Embed Size (px)
Citation preview
Qweak Installation:May 2010-May 2012
~1 year of beam in 3running periods:
Run 0 : Jan – Feb 2011 (published)
Run 1: Feb – May 2011 (my dissertation)
Run 2: Nov 2011 – May 2012
06/02/2015
Determination of the Weak Charge of the ProtonThrough Parity Violating Asymmetry Measurements in the
Elastic e+p Scattering
Adesh Subedi
Thesis Prize Talk – UGM 2015
Outline
o Physics motivation
o The QWeak apparatus
o My contributions to the experiment
Hardware: target
Monte-Carlo simulations: energy sensitivity, inelastic dilution
factor, electromagnetic radiative correction
Blinded Run 1 data analysis (thesis result); about 1/3 of total data
o Extraction of the weak charge of the proton
o Summary
2
EW Parity violating
EM Parity conserving
+
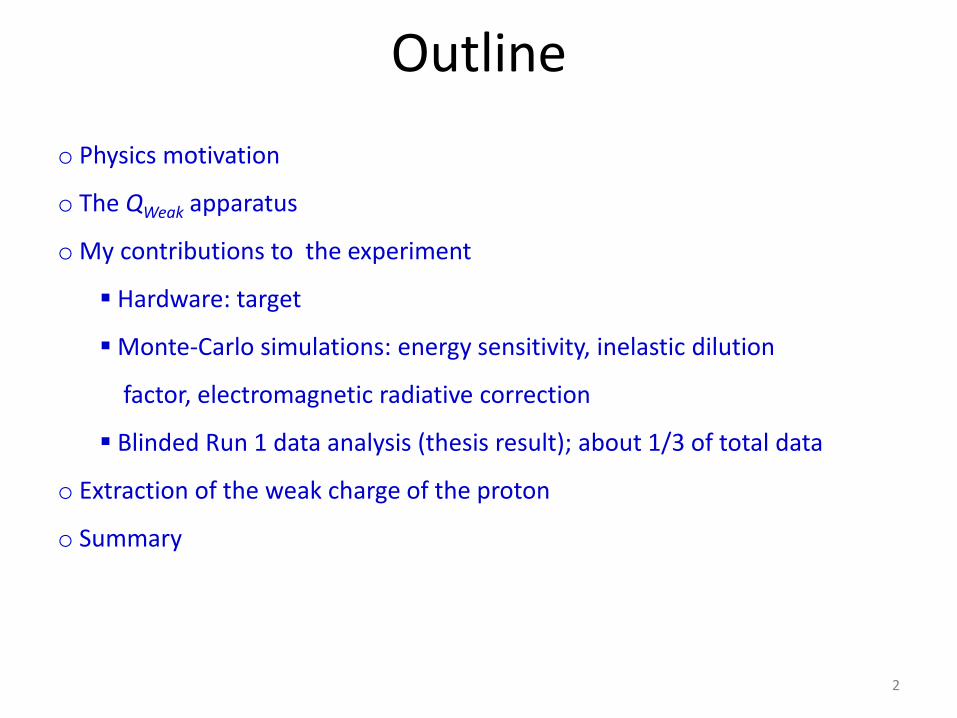
Weak charge is the neutral weak analog of electromagnetic charge
𝐴𝑃𝑉𝑒𝑝
=𝜎𝑅−𝜎𝐿
𝜎𝑅+𝜎𝐿 ~
𝑀𝑊𝑒𝑎𝑘𝑃𝑉
|Μ𝐸𝑀 | ∝
𝑄2
𝑀𝑍
𝐴𝑃𝑉𝑒𝑝
= 𝐺𝐹𝑄2
4𝜋𝛼 2
𝜖𝐺𝐸𝛾𝐺𝐸
𝑍+𝜏𝐺𝑀𝛾𝐺𝑀
𝑍 − 1−4sin 2𝜃𝑤 𝜖 ′ 𝐺𝑀𝛾𝐺𝐴
𝑍
𝜖 𝐺𝐸𝛾
2 + 𝜏 𝐺𝑀
𝛾
2
𝑤𝑒𝑟𝑒 𝐺𝐸,𝑀𝛾
𝑎𝑟𝑒 𝐸𝑀 𝐹𝐹𝑠 𝑎𝑛𝑑 𝐺𝐸,𝑀𝑍 & 𝐺𝐴
𝑍 𝑎𝑟𝑒 𝑛𝑒𝑢𝑡𝑟𝑎𝑙 𝑤𝑒𝑎𝑘 𝐹𝐹𝑠
𝑠𝑖𝑛2𝜃𝑤 = 1 − 𝑀𝑊
𝑀𝑧
2
= 𝑤𝑒𝑎𝑘 𝑚𝑖𝑥𝑖𝑛𝑔 𝑎𝑛𝑔𝑙𝑒 𝑎𝑛𝑑
𝜏 =𝑄2
4𝑀2, 𝜖 = [1 + 2 1 + 𝜏 tan2
𝜃
2 −1
, 𝜖 ′ = 𝜏 1 + 𝜏 1 − 𝜖2
𝐴𝑃𝑉𝑒𝑝
= −𝐺𝐹𝑄2
4𝜋𝛼 2 𝑄𝑊
𝑃 + 𝑄2𝐵 𝑄2 , 𝜃 when 𝜃~0, 𝜖 ~ 1 & 𝜏<<1
The world PVES data → 𝐵 𝑄2 , 𝜃
𝑨𝑷𝑽𝒆𝒑
, 𝑸𝟐, 𝑩 𝑸𝟐, 𝜽 → 𝑸𝒑𝒘
𝑸𝑾𝒑
→ 𝑪𝟏𝒖, 𝑪𝟏𝒅 & 𝐬𝐢𝐧𝟐 𝜽𝒘. 𝑪𝟏𝒖, 𝑪𝟏𝒅 → 𝑸𝑾𝒏
Parity Violating Asymmetry
when Q2<<MZ
3
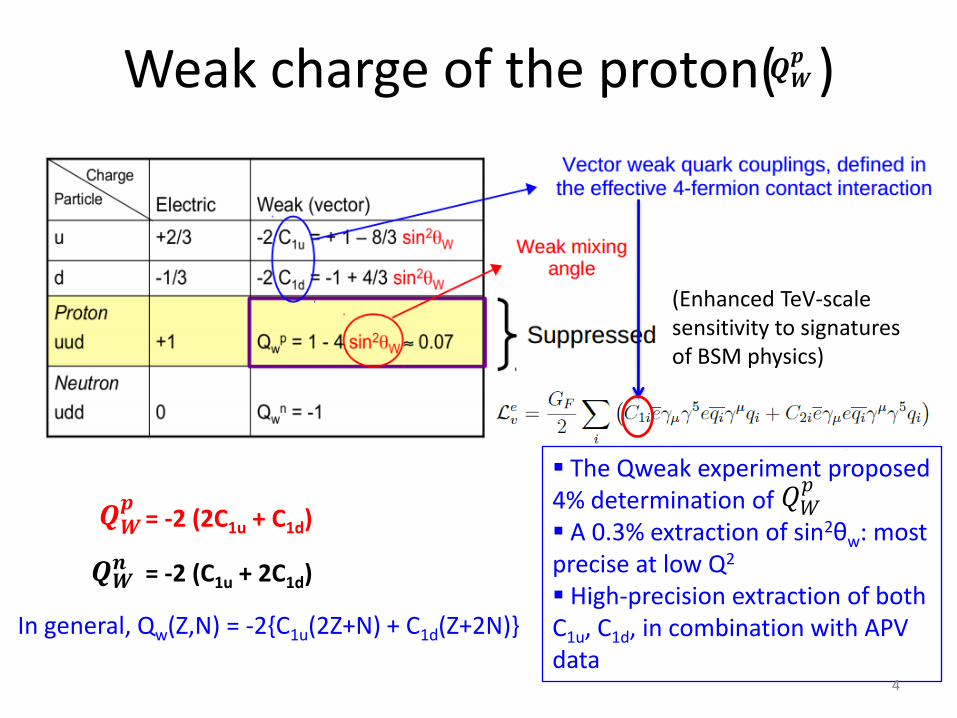
Weak charge of the proton( )
𝑸𝑾𝒑
𝑸𝑾𝒑
𝑸𝑾𝒏
= -2 (2C1u + C1d)
= -2 (C1u + 2C1d)
In general, Qw(Z,N) = -2{C1u(2Z+N) + C1d(Z+2N)}
The Qweak experiment proposed 4% determination of A 0.3% extraction of sin2θw: most precise at low Q2
High-precision extraction of both C1u, C1d, in combination with APV data
𝑄𝑊𝑝
(Enhanced TeV-scale sensitivity to signatures of BSM physics)
4
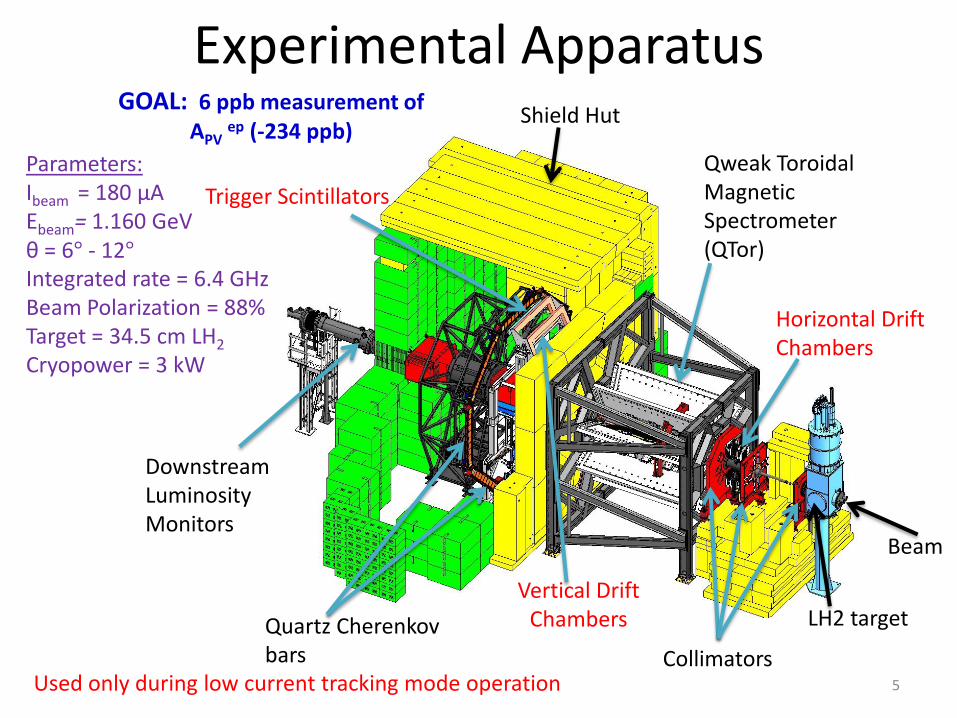
Experimental Apparatus
LH2 target
Parameters:Ibeam = 180 μAEbeam= 1.160 GeVθ = 6° - 12°Integrated rate = 6.4 GHzBeam Polarization = 88%Target = 34.5 cm LH2
Cryopower = 3 kW
Beam
Collimators
Qweak ToroidalMagnetic Spectrometer (QTor)
Horizontal Drift Chambers
Quartz Cherenkov bars
Downstream Luminosity Monitors
Shield Hut
Used only during low current tracking mode operation
Vertical Drift Chambers
Trigger Scintillators
GOAL: 6 ppb measurement of APV
ep (-234 ppb)
5
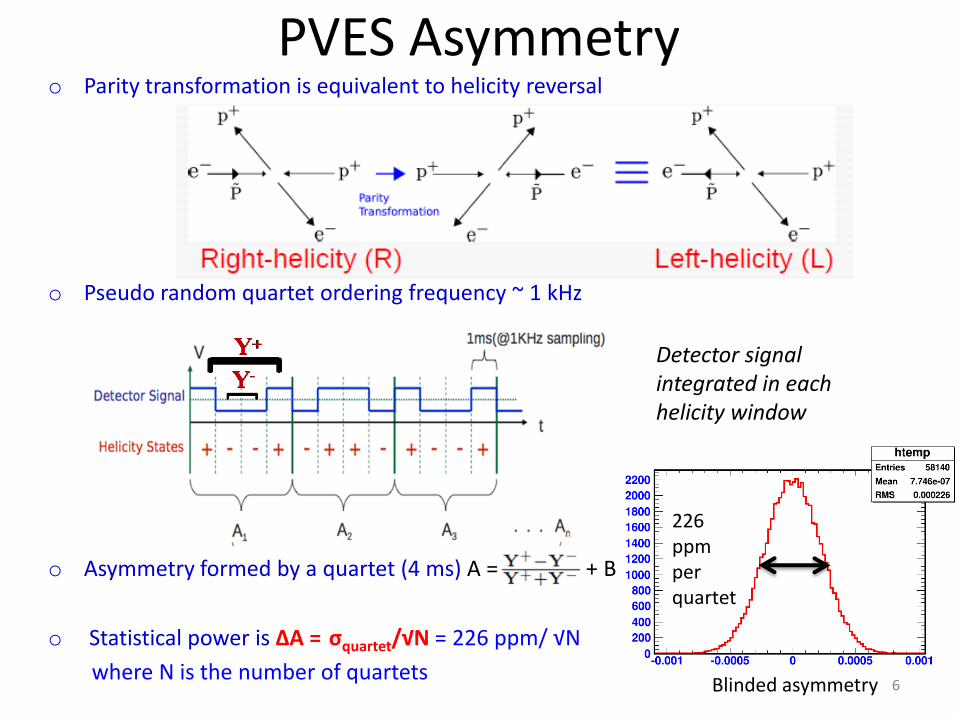
PVES Asymmetryo Parity transformation is equivalent to helicity reversal
o Pseudo random quartet ordering frequency ~ 1 kHz
o Asymmetry formed by a quartet (4 ms) A = + B
o Statistical power is ΔA = σquartet/√N = 226 ppm/ √N
where N is the number of quartets
Detector signal integrated in each helicity window
226 ppmper quartet
Blinded asymmetry 6
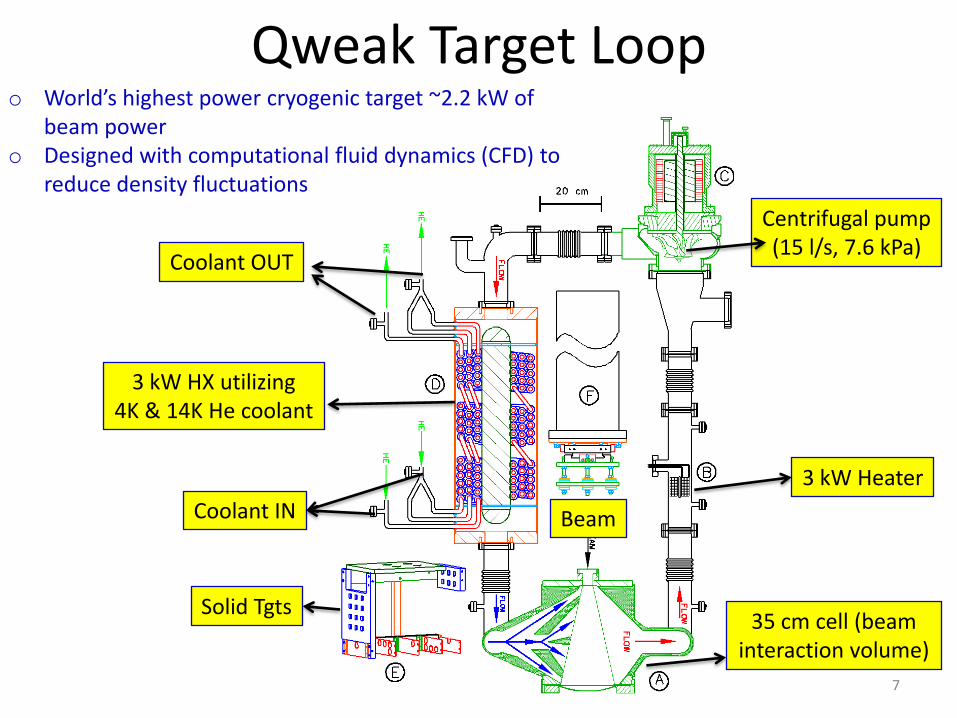
Qweak Target Loop
Centrifugal pump(15 l/s, 7.6 kPa)
3 kW Heater
3 kW HX utilizing4K & 14K He coolant
35 cm cell (beam interaction volume)
Solid Tgts
Coolant IN
Coolant OUT
Beam
o World’s highest power cryogenic target ~2.2 kW of beam power
o Designed with computational fluid dynamics (CFD) to reduce density fluctuations
7
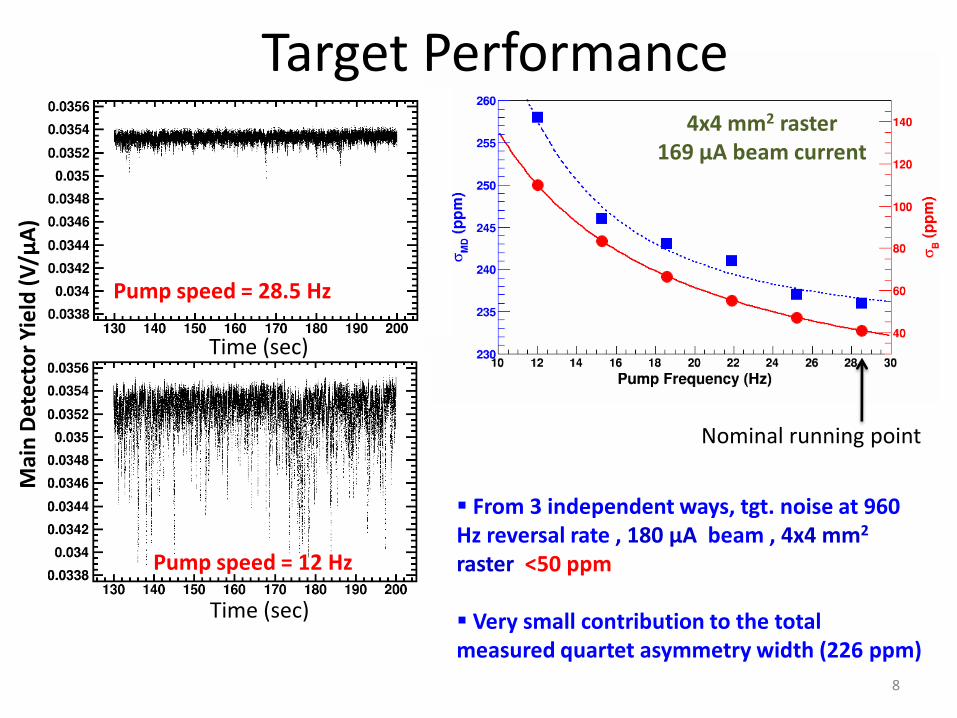
Nominal running point
Target Performance
Time (sec)
Time (sec)
Pump speed = 28.5 Hz
From 3 independent ways, tgt. noise at 960 Hz reversal rate , 180 μA beam , 4x4 mm2
raster <50 ppm
Very small contribution to the total measured quartet asymmetry width (226 ppm)
Pump speed = 12 Hz
Mai
n D
ete
cto
r Y
ield
(V
/μA
)
4x4 mm2 raster 169 μA beam current
8
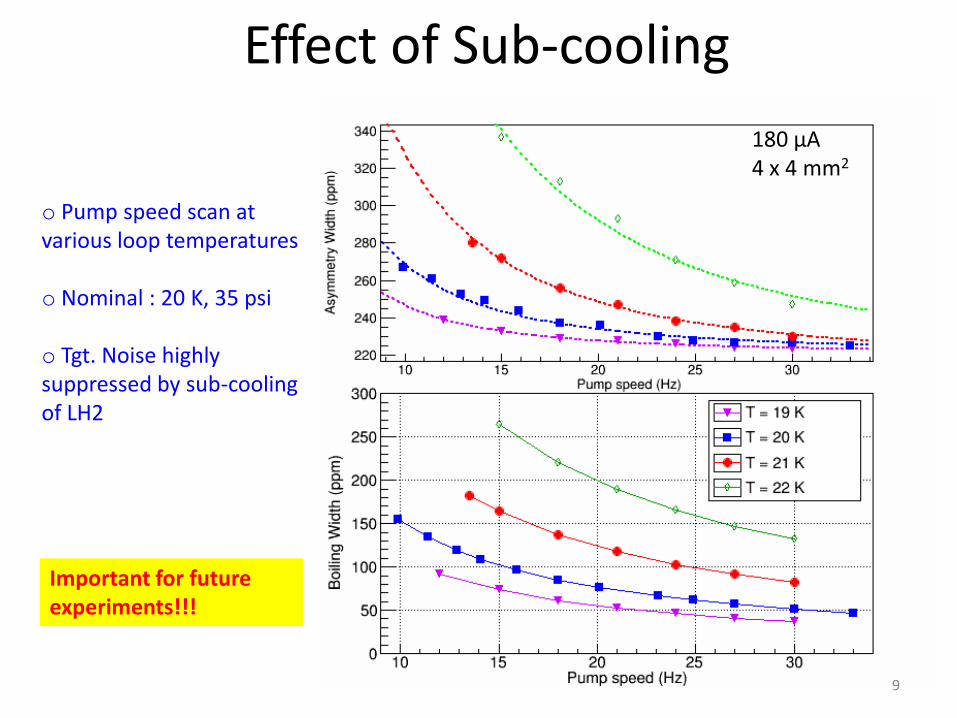
Effect of Sub-cooling
o Pump speed scan at various loop temperatures
o Nominal : 20 K, 35 psi
o Tgt. Noise highly suppressed by sub-cooling of LH2
180 μA4 x 4 mm2
Important for future experiments!!!
9
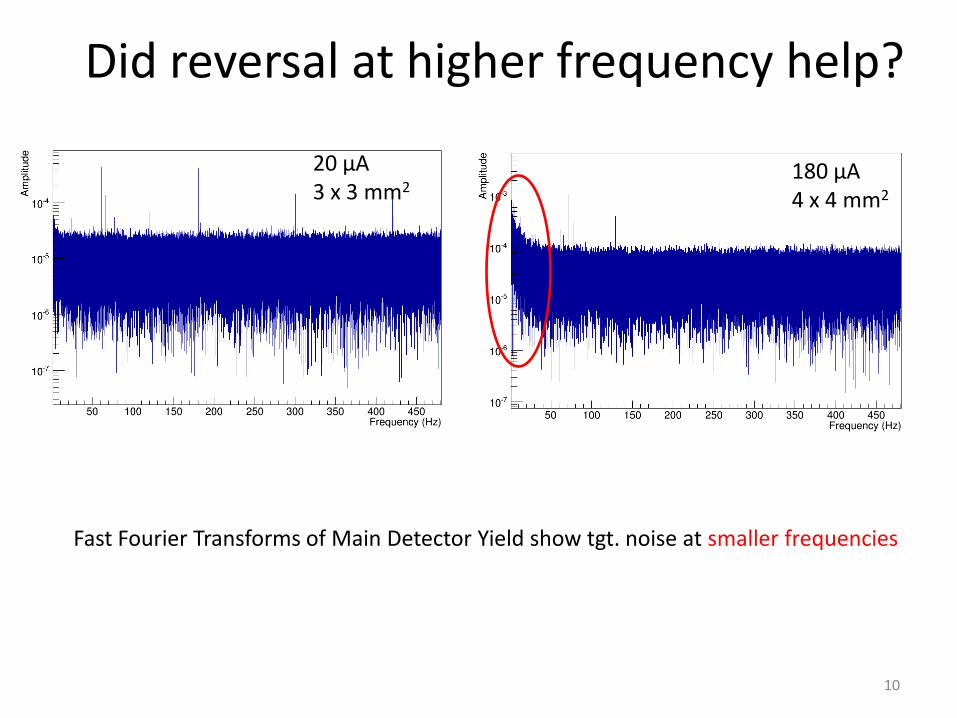
Did reversal at higher frequency help?
Fast Fourier Transforms of Main Detector Yield show tgt. noise at smaller frequencies
20 μA3 x 3 mm2
180 μA4 x 4 mm2
10
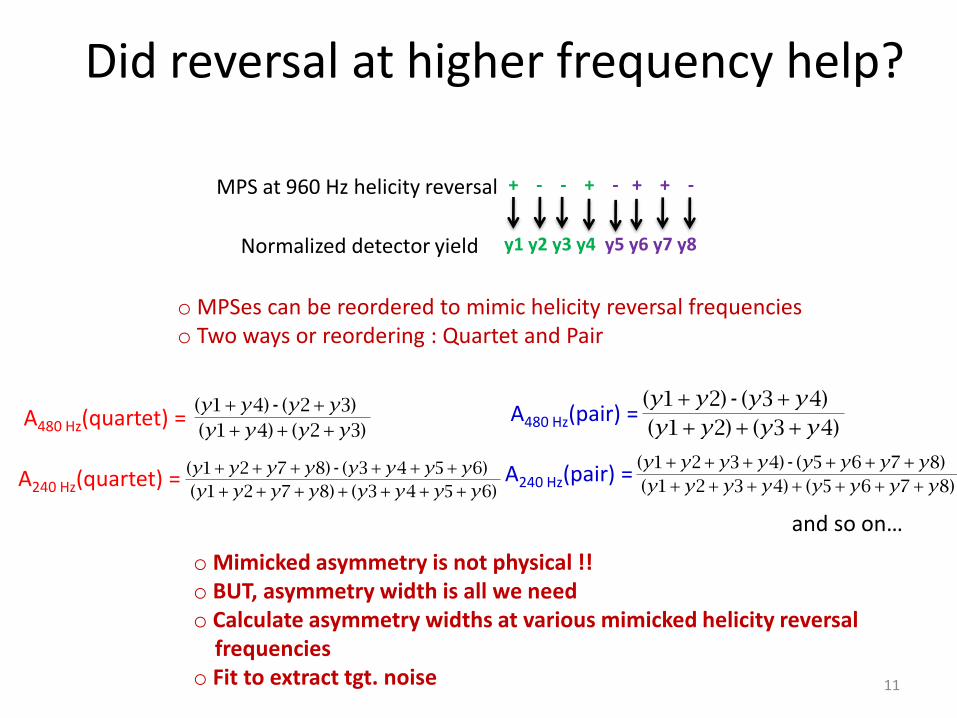
Did reversal at higher frequency help?
A480 Hz(quartet) =)3+2(+)4+1(
)3+2()4+1(
yyyy
yyyy - A480 Hz(pair) =)4+3(+)2+1(
)4+3()2+1(
yyyy
yyyy -
)8+7+6+5(+)4+3+2+1(
)8+7+6+5()4+3+2+1(
yyyyyyyy
yyyyyyyy -A240 Hz(pair) =A240 Hz(quartet) =
)6+5+4+3(+)8+7+2+1(
)6+5+4+3()8+7+2+1(
yyyyyyyy
yyyyyyyy -
+ - - + - + + -
y1 y2 y3 y4 y5 y6 y7 y8
MPS at 960 Hz helicity reversal
Normalized detector yield
o MPSes can be reordered to mimic helicity reversal frequencieso Two ways or reordering : Quartet and Pair
and so on…
o Mimicked asymmetry is not physical !!o BUT, asymmetry width is all we needo Calculate asymmetry widths at various mimicked helicity reversal
frequencies o Fit to extract tgt. noise 11
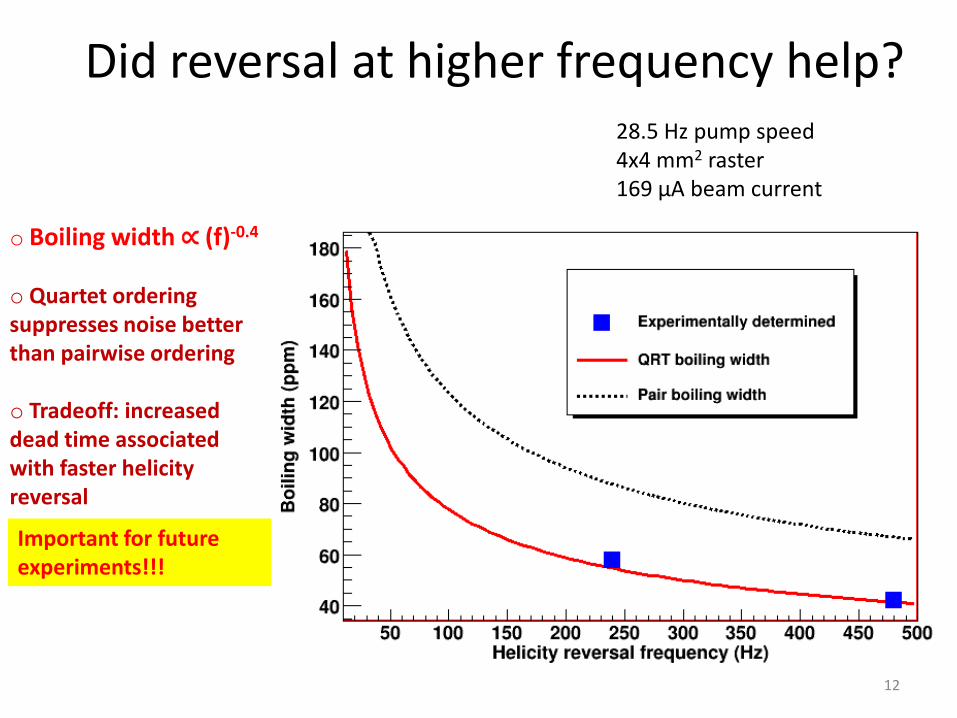
Did reversal at higher frequency help?28.5 Hz pump speed 4x4 mm2 raster169 μA beam current
o Boiling width ∝ (f)-0.4
o Quartet ordering suppresses noise better than pairwise ordering
o Tradeoff: increased dead time associated with faster helicity reversal
Important for future experiments!!!
12
Data Analysis
13
Removal of false Asymmetrieso Changes in helicity correlated beam properties create false asymmetries
o We identified, minimized & corrected for such helicity correlated false asymmetries
o where χ =X and Y angles and positions, Energy and Charge
o ∂A/∂χi determined by linear regression on natural beam motion (my dissertation) or driven motion
o Regression corrections applied at the quartet level
14
Linear Regression: Residual Correlations
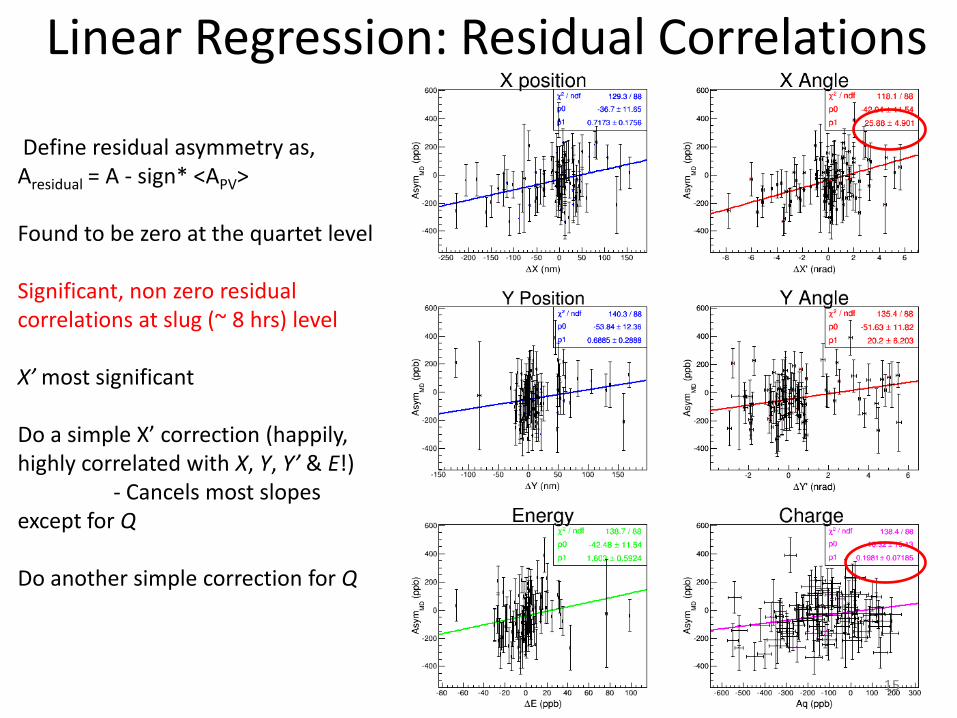
Define residual asymmetry as, Aresidual = A - sign* <APV>
Found to be zero at the quartet level
Significant, non zero residual correlations at slug (~ 8 hrs) level
X’ most significant
Do a simple X’ correction (happily, highly correlated with X, Y, Y’ & E!)
- Cancels most slopes except for Q
Do another simple correction for Q
15
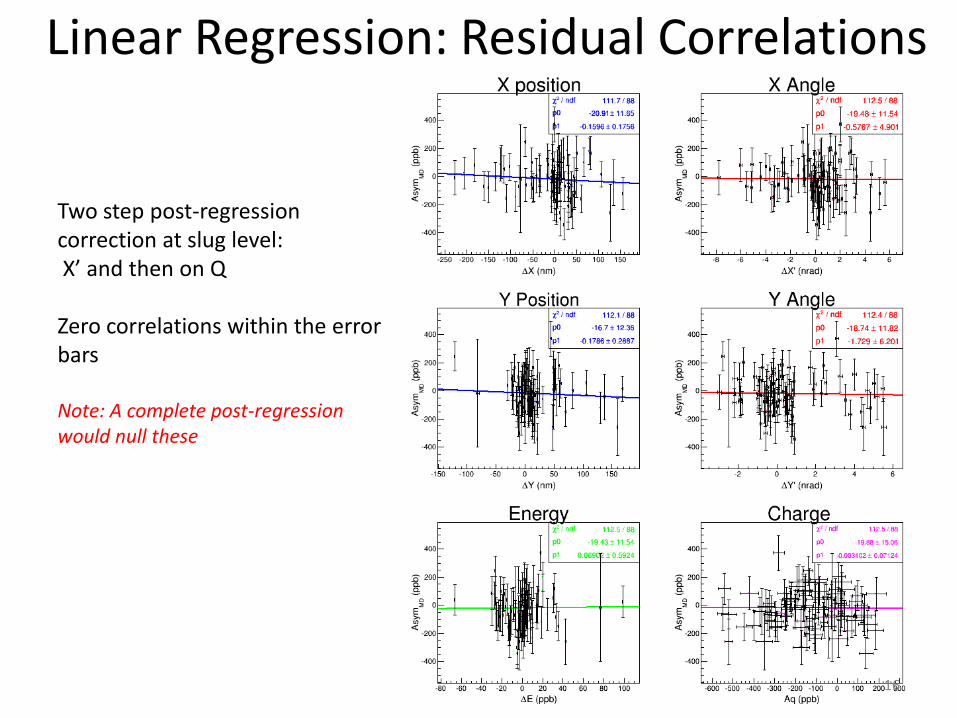
Two step post-regression correction at slug level:X’ and then on Q
Zero correlations within the error bars
Note: A complete post-regression would null these
Linear Regression: Residual Correlations
16
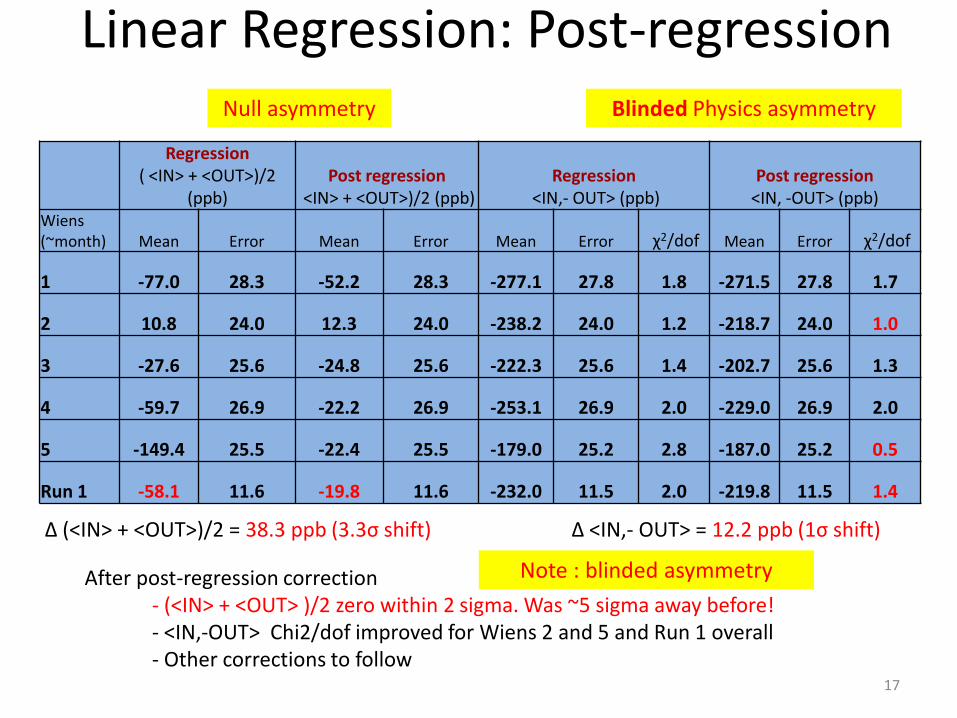
Regression( <IN> + <OUT>)/2
(ppb)Post regression
<IN> + <OUT>)/2 (ppb)Regression
<IN,- OUT> (ppb)Post regression
<IN, -OUT> (ppb)Wiens(~month) Mean Error Mean Error Mean Error χ2/dof Mean Error χ2/dof
1 -77.0 28.3 -52.2 28.3 -277.1 27.8 1.8 -271.5 27.8 1.7
2 10.8 24.0 12.3 24.0 -238.2 24.0 1.2 -218.7 24.0 1.0
3 -27.6 25.6 -24.8 25.6 -222.3 25.6 1.4 -202.7 25.6 1.3
4 -59.7 26.9 -22.2 26.9 -253.1 26.9 2.0 -229.0 26.9 2.0
5 -149.4 25.5 -22.4 25.5 -179.0 25.2 2.8 -187.0 25.2 0.5
Run 1 -58.1 11.6 -19.8 11.6 -232.0 11.5 2.0 -219.8 11.5 1.4
Linear Regression: Post-regression
After post-regression correction- (<IN> + <OUT> )/2 zero within 2 sigma. Was ~5 sigma away before!- <IN,-OUT> Chi2/dof improved for Wiens 2 and 5 and Run 1 overall - Other corrections to follow
Δ (<IN> + <OUT>)/2 = 38.3 ppb (3.3σ shift) Δ <IN,- OUT> = 12.2 ppb (1σ shift)
Null asymmetry Blinded Physics asymmetry
Note : blinded asymmetry
17
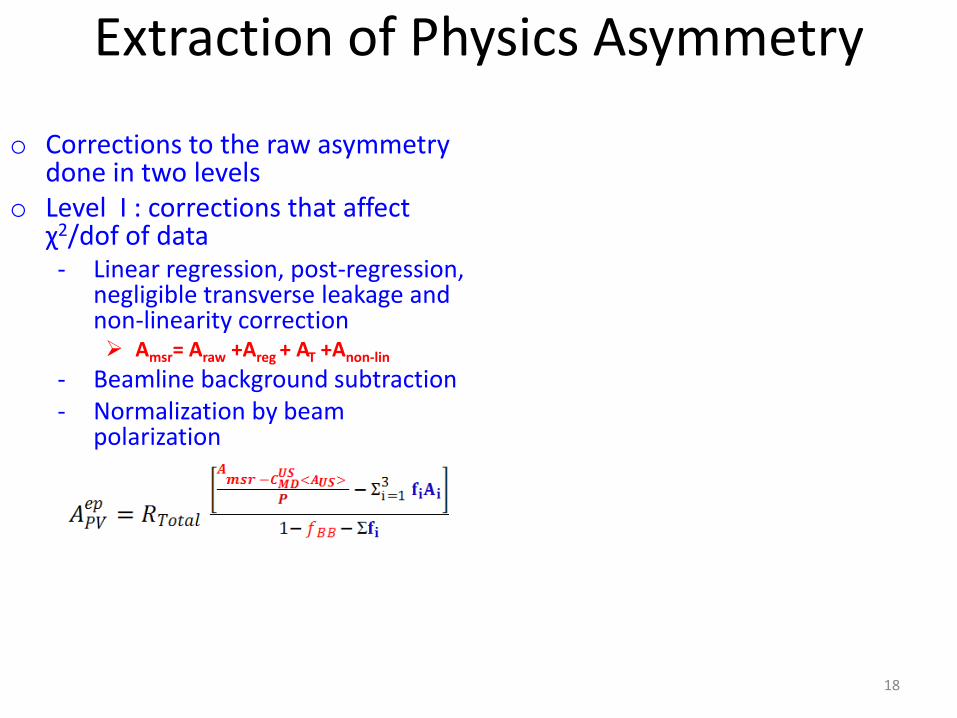
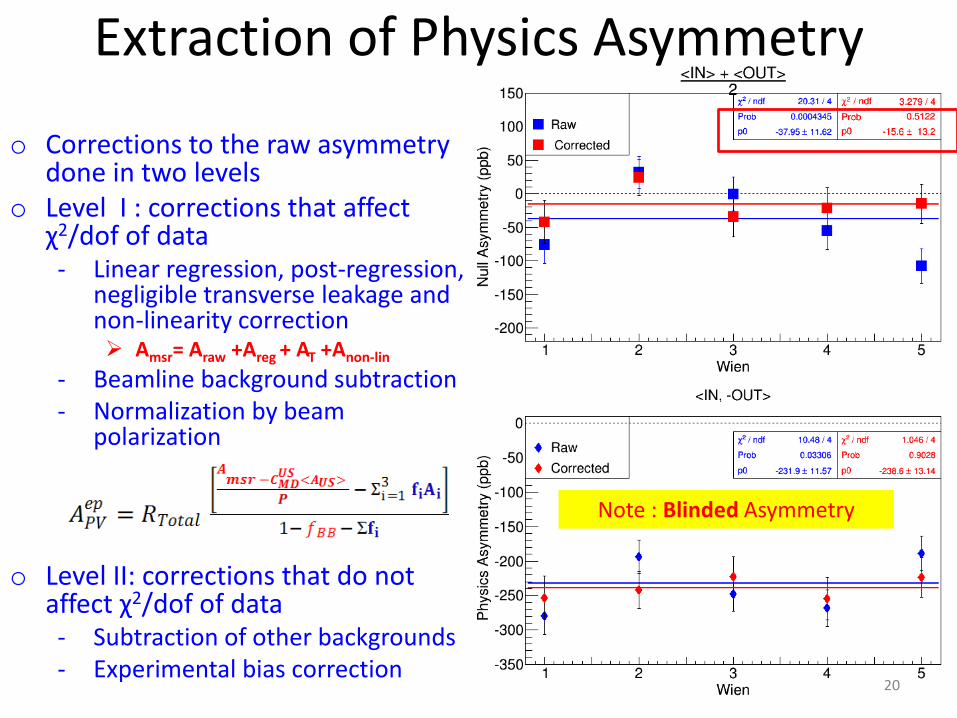
Extraction of Physics Asymmetry
o Corrections to the raw asymmetry done in two levels
o Level I : corrections that affect χ2/dof of data- Linear regression, post-regression,
negligible transverse leakage and non-linearity correction Amsr= Araw +Areg + AT +Anon-lin
- Beamline background subtraction- Normalization by beam
polarization
o Level II: corrections that do not affect χ2/dof of data- Subtraction of other backgrounds- Experimental bias correction
18
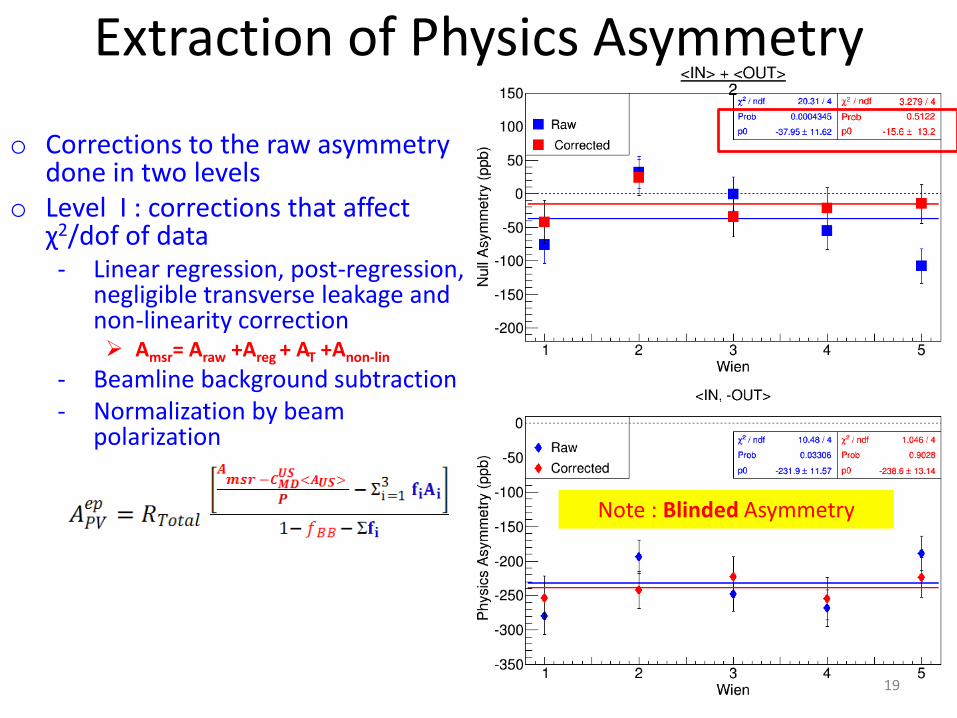
Extraction of Physics Asymmetry
o Corrections to the raw asymmetry done in two levels
o Level I : corrections that affect χ2/dof of data- Linear regression, post-regression,
negligible transverse leakage and non-linearity correction Amsr= Araw +Areg + AT +Anon-lin
- Beamline background subtraction- Normalization by beam
polarization
o Level II: corrections that do not affect χ2/dof of data- Subtraction of other backgrounds- Experimental bias correction
Note : Blinded Asymmetry
19
Extraction of Physics Asymmetry
o Corrections to the raw asymmetry done in two levels
o Level I : corrections that affect χ2/dof of data- Linear regression, post-regression,
negligible transverse leakage and non-linearity correction Amsr= Araw +Areg + AT +Anon-lin
- Beamline background subtraction- Normalization by beam
polarization
o Level II: corrections that do not affect χ2/dof of data- Subtraction of other backgrounds- Experimental bias correction
Note : Blinded Asymmetry
20
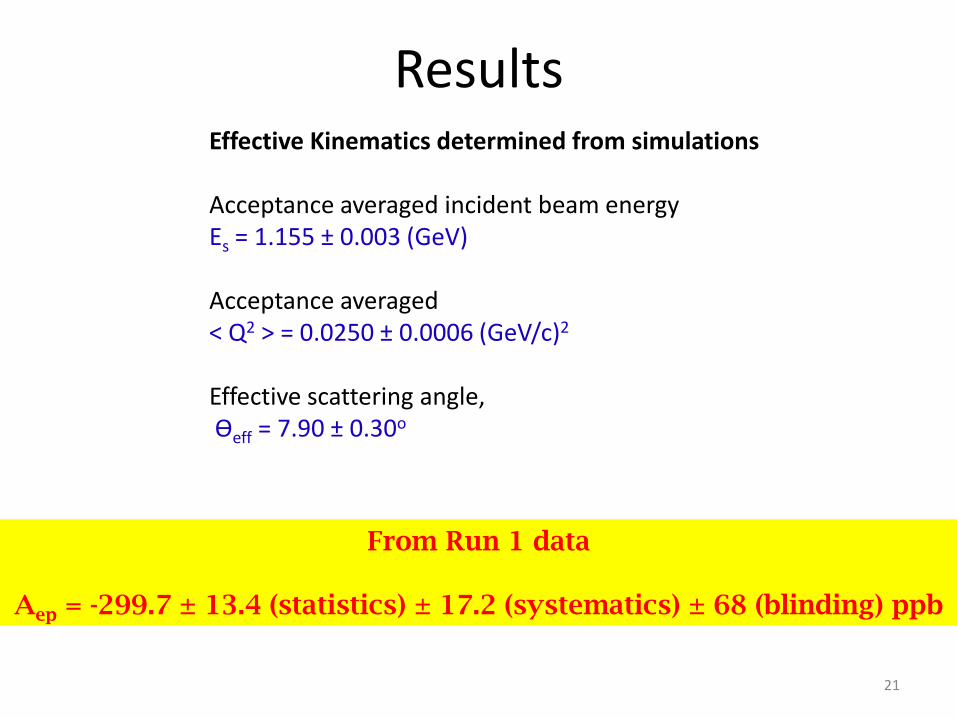
Effective Kinematics determined from simulations
Acceptance averaged incident beam energyEs = 1.155 ± 0.003 (GeV)
Acceptance averaged < Q2 > = 0.0250 ± 0.0006 (GeV/c)2
Effective scattering angle, ϴeff = 7.90 ± 0.30o
From Run 1 data
Aep = -299.7 ± 13.4 (statistics) ± 17.2 (systematics) ± 68 (blinding) ppb
ResultsResults
21
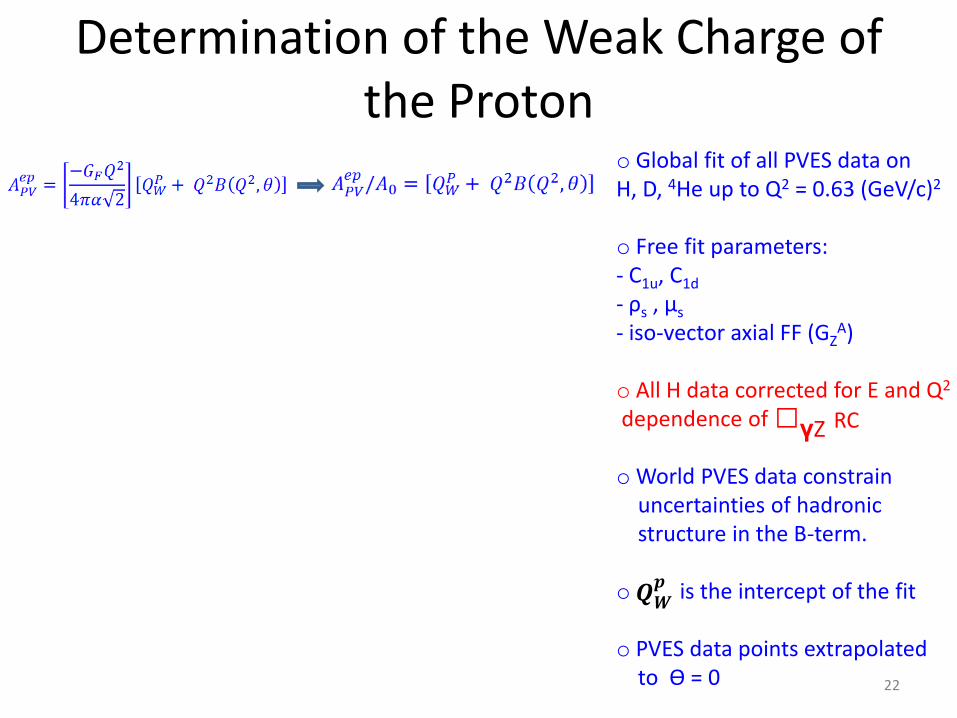
Determination of the Weak Charge of the Proton
o Global fit of all PVES data on H, D, 4He up to Q2 = 0.63 (GeV/c)2
o Free fit parameters:- C1u, C1d
- ρs , μs
- iso-vector axial FF (GZA)
o All H data corrected for E and Q2
dependence of
o World PVES data constrain uncertainties of hadronicstructure in the B-term.
o is the intercept of the fit
o PVES data points extrapolated to ϴ = 0
𝑸𝑾𝒑
□γZ RC
22
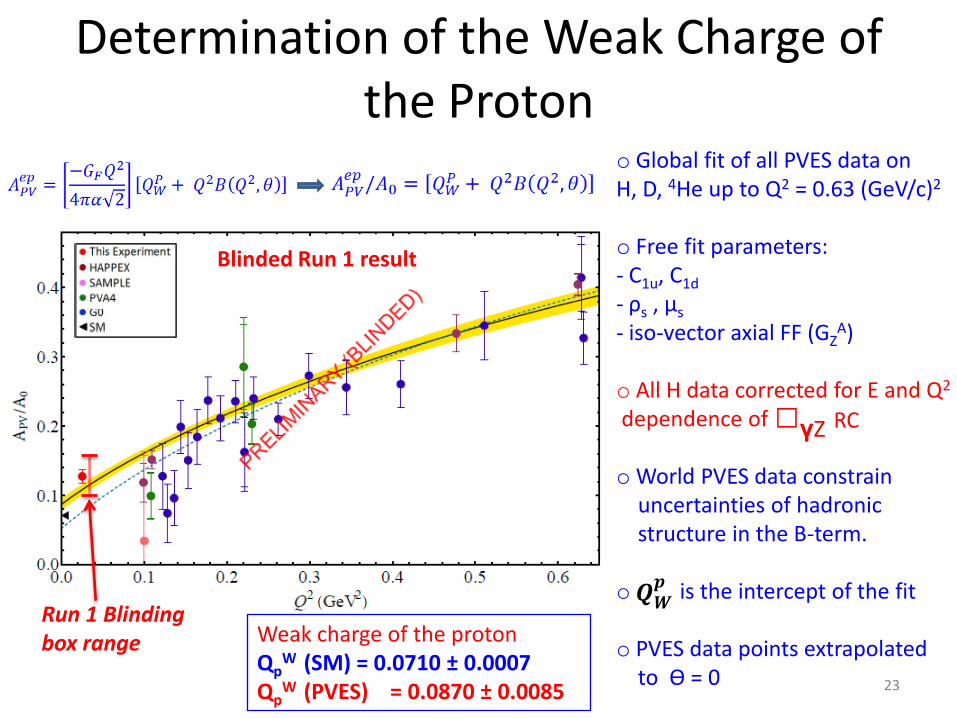
Determination of the Weak Charge of the Proton
𝑸𝑾𝒑
Run 1 Blinding box range Weak charge of the proton
QpW (SM) = 0.0710 ± 0.0007
QpW (PVES) = 0.0870 ± 0.0085
Blinded Run 1 result
23
o Global fit of all PVES data on H, D, 4He up to Q2 = 0.63 (GeV/c)2
o Free fit parameters:- C1u, C1d
- ρs , μs
- iso-vector axial FF (GZA)
o All H data corrected for E and Q2
dependence of
o World PVES data constrain uncertainties of hadronicstructure in the B-term.
o is the intercept of the fit
o PVES data points extrapolated to ϴ = 0
□γZ RC
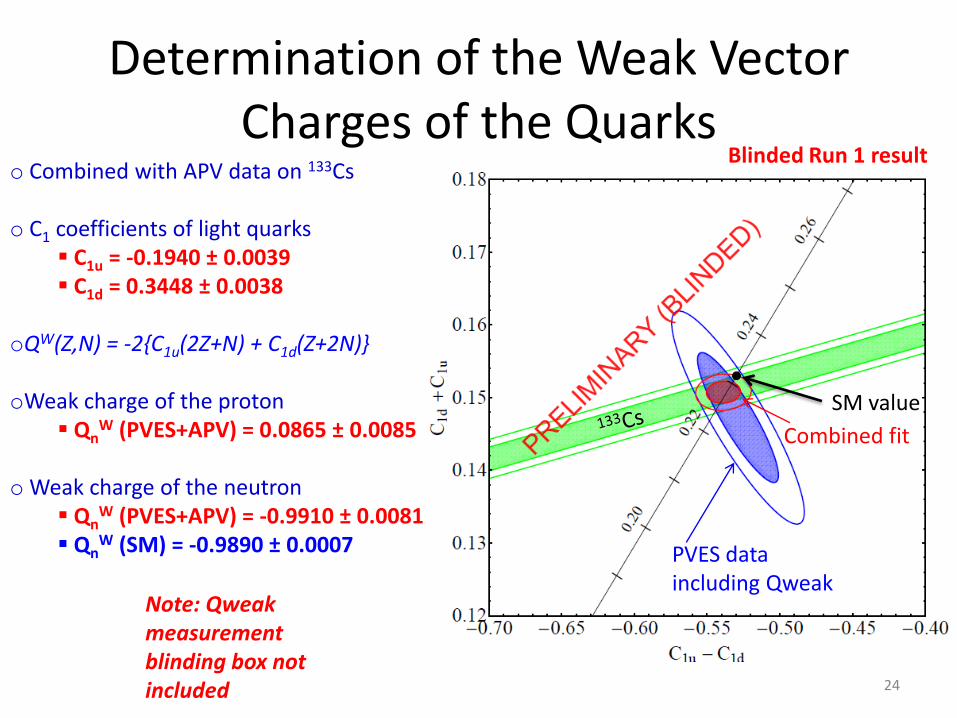
Determination of the Weak Vector Charges of the Quarks
o Combined with APV data on 133Cs
o C1 coefficients of light quarks C1u = -0.1940 ± 0.0039 C1d = 0.3448 ± 0.0038
oQW(Z,N) = -2{C1u(2Z+N) + C1d(Z+2N)}
oWeak charge of the proton Qn
W (PVES+APV) = 0.0865 ± 0.0085
o Weak charge of the neutron Qn
W (PVES+APV) = -0.9910 ± 0.0081 Qn
W (SM) = -0.9890 ± 0.0007 PVES data including Qweak
Combined fit
SM value
Note: Qweak measurement blinding box not included
Blinded Run 1 result
24
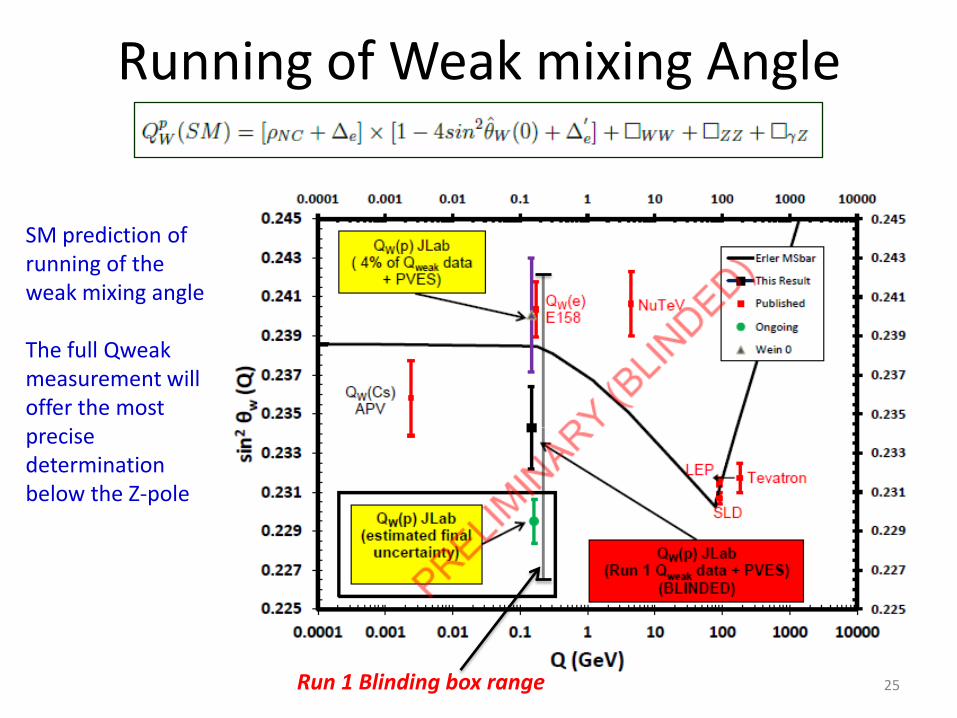
Running of Weak mixing Angle
SM prediction of running of the weak mixing angle
The full Qweak measurement will offer the most precise determination below the Z-pole
Run 1 Blinding box range 25
Implications of the Qweak experiment
o Sensitive to potential new parity-violating physics that couples
to electrons/quarks
o Assume agreement with the Standard Model within ΔQpW
Our model-independent mass reach is given by
Λ/g ≡ (2√2 GF ΔQpW)-0.5 ≥ 2.0 TeV
This mass reach is for 2σ (95% confidence limit)
To set exact mass limits, one must choose a model (a value for the
coupling)
26
Summary
o Final Qweak measurement will test the Standard Model
o Least noise achieved from the highest power cryogenic liquid hydrogen target. Encouraging for future experiments
o Blinded Run 1 statistical analysis result reported in my thesis. Efforts ongoing to finalize analysis
o Final Qweak results expected soon!
27
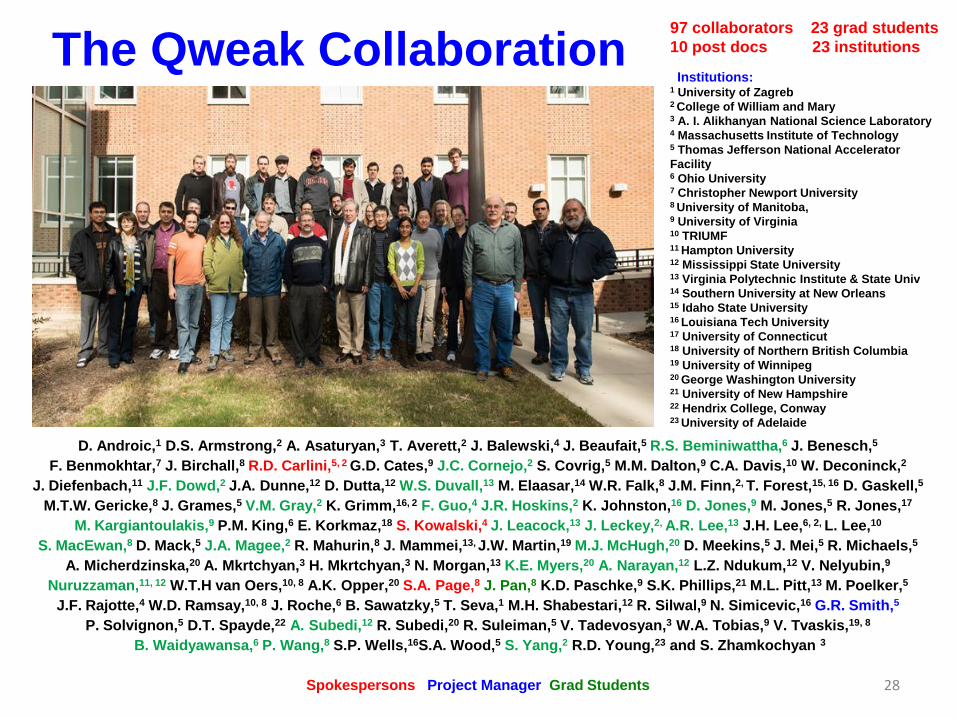
The Qweak Collaboration
D. Androic,1 D.S. Armstrong,2 A. Asaturyan,3 T. Averett,2 J. Balewski,4 J. Beaufait,5 R.S. Beminiwattha,6 J. Benesch,5
F. Benmokhtar,7 J. Birchall,8 R.D. Carlini,5, 2 G.D. Cates,9 J.C. Cornejo,2 S. Covrig,5 M.M. Dalton,9 C.A. Davis,10 W. Deconinck,2
J. Diefenbach,11 J.F. Dowd,2 J.A. Dunne,12 D. Dutta,12 W.S. Duvall,13 M. Elaasar,14 W.R. Falk,8 J.M. Finn,2, T. Forest,15, 16 D. Gaskell,5
M.T.W. Gericke,8 J. Grames,5 V.M. Gray,2 K. Grimm,16, 2 F. Guo,4 J.R. Hoskins,2 K. Johnston,16 D. Jones,9 M. Jones,5 R. Jones,17
M. Kargiantoulakis,9 P.M. King,6 E. Korkmaz,18 S. Kowalski,4 J. Leacock,13 J. Leckey,2, A.R. Lee,13 J.H. Lee,6, 2, L. Lee,10
S. MacEwan,8 D. Mack,5 J.A. Magee,2 R. Mahurin,8 J. Mammei,13, J.W. Martin,19 M.J. McHugh,20 D. Meekins,5 J. Mei,5 R. Michaels,5
A. Micherdzinska,20 A. Mkrtchyan,3 H. Mkrtchyan,3 N. Morgan,13 K.E. Myers,20 A. Narayan,12 L.Z. Ndukum,12 V. Nelyubin,9
Nuruzzaman,11, 12 W.T.H van Oers,10, 8 A.K. Opper,20 S.A. Page,8 J. Pan,8 K.D. Paschke,9 S.K. Phillips,21 M.L. Pitt,13 M. Poelker,5
J.F. Rajotte,4 W.D. Ramsay,10, 8 J. Roche,6 B. Sawatzky,5 T. Seva,1 M.H. Shabestari,12 R. Silwal,9 N. Simicevic,16 G.R. Smith,5
P. Solvignon,5 D.T. Spayde,22 A. Subedi,12 R. Subedi,20 R. Suleiman,5 V. Tadevosyan,3 W.A. Tobias,9 V. Tvaskis,19, 8
B. Waidyawansa,6 P. Wang,8 S.P. Wells,16S.A. Wood,5 S. Yang,2 R.D. Young,23 and S. Zhamkochyan 3
Spokespersons Project Manager Grad Students
97 collaborators 23 grad students
10 post docs 23 institutions
Institutions:1 University of Zagreb2 College of William and Mary3 A. I. Alikhanyan National Science Laboratory 4 Massachusetts Institute of Technology5 Thomas Jefferson National Accelerator
Facility6 Ohio University7 Christopher Newport University8 University of Manitoba,9 University of Virginia10 TRIUMF11 Hampton University12 Mississippi State University13 Virginia Polytechnic Institute & State Univ14 Southern University at New Orleans15 Idaho State University16 Louisiana Tech University17 University of Connecticut18 University of Northern British Columbia 19 University of Winnipeg20 George Washington University21 University of New Hampshire22 Hendrix College, Conway23 University of Adelaide
28

Thank You !
29

Supplemental Slides
30
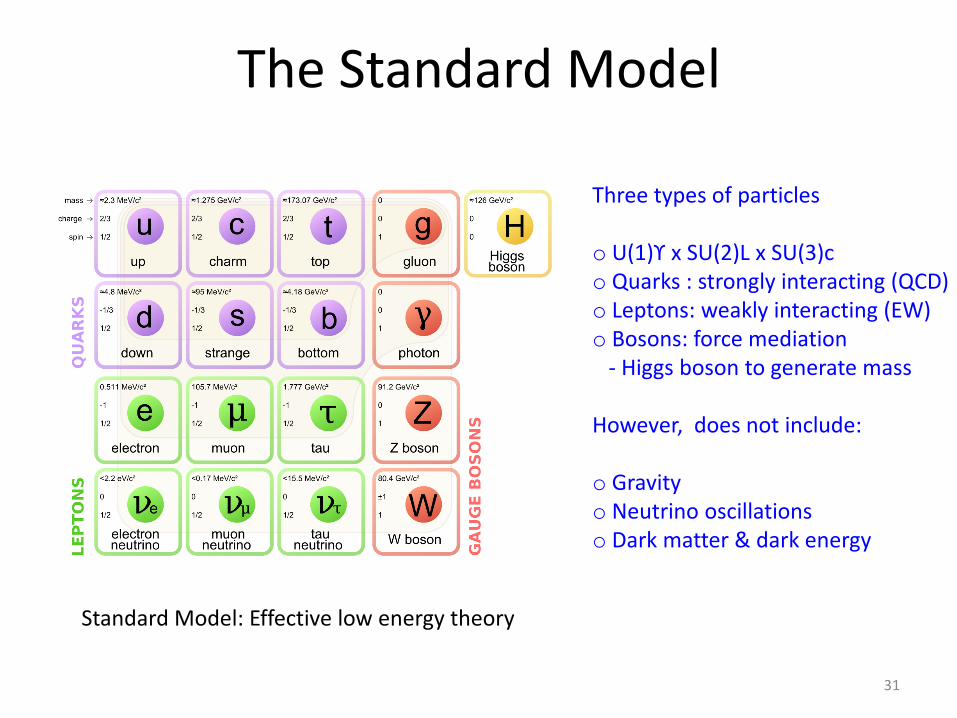
The Standard Model
Three types of particles
o U(1)ϒ x SU(2)L x SU(3)c o Quarks : strongly interacting (QCD)o Leptons: weakly interacting (EW)o Bosons: force mediation
- Higgs boson to generate mass
However, does not include:
o Gravityo Neutrino oscillationso Dark matter & dark energy
Standard Model: Effective low energy theory
31
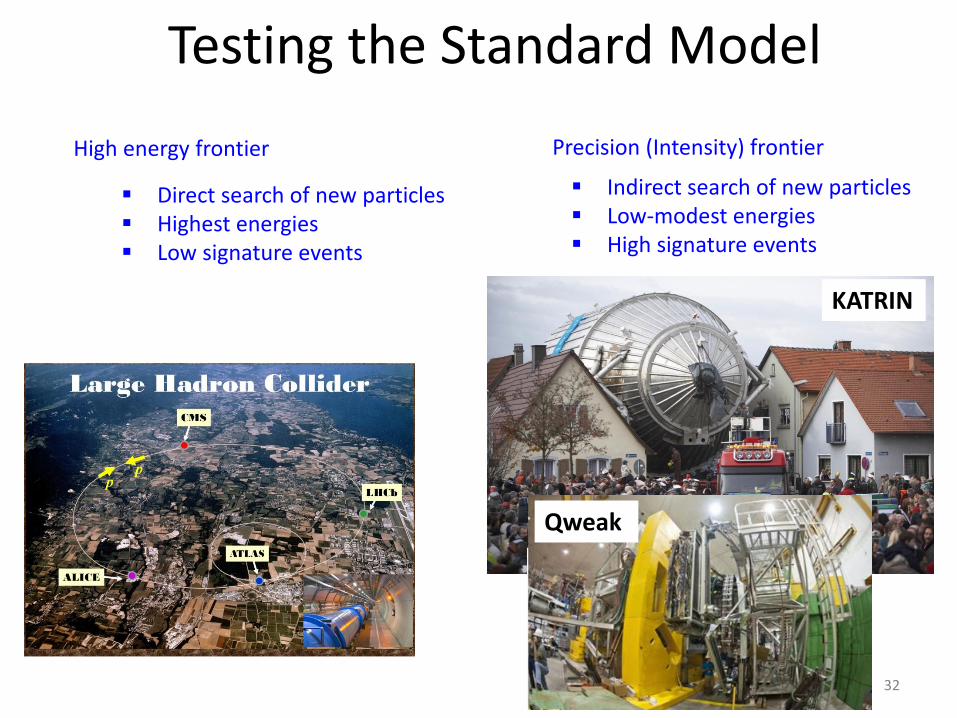
Testing the Standard Model
High energy frontier Precision (Intensity) frontier
Direct search of new particles Highest energies Low signature events
Indirect search of new particles Low-modest energies High signature events
KATRIN
Qweak
32
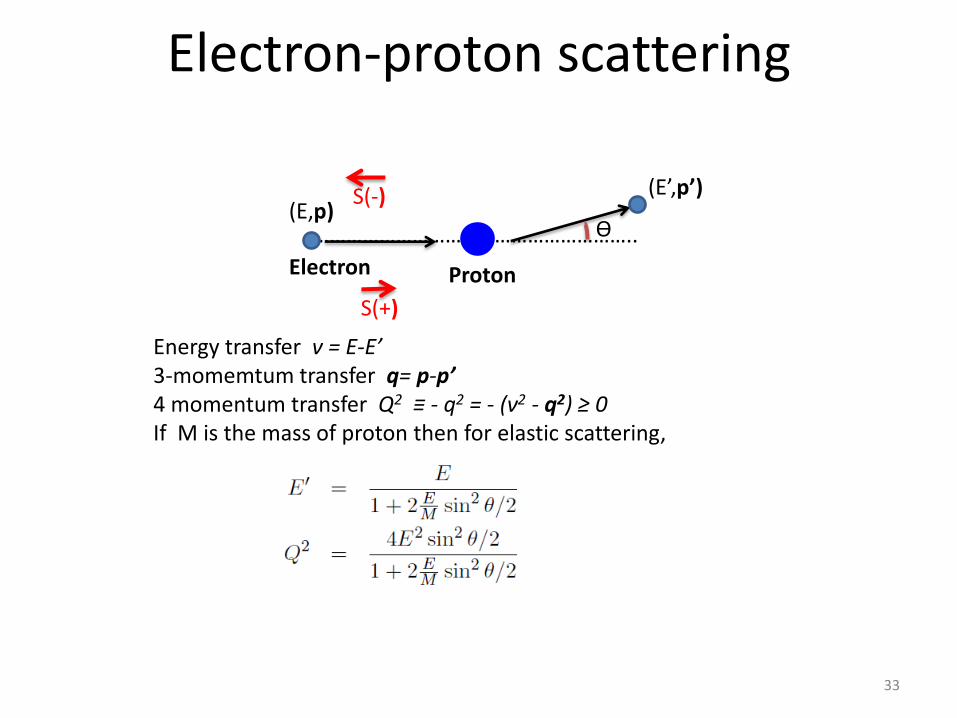
Electron-proton scattering
(E,p)S(-)
…………………………………………………..ϴ
Electron Proton
Energy transfer ν = E-E’3-momemtum transfer q= p-p’4 momentum transfer Q2 ≡ - q2 = - (ν2 - q2) ≥ 0If M is the mass of proton then for elastic scattering,
(E’,p’)
S(+)
33
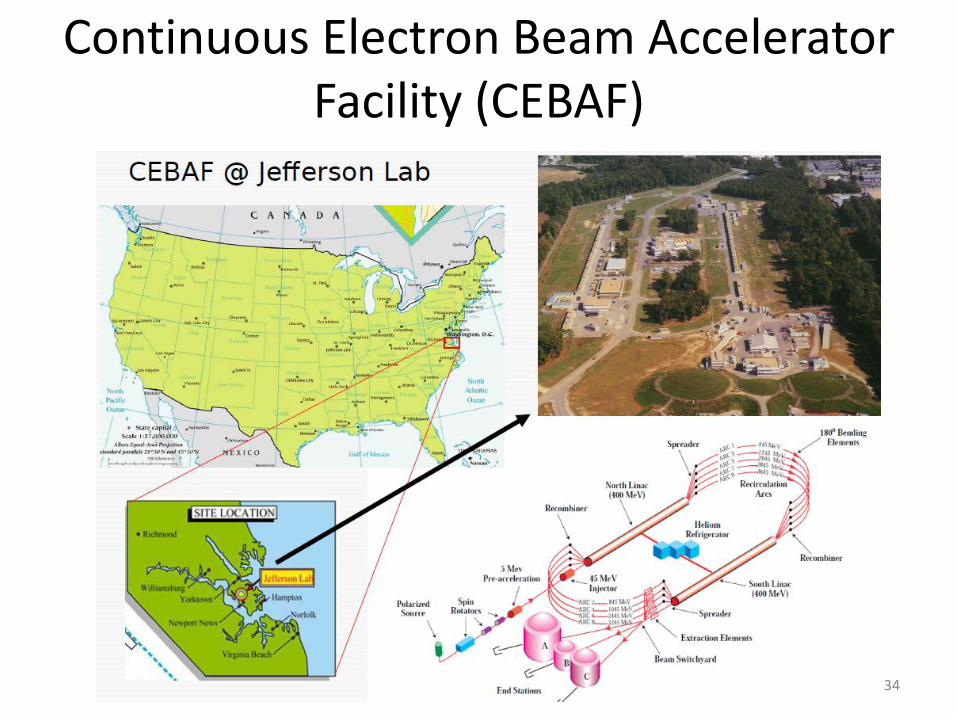
Continuous Electron Beam Accelerator Facility (CEBAF)
34
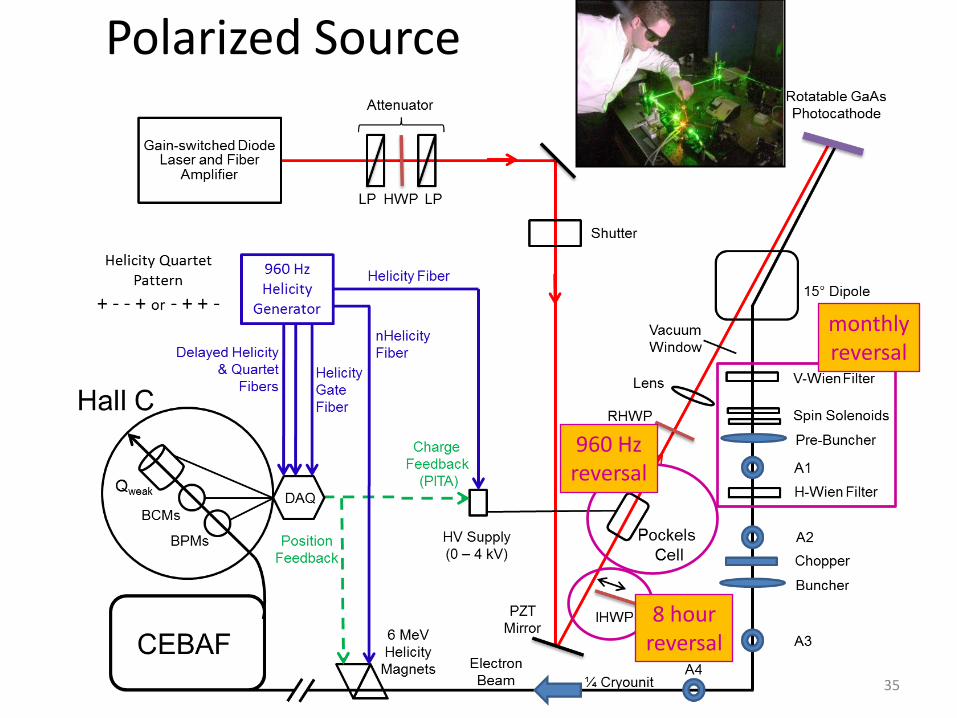
Polarized Source
8 hourreversal
960 Hzreversal
monthlyreversal
35
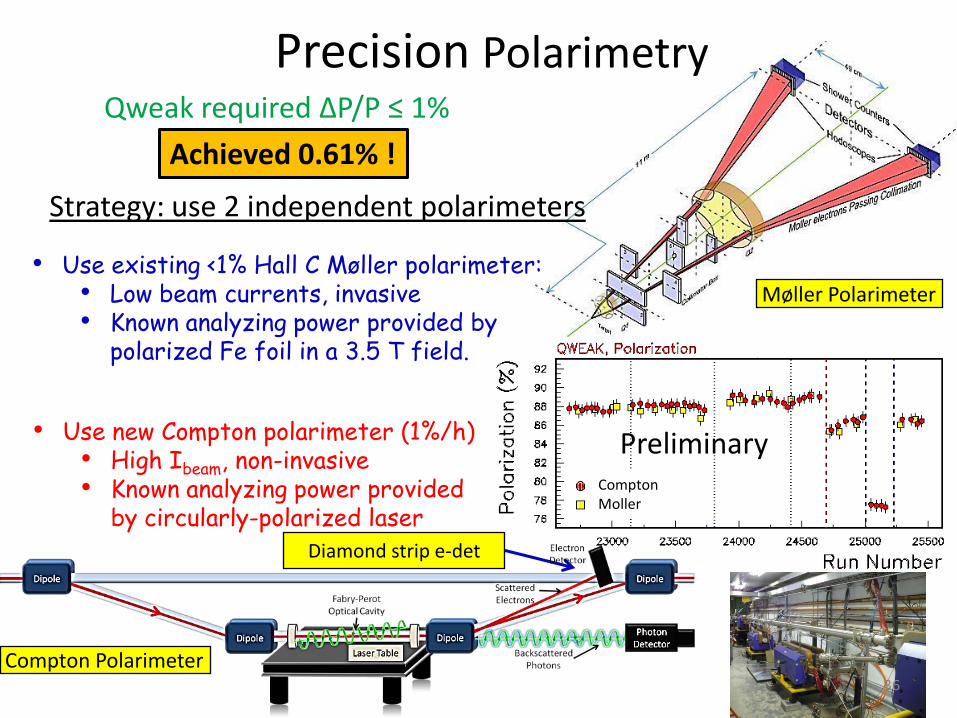
Qweak required ΔP/P ≤ 1%
Strategy: use 2 independent polarimeters
• Use new Compton polarimeter (1%/h)• High Ibeam, non-invasive • Known analyzing power provided
by circularly-polarized laser
• Use existing <1% Hall C Møller polarimeter: • Low beam currents, invasive• Known analyzing power provided by
polarized Fe foil in a 3.5 T field.
Møller Polarimeter
Compton Polarimeter
Compton Moller
Preliminary
Precision Polarimetry
Diamond strip e-det
Achieved 0.61% !
36
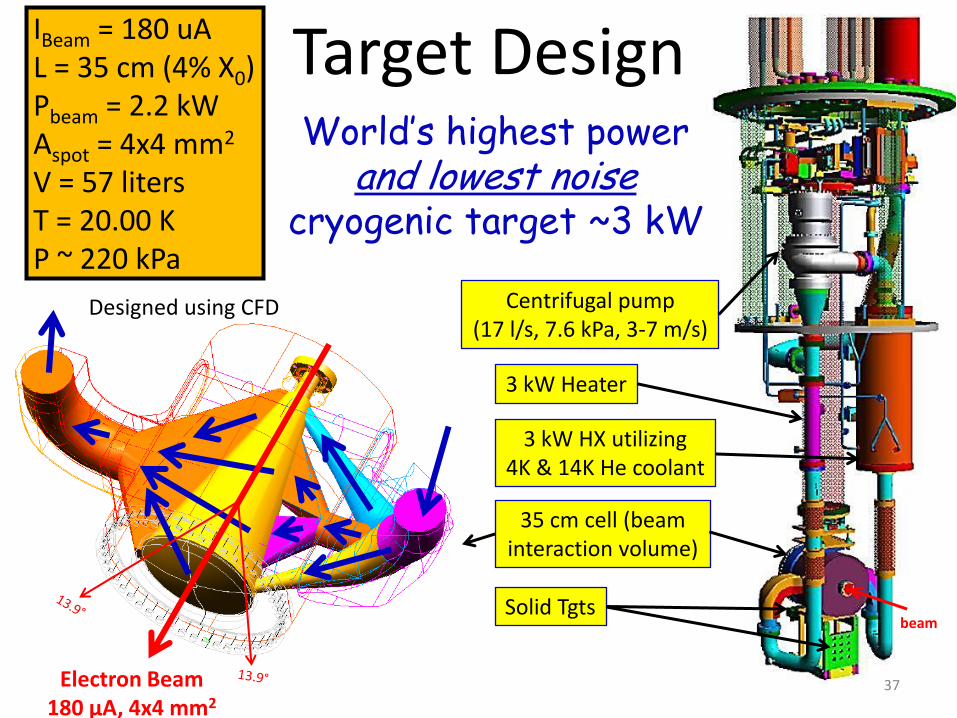
Target DesignWorld’s highest power
and lowest noisecryogenic target ~3 kW
IBeam = 180 uAL = 35 cm (4% X0)Pbeam = 2.2 kWAspot = 4x4 mm2
V = 57 litersT = 20.00 KP ~ 220 kPa
Centrifugal pump(17 l/s, 7.6 kPa, 3-7 m/s)
3 kW Heater
3 kW HX utilizing4K & 14K He coolant
35 cm cell (beam interaction volume)
Solid Tgtsbeam
Electron Beam180 μA, 4x4 mm2
Designed using CFD
37
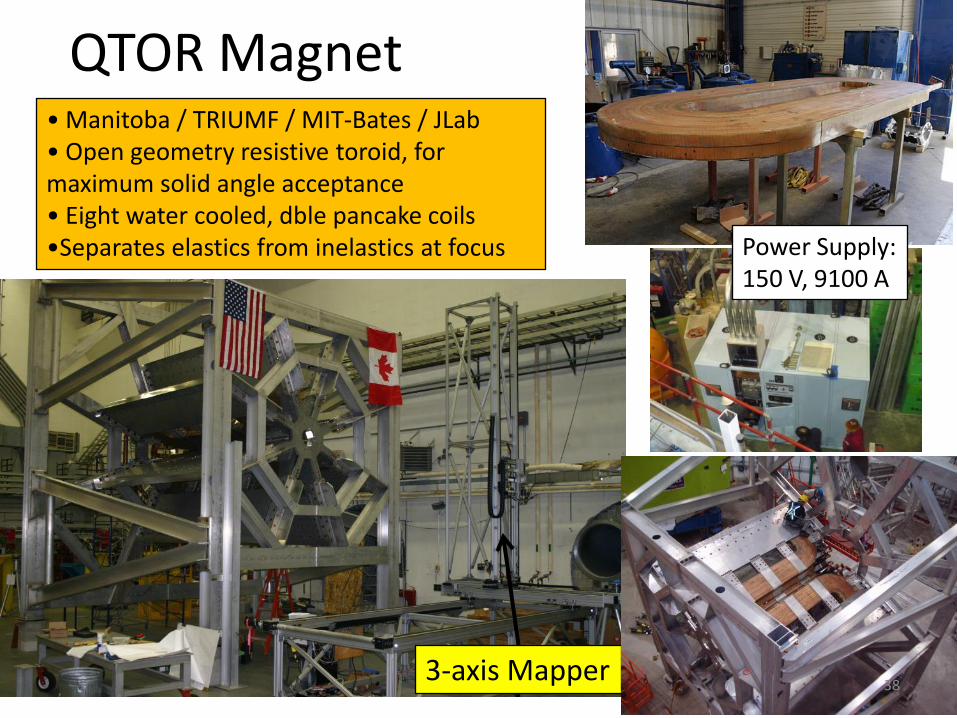
QTOR Magnet• Manitoba / TRIUMF / MIT-Bates / JLab• Open geometry resistive toroid, for maximum solid angle acceptance• Eight water cooled, dble pancake coils•Separates elastics from inelastics at focus
3-axis Mapper
Power Supply:150 V, 9100 A
38
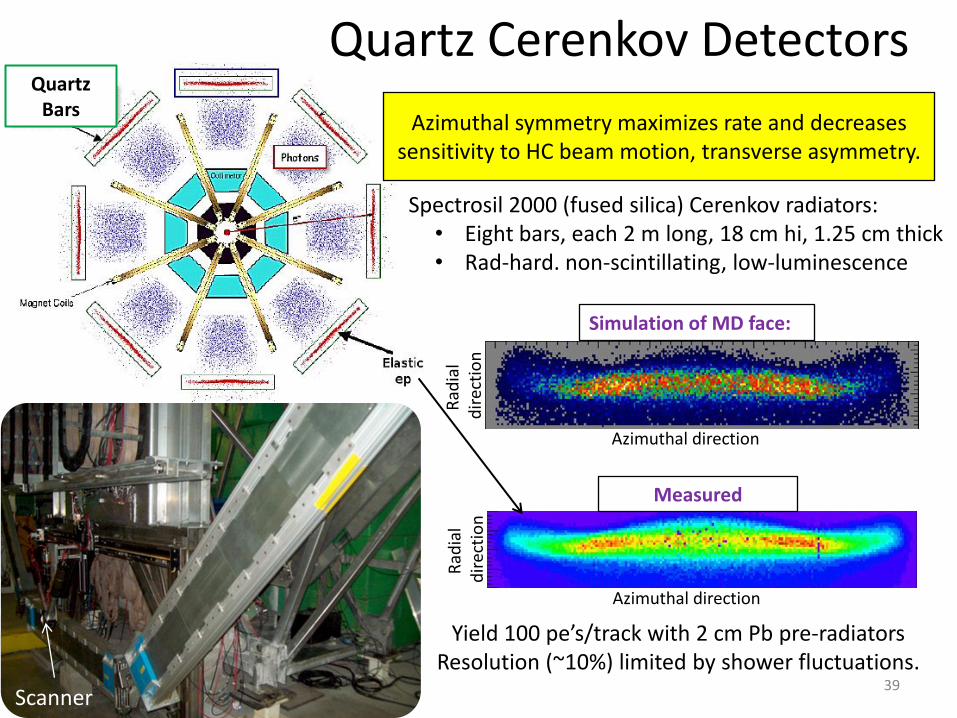
Quartz Cerenkov Detectors
Yield 100 pe’s/track with 2 cm Pb pre-radiatorsResolution (~10%) limited by shower fluctuations.
Simulation of MD face:
Measured
Azimuthal directionR
adia
ld
irec
tio
n
Azimuthal symmetry maximizes rate and decreases sensitivity to HC beam motion, transverse asymmetry.
Spectrosil 2000 (fused silica) Cerenkov radiators: • Eight bars, each 2 m long, 18 cm hi, 1.25 cm thick• Rad-hard. non-scintillating, low-luminescence
Quartz Bars
Azimuthal direction
Rad
ial
dir
ecti
on
Scanner39
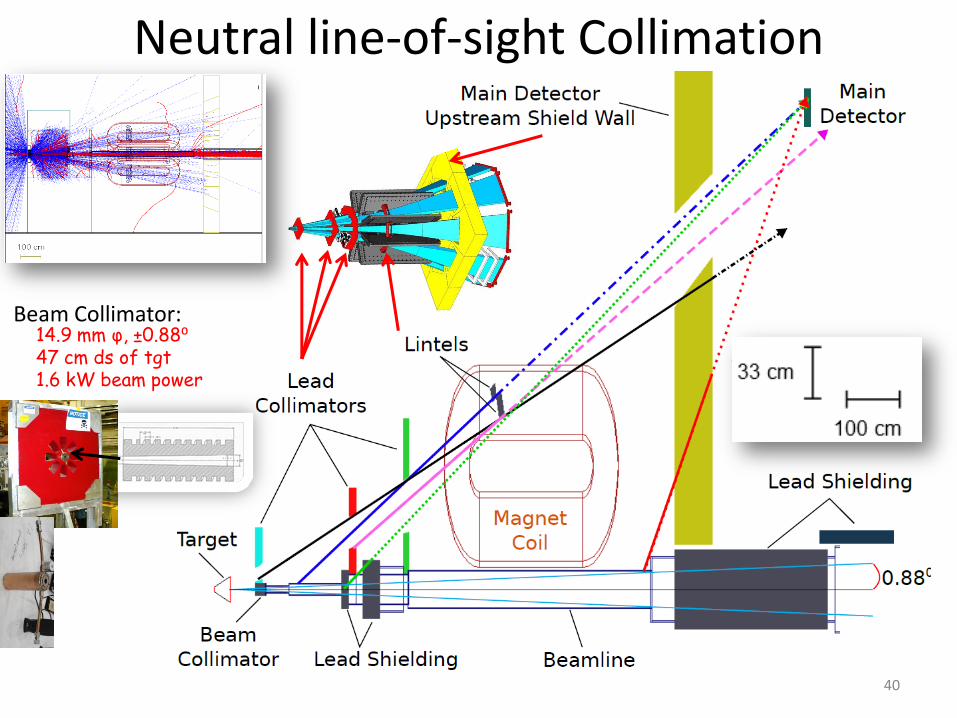
Neutral line-of-sight Collimation
14.9 mm φ, ±0.88⁰47 cm ds of tgt1.6 kW beam power
Beam Collimator:
40
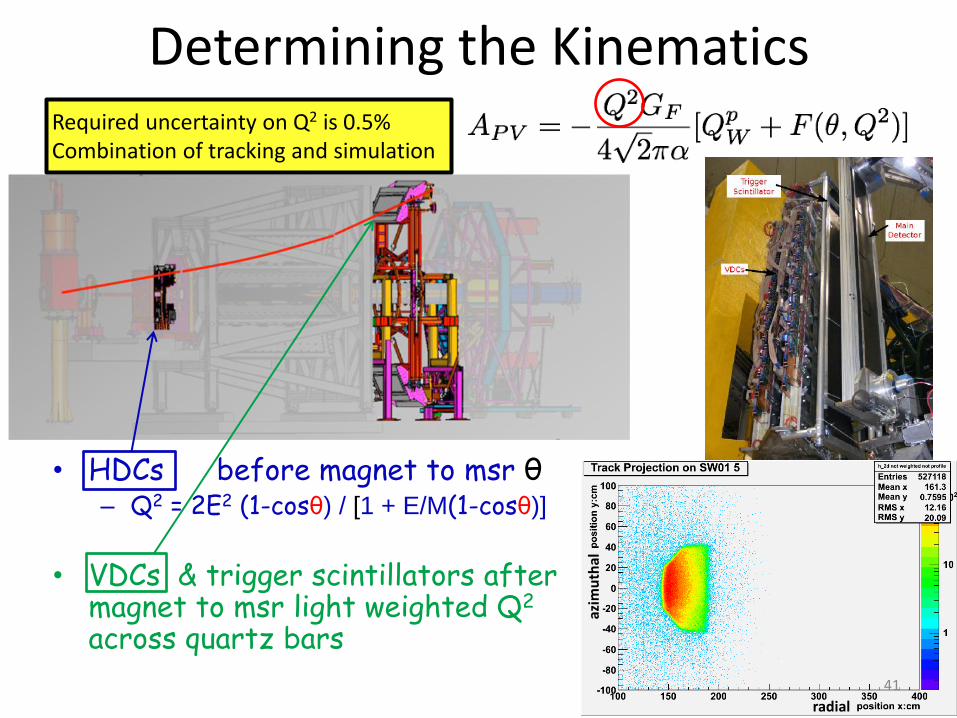
Determining the KinematicsRequired uncertainty on Q2 is 0.5% Combination of tracking and simulation
• HDCs before magnet to msr θ– Q2 = 2E2 (1-cosθ) / [1 + E/M(1-cosθ)]
• VDCs & trigger scintillators after magnet to msr light weighted Q2
across quartz bars
radial
azim
uth
al
41
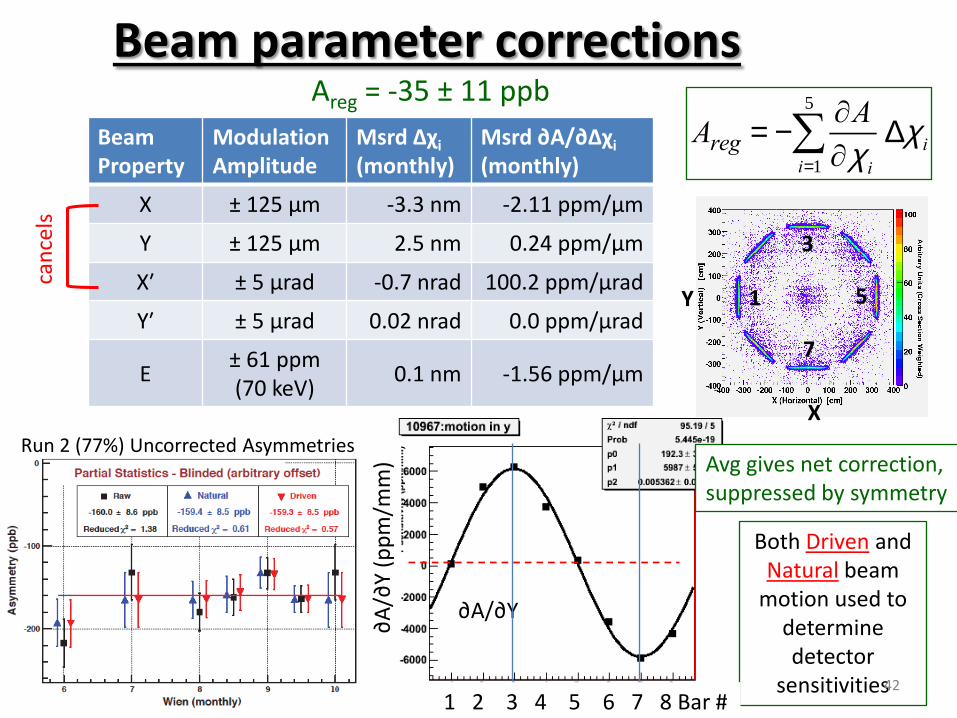
Beam parameter correctionsAreg = -35 ± 11 ppb
Areg = -¶A
¶c ii=1
5
å Dc iBeam Property
Modulation Amplitude
Msrd Δχi
(monthly)Msrd ∂A/∂Δχi
(monthly)
X ± 125 μm -3.3 nm -2.11 ppm/μm
Y ± 125 μm 2.5 nm 0.24 ppm/μm
X′ ± 5 μrad -0.7 nrad 100.2 ppm/μrad
Y′ ± 5 μrad 0.02 nrad 0.0 ppm/μrad
E± 61 ppm(70 keV)
0.1 nm -1.56 ppm/μm
Avg gives net correction, suppressed by symmetry
Both Driven and Natural beam
motion used to determine detector
sensitivities
1
3
5
7
∂A
/∂X
(p
pm
/mm
)
∂A/∂Y
1 2 3 4 5 6 7 8 Bar #1 2 3 4 5 6 7 8 Bar #
∂A
/∂Y
(pp
m/m
m)
can
cels
X
Y
∂A/∂X
Run 2 (77%) Uncorrected Asymmetries
42
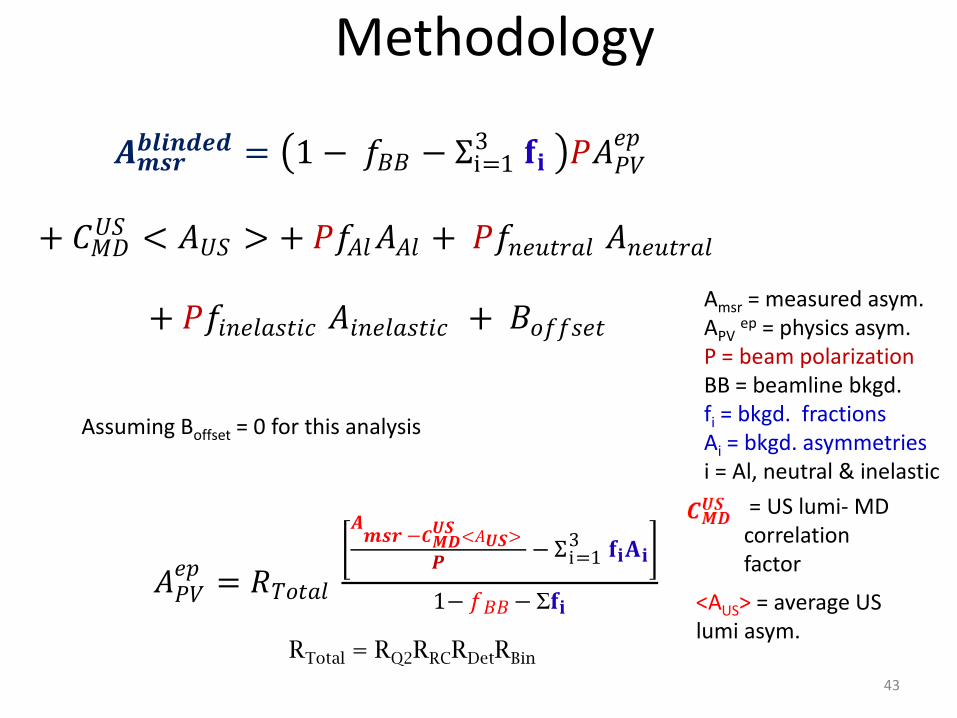
𝑨𝒎𝒔𝒓𝒃𝒍𝒊𝒏𝒅𝒆𝒅 = 1 − 𝑓𝐵𝐵 − Σi=1
3 𝐟𝐢 𝑃𝐴𝑃𝑉𝑒𝑝
+ 𝐶𝑀𝐷𝑈𝑆 < 𝐴𝑈𝑆 > + 𝑃𝑓𝐴𝑙𝐴𝐴𝑙 + 𝑃𝑓𝑛𝑒𝑢𝑡𝑟𝑎𝑙 𝐴𝑛𝑒𝑢𝑡𝑟𝑎𝑙
+ 𝑃𝑓𝑖𝑛𝑒𝑙𝑎𝑠𝑡𝑖𝑐 𝐴𝑖𝑛𝑒𝑙𝑎𝑠𝑡𝑖𝑐 + 𝐵𝑜𝑓𝑓𝑠𝑒𝑡
𝐴𝑃𝑉𝑒𝑝
= 𝑅𝑇𝑜𝑡𝑎𝑙
𝑨𝒎𝒔𝒓 −𝑪𝑴𝑫
𝑼𝑺<𝐴𝑼𝑺>
𝑷 − Σi=1
3 𝐟𝐢𝐀𝐢
1− 𝑓𝐵𝐵 − Σ𝐟𝐢
Amsr = measured asym.APV
ep = physics asym.P = beam polarizationBB = beamline bkgd.fi = bkgd. fractionsAi = bkgd. asymmetriesi = Al, neutral & inelastic
RTotal = RQ2RRCRDetRBin
Methodology
Assuming Boffset = 0 for this analysis
= US lumi- MD correlation factor
<AUS> = average US lumi asym.
43
Wien
0Wien
0
Wien
0
Wien
0Wien
0
Wien
0Wien
0
Wien
0
Wien
0
Wien
0
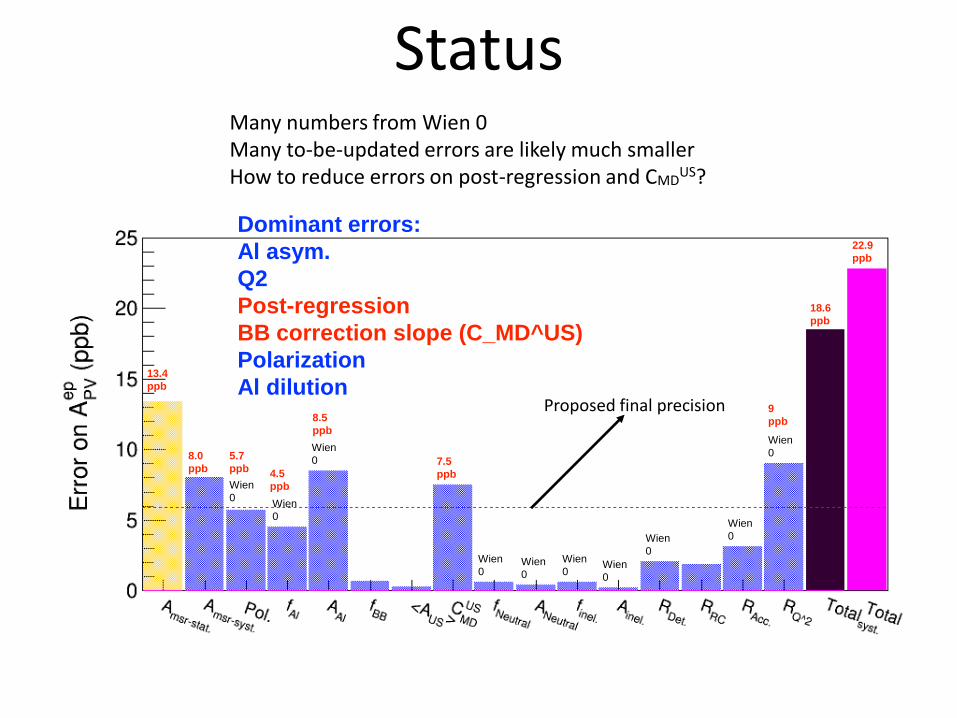
13.4
ppb
8.0
ppb7.5
ppb
9
ppb
Dominant errors:
Al asym.
Q2
Post-regression
BB correction slope (C_MD^US)
Polarization
Al dilutionProposed final precision
18.6
ppb
Many numbers from Wien 0Many to-be-updated errors are likely much smallerHow to reduce errors on post-regression and CMD
US?
5.7
ppb 4.5
ppb
8.5
ppb
22.9
ppb
Status
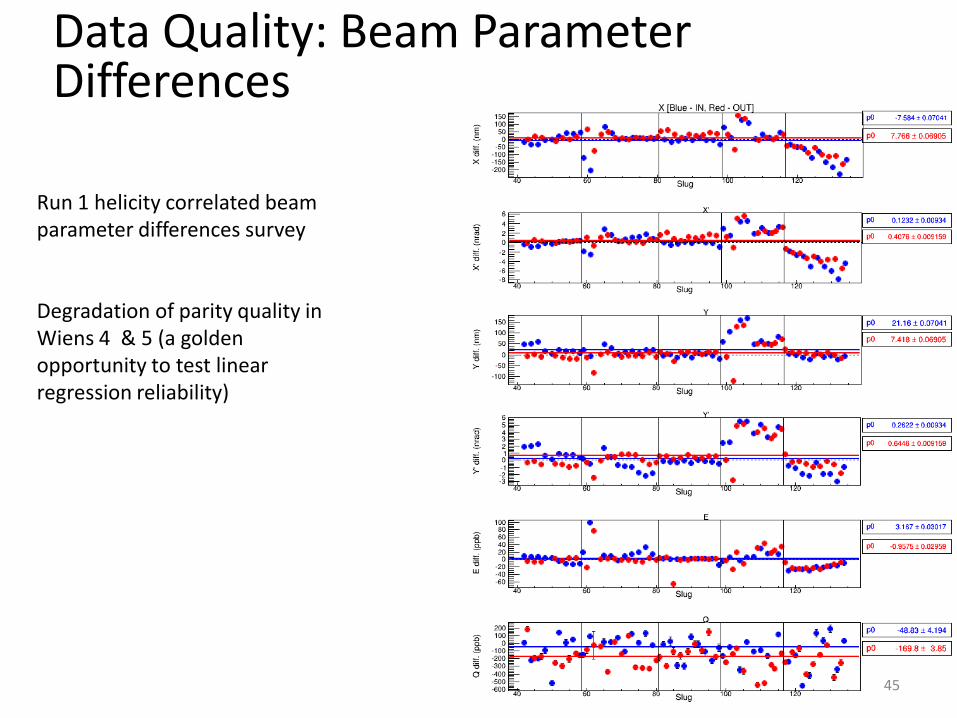
Data Quality: Beam Parameter Differences
Run 1 helicity correlated beam parameter differences survey
Degradation of parity quality in Wiens 4 & 5 (a golden opportunity to test linear regression reliability)
45
0 0.0025 0.005 0.0075
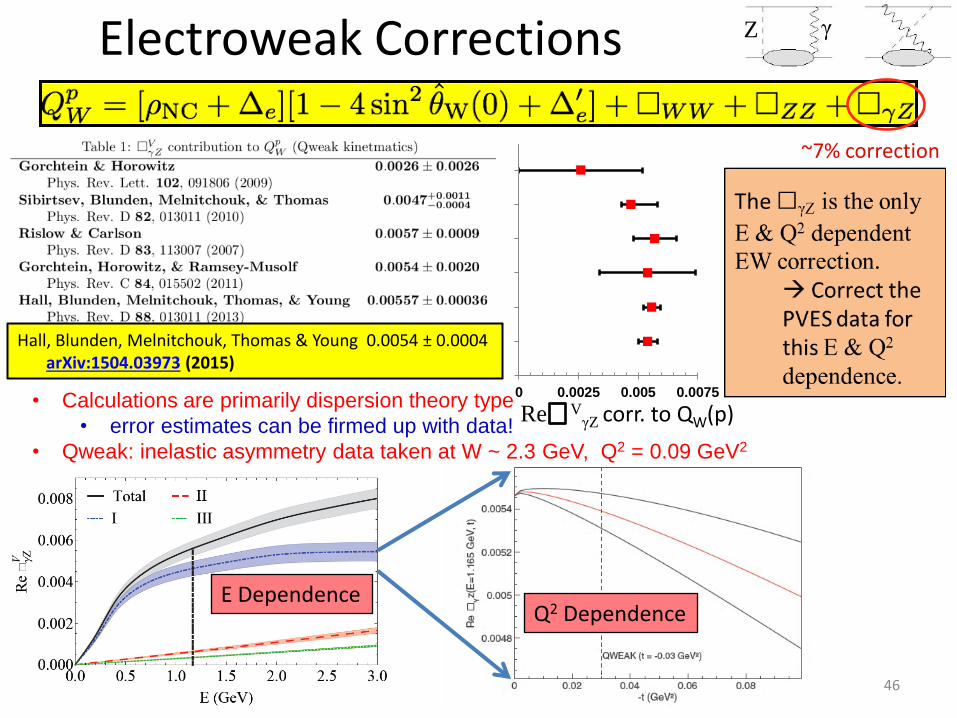
Electroweak Corrections
~7% correction
Q2 DependenceE Dependence
• Calculations are primarily dispersion theory type
• error estimates can be firmed up with data!
• Qweak: inelastic asymmetry data taken at W ~ 2.3 GeV, Q2 = 0.09 GeV2
γZ
Hall, Blunden, Melnitchouk, Thomas & Young 0.0054 ± 0.0004arXiv:1504.03973 (2015)
Re VγZ corr. to QW(p)
46
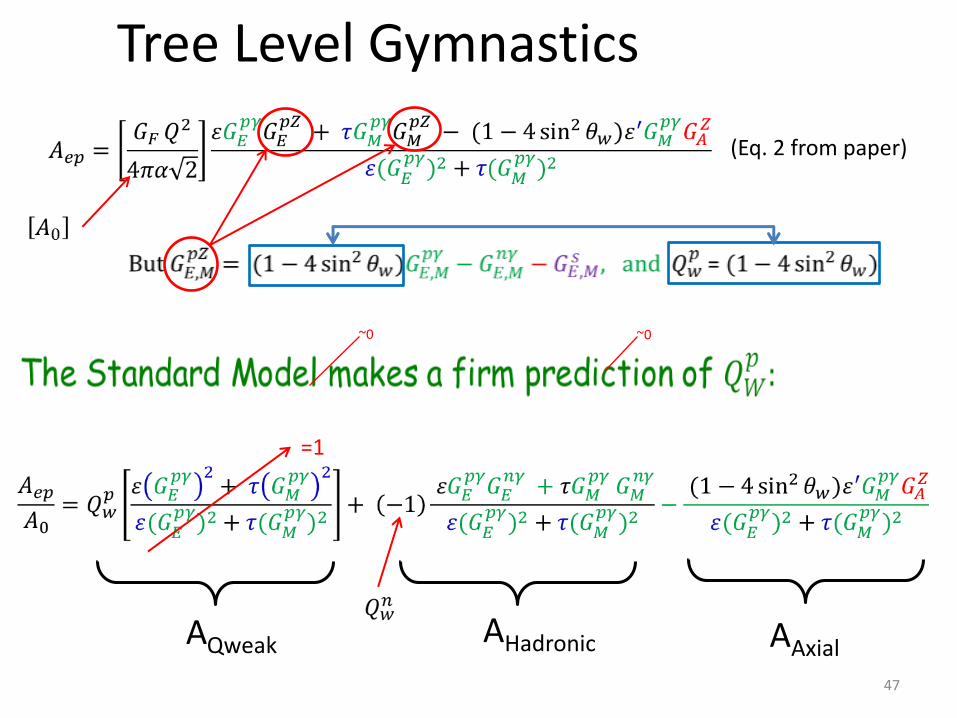
Tree Level Gymnastics
(Eq. 2 from paper)
AQweak AHadronic AAxial
~0 ~0
=1
47