Embed Size (px)
Citation preview
THESIS FOR THE DEGREE OF LICENTIATE OF ENGINEERING
SIMULATION AND OPTIMISATION OF CRUSHING PLANT PERFORMANCE
PER SVEDENSTEN
DEPARTMENT OF MACHINE AND VEHICLE SYSTEMS CHALMERS UNIVERSITY OF TECHNOLOGY
GÖTEBORG, SWEDEN
MAY 2004
Simulation and Optimisation of Crushing Plant Performance Copyright 2004 © Per Svedensten
Published and distributed by
Chalmers University of Technology
Machine and Vehicle Systems
SE-412 96 Göteborg
Printed in Sweden by
Chalmers Reproservice
Göteborg 2004
i
ABSTRACT Crushing plants are used both by quarry companies for aggregates production and in mining industry for size reduction of rock material and ores. At present, the performance of crushing plants is tuned using trial and error methods. This is a time consuming and difficult procedure. Achieving optimal performance is difficult using these methods. Computer simulation and optimisation can be used to improve the performance of a crushing plant. Crushing plant optimisation requires process optimisation theory to be utilised for a successful result. Process optimisation theory implies simultaneous optimisation of the crushing plant structure, machine parameters and the tolerances associated with the machine parameters. Parameters in a crushing plant are typically closed side setting and throw on crushers and aperture size, throw and rotational speed on screens. Tolerances in a crushing plant are typically the amount of wear that can be tolerated on wear parts that affect the performance of the plant.
This thesis focuses on mathematical modelling, computer simulation and optimisation of crushing plants. The structure of the crushing plant is considered to be fixed and only parameters and tolerances are included in the optimisations.
To optimise the crushing plant a novel methodology has been developed that uses both technical and economic models. The technical model includes the effects of wear in the plant enabling simultaneous optimisation of the parameters and wear tolerances. To solve the optimisation task two different methods have been used: genetic evolutionary algorithm with local search and probabilistic global search Lausanne.
The economic model includes production cost for all products and the income from sales. Including costs in the model provides a connection between the technical and economic issues which has proven to be very powerful. The optimisation also takes customer demands on the products into consideration. The optimisation is done with the restriction to never violate the customer demands regardless of the status of the wear parts.
In the thesis it is shown that it is impossible to utilise the optimisation results in a crushing plant if the modelling is done without including the wear of crucial machine parts. The results from the optimisation show that the developed methods are suitable for finding the optimal solution for different types of crushing plants. The obtained results give insights into how crushing plants are affected by wear and what measures are needed to establish a process with the required quality of the products.
The results from this work have been implemented in the new computer software. The software with a user friendly graphical interface has been developed in Microsoft Visual C++. To create the crushing plant model in the software environment a drag and drop method is implemented. This software can be used for finding the optimal setting for a crushing plant for the current market situation. It can also be utilised for design of plants. Different virtual prototypes of crushing plants can be easy evaluated on their top performance giving the best design. Education is another area where the developed software can be successfully used. The performances of different production units can be investigated to increase the knowledge of personnel how the production units interact in a crushing plant.
Keywords: Crushing plant, mathematical modelling, simulation, optimisation, genetic algorithm, probabilistic global search, process theory, process design.

ii
iii
CONTENTS Abstract ....................................................................................................................................... i
List of Publications.................................................................................................................... iv
Acknowledgement..................................................................................................................... iv
1. Introduction .......................................................................................................................... 1
2. Scientific Approach.............................................................................................................. 4
3. Modelling of Crushing Plants .............................................................................................. 6 3.1. Production Units......................................................................................................... 8 3.2. Rock Material ............................................................................................................. 9 3.3. Modelling Wear Influence ......................................................................................... 9 3.4. Economics ................................................................................................................ 12 3.5. Customer Demands .................................................................................................. 14
4. Optimisation ....................................................................................................................... 15 4.1. Pre-Processing.......................................................................................................... 15 4.2. Constraints................................................................................................................ 15 4.3. Cost Function ........................................................................................................... 16 4.4. Process Simulation ................................................................................................... 17 4.5. Problem Statement of Crushing Plant Optimisation ................................................ 18 4.6. Genetic Evolutionary Algorithm with Local Search, GLS ...................................... 18 4.7. Probabilistic Global Search Lausanne, PGSL.......................................................... 18 4.8. Method Comparison of the Optimisation Routines.................................................. 19
5. Software Implementation ................................................................................................... 20
6. Aggregate Production Example ......................................................................................... 21 6.1. Operating Conditions ............................................................................................... 22 6.2. Optimisation Results ................................................................................................ 23
7. Lump Iron Ore.................................................................................................................... 25 7.1. Operating Conditions ............................................................................................... 25 7.2. Optimisation Results ................................................................................................ 26
8. Conclusions and Future Work............................................................................................ 28
References ................................................................................................................................ 30
iv
LIST OF PUBLICATIONS The following papers are appended in this thesis:
Paper A: Svedensten, P. and Evertsson, C. M., Optimisation of crushing plants using a genetic evolutionary algorithm. Presented at Minerals Engineering conference in Perth, Australia, September 25-27, 2002. Accepted for publication in Minerals Engineering.
Paper B: Svedensten, P. and Evertsson, C. M., Computer assisted optimisation of crushing plants for both machine parameters and wear tolerances. Presented at CAMI 2003 in Calgary Canada, September 8-10, 2003. Proceedings of CAMI 2003.
Paper C: Svedensten, P. and Evertsson, C. M., Crushing plant optimisation; Finding the optimal machine parameters, wear tolerances and wear parts. Presented at Comminution 04 in Perth, Australia, March 24-26. Will be submitted to Minerals Engineering.
ACKNOWLEDGEMENT First the author would like to thank the sponsors of the project: The Swedish Aggregates Producers Association (SBMI), The Development Fund of the Swedish Construction Industry (SBUF) and Sandvik Rock Processing. To Work in the project have been very rewarding and enjoyable, the sponsors’ representatives have showed good interest and have provided a lot of good ideas both at the steering group meetings and on other occasions. The Swedish Energy authority (STEM) and Development Program for Minerals, Aggregates and Stone products. (MinBaS) are acknowledged for their extra support for the project. This has provided the project with extra resources for modelling which have been very useful and have helped the project to progress more rapidly.
This work has been carried out at the department of Machine and Vehicle Systems at Chalmers University of Technology. My supervisor Magnus Evertsson, Ph.D, is gratefully acknowledged for his involvement in my work. He has always supported me and provided me with inspiration throughout the project. My friends and colleges in the crushing group at Chalmers are also acknowledged for useful discussions and good laughs. It has been a pleasure working together with the crushing group lead by Dr Magnus Evertsson. Professor Viktor Berbyuk is acknowledged for discussions and his work as an examiner.
Finally friends and family deserves a big thanks for their support and interest in my work.
1
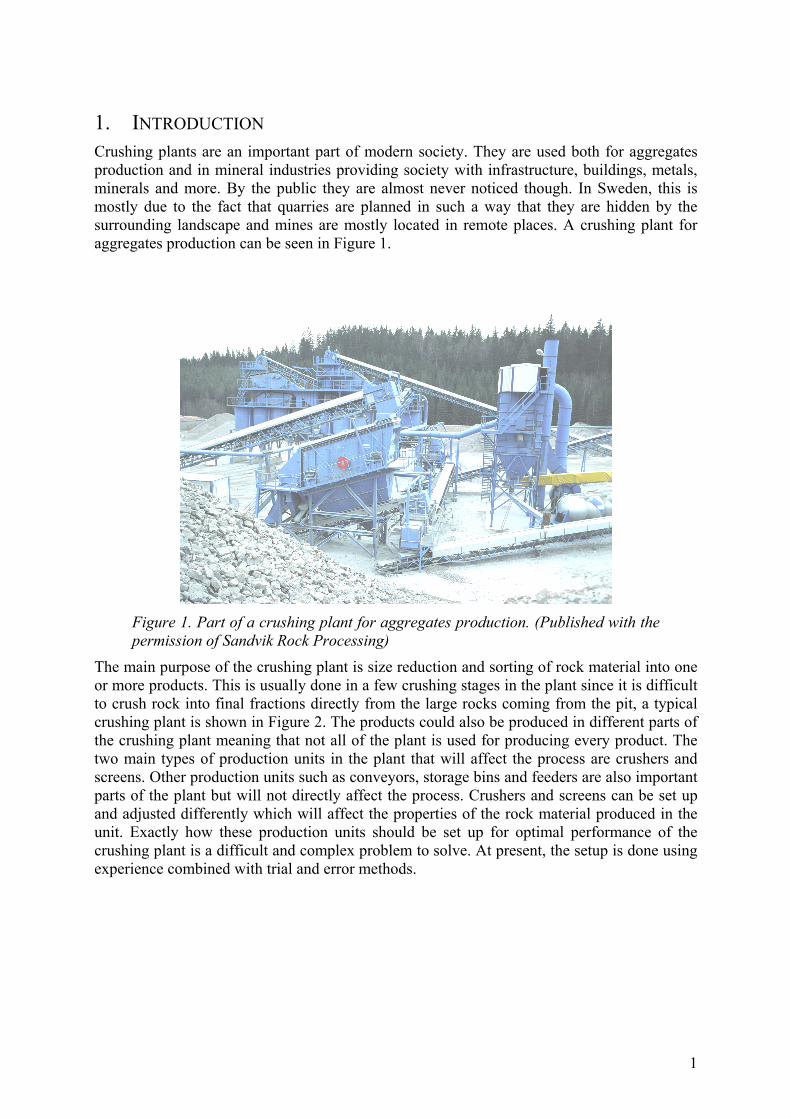
1. INTRODUCTION Crushing plants are an important part of modern society. They are used both for aggregates production and in mineral industries providing society with infrastructure, buildings, metals, minerals and more. By the public they are almost never noticed though. In Sweden, this is mostly due to the fact that quarries are planned in such a way that they are hidden by the surrounding landscape and mines are mostly located in remote places. A crushing plant for aggregates production can be seen in Figure 1.
Figure 1. Part of a crushing plant for aggregates production. (Published with the permission of Sandvik Rock Processing)
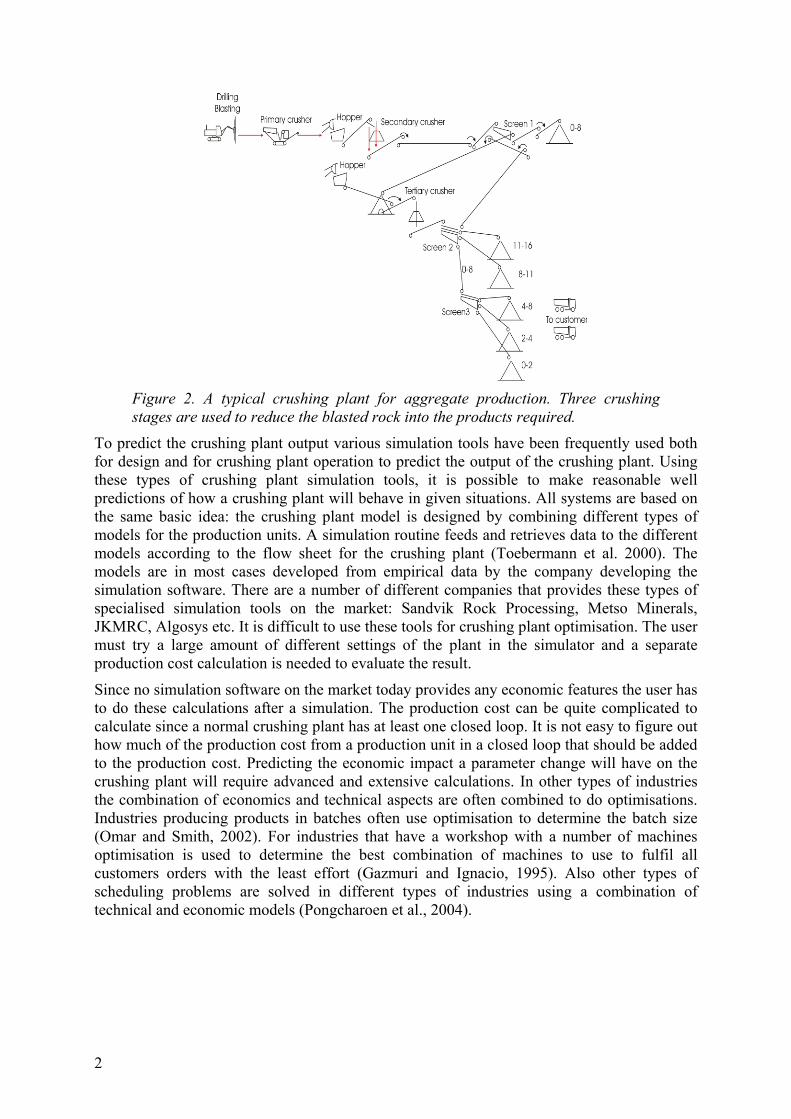
The main purpose of the crushing plant is size reduction and sorting of rock material into one or more products. This is usually done in a few crushing stages in the plant since it is difficult to crush rock into final fractions directly from the large rocks coming from the pit, a typical crushing plant is shown in Figure 2. The products could also be produced in different parts of the crushing plant meaning that not all of the plant is used for producing every product. The two main types of production units in the plant that will affect the process are crushers and screens. Other production units such as conveyors, storage bins and feeders are also important parts of the plant but will not directly affect the process. Crushers and screens can be set up and adjusted differently which will affect the properties of the rock material produced in the unit. Exactly how these production units should be set up for optimal performance of the crushing plant is a difficult and complex problem to solve. At present, the setup is done using experience combined with trial and error methods.
2
Figure 2. A typical crushing plant for aggregate production. Three crushing stages are used to reduce the blasted rock into the products required.
To predict the crushing plant output various simulation tools have been frequently used both for design and for crushing plant operation to predict the output of the crushing plant. Using these types of crushing plant simulation tools, it is possible to make reasonable well predictions of how a crushing plant will behave in given situations. All systems are based on the same basic idea: the crushing plant model is designed by combining different types of models for the production units. A simulation routine feeds and retrieves data to the different models according to the flow sheet for the crushing plant (Toebermann et al. 2000). The models are in most cases developed from empirical data by the company developing the simulation software. There are a number of different companies that provides these types of specialised simulation tools on the market: Sandvik Rock Processing, Metso Minerals, JKMRC, Algosys etc. It is difficult to use these tools for crushing plant optimisation. The user must try a large amount of different settings of the plant in the simulator and a separate production cost calculation is needed to evaluate the result.
Since no simulation software on the market today provides any economic features the user has to do these calculations after a simulation. The production cost can be quite complicated to calculate since a normal crushing plant has at least one closed loop. It is not easy to figure out how much of the production cost from a production unit in a closed loop that should be added to the production cost. Predicting the economic impact a parameter change will have on the crushing plant will require advanced and extensive calculations. In other types of industries the combination of economics and technical aspects are often combined to do optimisations. Industries producing products in batches often use optimisation to determine the batch size (Omar and Smith, 2002). For industries that have a workshop with a number of machines optimisation is used to determine the best combination of machines to use to fulfil all customers orders with the least effort (Gazmuri and Ignacio, 1995). Also other types of scheduling problems are solved in different types of industries using a combination of technical and economic models (Pongcharoen et al., 2004).
3
Processing rock in a crushing plant should be viewed as an industrial process. By accepting this fact, some basic rules about how to set up and run the process are established. Using process optimisation theory there are three areas that must be included to obtain an optimal process Montgomery (1996):
• Structure - Plant layout and production unit selection • Parameters - Set up of the variable parameters in the production units • Tolerances - Variations of the parameters, i.e. wear tolerances
All these areas must be optimised simultaneously to get an optimal process. A sub-optimal solution is likely to be the result otherwise. Crushing rock into different products is no exception from this statement. Optimising all three areas simultaneously is a complicated and large problem to solve. For a crushing plant it is impossible to do it without a powerful computer equipped with specialised optimisation software. The number of possible parameter combinations will quite easily reach billions for a problem with ten parameters.
In this thesis a method is presented that simultaneously provides modelling, simulation and optimisation of parameters and tolerances. The economic aspects are fully taken into consideration in all models. All methods and results of the research have been implemented in a software package. This software can be the base for developing a software package that can be commercially used by the industry.
One of the first results in this work was that it is impossible to utilise the optimisation results in a crushing plant without taking the wear of various crucial parts into account (Paper A). If the plant is optimised without including the effects of wear the quality of high value products will be ruined very quickly. Important parts that change due to wear are typically screen cloths and crusher liners. Both these types of wear parts will affect the crushing plant in such a way that the performance will change. Other types of wear parts can be conveyor belts and various types of protection devises. These parts do not directly affect the performance of the plant but will of course effect the down time due to wear part replacements. This aspect is not included in the current models.
4
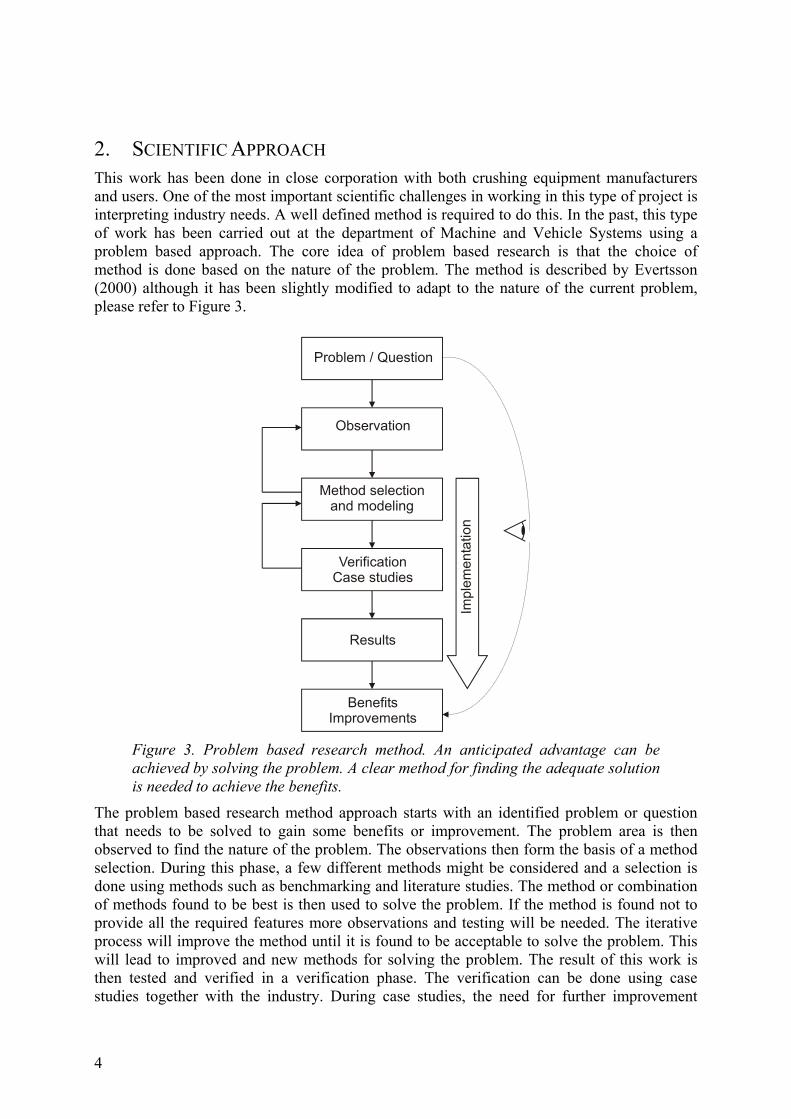
2. SCIENTIFIC APPROACH This work has been done in close corporation with both crushing equipment manufacturers and users. One of the most important scientific challenges in working in this type of project is interpreting industry needs. A well defined method is required to do this. In the past, this type of work has been carried out at the department of Machine and Vehicle Systems using a problem based approach. The core idea of problem based research is that the choice of method is done based on the nature of the problem. The method is described by Evertsson (2000) although it has been slightly modified to adapt to the nature of the current problem, please refer to Figure 3.
Problem / Question
Observation
Method selection and modeling
VerificationCase studies
Results
BenefitsImprovements
Impl
emen
tatio
n
Figure 3. Problem based research method. An anticipated advantage can be achieved by solving the problem. A clear method for finding the adequate solution is needed to achieve the benefits.
The problem based research method approach starts with an identified problem or question that needs to be solved to gain some benefits or improvement. The problem area is then observed to find the nature of the problem. The observations then form the basis of a method selection. During this phase, a few different methods might be considered and a selection is done using methods such as benchmarking and literature studies. The method or combination of methods found to be best is then used to solve the problem. If the method is found not to provide all the required features more observations and testing will be needed. The iterative process will improve the method until it is found to be acceptable to solve the problem. This will lead to improved and new methods for solving the problem. The result of this work is then tested and verified in a verification phase. The verification can be done using case studies together with the industry. During case studies, the need for further improvement

5
might arise. This means that further iterations with adjustments of the method to solve the problem is needed.
To get the desired improvement the results also need to be implemented which is a challenge in itself. Starting this implementation during the solving phase of the problem has shown to be very important. It is the author’s strong opinion that it is very difficult to do the implementation of the research results as a separate phase in the project. Not thinking about implementation during the research work can yield solutions that solve a particular problem but might be impossible to implement. Working with general methods that are flexible will help in the implementation phase of the project even though it will require more work during the research phase. In the end this method will, if successful, yield the foreseen benefits by solving the problem.
6
3. MODELLING OF CRUSHING PLANTS A survey of various existing software and programming languages was made, to select a method for modelling. The nature of the problem and the wish for a tool that could be implemented were the two biggest concerns when it came to method selection. Calculation speed is an important factor that also must be taken into consideration. Due to the number of parameter combinations and the need for linking of different models large calculation capacity was an issue that must be taken into consideration.
When modelling a crushing plant, there are some unique features that cannot be found in any other types of process industries. For example, the mixture of particle sizes in the rock material passed between the production units and the fact that a larger stone can be crushed to smaller ones and thus becomes a different product. In the plant there is really no way of telling where a rock of a certain size belongs before it ends up in a storage bin ready for delivery to the customer. Another important issue when modelling crushing plants is the fact that wear will have a great impact on the process. As shown in paper B wear needs to be considered in a special way to make the optimisation work (also described in section 3.3). Finally, the fact that the optimisation is discrete was also considered for the method selection.
In the evaluation standard simulation software packages such as Dymola (Dynasim AB), MatLab (Mathworks Inc.,) both alone and in combination with Simulink (Mathworks Inc.,) and TomLab (TomLab Optimization AB) were considered. A few different programming languages such as Microsoft Visual Basic (Microsoft Corp.) and Microsoft Visual C++ (Microsoft Corp.) was also investigated. It was quite quickly realized that the most suitable option was to use Visual C++ for the project. Visual C++ is quick and flexible when it comes to programming features. Another big advantage using C++ is that it is fully object oriented. This is a very important factor since it makes linking different models together dynamically very easy.
The fact that the software developed is totally stand alone and fully specialized is important when it comes to implementation. As mentioned before this is an important factor throughout the project and was recognized from the very beginning. If a software package is used in these types of projects, the risk of running into problems due to software limitation is imminent. There will also be a chance of running into problems never found before and it can therefore not be expected that a software package will have a solution for the new problem. The research will in other words be limited by the tools used instead of the much more favourable way of providing a solution which a flexible programming language will do. Using a software package will also result in properties problem if the developed software is implemented outside the university. The downside of starting from zero, is of course, the amount of time needed to get the basic software running. Coding and debugging a complete simulation and optimisation tool is a time consuming process. Once it is done the reward is large however. New ideas can be tested quickly and new crushing plant configurations can be quickly configured and tested, thanks to the graphical interface.
As mentioned before object orientation is important for modelling crushing plants in a software package. Programming is simplified by arranging all models with a common super class. Functions are automatically inherited down the class tree and all sub classes within the class structure are automatically compatible with each other. When all models are based on the same super class communication with the rest of the software is also simplified. Functions and other classes designed to communicate with the production unit models are automatically compatible with all models without any exceptions. This simplifies the addition of new models since the program structure is standardised.
7
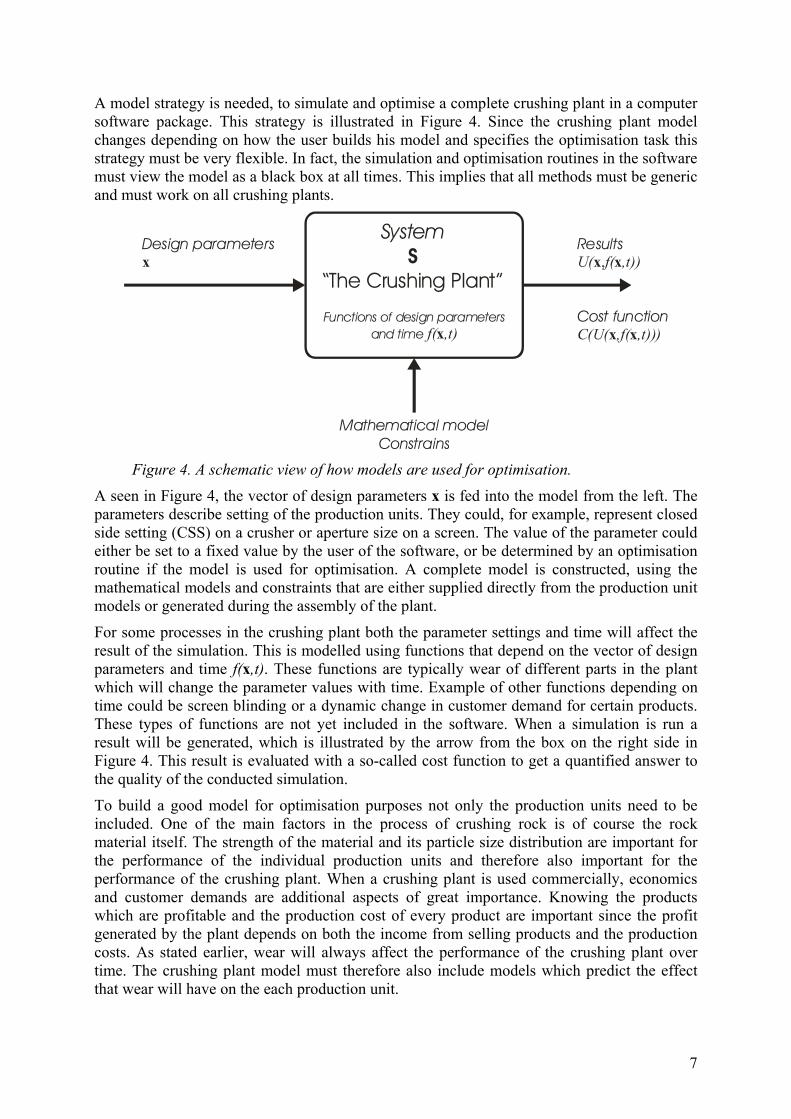
A model strategy is needed, to simulate and optimise a complete crushing plant in a computer software package. This strategy is illustrated in Figure 4. Since the crushing plant model changes depending on how the user builds his model and specifies the optimisation task this strategy must be very flexible. In fact, the simulation and optimisation routines in the software must view the model as a black box at all times. This implies that all methods must be generic and must work on all crushing plants.
Design parametersx
Functions of design parameters and time f( ,t)x
Mathematical modelConstrains
Results U( f( ,t))x x,
Cost functionC(U( ,f( ,t)))x x
System
“The Crushing Plant”S
Figure 4. A schematic view of how models are used for optimisation.
A seen in Figure 4, the vector of design parameters x is fed into the model from the left. The parameters describe setting of the production units. They could, for example, represent closed side setting (CSS) on a crusher or aperture size on a screen. The value of the parameter could either be set to a fixed value by the user of the software, or be determined by an optimisation routine if the model is used for optimisation. A complete model is constructed, using the mathematical models and constraints that are either supplied directly from the production unit models or generated during the assembly of the plant.
For some processes in the crushing plant both the parameter settings and time will affect the result of the simulation. This is modelled using functions that depend on the vector of design parameters and time f(x,t). These functions are typically wear of different parts in the plant which will change the parameter values with time. Example of other functions depending on time could be screen blinding or a dynamic change in customer demand for certain products. These types of functions are not yet included in the software. When a simulation is run a result will be generated, which is illustrated by the arrow from the box on the right side in Figure 4. This result is evaluated with a so-called cost function to get a quantified answer to the quality of the conducted simulation.
To build a good model for optimisation purposes not only the production units need to be included. One of the main factors in the process of crushing rock is of course the rock material itself. The strength of the material and its particle size distribution are important for the performance of the individual production units and therefore also important for the performance of the crushing plant. When a crushing plant is used commercially, economics and customer demands are additional aspects of great importance. Knowing the products which are profitable and the production cost of every product are important since the profit generated by the plant depends on both the income from selling products and the production costs. As stated earlier, wear will always affect the performance of the crushing plant over time. The crushing plant model must therefore also include models which predict the effect that wear will have on the each production unit.
8
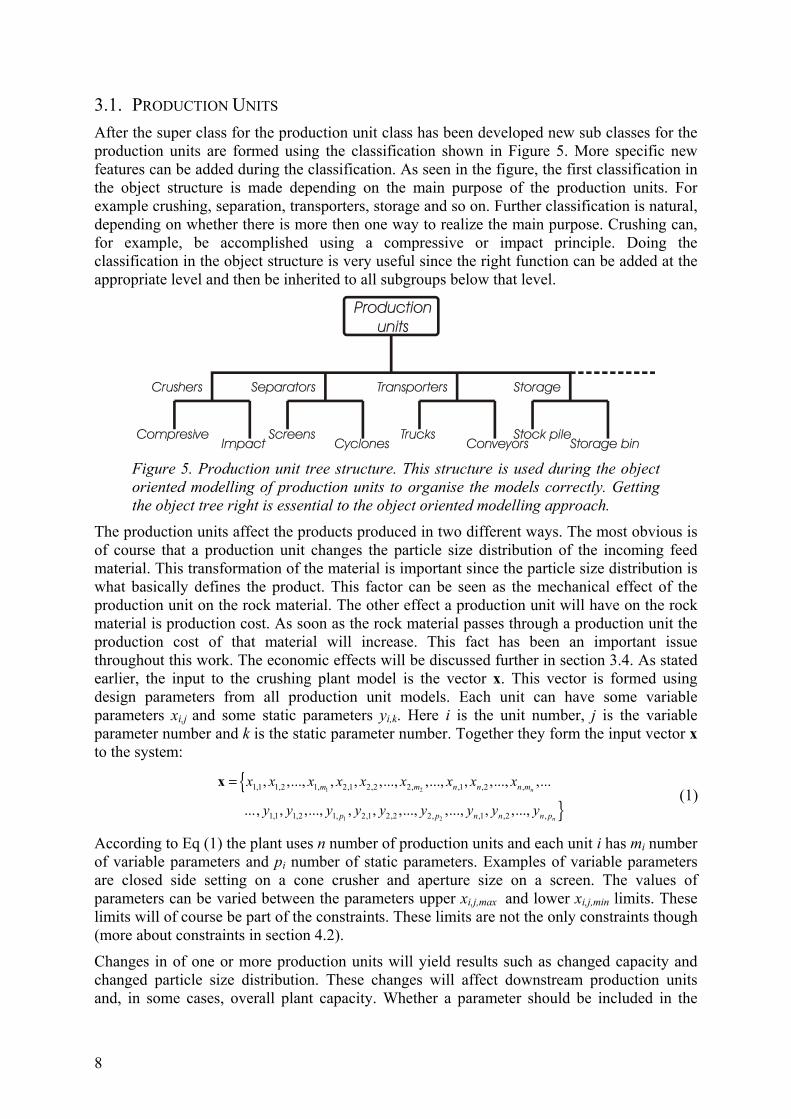
3.1. PRODUCTION UNITS After the super class for the production unit class has been developed new sub classes for the production units are formed using the classification shown in Figure 5. More specific new features can be added during the classification. As seen in the figure, the first classification in the object structure is made depending on the main purpose of the production units. For example crushing, separation, transporters, storage and so on. Further classification is natural, depending on whether there is more then one way to realize the main purpose. Crushing can, for example, be accomplished using a compressive or impact principle. Doing the classification in the object structure is very useful since the right function can be added at the appropriate level and then be inherited to all subgroups below that level.
Production units
Crushers Separators Transporters Storage
CompresiveImpact
ScreensCyclones
Stock pileStorage bin
TrucksConveyors
Figure 5. Production unit tree structure. This structure is used during the object oriented modelling of production units to organise the models correctly. Getting the object tree right is essential to the object oriented modelling approach.
The production units affect the products produced in two different ways. The most obvious is of course that a production unit changes the particle size distribution of the incoming feed material. This transformation of the material is important since the particle size distribution is what basically defines the product. This factor can be seen as the mechanical effect of the production unit on the rock material. The other effect a production unit will have on the rock material is production cost. As soon as the rock material passes through a production unit the production cost of that material will increase. This fact has been an important issue throughout this work. The economic effects will be discussed further in section 3.4. As stated earlier, the input to the crushing plant model is the vector x. This vector is formed using design parameters from all production unit models. Each unit can have some variable parameters xi,j and some static parameters yi,k. Here i is the unit number, j is the variable parameter number and k is the static parameter number. Together they form the input vector x to the system:
1 2
1 2
1,1 1,2 1, 2,1 2,2 2, ,1 ,2 ,
1,1 1,2 1, 2,1 2,2 2, ,1 ,2 ,
, ,..., , , ,..., ,..., , ,..., ,...
..., , ,..., , , ,..., ,..., , ,...,n
n
m m n n n m
p p n n n p
x x x x x x x x x
y y y y y y y y y
=x (1)
According to Eq (1) the plant uses n number of production units and each unit i has mi number of variable parameters and pi number of static parameters. Examples of variable parameters are closed side setting on a cone crusher and aperture size on a screen. The values of parameters can be varied between the parameters upper xi,j,max
and lower xi,j,min limits. These limits will of course be part of the constraints. These limits are not the only constraints though (more about constraints in section 4.2).
Changes in of one or more production units will yield results such as changed capacity and changed particle size distribution. These changes will affect downstream production units and, in some cases, overall plant capacity. Whether a parameter should be included in the
9
optimisation or fixed at a defined value is totally up to the user of the software to decide. The aim of an optimisation often affect whether a parameter should be included in the optimisation or not. It might be good to include the throw on a crusher when designing crushing plants since it is easy to specify the throw before the crusher is installed. If an optimisation is more focused on operation, throw might be of interest since it requires extra resources to change it in an operating plant. This will of course depend on the time frame for the optimisation. If the optimisation is done for a long time frame it might be worth including the throw. The time and resources needed to change of the throw will be easily paid off during the foreseen operating time.
3.2. ROCK MATERIAL The model of the rock material is the factor that will affect the mechanical performance of the process most apart from the parameter settings of the production units. The rock material model is of course also an object in the software system. The main purpose of the object is to carry information about the properties of the current rock material between the different production units. While the rock material is moved through the crushing plant model the rock material model is updated with both mechanical information such as particle size distribution and also production cost information. Other data that are contained in the rock material model include Bond work index, moisture content and density for example.
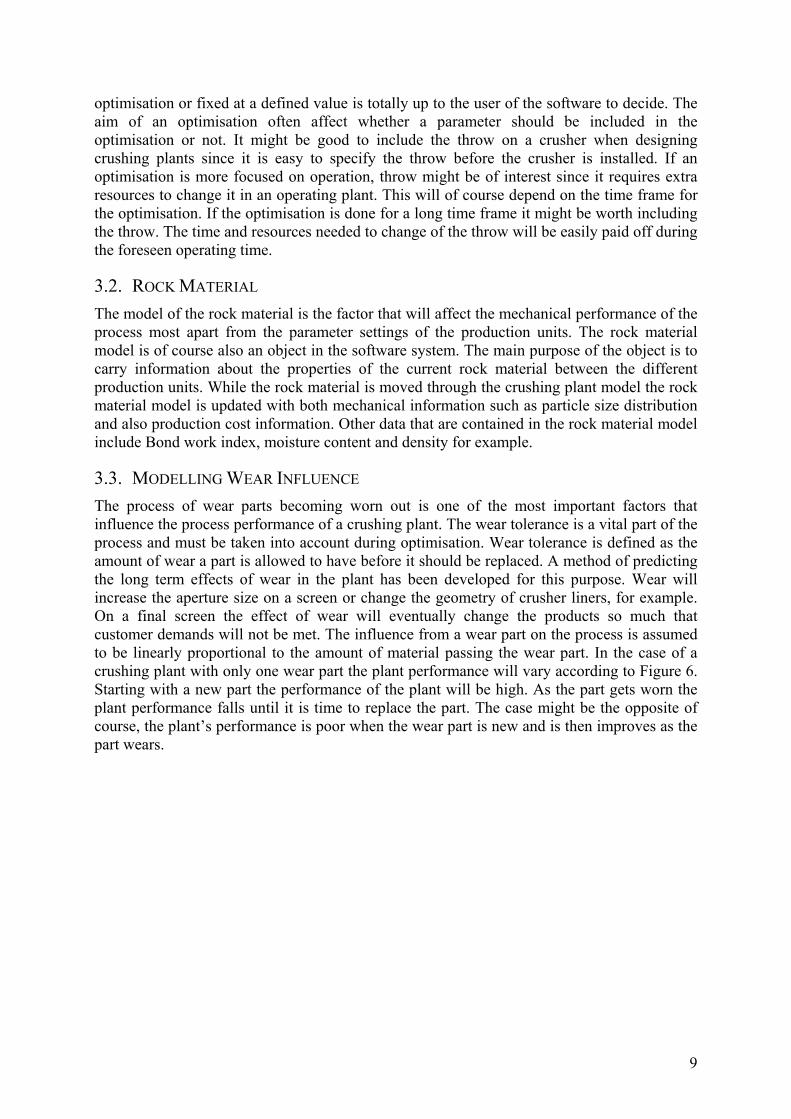
3.3. MODELLING WEAR INFLUENCE The process of wear parts becoming worn out is one of the most important factors that influence the process performance of a crushing plant. The wear tolerance is a vital part of the process and must be taken into account during optimisation. Wear tolerance is defined as the amount of wear a part is allowed to have before it should be replaced. A method of predicting the long term effects of wear in the plant has been developed for this purpose. Wear will increase the aperture size on a screen or change the geometry of crusher liners, for example. On a final screen the effect of wear will eventually change the products so much that customer demands will not be met. The influence from a wear part on the process is assumed to be linearly proportional to the amount of material passing the wear part. In the case of a crushing plant with only one wear part the plant performance will vary according to Figure 6. Starting with a new part the performance of the plant will be high. As the part gets worn the plant performance falls until it is time to replace the part. The case might be the opposite of course, the plant’s performance is poor when the wear part is new and is then improves as the part wears.
10
Time
Pla
nt p
erfo
rman
ce New part
Part replacement
Figure 6. Crushing plant performance variation effected by one wear part. (The picture is illustrative)
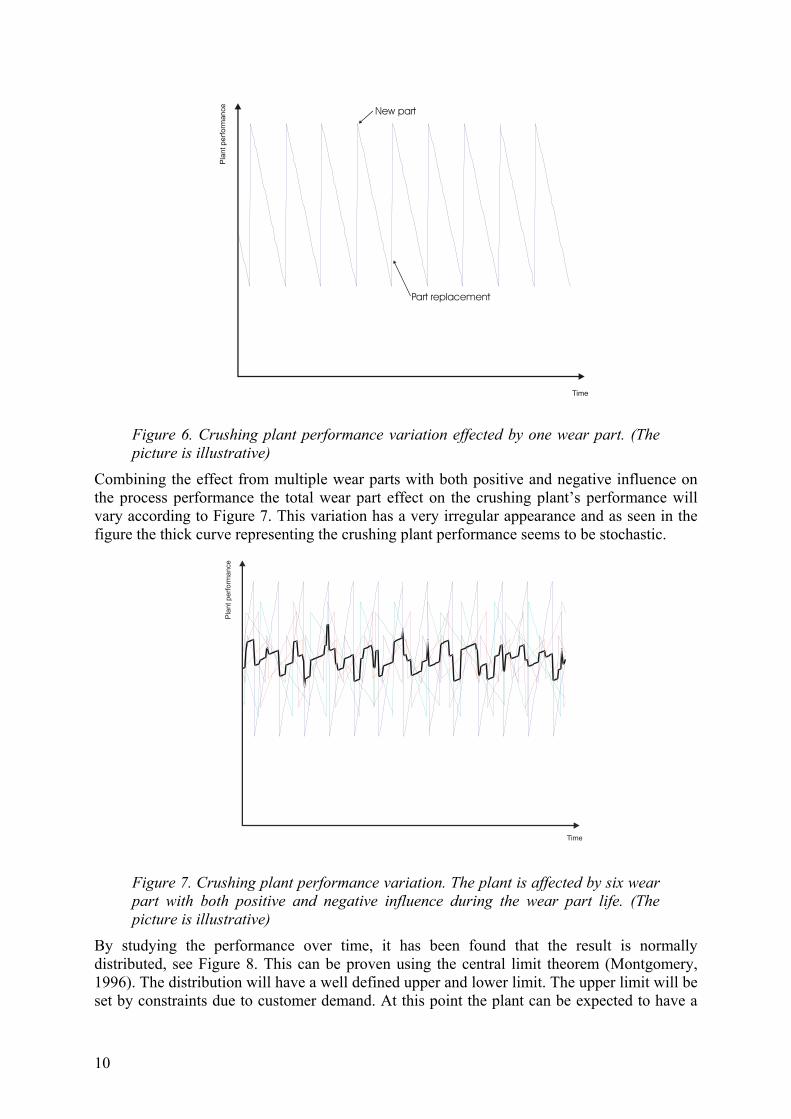
Combining the effect from multiple wear parts with both positive and negative influence on the process performance the total wear part effect on the crushing plant’s performance will vary according to Figure 7. This variation has a very irregular appearance and as seen in the figure the thick curve representing the crushing plant performance seems to be stochastic.
Time
Plan
tper
form
ance
Figure 7. Crushing plant performance variation. The plant is affected by six wear part with both positive and negative influence during the wear part life. (The picture is illustrative)
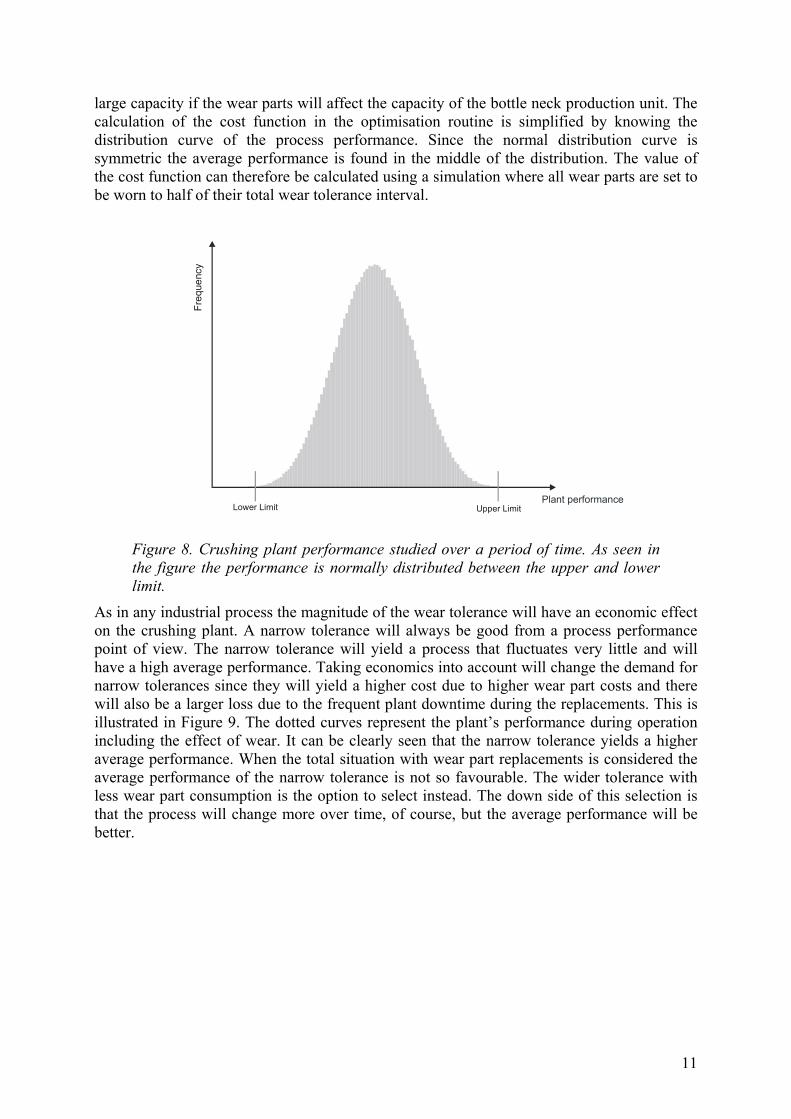
By studying the performance over time, it has been found that the result is normally distributed, see Figure 8. This can be proven using the central limit theorem (Montgomery, 1996). The distribution will have a well defined upper and lower limit. The upper limit will be set by constraints due to customer demand. At this point the plant can be expected to have a
11
large capacity if the wear parts will affect the capacity of the bottle neck production unit. The calculation of the cost function in the optimisation routine is simplified by knowing the distribution curve of the process performance. Since the normal distribution curve is symmetric the average performance is found in the middle of the distribution. The value of the cost function can therefore be calculated using a simulation where all wear parts are set to be worn to half of their total wear tolerance interval.
Plant performance
Freq
uenc
y
Upper LimitLower Limit
Figure 8. Crushing plant performance studied over a period of time. As seen in the figure the performance is normally distributed between the upper and lower limit.
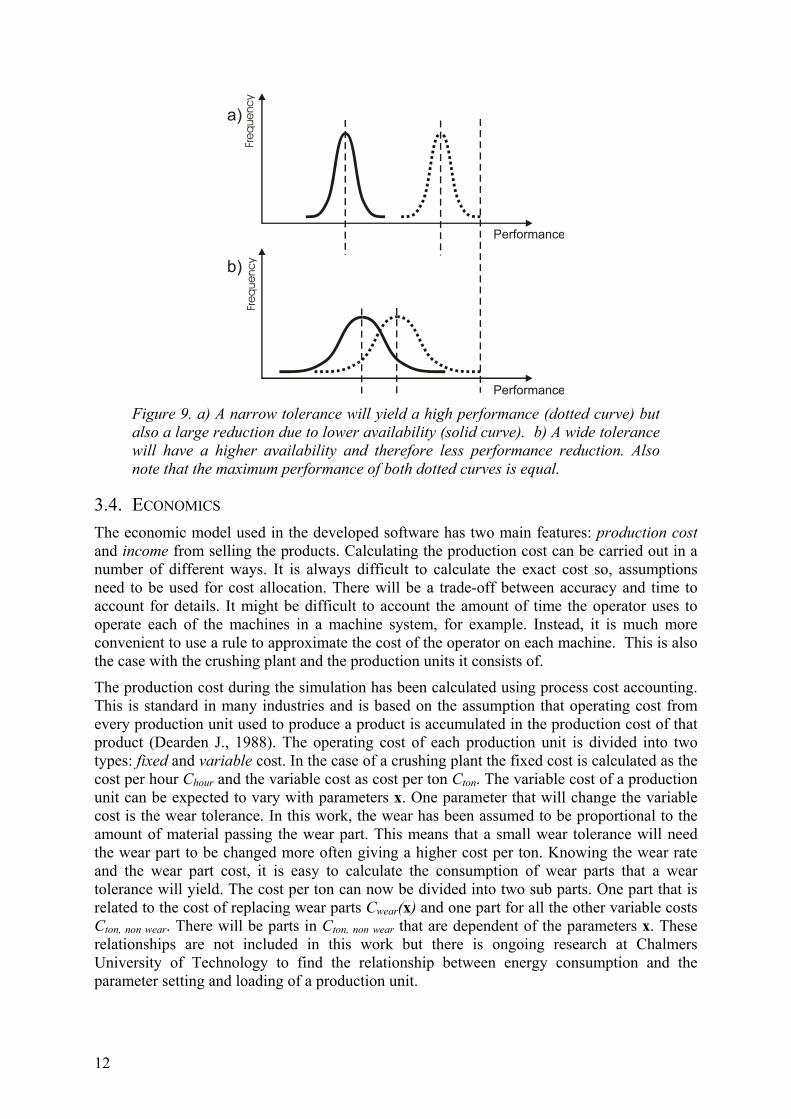
As in any industrial process the magnitude of the wear tolerance will have an economic effect on the crushing plant. A narrow tolerance will always be good from a process performance point of view. The narrow tolerance will yield a process that fluctuates very little and will have a high average performance. Taking economics into account will change the demand for narrow tolerances since they will yield a higher cost due to higher wear part costs and there will also be a larger loss due to the frequent plant downtime during the replacements. This is illustrated in Figure 9. The dotted curves represent the plant’s performance during operation including the effect of wear. It can be clearly seen that the narrow tolerance yields a higher average performance. When the total situation with wear part replacements is considered the average performance of the narrow tolerance is not so favourable. The wider tolerance with less wear part consumption is the option to select instead. The down side of this selection is that the process will change more over time, of course, but the average performance will be better.
12
Performance
a)
b)Fr
eq
uenc
yFr
eq
uenc
y
Performance Figure 9. a) A narrow tolerance will yield a high performance (dotted curve) but also a large reduction due to lower availability (solid curve). b) A wide tolerance will have a higher availability and therefore less performance reduction. Also note that the maximum performance of both dotted curves is equal.
3.4. ECONOMICS The economic model used in the developed software has two main features: production cost and income from selling the products. Calculating the production cost can be carried out in a number of different ways. It is always difficult to calculate the exact cost so, assumptions need to be used for cost allocation. There will be a trade-off between accuracy and time to account for details. It might be difficult to account the amount of time the operator uses to operate each of the machines in a machine system, for example. Instead, it is much more convenient to use a rule to approximate the cost of the operator on each machine. This is also the case with the crushing plant and the production units it consists of.
The production cost during the simulation has been calculated using process cost accounting. This is standard in many industries and is based on the assumption that operating cost from every production unit used to produce a product is accumulated in the production cost of that product (Dearden J., 1988). The operating cost of each production unit is divided into two types: fixed and variable cost. In the case of a crushing plant the fixed cost is calculated as the cost per hour Chour and the variable cost as cost per ton Cton. The variable cost of a production unit can be expected to vary with parameters x. One parameter that will change the variable cost is the wear tolerance. In this work, the wear has been assumed to be proportional to the amount of material passing the wear part. This means that a small wear tolerance will need the wear part to be changed more often giving a higher cost per ton. Knowing the wear rate and the wear part cost, it is easy to calculate the consumption of wear parts that a wear tolerance will yield. The cost per ton can now be divided into two sub parts. One part that is related to the cost of replacing wear parts Cwear(x) and one part for all the other variable costs Cton, non wear. There will be parts in Cton, non wear that are dependent of the parameters x. These relationships are not included in this work but there is ongoing research at Chalmers University of Technology to find the relationship between energy consumption and the parameter setting and loading of a production unit.
13
The cost per time unit iC can be entered directly into the software. The cost per hour is independent of the parameters x. The cost per hour can be very different from one plant to another, however.
The total cost per ton Ctot(x) is calculated using the cost per hour, the variable cost, and the total mass flow ,rock im of rock material through the production unit. This forms the equation as follows:
( ) ( ) ( ), ,,
itot i ton i
rock i
CC Cm
= +x xx
(2)
As mentioned earlier the variable cost includes the cost of wear. Since this is calculated separately the cost per ton is divided into two parts:
( ) ( ), , , ,ton i ton non wear i wear iC C C= +x x (3)
To calculate the cost caused by the consumption of wear parts the wear part cost Cwearpart,r,i(x), the wear rate εr,i(x) (in mm/ton), and wear tolerance ∆r,i(x) (in mm) are used. All parameters are dependant on x since they are a part of the optimisation. The value of the parameters will depend on which wear part that is selected by the optimisation routine. Unit i has wi number of wear parts.
( ) ( )( ) ( ), ,
, ,1 ,
iwwearpart r i
wear i r ir r i
CC ε
=
= ⋅∆∑
xx x
x (4)
Equations (2), (3), and (4) yield the cost of production for unit i. This cost will be added to the flow of material every time it passes the unit.
( ) ( )( ) ( ) ( ), ,
, , , ,1 , ,
iwwearpart r i i
tot i ton non wear i k ir r i rock i
C CC Cm
ε=
= + ⋅ +∆∑
xx x
x x (5)
As mentioned in section 3.3 there is a loss of performance for the crushing plant due to down time in replacing wear parts. During the down time there will be a fixed cost per hour. It is assumed that this cost is the same cost per hour as during operation. The cost per hour during down time is probably not exactly the same as the cost per hour during operation. Calculating a separate cost per hour during down time will be quite difficult and will not yield a great advantage in accuracy. Most of the cost per hour is due to financial and labour cost so the approximation is acceptable. The cost per hour for the plant during downtime is therefore the sum of the cost per hour for every production unit:
1
n
downtime ii
C C=
=∑ (6)
When the rock material is fed into the crushing plant it will also have a raw material cost connected to it, Cinit. This cost is due to blasting and transporting the material from the pit.
As mentioned in the beginning of the chapter there are two main parts of the economic calculations. So far only production cost has been covered. The income from selling product can be easily estimated. Using market price and historical data the income from the products can be calculated and entered into the software by the user.
14
Knowing the cost of production in all units, the downtime cost of the crushing plant, the initial material cost, and the sales price of all products, it is possible to do an economic calculation for the total production gross profit. The gross profit will not include sales and distribution costs. Subtracting the production cost from the income of every product will yield the gross profit for every product. Adding the gross profit from every product together will then yield the total gross profit for the total plant.
3.5. CUSTOMER DEMANDS The products produced in the crushing plant are usually sold or further processed in other types of plants. In any case, there will be quality specifications applicable to the products. One of the most common demands is a restriction in the amount of oversized and undersized material in the product. The amount of oversized and undersized material is measured as the mass percentage of rock material larger than the upper size limit and smaller than the lower size limit. The limitation of oversized and undersized material is often in conflict with the wish to have a large capacity of the crushing plant and wide wear tolerances. The screens must be properly loaded, to produce low amount of oversized and undersized material. This implies demands for the crusher feeding the screen. Loading a screen with too much material will decrease the screening efficiency which will generate products that will not comply with the customer requirements. There are also other customer demands that will affect the product. Strength and shape are also demands made on the products. This is not included in the software since there are no models currently available that can predict how these product parameters are affected in different production units.
15
4. OPTIMISATION The objective of optimisation is to maximize the gross profit of the plant while always satisfying the customer demands. An optimisation routine is needed to find the optimal solution. There are a number of different optimisation routines developed today to solve these types of discrete optimisation problems. Routines such as tabu search, simulated annealing, different types of genetic evolutionary algorithms, probabilistic global search and many more are frequently used. Genetic evolutionary algorithm with local search (GLS) has mostly been used in this work. GLS was selected after an evaluation of a number of different optimisation routines. The evaluation was not only to determine the ability to find the global optimum. CPU time, flexibility in handling different numbers of parameters and user friendliness for implementation were also important factors taken into account. To evaluate GLS probabilistic global search Lausanne (PGSL) has been tested. A more detailed description of the routines is found in section 4.6 and 4.7.
For implementation the optimisation routine must be fully automated meaning that it can not depend on the user being an expert on optimisation or expect the user to provide the optimisation routine with an initial guess. The selected optimisation routine must be independent from any tuning parameters to converge, both GLS and PGSL have this feature. Both optimisation routines are also totally independent from initial guesses. If the user supplies the routine with an initial guess, the plant’s current parameter setting would probably be entered. If the plant has been operating for some time, the current setting of the plant will probably be a local optimum. In that case the optimisation routine will have difficulty in finding the global optimum. The developed optimisation routine requires the user to select the parameters that should be optimised and the optimisation routine adapts to the situation. After a pre-processing routine, the optimisation routine finds the best solution within the existing constraints.
4.1. PRE-PROCESSING Before the optimisation can start the pre-processing routine retrieves data from the model and also prepares a wear test. All parameters selected by the user for optimisation are collected together with their limits. The pre-processing routine also finds the wear tolerances connected with the parameters. If there are wear tolerances selected for optimisation, a wear test is automatically constructed. This test is used to find if the values from the optimisation routine will generate products that will comply with the customer demands regardless of the status of the wear parts. For every customer demand there will be a combination of new and worn out wear parts that will have the highest risk of failing to comply with the stated demand. This combination must be found for every customer demand and saved to be used in the optimisation routine.
4.2. CONSTRAINTS As in many other types of process optimisation cases there are a number of different constraints. There are two main types of constraints in optimisation problems that need to be handled. The first type is the easiest; incompatibility between some parameter combinations. One example is screen aperture on a multi deck screen. A screen deck must have a smaller aperture relative to the deck above. This can be easily tested before the simulation is done. The other type of constrain needs a simulation to be checked. In a crushing plant, there are a number of different constraints of this type. The most obvious one is the customer demand type. Other examples are maximum particle size into a crusher and combination of parameters
16
not generating any valid simulation result due to factors such as insufficient crushing in a closed loop. The first simulation is always run with the wear status of all parts set to half the tolerance, all constraints are tested for this simulation. If the simulation passes all tests, the wear test is used to further test the wear tolerances. The combination of upper and lower limits of the optimisation parameters, the compatibility constraints, and the satisfied customer demands under all conditions all form the admissible set of parameters denoted Ωx. If all demands are met, the solution can be accepted and the cost function can be calculated.
4.3. COST FUNCTION One of the most important parts of the optimisation is the cost function. The formulation of the cost function is crucial to get the best results from the optimisation routine. Since the optimisation routine simply tries to maximise or minimise the result of the cost function the result will always depend on the cost function reflecting the wishes of the user of the optimisation routine. In the case of crushing plant optimisation, gross profit was selected as the cost function since the purpose of the plant will always be to generate profit for the owner of the plant. Other cost functions such as maximisation of a certain product used in Crushex by Algosys, is really not an option in most crushing plants. This will not be optimal for the plant since other products will be sacrificed to produce the selected product. These other products will have a value and can be sold to a customer. The production cost is not included in the optimisation. The proposed optimisation result might also have a very high production cost. The situation in a crushing plant is never so easy that one can focus on making one single product at the time.
The production cost of every product is needed to calculate the gross profit of the plant. This is calculated using the previously described process account method. As the rock material passes production units on the way through the crushing plant, the production costs of each unit is added. When parts of the rock material flow are stored in a storage bin or stock pile, the production cost of every unit it has passed are added up to yields the total production cost for that product. If the plant has closed loops it is possible that the production cost of a production unit needs to be added more than once. This is described by the utilisation factor µ(x). The value of the utilisation factor is automatically calculated during the simulation and the user never sees this factor. In the normal case when the rock material only passes a production unit once the value of the utilisation factor is one. The following formula is used to calculate the cost Ch,tot(x) of product h in the plant which consists of n production units:
( ) ( ) ( ), , ,1
n
h tot h i tot ii
C Cµ=
= ⋅∑x x x (7)
( ),0 h iµ≤ < ∞x (8)
This is done using the average wear setting of all wear parts. This will give the average cost of production for product h. Knowing the sales value Vh of product h and the average mass flow ( ),rock hm x produced will give the gross profit during operation using:
( ) ( )( ) ( ), ,h h h tot init rock hP V C C m= − − ⋅x x x (9)
The total gross profit per hour during operation ( ),tot productionP x from the production of q number of products can be calculated using the following equation:
( ) ( ),1
q
tot production hh
P P=
=∑x x (10)
17
Using equations (7), (9), and (10) the total profit per hour during operation of the production in a crushing plant can be written as:
( ) ( ) ( )( ) ( ), , , ,1 1
q n
tot production h h i tot i init rock hh i
P V C C mµ= =
= − ⋅ − ⋅
∑ ∑x x x x (11)
Since parts are worn out during operation, the crushing plant must be stopped to replace these parts. This will give the plant a percentage of time when it will not produce any products. In the software, it is assumed that the whole plant needs to be stopped to make a replacement of a wear part. Knowing the wear rate, wear tolerance and the average mass flow ( ),r im x passing wear part r on unit i gives the time in operation Toperation,r,i for wear part r:
( )( ) ( )
,, ,
, ,
r ioperation r i
r i r i
Tm
ε=
∆ ⋅x
x x (12)
This can be used together with the time (Treplacement,r,i) it takes to replace wear part r on unit i to calculate the availability αr,i:
( )( ) ( )
( )( ) ( )
,
, ,operation,r,i,
operation,r,i , , ,, ,
, ,
TT +
r i
r i r ir i
replacement r i r ireplacement r i
r i r i
mT
Tm
ε
αε
∆ ⋅ = =
+ ∆ ⋅
xx x
xx x
(13)
The total availability for the plant is then calculated:
,1 1
iwn
tot r ii r
α α= =
= ∏∏ (14)
Equations (10), (14) and (6) give the average profit per hour which is used as the cost function for the optimisation.
( ) ( ), 1tot tot tot production tot downtimeP P Cα α= ⋅ − − ⋅x (15)
4.4. PROCESS SIMULATION The simulation routine is one of the main components of the software developed. It can be used both in combination with the optimisation and stand alone. Steady state conditions are assumed to simulate the process in a crushing plant. Steady state in this case means that there are no changes of the process conditions during the simulation. Since the purpose of the simulation is to find the result of a long term setting of the crushing plant, steady state is a good way of calculating the average result during this time. Simulating the dynamic properties of the plant will yield information about start up and process changes which are not useful in this work. Not taking process changes and start up into consideration will not generate any large errors since it is assumed that they constitute such a small part of the total production time of the plant. Steady state simulation is also less time consuming, which is favourable when the simulation is used by the optimisation routine. In some optimisation cases maximal capacity of the plant is included. In these cases, the simulation routine finds the maximum capacity of the plant and runs the simulation at the maximised capacity. In other cases, where there is a limit in feed to the crushing plant the simulation routine uses the permissible amount of feed if the bottleneck not is overloaded. If the bottleneck is overloaded the simulation routine calculates the maximal capacity instead.
18
4.5. PROBLEM STATEMENT OF CRUSHING PLANT OPTIMISATION The statement of the optimisation problem is to maximise the gross profit of the crushing plant subject to all constraints imposed on the variable parameters x. This statement can be written in the following way:
( )max totP∈Ωxx
x (16)
The obtained solution *x of the problem (16) represents the most profitable setting of the crushing plant. This setting will give the global optimum ( )*totP x generating the highest gross profit per hour.
4.6. GENETIC EVOLUTIONARY ALGORITHM WITH LOCAL SEARCH, GLS Genetic evolutionary algorithm with local search is an improved version of the very widely used genetic evolutionary algorithm. Genetic evolutionary algorithms have successfully been used in many types of industries for optimisation purposes (Abido, 2000, Rajesh et al, 2001, Yuen et al, 2000 ). During workbench testing of the genetic evolutionary algorithm it has been found that it usually finds near-global optimum solutions (Jaszkiewicz, 2001). Finding the global optimum is very difficult for the genetic algorithm since it only works in the global search space. Fine tuning the solution is not done i.e. analysing solutions in the local search space. A local search routine has been added to improve the genetic evolutionary algorithm. This has proven to be a very powerful improvement of the genetic evolutionary algorithm (Murata and Ishibuchi, 1998). It also shortens the total CPU time for the optimisation by up to 95% while increasing the probability of finding the global optimum (Jaszkiewicz, 2001). A normal genetic evolutionary algorithm also uses mutation to change the individuals in the population as a try to improve them. Setting the mutation factor effectively can be tricky. Genetic evolutionary algorithms usually needs some tuning to successfully solve an optimisation problem. This is a problem if the routine is implemented in a software package. The genetic evolutionary algorithm with local search also has an anti clustering function which prohibits early conversion to a local optimum. More about how the genetic evolutionary algorithm works in detail can be found in Paper A.
4.7. PROBABILISTIC GLOBAL SEARCH LAUSANNE, PGSL A second optimisation method has been implemented to test the quality of the genetic evolutionary algorithm with local search. According to Raphael and Smith (2003) PGSL has a short CPU time and equal or better probability of finding the global optimum than genetic algorithms. It is also well suited for direct implementation in optimisation software, being very flexible when it comes to the number of parameters and no need for initial guess. PGSL is based on probability distributions of the different discrete values that a parameter can take. This probability distribution is used for guessing new combinations of parameter values. An interval around parameter values that generate high results from the cost function generates an increased probability of selection. New values are generated many times and the probability distribution is constantly updated. During the process the interval around the best value is narrowed and the probability of selecting values in the interval is increased. More information about PGSL can be found in Paper C.
19
4.8. METHOD COMPARISON OF THE OPTIMISATION ROUTINES A comparative study with the PGSL routine has been made to evaluate the performance of the GLS. The two main areas for comparison are ability to find the global optimum and the CPU time. It is also interesting to compare the quality of the guesses the two routines make. A high frequency of guesses outside the constraints will waste a lot of CPU time that could be used for finding approved solutions within the constraints. The result from this study showed that both routines have similar CPU time. The CPU time will vary from optimisation to optimisation since they both are based on random selection. In some cases the routines will select larger number of solutions outside the constraints yielding in longer CPU time for the optimisation. When comparing accuracy of finding the global optimum, the results point toward a small advantage for the GLS routine. PGSL can yield a solution that is not the global optimum in some cases. This happens at low frequency though. In some cases PGSL has an advantage over GLS. If the solutions space is large and but the constraints restrict the number of possible solutions severely the PGSL routine is advantageous. The number of successful guesses is much higher, which reduces the CPU time and improves the probability of finding the global optimum. The situation with severe constraints usually occurs in aggregate production situations with many products. Since the PGSL has recently been implemented, it has not been improved as much as the GLS which has been used in the project for over two years. This fact is an issue to take into account, since the performance of the GLS has been improved a lot during the project. The CPU time for the GLS routine has been cut to approximately one third during the project without sacrificing any accuracy. The conclusion from the comparison will therefore be that the GLS routine works well and produces results of high quality. It is also clear that there is a great potential for the PGSL routine if it is given time for further testing.
20
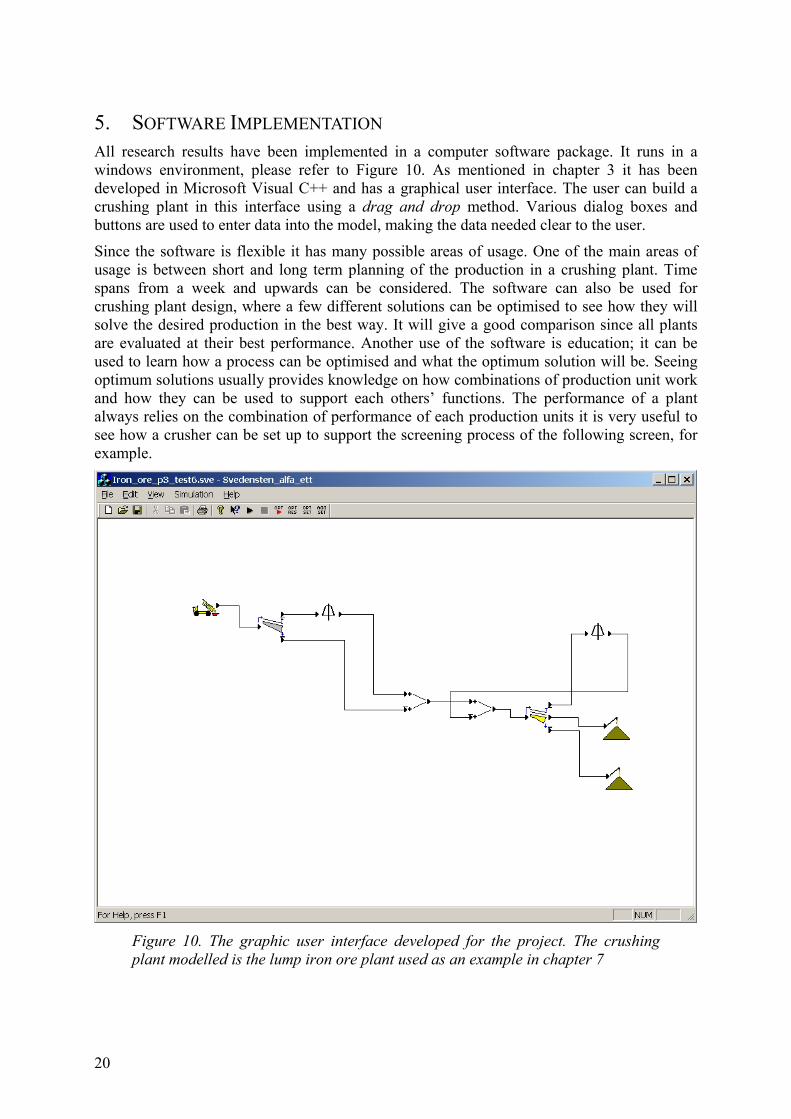
5. SOFTWARE IMPLEMENTATION All research results have been implemented in a computer software package. It runs in a windows environment, please refer to Figure 10. As mentioned in chapter 3 it has been developed in Microsoft Visual C++ and has a graphical user interface. The user can build a crushing plant in this interface using a drag and drop method. Various dialog boxes and buttons are used to enter data into the model, making the data needed clear to the user.
Since the software is flexible it has many possible areas of usage. One of the main areas of usage is between short and long term planning of the production in a crushing plant. Time spans from a week and upwards can be considered. The software can also be used for crushing plant design, where a few different solutions can be optimised to see how they will solve the desired production in the best way. It will give a good comparison since all plants are evaluated at their best performance. Another use of the software is education; it can be used to learn how a process can be optimised and what the optimum solution will be. Seeing optimum solutions usually provides knowledge on how combinations of production unit work and how they can be used to support each others’ functions. The performance of a plant always relies on the combination of performance of each production units it is very useful to see how a crusher can be set up to support the screening process of the following screen, for example.
Figure 10. The graphic user interface developed for the project. The crushing plant modelled is the lump iron ore plant used as an example in chapter 7
21
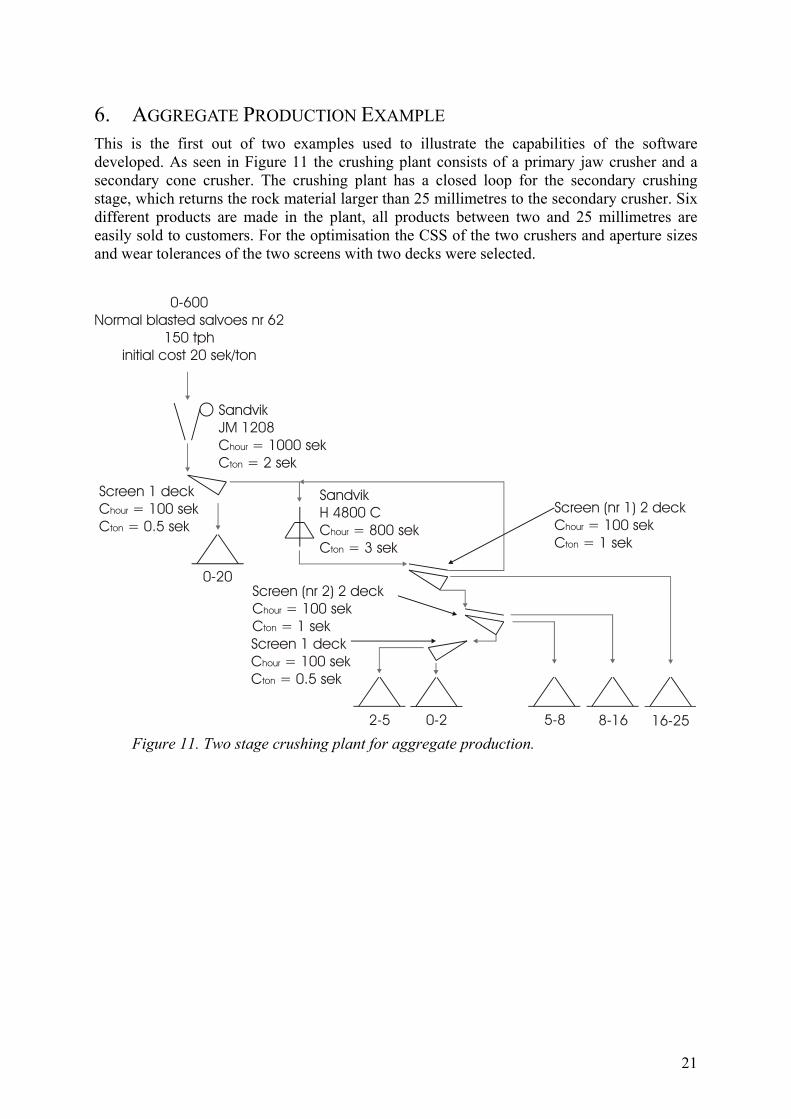
6. AGGREGATE PRODUCTION EXAMPLE This is the first out of two examples used to illustrate the capabilities of the software developed. As seen in Figure 11 the crushing plant consists of a primary jaw crusher and a secondary cone crusher. The crushing plant has a closed loop for the secondary crushing stage, which returns the rock material larger than 25 millimetres to the secondary crusher. Six different products are made in the plant, all products between two and 25 millimetres are easily sold to customers. For the optimisation the CSS of the two crushers and aperture sizes and wear tolerances of the two screens with two decks were selected.
0-20
0-600Normal blasted salvoes nr 62
150 tphinitial cost 20 sek/ton
8-165-82-5 16-25
SandvikH 4800 CC = 800 sekC = 3 sek
hour
ton
SandvikJM 1208C = 1000 sekC = 2 sek
hour
ton
0-2
Screen 1 deckC = 100 sekC = 0.5 sek
hour
ton
Screen (nr 2) 2 deckC = 100 sekC = 1 sek
hour
ton
Screen (nr 1) 2 deckC = 100 sekC = 1 sek
hour
ton
Screen 1 deckC = 100 sekC = 0.5 sek
hour
ton
Figure 11. Two stage crushing plant for aggregate production.

22
6.1. OPERATING CONDITIONS All production units of the crushing plant are assigned a fixed and a variable cost, according to the model described earlier, see Figure 11. All produced products have a sales price and customer demands which are shown in Table 1. In a normal crushing plant for aggregates production there will be some products that are not attractive to the market and will therefor have a low price and a limited market demand. What also should be noted about the customer demands are the amount of oversize and undersize allowed in each product. The allowed amounts are as seen larger then what is normal for aggregates production. The condition for the customer demand is as stated that they must always be fulfilled regardless of the state of the wear parts. In this case where there are a large number of products it is difficult to always fulfil the customer demand for all products at all times. Especially if the allowed amount of oversize and undersize are set low. Initially the customer demands where set to normal values for all products. The optimisation routine then failed to find any solution to the optimisation problem that fulfilled all constraints. This indicates that it is difficult to always fulfil the customer demands regardless of the status of the wear parts. The assumption is made that the capacity of the crushing plant is restricted by the feed to the plant.
Table 1. Products, prices and customer demands for the different products produced in the crushing plant in Figure 11.
Product Price Estimated amount of products to be sold.
Costumer demands (oversize / undersize)
0-20 20 sek 2000 tonnes per month 20% / -
16-25 65 sek unlimited 20% / 25%
8-16 50 sek unlimited 25% / 25%
5-8 60 sek unlimited 25% / 25%
2-5 65 sek unlimited 20% / 20%
0-2 10 sek 500 tonnes per month 30% / -
23
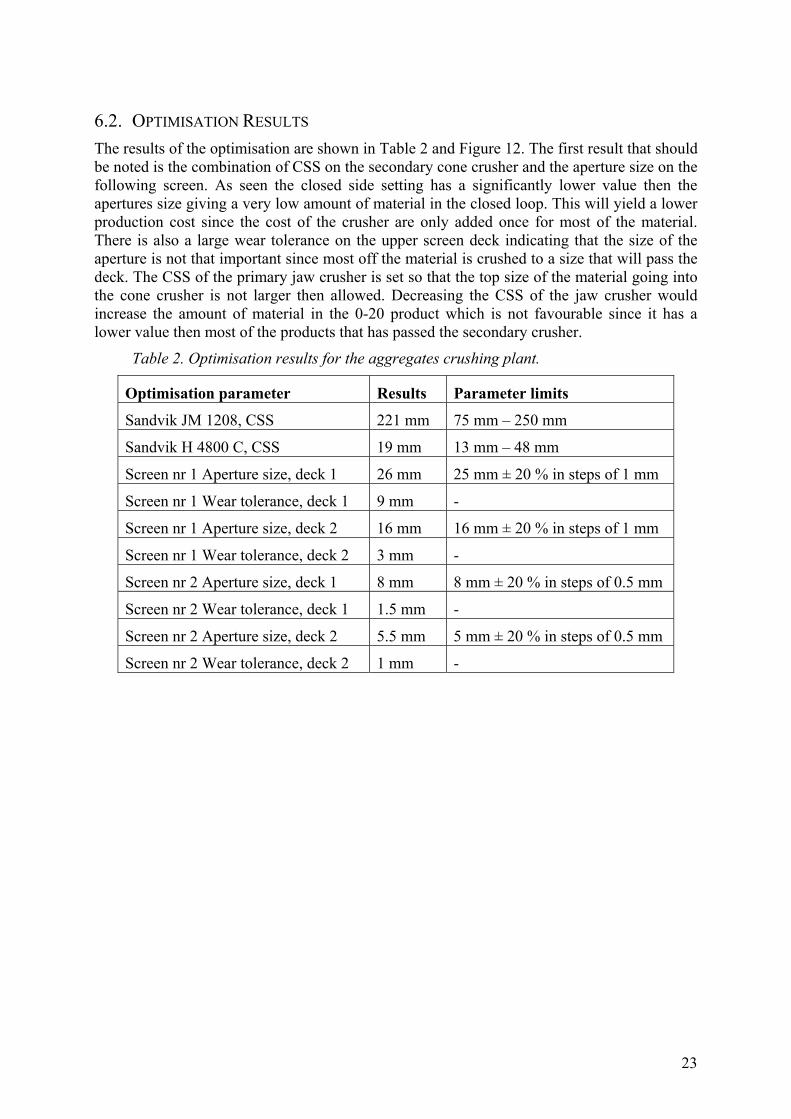
6.2. OPTIMISATION RESULTS The results of the optimisation are shown in Table 2 and Figure 12. The first result that should be noted is the combination of CSS on the secondary cone crusher and the aperture size on the following screen. As seen the closed side setting has a significantly lower value then the apertures size giving a very low amount of material in the closed loop. This will yield a lower production cost since the cost of the crusher are only added once for most of the material. There is also a large wear tolerance on the upper screen deck indicating that the size of the aperture is not that important since most off the material is crushed to a size that will pass the deck. The CSS of the primary jaw crusher is set so that the top size of the material going into the cone crusher is not larger then allowed. Decreasing the CSS of the jaw crusher would increase the amount of material in the 0-20 product which is not favourable since it has a lower value then most of the products that has passed the secondary crusher.
Table 2. Optimisation results for the aggregates crushing plant.
Optimisation parameter Results Parameter limits
Sandvik JM 1208, CSS 221 mm 75 mm – 250 mm
Sandvik H 4800 C, CSS 19 mm 13 mm – 48 mm
Screen nr 1 Aperture size, deck 1 26 mm 25 mm ± 20 % in steps of 1 mm
Screen nr 1 Wear tolerance, deck 1 9 mm -
Screen nr 1 Aperture size, deck 2 16 mm 16 mm ± 20 % in steps of 1 mm
Screen nr 1 Wear tolerance, deck 2 3 mm -
Screen nr 2 Aperture size, deck 1 8 mm 8 mm ± 20 % in steps of 0.5 mm
Screen nr 2 Wear tolerance, deck 1 1.5 mm -
Screen nr 2 Aperture size, deck 2 5.5 mm 5 mm ± 20 % in steps of 0.5 mm
Screen nr 2 Wear tolerance, deck 2 1 mm -
24
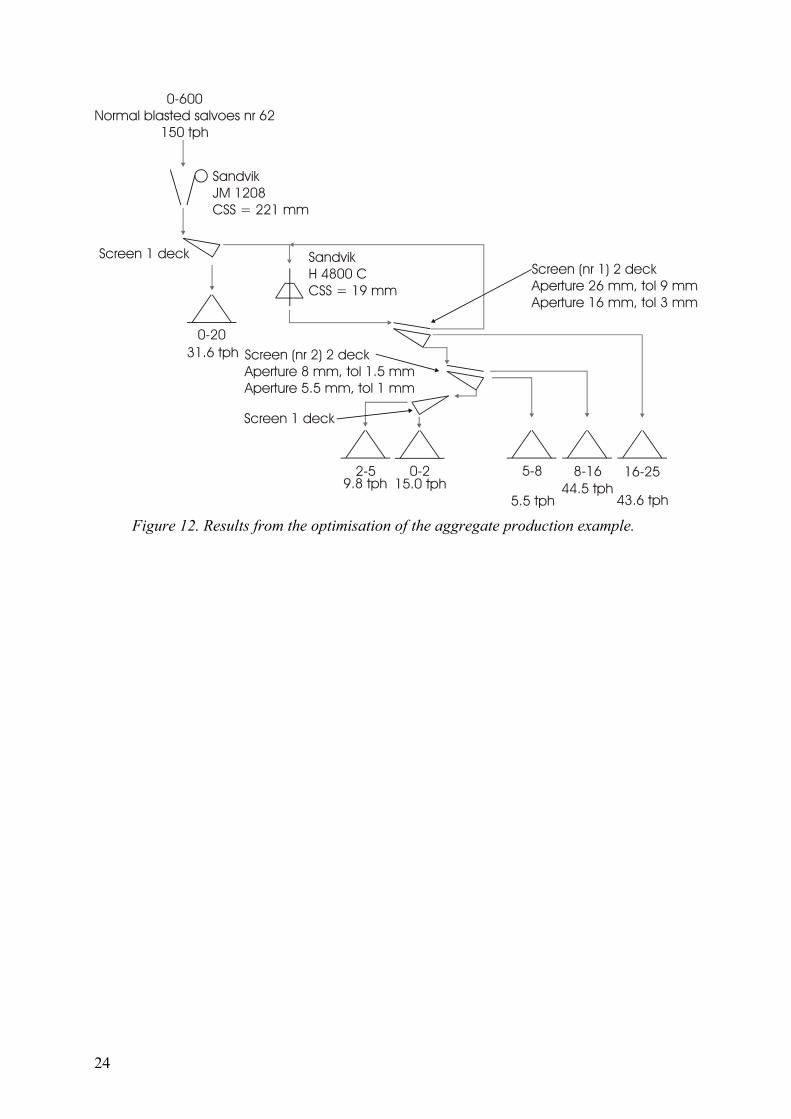
0-20
0-600Normal blasted salvoes nr 62
150 tph
8-165-82-5 16-25
SandvikH 4800 CCSS = 19 mm
SandvikJM 1208CSS = 221 mm
0-2
Screen 1 deck
Screen (nr 2) 2 deckAperture 8 mm, tol 1.5 mmAperture 5.5 mm, tol 1 mm
Screen (nr 1) 2 deckAperture 26 mm, tol 9 mmAperture 16 mm, tol 3 mm
Screen 1 deck
31.6 tph
44.5 tph43.6 tph5.5 tph
9.8 tph 15.0 tph
Figure 12. Results from the optimisation of the aggregate production example.
25
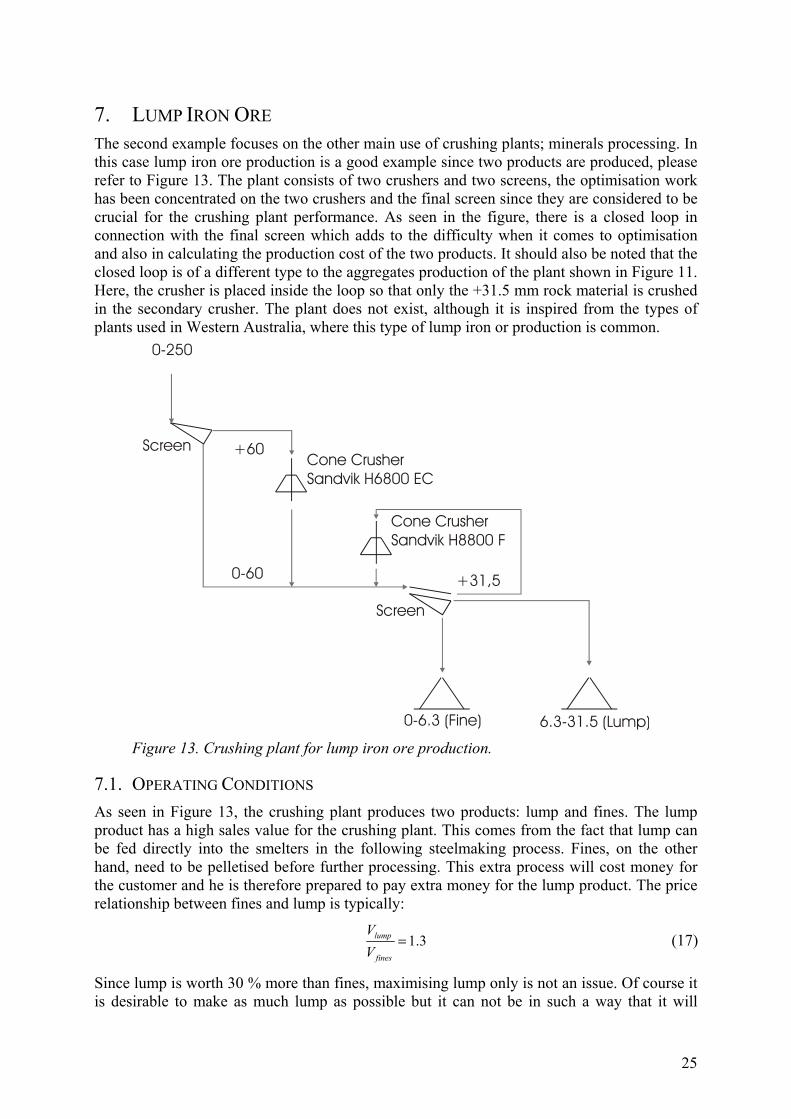
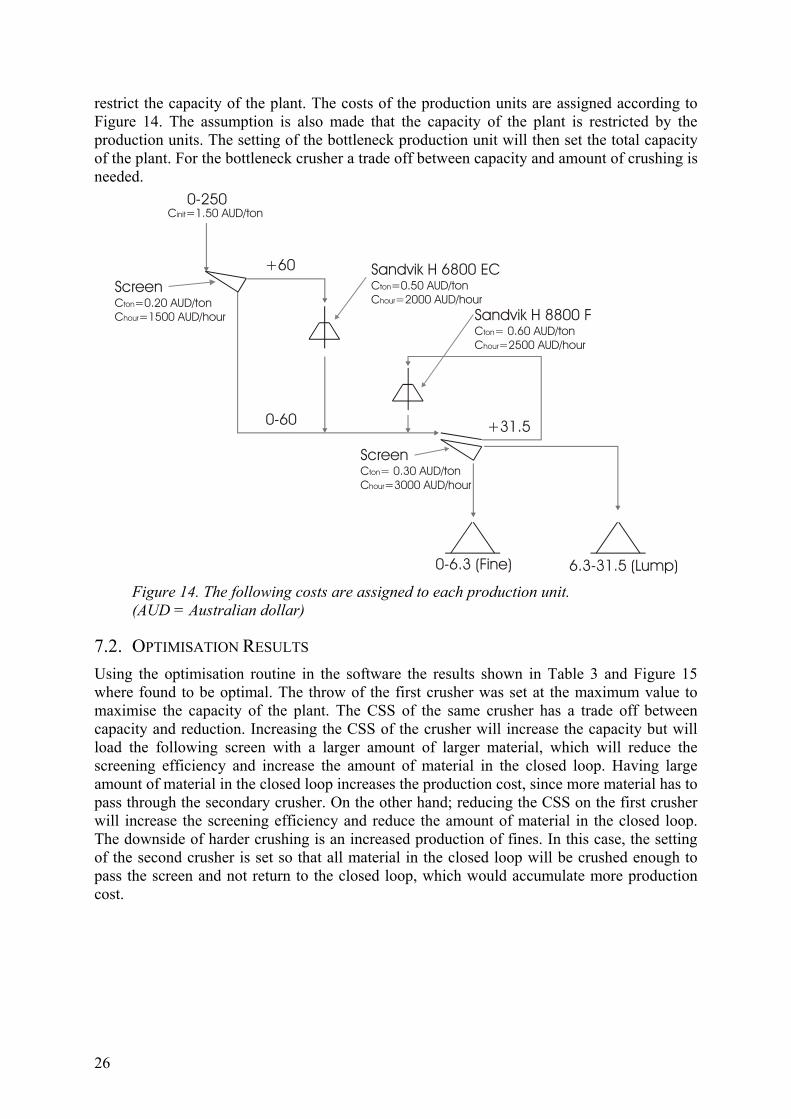
7. LUMP IRON ORE The second example focuses on the other main use of crushing plants; minerals processing. In this case lump iron ore production is a good example since two products are produced, please refer to Figure 13. The plant consists of two crushers and two screens, the optimisation work has been concentrated on the two crushers and the final screen since they are considered to be crucial for the crushing plant performance. As seen in the figure, there is a closed loop in connection with the final screen which adds to the difficulty when it comes to optimisation and also in calculating the production cost of the two products. It should also be noted that the closed loop is of a different type to the aggregates production of the plant shown in Figure 11. Here, the crusher is placed inside the loop so that only the +31.5 mm rock material is crushed in the secondary crusher. The plant does not exist, although it is inspired from the types of plants used in Western Australia, where this type of lump iron or production is common.
Cone CrusherSandvik H6800 EC
6.3-31.5 (Lump)0-6.3 (Fine)
+60
+31,50-60
0-250
Screen
Cone CrusherSandvik H8800 F
Screen
Figure 13. Crushing plant for lump iron ore production.
7.1. OPERATING CONDITIONS As seen in Figure 13, the crushing plant produces two products: lump and fines. The lump product has a high sales value for the crushing plant. This comes from the fact that lump can be fed directly into the smelters in the following steelmaking process. Fines, on the other hand, need to be pelletised before further processing. This extra process will cost money for the customer and he is therefore prepared to pay extra money for the lump product. The price relationship between fines and lump is typically:
1.3lump
fines
VV
= (17)
Since lump is worth 30 % more than fines, maximising lump only is not an issue. Of course it is desirable to make as much lump as possible but it can not be in such a way that it will
26
restrict the capacity of the plant. The costs of the production units are assigned according to Figure 14. The assumption is also made that the capacity of the plant is restricted by the production units. The setting of the bottleneck production unit will then set the total capacity of the plant. For the bottleneck crusher a trade off between capacity and amount of crushing is needed.
Sandvik H 6800 ECC =0.50 AUD/tonC =2000 AUD/hour
ton
hour
6.3-31.5 (Lump)0-6.3 (Fine)
+60
+31.50-60
0-250
ScreenC =0.20 AUD/tonC =1500 AUD/hour
ton
hour
C =1.50 AUD/toninit
Sandvik H 8800 FC = 0.60 AUD/tonC =2500 AUD/hour
ton
hour
ScreenC = 0.30 AUD/tonC =3000 AUD/hour
ton
hour
Figure 14. The following costs are assigned to each production unit. (AUD = Australian dollar)
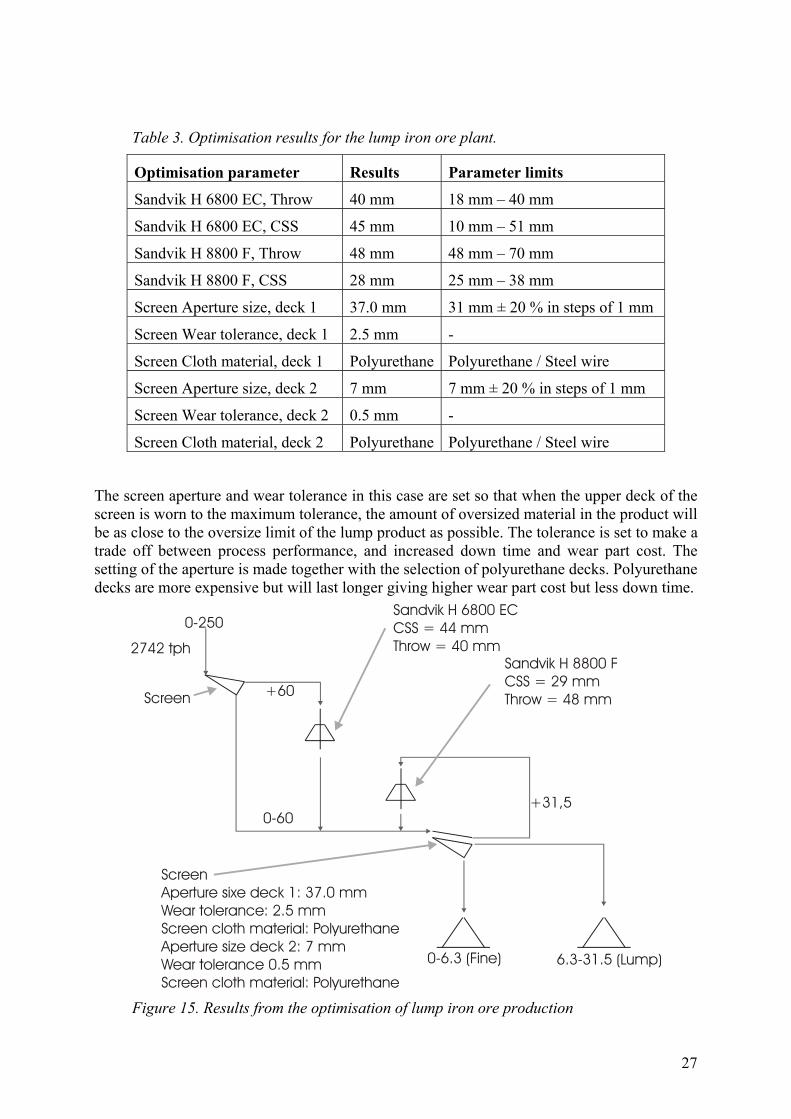
7.2. OPTIMISATION RESULTS Using the optimisation routine in the software the results shown in Table 3 and Figure 15 where found to be optimal. The throw of the first crusher was set at the maximum value to maximise the capacity of the plant. The CSS of the same crusher has a trade off between capacity and reduction. Increasing the CSS of the crusher will increase the capacity but will load the following screen with a larger amount of larger material, which will reduce the screening efficiency and increase the amount of material in the closed loop. Having large amount of material in the closed loop increases the production cost, since more material has to pass through the secondary crusher. On the other hand; reducing the CSS on the first crusher will increase the screening efficiency and reduce the amount of material in the closed loop. The downside of harder crushing is an increased production of fines. In this case, the setting of the second crusher is set so that all material in the closed loop will be crushed enough to pass the screen and not return to the closed loop, which would accumulate more production cost.
27
Table 3. Optimisation results for the lump iron ore plant.
Optimisation parameter Results Parameter limits
Sandvik H 6800 EC, Throw 40 mm 18 mm – 40 mm
Sandvik H 6800 EC, CSS 45 mm 10 mm – 51 mm
Sandvik H 8800 F, Throw 48 mm 48 mm – 70 mm
Sandvik H 8800 F, CSS 28 mm 25 mm – 38 mm
Screen Aperture size, deck 1 37.0 mm 31 mm ± 20 % in steps of 1 mm
Screen Wear tolerance, deck 1 2.5 mm -
Screen Cloth material, deck 1 Polyurethane Polyurethane / Steel wire
Screen Aperture size, deck 2 7 mm 7 mm ± 20 % in steps of 1 mm
Screen Wear tolerance, deck 2 0.5 mm -
Screen Cloth material, deck 2 Polyurethane Polyurethane / Steel wire
The screen aperture and wear tolerance in this case are set so that when the upper deck of the screen is worn to the maximum tolerance, the amount of oversized material in the product will be as close to the oversize limit of the lump product as possible. The tolerance is set to make a trade off between process performance, and increased down time and wear part cost. The setting of the aperture is made together with the selection of polyurethane decks. Polyurethane decks are more expensive but will last longer giving higher wear part cost but less down time.
Sandvik H 6800 ECCSS = 44 mm Throw = 40 mm
6.3-31.5 (Lump)0-6.3 (Fine)
+60
+31,50-60
0-250
Screen
Sandvik H 8800 FCSS = 29 mm Throw = 48 mm
ScreenAperture sixe deck 1: 37.0 mmWear tolerance: 2.5 mmScreen cloth material: PolyurethaneAperture size deck 2: 7 mmWear tolerance 0.5 mmScreen cloth material: Polyurethane
2742 tph
Figure 15. Results from the optimisation of lump iron ore production
28
8. CONCLUSIONS AND FUTURE WORK During the project, a simulation and optimisation software package has been successfully developed. The software includes every aspect described in this thesis. This includes a novel method for optimisation of parameters, wear tolerances and wear parts. The model of the crushing plant also includes models for economics and customer quality demands which have never been used before in these types of applications. This makes it possible to do simultaneous simulation of technical and economic aspects of the crushing plant. The connection between the technical and the economic aspect enables useful optimisations to be done. This has been recognised by many people as very powerful in many crushing plants.
The software developed has a graphic user friendly interface similar to the interface used by most crushing plant simulation software. The user of the software does not need a deeper understanding of the optimisation routine and never needs to do any adjustments to the software. However, it must be clear that the user of the software must understand how the optimisation software works and what can be expected from it.
In the two examples the abilities of the developed methods are shown. The importance of combination between the setting of the crusher and screens for best performance of the plant are exemplified. It is also shown that including the production costs for all production units influences the setting of the plant. The most obvious sign of this is the amount of material in the closed loop. In the aggregates production example the amount of material in the closed loop is low and in the lump iron ore the CSS of the crusher in the closed loop is set so that all material in the loop will pass the screen to end up in the stock piles instead of returning a second time to the loop. The aggregates production example shows the difficulties of keeping the quality of the product regardless of the wear tolerances. The failure of finding a solution to the optimisation problem using normal quality demands on all products implies that one has to accept periods of time where one or more products do not meet the quality demands. In the lump iron ore production example the setting of the crushers will also affect the capacity of the plant. The trade-off between capacity reduction and crushing is made to make the crushing plant performance as efficiently as possible.
There are areas for improvement of the developed software. Two case studies have recently been started. The aim of the case studies is to validate the results in real plants. Working with optimisation requires high accuracy models. Since the crushing plant model is built using a number of different models for crushers and screens there is a risk that accumulative errors could occur. An early small error in the crushing plant model might progress through the model and result in a large deviation at the end. To correct these errors measurements in the plant need to be done to calibrate the model. The measurement can be belt cuts and reading from weightometers. The models error can be identified and corrected using the measurement. Exactly how this should be done is unknown today. Receiving a number of measurements that indicate a model deviation must be processed in some way. The difficulty is locating the error in the crushing plant model. The error can originate from anywhere between the feed to the plant to all production unit models before the point where the measurement is taken.

29
Other areas of research that still not have been explored are various types of crushing plant design issues. This ranges from total plant layout to upgrades of crushing stages or parts of a existing plant. Designing plants from scratch using computer optimisation is a highly complex problem. Especially concerning the process optimisation theory saying that all three areas must be optimised simultaneously for the optimal process. Including all degrees of freedom in an optimisation will yield solution spaces that are exceedingly large. When crushing plants are designed more areas outside the pure technical aspects must be included. Risk management is an important aspect of crushing plant design.
Finally it must be mentioned that there is a lot of more work to be done in the area of this project. In the current case studies, future issues can be expected to surface, which are not currently visible.
30
REFERENCES Abido M. A., Parameter optimization of multimachine power system stabilizers using genetic local search. Electrical power and energy systems, 2001, 23, 785-794.
Dearden J., Management accounting, Prentice hall international, 1988
Dynasim AB, Dymola (software), Lund, Sweden.
Evertsson, C. M., Cone crusher performance, Ph.D. thesis, Chalmers University of Technology, Sweden 2000.
Jaszkiewicz A., Genetic local search for multi-objective combinatorial optimization. European journal of operational research, 2002, 137, 50-71.
Gazmuri P. and Ignacio A., Modelling and Visualization for a production planning decision support system, International Transactions in Operational Research, 2, 1995, 249-258
Mathworks Inc., MatLab (software), Natick, Massachusetts, USA.
Mathworks Inc., Simulink, plugin to MatLab, Natick, Massachusetts, USA.
Microsoft Corp., Visual Basic and Visual C++ (software), Redmond, Washington, USA
Montgomery D. C., Introduction to statistical quality control, Wiley, 1996
Murata T. and Ishibuchi, H., Multi-objective genetic local search algorithm and its application to flow shop scheduling. IEEE transaction on systems, man, and cybernetics – Part C: Applications and reviews, 1998, 28(3), 392-403.
Omar M. and Smith D. K., An optimal batch size for a production system under linearly increasing time-varying demand process, Computers and Industrial Engineering, 42, 2002, 35-42
Pongcharoen P., Hicks C. and Braiden P. M., The development of genetic algorithms for the finite capacity scheduling of complex products, with multiple levels of product structure, European Journal of Operational Research, 152, 2004, 215-225
Rajesh J. K., Gupta, S. K., Rangaiah, G. P., Ray, A. K., Multi-objective optimization of hydrogen plants, Chemical engineering science, 2001, 56, 999-1010.
Raphael B. and Smith I. F. C., A direct stochastic algorithm for global search. Applied Mathematics and Computation, 2003, 146 , 729-758
Toebermann J.-C., Rosenkranz J. H., Werther J. and Gruhn G., Block-oriented process simulation of solids processes. Computers and chemical engineering, 23, 2000, 1773-1782.
Tomlab optimization AB, TomLab (plugin to MatLab) Västerås, Sweden.
Yuen C.C., Aatmeeyata, Gupta, S. K., Ray, A. K. Multi-objective optimization of membrane separation modules using genetic algorithm. Journal of membrane science, 2000, 176, 177-196.