Embed Size (px)
Citation preview
Master‘s Thesis
Examining the Potential of Fish Farming to
Improve the Livelihoods of Farmers in the
Lake Victoria Region, Kenya
Assessing Impacts of Governmental Support
Athugun á möguleikum fiskeldis til að bæta
lífskjör kenískra bænda við Viktoríuvatn -
mat á áhrifum opinbers stuðnings
Nora Jacobi
Advisor: Benedict J. Colombi, PhD
University of Akureyri
Faculty of Business and Science
University Centre of the Westfjords
Master of Resource Management: Coastal and Marine Management
Ísafjörður, May 2013
Supervisory Committee
Advisor:
Benedict J. Colombi, Assistant Professor at the School of Natural Resources and the
Environment, The University of Arizona
Reader:
Rodrigo Menafra, MMM
Program Director:
Dagný Arnarsdóttir, MSc
Nora Jacobi
Examining the Potential of Fish Farming to Improve the Livelihoods of Farmers in
the Lake Victoria Region, Kenya – Assessing the Impacts of Governmental Support
Athugun á möguleikum fiskeldis til að bæta lífskjör kenískra bænda við Viktoríuvatn
-mat á áhrifum opinbers stuðnings
45 ECTS thesis submitted in partial fulfilment of a Master of Resource
Management degree in Coastal and Marine Management at the University Centre of
the Westfjords, Suðurgata 12, 400 Ísafjörður, Iceland
Degree accredited by the University of Akureyri, Faculty of Business and Science,
Borgir, 600 Akureyri, Iceland
Copyright © 2013Nora Jacobi
All rights reserved
Printing: Háskólaprent, May2013
Declaration
I hereby confirm that I am the sole author of this thesis and it is a product of my
own academic research.
__________________________________________
Nora Jacobi

Abstract
In Kenya, East Africa, fish-demand is constantly growing. Fish supply, however, lags
behind owing to declining natural fish stocks. Aquaculture production in Kenya is still
insignificant on a global scale, not following the sector‟s worldwide rapid growth.
However, Kenya shows great potential for aquaculture activities that are not yet fully
explored. In 2009 development and commercialization of Nile tilapia (Oreochromis
niloticus) and African catfish (Clarias gariepinus) aquaculture became part of the
government‟s Economic Stimulus Programme (ESP), aiming to stimulate economic growth
by creating business opportunities and jobs, as well as to alleviate food insecurity and
poverty, two major problems in Kenya. Aquaculture production increased significantly.
This study uses a structured questionnaire to elucidate the impacts of governmental support
on the livelihoods of small-scale aquaculture farmers in the Nyanza and Western
provinces, Kenya. Foci are (1) farm characteristics, (2) support mechanisms used, (3) fish
farm wealth, (4) livelihood changes and (5) future perspectives of aquaculture. Livelihoods
of ESP supported farmers improved in terms of protein consumption through incomes from
aquaculture but pond productivities are low. ESP subsidies helped fish farmers in the short-
term, i.e. through income generation and increased protein accessibility, but it failed to
teach farmers how to achieve self-sustainable aquaculture without the help of subsidies.
One way of achieving higher pond productivities is the promotion of sustainable and
integrated aquaculture-agriculture farming practices. The risk is high that if pond
productivities are not increased, aquaculture practices may be discontinued in the future
with negative impacts on the farmers‟ livelihoods.

Útdráttur
Fiskeftirspurn vex sífellt í Kenýa í Austur-Afríku. Vegna hnignandi fiskistofna gerir
fiskframboð það hins vegar ekki. Í alþjóðlegum samanburði er fiskeldi í Kenýa enn
óverulegt og fylgir ekki hröðum vexti greinarinnar á heimsvísu. Hins vegar eru vannýtt
sóknarfæri í fiskeldisstarfsemi í Kenýa. Árið 2009 varð þróun og markaðsvæðing eldis á
beitarfiski og Norður-Afríkgrana hluti af efnahagsörvunaráætlun ríkisstjórnar landsins.
Markmið áætlunarinnar voru að örva hagvöxt með sköpun viðskiptatækifæra og starfa og
að draga úr fæðuóöryggi og fátækt sem eru meiriháttar vandamál í Kenýa.
Fiskeldisframleiðsla jókst stórum í kjölfarið. Þessi rannsókn notaðist við spurningalista til
að varpa ljósi á áhrif stuðnings ríkisstjórnarinnar á lífskjör bænda sem stunda
smáframleiðslu á eldisfiski í Nyanza- og Western-sýslum í Kenýa. Í brennidepli voru
einkenni býla, stuðningskerfi, fjárhagur býla, breytingar á lífskjörum og framtíð
fiskeldisins. Vegna tekna af fiskeldi bötnuðu lífskjör bænda sem hlotið höfðu styrki frá
ríkisstjórninni þegar litið er til prótínneyslu en framleiðni tjarna þeirra er lítil. Með því að
auka tekjur og bæta aðgengi að prótínum hjálpuðu styrkirnir bændunum til skemmri tíma
litið en þeir kenndu bændunum ekki hvernig stunda má sjálfbært fiskeldi þegar þeir hætta
að fá styrki. Ein leið til að auka framleiðni tjarna þeirra er að styðja við samþætta og
sjálfbæra stundun landbúnaðar og fiskeldis. Ef framleiðni tjarnanna nær ekki að aukast er
mikil hætta á að dragi úr fiskeldi í Kenýa með neikvæðum afleiðingum á lífskjör bænda.


“Fulu bende oro ngege.”
“Even haplochromis (a small fish) employs tilapia (a large fish).”
(Luo Proverb)

Foreword
This thesis was written in the winter of 2012/2013, representing my final project for a
Master of Resource Management degree in Coastal and Marine Management from the
University of Akureyri, Iceland. In lectures the importance of aquaculture in terms of food-
provision and income-creation was often a main point of discussion. Fascinated by these
topics I decided to do my final project on aquaculture development in a developing country
in Africa, namely Kenya. Iceland and Kenya: Two countries that could not possibly be
much more different in terms of culture, climate, food and spirit! Attracted by this
challenge I travelled to Kisumu in western Kenya in the summer of 2012 to conduct my
research. Top-down aquaculture support, which is frequently ill-reputed, is applied in
Kenya where the government is funding the farming of fish, among other things to
alleviate poverty and food insecurity. I wanted to assess how successful in terms of
livelihood improvement small-scale fish farming in Kenya is, most of the farmers being
relatively new to aquaculture. I visited fish farms so very different to the ones observed in
Iceland where aquaculture has a long and well-established history. The farmers I visited
usually lived in simple farm houses, typically mud-and-wattle dwellings with grass- or
reed-thatched roofs and often without electricity. Rather small amounts of fish are
produced to be sold on local markets. Generally speaking, not at all comparable to the
industrial cultured fish production in Iceland. This research got me engaged in a
completely different aquaculture practice and opened my eyes to problems rarely seen in
countries like Iceland where aquaculture is well-managed and monitored. I hope that my
thesis will be of future use in helping to address problems of small-scale farmers in
countries where aquaculture is not a long established tradition.

xiii
Table of Contents
Foreword ............................................................................................................................. xi
Table of Contents .............................................................................................................. xiii
List of Figures .................................................................................................................. xvii
List of Tables ..................................................................................................................... xix
Acronyms ........................................................................................................................... xxi
Acknowledgements ......................................................................................................... xxiii
1 Introduction ................................................................................................................. 1
1.1 Background – Livelihoods and Aquaculture in Kenya ........................................... 1
1.2 Research Purpose .................................................................................................... 2
1.3 Research Aims and Objectives ............................................................................... 3
1.4 Research Questions ................................................................................................. 4
1.5 Structure and Context of the Paper ......................................................................... 5
2 Kenya Country Profile – With Focus on the Study Area ........................................ 7
2.1 Geography, Climate, Politics, Economy and Demographics .................................. 7
2.1.1 Geography of Kenya ........................................................................................ 7
2.1.2 Climate of Kenya ............................................................................................. 8
2.1.3 Kenyan Politics ................................................................................................ 9
2.1.4 Kenyan Economy .......................................................................................... 10
2.1.5 Demographics ................................................................................................ 11
2.2 Poverty and Food Insecurity in Kenya ................................................................. 12
2.2.1 Definitions ..................................................................................................... 12
2.2.2 Food Insecurity and Poverty – Situation in Kenya ........................................ 13
3 Rationale for Aquaculture in Kenya ........................................................................ 15
3.1 Status of Kenyan Capture Fisheries ...................................................................... 15
xiv
3.2 Aquaculture Development in Kenya .................................................................... 17
3.2.1 Nile Tilapia (Oreochromis niloticus) ............................................................ 18
3.2.2 African Catfish (Clarias gariepinus) ............................................................. 18
3.3 Fish and Food Security ......................................................................................... 19
3.3.1 General .......................................................................................................... 19
3.3.2 Aquaculture for Food Security ...................................................................... 20
4 Extension Services and Support Mechanisms for Aquaculture in Kenya ........... 23
4.1 Aquaculture Extension in Kenya .......................................................................... 23
4.1.1 Public Sector and Institutional Linkages ....................................................... 23
4.1.2 Non-Governmental Organisations................................................................. 24
4.2 History of Aquaculture Extension in Kenya......................................................... 24
4.3 The Economic Stimulus Programme of the Kenyan Government ....................... 26
4.3.1 Project Description ........................................................................................ 26
4.3.2 The Economic Stimulus Programme and Aquaculture ................................. 27
4.4 Literature Review ................................................................................................. 31
4.4.1 Livelihoods and Aquaculture ........................................................................ 31
4.4.2 Subsidies and Extension Services in Aquaculture Development .................. 33
5 Research Methodology .............................................................................................. 37
5.1 Conducting Interviews .......................................................................................... 37
5.1.1 Questionnaire Development .......................................................................... 37
5.1.2 Interviews ...................................................................................................... 38
5.1.3 Limitations .................................................................................................... 41
5.2 The Study Area ..................................................................................................... 42
5.3 Selection of the Respondent Group ...................................................................... 42
5.3.1 Defining the Stakeholders of this Study ........................................................ 43
5.3.2 Farmers‟ Characteristics ................................................................................ 44
5.3.3 Limitations .................................................................................................... 45
xv
5.4 Data Transcription and Analysis ........................................................................... 47
5.4.1 Data Transcription ......................................................................................... 47
5.4.2 Data Analysis ................................................................................................. 47
5.4.3 Limitations ..................................................................................................... 48
6 Results ......................................................................................................................... 49
6.1 Fish Farming Characteristics ................................................................................ 49
6.1.1 General........................................................................................................... 49
6.1.2 Access to Aquaculture Related Necessities ................................................... 50
6.1.3 Fish Feed ....................................................................................................... 51
6.1.4 Problems on the Fish Farms .......................................................................... 52
6.2 Support Mechanisms Used ................................................................................... 54
6.3 Farm Wealth ......................................................................................................... 55
6.3.1 Pond Productivity .......................................................................................... 55
6.3.2 Use of Fish Harvest ....................................................................................... 56
6.3.3 Use of Household Income ............................................................................. 56
6.3.4 Aquaculture and Income Creation ................................................................. 57
6.3.5 Aquaculture Expenditures ............................................................................. 58
6.3.6 Aquaculture Profits and Self-Sufficiency ...................................................... 59
6.4 Livelihood Changes .............................................................................................. 60
6.4.1 Changes in Diet Diversity, Healthcare, Payment of Schooling Fees and
Household Possessions ................................................................................................ 60
6.4.2 Changes in Protein Consumption .................................................................. 62
6.5 Future Perspectives ............................................................................................... 66
6.5.1 Future Plans and Funding .............................................................................. 66
6.5.2 Future Support Needed .................................................................................. 66
7 Discussion ................................................................................................................... 69
7.1 Livelihoods and Aquaculture ................................................................................ 69
xvi
7.1.1 Income Creation and Aquaculture ................................................................. 69
7.1.2 Food Security ................................................................................................ 71
7.1.3 Sustainable Use of Natural Resources .......................................................... 73
7.1.4 Other Aspects ................................................................................................ 76
7.2 Future Challenges and Opportunities ................................................................... 77
7.3 Conclusions .......................................................................................................... 78
7.4 Recommendations ................................................................................................ 79
References .......................................................................................................................... 81
Appendix A – Research Questionnaire ........................................................................... 87
Appendix B – Cover Letter .............................................................................................. 93
xvii
List of Figures
Figure 2.1 Map of Kenya, East Africa .................................................................................. 8
Figure 2.2 Annual climate chart of Kisumu (city), Nyanza province, Kenya ...................... 9
Figure 2.3 Counties of the Nyanza and Western provinces, Kenya ................................... 10
Figure 3.1 Kenya‟s fisheries and aquaculture production (2011) ...................................... 16
Figure 3.2 Map of Lake Victoria, Africa ............................................................................ 16
Figure 3.3 Nile tilapia (Oreochromis niloticus) .................................................................. 18
Figure 3.4 African catfish (Clarias gariepinus) .................................................................. 19
Figure 4.1 Reported aquaculture production in Kenya, 1950 - 2012 ................................. 26
Figure 4.2 Aquaculture production in Kenya by species (2011) ........................................ 29
Figure 5.1 Typical fish ponds visited during the research period in western Kenya ......... 40
Figure 5.2 Visible fish during a feeding demonstration on a farm in western Kenya ........ 41
Figure 5.3 Area of data collection in western Kenya ......................................................... 42
Figure 5.4 Aquaculture stakeholders in Kenya................................................................... 44
Figure 5.5 Gender, county and education divisions of the interviewed fish farmers ......... 45
Figure 6.1 Frequency of different categories of fish feeds used by the fish farmers ......... 52
Figure 6.2 Major fish farming related problems.. ............................................................... 54
Figure 6.3 The main use of fish harvests ............................................................................ 56
Figure 6.4 The main use of total household incomes ......................................................... 57
Figure 6.5 The most important source of income of the fish farmers ................................ 58
Figure 6.6 Main aquaculture related expenditures ............................................................. 59
Figure 6.7 Farmers' changes in diet diversity, healthcare, ability to pay schooling fees and
amount of household assets owned since starting aquaculture............................................ 62
Figure 6.8 Farmers' changes in the consumption frequency of meat, purchased fish, omena
and beans since starting aquaculture ................................................................................... 65
Figure 6.9 Type of support needed by the fish farmers ...................................................... 67

xix
List of Tables
Table 2.1 Official exchange rates of KES per USD (period average) ................................ 11
Table 2.2 Selected demographic data of Kenya.................................................................. 12
Table 2.3 Demographic data for the Kisumu, Homa Bay and Vihiga counties.................. 12
Table 2.4 Poverty and food security related data for the Kisumu, Homa Bay and Vihiga
counties ................................................................................................................................ 14
Table 3.1 The different roles of aquaculture in Africa ....................................................... 21
Table 4.1 Aquaculture statistics for Vihiga county and the Western province (2011) ....... 29
Table 4.2 Aquaculture statistics for the Homa Bay and Kisumu counties, and the Nyanza
province (2011) ................................................................................................................... 30
Table 6.1 Characteristics of surveyed fish farms in the study area .................................... 50
Table 6.2 Distances to get access to aquaculture related necessities in the study area ....... 51
Table 6.3 Fish feedsused by farmers in the study area ....................................................... 52
Table 6.4 Fish farming related problems in the study area ................................................. 53
Table 6.5 Support received by the fish farmers in the study area ....................................... 55
Table 6.6 Productivity of fish ponds in the study area ....................................................... 55
Table 6.7 Average annual aquaculture incomes, expenditures and profits, and portion of
farms where aquaculture is self-supportive in the study area .............................................. 60
Table 6.8 Average consumption frequency of meat, purchased fish, omena and beans of
farmers in the study area before starting aquaculture .......................................................... 63
Table 6.9 Future plans of fish farmers in the study area ..................................................... 66

xxi
Acronyms
ESP Economic Stimulus Programme
FD Fisheries Department
GDP Gross Domestic Product
GIZ Deutsche Gesellschaft für InternationaleZusammenarbeit (German
Development Agency)
GNI Gross National Income
GoK Government of Kenya
INADES Institut Africain pour le Développement Economique et Social
ITCZ Inter-Tropical Convergence Zone
KES Kenyan Shilling
KMFRI Kenya Marine and Fisheries Research Institute
LBDA Lake Basin Development Authority
LIFDC Low-Income Food-Deficit Country
MoFD Ministry of Fisheries Development
NGO Non-Governmental Organisation
PPP Purchasing Power Parity
USD US Dollar

xxiii
Acknowledgements
Foremost I would like to express my sincere thankfulness to my advisor Dr. Benedict J.
Colombi for his patience, motivation, knowledge and enthusiasm. His guidance and
continuous support helped me in all project phases - preparation, research and finally the
writing of this thesis. Besides my advisor I would like to thank the staff at the University
Centre of the Westfjords in Ísafjörður, Iceland: Peter Weiss for his enthusiasm and help
getting this project started, Dagný for helpful and valuable advice and suggestions,
Albertína for her time and help with questionnaire development and data interpretation,
and Gunna Sigga for keeping up my spirits. Furthermore I am very grateful to Dr. Tumi
Tómasson for his time to read and correct my thesis, providing mewith helpful adviceand
valuable literature. Special thanks also go to Dr. Patricia Manuel for her time, valuable
input and last-minute help! Without help of the Deutsche Gesellschaft für Internationale
Zusammenarbeit (German Development Agency) and Kenyan Ministry of Fisheries
Development during project-planning and my time in Kenya it would not have been
possible to conduct my research: Special thanks goes to Arnoud and Laszlo for hosting me
and their helpful advice about living and researching in Kenya. Getting in touch with
people able to help me find and contact respondents for my study would not have been
possible without help from Arnoud, Enos, Jedida, George O., Fredrick, Sophie and George
A. - thank you so much. Special thanks to Fredrick, Sophie and George A. for their help
with translation, and George for driving me safely to my respondents on the crazy Kenyan
roads! Many thanks also to Laila who helped me design my questionnaire. I would also
like to thank all the fish farmers who agreed to participate in my field work, taking time off
from their farm work to help me complete my research. None of this project would have
been possible without the help and support of my amazing family and friends worldwide
who I could always rely on with personal as well as with professional matters – be it via
Skype or in person! Nic and Jojo, really big hugs go to you! Finally I want to thank Tómas
for his time and Icelandic translations - without you I would not have started writing.
Takk fyrir.

1
1 Introduction
1.1 Background – Livelihoods and Aquaculture in Kenya
In the most general terms, livelihoods can be described as peoples‟ means to secure the
necessities of life. They are highly dynamic and shaped by a variety of different factors and
forces that are themselves shifting constantly. The improvement of livelihoods of people in
developing countries is the mission of many public and governmental institutions, and is
successful when communities experience increased well-being and reduced vulnerability
through higher incomes, improved food security and the more sustainable use of natural
resources (DFID, 1999).
Rural populations in Kenya - an East African Low-Income Food-Deficit Country (LIFDC)
(FAO, 2013a) - are facing increasing pressure on their livelihoods through, for example,
the combined impacts of HIV/AIDS, climate change and water scarcity (CIA, 2013).
Aquaculture of low-trophic level fish species is one way to improve livelihoods in
developing countries (FAO, 2012). Russell, Grötz, Kriesemer and Pemsl (2008) for
example described fish farming households as being among the more livelihood-secure
households of their studied communities in Malawi. Aquaculture development has hence
been stimulated in numerous countries in order to improve livelihoods with varying
success rates.
Kenya has great potential for pond-based aquaculture of Nile tilapia (Oreochromis
niloticus) and African catfish (Clarias gariepinus). However, in 2008 this potential was by
no means fully explored (Mbugua, 2008a) despite about 30 years of various aquaculture
extension services (Ngugi & Manyala, 2004).
Support for aquaculture development in Kenya comes from the Government of Kenya
(GoK) but also from the industry, the private sector and a number of Non-Governmental
Organisations (NGOs) (Rothuis, van Duijn, van Rijsingen, van der Pijl & Rurangwa,
2011). In 2009 the development of Nile tilapia and African catfish aquaculture became part
of the GoK‟s Economic Stimulus Programme (ESP), in order to commercialize this sub-
2
sector of Kenya‟s economy (Manyala, 2011), improve the nutritional situation of the
farmers and create employment (TISA, 2010). Fish pond construction costs as well as the
costs for feeds and fingerlings are subsidised by the programme. Additionally,
governmental infrastructure supporting the aquaculture sub-sector, i.e. trainings, research
farms and extension officers, is in place (Hino, 2011). This program led to an increase in
the number of farmers engaged in fish farming as well as to increased fish production
(FAO, 2013b). On a global scale, however, Kenyan aquaculture production is still
insignificant (Rothuis et al., 2011).
Top-down government support policies for aquaculture development sometimes prove to
be unsuccessful in terms of increasing production (Russell et al., 2008). In Kenya,
however, the country‟s increasing demand for fish connected to a rapidly increasing
population (CIA, 2013) may improve the likelihood of success of government intervention.
Fish consumption patterns in Kenya used to reflect the proximity to fishing areas and
cultural tradition. Traditionally the major fish consumers have been the Luo ethnic group,
inhabiting areas around Lake Victoria. However, the demand for fish has increased fast
because more and more people have embraced fish on their household menus and
aquaculture production is widespread throughout the country (Rothuis et al., 2011). The
Nyanza and Western provinces, where this study took place, are poor. However, owing at
least partially to aquaculture development, significant improvements in livelihoods were
recorded between 2004 and 2011 (Dominion Farms, 2011). These prerequisites, i.e. the
population‟s fondness for fish, the prevalence of aquaculture and the high poverty ratio in
the area, makes the Kenyan Nyanza and Western provinces ideal for a study on livelihood
changes through aquaculture in a developing country.
1.2 Research Purpose
“Even haplochromis (a small fish) employs tilapia (a large fish).”
This old Luo proverb (author unknown, from Miruka, 2001, 56; see also page ix of this
document) mentions two types of fish which both inhabit Lake Victoria (Odada, Olago,
Kulindwa, Ntiba & Wandiga, 2004). It is about responsiveness to humble calls, the need to
listen to the voices of those who are perceived as voiceless – the poor. I found this proverb
attributing to this study because it incorporates collaborations between the GoK and the
3
rural poor through the provision of subsidies for fish farming activities. The opinions of the
fish farmers – the poor - encountered in this study could help to improve the livelihoods of
small-scale fish farmers.
Aquaculture has been developing rapidly over the last 30 years (FAO, 2012), but for
Kenya the farming of fish still depicts a relatively new opportunity to create incomes and
improve livelihoods (Fisheries Department, 2012). Since the introduction of the GoK‟s
ESP in 2009 no study has described a livelihood-based response of the fish farmers to the
program. In order to identify if the GoK‟s efforts in terms of boosting aquaculture
development with the aim to improve livelihoods were successful, the livelihood situations
of farmers who did and who did not receive governmental support for aquaculture are
compared. This study thus seeks to elaborate on the potential of governmental aquaculture
support to help improve livelihoods in a sub-Saharan LIFDC in terms of increased well-
being and reduced vulnerability through increased income creation, changes in protein
consumption and the sustainable use of natural resources on the farms.
In order to continuously improve livelihoods it is necessary to ensure that aquaculture can
successfully continue after subsidies have stopped. However, earlier studies show that
successes from subsidised aquaculture are often short-lived. After support is terminated,
fish farming activities are often discontinued (Dey et al., 2006) or production levels drop
back to pre-funding levels (Brummett et al., 2011), which both should be avoided. This
study seeks to provide insights and offer recommendations on supporting small-scale
aquaculture, even when government funding is no longer available.
1.3 Research Aims and Objectives
Aquaculture plays a role in food security and poverty alleviation worldwide through
significant production of some low-value freshwater species. Especially fish producers in
Asia, mainly in China, Bangladesh, Vietnam, India and Indonesia, have benefitted from the
culture of low-trophic level fish like for example tilapia. The LIFDCs though, mostly in
Asia and sub-Saharan Africa, remain minor in terms of their share of global aquaculture
production. However, especially in many developing countries, fish is the number one
animal protein source. Its contribution to the health of people as well as to economic
growth is crucial (FAO, 2012).
4
Hence, aquaculture development has been stimulated in many ways with varying success
rates in numerous countries. Building on other case studies this study examines the
potential of fish farming to improve the livelihoods of farmers in the Lake Victoria region,
Kenya. Objectives of this study are to shed light on (1) farm characteristics and
demographics in the study area, (2) support mechanisms used by the fish farmers, (3) farm
wealth, (4) livelihood changes through aquaculture and (5) future fish farming prospects.
1.4 Research Questions
The study objectives are framed in the context of the following guiding research questions:
(1) How effective has the Kenyan government‟s Economic Stimulus Programme been
for chosen Nile tilapia (Oreochromis niloticus) and African catfish (Clarias gariepinus)
farmers in western Kenya to improve livelihoods in terms of improved well-being and
reduced vulnerability through (a) increased income creation, (b) changes in protein
consumption, and the (c) sustainable use of natural resources?
(2) What is the long-term potential of small-scale Nile tilapia (Oreochromis niloticus)
and African catfish (Clarias gariepinus) aquaculture in chosen farms in western Kenya (a)
with or (b) without the support of the Kenyan government‟s Economic Stimulus
Programme?
Answering these questions will shed light on the potential of governmental aquaculture
support to improve the livelihoods of farmers in the Lake Victoria region of Kenya.
This study does not provide a full picture of fish farming in the study area. Instead, it
explores the experiences and opinions of a small group of fish farmers more thoroughly.
Also, the study involves only one group of stakeholders, the fish farmers themselves, even
though aquaculture in Kenya is an activity with a multitude of different stakeholders
(Rothuis et al., 2011). The sample of participants is not random, it is opportunistic. The
study relied on the availability and willingness of famers to participate and was constrained
by logistical challenges. The work covers only a small area and in a very short period of
time. Consequently, the sample displays strong attributes of homogeneity: predominantly
male, and quite old farmers, with a high proportion of them operating financially „better-
off‟ farms.
5
Despite these constraints and limitations the research never-the-less presents lessons from
farmers who are attempting to eke out a livelihood in small-scale aquaculture with and
without government support. It illustrates some of the successes and challenges of the
activity and offers insights to future aquaculture success for farmers wishing to attempt it.
1.5 Structure and Context of the Paper
The aim of this thesis is to first give information on the area under discussion and second,
to employ data collected in the Lake Victoria region of Kenya (western Kenya), in the
Nyanza and Western provinces, to put the situation of local fish farmers into context.
Background information on the topic and a review of related literature are provided in
sections two to four of this thesis. Kenya‟s geography, climate, politics, economy and
demographics, as well as two of the country‟s main issues, namely poverty and food
insecurity, are described in section two. The importance of fish farming in Kenya, with its
declining Lake Victoria fisheries, to help alleviate poverty and food insecurity is
highlighted in section three. Aquaculture extension services in Kenya, highlighting the
support the sector receives through the GoK‟s ESP, are concentrated on in section four.
Also, a historical overview of the subject is given. Research methods employed to collect
and analyse the data are outlined in section five. The results of the research on aquaculture
development in the Nyanza and Western provinces are presented and discussed in sections
six and seven: The results of my study are presented in section six, encompassing farm
characteristics and demographic information, the fish farmers‟ use of aquaculture support
mechanisms, farm wealth, livelihood changes induced by fish farming and perspectives for
aquaculture continuation in the future. These results are discussed and related to relevant
earlier studies in section seven. Conclusions and recommendations are also given in this
section.

7
2 Kenya Country Profile – With Focus on the Study Area
2.1 Geography, Climate, Politics, Economy and Demographics
The primary source of this section is the CIA (2013)‟s World Factbook, which provides
up-to-date data on Kenya. Another reference frequently cited throughout this thesis project
report is Rothuis et al. (2011). The authors of this report, working out of Wageningen
University in the Netherlands, present key findings and recommendations of a fact-finding
mission on aquaculture business opportunities in Kenya with respect to food security.
Overall, and especially for this section, this source provided very valuable information.
2.1.1 Geography of Kenya
The Republic of Kenya (capital city: Nairobi) is an East African country lying on the
equator. It is bordered by Tanzania to the south, Uganda to the west, South Sudan to the
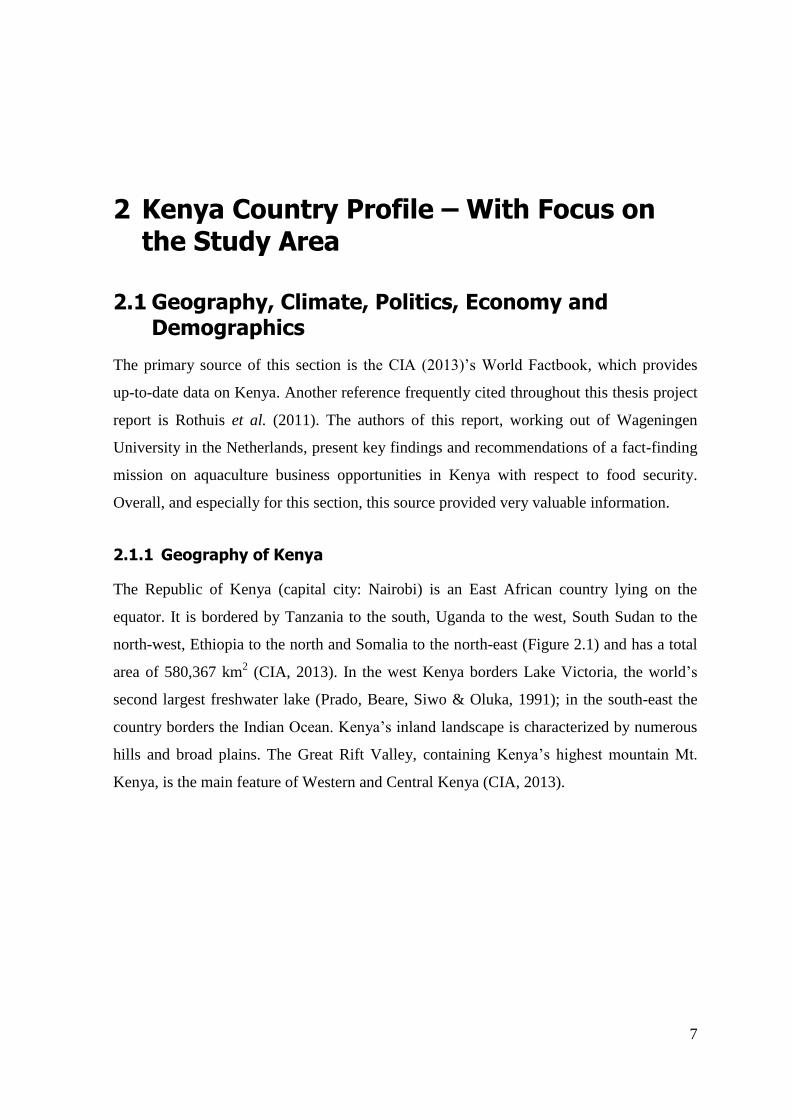
north-west, Ethiopia to the north and Somalia to the north-east (Figure 2.1) and has a total
area of 580,367 km2 (CIA, 2013). In the west Kenya borders Lake Victoria, the world‟s
second largest freshwater lake (Prado, Beare, Siwo & Oluka, 1991); in the south-east the
country borders the Indian Ocean. Kenya‟s inland landscape is characterized by numerous
hills and broad plains. The Great Rift Valley, containing Kenya‟s highest mountain Mt.
Kenya, is the main feature of Western and Central Kenya (CIA, 2013).
8
Figure 2.1 Map of Kenya, East Africa (from Rothuis et al., 2011)
2.1.2 Climate of Kenya
Kenya‟s climate is influenced by its topography, proximity to the equator, the Indian
Ocean and the Inter-Tropical Convergence Zone (ITCZ) (National Environment
Management Authority, 2005). The country‟s climate varies by location, with elevation
being the major driver for temperature differences. The climate along the Indian Ocean
coastline is tropical with rainfall and high temperatures throughout the year. Further inland
the climate becomes more arid. The migration of the ITCZ produces the country‟s seasonal
rainfall resulting in two distinct rain periods: The „long‟ rains from March to May and the
„short‟ rains from October to December. Between about 50 – 200 mm of rainfall per month
are generally received in these seasons. The country also suffers water scarcity due to the
9
uneven distribution of water resources in time and space as well as due to an increasing
occurrence of extreme weather events (Rothuis et al., 2011). Recurring droughts in the dry
seasons and flooding during the rainy seasons are Kenya‟s main natural hazards (CIA,
2013). The shores of Lake Victoria display a warm, tropical climate all year round
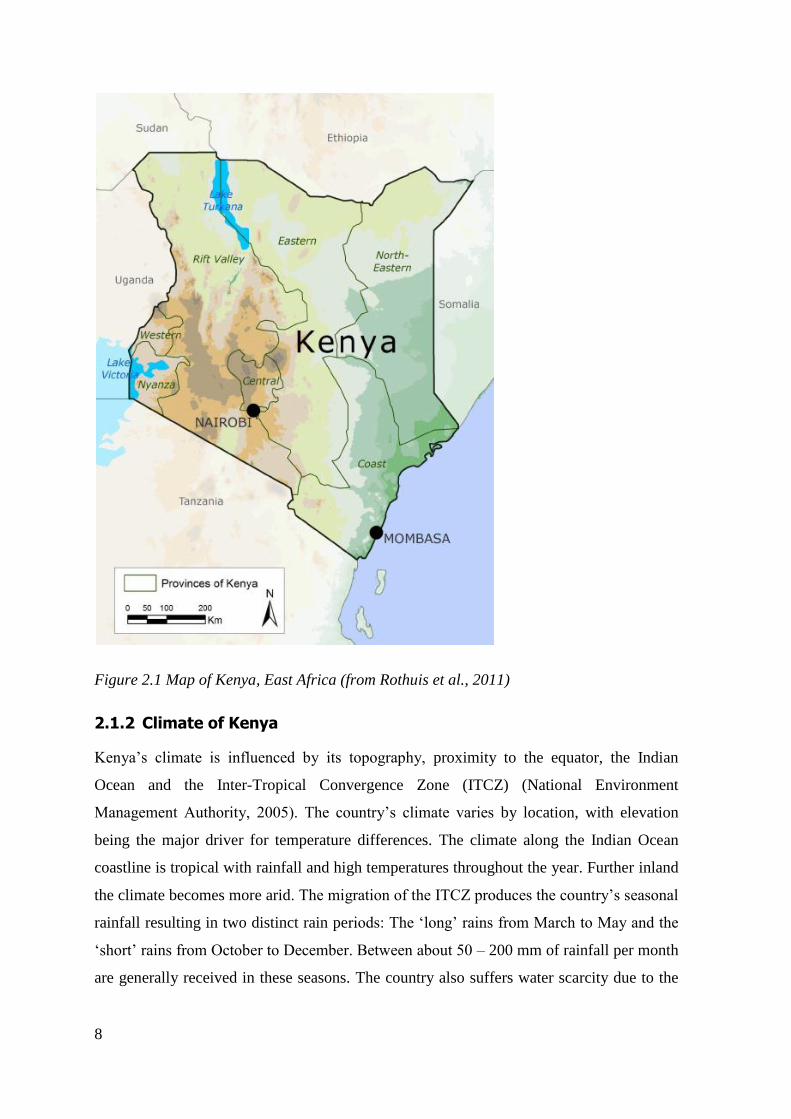
(Rothuis et al., 2011). Precipitation and temperature data for Kisumu, the capital of the
Nyanza province at the shores of Lake Victoria, are displayed in Figure 2.2.
Figure 2.2 Annual climate chart of Kisumu (city), Nyanza province, Kenya, displaying
average low and high temperatures (in °C) and average precipitation (in mm) (from
Climate Data, n.d.)
2.1.3 Kenyan Politics
The Republic of Kenya is a presidential republic, with a multi-party system and the
president being both the head of government and state (Rothuis et al., 2011). Formerly
Kenya was British East Africa. On December 12th, 1963 Kenya became independent from
the United Kingdom. The Republic of Kenya is politically divided into seven provinces
and Nairobi area (Figure 2.1). In August 2010 the constitution designated 47 yet-to-be-
defined counties as first order administrative units (CIA, 2013). The Nyanza province
comprises the Homa Bay, Migori, Kisii, Nyamira, Kisumu and Siaya counties; the Western
province comprises the Busia, Bungoma, Kakamega and Vihiga counties (Figure 2.3)
10
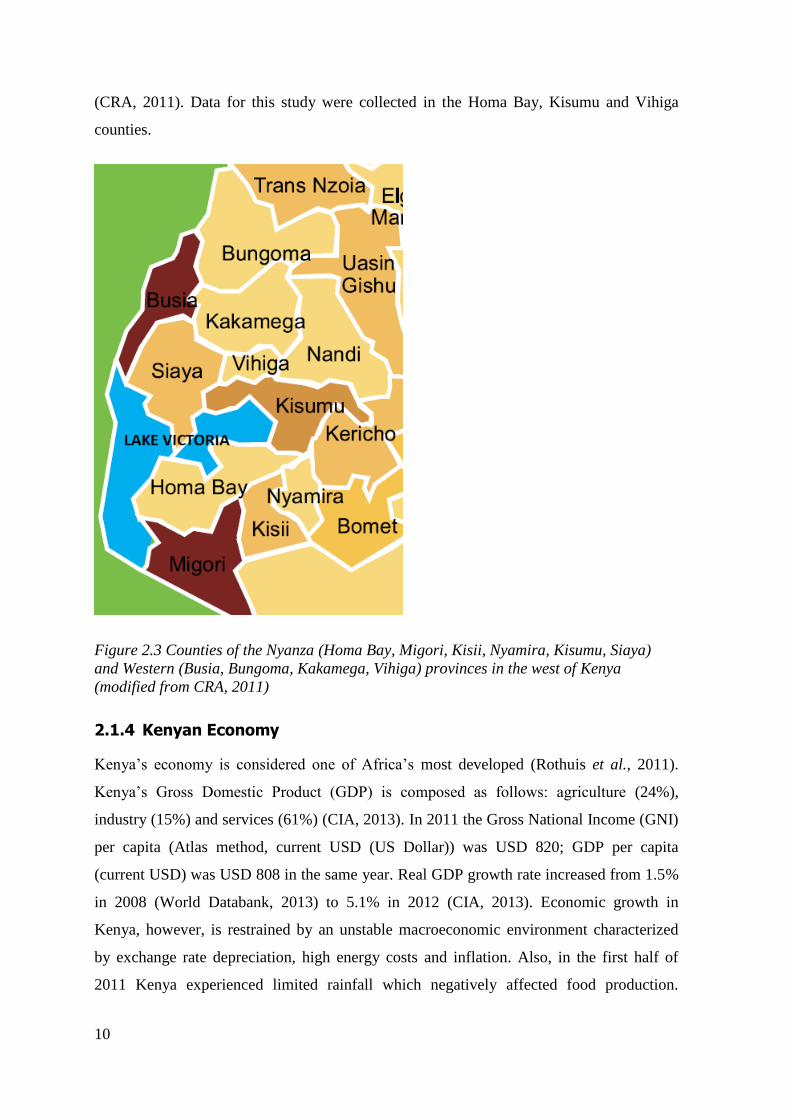
(CRA, 2011). Data for this study were collected in the Homa Bay, Kisumu and Vihiga
counties.
Figure 2.3 Counties of the Nyanza (Homa Bay, Migori, Kisii, Nyamira, Kisumu, Siaya)
and Western (Busia, Bungoma, Kakamega, Vihiga) provinces in the west of Kenya
(modified from CRA, 2011)
2.1.4 Kenyan Economy
Kenya‟s economy is considered one of Africa‟s most developed (Rothuis et al., 2011).
Kenya‟s Gross Domestic Product (GDP) is composed as follows: agriculture (24%),
industry (15%) and services (61%) (CIA, 2013). In 2011 the Gross National Income (GNI)
per capita (Atlas method, current USD (US Dollar)) was USD 820; GDP per capita
(current USD) was USD 808 in the same year. Real GDP growth rate increased from 1.5%
in 2008 (World Databank, 2013) to 5.1% in 2012 (CIA, 2013). Economic growth in
Kenya, however, is restrained by an unstable macroeconomic environment characterized
by exchange rate depreciation, high energy costs and inflation. Also, in the first half of
2011 Kenya experienced limited rainfall which negatively affected food production.
11
Overall, however, Kenya‟s economy has gradually emerged from economic slowdown and
political instability. Reforms in public finance management have continued, but progress
has been slow. Economic freedom has been held back by extensive corruption and weak
protection of property rights (Rothuis et al., 2011).
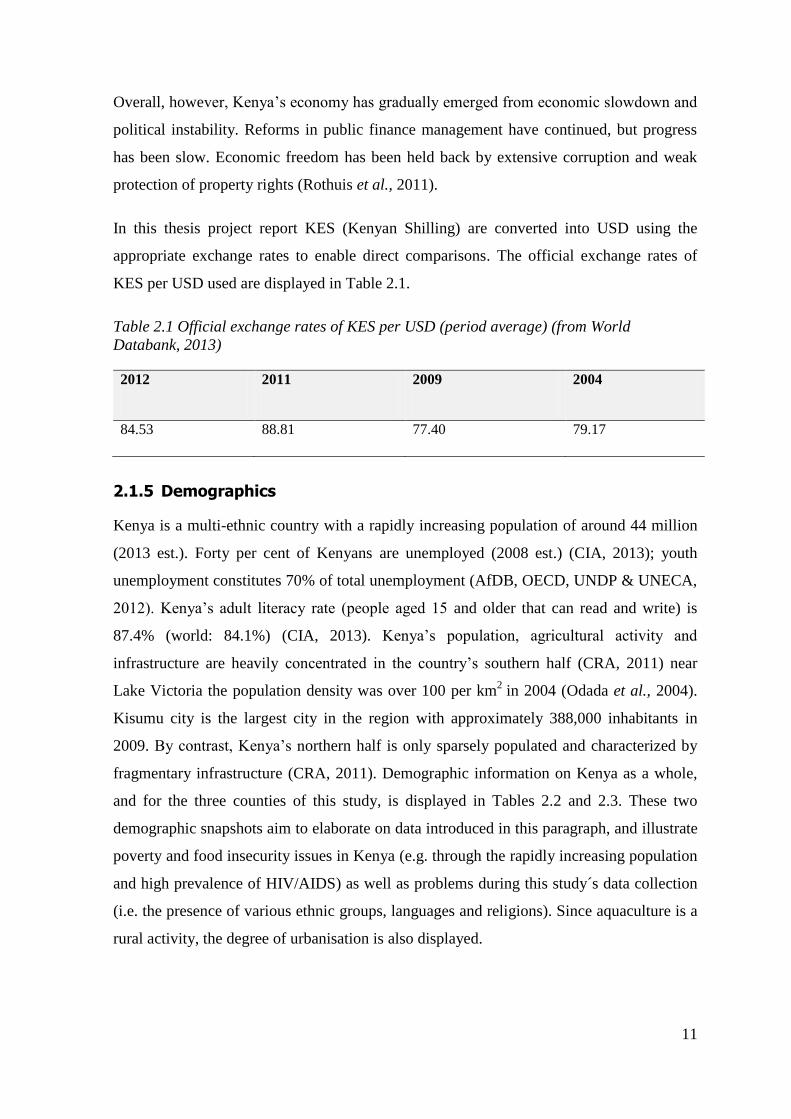
In this thesis project report KES (Kenyan Shilling) are converted into USD using the
appropriate exchange rates to enable direct comparisons. The official exchange rates of
KES per USD used are displayed in Table 2.1.
Table 2.1 Official exchange rates of KES per USD (period average) (from World
Databank, 2013)
2012 2011 2009 2004
84.53 88.81 77.40 79.17
2.1.5 Demographics
Kenya is a multi-ethnic country with a rapidly increasing population of around 44 million
(2013 est.). Forty per cent of Kenyans are unemployed (2008 est.) (CIA, 2013); youth
unemployment constitutes 70% of total unemployment (AfDB, OECD, UNDP & UNECA,
2012). Kenya‟s adult literacy rate (people aged 15 and older that can read and write) is
87.4% (world: 84.1%) (CIA, 2013). Kenya‟s population, agricultural activity and
infrastructure are heavily concentrated in the country‟s southern half (CRA, 2011) near
Lake Victoria the population density was over 100 per km2
in 2004 (Odada et al., 2004).
Kisumu city is the largest city in the region with approximately 388,000 inhabitants in
2009. By contrast, Kenya‟s northern half is only sparsely populated and characterized by
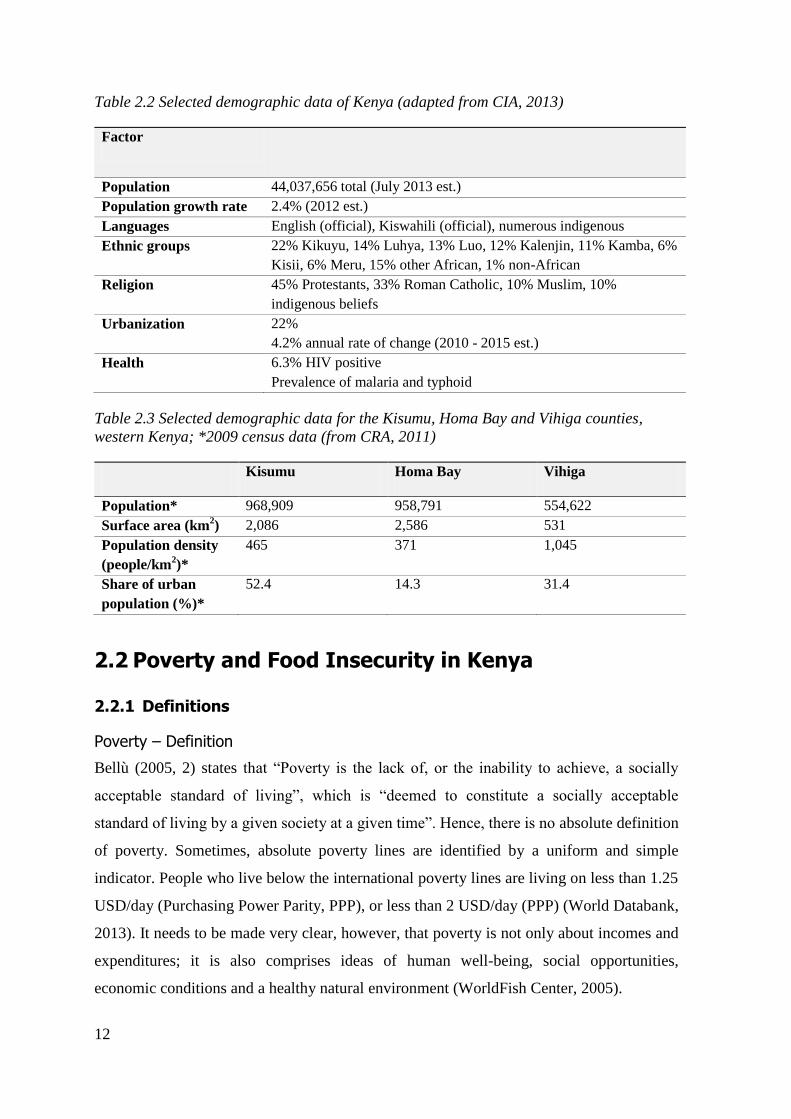
fragmentary infrastructure (CRA, 2011). Demographic information on Kenya as a whole,
and for the three counties of this study, is displayed in Tables 2.2 and 2.3. These two
demographic snapshots aim to elaborate on data introduced in this paragraph, and illustrate
poverty and food insecurity issues in Kenya (e.g. through the rapidly increasing population
and high prevalence of HIV/AIDS) as well as problems during this study´s data collection
(i.e. the presence of various ethnic groups, languages and religions). Since aquaculture is a
rural activity, the degree of urbanisation is also displayed.
12
Table 2.2 Selected demographic data of Kenya (adapted from CIA, 2013)
Factor
Population 44,037,656 total (July 2013 est.)
Population growth rate 2.4% (2012 est.)
Languages English (official), Kiswahili (official), numerous indigenous
Ethnic groups 22% Kikuyu, 14% Luhya, 13% Luo, 12% Kalenjin, 11% Kamba, 6%
Kisii, 6% Meru, 15% other African, 1% non-African
Religion 45% Protestants, 33% Roman Catholic, 10% Muslim, 10%
indigenous beliefs
Urbanization 22%
4.2% annual rate of change (2010 - 2015 est.)
Health 6.3% HIV positive
Prevalence of malaria and typhoid
Table 2.3 Selected demographic data for the Kisumu, Homa Bay and Vihiga counties,
western Kenya; *2009 census data (from CRA, 2011)
Kisumu Homa Bay Vihiga
Population* 968,909 958,791 554,622
Surface area (km2) 2,086 2,586 531
Population density
(people/km2)*
465 371 1,045
Share of urban
population (%)*
52.4 14.3 31.4
2.2 Poverty and Food Insecurity in Kenya
2.2.1 Definitions
Poverty – Definition
Bellù (2005, 2) states that “Poverty is the lack of, or the inability to achieve, a socially
acceptable standard of living”, which is “deemed to constitute a socially acceptable
standard of living by a given society at a given time”. Hence, there is no absolute definition
of poverty. Sometimes, absolute poverty lines are identified by a uniform and simple
indicator. People who live below the international poverty lines are living on less than 1.25
USD/day (Purchasing Power Parity, PPP), or less than 2 USD/day (PPP) (World Databank,
2013). It needs to be made very clear, however, that poverty is not only about incomes and
expenditures; it is also comprises ideas of human well-being, social opportunities,
economic conditions and a healthy natural environment (WorldFish Center, 2005).
13
Food insecurity – Definition
Food insecurity is the lack of secure access to sufficient amounts of safe and nutritious
food for normal growth and development and an active, healthy life. Because food
constitutes a major part of expenditures for the poorest households, food prices can directly
affect food security (FAO, 2008). Typically, one has to consider four dimensions when
discussing food security (from FAO, 2008):
(1) Availability of food which is determined by a country‟s importation capacity, domestic
production and the existence of food aids and food stocks.
(2) Access to food which depends on purchasing power of households, levels of poverty,
the availability of market and transport infrastructure and food distribution systems as well
as food prices.
(3) Stability of food access and supply may be influenced by weather, human-induced
disasters, price fluctuations as well as a variety of economic and political factors.
(4) Food utilization must be safe and healthy and hence depends on feeding and care,
access to clean water, food quality and safety as well as sanitation and health.
2.2.2 Food Insecurity and Poverty – Situation in Kenya
In 2005 the percentage of Kenyans living below the international poverty lines of 1.25
USD/day (PPP) and 2 USD/day (PPP) was 43.4% and 67.2%, respectively (most recent
figures available at the time of writing this thesis) (World Databank, 2013). In 2011 about
75% of the country‟s poor lived in pastoral areas; 3.75 million of these people were food
insecure. Malnutrition of children may be as high as 30% in some parts of the country
(Rothuis et al., 2011). Factors driving Kenya‟s poverty and food insecurity are water
scarcity during droughts, land subdivision and tenure, environmental deterioration
(Ministry of Foreign Affairs of Denmark, 2006), volatile food prices and social inequality
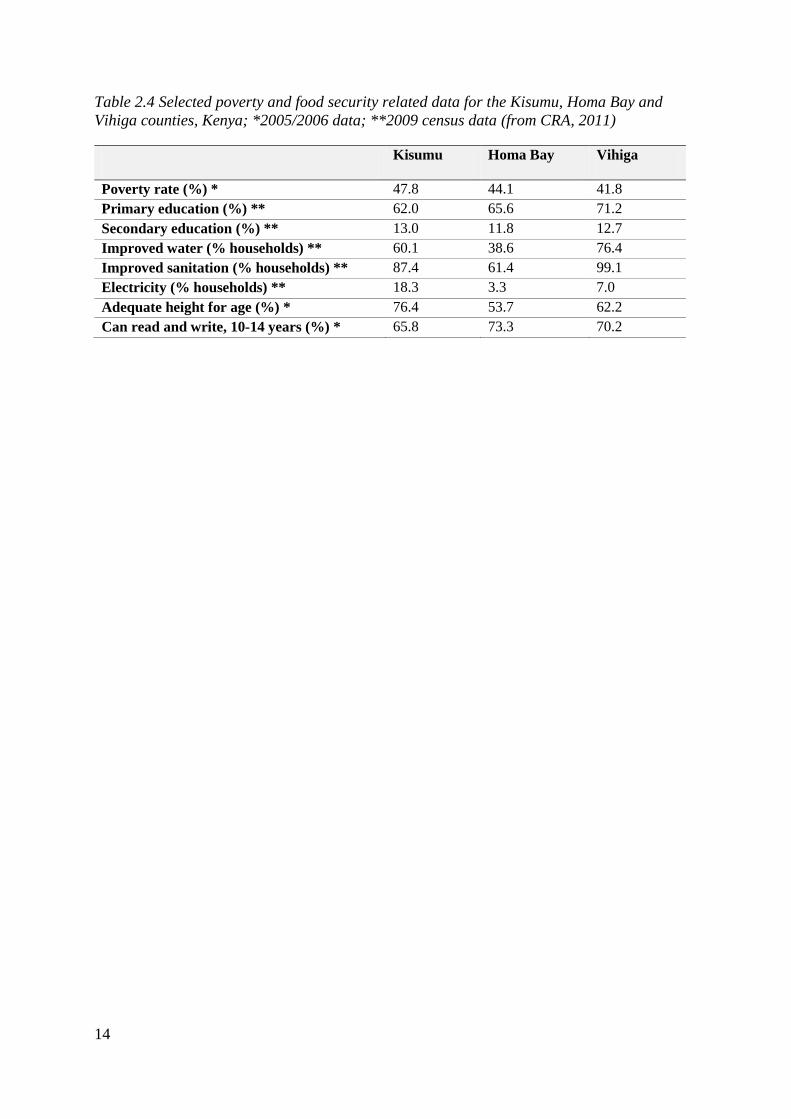
(Rothuis et al., 2011). The data presented in Table 2.4 aim to develop an understanding of
poverty in the Kisumu, Homa Bay and Vihiga counties before fish farming became
popular. Even though no absolute poverty line was applied by CRA (2011), the data still
give an idea about the situation since the lack of education and literacy, the lack of
electricity, improved water and sanitation, and stunting are possible poverty indicators.
14
Table 2.4 Selected poverty and food security related data for the Kisumu, Homa Bay and
Vihiga counties, Kenya; *2005/2006 data; **2009 census data (from CRA, 2011)
Kisumu Homa Bay Vihiga
Poverty rate (%) * 47.8 44.1 41.8
Primary education (%) ** 62.0 65.6 71.2
Secondary education (%) ** 13.0 11.8 12.7
Improved water (% households) ** 60.1 38.6 76.4
Improved sanitation (% households) ** 87.4 61.4 99.1
Electricity (% households) ** 18.3 3.3 7.0
Adequate height for age (%) * 76.4 53.7 62.2
Can read and write, 10-14 years (%) * 65.8 73.3 70.2
15
3 Rationale for Aquaculture in Kenya
3.1 Status of Kenyan Capture Fisheries
Kenya has a 536 km long stretch of Indian Ocean coastline, multiple freshwater bodies
(CIA, 2013) and a long fishing history with the Luhyia, Luo and Abasuba ethnic groups
actively fishing for more than five centuries (EPZA, 2005). In 2011, capture fisheries
directly employed 62,232 fishermen. The Kenyan capture fisheries sector comprises
mainly artisanal practices; offshore marine waters are exploited by vessels from Distant-
Water Fishing Nations. Kenya‟s capture fisheries hence mainly depend on freshwater
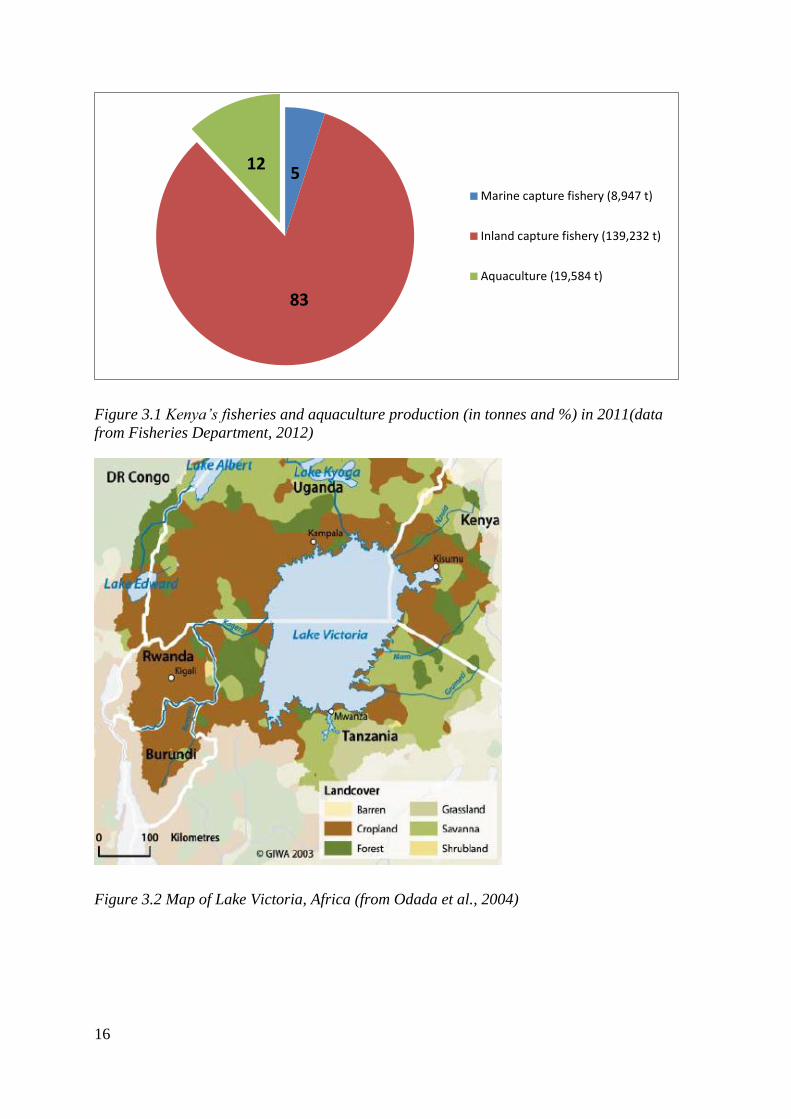
inland capture fisheries (Figure 3.1). In 2011 80% of Kenya‟s capture fisheries were
comprised by Lake Victoria‟s harvest of approximately 133,800 tonnes (Fisheries
Department, 2012). Lake Victoria (Figure 3.2), one of the East African Great Lakes, is the
world´s second largest freshwater lake. Its surface area is 68,800 km2, with only 6% in
Kenya (Prado et al., 1991).
However, Kenya‟s capture fisheries are at risk: Overfishing of marine fish resources is
reported in some areas. Also, increasing fishing efforts on Lake Victoria(Fisheries
Department, 2012) combined with multiple environmental problems like pollution, water
hyacinth infestation, anoxia and alien species introduction (Odada et al., 2004) led to a
declining trend in catches for most fish species (apart from catfish (Clarias spp.) and
omena (Rastrienobola argentea)) since the early 2000s. This could be an indicator for
reduced fish stocks in the lake directly threatening food security and income for
livelihoods of lakeside communities. The country‟s aquaculture sector could be a means to
create employment and reduce pressure on capture fisheries (Fisheries Department, 2012).
16
Figure 3.1 Kenya‟s fisheries and aquaculture production (in tonnes and %) in 2011(data
from Fisheries Department, 2012)
Figure 3.2 Map of Lake Victoria, Africa (from Odada et al., 2004)
5
83
12
Marine capture fishery (8,947 t)
Inland capture fishery (139,232 t)
Aquaculture (19,584 t)
17
3.2 Aquaculture Development in Kenya
Aquaculture is one of the fastest growing animal food-producing sectors worldwide: Its
contribution to world food fish production was 47% in 2010. Because of fast population
growth the world will require at least another 23 million tonnes of food fish by 2030. This
demand will need to be met with aquaculture since many of the world fisheries are at or
close to their limit. Many developing countries, especially in Asia, are major aquaculture
producers (FAO, 2012) but there is little aquaculture tradition in most African countries
(Brummett & Williams, 2000).
Fish farming in Kenya developed from the introduction of sport fishing in the 1890s. Static
water pond culture of carp, tilapia species and catfish developed in the early 1920s as a
control mechanism for snails, aquatic weeds, mosquitoes and leeches. Small-scale
aquaculture started in the 1940s (Kaliba, Ngugi, Mackambo & Quagrainie, 2007) but only
expanded in the 1960s through the „Eat More Fish‟ campaign of the GoK (Rothuis et al.,
2011). Since then declines in aquaculture activity were recorded regularly due to low-level
extension services and a lack of quality fingerlings (Ngugi & Manyala, 2004). Mariculture,
i.e. marine aquaculture, was introduced in the late 1970s but never flourished (Rothuis et
al., 2011).
Generally, the reasons for slow aquaculture development in Kenya have been (1) lack of a
tradition of fish and water husbandry (Brummett & Williams, 2000), (2) numerous
political, social and economic constraints that restrict investment and delay expansion, (3)
lack of information on fish farming technology and culture practices (Fisheries
Department, 2012) and (4) unknown investment return-rates (Ngugi & Manyala, 2004).
Kenya has a high potential for aquaculture, however, offering prospects of better incomes
and food supply for its rural population. Diverse aquaculture species, such as tilapia, trout,
catfish, common and Chinese carps, shrimp and freshwater prawns (Rothuis et al., 2011)
can be supported due to varied geographic and climatic regions and diverse water
resources ranging from marine and brackish waters to warm and cold fresh water
resources. The region around Lake Victoria is endowed with high potential due to various
water sources such as rivers, wetlands, lakes, water reservoirs and springs. Also, the region
has clay/loamy soil suitable for pond construction, as well as high temperatures for year-
18
round production and fast fish growth. Markets are also available in the area (Alal, 2012).
The two main species cultured in Kenya, Nile tilapia and African catfish (Fisheries
Department, 2012), are introduced in the following two paragraphs.
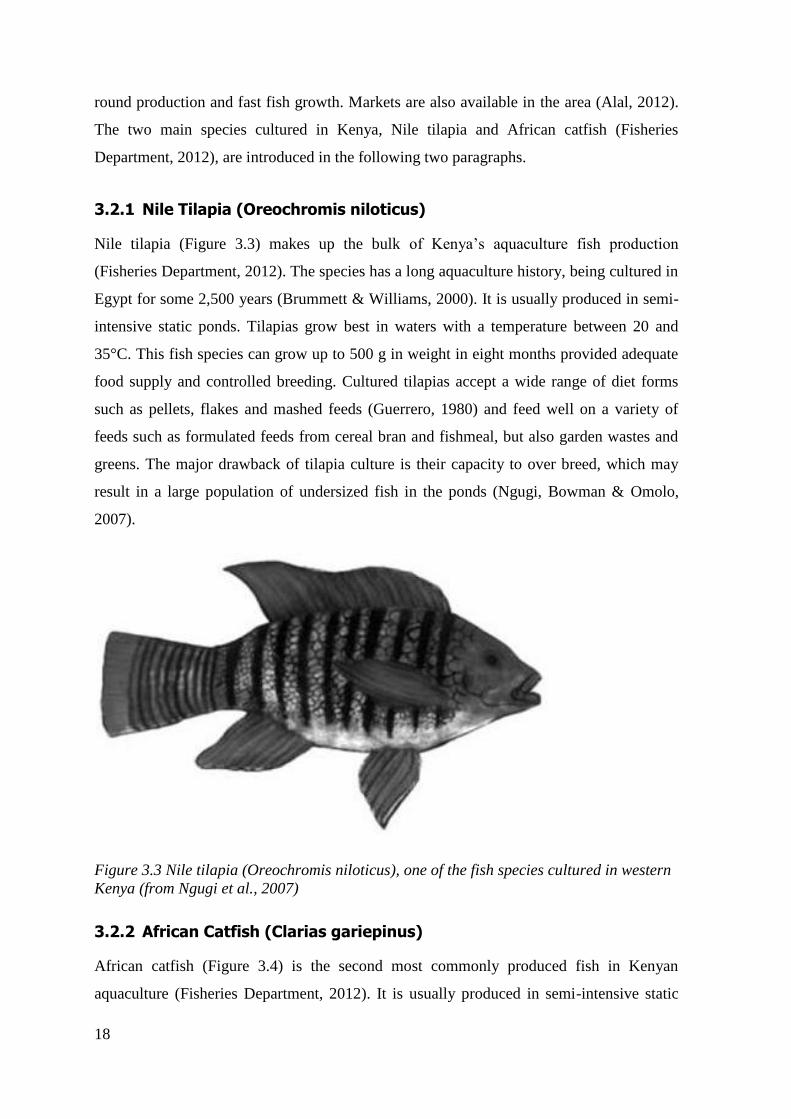
3.2.1 Nile Tilapia (Oreochromis niloticus)
Nile tilapia (Figure 3.3) makes up the bulk of Kenya‟s aquaculture fish production
(Fisheries Department, 2012). The species has a long aquaculture history, being cultured in
Egypt for some 2,500 years (Brummett & Williams, 2000). It is usually produced in semi-
intensive static ponds. Tilapias grow best in waters with a temperature between 20 and
35°C. This fish species can grow up to 500 g in weight in eight months provided adequate
food supply and controlled breeding. Cultured tilapias accept a wide range of diet forms
such as pellets, flakes and mashed feeds (Guerrero, 1980) and feed well on a variety of
feeds such as formulated feeds from cereal bran and fishmeal, but also garden wastes and
greens. The major drawback of tilapia culture is their capacity to over breed, which may
result in a large population of undersized fish in the ponds (Ngugi, Bowman & Omolo,
2007).
Figure 3.3 Nile tilapia (Oreochromis niloticus), one of the fish species cultured in western
Kenya (from Ngugi et al., 2007)
3.2.2 African Catfish (Clarias gariepinus)
African catfish (Figure 3.4) is the second most commonly produced fish in Kenyan
aquaculture (Fisheries Department, 2012). It is usually produced in semi-intensive static
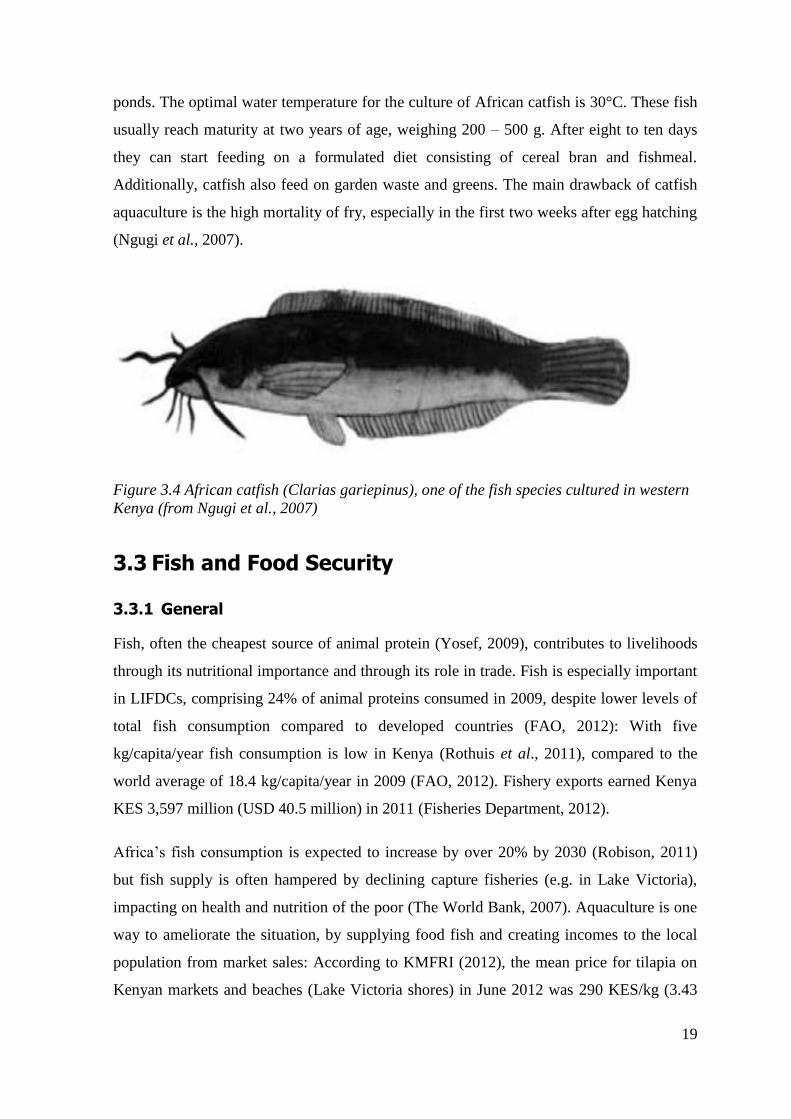
19
ponds. The optimal water temperature for the culture of African catfish is 30°C. These fish
usually reach maturity at two years of age, weighing 200 – 500 g. After eight to ten days
they can start feeding on a formulated diet consisting of cereal bran and fishmeal.
Additionally, catfish also feed on garden waste and greens. The main drawback of catfish
aquaculture is the high mortality of fry, especially in the first two weeks after egg hatching
(Ngugi et al., 2007).
Figure 3.4 African catfish (Clarias gariepinus), one of the fish species cultured in western
Kenya (from Ngugi et al., 2007)
3.3 Fish and Food Security
3.3.1 General
Fish, often the cheapest source of animal protein (Yosef, 2009), contributes to livelihoods
through its nutritional importance and through its role in trade. Fish is especially important
in LIFDCs, comprising 24% of animal proteins consumed in 2009, despite lower levels of
total fish consumption compared to developed countries (FAO, 2012): With five
kg/capita/year fish consumption is low in Kenya (Rothuis et al., 2011), compared to the
world average of 18.4 kg/capita/year in 2009 (FAO, 2012). Fishery exports earned Kenya
KES 3,597 million (USD 40.5 million) in 2011 (Fisheries Department, 2012).
Africa‟s fish consumption is expected to increase by over 20% by 2030 (Robison, 2011)
but fish supply is often hampered by declining capture fisheries (e.g. in Lake Victoria),
impacting on health and nutrition of the poor (The World Bank, 2007). Aquaculture is one
way to ameliorate the situation, by supplying food fish and creating incomes to the local
population from market sales: According to KMFRI (2012), the mean price for tilapia on
Kenyan markets and beaches (Lake Victoria shores) in June 2012 was 290 KES/kg (3.43
20
USD/kg) and 191 KES/kg (2.26 USD/kg), respectively. Kenya‟s marketing potential for
fish is high with the GoK actively promoting its consumption for health reasons (EPZA,
2005).
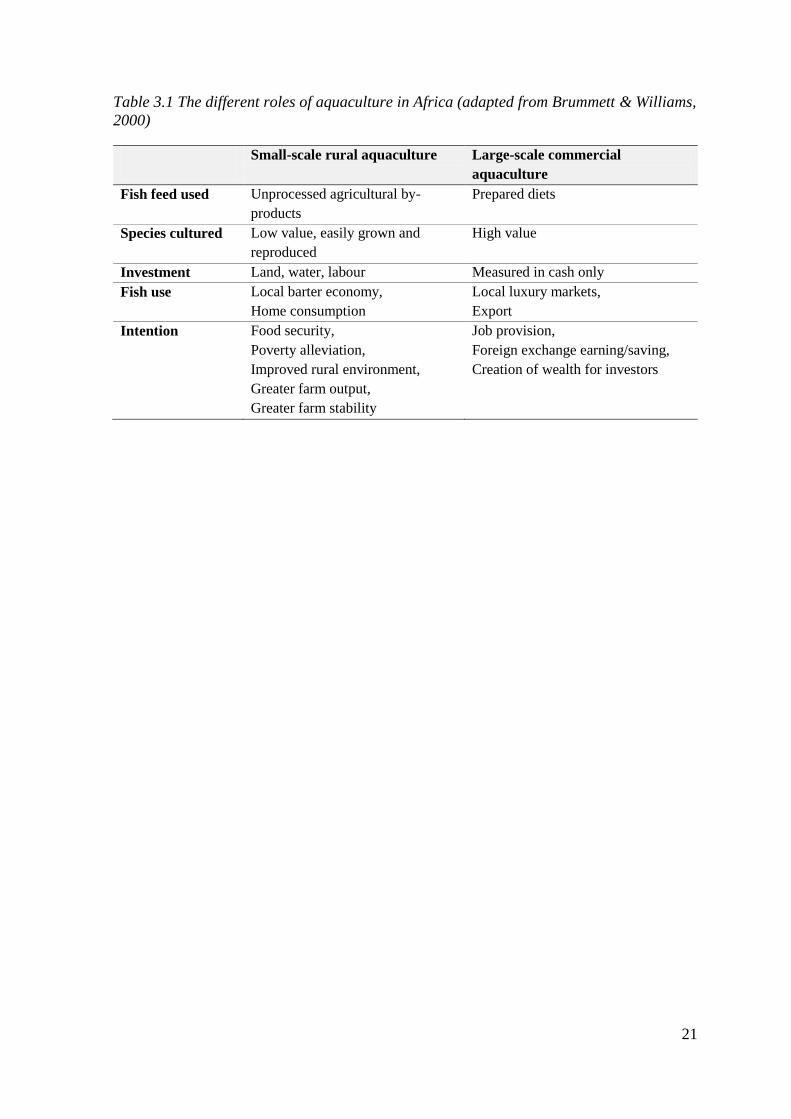
3.3.2 Aquaculture for Food Security
Aquaculture is divided into small-scale rural and large-scale commercial activities. It can
contribute to food security and poverty alleviation both directly by providing food fish, and
indirectly by job- and income-creation (Table 3.1). For small-scale rural aquaculture these
contributions are, however, rather small (Hishamunda, Cai & Leung, 2009; Brummett &
Williams, 2000). Small-scale aquaculture is further divided into subsistence (least
commercialized form, production mainly for home-consumption) and artisanal farming
(slightly more commercialized, also production for local markets). It is most often
integrated with agriculture: Nutrient-inputs for fish farms in inland areas are likely to
originate from the farm and prospective fish farmers often already farm livestock and/or
crops. . This allows each element in a rural farm set up to benefit from each other. Usually
an extensive or semi-intensive low-cost production technology appropriate to the available
resource-base is applied (FAO, 1997). This integrated approach of aquaculture
development is usually more environmentally and socially sustainable than the rapid and
indiscriminate expansion of commercial aquaculture, which has often led to environmental
degradation and social disruption. Economic problems may be alleviated in the short-term,
but the intervention is probably unsustainable in the long-term (Brummett & Williams,
2000).
Before 2007 aquaculture in Kenya was mainly a subsistence activity. Realizing the above-
stated potentials of fish farming the GoK started subsidizing aquaculture
commercialization (see section 4). However, in 2011 fish farming was mainly practiced by
smallholders producing around three tonnes/ha; the number of intensive commercial farms
and aquaculture employment creation in Kenya was still limited. The contribution of
intensive fish production systems is expected to contribute far more significantly in the
future (Rothuis et al., 2011).
21
Table 3.1 The different roles of aquaculture in Africa (adapted from Brummett & Williams,
2000)
Small-scale rural aquaculture Large-scale commercial
aquaculture
Fish feed used Unprocessed agricultural by-
products
Prepared diets
Species cultured Low value, easily grown and
reproduced
High value
Investment Land, water, labour Measured in cash only
Fish use Local barter economy,
Home consumption
Local luxury markets,
Export
Intention Food security,
Poverty alleviation,
Improved rural environment,
Greater farm output,
Greater farm stability
Job provision,
Foreign exchange earning/saving,
Creation of wealth for investors

23
4 Extension Services and Support Mechanisms for Aquaculture in Kenya
4.1 Aquaculture Extension in Kenya
The information in this section relies to a large extent on an FAO report by Ngugi and
Manyala (2004). This document is the only report presenting information about
aquaculture extension services in Kenya in a holistic manner, and describing aquaculture
development in the country since its beginning.
One of the GoK‟s major development aims is to introduce/improve alternative, sustainable,
low-cost family and community initiatives with the perspective of (1) increasing protein
availability for domestic use, (2) generating income and (3) reducing poverty. One such
initiative is to boost protein production from the fisheries and aquaculture sub-sectors
(Ngugi & Manyala, 2004). Government agents and other stakeholders, especially in rural
and semi-urban communities, have campaigned a lot for the promotion of aquaculture
since the early 2000s (Manyala, 2011).
4.1.1 Public Sector and Institutional Linkages
The Kenyan Fisheries Department (FD) in the Ministry of Fisheries Development (MoFD)
assures that fisheries programmes meet the needs of the Kenyan public and the industry by
interacting closely with stakeholders. It is responsible for the administration of fisheries
and aquaculture including enforcement of fisheries regulations, collecting and reporting
statistics, licensing, fish quality assurance and control of imports and exports. Regional
development authorities, like the Lake Basin Development Authority (LBDA), have direct
charge over definite areas, complementing the FD rather than overlapping with its
responsibilities. The degree to which the FD can fulfil its responsibilities depends to a
great extent on available manpower and research from Kenya Marine and Fisheries
Research Institute (KMFRI) and Kenya Agricultural Research Institute. The FD works
closely with multiple international development agencies, NGOs and individuals in order
to promote aquaculture in the country. The LBDA was established in 1979 with its
24
headquarters in Kisumu (city). The KMFRI is dedicated to scientific research in the sectors
of aquaculture, marine and inland fisheries as well as related basic research on aquatic
ecology and fish biology. They also engage in transfer and dissemination of research
findings to farmers. The Department of Fisheries at Moi University (Eldoret, Rift Valley
province) was founded in 1990. Its objectives are oriented to community outreach and
include education and training and are otherwise similar to those of KMFRI (Ngugi &
Manyala, 2004).
4.1.2 Non-Governmental Organisations
The following NGOs are either interested in or actively associated with aquaculture
extension in different parts of Kenya: INADES (Institut Africain pour le Développement
Economique et Social), Catholic Church, Action Aid, Africa Now, Intermediate
Technology Development Group, Netwas International, World Vision and Plan
International. Among the most prominent NGOs involved in aquaculture extension
services in Kenya is the US Peace Corps (the first organization to transfer fish farming
technology to the grass root level). As of 2004 most NGOs had reduced their participation
in aquaculture extension services (Ngugi & Manyala, 2004).
4.2 History of Aquaculture Extension in Kenya
Small-scale aquaculture in Kenya expanded in the 1960s during the GoK´s ´Eat more Fish´
campaign. Extension services, however, were thinly spread and farmers failed to reap the
benefits (Ngugi & Manyala, 2004). The GoK‟s efforts still resulted in the rapid spread of
rural Nile tilapia ponds in western Kenya. However, most of them were small and
neglected or abandoned in the 1970s due to poor yields, the lack of technical expertise and
quality fingerlings and low-level extension services (Okechi, 2004). The need for effective
and sustained extension services to support and improve the productivity of rural fish
ponds in Kenya became clear (Ngugi & Manyala, 2004).
In the 1980s the GoK was able to engage various donors and NGOs aiming to rehabilitate
several thousand rural fish ponds that had been abandoned. One region given particular
attention was western Kenya because of its high aquaculture potential and its already
existing organized extension structure under the LBDA. Pond constructions, involving
women, development issues and training activities were also taken care of. Success was
25
scarce though: Ten thousand ponds existed in Kenya‟s central and western regions in 1989,
but only 967 were actively managed. Their total annual production was only around 65
tonnes (Ngugi & Manyala, 2004); compared to around 1,000 tonnes/year countrywide
(FAO, 2013b).
In the 1990s further aquaculture extension programmes were undertaken by the
Department of Fisheries at Moi University in order to carry out on-farm trials in Kenya‟s
central and western regions. This brought together FD extension officers, farmers and
academic researchers striving to commercialize small-scale fish farming. This programme
resulted in higher tilapia and catfish yields through improved management approaches.
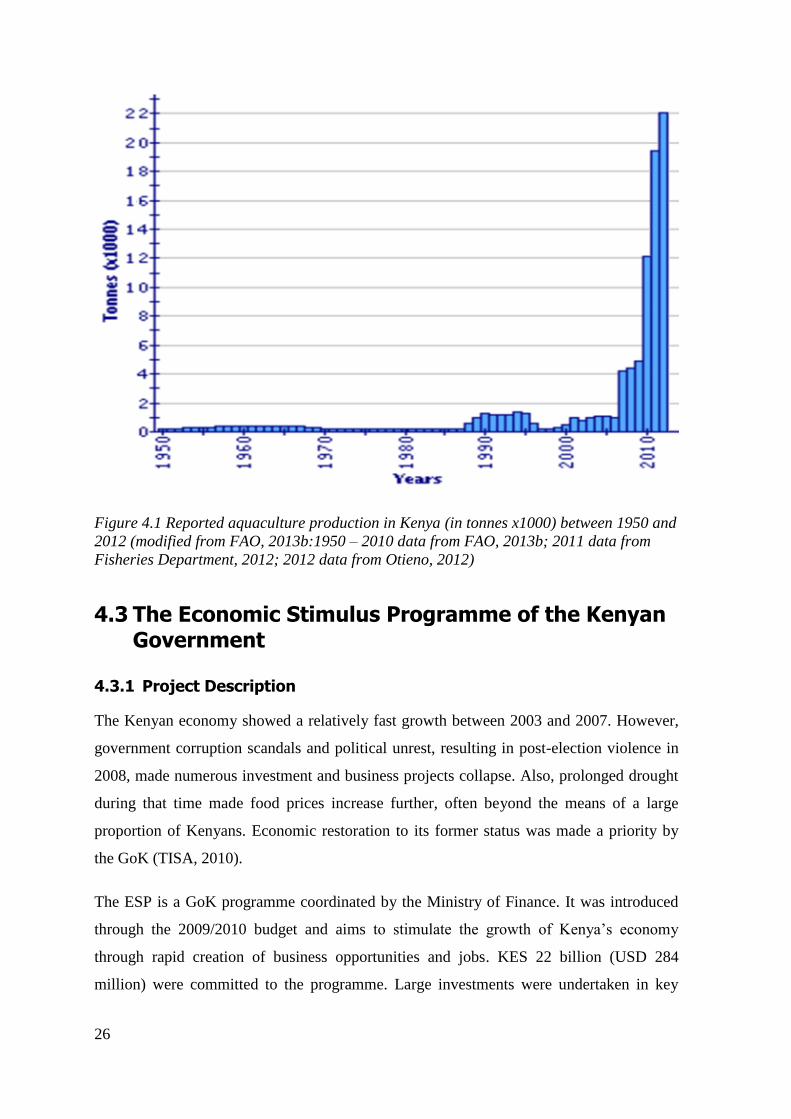
However, countrywide cultured fish production lingered at around 1,000 tonnes/year until
2007 (Figure 4.1). Only a few donors were supporting aquaculture extension in Kenya, and
government support was insufficient. Staff salaries consumed a large portion of the
operating budgets and a big share of project funding was taken by expatriate consultants
(Ngugi & Manyala, 2004).
The only institution which had attempted to provide a revolving credit facility for fish
farmers in Kenya in 2004 was LBDA, targeting mainly individuals and groups already
involved in small-scale aquaculture, fish feed or fingerling production. Even though
private sector aquaculture development in Kenya had mainly been in the form of
agriculturally integrated small-scale rural projects, a number of investors had ventured into
more commercial fish farming practices in the early 2000s (Ngugi & Manyala, 2004).
In 2007 the GoK attempted to stimulate aquaculture through the development of high
quality fingerlings and feeds, and the introduction of training programmes (Mbugua,
2008b) making Kenya a noteworthy aquaculture producer in East Africa (FAO, 2012):
Fish production increased exponentially, reaching more than 4,000 tonnes (Figure 4.1).
This growth can be explained by increasing commercialization of aquaculture by
government policies (Rothuis et al., 2011). However, the lack of proper pond management
and coherent government policies were still hampering a further increase of aquaculture
production (Mbugua, 2008b). According to Mbugua (2008a) aquaculture needs to be
treated and operated as an enterprise with only one aim to further boost production: The
creation of economic gains for investors. This is where the GoK‟s ESP comes into play.
26
Figure 4.1 Reported aquaculture production in Kenya (in tonnes x1000) between 1950 and
2012 (modified from FAO, 2013b:1950 – 2010 data from FAO, 2013b; 2011 data from
Fisheries Department, 2012; 2012 data from Otieno, 2012)
4.3 The Economic Stimulus Programme of the Kenyan Government
4.3.1 Project Description
The Kenyan economy showed a relatively fast growth between 2003 and 2007. However,
government corruption scandals and political unrest, resulting in post-election violence in
2008, made numerous investment and business projects collapse. Also, prolonged drought
during that time made food prices increase further, often beyond the means of a large
proportion of Kenyans. Economic restoration to its former status was made a priority by
the GoK (TISA, 2010).
The ESP is a GoK programme coordinated by the Ministry of Finance. It was introduced
through the 2009/2010 budget and aims to stimulate the growth of Kenya‟s economy
through rapid creation of business opportunities and jobs. KES 22 billion (USD 284
million) were committed to the programme. Large investments were undertaken in key
27
sectors of the economy, namely education, health and sanitation, food production,
environment, local government, industrialisation and fisheries/aquaculture. Aquaculture is
identified as a key pillar in the production sector (TISA, 2010). Rothuis et al. (2011) state
that observed economic growth can be attributed, at least partially, to this programme.
However, many initiatives such as the ESP were doomed to failure due to corruption, poor
project planning or failure to involve citizens in local development. By the end of 2010,
several ESP projects that were supposed to have been funded had either not commenced or
were incomplete as a result of slow implementation and poor planning. Citizens‟
involvement in ESP projects is not adequately provided for by the ESP governance
structure. Hence, there is low community involvement and awareness in the ESP funded
projects. The poor information flow on the progress of the ESP projects also leads to only a
few people knowing about the existence of the full fund. Many people are not fully aware
of the assigned projects and objectives of the programme. Also reported is consistent
confusion between different sources of funding and that projects are misplaced and
therefore do not meet the priorities of particular regions (TISA, 2010).
4.3.2 The Economic Stimulus Programme and Aquaculture
Description of Implementation
Aquaculture commercialization was incorporated into the ESP by the MoFD in 2009
(Manyala, 2011) in order to improve nutrition, alleviate poverty and create over 120,000
employment opportunities (TISA, 2010). It promotes Nile tilapia and African catfish
culture in western, eastern and central Kenya, parts of Rift Valley and the coastal regions
(Fisheries Department, 2012). However, both species are not farmed in all counties
(MoFD, email, September 26th
, 2012). Fish pond construction costs as well as the costs for
feeds and fingerlings are subsidised by the programme. Additionally, governmental
infrastructure supporting the aquaculture sub-sector, i.e. training, research farms and
extension officers, is in place (Hino, 2011).
In Phase 1, starting in 2009, the construction of 28,000 fish ponds (Hino, 2011) at 300 m2
each (Rothuis et al., 2011) was funded, i.e. 200 fish ponds in 140 constituencies at a total
cost of KES 1,120 million (USD 14.5 million) (TISA, 2010). Each of these ponds is
expected to produce at least 270 kg of fish/year (Muiruri, 2010). Phase 2 of the project
started in late 2010 with an additional USD 37.5 million investment to increase the number
28
of fish ponds countrywide to 48,000 (Hino, 2011). As of November 2012 the GoK had
invested KES 5,600 million (USD 66.2 million) in aquaculture development over the
previous three financial years (Alal, 2012). GoK subsidies on pond construction ended in
2011, feed subsidies were gradually decreased from 100% in 2010 to 25% in 2012
(Rothuis et al., 2011).
Kenyan Aquaculture Production since 2009
Cultured fish production in Kenya increased exponentially with the availability of ESP
support (Figure 4.1): During the year 2009 a total of 4,895 tonnes of cultured fish was
harvested. In 2010 a 12,153 tonnes yield of cultured fish was reported. In 2011 19,584
tonnes of farmed fish were produced in approximately 46,000 ponds, creating employment
for almost 49,000 farmers. Farmed fish comprised 12% of fish production in the same year
(Figure 3.1), creating about KES 4,223 million (USD 48 million) for the farmers (Fisheries
Department, 2012). Aquaculture production in 2012 reached 22,000 tonnes (Otieno, 2012).
In 2010 Kenya was Africa‟s number four aquaculture producer, with 0.94% share of
Africa‟s farmed fish production (FAO, 2012). On a global scale, however, aquaculture
production in Kenya is still insignificant (Rothuis et al., 2011). Fish farmers are active in
all Kenyan provinces, apart from the North Eastern province and Nairobi area (Manyala,
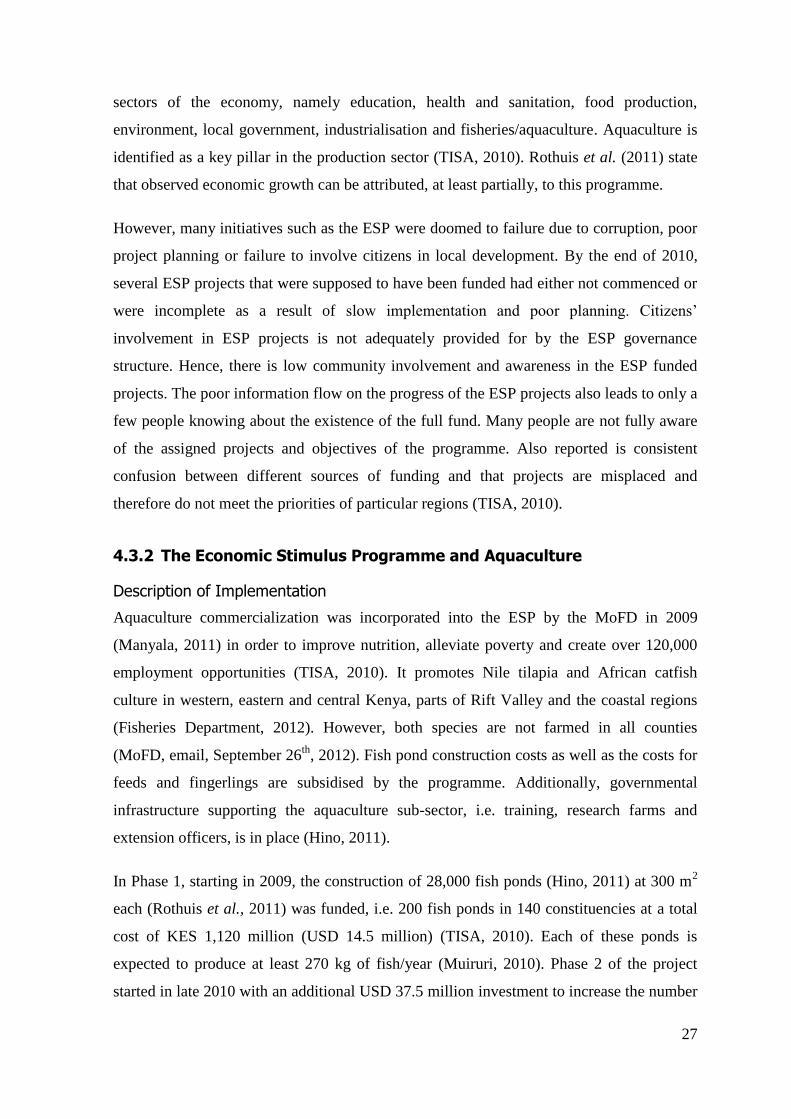
2011). In 2011 the bulk of cultured fish production came from Nile tilapia, followed by
African catfish, Common carp and Rainbow trout (Figure 4.2) (Fisheries Department,
2012). Other farmed species include Koi carp, Black bass and Gold fish, but these only
contribute insignificantly to the total (Manyala, 2011).
29
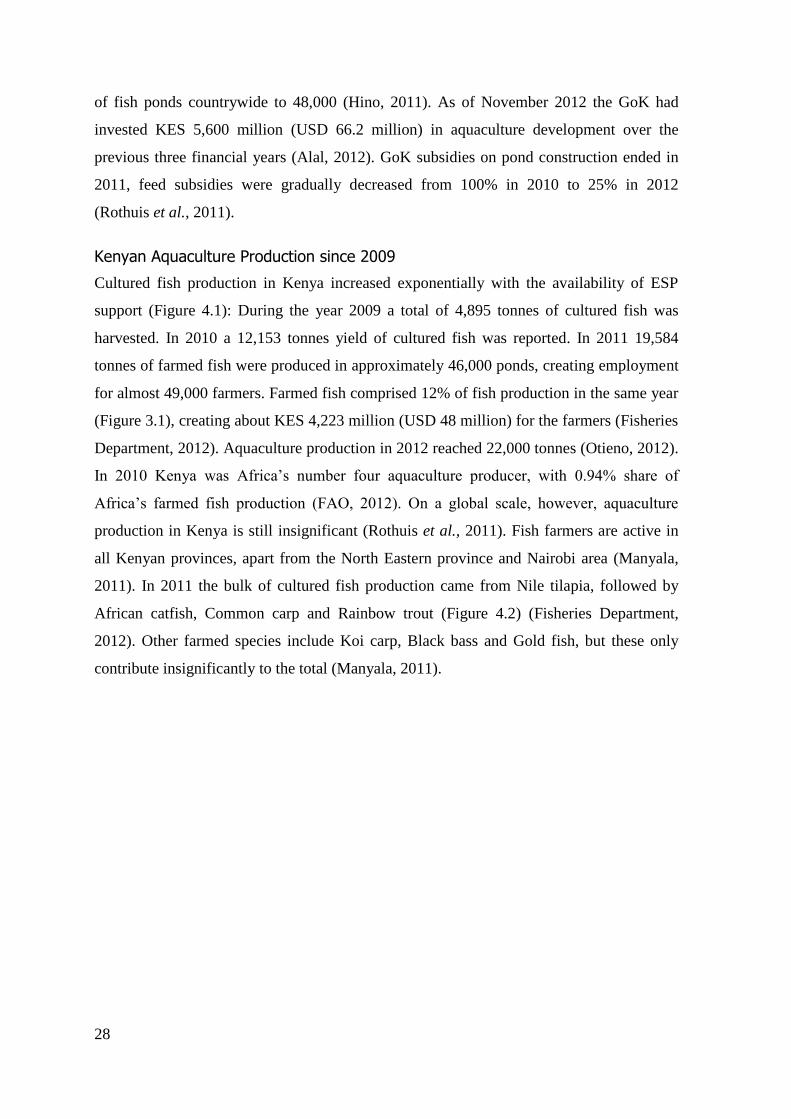
Figure 4.2 Aquaculture production in Kenya (in % and tonnes) by species in 2011 (data
from Fisheries Department, 2012)
Tables 4.1 and 4.2 present an overview of the aquaculture situation in the Vihiga, Homa
Bay and Kisumu counties. Comparing available pond numbers, number of ponds stocked
and harvested gives an idea about the success of ESP-supported aquaculture in the three
counties.
Table 4.1 Nile tilapia (Oreochromis niloticus) and African catfish (Clarias gariepinus)
aquaculture statistics for Vihiga county and Kenya‟s Western province in total as of 31st of
December, 2011 (from MoFD, email, September 26th
, 2012)
Vihiga County Western Province (Total)
No. of Fish Farmers 1,667 11,684
No. of Fish Ponds 2,065 13,159
Area of Ponds (m2) 619,500 2,817,025
No. of Ponds Stocked 400 (sic) 5,744
Area of Ponds Stocked (m2) 120,000 1,653,400
No. of Ponds Harvested 513 (sic) 3,614
Area of Ponds Harvested (m2) 153,900 1,058,050
75
18 6
1
Niletilapia (14,689 t)
African catfish (3,525 t)
Common carp (1,175 t)
Rainbow trout 186 t)
30
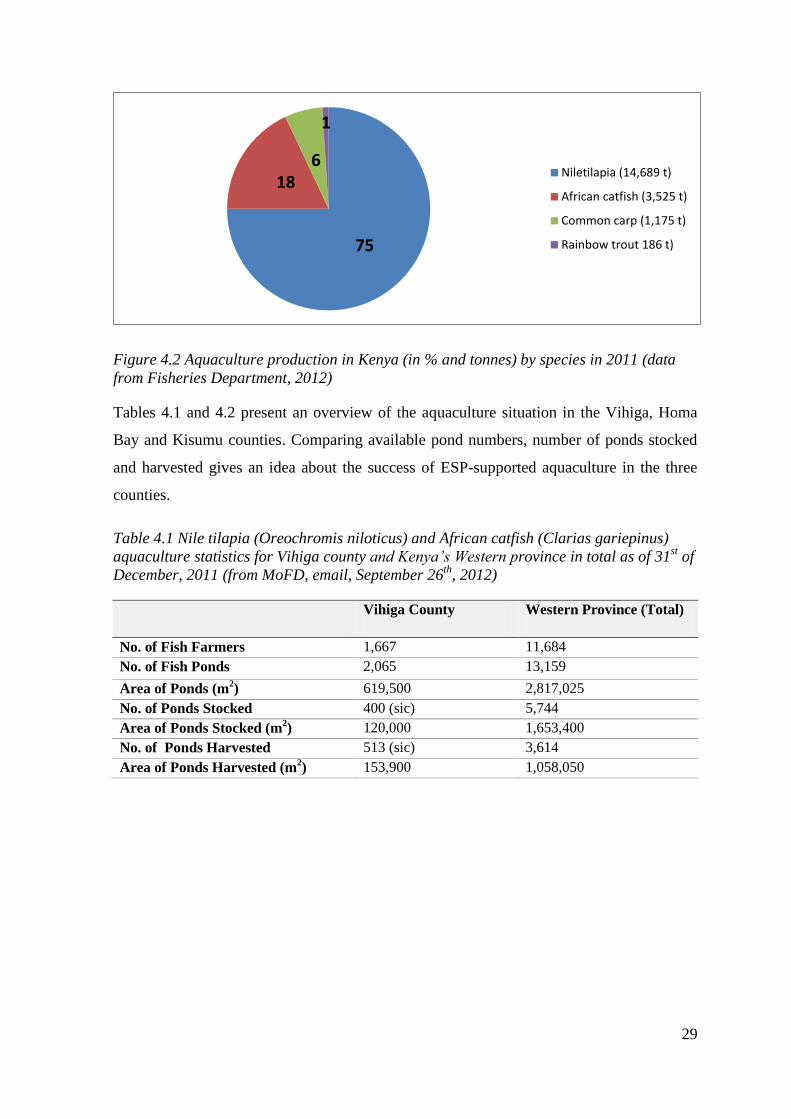
Table 4.2 Nile tilapia (Oreochromis niloticus) and African catfish (Clarias gariepinus)
aquaculture statistics for the Homa Bay and Kisumu counties, and Kenya‟s Nyanza
province in total as of 31st of December, 2011 (from MoFD, email, September 26
th, 2012)
Homa Bay
County
Kisumu
County
Nyanza
Province
(Total)
No. of farmers 614 977 10,429
No. of ponds 621 1,038 11,587
Area of ponds (m2) 66,300 303,316 (sic) 3,087,244
No. of ponds stocked 621 993 6,902
Area of ponds stocked (m2) 66,300 316,171 (sic) 1,731,954
No. of ponds harvested 94 216 3,257
Area of ponds harvested (m2) 28,200 135,765 901,364
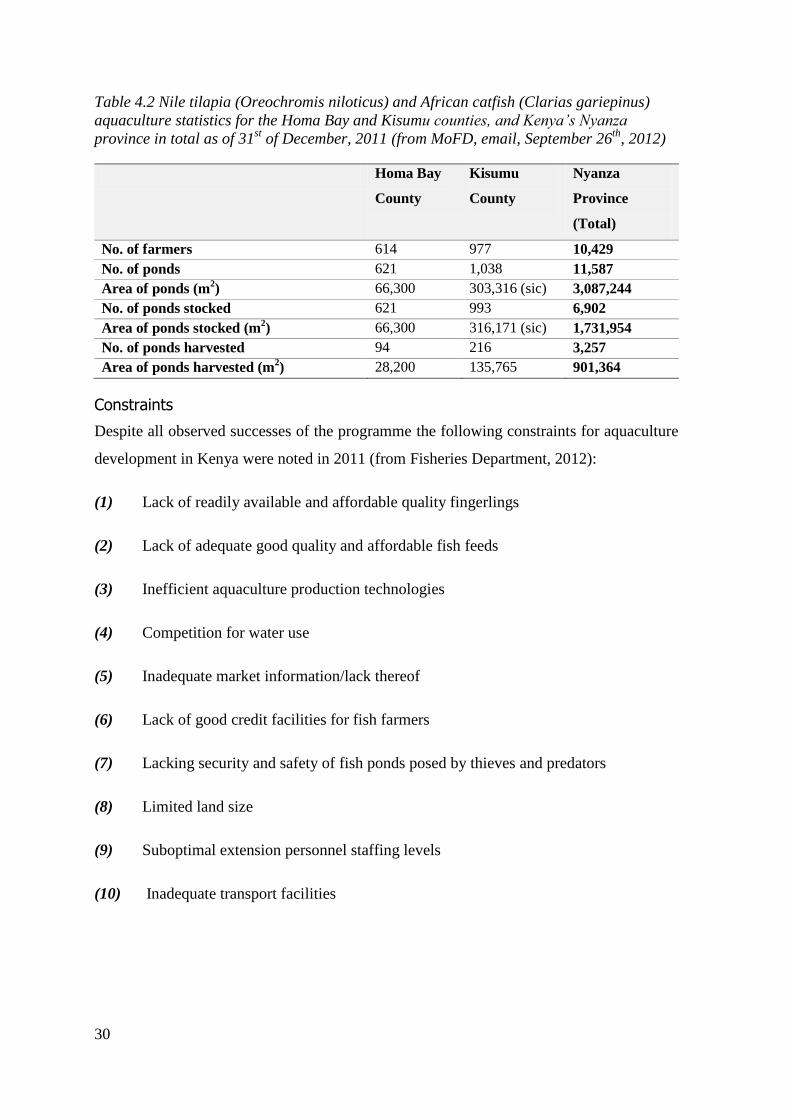
Constraints
Despite all observed successes of the programme the following constraints for aquaculture
development in Kenya were noted in 2011 (from Fisheries Department, 2012):
(1) Lack of readily available and affordable quality fingerlings
(2) Lack of adequate good quality and affordable fish feeds
(3) Inefficient aquaculture production technologies
(4) Competition for water use
(5) Inadequate market information/lack thereof
(6) Lack of good credit facilities for fish farmers
(7) Lacking security and safety of fish ponds posed by thieves and predators
(8) Limited land size
(9) Suboptimal extension personnel staffing levels
(10) Inadequate transport facilities
31
Future Outlook
Tying in with the work done by the ESP, the MoFD is partnering with Israel and Germany
to further boost aquaculture production in Kenya and make it the key income generation
for smallholder farms. The programme includes professional fish farming training. This
trilateral tilapia value chain programme runs for two years (August 2012 – June 2014) and
aims to eradicate poverty by creating alternative livelihoods (i.e. aquaculture) for
communities around Lake Victoria and to thereby enhance sustainable protection of the
lake‟s environment (Israel Diplomatic Network, 2012).
4.4 Literature Review
4.4.1 Livelihoods and Aquaculture
Aquaculture is one way to provide communities with improved nutrition through the
provision of valuable fish protein (e.g. FAO, 2012). In their study in Malawi, Dey et al.
(2006) for example established that in households with fish ponds home-produced fish was
consumed more frequently than in households without fish ponds. This trend is, however,
not always observed: Thompson, Roos, Sultana and Thilsted (2002) showed that 32% of
the surveyed households in Bangladesh never consumed the fish they produced. Another
study in Bangladesh also observed that fish from the fish farmers´ own ponds only
contribute 1-11% of fish consumed at household level and that fish bought from local
markets were the single most important source of fish consumed locally for both,
households with and without fish ponds (Kawarazuka & Bene, 2010). The production of
´cash crops´, not ´food crops´ seems to be, according to Kawarazuka and Bene (2010) the
general perception of many smallholder fish farms.
Through employment and income generation from aquaculture, and subsequent higher
purchasing power, fish farming households often manage to improve their diets through
increased food accessibility. Dey et al. (2006)´s study in Malawi for example found that
the income of households owning fish ponds was 1.5 times higher than that of households
without fish ponds. Furthermore, it seems particularly successful to combine aquaculture
with other activities: Profits of fish farmers who combined aquaculture with rice farming
almost doubled (Kawarazuka & Bene, 2010; Aiga et al., 2009).
32
Certain food products, e.g. meat and fish, are possibly bought more frequently because of a
better income situation of the farmers through aquaculture. Several recent studies highlight
this trend: Household incomes from aquaculture increase the consumption of staple foods
(Jahan, Ahmed & Belton, 2010) and foods from animal sources (Dey et al., 2006;
Alderman, 1986), increasing the total energy intake of the fish farming households
(Kawarazuka & Bene, 2010). Another reason for often observed increases in meat
consumption could be that farmers, through incomes from aquaculture, have more money
to keep livestock on their farms for home consumption: Neiland, Jaffry, Ladu, Sarch and
Madakan (2000) for example show in a study in north-east Nigeria that increased income
(from fishing, however) was used as input for farming resulting in the fishing households
to have a higher farm-productivity. The increased availability of farmed produce was not,
however, definite evidence for better or greater amounts of food intake: Von Braun, Bouis,
Kumar and Pandya-Lorch (1992) established that additional incomes may be spent on
foods of low nutritional value or on non-food items.
Overall, the need for food of the poor would, without income increase initiated by fish
farming, possibly never be translated into an effective demand for food. Food availability
is increased either immediately through the selling of fish on the domestic markets or later
with food imports through foreign exchange earned through aquaculture. Hishamunda and
Ridler (2006) show this aspect in their case study in Zimbabwe, where commercial tilapia
farms provide jobs and incomes to farmers in an impoverished region.
Aquaculture also creates employment for underprivileged groups, e.g. women and young
people (Hino, 2011; Jagger & Pender, 2001). Women and children are mainly involved in
pond management activities such as feeding, fertilization, predator control. Women also
take care of value-adding post-production techniques. However fish ponds are mainly
owned by men. In Kenya women predominate in the fish processing and marketing sectors
(Hino, 2011). Jagger and Pender (2001) suggest that women should be more actively
integrated into extension practices. The importance of women participation I aquaculture is
stressed by Weeratunge, Snyder and Sze (2010): Gender disparities not only affect the
livelihoods of women themselves, but also livelihoods of the entire household and
community. According to these authors the aquaculture sector “might well turn out to be a
female sphere” (Weeratunge et al., 2010, 405) if gleaning and post-harvesting are
accounted for.
33
In order for aquaculture to improve livelihoods in the long-term, integrated agriculture-
aquaculture practices may be the way forward. Dey et al. (2006) for example established
that low soil fertility and water availability, the two major constraints to crop production
on small-scale farms in Malawi, were at least partially overcome by the role of fish ponds
in nutrient recycling and water storage. Overall farm-output for home-consumption and
income creation may hence be increased. Also, organic farm by-products and wastes, like
manure, greens and garden/kitchen waste, are used in integrated systems (Dey et al., 2006).
Aquaculture has also been shown to indirectly improve livelihoods. As a valuable
alternative for fish production it presents an important environmental role helping to
conserve threatened wild fish species. The importance of this is evident, Bene, Steel,
Luadia and Gordon (2009, 115) for example describe fish from small-scale fisheries in
Congo as “bank in the water” for local communities.
However, it needs to be noted that especially in developing countries record keeping in
aquaculture is often not adequately practiced. Okechi (2004) reports this as a constraint to
aquaculture related research in Kenya.
4.4.2 Subsidies and Extension Services in Aquaculture Development
Over the years, several donor organizations have supported aquaculture development
worldwide to initiate livelihood improvements. Success rates, however, varied greatly.
Looking at these past successes and failures of support activities for aquaculture sheds
light on the necessary for (a) successfully increasing aquaculture production to improve
rural livelihoods and (b) avoiding discontinuation of fish farming or drop-backs to pre-
funding levels after support is stopped.
A commonly accepted fact is that aquaculture support always needs to be applied with
great knowledge of local conditions so as to not have negative environmental and social
consequences (Hishamunda & Ridler, 2006; Brummett & Williams, 2000; Coche, Haight
& Vincke, 1994): If prevailing regional economic conditions, social systems, natural
resource constraints and indigenous knowledge bases are not taken into account
sufficiently, impacts of any support mechanism applied are likely to be negligible in the
long-term. Brummett and Williams (2000) for example show that mass-applications of
aquaculture technologies in Africa are impossible due to the continent‟s wide spectrum of
34
aquaculture systems arising from variable social, environmental and economic conditions.
Another example is capture fisheries in the Senegal River basin, making aquaculture
uncompetitive (Hishamunda & Ridler, 2006). Coche et al. (1994) described the
(unsuccessful) promotion of fish farming in non-fish-eating communities in Kenya.
Complex research to gain understanding of local conditions always needs to be undertaken.
Failure to do so could lead to farms not being able to evolve into more productive systems,
as well as to reluctance among assistance bodies to fund further aquaculture work.
Another important point is that only profitable aquaculture practices can be sustained
without continuous subsidies (Brummett et al., 2011; Hishamunda & Ridler, 2006; Pillay,
1997; Coche et al., 1994). Hence, it is crucial to prepare fish farmers to be self-sufficient
before aquaculture support is ending (Pillay, 1997). This economic reality, however, is
often ignored by donors. In sub-Saharan Africa in the 1970s, for example, less than ten out
of 54 surveyed small-scale farms were found to be self-sustainable after international
donors had departed (Coche et al., 1994). Self-sustainability of fish farms can only be
achieved in regions with an existing infrastructural basis for fish farming, such as access to
markets, administration services and institutional help (Ahmed, 2009). If aquaculture
development is promoted without these services, successes can usually only be recorded
when support is still available to the farmers.
A commonly observed malpractice is that donor-funding often takes place without regard
to market conditions (Hishamunda & Ridler, 2006). This includes the impracticality of
selling cultured fish on (existing) markets (Hishamunda & Ridler, 2006; Coche et al.,
1994; see above) as well as the non-availability or inaccessibility of markets, stated as a
constraint for aquaculture development in Africa by Brummett and Williams (2000):
Improved availability of storage and cooling facilities and better access to the markets
through improved road infrastructure can increase the fish farmers‟ incomes by improving
the marketing of the fish. However, according to Alal (2012) market availability is not a
problem in Kenya´s Lake Victoria region. In their case study of fish farming in Central
Cameroon Brummett et al. (2011) assessed the effects of a five-year participatory
aquaculture extension programme and found that during the programme period fish pond
productivity, the number of active fish farmers and net returns from aquaculture overall
increased. However, success was more significant in areas with good market access.
Within three years of termination of extension support farmers with bad market access had
35
returned to pre-extension production levels. Market access is hence necessary for long-
term successes in aquaculture.
Dey et al. (2006) showed in their case study in Malawi that farmers who adopted supported
fish farming technologies were i.a. recorded to have higher household incomes and a
higher consumption of meat and fish than farmers who did not adopt these technologies.
However, in the long-term the support showed only little success because farmers usually
discontinued fish production as soon as subsidies came to an end (Dey et al., 2006).
Brummet et al. (2011) recorded drop-backs to pre- funding levels of fish production after
subsidies had stopped. In a case study in Bangladesh Ahmed (2009) showed that fish
production efficiency, and hence the chance of self-sustainability, were increased through
extension services and farmer trainings: Both methods are relatively low-cost and can help
reducing risks in aquaculture as well as improve profitability. If self-sustainability cannot
be achieved, investments evidently need to be made to ensure the continuous (and costly)
availability of quality technical assistance to achieve long-term success of aquaculture.
Another way to financially help fish farmers is loan-availability. Loan may help fish
farmers to recuperate from shocks, as well as a starting capital for an aquaculture business.
Quagrainie, Ngugi and Amisah (2010) found in their study about small-scale fish farmers
in Kenya that the level of credit use in fish farming is very low even though the GoK
encourages aquaculture development by offering credit facilities through the government
agricultural finance institution, Agriculture Finance Corporation.
Failure of (donor-funded) aquaculture development may also be introduced simply by
using wrong indicators of success: Hishamunda and Ridler (2006) showed that the plain
amount of fish produced was not sufficient to indicate aquaculture success; production
costs need to be incorporated as well.
Generally, classical top-down approaches of aquaculture support seem to have a lower
success rate than participatory approaches (Dey et al., 2006; Brummett & Williams, 2000;
ALCOM, 1994). The most promising approach of aquaculture development in Africa,
according to Brummett and Williams (2000), is an evolutionary pathway. When
aquaculture is a component of broader, integrated rural development initiatives it is more
likely to be sustained. More and more long-term support is provided by leadership that
comes from local initiatives rather than being imposed from outside by development
36
agencies (Brummett & Williams, 2000; ALCOM, 1994). Through this practice both the
needs of rural communities and rural budgets can be met eventually. Successful
aquaculture industries in Norway, Scotland, Israel, South Africa and the USA have
followed such pathways: From the beginning, small-scale fish producers worked closely
with universities and/or government researchers to improve output and markets over time.
Government policies and assistance followed in most cases. As the fish farmers, over time,
gain a greater understanding of the functioning and potential of certain aquaculture
techniques, they will become increasingly able to guide further evolution towards greater
productivity and profitability (Brummett & Williams, 2000). ALCOM (1994) found that
farmers who started aquaculture on their own or through local initiatives, rather than being
imposed from outside, may also be more aware of the importance of trainings to improve
their fish farming business in order to be successful.
37
5 Research Methodology
5.1 Conducting Interviews
5.1.1 Questionnaire Development
Following my interest in food security, poverty alleviation and aquaculture in developing
countries I started an online search for a suitable topic for my thesis project in December
2011. I found a project on tilapia aquaculture in Kenya through the German Development
Agency (GIZ, Deutsche Gesellschaft für Internationale Zusammenarbeit). It followed a
period of consulting the available literature on alleviating food insecurity and poverty
through fish farming in general, as well as on aquaculture development in Kenya. My
literature search was mainly done through online databases and using documents sent to
me by a GIZ employee. Through discussions with GIZ and MoFD employees, as well as
through knowledge gained by consulting the available literature, I came up with my
research questions and a timeframe for the project.
After consulting Bernard (2006) I decided on conducting formal, face-to-face interviews,
using a structured survey questionnaire. All respondents answered the same set of
questions. The rationale is that in structured interviews, and especially in those using
questionnaires, the input that triggers peoples´ responses is controlled, so that outputs can
be reliably compared (Bernard, 2006). Appendix A presents the study questionnaire. The
interviews followed the structure of the questionnaire and were divided into five sections:
(1) General information – Farm characteristics and demographics, (2) support mechanisms
used, (3) farm wealth, (4) livelihood changes and (5) future perspectives. However, I also
recorded information volunteered by the farmers, as suggested by Marshall and Rossman
(2011), since it is the respondents‟ – not the researchers‟ – perspective that is needed. I
recorded the information (writing down the comments) during the interview and later
incorporated them into my sorting of the data and analysis of results.
I started designing the questionnaire in March 2012 and used both quantitative and fixed-
choice and open-ended short-answer questions. This approach is suggested by Bernard
38
(2006) to create insight and understanding of the topic. After consulting the literature on
past studies I came up with 37 questions for my questionnaire. I organized them into a
logical sequence, leading the conversation from rather simple (e.g. number of ponds) to
more complex questions (e.g. future perspectives). Bernard (2006) recommends this order
to gain the trust of the respondents and also to get the conversation ‟flowing‟ before the
subjects become more difficult.
I developed my questionnaire by consulting the literature and discussing the questions with
GIZ and MoFD employees. The questionnaire went through several versions before it was
ready to be taken to the field. Following the example of Ahmed (2009) I checked my
questionnaire for weaknesses by doing a few test runs after arriving in Kenya: I asked fish
farmers to answer the questions, attentively trying to find ambiguities. The results of these
test-runs were not incorporated into the results of this study. I noticed that I had to simplify
and especially shorten my questionnaire. Changes were incorporated into the questionnaire
before testing it again. I conducted five such test-runs. With the resulting set of questions I
conducted 60 interviews of qualitative nature, only applying small changes occasionally.
These changes mainly concerned the use of different wordings to clarify poor
understandings.
My questionnaire was later used as a basis for the GIZ‟s project „Analysis of a Baseline
Data Collection Conducted within the framework of the Trilateral Cooperation between the
Republic of Kenya, the State of Israel and the Federal Republic of Germany to improve the
Tilapia value chain in the north-western region of Kenya‟ (Manyala, in press) to achieve
their objective of protecting Lake Victoria‟s environment and eradicating poverty by
creating alternative livelihoods for communities living adjacent to the lake. The results of
this quantitative research project were not available at the time of writing this thesis project
report, and could hence not be incorporated.
5.1.2 Interviews
I conducted the interviews between August 31st, 2012 and September 24
th, 2012. Each
interview lasted for 30 to 45 minutes. Even though Bernard (2006) recommends using a
voice recorder in all structured and semi-structured interviews, except where people
disapprove, I decided to not use voice recording devices to avoid reluctance of the
interviewees. Most questions were multiple-choice style; other questions only required
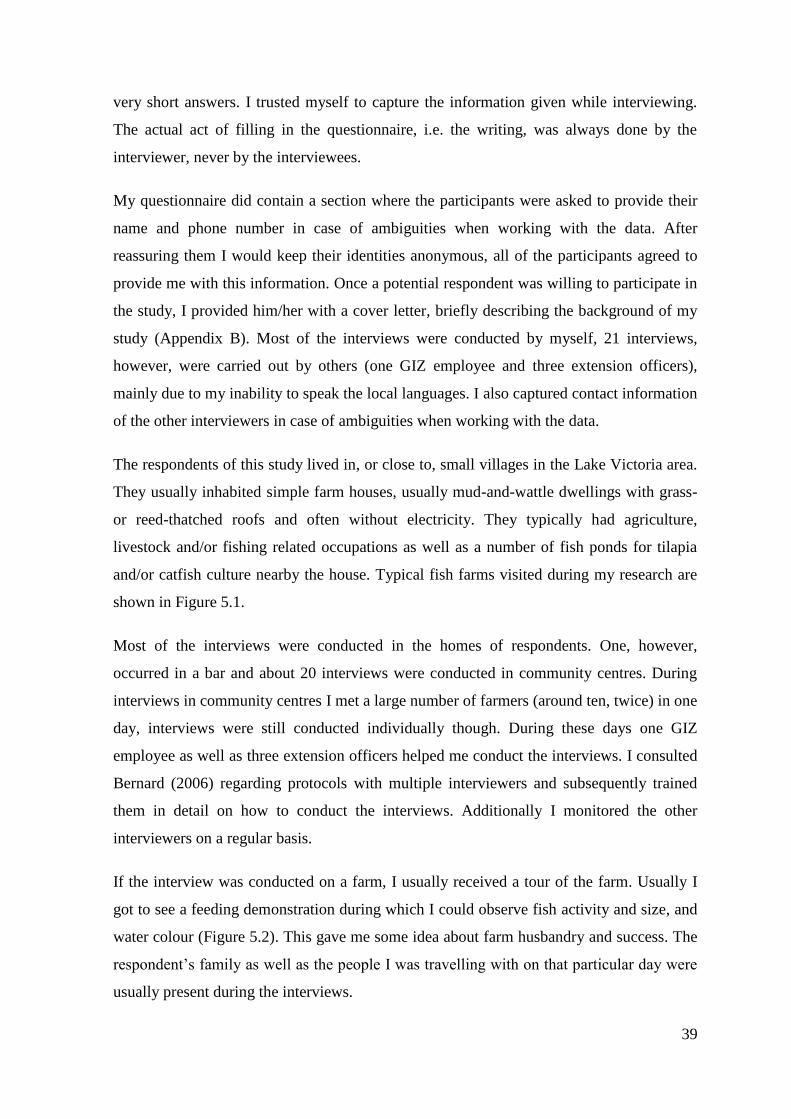
39
very short answers. I trusted myself to capture the information given while interviewing.
The actual act of filling in the questionnaire, i.e. the writing, was always done by the
interviewer, never by the interviewees.
My questionnaire did contain a section where the participants were asked to provide their
name and phone number in case of ambiguities when working with the data. After
reassuring them I would keep their identities anonymous, all of the participants agreed to
provide me with this information. Once a potential respondent was willing to participate in
the study, I provided him/her with a cover letter, briefly describing the background of my
study (Appendix B). Most of the interviews were conducted by myself, 21 interviews,
however, were carried out by others (one GIZ employee and three extension officers),
mainly due to my inability to speak the local languages. I also captured contact information
of the other interviewers in case of ambiguities when working with the data.
The respondents of this study lived in, or close to, small villages in the Lake Victoria area.
They usually inhabited simple farm houses, usually mud-and-wattle dwellings with grass-
or reed-thatched roofs and often without electricity. They typically had agriculture,
livestock and/or fishing related occupations as well as a number of fish ponds for tilapia
and/or catfish culture nearby the house. Typical fish farms visited during my research are
shown in Figure 5.1.
Most of the interviews were conducted in the homes of respondents. One, however,
occurred in a bar and about 20 interviews were conducted in community centres. During
interviews in community centres I met a large number of farmers (around ten, twice) in one
day, interviews were still conducted individually though. During these days one GIZ
employee as well as three extension officers helped me conduct the interviews. I consulted
Bernard (2006) regarding protocols with multiple interviewers and subsequently trained
them in detail on how to conduct the interviews. Additionally I monitored the other
interviewers on a regular basis.
If the interview was conducted on a farm, I usually received a tour of the farm. Usually I
got to see a feeding demonstration during which I could observe fish activity and size, and
water colour (Figure 5.2). This gave me some idea about farm husbandry and success. The
respondent‟s family as well as the people I was travelling with on that particular day were
usually present during the interviews.
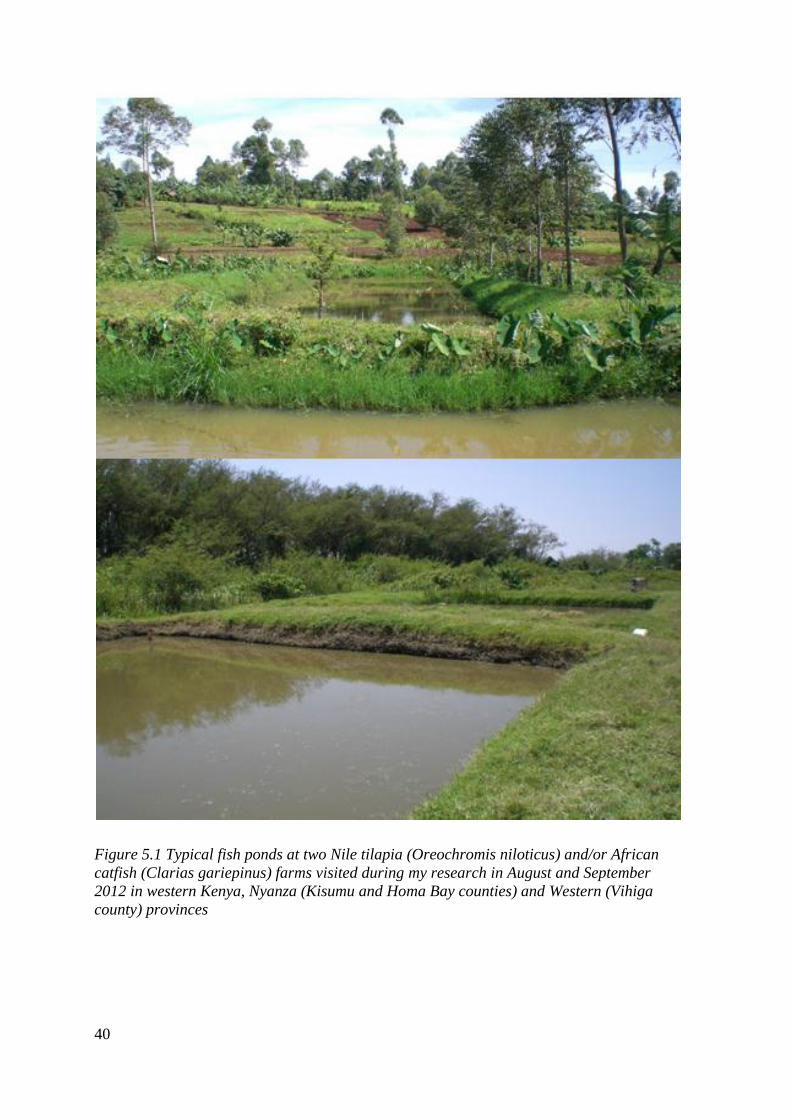
40
Figure 5.1 Typical fish ponds at two Nile tilapia (Oreochromis niloticus) and/or African
catfish (Clarias gariepinus) farms visited during my research in August and September
2012 in western Kenya, Nyanza (Kisumu and Homa Bay counties) and Western (Vihiga
county) provinces
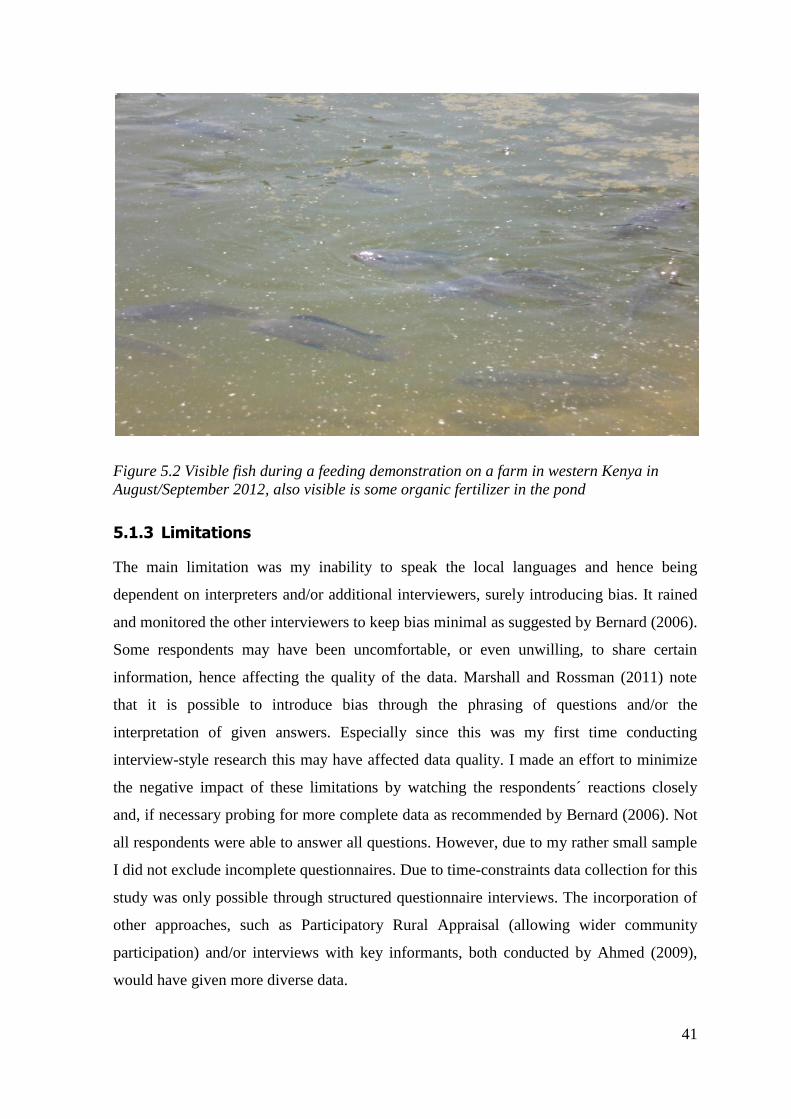
41
Figure 5.2 Visible fish during a feeding demonstration on a farm in western Kenya in
August/September 2012, also visible is some organic fertilizer in the pond
5.1.3 Limitations
The main limitation was my inability to speak the local languages and hence being
dependent on interpreters and/or additional interviewers, surely introducing bias. It rained
and monitored the other interviewers to keep bias minimal as suggested by Bernard (2006).
Some respondents may have been uncomfortable, or even unwilling, to share certain
information, hence affecting the quality of the data. Marshall and Rossman (2011) note
that it is possible to introduce bias through the phrasing of questions and/or the
interpretation of given answers. Especially since this was my first time conducting
interview-style research this may have affected data quality. I made an effort to minimize
the negative impact of these limitations by watching the respondents´ reactions closely
and, if necessary probing for more complete data as recommended by Bernard (2006). Not
all respondents were able to answer all questions. However, due to my rather small sample
I did not exclude incomplete questionnaires. Due to time-constraints data collection for this
study was only possible through structured questionnaire interviews. The incorporation of
other approaches, such as Participatory Rural Appraisal (allowing wider community
participation) and/or interviews with key informants, both conducted by Ahmed (2009),
would have given more diverse data.
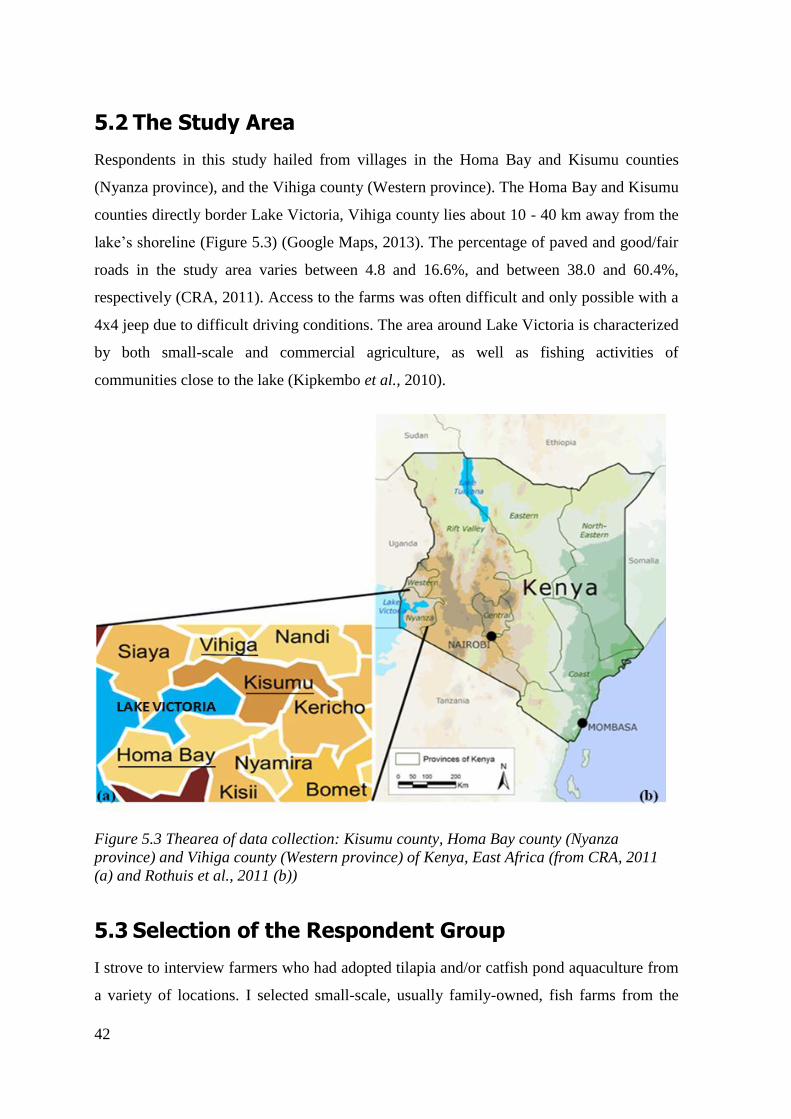
42
5.2 The Study Area
Respondents in this study hailed from villages in the Homa Bay and Kisumu counties
(Nyanza province), and the Vihiga county (Western province). The Homa Bay and Kisumu
counties directly border Lake Victoria, Vihiga county lies about 10 - 40 km away from the
lake‟s shoreline (Figure 5.3) (Google Maps, 2013). The percentage of paved and good/fair
roads in the study area varies between 4.8 and 16.6%, and between 38.0 and 60.4%,
respectively (CRA, 2011). Access to the farms was often difficult and only possible with a
4x4 jeep due to difficult driving conditions. The area around Lake Victoria is characterized
by both small-scale and commercial agriculture, as well as fishing activities of
communities close to the lake (Kipkembo et al., 2010).
Figure 5.3 Thearea of data collection: Kisumu county, Homa Bay county (Nyanza
province) and Vihiga county (Western province) of Kenya, East Africa (from CRA, 2011
(a) and Rothuis et al., 2011 (b))
5.3 Selection of the Respondent Group
I strove to interview farmers who had adopted tilapia and/or catfish pond aquaculture from
a variety of locations. I selected small-scale, usually family-owned, fish farms from the
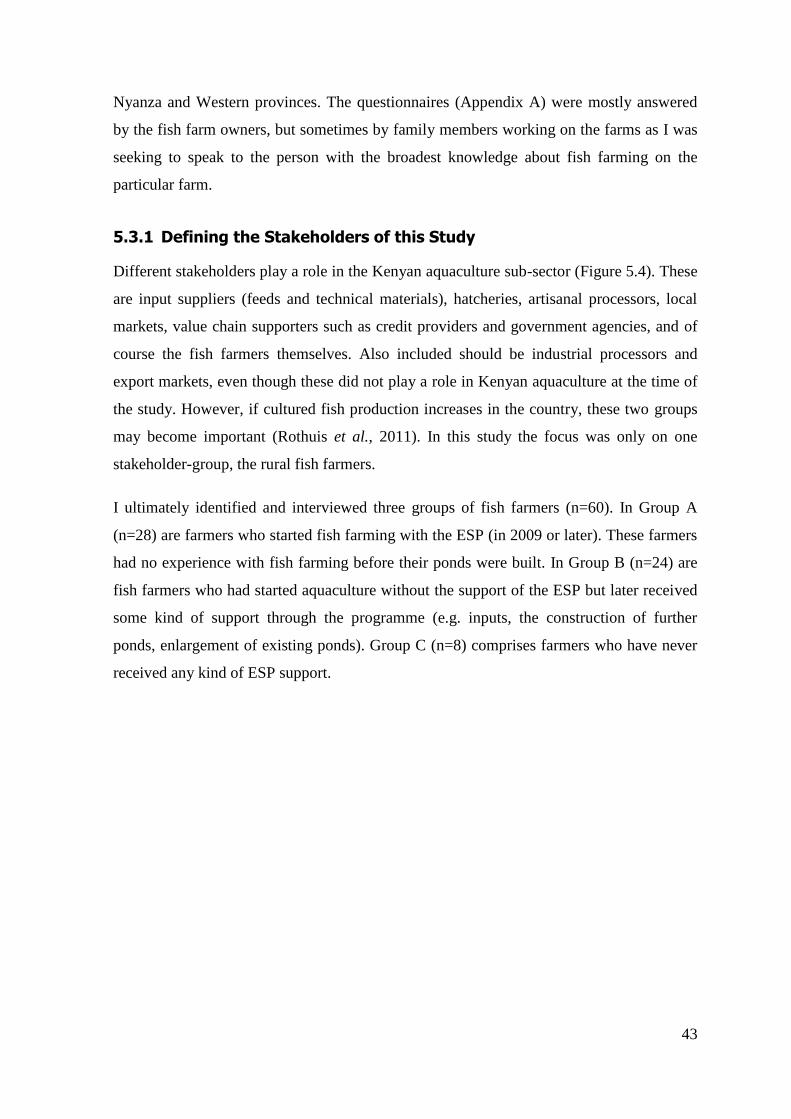
43
Nyanza and Western provinces. The questionnaires (Appendix A) were mostly answered
by the fish farm owners, but sometimes by family members working on the farms as I was
seeking to speak to the person with the broadest knowledge about fish farming on the
particular farm.
5.3.1 Defining the Stakeholders of this Study
Different stakeholders play a role in the Kenyan aquaculture sub-sector (Figure 5.4). These
are input suppliers (feeds and technical materials), hatcheries, artisanal processors, local
markets, value chain supporters such as credit providers and government agencies, and of
course the fish farmers themselves. Also included should be industrial processors and
export markets, even though these did not play a role in Kenyan aquaculture at the time of
the study. However, if cultured fish production increases in the country, these two groups
may become important (Rothuis et al., 2011). In this study the focus was only on one
stakeholder-group, the rural fish farmers.
I ultimately identified and interviewed three groups of fish farmers (n=60). In Group A
(n=28) are farmers who started fish farming with the ESP (in 2009 or later). These farmers
had no experience with fish farming before their ponds were built. In Group B (n=24) are
fish farmers who had started aquaculture without the support of the ESP but later received
some kind of support through the programme (e.g. inputs, the construction of further
ponds, enlargement of existing ponds). Group C (n=8) comprises farmers who have never
received any kind of ESP support.
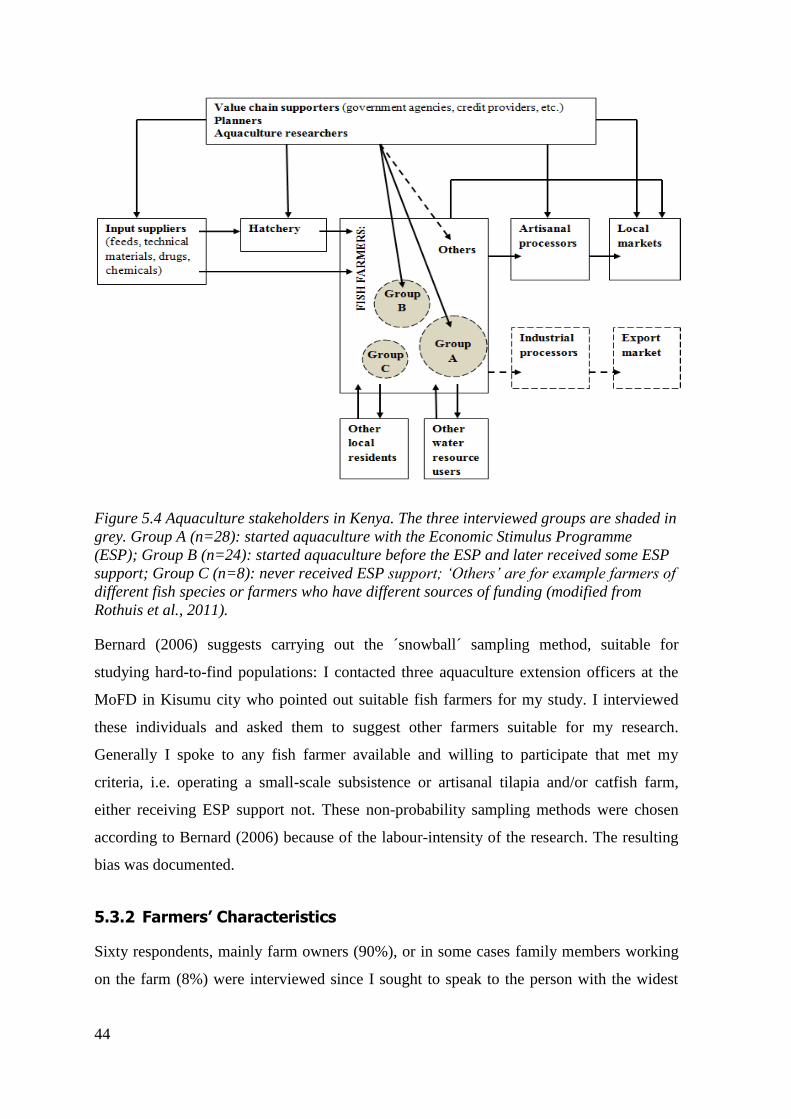
44
Figure 5.4 Aquaculture stakeholders in Kenya. The three interviewed groups are shaded in
grey. Group A (n=28): started aquaculture with the Economic Stimulus Programme
(ESP); Group B (n=24): started aquaculture before the ESP and later received some ESP
support; Group C (n=8): never received ESP support; „Others‟ are for example farmers of
different fish species or farmers who have different sources of funding (modified from
Rothuis et al., 2011).
Bernard (2006) suggests carrying out the ´snowball´ sampling method, suitable for
studying hard-to-find populations: I contacted three aquaculture extension officers at the
MoFD in Kisumu city who pointed out suitable fish farmers for my study. I interviewed
these individuals and asked them to suggest other farmers suitable for my research.
Generally I spoke to any fish farmer available and willing to participate that met my
criteria, i.e. operating a small-scale subsistence or artisanal tilapia and/or catfish farm,
either receiving ESP support not. These non-probability sampling methods were chosen
according to Bernard (2006) because of the labour-intensity of the research. The resulting
bias was documented.
5.3.2 Farmers’ Characteristics
Sixty respondents, mainly farm owners (90%), or in some cases family members working
on the farm (8%) were interviewed since I sought to speak to the person with the widest
45
range of knowledge about the fish farming activities. Two per cent of the respondents did
not state his/her connection to the farm. Most of the farmers interviewed were male, from
Homa Bay county, and with primary education (highest level of education) (Figure 5.5).
The average age of the fish farmers was 50.3 years, ranging from 17 to 76 years. Thirty-
eight per cent were 60 years or older; only 7% were 25 years old or younger. Their average
household size was 7.6 people, ranging from two to 17. Average extended family (i.e.
family who do not live in the household but depend on the farmers´ incomes) were 4.3
people, ranging from zero to 20. Aquaculture was started between 2009 and 2012 by
78.3% of the farmers, only 21.7% started before 2009. The land used for aquaculture was
either the fish farmers´ own (81.7%), or rented (18.3%).
Figure 5.5 Gender (a), county (b) and highest level of education (c) divisions of the
interviewed farmers farming Nile tilapia (Oreochromis niloticus) and/or African catfish
(Clarias gariepinus) of this study conducted in western Kenya (Nyanza and Western
provinces) in August and September 2012
5.3.3 Limitations
Marshall and Rossman (2011) note that research cannot be designed without certain
limitations; never, for example, can all relevant stakeholders be interviewed in depth. The
46
main limitation of this study is the fact that I was only able to interview one group of
stakeholders, i.e. the fish farmers. Furthermore, my research was limited to fish farmers
who spoke English. Even though English is an official language in Kenya (CIA, 2013),
Kiswahili and various indigenous languages are prevalent in the villages. Not only was the
respondents‟ ability to speak English crucial, decisive was also their contentment to
discuss their farming activities and livelihood situation. Another restraining factor was that
English is not my first language either. Without doubt misunderstandings were evoked by
the conversation of two parties, of which one at least was a non-native English speaker. I
tried to avoid such misunderstandings as much as possible by speaking slowly and re-
wording my questions as well as giving the respondents time to read the questions. On the
other hand, the fact that I am not a native English speaker may have reassured some
participants.
A few times I was confronted with farmers not able to speak English. The aquaculture
extension officers, at least one of which usually travelled with me, helped me by
interpreting and translating. This, however, may have put their point of view across to me
rather than the opinion of the fish farmers. I was not able to avoid this.
My respondent pool was also limited to respondents comfortable discussing personal and
political issues with a foreigner. Some individuals may have been uncomfortable sharing
their opinion as well as certain personal information with someone who has a completely
different background and colour. I felt that the issue of skin colour played a critical role in
the willingness, and possibly also honesty, in answering certain questions. Some farmers
may have tried to impress me. From discussions with the aquaculture extension officers
from the MoFD I learned that fish farmers in the area are accustomed to discussing their
activities with NGO personnel, and hence know which answers are „good‟ and „bad‟ ones
to give. However, apart from taking note of possible bias (Bernard, 2006) I was not able to
avoid these issues. In some cases, however, there may have been potential benefits by my
status as a foreigner. I most likely did not represent a political „threat‟ and hence fish
farmers may have answered my questions more honestly.
The „snowball‟ method is known to generate a relatively homogenous data sample
(Bernard, 2006). My inability to choose respondents randomly may have resulted in the
disadvantage of only getting to interview fish farmers that are comparatively „well-off‟.
47
Many of the farmers were elderly and male, often receiving a pension or having a regular
business generating income. I cannot shake off the feeling that the extension officers may
have been ashamed of showing me farms in bad conditions. However, I made efforts to
alleviate this bias as much as possible by trying to interview farmers from different areas.
Thanks to the MoFD I had access to transport and was able to interview fish farmers up to
a two hours´ drive away from Kisumu.
My intent was to find around 20 farmers in each of the three groups. However, it was
especially difficult to find fish farmers who had never received any ESP support (Group
C). Nonetheless, I decided to include the eight farmers in this group in my research
because I consider this group extremely important for evaluating the outcomes of the
study. Even though every effort was made to present a reliable set of outcomes,
comparisons between the three groups of fish farmers are complicated due to the
considerable difference in sample sizes.
5.4 Data Transcription and Analysis
5.4.1 Data Transcription
Data noted down on the survey questionnaires during the interviews were transcribed into
Microsoft Excel (2007) between September and December 2012. During this step some
data were numerically coded (e.g. 1 = yes; 2 = no; 0 = no response) in order to ease data
management and lucidity, as suggested by Bernard (2006).
5.4.2 Data Analysis
I analysed and discussed the data using the characterization of livelihood improvements
used by DFID (1999); i.e. that livelihood improvements happen when communities
experience increased well-being and reduced vulnerability through higher incomes,
improved food security and the more sustainable use of natural resources.
For analysis some of the data were pooled into categories: Manure, cow dung, chicken
droppings and compost, for example, were pooled as organic fertilizers. This step was
necessary for open-ended short answer questions. The construction of visual displays like
graphs and tables, recommended by Bernard (2006) for all qualitative and quantitative
48
analysis, helped me to understand the data and communicate detected patterns to the
readers.
In order to assess any aquaculture related activities incorporating time spans (i.e. fish
grow-out period, expenditures and income over a year) correctly, it was necessary to know
the period of time between stocking of the pond with fingerlings and re-stocking for the
next grow-out cycle. This period includes the time that the fish pond is actually occupied
with fish, plus approximately one month of fallow period between fish harvest and re-
stocking (fish farmers, personal communications, August and September 2012). The
average length of one such cycle is 7.9 months, ranging between six and 12 months. The
farmers were asked to provide information about their incomes and expenditures for one
such cycle and the size of their last fish harvest. From these figures monthly figures were
calculated and ultimately extrapolated to give yearly figures.
5.4.3 Limitations
Employing a full Sustainable Livelihoods Framework (using poverty reduction, well-being
and capabilities, livelihood adaption, vulnerability and resilience, and natural resource base
sustainability as indicators to assess sustainable livelihoods) to analyse the data, as done by
Ahmed (2009), would have given a broader and more in-depth insight into livelihood
improvements of the studied households. However, due to time-constraints only certain
aspects were investigated, namely incomes, food security and the sustainable use of natural
resources.
The use of voice recording would possibly have increased my credibility, as well as made
data transcription and analysis easier. However, I suspect that under the interviewing
circumstances a voice recording device might just have introduced tenseness amongst the
respondents, which would have negatively impacted the answers given. Hence, I believe
that the use of multiple choice questions as well as a few very short open answer questions
eliminated the need for voice recording.
49
6 Results
6.1 Fish Farming Characteristics
6.1.1 General
The majority of the respondents (61.7%) were members in a fish farming group. The water
used for fish farming was most often groundwater (45%), followed by lake- and well water
(18.3%, each). Fifteen per cent of respondents stated riverine water sources (no response:
3.3%). Many farmers mentioned that for them aquaculture represents a ´risky´ activity of
income creation in terms of harvest losses due to water non-availability and fish diseases
(fish farmers, personal communications, August and September, 2012). General fish
farming characteristics, according to the type of support received by the farmers, are
displayed in Table 6.1. Farmers owned an average of 2.6 ponds, ranging from one to 13
(average pond area: 355.6 m2), i.e. 936.4 m
2 pond area per farm. Farmers in Group C not
only had most ponds on their farms, they also employed most labourers. The main species
farmed by all groups was tilapia, mostly in monoculture systems. The often more
rewarding polyculture of tilapia and catfish (Ngugi et al., 2007) was mainly practiced by
Group C, followed by Group B. A similar tendency was observed with the use of polysex
fingerlings: Mainly farmers in Group C used this comparatively cheaper alternative of
fingerling acquisition, followed by Group B. Several farmers doubted the efficiency of
monosex fingerlings, observing fish reproduction in the ponds even though hatcheries
claimed to sell monosex fingerlings (fish farmers, personal communications, August and
September, 2012). The re-use of pond water, e.g. for watering vegetables, was mostly
practiced by Group B, followed by Group C. The main fertilizers used were of organic
nature, i.e. compost and various kinds of manure. The chemical fertilizer Di-Ammonium
Phosphate was mainly used by Group A, rarely on its own though. Record-keeping was
widely practiced, mainly in Group C, followed by Group A. Overall, farmers in Groups B
and C did best in terms of cost-effective and environmentally sustainable farming
practices: Group C through their lead in the use of polysex fingerlings and polyculture
systems; Group B through their lead in water-reutilization and the use of organic fertilizers.
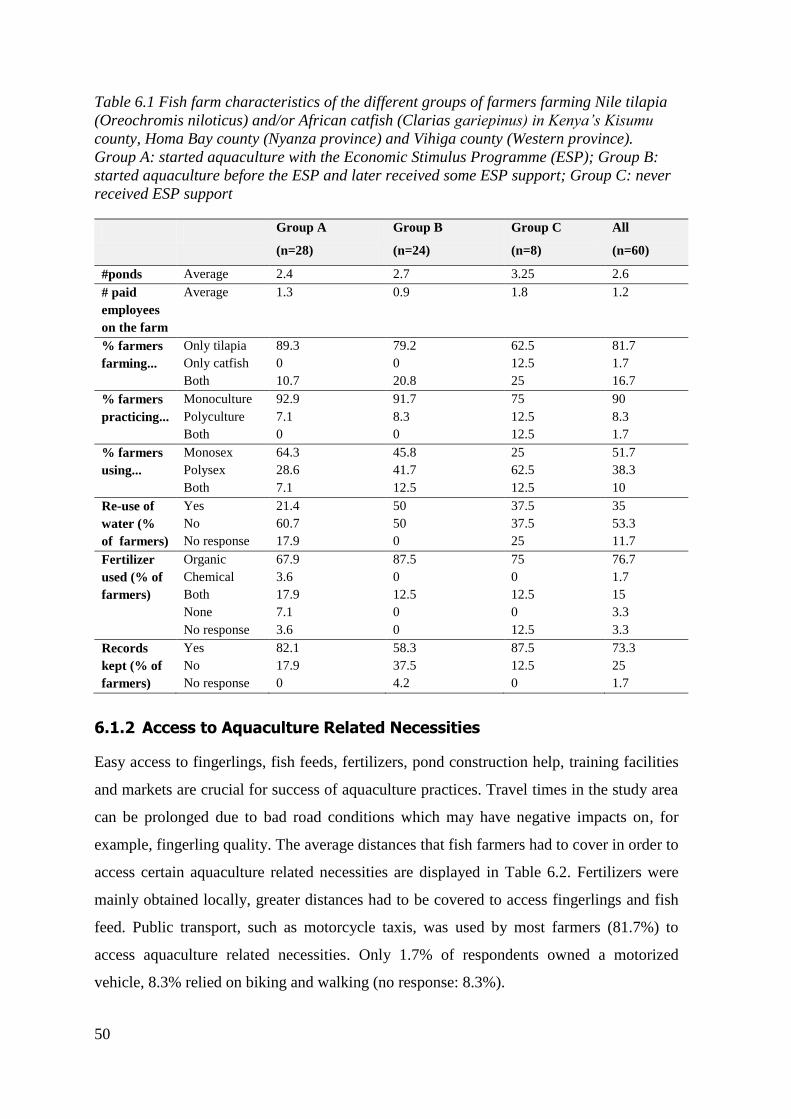
50
Table 6.1 Fish farm characteristics of the different groups of farmers farming Nile tilapia
(Oreochromis niloticus) and/or African catfish (Clarias gariepinus) in Kenya‟s Kisumu
county, Homa Bay county (Nyanza province) and Vihiga county (Western province).
Group A: started aquaculture with the Economic Stimulus Programme (ESP); Group B:
started aquaculture before the ESP and later received some ESP support; Group C: never
received ESP support
Group A
(n=28)
Group B
(n=24)
Group C
(n=8)
All
(n=60)
#ponds Average 2.4 2.7 3.25 2.6
# paid
employees
on the farm
Average 1.3 0.9 1.8 1.2
% farmers
farming...
Only tilapia
Only catfish
Both
89.3
0
10.7
79.2
0
20.8
62.5
12.5
25
81.7
1.7
16.7
% farmers
practicing...
Monoculture
Polyculture
Both
92.9
7.1
0
91.7
8.3
0
75
12.5
12.5
90
8.3
1.7
% farmers
using...
Monosex
Polysex
Both
64.3
28.6
7.1
45.8
41.7
12.5
25
62.5
12.5
51.7
38.3
10
Re-use of
water (%
of farmers)
Yes
No
No response
21.4
60.7
17.9
50
50
0
37.5
37.5
25
35
53.3
11.7
Fertilizer
used (% of
farmers)
Organic
Chemical
Both
None
No response
67.9
3.6
17.9
7.1
3.6
87.5
0
12.5
0
0
75
0
12.5
0
12.5
76.7
1.7
15
3.3
3.3
Records
kept (% of
farmers)
Yes
No
No response
82.1
17.9
0
58.3
37.5
4.2
87.5
12.5
0
73.3
25
1.7
6.1.2 Access to Aquaculture Related Necessities
Easy access to fingerlings, fish feeds, fertilizers, pond construction help, training facilities
and markets are crucial for success of aquaculture practices. Travel times in the study area
can be prolonged due to bad road conditions which may have negative impacts on, for
example, fingerling quality. The average distances that fish farmers had to cover in order to
access certain aquaculture related necessities are displayed in Table 6.2. Fertilizers were
mainly obtained locally, greater distances had to be covered to access fingerlings and fish
feed. Public transport, such as motorcycle taxis, was used by most farmers (81.7%) to
access aquaculture related necessities. Only 1.7% of respondents owned a motorized
vehicle, 8.3% relied on biking and walking (no response: 8.3%).
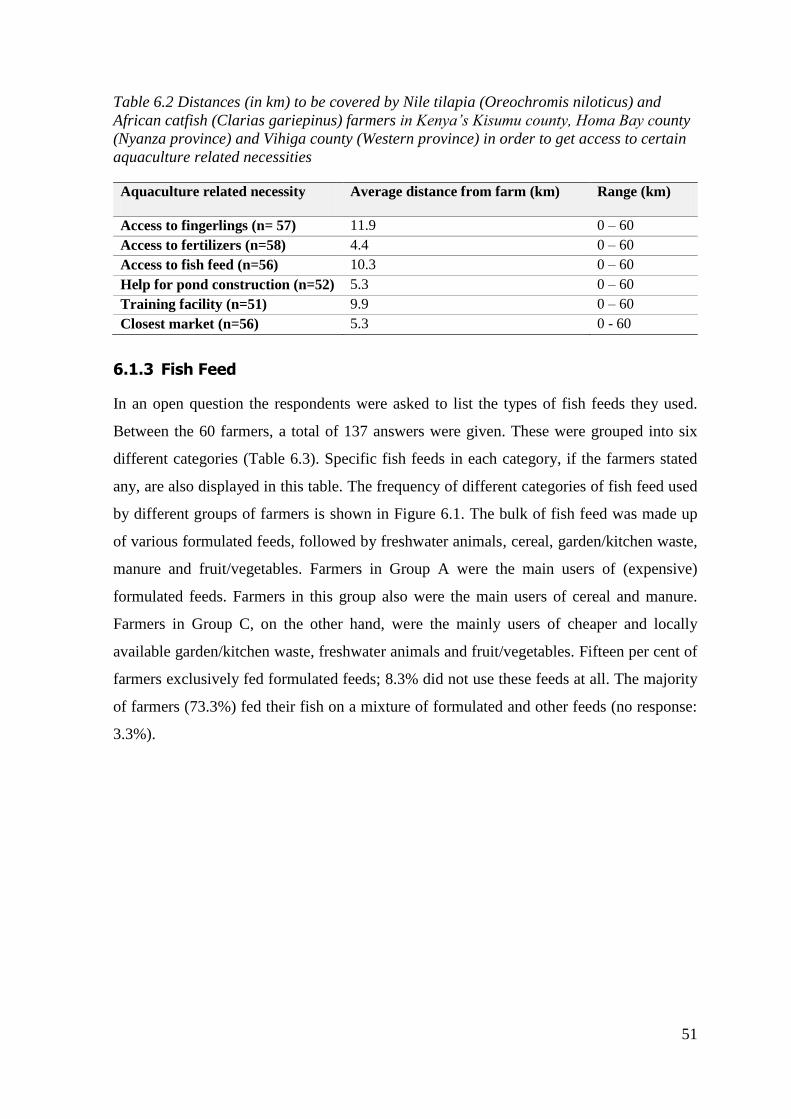
51
Table 6.2 Distances (in km) to be covered by Nile tilapia (Oreochromis niloticus) and
African catfish (Clarias gariepinus) farmers in Kenya‟s Kisumu county, Homa Bay county
(Nyanza province) and Vihiga county (Western province) in order to get access to certain
aquaculture related necessities
Aquaculture related necessity Average distance from farm (km) Range (km)
Access to fingerlings (n= 57) 11.9 0 – 60
Access to fertilizers (n=58) 4.4 0 – 60
Access to fish feed (n=56) 10.3 0 – 60
Help for pond construction (n=52) 5.3 0 – 60
Training facility (n=51) 9.9 0 – 60
Closest market (n=56) 5.3 0 - 60
6.1.3 Fish Feed
In an open question the respondents were asked to list the types of fish feeds they used.
Between the 60 farmers, a total of 137 answers were given. These were grouped into six
different categories (Table 6.3). Specific fish feeds in each category, if the farmers stated
any, are also displayed in this table. The frequency of different categories of fish feed used
by different groups of farmers is shown in Figure 6.1. The bulk of fish feed was made up
of various formulated feeds, followed by freshwater animals, cereal, garden/kitchen waste,
manure and fruit/vegetables. Farmers in Group A were the main users of (expensive)
formulated feeds. Farmers in this group also were the main users of cereal and manure.
Farmers in Group C, on the other hand, were the mainly users of cheaper and locally
available garden/kitchen waste, freshwater animals and fruit/vegetables. Fifteen per cent of
farmers exclusively fed formulated feeds; 8.3% did not use these feeds at all. The majority
of farmers (73.3%) fed their fish on a mixture of formulated and other feeds (no response:
3.3%).
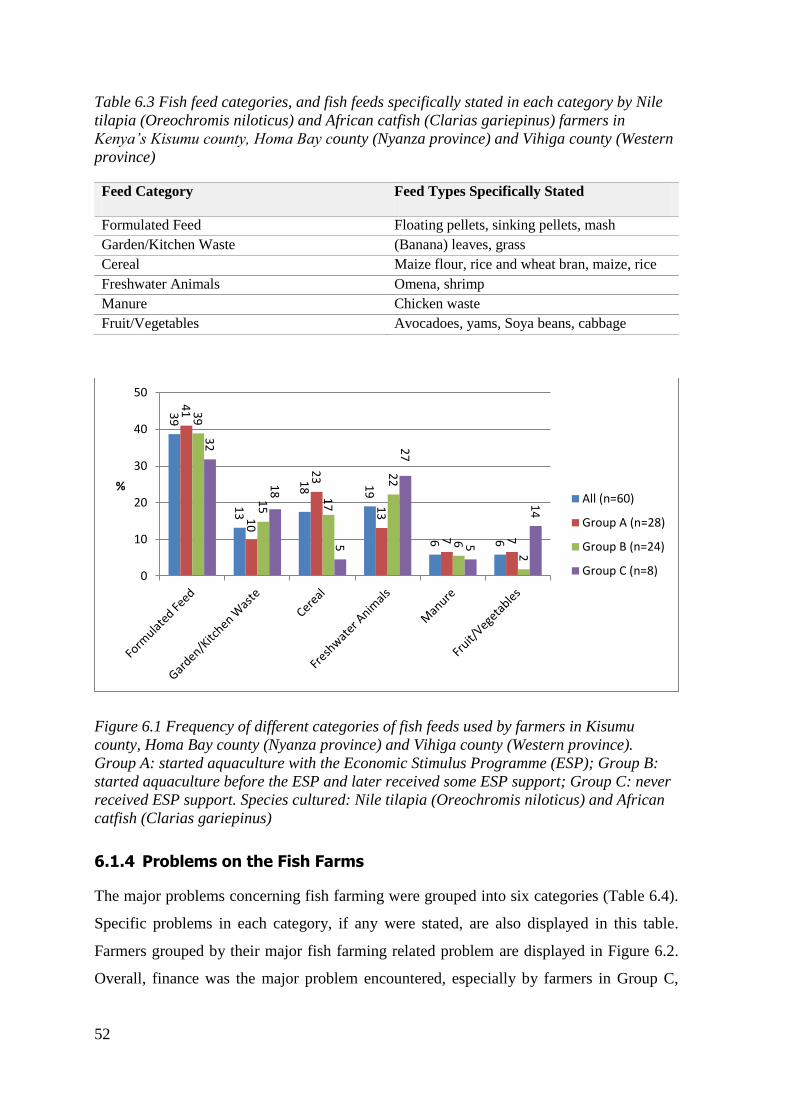
52
Table 6.3 Fish feed categories, and fish feeds specifically stated in each category by Nile
tilapia (Oreochromis niloticus) and African catfish (Clarias gariepinus) farmers in
Kenya‟s Kisumu county, Homa Bay county (Nyanza province) and Vihiga county (Western
province)
Feed Category Feed Types Specifically Stated
Formulated Feed Floating pellets, sinking pellets, mash
Garden/Kitchen Waste (Banana) leaves, grass
Cereal Maize flour, rice and wheat bran, maize, rice
Freshwater Animals Omena, shrimp
Manure Chicken waste
Fruit/Vegetables Avocadoes, yams, Soya beans, cabbage
Figure 6.1 Frequency of different categories of fish feeds used by farmers in Kisumu
county, Homa Bay county (Nyanza province) and Vihiga county (Western province).
Group A: started aquaculture with the Economic Stimulus Programme (ESP); Group B:
started aquaculture before the ESP and later received some ESP support; Group C: never
received ESP support. Species cultured: Nile tilapia (Oreochromis niloticus) and African
catfish (Clarias gariepinus)
6.1.4 Problems on the Fish Farms
The major problems concerning fish farming were grouped into six categories (Table 6.4).
Specific problems in each category, if any were stated, are also displayed in this table.
Farmers grouped by their major fish farming related problem are displayed in Figure 6.2.
Overall, finance was the major problem encountered, especially by farmers in Group C,
39
13
18
19
6
6
41
10
23
13
7
7
39
15
17
22
6
2
32
18
5
27
5
14
0
10
20
30
40
50
%
All (n=60)
Group A (n=28)
Group B (n=24)
Group C (n=8)
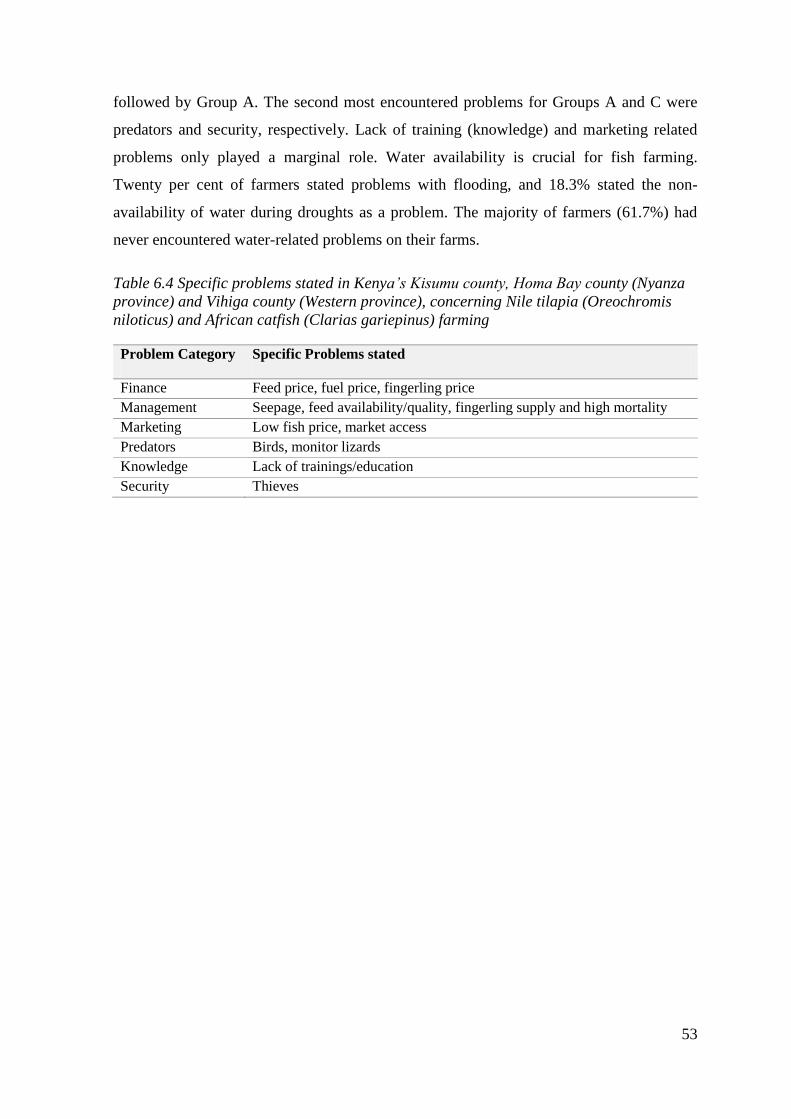
53
followed by Group A. The second most encountered problems for Groups A and C were
predators and security, respectively. Lack of training (knowledge) and marketing related
problems only played a marginal role. Water availability is crucial for fish farming.
Twenty per cent of farmers stated problems with flooding, and 18.3% stated the non-
availability of water during droughts as a problem. The majority of farmers (61.7%) had
never encountered water-related problems on their farms.
Table 6.4 Specific problems stated in Kenya‟s Kisumu county, Homa Bay county (Nyanza
province) and Vihiga county (Western province), concerning Nile tilapia (Oreochromis
niloticus) and African catfish (Clarias gariepinus) farming
Problem Category Specific Problems stated
Finance Feed price, fuel price, fingerling price
Management Seepage, feed availability/quality, fingerling supply and high mortality
Marketing Low fish price, market access
Predators Birds, monitor lizards
Knowledge Lack of trainings/education
Security Thieves
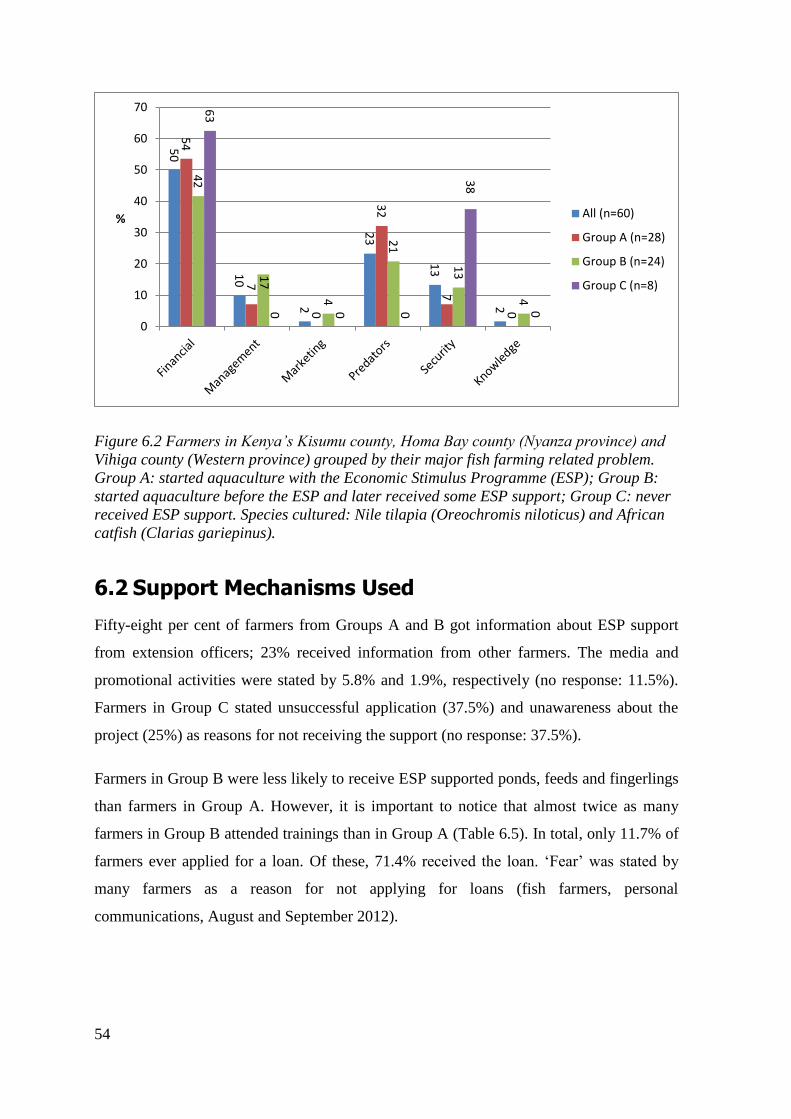
54
Figure 6.2 Farmers in Kenya‟s Kisumu county, Homa Bay county (Nyanza province) and
Vihiga county (Western province) grouped by their major fish farming related problem.
Group A: started aquaculture with the Economic Stimulus Programme (ESP); Group B:
started aquaculture before the ESP and later received some ESP support; Group C: never
received ESP support. Species cultured: Nile tilapia (Oreochromis niloticus) and African
catfish (Clarias gariepinus).
6.2 Support Mechanisms Used
Fifty-eight per cent of farmers from Groups A and B got information about ESP support
from extension officers; 23% received information from other farmers. The media and
promotional activities were stated by 5.8% and 1.9%, respectively (no response: 11.5%).
Farmers in Group C stated unsuccessful application (37.5%) and unawareness about the
project (25%) as reasons for not receiving the support (no response: 37.5%).
Farmers in Group B were less likely to receive ESP supported ponds, feeds and fingerlings
than farmers in Group A. However, it is important to notice that almost twice as many
farmers in Group B attended trainings than in Group A (Table 6.5). In total, only 11.7% of
farmers ever applied for a loan. Of these, 71.4% received the loan. „Fear‟ was stated by
many farmers as a reason for not applying for loans (fish farmers, personal
communications, August and September 2012).
50
10
2
23
13
2
54
7
0
32
7
0
42
17
4
21
13
4
63
0
0
0
38
0
0
10
20
30
40
50
60
70
%
All (n=60)
Group A (n=28)
Group B (n=24)
Group C (n=8)
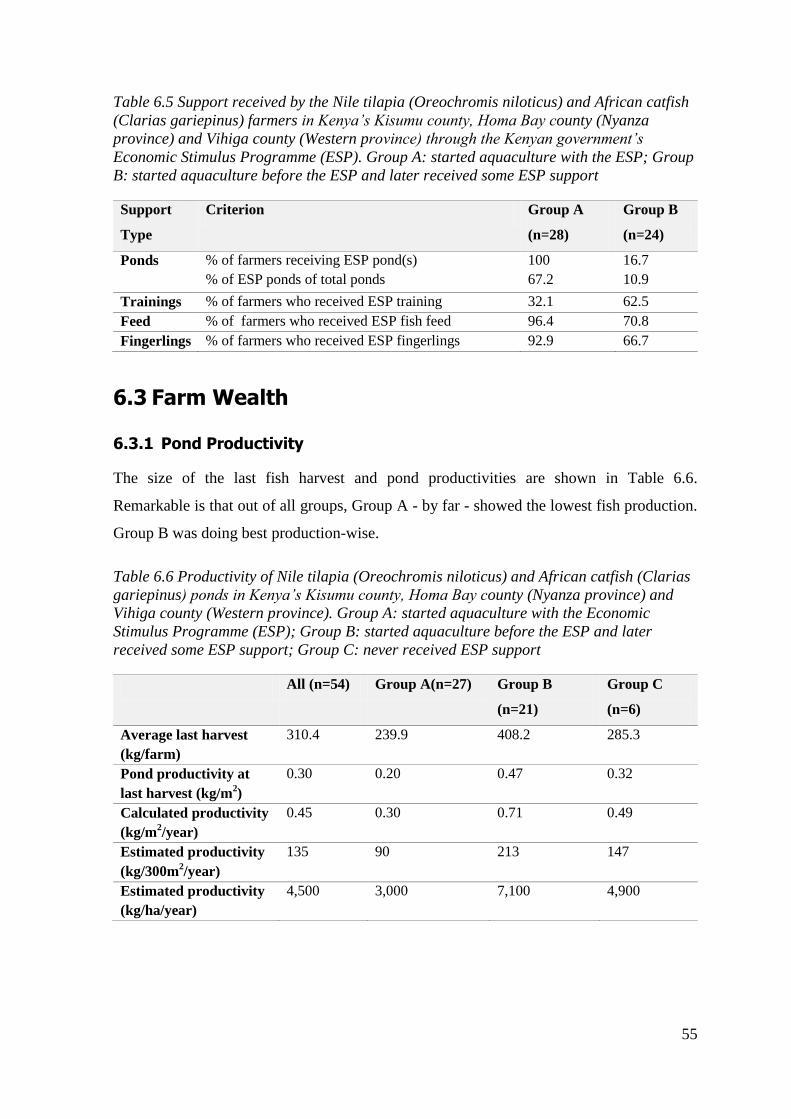
55
Table 6.5 Support received by the Nile tilapia (Oreochromis niloticus) and African catfish
(Clarias gariepinus) farmers in Kenya‟s Kisumu county, Homa Bay county (Nyanza
province) and Vihiga county (Western province) through the Kenyan government‟s
Economic Stimulus Programme (ESP). Group A: started aquaculture with the ESP; Group
B: started aquaculture before the ESP and later received some ESP support
Support
Type
Criterion Group A
(n=28)
Group B
(n=24)
Ponds % of farmers receiving ESP pond(s)
% of ESP ponds of total ponds
100
67.2
16.7
10.9
Trainings % of farmers who received ESP training 32.1 62.5
Feed % of farmers who received ESP fish feed 96.4 70.8
Fingerlings % of farmers who received ESP fingerlings 92.9 66.7
6.3 Farm Wealth
6.3.1 Pond Productivity
The size of the last fish harvest and pond productivities are shown in Table 6.6.
Remarkable is that out of all groups, Group A - by far - showed the lowest fish production.
Group B was doing best production-wise.
Table 6.6 Productivity of Nile tilapia (Oreochromis niloticus) and African catfish (Clarias
gariepinus) ponds in Kenya‟s Kisumu county, Homa Bay county (Nyanza province) and
Vihiga county (Western province). Group A: started aquaculture with the Economic
Stimulus Programme (ESP); Group B: started aquaculture before the ESP and later
received some ESP support; Group C: never received ESP support
All (n=54) Group A(n=27) Group B
(n=21)
Group C
(n=6)
Average last harvest
(kg/farm)
310.4 239.9 408.2 285.3
Pond productivity at
last harvest (kg/m2)
0.30 0.20 0.47 0.32
Calculated productivity
(kg/m2/year)
0.45 0.30 0.71 0.49
Estimated productivity
(kg/300m2/year)
135 90 213 147
Estimated productivity
(kg/ha/year)
4,500 3,000 7,100 4,900
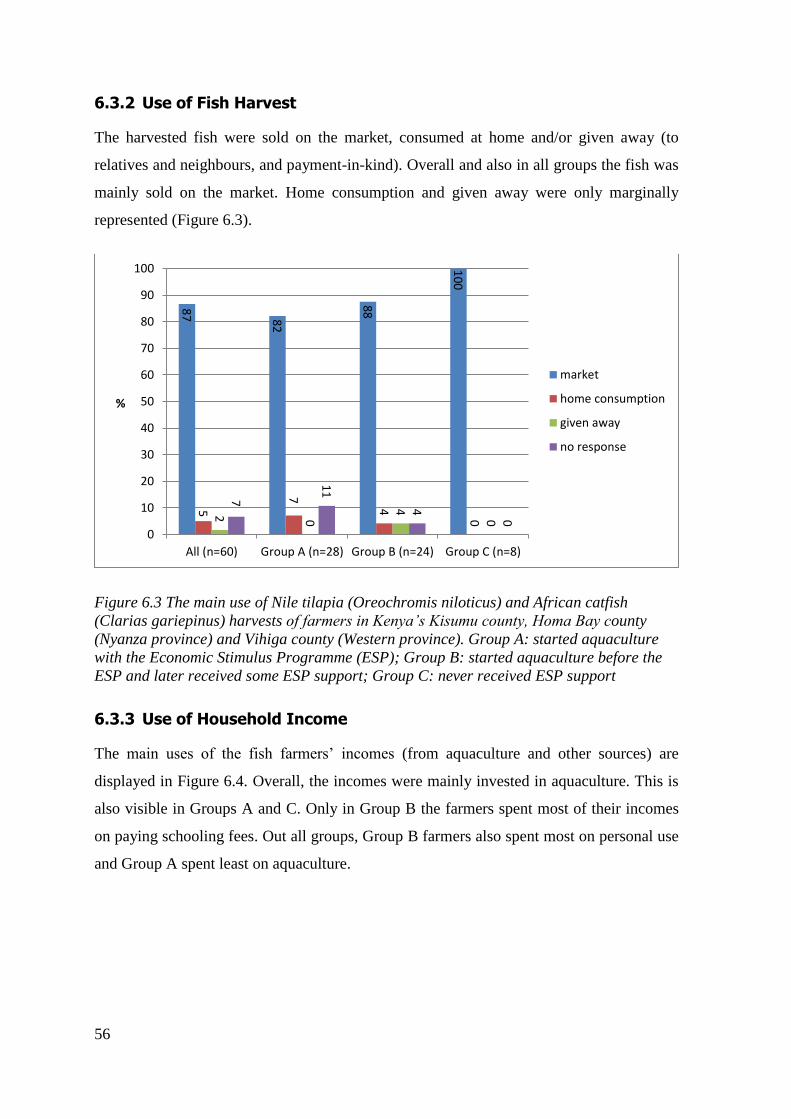
56
6.3.2 Use of Fish Harvest
The harvested fish were sold on the market, consumed at home and/or given away (to
relatives and neighbours, and payment-in-kind). Overall and also in all groups the fish was
mainly sold on the market. Home consumption and given away were only marginally
represented (Figure 6.3).
Figure 6.3 The main use of Nile tilapia (Oreochromis niloticus) and African catfish
(Clarias gariepinus) harvests of farmers in Kenya‟s Kisumu county, Homa Bay county
(Nyanza province) and Vihiga county (Western province). Group A: started aquaculture
with the Economic Stimulus Programme (ESP); Group B: started aquaculture before the
ESP and later received some ESP support; Group C: never received ESP support
6.3.3 Use of Household Income
The main uses of the fish farmers‟ incomes (from aquaculture and other sources) are
displayed in Figure 6.4. Overall, the incomes were mainly invested in aquaculture. This is
also visible in Groups A and C. Only in Group B the farmers spent most of their incomes
on paying schooling fees. Out all groups, Group B farmers also spent most on personal use
and Group A spent least on aquaculture.
87
82
88
10
0
5
7 4
0
2 0
4 0
7
11
4 0
0
10
20
30
40
50
60
70
80
90
100
All (n=60) Group A (n=28) Group B (n=24) Group C (n=8)
%
market
home consumption
given away
no response
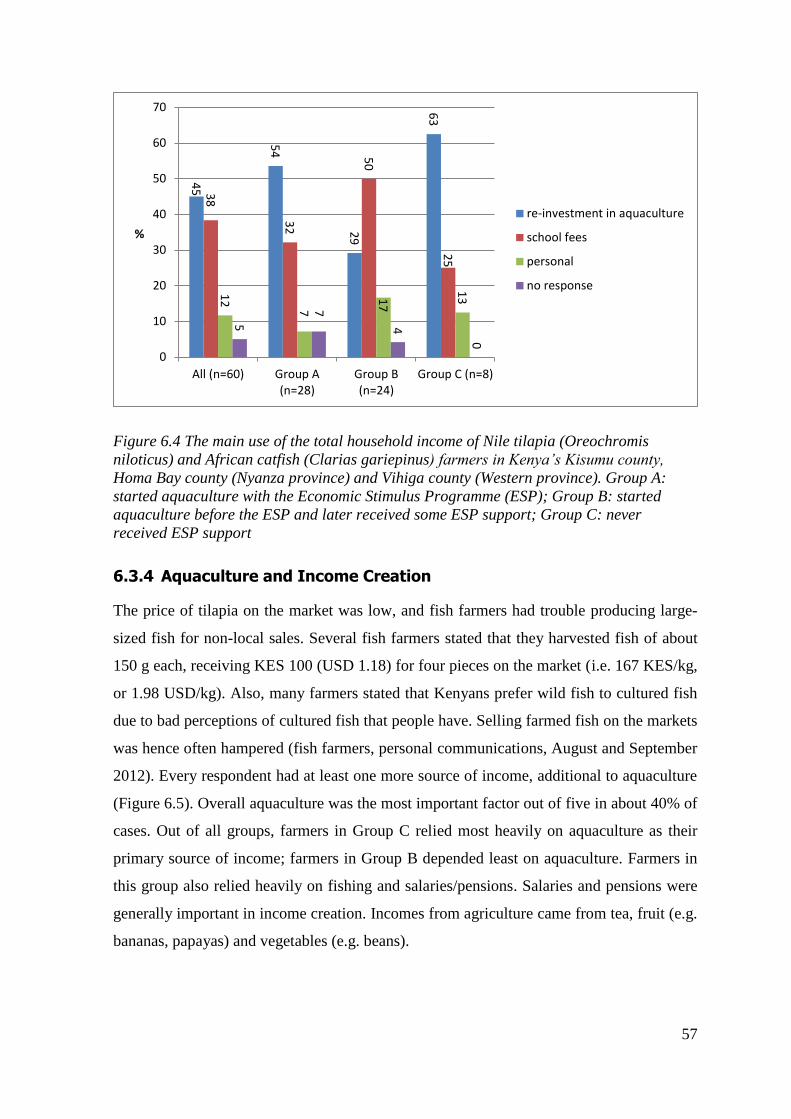
57
Figure 6.4 The main use of the total household income of Nile tilapia (Oreochromis
niloticus) and African catfish (Clarias gariepinus) farmers in Kenya‟s Kisumu county,
Homa Bay county (Nyanza province) and Vihiga county (Western province). Group A:
started aquaculture with the Economic Stimulus Programme (ESP); Group B: started
aquaculture before the ESP and later received some ESP support; Group C: never
received ESP support
6.3.4 Aquaculture and Income Creation
The price of tilapia on the market was low, and fish farmers had trouble producing large-
sized fish for non-local sales. Several fish farmers stated that they harvested fish of about
150 g each, receiving KES 100 (USD 1.18) for four pieces on the market (i.e. 167 KES/kg,
or 1.98 USD/kg). Also, many farmers stated that Kenyans prefer wild fish to cultured fish
due to bad perceptions of cultured fish that people have. Selling farmed fish on the markets
was hence often hampered (fish farmers, personal communications, August and September
2012). Every respondent had at least one more source of income, additional to aquaculture
(Figure 6.5). Overall aquaculture was the most important factor out of five in about 40% of
cases. Out of all groups, farmers in Group C relied most heavily on aquaculture as their
primary source of income; farmers in Group B depended least on aquaculture. Farmers in
this group also relied heavily on fishing and salaries/pensions. Salaries and pensions were
generally important in income creation. Incomes from agriculture came from tea, fruit (e.g.
bananas, papayas) and vegetables (e.g. beans).
45
54
29
63
38
32
50
25
12
7
17
13
5
7
4
0
0
10
20
30
40
50
60
70
All (n=60) Group A(n=28)
Group B(n=24)
Group C (n=8)
%
re-investment in aquaculture
school fees
personal
no response
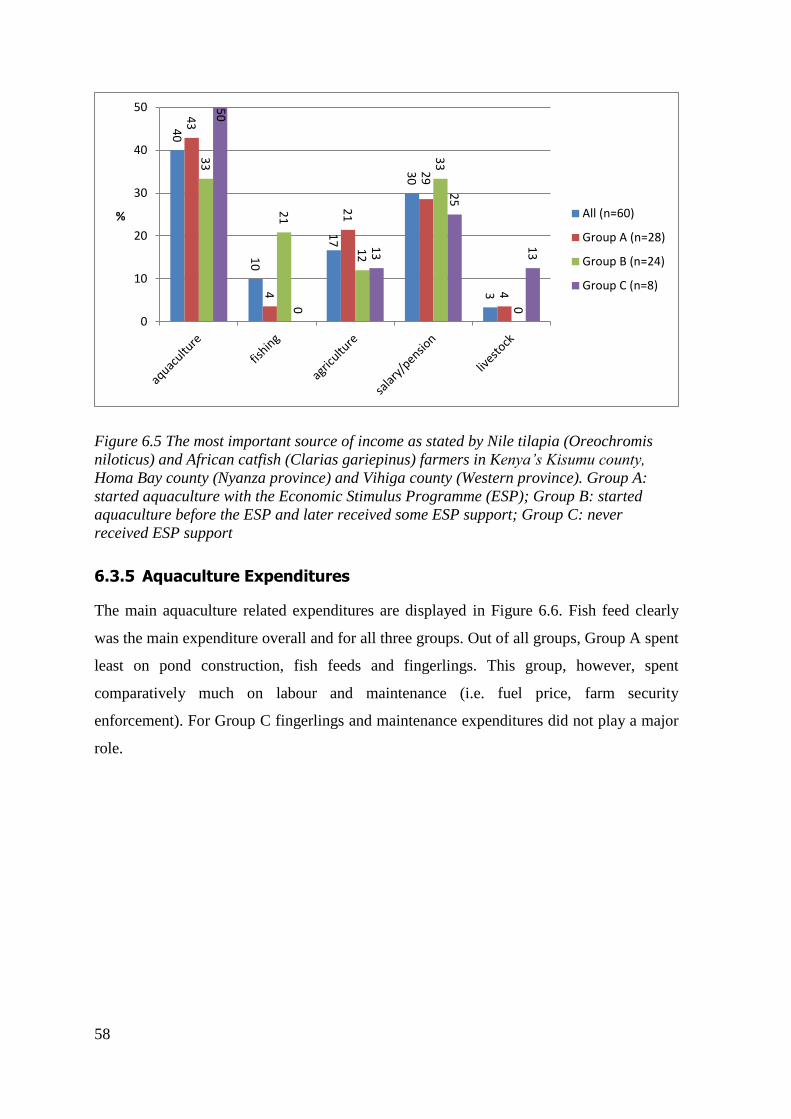
58
Figure 6.5 The most important source of income as stated by Nile tilapia (Oreochromis
niloticus) and African catfish (Clarias gariepinus) farmers in Kenya‟s Kisumu county,
Homa Bay county (Nyanza province) and Vihiga county (Western province). Group A:
started aquaculture with the Economic Stimulus Programme (ESP); Group B: started
aquaculture before the ESP and later received some ESP support; Group C: never
received ESP support
6.3.5 Aquaculture Expenditures
The main aquaculture related expenditures are displayed in Figure 6.6. Fish feed clearly
was the main expenditure overall and for all three groups. Out of all groups, Group A spent
least on pond construction, fish feeds and fingerlings. This group, however, spent
comparatively much on labour and maintenance (i.e. fuel price, farm security
enforcement). For Group C fingerlings and maintenance expenditures did not play a major
role.
40
10
17
30
3
43
4
21
29
4
33
21
12
33
0
50
0
13
25
13
0
10
20
30
40
50
%
All (n=60)
Group A (n=28)
Group B (n=24)
Group C (n=8)
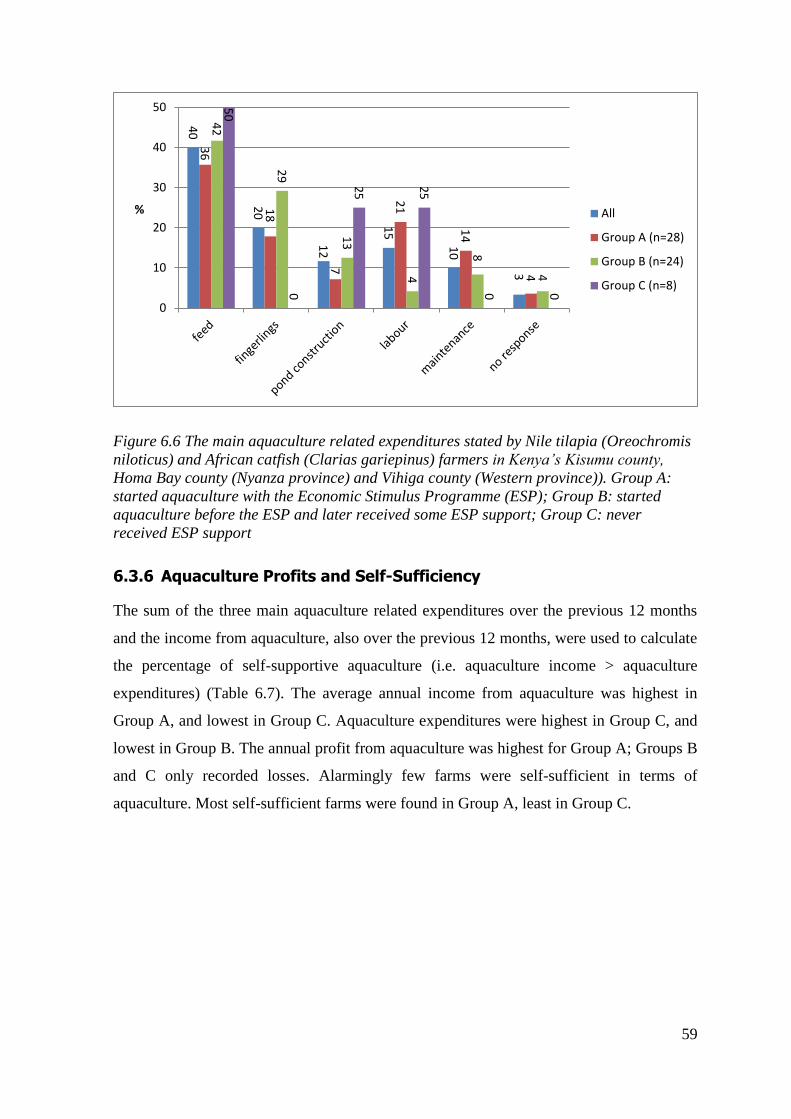
59
Figure 6.6 The main aquaculture related expenditures stated by Nile tilapia (Oreochromis
niloticus) and African catfish (Clarias gariepinus) farmers in Kenya‟s Kisumu county,
Homa Bay county (Nyanza province) and Vihiga county (Western province)). Group A:
started aquaculture with the Economic Stimulus Programme (ESP); Group B: started
aquaculture before the ESP and later received some ESP support; Group C: never
received ESP support
6.3.6 Aquaculture Profits and Self-Sufficiency
The sum of the three main aquaculture related expenditures over the previous 12 months
and the income from aquaculture, also over the previous 12 months, were used to calculate
the percentage of self-supportive aquaculture (i.e. aquaculture income > aquaculture
expenditures) (Table 6.7). The average annual income from aquaculture was highest in
Group A, and lowest in Group C. Aquaculture expenditures were highest in Group C, and
lowest in Group B. The annual profit from aquaculture was highest for Group A; Groups B
and C only recorded losses. Alarmingly few farms were self-sufficient in terms of
aquaculture. Most self-sufficient farms were found in Group A, least in Group C.
40
20
12
15
10
3
36
18
7
21
14
4
42
29
13
4
8
4
50
0
25
25
0
0
0
10
20
30
40
50
%
All
Group A (n=28)
Group B (n=24)
Group C (n=8)
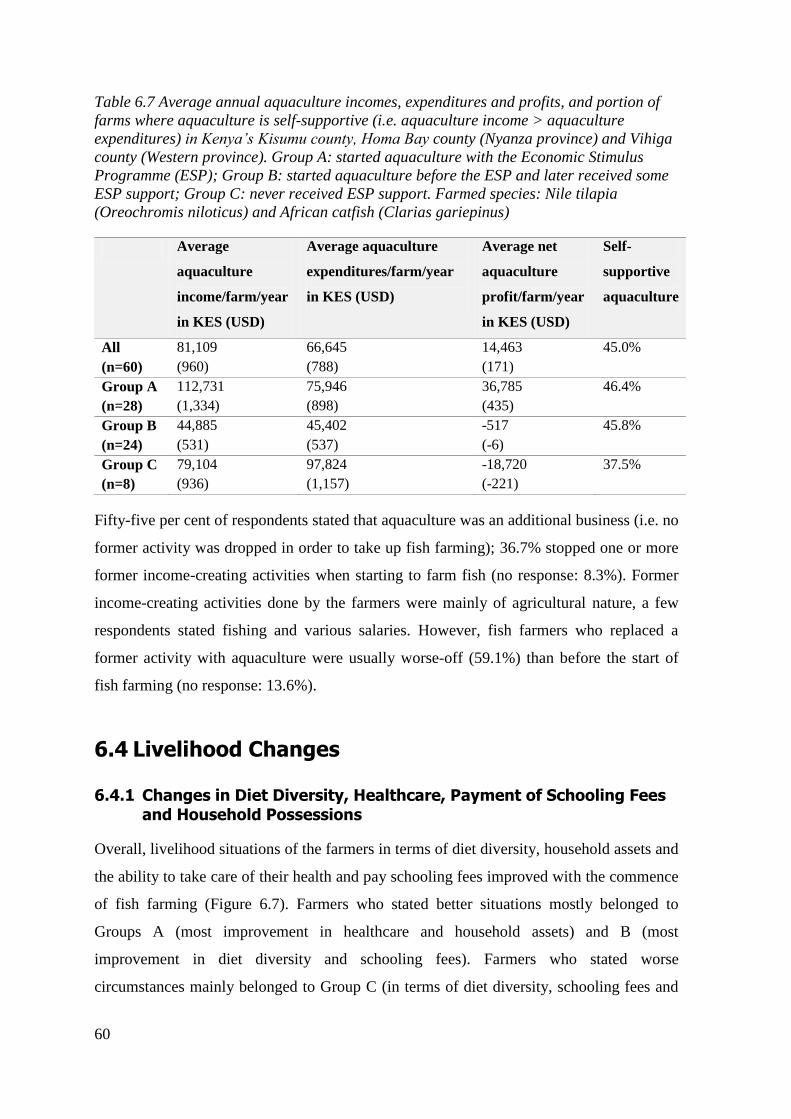
60
Table 6.7 Average annual aquaculture incomes, expenditures and profits, and portion of
farms where aquaculture is self-supportive (i.e. aquaculture income > aquaculture
expenditures) in Kenya‟s Kisumu county, Homa Bay county (Nyanza province) and Vihiga
county (Western province). Group A: started aquaculture with the Economic Stimulus
Programme (ESP); Group B: started aquaculture before the ESP and later received some
ESP support; Group C: never received ESP support. Farmed species: Nile tilapia
(Oreochromis niloticus) and African catfish (Clarias gariepinus)
Average
aquaculture
income/farm/year
in KES (USD)
Average aquaculture
expenditures/farm/year
in KES (USD)
Average net
aquaculture
profit/farm/year
in KES (USD)
Self-
supportive
aquaculture
All
(n=60)
81,109
(960)
66,645
(788)
14,463
(171)
45.0%
Group A
(n=28)
112,731
(1,334)
75,946
(898)
36,785
(435)
46.4%
Group B
(n=24)
44,885
(531)
45,402
(537)
-517
(-6)
45.8%
Group C
(n=8)
79,104
(936)
97,824
(1,157)
-18,720
(-221)
37.5%
Fifty-five per cent of respondents stated that aquaculture was an additional business (i.e. no
former activity was dropped in order to take up fish farming); 36.7% stopped one or more
former income-creating activities when starting to farm fish (no response: 8.3%). Former
income-creating activities done by the farmers were mainly of agricultural nature, a few
respondents stated fishing and various salaries. However, fish farmers who replaced a
former activity with aquaculture were usually worse-off (59.1%) than before the start of
fish farming (no response: 13.6%).
6.4 Livelihood Changes
6.4.1 Changes in Diet Diversity, Healthcare, Payment of Schooling Fees and Household Possessions
Overall, livelihood situations of the farmers in terms of diet diversity, household assets and
the ability to take care of their health and pay schooling fees improved with the commence
of fish farming (Figure 6.7). Farmers who stated better situations mostly belonged to
Groups A (most improvement in healthcare and household assets) and B (most
improvement in diet diversity and schooling fees). Farmers who stated worse
circumstances mainly belonged to Group C (in terms of diet diversity, schooling fees and
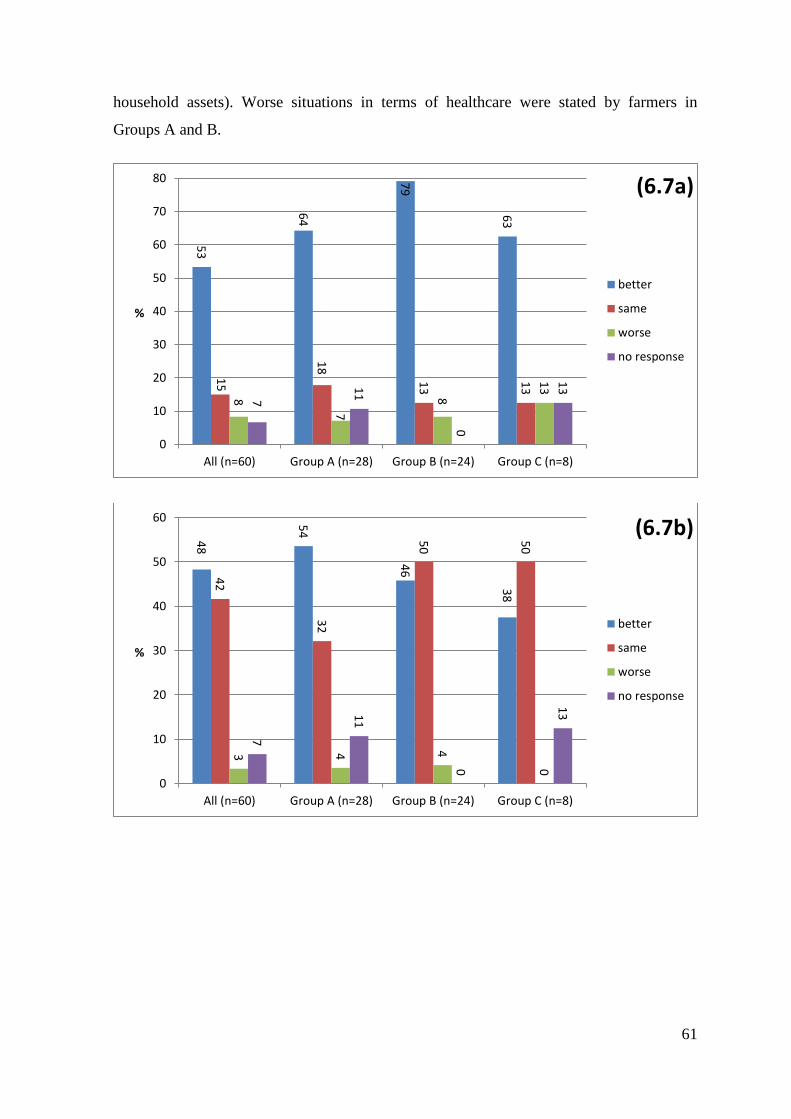
61
household assets). Worse situations in terms of healthcare were stated by farmers in
Groups A and B.
53
64
79
63
15
18
13
13
8
7
8
13
7
11
0
13
0
10
20
30
40
50
60
70
80
All (n=60) Group A (n=28) Group B (n=24) Group C (n=8)
%
(6.7a)
better
same
worse
no response
48
54
46
38
42
32
50
50
3
4
4
0
7
11
0
13
0
10
20
30
40
50
60
All (n=60) Group A (n=28) Group B (n=24) Group C (n=8)
%
(6.7b)
better
same
worse
no response
62
Figure 6.7 Changes in four different livelihood aspects of Nile tilapia (Oreochromis
niloticus) and African catfish (Clarias gariepinus) farmers in Kenya‟s Kisumu county,
Homa Bay county (Nyanza province) and Vihiga county (Western province) since starting
aquaculture: (6.7a) Diet diversity, (6.7b) healthcare, (6.7c) ability to pay schooling fees
and (6.7d) amount of household assets owned. Group A: started aquaculture with the
Economic Stimulus Programme (ESP); Group B: started aquaculture before the ESP and
later received some ESP support; Group C: never received ESP support
6.4.2 Changes in Protein Consumption
Protein consumption is a valuable indicator for livelihood situations (FAO, 2012). In this
study the respondents were firstly asked to indicate their weekly consumption of certain
65
61
71
63
13
14
17
0
10
7 8
25
12
18
4
13
0
10
20
30
40
50
60
70
80
All (n=60) Group A (n=28) Group B (n=24) Group C (n=8)
%
(6.7c)
better
same
worse
no response
47
50
46
38
38
32
46
38
8
7
8
13
7
11
0
13
0
10
20
30
40
50
All (n=60) Group A (n=28) Group B (n=24) Group C (n=8)
%
(6.7d)
better
same
worse
no response
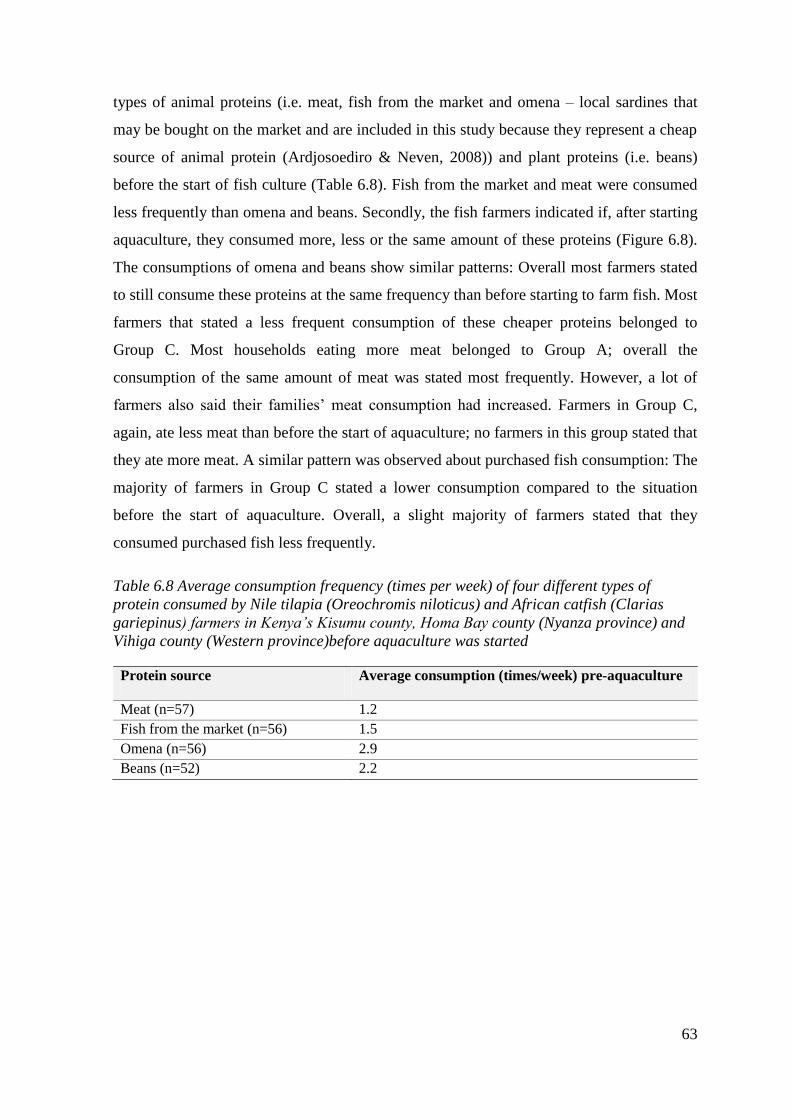
63
types of animal proteins (i.e. meat, fish from the market and omena – local sardines that
may be bought on the market and are included in this study because they represent a cheap
source of animal protein (Ardjosoediro & Neven, 2008)) and plant proteins (i.e. beans)
before the start of fish culture (Table 6.8). Fish from the market and meat were consumed
less frequently than omena and beans. Secondly, the fish farmers indicated if, after starting
aquaculture, they consumed more, less or the same amount of these proteins (Figure 6.8).
The consumptions of omena and beans show similar patterns: Overall most farmers stated
to still consume these proteins at the same frequency than before starting to farm fish. Most
farmers that stated a less frequent consumption of these cheaper proteins belonged to
Group C. Most households eating more meat belonged to Group A; overall the
consumption of the same amount of meat was stated most frequently. However, a lot of
farmers also said their families‟ meat consumption had increased. Farmers in Group C,
again, ate less meat than before the start of aquaculture; no farmers in this group stated that
they ate more meat. A similar pattern was observed about purchased fish consumption: The
majority of farmers in Group C stated a lower consumption compared to the situation
before the start of aquaculture. Overall, a slight majority of farmers stated that they
consumed purchased fish less frequently.
Table 6.8 Average consumption frequency (times per week) of four different types of
protein consumed by Nile tilapia (Oreochromis niloticus) and African catfish (Clarias
gariepinus) farmers in Kenya‟s Kisumu county, Homa Bay county (Nyanza province) and
Vihiga county (Western province)before aquaculture was started
Protein source Average consumption (times/week) pre-aquaculture
Meat (n=57) 1.2
Fish from the market (n=56) 1.5
Omena (n=56) 2.9
Beans (n=52) 2.2
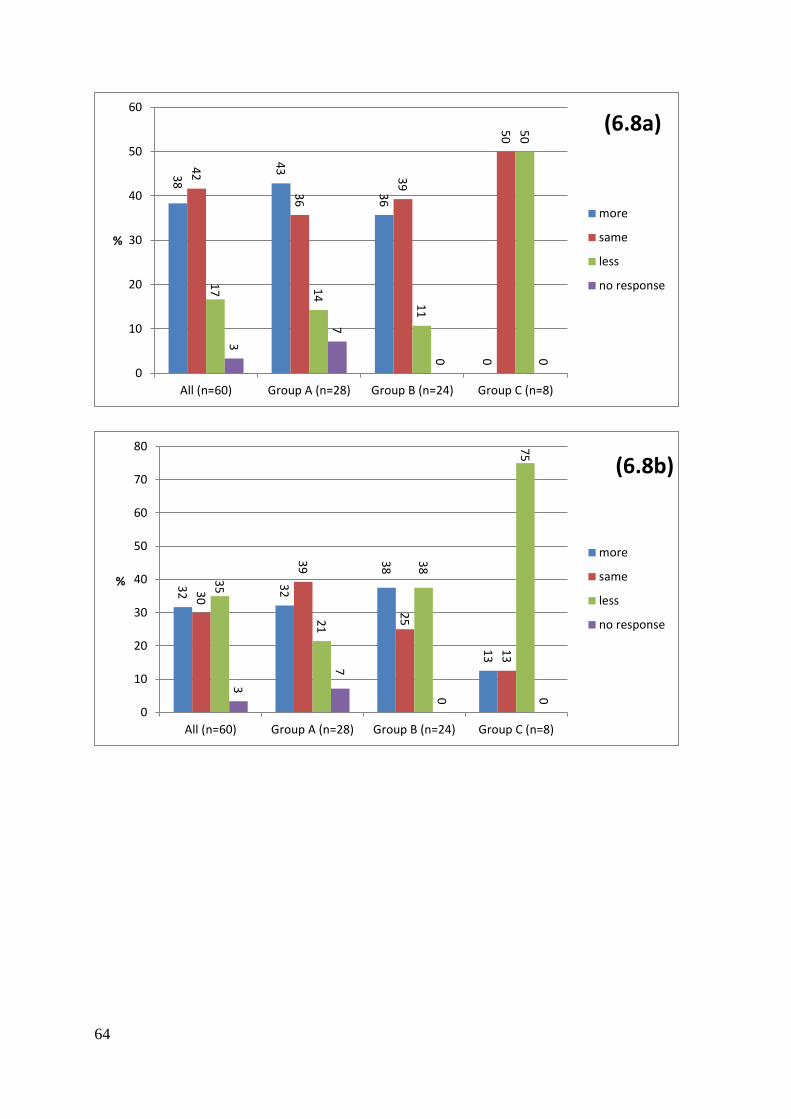
64
38
43
36
0
42
36
39
50
17
14
11
50
3
7
0
0
0
10
20
30
40
50
60
All (n=60) Group A (n=28) Group B (n=24) Group C (n=8)
%
(6.8a)
more
same
less
no response
32
32
38
13
30
39
25
13
35
21
38
75
3
7
0
0
0
10
20
30
40
50
60
70
80
All (n=60) Group A (n=28) Group B (n=24) Group C (n=8)
%
(6.8b)
more
same
less
no response
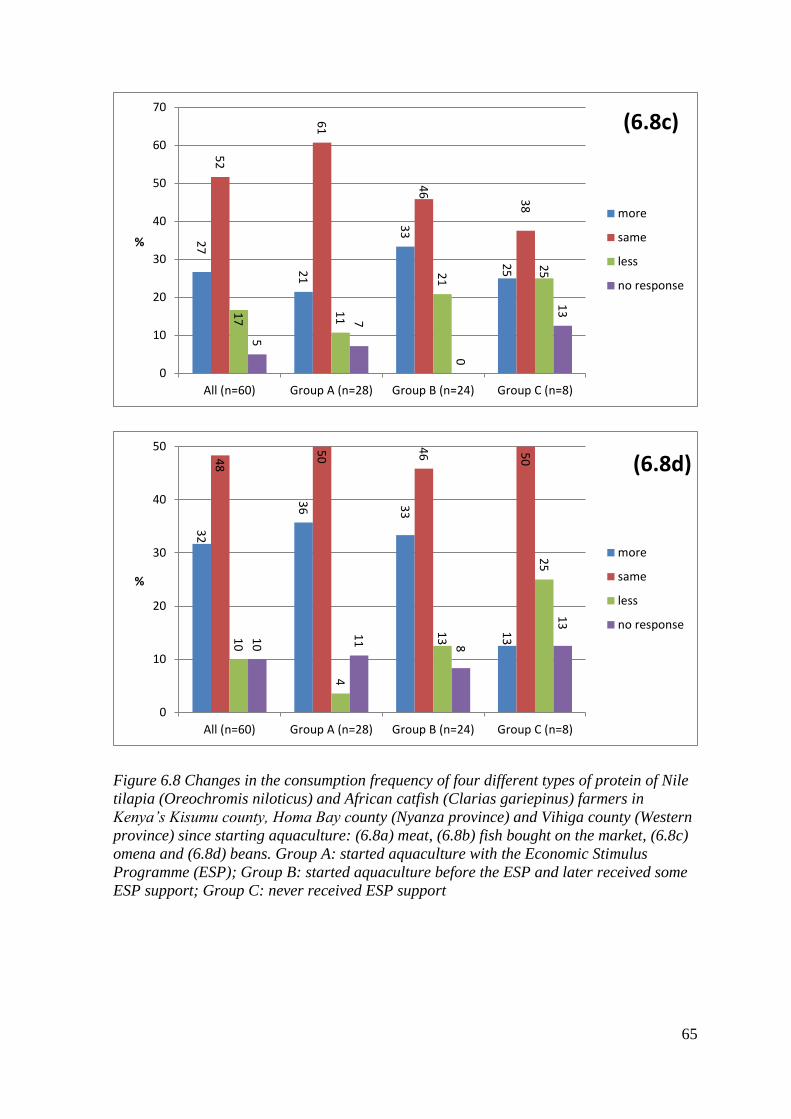
65
Figure 6.8 Changes in the consumption frequency of four different types of protein of Nile
tilapia (Oreochromis niloticus) and African catfish (Clarias gariepinus) farmers in
Kenya‟s Kisumu county, Homa Bay county (Nyanza province) and Vihiga county (Western
province) since starting aquaculture: (6.8a) meat, (6.8b) fish bought on the market, (6.8c)
omena and (6.8d) beans. Group A: started aquaculture with the Economic Stimulus
Programme (ESP); Group B: started aquaculture before the ESP and later received some
ESP support; Group C: never received ESP support
27
21
33
25
52
61
46
38
17
11
21
25
5
7
0
13
0
10
20
30
40
50
60
70
All (n=60) Group A (n=28) Group B (n=24) Group C (n=8)
%
(6.8c)
more
same
less
no response
32
36
33
13
48
50
46
50
10
4
13
25
10
11
8
13
0
10
20
30
40
50
All (n=60) Group A (n=28) Group B (n=24) Group C (n=8)
%
(6.8d)
more
same
less
no response
66
6.5 Future Perspectives
6.5.1 Future Plans and Funding
The majority of fish farmers were planning on expanding their aquaculture enterprises
(Table 6.9). None of the farmers indicated they would discontinue or reduce their
aquaculture. Some of the fish farmers (personal communications, August and September
2012) stated land availability problems as a reason for not being able to expand
aquaculture. The majority of respondents (56.7%) stated the fish farm‟s profits as their
main future aquaculture funding source. Loan application was named by 18.3% of
respondents; 11.7% stated to rely on some sort of subsidies. The remaining 13.3% of
farmers did not know how to finance their aquaculture enterprise in the future.
Table 6.9 Future plans of Nile tilapia (Oreochromis niloticus) and African catfish (Clarias
gariepinus) farmers in Kenya‟s Kisumu county, Homa Bay county (Nyanza province) and
Vihiga county (Western province), concerning their aquaculture enterprise. Group A:
started aquaculture with the Economic Stimulus Programme (ESP); Group B: started
aquaculture before the ESP and later received some ESP support; Group C: never
received ESP support
All (n=60) Group A (n=28) Group B (n=24) Group C(n=8)
Continuation 26.7% 35.7% 20.8% 0%
Expansion 73.3% 64.3% 79.2% 100%
6.5.2 Future Support Needed
The main support needed, in all groups, was financial support. Other needs comprised
training and management/infrastructure (i.e. better access to fish feed and markets,
improved security, better road-infrastructure, better availability storage and cooling
facilities as well as better communication between fish farmers through cooperatives)
(Figure 6.9). Most need for training was mentioned by Group B, followed by Group C. Out
of all groups, farmers in Group A stated the need for most management/infrastructure
related support.
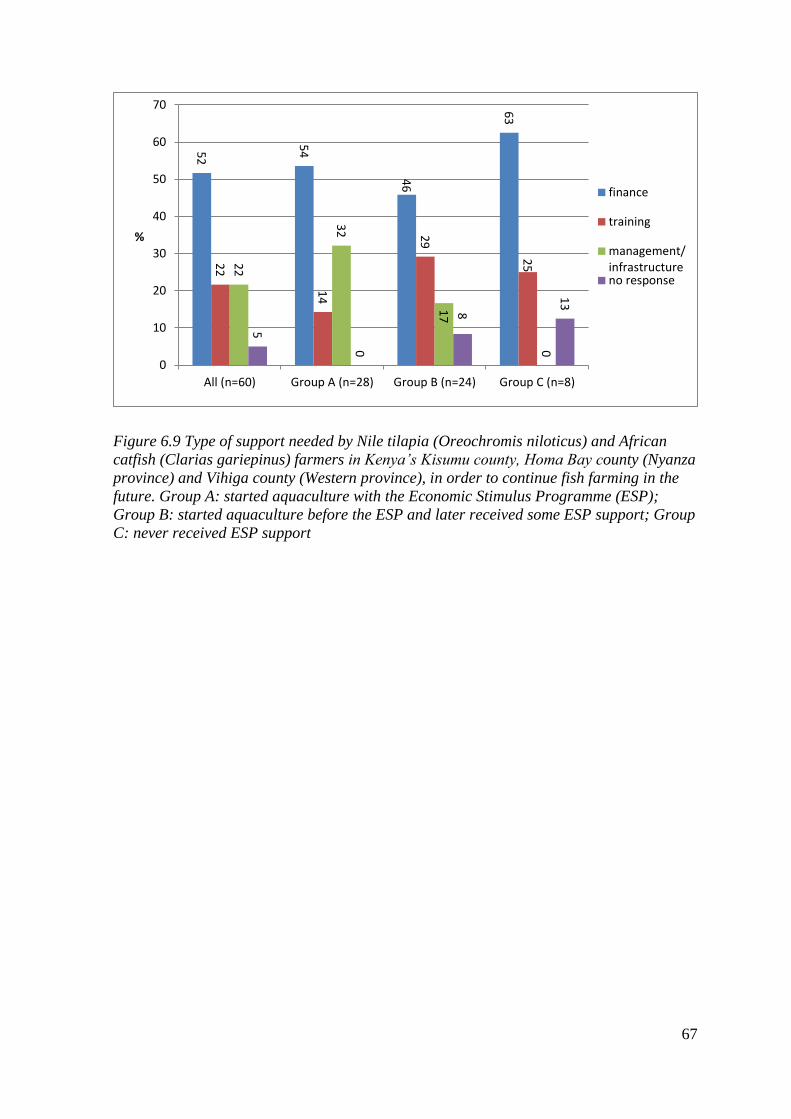
67
Figure 6.9 Type of support needed by Nile tilapia (Oreochromis niloticus) and African
catfish (Clarias gariepinus) farmers in Kenya‟s Kisumu county, Homa Bay county (Nyanza
province) and Vihiga county (Western province), in order to continue fish farming in the
future. Group A: started aquaculture with the Economic Stimulus Programme (ESP);
Group B: started aquaculture before the ESP and later received some ESP support; Group
C: never received ESP support
52
54
46
63
22
14
29
25
22
32
17
0
5
0
8
13
0
10
20
30
40
50
60
70
All (n=60) Group A (n=28) Group B (n=24) Group C (n=8)
%
finance
training
management/infrastructureno response

69
7 Discussion
7.1 Livelihoods and Aquaculture
According to DFID (1999) livelihood improvements can be recorded when communities
experience increased well-being and reduced vulnerability through (a) higher incomes, (b)
improved food security and (c) the more sustainable use of natural resources. However, it
needs to be noted that the application of a more holistic research approach, e.g.
Participatory Rural Appraisal, as suggested by Ahmed (2009), may have changed the
results of this study.
7.1.1 Income Creation and Aquaculture
Overall aquaculture played an important role in income creation in all the surveyed
households. However, the income from other income-creating activities (e.g. agriculture)
was needed to sustain fish farming: On less than half of the surveyed farms, in all groups,
aquaculture was self-supportive. Similar observations about the particular successfulness
of combining agriculture and aquaculture were made by Kawarazuka and Bene (2010), as
well as by Aiga et al., (2009). Only very few self-supportive aquaculture farms after
donor-departure were also reported by Coche et al. (1994), initiating the thought that the
situation in Kenya‟s Lake Victoria region may get worse, since ESP support was, at least
partially, only available until 2012. The overall high importance of salaries and pensions in
income creation may have to do with the rather old group of fish farmers interviewed in
this study. Farmers with no support relied most on aquaculture as their primary source of
income: Possibly they may have had to drop, or reduce, other income creating activities in
order to start fish farming. This is supported by the fact that farmers with no support only
had small, or no, shares in fishing, agriculture and business salaries. ESP support may have
enabled farmers in Group A to keep up fishing, agriculture, livestock farming and regular
businesses. Farmers in Group B depended least on aquaculture as their primary source of
income, but practiced agriculture and had the highest shares in fishing and businesses to
compensate. Their experience with fish farming may have taught them about the riskiness
of aquaculture in the Lake Victoria region with its prevalent flooding and droughts.
70
Drought risks are increased in the study area due to the fish farmers‟ sole dependence on
natural water sources. Later received ESP support possibly eased Group B‟s financial
situation enabling them to go strong on other income creating activities.
Overall, pond productivity in the study area correlated well with the average amount
produced (3 tonnes/ha) on small-scale fish farms in Kenya given by Rothuis et al. (2011).
It was, in fact, often even higher. However, ponds of farmers surveyed in this study did not
fulfil the expectations of the GoK‟s ESP; i.e. 270 kg/300m2/year (Muiruri, 2010).
Interesting to see is that Group A was the only group making profits from aquaculture,
even though Group A´s productivity was the lowest out of all groups. A possible
explanation for this profit is that it builds upon ESP support received by the farmers.
However, because ESP subsidies have been reduced over the years, farmers in Group A
also needed to buy own aquaculture inputs. The comparatively high aquaculture
expenditures in this Group may have to do with the fact that farmers habitually used more
expensive inputs because these were usually supplied by the ESP. Due to lacking
aquaculture experience farmers in Group A may not have known about lower cost
alternatives.
The financial losses in aquaculture recorded by Groups B and C, even though these groups
showed higher productivities than Group A, can possibly be explained by reduced, or no,
funding in these Groups: Expenditures were highest in Group C (no funding); incomes
were however higher than in Group B. Farmers in Group B also went very strong on other
income creating activities, possibly reducing money and time available for aquaculture.
Expenditures in Group B were lowest which can possibly be explained by their long
experience with aquaculture, making them learn about cost-effective farming techniques
(see section 7.1.3). The later received subsidies possibly alleviated their financial situation.
For Group C long aquaculture experience and knowledge about cost-effective farming
practices was not able to compensate for the non-availability of subsidies; expenditures in
this group are highest out of all. Contributing to this may be the fact that farmers in Group
C also employ most labourers.
Overall, it is important to note though that the actual profitability of aquaculture is likely to
be even worse for all groups since only the three most important aquaculture expenditures
were used to calculate aquaculture profits. Also, even though record-keeping was widely
71
practiced by fish farmers in the study area caution needs to be exercised, especially with
results regarding incomes and expenditures.
Even though local markets in the study area were available, market access may was often
recorded to be difficult due to bad road conditions and the fact that most farmers did not
have their own transport. Public transport is costly, possibly hindering farmers from selling
the fish on the markets to increase their profits. The importance of not only market
availability, but also accessibility, for increasing aquaculture profitability was stressed by
Brummett et al. (2011), and Brummett and Williams (2000). Other problems that may
hamper market sales of cultured fish in the study area are the consumers‟ poverty and bad
perception of cultured fish, both observed in the study area. Poverty of fish consumers was
also identified by Brummett and Williams (2000) as a constraint for market sales of
cultured fish.
This study shows that, on a regional scale, some employment was indeed created through
aquaculture. However, small-scale aquaculture often does not create full-time employment
all-year-round. Respondents stated frequently that casual labourers were employed mainly
during pond construction and harvest. Also, most labourers were not only working in
aquaculture, but carried out work in other sections of the farm as well. Important to note is
that for some farmers of this study aquaculture seemed to represent mainly a recreational
activity; not feasible as a full-time activity, but great on the side, especially if it is
subsidised.
7.1.2 Food Security
Changes in protein consumption and overall diet diversity, as perceived by the
respondents, are looked at in this section. Before the start of aquaculture the main proteins
consumed were low-cost proteins like beans and omena. Higher cost options, like
purchased fish and meat were consumed less frequently by all farmers.
After starting aquaculture, fish from the farm´s own ponds were rarely used for home-
consumption, which contradicts with Dey et al. (2006)‟s observation that fish farming
households frequently consumed home-farmed fish. Almost all fish produced in the
households in this study was sold on the market. Indirectly, however, the consumption of
animal protein increased for many farmers in Groups A and B: Fish from the market and
72
meat were, after the start of aquaculture, consumed more frequently in many of the
farmers‟ households. A possible explanation for this observation in Group A may be the
profit from aquaculture, increasing their food accessibility, which was also observed by
Hishamunda & Ridler (2006). Another reason for Group A‟s increase in meat consumption
could be that farmers now have more money to keep livestock on their farm for home
consumption. Neiland et al. (2000)‟s study supported this finding. The increased
consumption of purchased fish and meat by Group B cannot be explained by profits made
from fish farming. However, out of all groups, farmers in Group B spent most of their total
household income (from aquaculture and other sources) on personal items, which include
food. Respondents in this study harvested their fish once or twice per year to sell the fish
on the market. Large amounts of fish cannot be kept at home for home-consumption due to
the often reported lack of storage and cooling facilities. If farmers wanted to produce fish
for home-consumption only, continuous harvest methods would have to be applied.
Aquaculture in the study area hence produced „cash crops‟, not „food crops‟. Protein
consumption of farmers in Groups A and B may have improved, but indirectly through the
generation of income. However, it is possible that the farmers who stated a lower
consumption of purchased fish than before the start of aquaculture replaced the
consumption of previously purchased fish with fish from the own ponds.
An exception in protein consumption was made by Group C. Even though all the fish
harvested is sold on the market, meat consumption showed no increase, and purchased fish
consumption increased least compared to the other groups. Farmers in this Group only
record financial losses from their aquaculture and may hence not have money available to
spend on animal protein.
Beans and omena kept their high importance as protein sources in the surveyed
households, and were often also consumed more than before the acquisition of fish ponds.
Both are traditional and low-cost foods in Kenya.
Overall diet diversity increased for all farmers since starting aquaculture; mainly, however,
for Group B. Most farmers stating worse diet diversities since starting aquaculture were
from Group C. Possible explanations are that Group C records serious financial losses with
their aquaculture. Also, farmers in this group did not use any of the harvested fish for
home-consumption to increase their diet diversities. Groups A and B, on the other hand,
73
stated at least some minor home-consumption of harvested fish which may have helped to
make these households´ diets more diverse. Diet diversities possibly also increased through
food items bought with the income generated.
Caution, however, needs to be exercised when looking at findings stated in this section:
Some farmers may not have answered these rather personal questions honestly, be it
because of embarrassment and/or the expectation that stating improvements in nutrition
through aquaculture may make extension personnel continue fish farming subsidies
(extension officers, personal communications, August and September 2012).
Overall, the findings of this study compare well with Kawarazuka and Bene (2010) and
Thompson et al. (2002), indicating that farmed fish is often mainly used as a cash crop, not
a food crop. Incomes are then used to buy staple foods (Jahan et al., 2010) as well as non-
staple foods (Dey et al., 2006), which was both observed in this study. However, further
research is needed in order to assess the actual nutritional situation of the fish farmers since
the sole increased availability of food items does not equal better nutrition.
7.1.3 Sustainable Use of Natural Resources
One way to increase the farms‟ profits, and hence support livelihoods, is the integration of
fish farming in other traditional farming activities, as shown by Dey et al. (2006). Since
Nile tilapia and African catfish feed well on a variety of different feeds, these species are
ideal for an integrated aquaculture approach. This study shows that farmers indeed used a
variety of different feeds for the fish. The utilization of on-farm and locally produced
material like banana leaves, maize and protein-rich omena, makes sense as these
ingredients are cost-effective and readily available. However, most farmers (especially
farmers that received ESP support) chiefly used formulated feeds such as pellets and mash.
These are expensive and often not locally available; making feeds the most frequently
stated aquaculture related expenditure. Also, great distances usually had to be covered in
order to buy these feeds, adding to the total aquaculture expenses. Farmers who did not
receive aquaculture funding rely to a greater extent on cheaper and locally available feeds.
In order to secure fast and secure fish growth to achieve high market prices, the use of
high-protein feeds is preferred. In the study area these were comprised of locally available
freshwater animals from Lake Victoria and formulated feeds. Farmers in Groups B and C
used locally available high-protein feeds more often than farmers in Group A, and at the
74
same time showed higher pond productivities. Hence, good fish growth does not seem to
depend solely on the use of formulated feeds.
Pond fertilizers used in the study area were mainly on-farm and locally produced materials,
not adding to expenditures related to aquaculture. These cheap and readily available
agricultural by-products and farm waste products would otherwise be of less (or no)
importance on the farms. However, again farmers in Group A were the main users of more
expensive chemical fertilizers. Especially when aquaculture support is terminated, this
could lower aquaculture profits.
Another way of integrating fish farming into agriculture is the re-use of pond water (e.g.
for watering crops). This, however, was not widely practiced. Especially in the dry seasons
this could help to improve crop farming and should therefore be encouraged. Higher crop
yields could increase the farmers‟ incomes and/or nutrition which would, in turn, better
their livelihoods as shown by Dey et al. (2006). Especially farmers in Group A did not
often practice pond water re-use. Farmers in Groups B and C used this practice more,
possibly due to their longer experience with fish farming.
The farming of both, tilapia and catfish (also in polyculture systems), gives the benefit of
having another fish species to sell on the market and may hence increase the farmers‟
incomes to improve their livelihoods. Overall, however, this was not widely practiced and
should be encouraged for above stated reasons. Mainly farmers in Groups B and C were
aware of the benefits of farming both species, also in polyculture, possibly due to their
longer experience with fish farming compared to Group A.
The use of polysex fingerlings would initiate the production of own fingerlings in years to
come, lowering aquaculture expenditures (also travel expenses since monosex fingerlings
are not usually obtained locally) and increasing aquaculture profits that could be used to
improve livelihoods. Farmers in Group C were the main users of polysex fingerlings,
possibly due to the cost-effectiveness of this option. Supportive is the fact that fingerlings
were not part of main aquaculture related expenditures in Group C. Farmers in Group B,
possibly habitually, used a high portion of polysex fingerlings. Fingerlings however still
contributed to aquaculture related expenditures in this group. Farmers in Group A
(possibly habitually) chiefly used only-male monosex fingerlings, perhaps because these
75
were subsidised by the ESP. Monosex fingerlings increase and accelerate pond production
and are hence convenient to use for commercial aquaculture, but are also very costly.
Overall, fish farmers in Groups B and C did best in cost-effective and environmentally
sustainable farming practices. This can possibly be accounted to the longer aquaculture
experience of these farmers: Over time, they gained a good understanding of the
functioning and potential of certain aquaculture techniques, and will possibly guide further
evolution towards greater productivity and profitability. It is also possible that farmers in
Group B worked with researchers to improve fish farming techniques before GoK support
followed. Farmers in Group A, possibly due to lacking aquaculture experience, only had
limited knowledge about cost-effective and environmentally sustainable farming practices.
However, even though their pond productivity was lowest from all groups, these farmers
were the only ones to record profits from aquaculture in this study. This is likely to be the
case because farmers in this group still benefitted from the ESP support which is supported
by the fact that out of all groups farmers in Group A spent least on pond construction, fish
feeds and fingerlings; and overall invested least money into aquaculture. However, farmers
in Group A still invested a major amount of their total household incomes (from
aquaculture and other sources) in aquaculture. This may be the case because farmers in this
group have lacking aquaculture experience and may buy inputs (formerly) supported by the
ESP, which are usually of a more expensive nature than locally produced inputs. The
highest investment of household incomes into aquaculture was observed in Group C,
possibly because no support was available for these farmers. Overall, a more evolutionary
pathway as described by Brummett and Williams (2000) and practiced by Groups B and C
in this study, was found to be most successful in this study. Generally, the introduction of
fish farming should have built more on natural resource constraints and the local
knowledge base as suggested by Hishamunda and Ridler, 2006, Brummett and Williams,
2000, and Coche et al., 1994 to make aquaculture development sustainable in the long-
term.
Trainings on how to increase pond productivities without subsidies (e.g. through the
application of more cost-effective farming practices) are crucial for farmers in the study
area. Methods for processing and storing agricultural by-products for their subsequent use
in aquaculture should be promoted.
76
7.1.4 Other Aspects
Other considerations for livelihood improvements, which are not explicitly incorporated in
the DFID (1999) definition, but in the context of this study became obvious, are dealt with
in this section.
Environmental Conservation
This study shows that some fish farmers gave up fishing in Lake Victoria to start farming
fish. Aquaculture could hence help to replenish reduced fish stocks in the lake; indirectly
securing employment opportunities and animal protein availability for lakeside
communities in the future through improved capture fisheries. With supporting aquaculture
development the GoK hence has a promising chance avoiding the aggravation of
environmental problems in Lake Victoria and hopefully even enhancing the situation.
More research, however needs to be done on the fishing- and aquaculture relationship since
many of the fish farms visited in this study were located quite far inland, and are hence
rather unlikely to represent former capture fishing households.
Empowering Underprivileged Groups – Women and Young People
Aquaculture, since it is an activity with many different stakeholders, can provide
employment also to women and young people. This study, however, mainly incorporated
male and quite old farmers. However, because on many farms aquaculture represented an
added activity to the other farming activities, additional workers were needed. This
possibly gave employment opportunities to the farmers‟ families. By supporting
aquaculture development the GoK may hence also have provided incomes to
underprivileged groups, i.e. women and young people, as established by Hino (2011), and
Jagger and Pender (2001). In order to further assess the roles of these groups more research
needs to be done incorporating additional groups of stakeholders.
Changes in other Livelihood Parameters
Changes in certain other livelihood parameters that indicate increased well-being; i.e.
increased healthcare, the increased possession of household assets and the increased ability
to pay schooling fees were also chosen in this study to shed light on livelihood changes of
the fish farmers in the study area.
77
Overall, livelihood situations of the fish farmers in terms of the above-stated livelihood
parameters improved with commence of fish farming. Profits from aquaculture may have
enabled farmers from Group A to initiate these improvements. However, the also rather
favourable situations of Groups B and C cannot be explained with income creation by
aquaculture. I suspect here that farmers may have tried to impress me when answering
these rather personal questions about their well-being.
7.2 Future Challenges and Opportunities
In order to help fish farmers increase production and hence increase aquaculture profits to
improve livelihoods, their problems need to be taken care of. Financial problems were
mentioned primarily by most farmers. Farmers in Group C, probably due to the lack of
financial support, had the most severe financial problems. Financial problems of farmers in
Group A may have arisen from the fact that these farmers hardly used any cost-effective
farming techniques, increasing their aquaculture related expenditures with decreasing
subsidies. Trainings about integrated farming techniques may help alleviate financial
problems on the farms. However, some farmers may have exaggerated financial issues in
the hope of receiving more support.
Many of the other problems mentioned, e.g. seepage problems, predation problems and
security issues, could be taken care of by building better ponds, the use of fences and nets
against predators and the employment of security staff. This, however, calls for trainings
and/or the availability of more capital. It is important to build a solid base of knowledge to
eventually achieve self-sufficiency of aquaculture since support is temporary. This should
have been a priority from the start of the ESP, especially as Ahmed (2009) identifies
trainings as low-cost methods to increase fish farming productivity. Trainings through the
ESP were offered in the study area, but not sufficiently attended by the farmers. This may
be due to insufficient advertisement or due to training-locations not easily accessible for
fish farmers. Minimizing these constraints could raise the training-attendance of fish
farmers, helping to educate them about sustainable fish farming practices. However, the
fact that almost twice as many farmers who started aquaculture on their own initiative
attended trainings may also show that farmers in this group had a higher interest in
learning about fish farming than farmers who were imposed from outside. This is
supported by ALCOM (1994). Also, out of all groups, the need for trainings in the future
78
was mostly realized by farmers from Group B, and least by farmers from Group A. A
possible reason could be that farmers in Group A were not aware of problems, due to their
lacking aquaculture experience. Local farm supervision by trained cooperative members
who attentively point out problems to inexperienced fish farmers could be one way to
alleviate the situation. Increasing aquaculture profits could be achieved by improving the
marketing of the fish through improved availability of storage and cooling facilities. Also,
even though Alal (2012) stressed that market availability in Kenya‟s Lake Victoria region
is not a problem, access to the markets was often complicated for the farmers in the study
area. Improving road infrastructure would possibly help to alleviate this problem. The
respondents were aware of these shortcomings. Frequently stated were „better market
access‟ and „availability of storage and cooling facilities‟ as support needed in the future.
Most farmers were planning on expanding their fish farming businesses and financing
these actions through farm profits. However, only 32.8% % of ponds in Group A were
constructed without support from the ESP, i.e. only on these farms expansion had already
taken place. Since ESP support is ending, financing aquaculture by aquaculture profits may
even be impossible for farmers in Group A, if no increase in profits takes place. Alarming
is the large number of fish farmers that did not know how to finance their ponds in the
future. A small number of farmers stated their plan of future aquaculture financing as being
loans. However, this study shows that only a total of seven respondents ever applied for a
loan. Low levels of credit use by fish farmers in Kenya were also observed by Quagrainie
et al. (2010). This may have to do with non-sufficient knowledge about available loans or
simply the fear of applying for a loan. More advertising activities need to be undertaken in
order to promote potential future support programmes, and also loans available to the fish
farmers, to boost aquaculture production. Such advertisement should be done through
extension officers, promotional activities and also the media. These were sources of
information found to be well-perceived by the respondents of this study.
7.3 Conclusions
In conclusion, this study shows that livelihoods of ESP supported farmers in Kenya‟s Lake
Victoria region have indeed improved in terms of increased protein consumptions.
However, observed improvements are mainly indirect, possibly through the generation of
income from aquaculture. Since fish pond productivities of ESP supported fish farmers are
79
exceptionally low, profits were possibly only recorded because aquaculture inputs were, at
least partially, subsidized over the years. Efforts hence need to be made to increase the
productivity of fish ponds in the study area, securing the continuation of aquaculture after
ESP subsidies have completely stopped. Governmental aquaculture subsidies helped fish
farmers in the short-term, i.e. through income generation and increased protein
accessibility, but it failed to teach farmers how to achieve self-sustainable aquaculture
without the help of subsidies. One way of achieving higher pond productivities, and hence
self-sustainable aquaculture practices, is the promotion of sustainable and integrated
aquaculture-agriculture farming practices, allowing for the use of locally available and
cost-effective aquaculture inputs. This fish farming technology was, however, not widely
used by ESP supported farmers. The risk is high that if pond productivities are not
increased, aquaculture practices may be discontinued having negative consequences on the
farmers‟ livelihoods.
7.4 Recommendations
The following recommendations, based on the outcomes of this study, should be noted in
order to successfully continue aquaculture in western Kenya to help improve livelihoods:
I) Fish farmers should be educated about integrated aquaculture systems to make fish
farming more sustainable and cost-effective.
II) The perception of farmed fish needs to be improved among rural communities.
III) Farmers should be taught how to produce their own high-quality fish feed from
local and easily available ingredients.
IV) Local feed mills and local hatcheries should be promoted to reduce transport costs
for important fish farm inputs and high mortality rates of fingerlings.
V) Further encourage fish farmers to be members of fish farming groups and
cooperatives to improve communication amongst fish farmers which may prove to
be helpful in problem solving.
80
VI) Train cooperative members to be able to supervise and train other farmers in the
area, especially on predator control tools, achievement of farm security and
integrated aquaculture.
VII) Improved publication of relevant aquaculture development project results and
improvements through appropriate media in order to attract the interest of rural
people, governmental and non-governmental organizations and funding agencies.
VIII) Testing of the suitability of the area and community setting before promoting
aquaculture projects in order to avoid the building of ponds in unsuitable areas, i.e.
areas where land and water availability are scarce.
IX) The development of a suitable model for fish marketing mechanisms is necessary.
This includes certain infrastructural facilities such as the availability of storage and
cooling facilities and an improved road network.
X) Educate fish farmers on the use of loans and instruct commercial agricultural
lenders to invest in the aquaculture enterprise.
XI) More large-scale intensive fish farming systems need to be developed to keep up
with continuously increasing needs for fish.
XII) The model for large-scale commercial aquaculture systems in Kenya needs to be
critically assessed in terms of equity and (environmental) sustainability in order to
avoid social disruption and environmental degradation. Environmental regulations
need to be monitored.
XIII) Promote local participation and investments in wider research and knowledge.
XIV) The reliance of fish farmers on natural water resources needs to be alleviated, e.g.
through the construction of boreholes, to secure water supply during droughts.
81
References
AfDB, OECD, UNDP & UNECA (2012). African Economic Outlook 2012. Paris:
Organisation for Economic Co-operation and Development.
Ahmed, N. (2009). The Sustainable Livelihoods Approach to the Development of Fish
Farming in Rural Bangladesh. Journal of International Farm Management, 4(4), 1-18.
Aiga, H., Matsuoka, S., Kuroiwa, C. & Yamamoto, S. (2009). Malnutrition among children in
rural Malawian fish-farming households. Transactions of the Royal Society of
Tropical Medicine and Hygiene, 103(8), 827-833.
Alal, M. (2012). Fish Landing Sites to Improve Fish Production in Kenya. Retrieved from
http://www.africanews.com/site/list_message/44179
ALCOM (1994). Aquaculture into the 21st Century in Southern Africa. Rome: Food and
Agriculture Organization of the United Nations.
Alderman, H. (1986). The effect of food price and income changes on the acquisition of food
by low-income households. Washington DC: International Food Policy Research
Institute.
Ardjosoediro, I. & Neven, D. (2008). The Kenya Capture Fisheries Value Chain: An AMAP-
FSKG Value Chain Finance Case Study Micro Report #122. USAID.
Bellù, L.G. (2005). Impacts of Policies on Poverty. Rome: Food and Agriculture Organization
of the United Nations.
Bene, C., Steel, E., Luadia, B.K. & Gordon, A. (2009). Fish as the „bank in the water‟ –
Evidence from chronic-poor communities in Congo. Food Policy, 34(1), 108-118.
Bernard, H.R. (2006). Research Methods in Anthroplogy; Qualitative and Quantitative
Approaches. Lanham: AltaMira Press.
82
Brummett, R.E. & Williams, M.J. (2000). The evolution of aquaculture in African rural and
economic development. Ecological Economics, 33(2), 193-203.
Brummett, R.E., Gockowski, J., Pouomogne, V. & Muir, J. (2011). Targeting agricultural
research and extension for food security and poverty alleviation: A case study of fish
farming in Central Cameroon. Food Policy, 36(6), 805-814.
CIA (2013). The World Factbook Kenya. Retrieved from
https://www.cia.gov/library/publications/the-world-factbook/geos/ke.html
Climate Data (n.d.). Climate Kisumu – Kenya. Retrieved from
http://www.climatedata.eu/climate.php?loc=kexx0005&lang=en
Coche, A.G., Haight, B.A. & Vincke, M.M.J. (1994). Aquaculture development and research
in sub-Saharan Africa. Rome: Food and Agriculture Organization of the United
Nations.
CRA (2011). Kenya County Fact Sheets. Nairobi: Commission on Revenue Allocation.
Dey, M.M., Kambewa, P., Prein, M., Jamu, D., Paraguas, F.J., Pemsl, D.E. & Briones, R.M.
(2006). Impact of Development and Dissemination of Integrated Aquaculture-
Agriculture (IAA) Technologies in Malawi. NAGA, WorldFishCenterQuaterly, 29(1-
2), 28-35.
DFID (1999). Sustainable Livelihoods Guidance Sheets. London: Department for
International Development.
Dominion Farms (2011). Dominion Farm Case Study - Life out of the Yala Swamp. Retrieved
from http://www.aecfafrica.org/download/Life-Out-of-the-Swamp.pdf
EPZA (2005). Fishery Industry in Kenya 2005. Nairobi: Export Processing Zones Authority.
FAO (1997). Rural Aquaculture: Overview and Framework for Country Reviews. Retrieved
from http://www.fao.org/docrep/003/X6941E/x6941e04.htm
FAO (2008). The State of Food and Agriculture; Biofuels: Prospects, Risks and
Opportunities. Rome: Food and Agriculture Organization of the United Nations.
83
FAO (2012). The State of World Fisheries and Aquaculture 2012. Rome: Food and
Agriculture Organization of the United Nations.
FAO (2013a). Low-Income Food-Deficit Countries (LIFDC) – List for 2012. Retrieved from
http://www.fao.org/countryprofiles/lifdc/en/
FAO (2013b). National Aquaculture Sector Overview Kenya. Retrieved from
http://www.fao.org/fishery/countrysector/naso_kenya/en
Fisheries Department (2012). Fisheries Annual Statistical Bulletin 2011. Nairobi: Ministry of
Fisheries Development.
Google Maps (2013). Vihiga Kenya. Retrieved from
https://maps.google.is/maps?hl=en&q=vihiga&ie=UTF-
8&hq=&hnear=0x17800c2778604159:0x7e448ddc8e934919,Vihiga,+Kenya&gl=is&
ei=aZsQUafMLcKl0AWsp4DAAQ&ved=0CIkBELYD
Guerrero, R.D. (1980). Studies on the feeding of Tilapia-Nilotica in floating cages.
Aquaculture, 20(3), 169-175.
Hino, J. (2011). Uncharted Waters: Kenya Takes Dramatic Leap In Aquaculture. Corvallis:
Global Aquaculture Advocate.
Hishamunda, N. & Ridler, N.B. (2006). Farming fish for profits: A small step towards food
security in sub-Saharan Africa. Food Policy, 31(5), 401-414.
Hishamunda, N., Cai, J. & Leung, P. (2009). Commercial aquaculture and economic growth,
poverty alleviation and food security Assessment framework. Rome: Food and
Agriculture Organization of the United Nations.
Israel Diplomatic Network (2012). Kenyan-German-Israel Trilateral Tilapia Cooperation.
Retrieved from http://embassies.gov.il/nairobi/NewsAndEvents/Pages/Trilateral-
Tilapia-Cooperation.aspx
Jagger, P. & Pender, J. (2001). Markets, marketing and production issues for aquaculture in
East Africa: The case of Uganda. Naga, 24(1-2), 42-51.
84
Jahan, K.M., Ahmed, N. & Belton, B. (2010). The impacts of aquaculture on food security:
lessons from Bangladesh. Aquaculture Research, 41(4), 481-495.
Kaliba, A.R., Ngugi, C.C., Mackambo, J. & Quagrainie, K.K. (2007). Economic profitability
of Nile tilapia (Oreochromis niloticus L.) production in Kenya. Aquaculture Research,
38(11), 1129-1136.
Kawarazuka, N. & Bene, C. (2010). Linking small-scale fisheries and aquaculture to
household nutritional security: an overview. Food Security, 2(4), 343-357.
KMFRI (2012). EFMIS-Ke Market Bulletin [Brochure]. Kisumu: Kenya Marine and Fisheries
Research Institute.
Manyala, J.O. (2011). Fishery Value Chain Analysis Background Report – Kenya. (n.p.)
Manyala, J.O. (in press). Analysis of a Baseline Data Collection Conducted within the
framework of the Trilateral Cooperation between the Republic of Kenya, the State of
Israel and the Federal Republic of Germany to improve the Tilapia value chain in the
North Western region of Kenya. Eldoret: Deutsche Gesellschaft für Internationale
Zusammenarbeit.
Marshall, C. & Rossman, G.B. (2011). Designing Qualitative Research Fifth Edition.
Thousand Oaks: SAGE Publications, Inc.
Mbugua, H.M. (2008a). Aquaculture in Kenya; Status, Challenges and Opportunities.
Directorate of Aquaculture Development, Kenya.
Mbugua, H.M. (2008b). Opportunities in Fish Farming for Employment and Sustainable
Livelihoods in Kenya. Ministry of Fisheries Development, Kenya.
Ministry of Foreign Affairs of Denmark (2006). Kenya-Denmark Partnership, Strategy for
Development Cooperation 2006 – 2010. Copenhagen: Ministry of Foreign Affairs of
Denmark.
Miruka, O. (2001). Oral Literature of the Luo. Nairobi: East African Educational Publishers
Ltd.
Muiruri, F. (2012, April). Fish farms answer to declining stock. The Link, p. 2.
85
National Environment Management Authority (2005). Draft report on Kenya´s climate
change technology needs and needs assessment report under the United Nations
framework convention on climate change. Nairobi: National Environment
Management Authority Ministry of Environment and Natural Resources.
Neiland, A.E., Jaffry, S., Ladu, B.M.B., Sarch, M.P. & Madakan, S.P. (2000). Inland fisheries
of North East Nigeria including the Upper River Benue, Lake Chad and the Nguru-
Gashua wetlands I. Characterization and analysis of planning suppositions. Fisheries
Research, 48(3), 229-243.
Ngugi, C.C. & Manyala, J.O. (2004). Aquaculture extension services in Kenya. Retrieved
from http://www.fao.org/docrep/007/y5641e/y5641e09.htm#bm9
Ngugi, C.C., Bowman, J.R. & Omolo, B.O. (2007). A new Guide to Fish Farming in Kenya.
Corvallis: Aquaculture Collaborative Research Support Program.
Odada, E.O., Olago, D.O., Kulindwa, K.A.A., Ntiba, M. & Wandiga, S. (2004). Mitigation of
environmental problems in Lake Victoria, East Africa: Causal chain and policy option
analyses. AMBIO, 33(1-2), 13-23.
Okechi, J.K. (2004). Profitability assessment: A case study of African catfish (Clarias
gariepinus) farming in the Lake Victoria Basin, Kenya. Reykjavík: The United
Nations University.
Otieno, S. (2012). Fish farming picking up well – Researchers. Retrieved from
http://www.the-star.co.ke/news/article-99042/fish-farming-picking-well-researchers
Pillay, T. (1997). Economic and social dimensions of aquaculture management. Aquaculture
Economics and Management, 1(1-2), 3-11.
Prado, J., Beare, R.J., Siwo, J.M. & Oluka, L.E. (1991). Regional Project for Inland Fisheries
Planning, Development and Management in Eastern/Central/Southern Africa
(I.F.I.P.) – A Catalogue of Fishing Methods and Gear used in Lake Victoria. Rome:
Food and Agriculture Organization of the United Nations.
Quagrainie, K.K., Ngugi, C.C. & Amisah, S. (2010). Analysis of the use of credit facilities by
small-scale fish farmers in Kenya. Aquaculture International, 18(3), 393-402.
86
Rothuis A., van Duijn, A.P., van Rijsingen, J., van der Pijl, W. & Rurangwa, E. (2011).
Business opportunities for aquaculture in Kenya with special reference to food
security. The Hague: Wageningen UR.
Russell, A.J.M., Grötz, P.A., Kriesemer, S.K. & Pemsl, D.E. (2008). Recommendation
Domains for Pond Aquaculture Country Case Study: Development and Status of
Freshwater Aquaculture in Malawi. Penang: The WorldFish Center.
The World Bank (2007). Changing the Face of the Waters – The Promise and Challenge of
Sustainable Aquaculture. Washington, DC: The World Bank.
Thompson, P., Roos, N., Sultana, P. & Thilsted, S.H. (2002). Changing significance of inland
fisheries for livelihoods and nutrition in Bangladesh. In Kataki, P.K. & Babu, S.C.
(eds.), Food systems for improved human nutrition: linking agriculture, nutrition and
productivity (pp. 249-317). Binghamton: Haworth Press.
TISA (2010). How is the ESP Performing in Your Constituency? [Brochure]. Nairobi: The
Institute for Social Accountability.
Von Braun, J., Bouis, H., Kumar, S. & Pandya-Lorch, R. (1992). Improving food security of
the poor: concept, policy and programs. Washington: International Food Policy
Research Institute.
Weeratunge, N., Snyder, K.A. & Sze, C.P. (2010). Gleaner, fisher, trader, processor:
understanding gendered employment in fisheries and aquaculture. Fish and Fisheries,
11(4), 405-420.
World Databank (2013). World Development Indicators (WDI). Retrieved from
http://databank.worldbank.org/ddp/home.do?Step=12&id=4&CNO=2
WorldFishCenter (2005). Fisheries and the Millennium Development Goals: Solutions for
Africa. Retrieved from http://www.fishforall.org/ffa-
summit/English/FisheriesMDGs_22_8_lowres.pdf
Yosef, S. (2009). Rich Food for Poor People – Genetically Improved Tilapia in the
Philippines. Washington DC: International Food Policy Research Institute (IFPRI).

87
Appendix A – Research Questionnaire

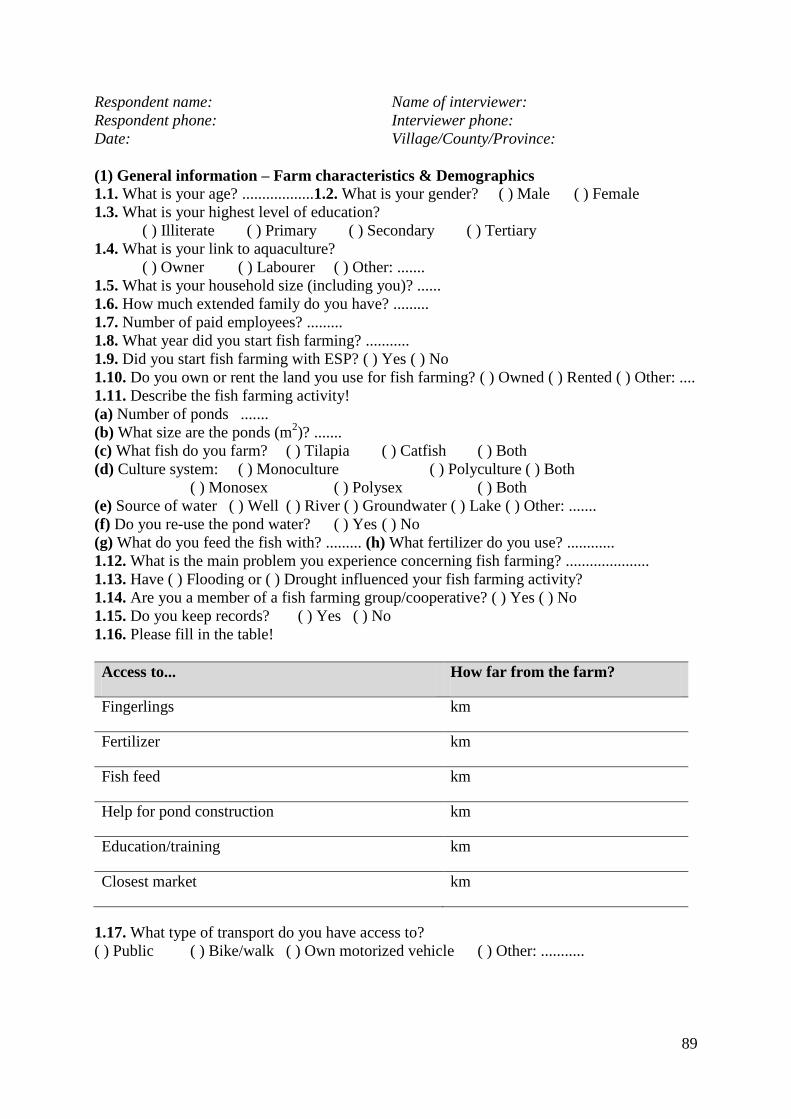
89
Respondent name: Name of interviewer:
Respondent phone: Interviewer phone:
Date: Village/County/Province:
(1) General information – Farm characteristics & Demographics
1.1. What is your age? ..................1.2. What is your gender? ( ) Male ( ) Female
1.3. What is your highest level of education?
( ) Illiterate ( ) Primary ( ) Secondary ( ) Tertiary
1.4. What is your link to aquaculture?
( ) Owner ( ) Labourer ( ) Other: .......
1.5. What is your household size (including you)? ......
1.6. How much extended family do you have? .........
1.7. Number of paid employees? .........
1.8. What year did you start fish farming? ...........
1.9. Did you start fish farming with ESP? ( ) Yes ( ) No
1.10. Do you own or rent the land you use for fish farming? ( ) Owned ( ) Rented ( ) Other: ....
1.11. Describe the fish farming activity!
(a) Number of ponds .......
(b) What size are the ponds (m2)? .......
(c) What fish do you farm? ( ) Tilapia ( ) Catfish ( ) Both
(d) Culture system: ( ) Monoculture ( ) Polyculture ( ) Both
( ) Monosex ( ) Polysex ( ) Both
(e) Source of water ( ) Well ( ) River ( ) Groundwater ( ) Lake ( ) Other: .......
(f) Do you re-use the pond water? ( ) Yes ( ) No
(g) What do you feed the fish with? ......... (h) What fertilizer do you use? ............
1.12. What is the main problem you experience concerning fish farming? .....................
1.13. Have ( ) Flooding or ( ) Drought influenced your fish farming activity?
1.14. Are you a member of a fish farming group/cooperative? ( ) Yes ( ) No
1.15. Do you keep records? ( ) Yes ( ) No
1.16. Please fill in the table!
Access to... How far from the farm?
Fingerlings km
Fertilizer km
Fish feed km
Help for pond construction km
Education/training km
Closest market km
1.17. What type of transport do you have access to?
( ) Public ( ) Bike/walk ( ) Own motorized vehicle ( ) Other: ...........
90
(2) Support mechanisms used
2.1. What sources of support do/did you receive?
( ) ESP ponds (number: ...........) ( ) ESP feed ( ) Other: ..........
( ) ESP trainings (number: ..........) ( ) ESP fingerlings
2.2. If farmer receives ESP support: What is his/her source of information?
( ) Promotional activities ( ) Extension officers ( ) Other farmers ( ) Media ( ) Other: .........
2.3. If the farmer does not receive ESP support, why not? .......
2.4. Have you ever applied for a loan? ( ) Yes ( ) No
2.5. Was it successful? ( ) Yes ( ) No
(3) Farm wealth
3.1. Time between stocking of pond and re-stocking of pond (= length of cycle): ..... months
3.2. What are your sources of income (1 = most important, 5 = least important)?
1: .......................... 3: .............................. 5: ...............................
2: ......................... 4: ..............................
3.3. Income from aquaculture per cycle? KES..........
3.4. Is aquaculture an additional source of income? ( ) Yes ( ) No
3.5. If no – which former activity was replaced by aquaculture? .................
3.6. Income from this former activity? KES/year ...........
3.7. Aquaculture related expenditures (1 = most important, 3 = least important)
1: .............................. KES/cycle: .............
2: .............................. KES/cycle: .............
3: ............................. KES/cycle: .............
3.8. Size of last fish harvest? Kg .................
3.9. What are you mainly using the harvested fish for?
( ) Sold on market ( ) given to relatives/neighbours/payment-in-kind
( ) Home consumption ( ) Other: .........
3.10. What are you mainly using your income for?
( ) Investment in aquaculture ( ) Schooling fees
( ) Personal ( ) Other: ............
(4) Livelihood changes
4.1. What types of protein do you and your family consume? Indicate changes!
Type of protein Before aquaculture
(times per week)
Now
Meat More/less/same
Fish from market More/less/same
Omena More/less/same
Beans More/less/same
91
4.2. Livelihood quality. Indicate changes!
Livelihood quality Situation ‘now’ compared to ‘before aquaculture’
Diet diversity Better/worse/same
Healthcare Better/worse/same
Payment of schooling fees Better/worse/same
Possession of household assets Better/worse/same
(5) Future perspectives 5.1. What are your plans for aquaculture operations in the next 5 years?
( ) Continue at current level ( ) Expand ( ) Reduce
( ) Discontinue ( ) Undecided ( ) Other: .........
5.2. What support do you need in the future? ............................
5.3. How are you planning on financing aquaculture in the future?
( ) Fish farm profits ( ) Subsidies ( ) Other: ..............
( ) Loan ( ) Don‟t know


93
Appendix B – Cover Letter

95
Survey of Fish Farming Households in the Lake Victoria Region, Kenya
(Europe – University Centre of the Westfjords – Iceland)
As a graduate student of the University of Akureyri in Iceland I am conducting a study on
tilapia aquaculture in Kenya; in particular in understanding the situation of tilapia farming
households in your area. Your participation in this study will be very useful in generating
valuable insights. I would like to assure you that all responses at the individual level will be
kept strictly confidential. None of your responses will be quoted or disseminated to another
person or organization to safeguard your identity.
Following are my research questions:
(1) How effective has the Kenyan government‟s Economic Stimulus Programme been for
chosen Nile tilapia (Oreochromis niloticus) and African catfish (Clarias gariepinus) farmers
in western Kenya to improve livelihoods in terms of improved well-being and reduced
vulnerability through (a) increased income creation, (b) changes in protein consumption, and
the (c) sustainable use of natural resources?
(2) What is the long-term potential of small-scale Nile tilapia (Oreochromis niloticus) and
African catfish (Clarias gariepinus) aquaculture in chosen farms in western Kenya (a) with or
(b) without the support of the Kenyan government‟s Economic Stimulus Programme?

96


98