Embed Size (px)
Citation preview
NAVAL POSTGRADUATE SCR,HOOL Monterey, California
THESIS
AN ANALYSIS OF FACTORS PREDICTING GRADUATION
AT UNITED STATES MARINE CORPS OFFICER CANDIDATES SCHOOL
by
Donald B. McNeill, Jr. September 2002
Thesis Advisor: Samuel E. Buttrey Second Reader: Lyn R. Whitaker
Approved for public release; distribution is unlimited.

THIS PAGE INTENTIONALLY LEFT BLANK

REPORT DOCUMENTATION PAGE Form Approved OMB No. 0704-0188 Public reporting burden for this collection of information is estimated to average 1 hour per response, including the time for reviewing instruction, searching existing data sources, gathering and maintaining the data needed, and completing and reviewing the collection of information. Send comments regarding this burden estimate or any other aspect of this collection of information, including suggestions for reducing this burden, to Washington headquarters Services, Directorate for Information Operations and Reports, 1215 Jefferson Davis Highway, Suite 1204, Arlington, VA 22202-4302, and to the Office of Management and Budget, Paperwork Reduction Project (0704-0188) Washington DC 20503. 1. AGENCY USE ONLY (Leave blank)
2. REPORT DATE September 2002
3. REPORT TYPE AND DATES COVERED Master’s Thesis
4. TITLE AND SUBTITLE: “An Analysis of Factors Predicting Graduation at United States Marine Corps Officer Candidates School”
6. AUTHOR(S) Major Donald B. McNeill, Jr.
5. FUNDING NUMBERS
7. PERFORMING ORGANIZATION NAME(S) AND ADDRESS(ES) Naval Postgraduate School Monterey, CA 93943-5000
8. PERFORMING ORGANIZATION REPORT NUMBER
9. SPONSORING /MONITORING AGENCY NAME(S) AND ADDRESS(ES) N/A
10. SPONSORING/MONITORING AGENCY REPORT NUMBER
11. SUPPLEMENTARY NOTES The views expressed in this thesis are those of the author and do not reflect the official policy or position of the Department of Defense or the U.S. Government. 12a. DISTRIBUTION / AVAILABILITY STATEMENT Approved for public release; distribution is unlimited
12b. DISTRIBUTION CODE
13. ABSTRACT (maximum 200 words) All officers commissioned in the Marine Corps except those from the Naval Academy are required to successfully complete an intense screening program at Officer Candidates School (OCS). The Marine Corps is attempting to improve its officer selection process and reduce attrition at OCS by determining which candidates it should recruit and send to OCS. In late 2000, the Marine Corps Combat Development Command (MCCDC) commissioned a 67-question survey that has been given to all candidates entering OCS since fall of 2000. The results of this survey were used to build models to provide a probability of success of candidates based upon responses to the survey and other demographic data. One model created from this survey was used to build a computer desktop tool that officers may use to assist in selecting the candidates who have the highest probability of success at OCS and in preparing them for the rigors of OCS. This tool provides a probability of graduation for each candidate that is 99.8% correlated with the actual graduation rate of other candidates who have similar characteristics to the candidate whose probability of graduation was calculated.
15. NUMBER OF PAGES
91
14. SUBJECT TERMS Surveys, Officer Recruiting, Officer Training, Military Training, Officer Selection, Screening, Officer Candidate, Accession, Predictions.
16. PRICE CODE
17. SECURITY CLASSIFICATION OF REPORT
Unclassified
18. SECURITY CLASSIFICATION OF THIS PAGE
Unclassified
19. SECURITY CLASSIFICATION OF ABSTRACT
Unclassified
20. LIMITATION OF ABSTRACT
UL
NSN 7540-01-280-5500 Standard Form 298 (Rev. 2-89) Prescribed by ANSI Std. 239-18
i

THIS PAGE INTENTIONALLY LEFT BLANK
ii

Approved for public release; distribution is unlimited.
AN ANALYSIS OF FACTORS PREDICTING GRADUATION AT UNITED STATES MARINE CORPS OFFICER CANDIDATES SCHOOL
Donald B. McNeill, Jr.,
Major, United States Marine Corps B.S., United States Naval Academy, 1989
Submitted in partial fulfillment of the requirements for the degree of
MASTER OF SCIENCE IN OPERATIONS RESEARCH
from the
NAVAL POSTGRADUATE SCHOOL September 2002
Author: Donald B. McNeill, Jr.
Approved by: Samuel E. Buttrey
Thesis Advisor
Lyn R. Whitaker Second Reader
James N. Eagle, Chairman Operations Research Department
iii

THIS PAGE INTENTIONALLY LEFT BLANK
iv

ABSTRACT
All officers commissioned in the Marine Corps except those from the Naval
Academy are required to successfully complete an intense screening program at Officer
Candidates School (OCS). The Marine Corps is attempting to improve its officer
selection process and reduce attrition at OCS by determining which candidates it should
recruit and send to OCS. In late 2000, the Marine Corps Combat Development Command
(MCCDC) commissioned a 67-question survey that has been given to all candidates
entering OCS since fall of 2000. The results of this survey were used to build models to
estimate the probability of success of candidates based upon responses to the survey and
other demographic data. One model created from this survey was used to build a
computer desktop tool that officers may use to assist in selecting the candidates who have
the highest probability of success at OCS and in preparing them for the rigors of OCS.
This tool produced estimates of graduation probabilities for a test set of candidates that
were very highly correlated with the actual graduation rates.
v

THIS PAGE INTENTIONALLY LEFT BLANK
vi

TABLE OF CONTENTS
I. INTRODUCTION....................................................................................................... 1 A. BACKGROUND.............................................................................................. 1
1. Commissioning Sources ...................................................................... 1 2. History of OCS .................................................................................... 1 3. OCS Programs and Requirements .................................................... 2 4. Candidate Recruiting and Training Prior to OCS........................... 6
B. AREA OF RESEARCH.................................................................................. 7 C. OFFICER CANDIDATES SCHOOL SUCCESS RATES .......................... 8 D. OBJECTIVES AND RESEARCH QUESTIONS ........................................ 9 E. SCOPE OF THESIS AND METHODOLOGY.......................................... 10
1. Scope of Thesis................................................................................... 10 2. Thesis Methodology .......................................................................... 10
F. ORGANIZATION OF THESIS................................................................... 11
II. LITERATURE REVIEW......................................................................................... 13 A. STUDIES IN EMPLOYMENT ATTRITION............................................ 13 B. STUDIES IN ENLISTED ASSESSION ATTRITION .............................. 13 C. STUDIES IN OFFICER CANDIDATE ATTRITION .............................. 15
III. DATA AND METHODOLOGY.............................................................................. 23 A. DATA.............................................................................................................. 23
1. Database Used in Thesis ................................................................... 23 2. Dependent Variable........................................................................... 26 3. Independent or Explanatory Variables........................................... 26
B. METHODOLOGY........................................................................................ 26 1. Initial Findings .................................................................................. 26 2. Analysis of Data Set Containing Only Officer Candidates
Course Candidates ............................................................................ 27 3. Analysis of Complete Data Set Using All Commissioning
Sources................................................................................................ 33
IV. MODEL DEVELOPMENT ........................................................................................... 41 A. OFFICER SELECTION OFFICER RISK ESTIMATION TOOL ......... 41 B. OFFICER CANDIDATE SCHOOL ATTRITION PREDICTION
MODEL.......................................................................................................... 44 C. MODEL VALIDATION............................................................................... 44
V. SUMMARY, CONCLUSIONS, AND RECOMMENDATIONS.......................... 47 A. SUMMARY.................................................................................................... 47 B. CONCLUSIONS............................................................................................ 47 C. RECOMMENDATIONS.............................................................................. 48
vii

APPENDIX A: USMC OFFICER CANDIDATES SCHOOL QUESTIONNAIRE....... 51
APPENDIX B: MICROSOFT EXCEL® SPREADSHEET EXAMPLE.......................... 65
APPENDIX C: S-PLUS® CODE USED TO GENERATE PROBABILITY PLOTS..... 67
LIST OF REFERENCES ..................................................................................................... 69
INITIAL DISTRIBUTION LIST ........................................................................................ 73
viii

LIST OF FIGURES
Figure 1. Principal Components for OCC Numeric Data Frame.................................... 32 Figure 2. Classification Tree with Fifteen Leaves Derived from Categorical Data Set
......................................................................................................................... 34 Figure 3. Predicted Probability of Graduation vs. Graduation Rate for Training Set .... 42 Figure 4. Predicted Probability of Graduation vs. Graduation Rate for Test Set ........... 45
ix

THIS PAGE INTENTIONALLY LEFT BLANK
x

LIST OF TABLES
Table 1. Comparison of Predicted Probability of Graduation (Prob(Grad)) with Actual Graduation Rate (Pct(Grad)) for Bins in Training Set ........................ 43
Table 2. Comparison of Predicted Probability of Graduation (Prob(Grad)) with Actual Graduation Rate (Pct(Grad)) for Bins in Test Set ............................... 46
xi

THIS PAGE INTENTIONALLY LEFT BLANK
xii

ACKNOWLEDGMENTS
Special thanks go to Professors Samuel E. Buttrey and Lyn R. Whitaker as my
thesis advisor and second reader for their insight into techniques that were useful in the
writing of this thesis. Your patience and guidance were most appreciated, and, without
your assistance, it would not have been possible for me to complete this thesis.
Additionally, I would like to thank Professor Nita Miller and Lieutentant Colonel Saverio
Manago, United States Army, for their added help in looking at the problem from another
angle. I would also like to express my particular gratitude and love for my beautiful wife
Laura for her sacrifices over the past two years in pulling more than her fair share of the
load around home and for my four beloved children Britton, Hannah, Bennett, and
Heather for their patience and understanding when I often could not play or spend time
with them because of school or was not as patient as I ought to have been. Most of all, I
would like to express my eternal gratitude for the undeserved mercy of the Lord Jesus
Christ, the grace He has given me, and the work He continues to do in me. This paper is
dedicated to the glory of the risen Christ. Soli Deo Gloria.
xiii

THIS PAGE INTENTIONALLY LEFT BLANK
xiv

EXECUTIVE SUMMARY
In order to determine predictors of success and failure at Marine Corps Officer
Candidates School (OCS) and improve the process for commissioning Marine officer
candidates, the Marine Corps Combat Development Command commissioned a 67-
question survey to be given to all candidates attending OCS. The results from the survey
were to be used to predict whether or not an individual would succeed at OCS and to
ensure that only those candidates with a high probability of success are actually sent to
OCS.
Over the past year, over two thousand Marine officer candidates from twelve
separate companies have been given this survey. One company was removed from the
database because of errors in the data, ten were used for the initial database, and the last
company served as the test set for models that were created. Once the data was prepared
for use, a variety of statistical analysis techniques including logistic regression,
classification and regression trees, principal components, agglomerative and k-means
clustering, correlation coefficient analysis, Bayesian networks, and bagging were applied.
In some of the analysis, many of the questions were converted from categorical to
numeric format in order to save degrees of freedom in the model.
Unfortunately, because of high dimensionality of the data set and the initial high
proportion of candidates who graduated (78%), it was too difficult to predict whether or
not a given individual would graduate from OCS. It was generally found that either the
models did not have the required power to correctly predict success, or they tended to
over-fit initially and then had high misclassification rates when the model was cross-
validated. However, it was found that it is possible to predict success for groups of
candidates. A logistic regression model that contained both categorical and numeric
questions and some demographic data was determined to be the best overall model. From
the results of this model, a spreadsheet was created in which a candidate’s responses to
the survey could be entered. The spreadsheet then computes the model’s estimate of the
probability of graduation. Then, using this model, a vector of probabilities of graduation
for all candidates in the test set was produced, sorted in increasing order, and separated xv

into equal-sized bins. The average predicted probability of graduation for each bin was
then calculated and compared with the actual graduation rate for each bin, providing a
99% correlation rate.
Consequently, it appears that, although it is not possible with this data set to
predict whether or not individuals will graduate from OCS, it is possible to produce a
probability of graduation for individuals based upon the results from this GLM.
Modifications to the survey recommended in the conclusion to the paper may improve
the possibility of correctly predicting whether or not individuals will graduate from
Marine Corps OCS.
xvi

I. INTRODUCTION
A. BACKGROUND
1. Commissioning Sources
Commissioned officers in the United States Marine Corps come from several
sources: the United States Naval Academy, civilian universities, and the enlisted ranks of
the Marine Corps and other services. All of these officers except those who attend the
Naval Academy are required to successfully complete a screening process at Marine
Corps Base Quantico, Virginia, called Officer Candidates School (OCS). The mission of
Marine Corps Officer Candidates School states that its charter is “To train, evaluate, and
screen officer candidates to ensure that they possess the moral, intellectual, and physical
qualities for commissioning and the leadership potential to serve successfully as
company grade officers in the operating forces.” (http://www.ocs.usmc.mil/) One of the
primary goals of OCS is to place candidates under stressful, pressure-filled situations in
order to determine their ability to lead others while under stress (North and Smith, 1993,
p. 9).
2. History of OCS
Prior to World War I, almost all officers in the Marine Corps came from either the
Naval Academy or from the enlisted ranks of the Marine Corps. Marine Corps OCS had
its true beginning during World War I, when it became necessary to commission more
officers for the war. Because of its successes in World War I, the Marine Corps,
maintained at a larger size than prior to the war, began to recruit more heavily at civilian
universities through the Naval Reserve Officer Training Corps (NROTC) program. In
1934, to further build the pool of potential candidates, the Marine Corps developed the
Platoon Leader’s Course (PLC) program for colleges with no NROTC program. Students
selected for this program were commissioned as reserve officers after two six-week
periods of instruction at either Quantico or San Diego. With concerns that America
would soon be involved in another war, the Marine Corps added, in 1940, another
program, the Officer Candidates Class. These programs have been expanded or reduced
1

in size as necessary over the past decades to meet the requirements for new
commissioned lieutenants in the Marine Corps (http://www.ocs.usmc.mil/history.htm).
3. OCS Programs and Requirements
Currently, the major commissioning programs are the Officer Candidate Class
(OCC), the Platoon Leader’s Class (PLC), Marine Corps Reserve Officers Training
Corps (MCROTC), and the Marine Corps Enlisted Commissioning Program (MECEP).
Their contracts state that those applying for the OCC and PLC programs agree to serve
eight years as commissioned officers in the Marine Corps Reserve if they successfully
complete the course (NAVMC 10462 (REV. 5-93)). Candidates from these programs
receive different levels of financial support for college based upon the program for which
they have been selected.
Generally recruited during their senior year of college, OCC candidates attend a
ten-week training program after they have graduated from college. They receive nothing
toward college costs. Some are recruited into this program after they have graduated and
held jobs in the civilian sector. Two small programs for commissioning of enlisted
Marines, the Enlisted Commissioning Program (ECP) and the Meritorious
Commissioning Program (MCP), generally fall under the OCC program. Enlisted
Marines applying for the ECP are required to have completed a baccalaureate degree on
their own, usually during off-duty hours while in the Marine Corps, though some who
already have degrees enlist and later apply for commissioning. The MCP is for
exceptional Marines who have some college experience, usually an associate degree or
75 semester hours of college credit. These Marines without degrees must continue to
pursue completion of their baccalaureate in order to be competitive for promotion and
continued service (MCO1040.43A, paragraph 5b). ECP and MCP candidates who do not
successfully complete OCS will be returned to a Marine Corps unit to complete their
service obligation at their prior rank (ibid, paragraph 19). Because they have received no
financial assistance, OCC candidates may leave OCS for any reason after their 7th week
of training in Quantico and are not required to accept a commission upon graduation
from OCS (Service Agreement, Officer Candidate (Ground), NAVMC 10462 (REV. 5-
93)).
2

Typically, PLC candidates attend two separate and sequential six-week OCS
classes in the summers prior to college graduation, classes known as PLC Juniors and
PLC Seniors. PLC candidates usually sign up during their freshman year of college and
currently may receive money each month toward college expenses from two separate
programs: the Financial Assistance Program (FAP) (MCO 7220.43B) and the Tuition
Assistance Program (TAP) (MCO 1560.33). Once a candidate in good standing has
completed the first summer training period, he or she may apply from FAP that is
distributed using a tiered system. During the first year, eligible candidates receive $300
per month for nine months, and $350 and $400 per month during the following two years
(CMC letter, 8 November 2001). They may also receive from the TAP up to $5,200 per
year in each of their last three years of college, totaling not more than $15,600 over a
three-year period. Once candidates begin receiving this money, they are obligated to
serve for a minimum of 48 months on active duty for the Financial Assistance Program or
for eight years service, five of which must be on active duty, for the College Tuition
Assistance Program. Those who do not complete PLC Seniors except due to medical
reasons are required to reimburse the government for their financial assistance unless
they agree to serve two years as enlisted Marines; those who have accepted tuition
assistance may be required to serve for up to four years as enlisted Marines if they are not
commissioned. Anecdotally, OSO’s are aware that it is often difficult to convince a
candidate who has completed PLC Juniors to return for PLC Seniors: they find that,
currently, it is necessary to recruit three candidates in order to commission one because
many, after completing PLC Juniors, refuse FAP and CTAP and do not go on to PLC
Seniors (conversation with Major Blake Wilson, Marine Corps Recruiting Command, 27
November 2001). A cursory look at this data set may support that assertion: since those
candidates who choose the PLC Junior and PLC Senior route to commissioning attend in
separate summers, generally following their freshman and junior years of college, the
PLC Seniors in the data set likely attended PLC Juniors two summers ago, in the summer
of 1998. It is noteworthy that there was only one company of 238 PLC Seniors but three
companies of PLC Juniors totaling 698 candidates, indicating that many attending PLC
Juniors may not continue in the program to PLC Seniors, through attrition either at OCS
or in the intervening two years. During the summer of 1998, the summer in which most 3
of this year’s PLC Seniors would have attended PLC Juniors, there were 430 graduates of
PLC Juniors from only two companies (phone conversation with Sergeant Kevin R.
Scheaffer, Officer Candidates School, 16 September 2002). Although some may have
either attended PLC Seniors in the summer of 1999 or were not able to attend in 2000
because of medical or other reasons, it appears that there was significant attrition in the
intervening period between the end of PLC Juniors and the beginning of PLC Seniors:
the total number of those starting PLC Seniors was only about 55% of the total that
graduated from PLC Juniors two years ago. The discrepancy in these two numbers is not
due to a significant change in the officer recruiting mission for the Marine Corps in that
period, either, that might have necessitated an increase in officer quotas.
Those who either enroll during their junior year of college or are unable to
complete both PLC Juniors and PLC Seniors prior to graduation due to medical or other
reasons may attend a single ten-week OCS class in one summer (MCO P1100.73B,
paragraph 2001.3.a). This ten-week program, called PLC Combined, is virtually identical
to the ten-week OCC course. A candidate in the PLC Combined program may receive
tuition assistance and financial assistance once he or she has completed the ten-week
program, and the requirement to accept a commission is the same as for a candidate from
the PLC Junior and Senior program.
During the school year, those enrolled in the PLC program are required to spend
time with their OSO to prepare them for OCS. If they successfully complete PLC Juniors,
they are not required to continue with the program, as long as they have not accepted
money from either the Financial Assistance Program or the College Tuition Assistance
Program. Those who continue with the program but do not receive money are not
required to complete PLC Seniors nor to accept a commission if they complete that
program.
Of the four types of candidates, MCROTC candidates typically receive the most
financial and tuition assistance. Most MCROTC candidates receive full college tuition,
fees, textbooks, and a monthly stipend of $250 per month for freshmen and sophomores,
$300 per month for juniors, and $350 per month for seniors
(https://www.nrotc.navy.mil/scholarships_application.html). Some who do not have
4

scholarships also participate in the NROTC College Program and may be commissioned
as reserve officers upon graduation from OCS and college (MCO P1100.73B, paragraph
3001). During their last two years, they may receive monthly stipends of $350 during
their junior year and $400 during their senior year. Because of the great expense of the
scholarship program, the Marine Corps has a great incentive to see all MCROTC
candidates commissioned. Until the end of their sophomore year, the student may dis-
enroll from the program for any reason with no requirement to reimburse the
government. At the beginning of his or her junior year in college, he or she is required to
sign a statement committing him or her to service as an officer in the Marine Corps for
eight years upon graduation from college. Participants receiving MCROTC scholarships
are required to serve four of those eight years on active duty, and non-scholarship
candidates must serve three and a half years on active duty
(https://www.nrotc.navy.mil/faqs.cfm). Those MCROTC candidates who fail at OCS
except for medical reasons may be required to attend Marine Corps boot camp and serve
for up to four years as enlisted Marines or may be required to repay the government for
their tuition, fees, books, and their stipend, a great incentive for them to successfully
complete the program (MCO P1100.73B, page 3-29). In a few cases, those MCROTC
candidates who are unable to successfully complete OCS are given the opportunity to
apply for commissions in the United States Navy and thus meet their service obligations
without having to repay their college expenses.
Upon acceptance to the program, MECEP candidates are required to re-enlist for
a period to cover their entire time at college and are required to pay for all tuition, books,
and other expenses themselves at the civilian institution they attend (MCO P1100.73B,
paragraph 3001). Upon commissioning, MECEP candidates are required to serve at least
four years on active duty as commissioned officers. MECEP candidates who are found
not suitable for officer programs because of failure at OCS will be removed from the
college they are attending, returned to Marine Corps units, and required to complete their
obligated service at their current enlisted rank (MCO 1560.15L).
Both MCROTC and MECEP candidates generally spend more time with their
Marine Officer Instructor (MOI) than PLC candidates do with their OSO and receive
5

more instruction during the school year, taking actual classes in military science and
receiving extracurricular instruction during the year. Consequently, MECEP and
MCROTC candidates are required to attend only a single six-week program called
“Bulldog” in one of the summers prior to college graduation. Because of the background
of the enlisted Marines and the more extensive training of MCROTC students, this
program does not spend as much time in indoctrination and basics of military life;
consequently, their course in Quantico is quite a bit more compressed than the OCC or
PLC programs.
4. Candidate Recruiting and Training Prior to OCS
The Marine Corps has a well-established recruiting program to ensure that its
requirements for new officers are met each year, with regional Officer Selection Officers
(OSOs), who recruit PLC and OCC candidates, and Marine Officer Instructors (MOIs) at
each college that has an MCROTC program. An OSO’s responsibility usually lies along
geographic lines. Each OSO has a certain geographic area, often covering thousands of
square miles, and works at the colleges in that region to recruit candidates. Most MOIs
work at a single university to oversee the MCROTC and MECEP candidates enrolled
there. A few MOIs must cover the MCROTC programs at more than one university in a
very small geographic region, such as the greater Atlanta area, which has several
universities with ROTC units within the local area. While these OSOs and MOIs are
responsible for training officer candidates in Marine Corps customs, doctrine and history
and in preparing them for OCS, OSOs are required to spend much of their time recruiting
new candidates, which reduces the amount of time they have available to train their
candidates. Depending upon the year and the geographic region, each OSO is required to
recruit several new officer candidates each month, which may require extensive travel
over his or her region. Anecdotally, it is known within Marine Corps circles that
recruiting duty is some of the most difficult duty in the Marine Corps, requiring much
time for travel and extremely long work hours, both in recruiting enlisted personnel and
officers. On the other hand, MOIs are required to do very little recruiting or traveling;
they spend the majority of their time training their MCROTC and MECEP candidates for
6

OCS. It is extremely expensive to maintain this recruiting structure, and the Marine
Corps would like to minimize the costs involved in recruiting and commissioning
officers. In 2001, there were 72 OSOs and 63 MOIs spread across the United States. Each
MCROTC unit also has a staff non-commissioned officer assigned as an advisor to the
candidates, as well as the MOI (phone conversations with Master Sergeant Ricardo A.
Hudson and Mrs. Tonya L. Durden, Marine Corps Recruiting Command, 16 August
2002).
B. AREA OF RESEARCH
The Marine Corps spends millions of dollars each year in recruiting officers.
Historically, there has been about a 25% failure rate at Marine Corps Officer Candidates
School. Each failure costs the Marine Corps valuable time and money. In addition to the
tuition, stipends, uniforms, and books where applicable, there are many other expenses,
such as transportation for candidates to and from OCS, training events, medical
screenings including flight physicals for potential candidates, hotel lodging for
candidates when they have to attend training or undergo medical screening away from
home, automobile mileage for OSOs as they travel from college to college, and a whole
host of other expenses (phone conversation with Major Timothy Kornacki, former OSO,
20 June 2002). For each failure at OCS, another officer candidate must be recruited,
screened, and prepared for a later OCS class. In recent years, in order to get one
successful candidate to finish OCS and accept a commission as a Marine Corps officer, it
has been necessary to recruit three candidates (conversation with Major Blake Wilson, 27
November 2001). Candidates may not complete OCS for a variety of reasons. Many, after
looking into the program, simply decide that they do not want to become Marine officers.
Others do not have the mental, physical or moral aptitude or are required to leave OCS
because of injuries sustained in training.
In an effort to minimize the number of failures among OCS candidates, the
Marine Corps Combat Development Command’s (MCCDC) Studies and Analysis (S &
A) Division commissioned, in late 2000, a 67-question survey that has been given to
every candidate entering OCS since fall of 2000. The questions are broken into five basic
7
categories: General Demographic Information, General OCS Preparation, Physical
Training Section, Health/Lifestyle Section, and Medical History Section. MCCDC would
like to reduce attrition without changing its screening standards or reducing the quality of
Marine Corps OCS candidates. Marine Corps S & A requested that research be done to
identify ways to reduce candidate attrition at OCS by finding profiles that predict attrition
at OCS. Additionally, they requested that two tools be developed for use by OSOs and
MOIs. First, a computer-based model called the Officer Selection Officer Risk
Estimation Model (OSOREM) would allow an OSO or MOI to enter parameters and then
determine from a prediction of success or failure whether or not to send a candidate to
OCS. The second tool, called the Officer Candidate Attrition Prediction Model
(OCAPM), would be designed to identify levels of risk for candidates and predict the
reason for failure should it occur so that the probability of it occurring may be minimized
(Statement of Work). This thesis investigates the effect of these factors and combinations
of factors on the success of a typical Marine Corps OCS candidate and whether factors
indicating a higher than average probability of failure may be corrected by improved
training prior to the candidate arriving at OCS.
C. OFFICER CANDIDATES SCHOOL SUCCESS RATES
Each program for officer candidates has different service-time requirements based
upon the amount of support a candidate receives when he or she is attending college.
Based upon the requirements placed on candidates, it seems that the OCC candidates
would have the least motivation of the three groups to successfully complete OCS as well
as the least opportunity for formal preparation for OCS. Many will know either from
employment experience or from civilian recruiters’ visits to their colleges that they could
easily find employment in the civilian sector that pays markedly more than service in the
Marine Corps does, without the difficulty of OCS or the requirements of military service.
Knowing that they may be forced to either repay their college costs or to serve as enlisted
Marines should make PLC or MCROTC candidates more motivated to successfully
complete OCS. This should be particularly true for MCROTC candidates, who would
have to repay the government for their entire college education.
8

The officer-recruiting program is designed so that OSOs are required to provide a
certain number of new candidates for OCS each month. The OSO does not receive a
credit until the candidate successfully completes the inventory physical fitness test (PFT)
given during the first few days of OCS. Failures do not negatively impact the OSO’s
performance rating. Generally, all they need to do is ensure they have enough candidates
to pass the PFT to meet their quota. Consequently, an OSO has little incentive to hold
back a candidate who he or she believes has a low probability of success; the OSO’s only
concern is getting the candidate to a condition in which he or she can successfully
complete the PFT. This could weaken the pool of candidates attending OCS; the OSO
sends as many as possible, weak or strong, to ensure that his or her quota is met.
D. OBJECTIVES AND RESEARCH QUESTIONS
The primary objective of this thesis is to predict success or failure of the typical
Marine Corps OCS candidate, taking into account information gained from the 67-
question survey given to OCS candidates over the past year, and to develop tools that will
assist OSOs and MOIs in preparing their candidates for OCS. These tools should allow
OSOs and MOIs to enter data into a desktop-based program that will produce a predicted
probability of success at the candidate’s OCS class. They should, as well, be able to be
updated periodically with new data as additional companies graduate from OCS.
The primary research question for this thesis is: “Are there any factors or
combinations of factors which positively or negatively contribute toward successful
completion of Marine Corps OCS?” The secondary question is: “Which factors or
combinations of factors can be influenced by OSOs, MOIs and OCS staff in order to
minimize the probability of failure and maximize the probability of success at OCS?” It
would also be desirable to address whether or not success or failure can be predicted
based upon a candidate’s responses to the survey.
The null hypothesis for the primary research questions is as follows:
H0: None of the factors included in the survey is significant in predicting success of
candidates from Marine Corps OCS.
9

Conversely, the alternative hypothesis for the primary research questions is as
follows:
H1: At least one of the factors included in the survey is significant in predicting
success of candidates from Marine Corps OCS.
E. SCOPE OF THESIS AND METHODOLOGY
1. Scope of Thesis
Research done for this thesis applies to all officer screening programs in the
military services, particularly programs that place applicants in high-pressure situations.
For example, this may apply to the services’ officer candidate schools and officer training
school, as well as the indoctrination period that freshmen undergo at the United States’
service academies. Additionally, many of the findings may apply to initial-entry training
of enlistees in the services as well as to other organizations that screen applicants in
similar fashion, such as police academies and the Federal Bureau of Investigation (FBI).
2. Thesis Methodology
The foundation of this thesis is the survey given to candidates at Marine Corps
OCS. First, it was necessary to investigate the validity of all the questions and responses
of the survey. Next, responses were checked for validity, and errors in the data set need
to be removed. Then, once the survey results are transferred into a statistics package,
statistical analysis techniques such as classification trees, regression, and linear models
were used to identify factors or combinations of factors that point toward success or
failure at OCS and fit models for the typical candidate at OCS. From that, a spreadsheet-
based tool was created to assist OSOs, MOIs, and OCS staff in identifying those
candidates who have a higher probability of failure than the average candidate in the
whole OCS program and in the particular program for this candidate. This tool may
provide guidance as to how to improve each candidate’s performance. Further potential
applications include a means to create a means by which the data can be continually
updated as additional classes complete OCS and the data set becomes larger. Finally, data
10

gathered from a class that graduated in March 2002 was used to validate the model and
tools that have been developed.
F. ORGANIZATION OF THESIS
Chapter I of this thesis has provided an introduction and background information
on the problem as well as a basic description of the various OCS programs. Chapter II is
a discussion of studies done on attrition in the workforce, primarily focused on military
examples. Chapter III covers the data and methodology used in this problem and
assumptions made in the study. Chapter IV discusses the development of the models from
the data. Chapter V provides a summary of findings from this thesis, conclusions gained
from the research, recommendations for further research and action by the Marine Corps.
11

THIS PAGE INTENTIONALLY LEFT BLANK
12

II. LITERATURE REVIEW
A. STUDIES IN EMPLOYMENT ATTRITION
Over the years, there have been numerous studies aimed at determining success
and attrition rates of people in various organizations. From academics to civilian
employment to military service, researchers have determined that there are two basic
groups of factors that serve as predictors of success for people in various organizations:
individual factors and organizational factors. Individual factors involve such categories
as demographics, motivations, expectations, and personality traits, while the
organizational factors refer to the basic characteristics of the organization. Research has
consistently shown that the individual factors of motivation, education level, and marital
status best predict attrition in military units (Carroll and Cole, pp. 31-32).
Organizations that require a screening process in a high-pressure environment
have many similarities with military indoctrination programs. Processes such as the
introductory course at various police academies, fire academies, and the FBI, could be
useful in providing more sources to study and use as references for potential predictors of
success or failure at Marine Corps OCS. There do not appear to be any published studies
on attrition of applicants to such programs.
B. STUDIES IN ENLISTED ASSESSION ATTRITION
Prior to the late 1970’s, most of the research on military attrition focused on
individual factors rather than organizational ones. (Mobley, Hand, Baker, and Meglino,
1978, p. 2) Research in other fields suggested that individual intentions may be
significant in predicting future behavior in employees (ibid, p.8). In the late 1970’s, the
Center for Management and Organizational Research conducted a series of studies to
determine predictors of attrition of enlisted Marine Corps recruits. One of these studies,
published in 1978, was based on a survey given to 1,521 male, non-reservist recruits from
three consecutive recruit-training companies in August 1976, at Marine Corps Recruit
Depot Parris Island, South Carolina. This survey was given at the beginning of training;
13

12% of the recruits were not successful in completing recruit training. The study included
demographic information attained from the Recruit Accession Management System
(RAMS) along with results of questions in the survey that addressed pre-recruit training
intentions, expectations, and attraction to civilian and military roles. Questions in the
survey asked participants to rate how desirable certain role outcomes were and to give
their expected probability that the Marine Corps and civilian employment would allow
them to attain those outcomes (ibid, 1978, p. 13). For instance, recruits were asked how
important a strong family life is to them and then were asked to rate how likely they
expected both the military and civilian employment would help them to achieve that goal.
The values were multiplied by expected probabilities for all questions in each category to
give an overall utility value. Additionally, there was another survey given to recruits
when they either graduated from recruit training or failed from the program, and other
surveys were given to continue to track these Marines as they progressed through
advanced training and on to other duty stations.
Researchers found several significant differences between those who graduated
and those who did not. First, demographically, there were significant differences in
education, marital status, and mental score. Those who graduated were more likely to
have higher education and mental levels and less likely to be married. The education
level difference was significant at the 0.01 level, and the other two were significant at the
0.05 level. Second, they found differences between the two groups’ intentions even
before they started training. Questions addressing intentions indicated that graduates had
significantly greater intention than non-graduates to complete their enlistment contract
and to re-enlist, both significant at the 0.01 level. Again, even before they began recruit
training, there were significant differences in expectations; those who eventually
graduated had a higher expectation of graduating and had a lower expectation of being
able to find a civilian job (ibid, p. 21). Responses to questions that addressed both
attraction to recruits’ potential role as Marines and belief that becoming Marines would
allow them to meet their goals indicated that, even before boot camp, subsequent
graduates had a significantly greater desire to become Marines and expectation of
completing their first-term enlistment than non-graduates. Interestingly, there were no
14

significant differences in attraction to civilian jobs or expectation of finding civilian
employment between the graduate and non-graduate groups. Regarding overall
satisfaction with the Marine Corps, those who subsequently graduated were significantly
more likely to expect to be satisfied than non-graduates (ibid, p. 22). The authors also
constructed a logistic regression model to predict recruit training attrition. The best
predictor of attrition was the recruit’s expectancy of completion measured at the
beginning of training. Other variables that contributed the significantly in the equation
were education, the sum of positive minus negative Marine role outcome expectancies,
expectation of finding a civilian job (negative impact), intention to complete, age
(negative impact), Marine force role, and expected overall satisfaction.
A second study of the turnover process among this group of enlisted Marines over
their entire four-year enlistment term took a closer look at behavioral intentions of the
Marines. The authors pointed out that turnover among new employees is often due to the
employees seeing little utility in their present situation, having low satisfaction in their
job, and having low motivation to remain. As was suggested in the first study, those who
completed enlistment had significantly higher intention to complete their enlistment than
those who did not. The results indicate that behavioral intentions can act as a predictor of
employee turnover (Youngblood, Mobley, and Meglino, 1983). Such an indication may
have implications on the success rates of Marine officer candidates: those who succeed
may, in general, be those who simply have the highest motivation and desire to succeed
at OCS.
C. STUDIES IN OFFICER CANDIDATE ATTRITION
In an effort to determine the causes for officer candidate attrition and
consequently to minimize attrition, several military services have commissioned studies
over the years using various methods. In the early 1980’s, researchers conducted a study
of attrition among cadets at the United States Military Academy, West Point, New York,
and candidates at Army Officer Candidate School, Fort Benning, Georgia, using the
Miner Sentence Completion Scale (MSCS) (Form H) to determine if motivational
propensities were significant in predicting graduation rates of cadets and candidates.
15

Previous research has determined that military training organizations may be viewed as
hierarchical in nature. This test involves a survey given to participants who answer
incomplete sentences that are intended to measure their opinions on the following seven
subscales: Authority Figures, Competitive Games, Competitive Situations, Assertive
Role, Imposing Wishes, Standing Out From Group, and Routine Administrative
Functions. A positive score indicates that an individual is likely to fit in a hierarchical
organization (Miner, 2000). The researchers’ underlying premise was that an individual
is less likely to quit from a job when his or her motives correspond to the demands of the
organization. Much research in the past has supported the concept that the military is a
hierarchical organization. Thus, the researchers tested the hypothesis that turnover would
be higher among cadets and candidates whose motives were not consistent with a
hierarchical organization. Those more likely to attrite from a hierarchical organization
could generally be characterized as less comfortable with authority, either in themselves
or others; less competitive; and less desirous of distinguishing themselves.
The study of the West Point cadets may have applicability to this study because of
the particularly intense training and evaluation conducted upon freshmen, called
“plebes,” as well as the continued academic and military pressure on cadets through their
four years of college instruction at West Point. Early in their freshman year, the cadets
were given a survey whose results were used until the class graduated. The questionnaire
had blanks in which cadets were required to write their answers, and, to minimize
grading variance, a single evaluator scored all the surveys. The study of the West Point
cadets, covering their four years there, did not include those who were forced to leave the
academy; it is reasonable to assume that some of those who voluntarily left West Point
would have eventually been forced out. The data set that was examined consisted of a
randomly chosen set of 502 cadets, 36% of the class entering in 1972. In this group, 313
graduated, 53 were forced to leave, and 136 voluntarily left the academy. The graduation
and resignation rates of this subset were consistent with rates for the entire class. Even
though the study covered a long period during which attitudes may have changed in the
cadets, the researchers still found significant differences between the group that
graduated and the group that voluntarily left West Point in total scores, Assertive Role,
16

Imposing Wishes, and Routine Administrative Functions (Butler, Lardent, and Miner,
1983, pp. 496-499).
The study of Army OCS candidates was conducted over a much shorter period,
the fifteen weeks of two OCS classes in late 1975 and early 1976, reducing the likelihood
that the individual candidates would markedly change their attitudes toward their
organization. This intense evaluation program was likely to be very similar to the focus
of this study, Marine Corps OCS. Most of those attending Army OCS were superior
performers among the enlisted ranks of the Army, so it is likely that they already had
many of the attitudes and motivations consistent with Army hierarchical structure. Of 110
candidates with usable surveys in the first company, 91 graduated and 19 left prior to
graduation. In the second company, surveys for 131 graduating and 10 separating
candidates were usable. Combined, the two companies provided records of 222 graduates
and 29 non-graduates, a 12% failure rate, substantially lower than the West Point attrition
rate. Unfortunately, the surveys were given a little later in the training cycle for this
company (training day thirteen instead of day three), so some of the candidates who left
within the first few days of their class never took the survey. The OCS study used a
multiple-choice measurement instead of the blanks used in the West Point study,
reducing the possibility of scorer variability but likely skewing the responses to shed a
more positive light upon participants. Researchers also used additional tests designed for
use in a manufacturing environment. The results of the survey of OCS candidates
indicated significant differences between graduates and non-graduates in total score,
Competitive Games, Competitive Situations, and Assertive Role, as well as several
categories in the manufacturing test and another test. The tests of OCS candidates
indicated a stronger competitive nature among graduates than non-graduates. In
summary, both studies supported the hypothesis that turnover among those training to
become military officers tends to be higher among those who lack motives that are
congruent with hierarchical systems, such as the military. Both motives and motivation
appeared to be significant in predicting attrition among these groups. (Butler, Lardent,
and Miner, 1983, pp. 500-505).
17

In 1993, two Air Force officers wrote a thesis addressing attrition of African-
American officer candidates in the Air Force. Their study’s focus is somewhat different
from that of this thesis because their focus was upon academic performance of cadets at
the United States Air Force Academy (USAFA) and at U. S. Air Force ROTC units.
Although both of these programs are much less intense and more academic than Marine
Corps OCS, there are some similarities that bear scrutiny, particularly the USAFA’s
indoctrination program for freshmen. Anecdotally, this program is not believed to be as
intense as that used at West Point during the time of the previous study. Their study
focused upon how much academic performance and area of high school attendance
differed between African-Americans and other Air Force officer candidates (Carroll and
Cole, 1993, p. 8). The officers concluded that academics had only a limited role in
predicting success of these candidates, either at USAFA or at civilian universities in the
AFROTC program (ibid, p. 82). More important, they determined, was the motivation
level for each candidate (ibid, p. 50). At the end of their report, they commented that the
importance of academic potential diminishes for USAFA cadets once they enter training,
which is significant in this study because the indoctrination of first-year cadets at
USAFA more closely resembles that of Marine OCS than does the experience of
AFROTC candidates at civilian universities. They discussed the importance of the
common bond that results from group activities, giving feelings of involvement for
USAFA cadets (ibid, p. 98).
Closer to the focus of this thesis, in 1993, James H. North and Karen D. Smith of
the Center for Naval Analysis produced a report that concerns the commissioning of
officers in the Marine Corps. The purposes of this study were to determine if differences
in performance in minority candidates and officers was due to discrimination, to assist
recruiters in identifying those candidates who had the highest probability of success at
OCS, and to determine the best mix of OCS classes (North and Smith, p. 1). Using data
obtained from the Marine Corps’ Automatic Recruit Management System (ARMS) (ibid,
p. 22), they determined that the most important factor in successful completion of OCS
for males is prior service as a Marine (ibid, p. 3). Additional significant terms in their
model are physical fitness scores, race and ethnicity, and gender. They recommended that
18

programs for enlisted commissioning be expanded because prior enlisted candidates had
a 17% higher probability of success at OCS than those with no prior service as enlisted
Marines. They also noted that a candidate with a 275-point PFT score was 6.6% more
likely to graduate than a candidate with a 250 score (ibid, p. 30). All minorities had an
8% lower probability of success at OCS than white officers. Females had about a 20%
higher attrition rate than males in this study, but it did not measure the gender
performance gap because the two groups were analyzed separately. For females, the only
statistically significant factor was the PFT score: a ten-point increase in PFT predicted a
3% decrease in attrition probability (ibid, p. 59). They further noted that candidates from
more competitive colleges or schools with NROTC units had a higher probability of
success and that more participation by the OSO in pre-OCS preparation seems to increase
the probability of success in candidates (ibid, p. 5).
North and Smith took a close look at individual OCS programs. For OCC and
PLC candidates, they determined that indicators of success at OCS were higher PFT
scores, younger ages, being Caucasian, not having an Electronic Repair (EL) composite
score waiver on the Armed Services Vocational Aptitude Battery (ASVAB), having prior
service in the Marine Corps, studying engineering, and attending a college that had an
NROTC unit. Those with an EL score waiver had a 4.5% higher probability of attrition
than those without such a waiver (ibid, p. 30). Furthermore, those who attended
historically African-American colleges had a higher attrition rate than others. They also
determined that those attending either of the six-week PLC programs were more likely to
graduate than those in OCC (ten-week program), and those with aviation guarantees or
from the Enlisted Commissioning Program had a lower likelihood of attrition (ibid, pp.
27-29). In the NROTC program, they determined that younger candidates, candidates
with higher PFT scores, and those from the MECEP program had a lower probability of
attrition than other candidates. Interestingly, there was no significant difference for race
or ethnicity in this group (p. 63).
Captain Cheryl L. Fitzgerald (1996), a Marine Corps officer, studied the attrition
of females at Marine Corps Officer Candidates School, primarily in an effort to
determine why the attrition rates of females historically has been higher than the rate for
19

males. Her research used both regression models and surveys as well as demographic
data attained from the Automated Recruit Management System (ARMS) database
maintained by Headquarters Marine Corps to help predict female attrition. On the whole,
the regression models had little value in predicting attrition (Fitzgerald, 1996, p. 72). Her
study further focused upon the results attained from surveys given to candidates before
beginning OCS during the summer of 1995 and upon departing OCS, after either
successfully completing the course or not completing it for any reason.
Contrary to the study done by North and Smith, whose data indicated that higher
PFT scores predict a lower probability of attrition (North and Smith, p. 59), Captain
Fitzgerald’s results indicated that physical fitness scores did not have a significant effect
upon completion rates at OCS. From her study, she determined that accession was the
only significant factor in predicting successful completion of OCS. During that summer,
those female candidates who were previously enlisted Marines or came from the NROTC
program had a significantly higher probability of success at OCS (ibid, p. 46). Those
candidates pursuing commissions via the MECEP, ECP, MCP, or NROTC programs had
a 15% higher probability of success than candidates from other programs. Captain
Fitzgerald further determined that, when the effect from commissioning source was
removed from the model, the only other significant factor is the age of the candidate. Her
research found that a candidate’s probability of success decreased 1% for each year older
she was when she attended OCS. This finding, as well, contradicted the results of the
North and Smith study, though the finding was not significant at the 0.05 level (ibid, p.
46). She recommended that Marine Corps recruiting efforts be focused on increasing
accessions from the MECEP, ECP, MCP, and NROTC programs and that efforts be
directed toward recruiting younger women for OCS (ibid, p. 73). Additionally, because
of differences in male and female responses determined from the post-course and
separation surveys, she recommended that the six-week pre-course physical training
program for females be changed because the majority of successful and unsuccessful
females recommended that they should do more hiking and walking with a pack to
prepare for OCS (ibid, p. 76). She felt that preparation training for OCS might be more
beneficial if it differed by gender; the majority of males felt that they could have been
20

better physically prepared if they had done more running prior to OCS (ibid, p. 35).
Unfortunately, because of the anonymous nature of the surveys, the results of each survey
were not tied to the participant’s social security number or other code that would identify
each candidate, so the surveys did not provide as much information as they might have.
21

THIS PAGE INTENTIONALLY LEFT BLANK
22

III. DATA AND METHODOLOGY
A. DATA
1. Database Used in Thesis
The data for this study has been collected over the period of a year. During the
period from January 2001 to January 2002, 2,836 Marine officer candidates from twelve
separate companies were given surveys whose responses were entered into the Marine
Corps Automated Information System (MCAIMS). Four of the twelve companies were
OCC companies, three were PLC Junior companies, one was a PLC Senior company, one
was a PLC Combined company, one was a combined OCC and PLC Combined company
because there were not enough of either group to justify separate companies, and two
were combined MCROTC and MECEP “Bulldog” companies. The survey was given to
all candidates from each company in a one-hour classroom setting during the first week
of training at OCS. Although the survey was the primary database for use in building
models for predicting success of candidates, demographic data stored in ARMS was also
used because it was believed that additional predictors might be found in this data.
The first set of surveys, received from an OCC company designated as C-176,
which had 241 candidates, had significantly more errors and missing values than later
surveys because administrators of the survey learned points at which to clarify
instructions as well as techniques to prevent candidates from making errors while filling
out the survey. The last company to take the survey during this period, a 301-candidate
OCC company designated as C-179, served as the test set for the models created. Of
these, demographic data for one OCC company was not available, requiring its removal,
as well, from the analysis. Consequently, two OCC companies, three PLC Junior
companies, one PLC Senior company, one PLC Combined company, one company
containing OCC and PLC Combined candidates, and two Bulldog companies were used
for model development. 2,000 surveys had demographic data available and were usable.
Additionally, many analysis techniques required that responses from any candidate with
missing values be deleted, resulting in 245 more candidates being removed, which left
only 1,755 usable surveys. Thus, there were 284 OCC candidates, 648 PLC Junior
23
candidates, 224 PLC Senior candidates, 284 PLC Combined candidates, 191 MCROTC
candidates, and 124 MECEP candidates in resulting analysis. Some of the analysis
allowed only questions whose responses could be converted to numeric values, reducing
the number of questions used from 67 to 46.
The data from the survey was stored as a flat file in Microsoft Access® (Prague
and Irwin, 1997, p. 3) with each response given the same letter that appears for each
response in the survey. Between two and five sequential letters beginning with “A” were
used for each question representing various responses, depending upon how many
choices candidates had for each question. For situations in which either the candidate did
not answer the question or the scanner could not read the response, the question was
given an “X” value. These databases were later converted into S-Plus® (S-Plus 2000
User’s Guide, 1997, p. 12) data frames for analysis. In the process of conversion, social
security numbers beginning with 0’s had to be corrected so that they could be read
correctly. Additionally, in many cases, the data was not entered in a systematic and
consistent manner: for example, demographic data may have been input into the
Microsoft Access® database as either “True,” “Yes,” or “Y” or a combination of capital
and lower-case letters with the potential for added blank spaces at the end of the typed
response to create additional categories for essentially the same response. These had to be
modified very carefully to ensure that the responses were aggregated properly. For
example, in the “Religion” category from the demographic data, there were at least
twenty variations for the response “Catholic,” most of which resulted from typographical
errors but some from differences in use of capital letters in entering the data. For
example, data for the same entries was often entered with one or more different
keystrokes different or various typographical or spelling errors, resulting in the creation
of different categories in S-Plus®. This problem would have been greatly reduced if a
small macro were produced that would allow personnel entering demographic data to
enter the majority of possible responses via pull-down menus with an option to enter
other selections manually.
While consolidating the data, it was necessary to make several assumptions. First,
for the “Married.Y.N” column in the demographic data, it was assumed all missing
24

values were “No” unless there were some other discriminator that might suggest that the
candidate were married. Most Marine officer candidates are not married, so this is likely
a valid assumption. Second, there were many inconsistencies in columns indicating
whether or not a candidate had dependents and how many of them he or she had at the
time of the OCS class. All those that indicated “Yes” but also showed “0” as the number
of dependents were verified not to have dependents nor be married by OCS staff.
Unfortunately, at the time of the analysis, OCS was unable to provide answers for the
much larger set of candidates who indicated “No” in the column asking whether or not
they had dependents but showed a number greater than 0 in the column of data giving the
number of dependents. In attempting to correct for these discrepancies, it was necessary
to make a few assumptions. First, those candidates who had named dependents were
changed from “No” to “Yes” in the “Dependents.Y.N” column, and the “Number of
Dependents” column was changed to reflect the number of listed dependents. Those who
had no named dependents were more difficult to verify because of the potential for
missing values there. Either the whole group could have been changed to “Yes” because
they had other than a “0,” or only those with named dependents might have been
changed. The latter option was chosen because the vast majority of OCS candidates have
no dependents, and all those with “No” listed were given the number “0” as their number
of dependents. When faced with other inconsistencies in this data, it was decided to go
with a “majority rules” approach. For example, if data indicated that a candidate was
single, had “No” dependents in the “Dependents: Y/N” column and “1” or more in the
“Number of Dependents” column, the last number was changed to read “0”.
Repeat Appearances of Candidates at OCS. There were a few instances in
which candidates appeared twice in the database; these involved a candidate who failed
to complete the program and then returned for another class. In each case, the candidate
again failed to complete the class. Both instances for all these candidates were left in the
database.
Missing Data. Due to the large amount of missing data, it was necessary to make
additional assumptions. As various tables of data were checked, many fields were noted
to be empty. Again, using a “majority rules” approach, they were filled as best as
25

possible. A large number of fields indicating marital status were empty. The fields
indicating whether or not the candidates had dependents and the number of dependents
were used to impute these missing values.
Honesty. One of the big assumptions made in the analysis is that the candidates
taking the surveys were honest in the answering of the questions. Several of the questions
asked were potentially embarrassing or, in the case of questions addressing use of illegal
drugs, could adversely impact the candidate’s future Marine Corps service or even open
the possibility of military or civilian prosecution. Administrators of the survey assured
candidates that the results were completely confidential and that no repercussions would
come from any answers to the survey. Also, there is a tendency even in an anonymous
survey for a participant to try to make himself or herself look better than is really true.
This has been found to be true in surveys asking questions about convictions for drunk
driving or for bankruptcy. There may be concerns among participants that even a small
risk of improper disclosure is not worth providing truthful answers on questions that
might embarrass them (Fowler, 1995, pp. 29-29). It was assumed that candidates
answered truthfully in all questions.
2. Dependent Variable
The dependent variable in this problem is “Grad.Y.N” in S-Plus®, a binary
variable to indicate whether or not a candidate successfully completed OCS. A “0”
indicates a failure, and a “1” indicates success.
3. Independent or Explanatory Variables
The set of independent variables comes from the responses to the 67-question
survey given to Marine Corps officer candidates over the past year and from
demographic data obtained from ARMS. Questions from the survey had between two and
five possible answers, and the database used an “X” to indicate that the candidate did not
answer the question. Demographic categories had a large range of potential responses.
(Appendix A.)
B. METHODOLOGY
1. Initial Findings
26

One of the first things to note with this data set is the overall success rate. The
success rate for OCS for all candidates over the period in which the survey was given
was 77.25% (1,545 graduates out of 2,000 total candidates). Thus, any model making
predictions of graduation should do better than the naïve model in which all candidates
are predicted to graduate. In such a case, the model would be wrong only 22.75% of the
time. If a model does not do at least a little better than this consistently, it is not worth
consideration.
An initial look at the data set and basic check of success rates indicates that there
are statistically significant differences in success rates for the various commissioning
programs. Those in the MECEP program had the best success rate, 93.70% (127/137),
closely followed by the MCROTC candidates, who had an 88.63% success rate
(187/211). The aggregated success rate of all three PLC courses (Junior, Senior, and
Combined) was 77.83% (1,018/1,308). However, when the three courses were separated,
there is a significant difference in the results. The PLC Junior success rate was 83.81%
(585/698), and the PLC Senior success rate was 89.50% (213/238). However, the PLC
Combined success rate was only 59.14% (220/372). This rate very closely matches the
other ten-week program, the OCC program, which had a success rate of only 61.92%
(213/344). Assuming that these 2,000 candidates represent a random sample of all OCS
candidates, a Pearson’s chi-squared test, performed on the cross-tabulation of program
versus graduation, produced a chi-squared value of 187 (on five degrees of freedom) and
a p-value of 0, indicating significant differences in graduation rates between groups.
2. Analysis of Data Set Containing Only Officer Candidates Course Candidates
As was stated earlier in this paper, the initial desire in the creation of models was
to build a model that would provide strong enough conclusions so that the Marine Corps
could predict whether or not individuals would successfully complete OCS. Because of
anecdotal knowledge that the sets of candidates from different commissioning sources
performed differently and because other studies indicated that commissioning source is
one of the most important predictors of success at OCS (North and Smith, 1993, and
Fitzgerald, 1996), the large data set was broken into smaller sets that were homogeneous
27
by commissioning source. It was also felt that building a model predicting success of a
group that had a graduation rate lower than that of the entire group might be possible. In
an attempt to remove variation from commissioning source at the outset of the analysis
and to use a set on which it might be easier to predict success, candidates from the
Officer Candidates Course were separated from the main data set for analysis. This data
set, containing responses from 339 candidates, contained the results from the survey, as
well as over forty questions from the demographic data gathered from ARMS. The
overall success rate of candidates from this data set was 62.5% (212 out of 339). The data
set contained such a large number of possible responses due to the demographic
questions and the letter-based responses to the survey that analysis was extremely
difficult due to limited degrees of freedom available. In order to correct this, many of the
responses in demographic questions were aggregated as best as possible, and some
demographic questions were excluded from the analysis. For example, there were
initially over seventy different “Religion” fields, which were later reduced to four
different categories: Catholic, Protestant, Other, and None.
The first technique attempted was the logistic regression, in which each
candidate’s outcome is assumed to be a Bernoulli random variable with probability
whose logit is a linear function of that candidate’s prediction variables (Hamilton, 1992,
pp. 217-223). This model was then combined with an iterative function in S-Plus® that
computes the Akaike Information Criterion (AIC) (Venables and Ripley, 1994). This
function attempts to minimize the AIC, a score that represents a sum of the model’s total
error plus a penalty function based upon the complexity of the model. The higher the
model’s error and the more complex the model, the higher the AIC score. Thus, a low
AIC score is a desirable trait in a model because the error is small and the model is not
complex (Hand, et al, 2001, p. 225). Using only one-term interactions, the AIC score,
decreased from 450.41 for an empty model with no terms, to 288.18 with 22 independent
variables selected by S-Plus® for the model. In a later attempt to determine AIC from a
data frame including only the 67 questions as independent variables and the “Grad.Y.N”
dependent variable, only eight of the 67 questions were removed. This model is clearly
worse than the previous one because it has more than twice as many terms as the
28

previous one. It is apparent from this analysis that, based upon the large number of terms
in each of these models, the relationship between the available predictors and graduation
is more complex than expected.
After looking at the AIC results, the next statistical analysis technique used on
this data set was the classification tree algorithm (Breiman, Friedman, Olshen and Stone,
1984). Classification trees produced by this algorithm are one of the most important
statistical modeling innovations over the past few decades. The tree model produces a
hierarchy of binary decisions as to the best variable upon which to split the data set,
attempting to create subsets that are as homogeneous as possible. If there are too many
splits, the model will over-fit, while too few splits will result in insufficient predictive
power in the tree. Splits from the algorithm are “greedy,” meaning that they are the best
splits for the moment, possibly at the expense of later split decisions; they may not be the
best ones for the global building of the tree. Trees produced by this algorithm are scored
by a loss function in which each incorrect prediction adds a loss of one to the score, and
each correct prediction adds a loss of 0. Cross-validation of the model is then necessary
to ensure that a low initial misclassification rate is not due to over-fitting the model. In
cross-validation, several subsets randomly generated from the training set are run through
the proposed tree, and the overall misclassification rate is used to indicate how good the
tree is. Ideally, the optimal classification tree size will minimize both the training set
error rate and the test set error rate (Hand, et al, 2001, pp. 145-151).
When the first tree using the entire data set was created, it used 31 variables and
39 terminal nodes and produced a misclassification rate of 9.44%. When cross-validated,
this tree had a misclassification rate of 46%, a clear indication that the full tree over-fit
the model. In an attempt to set a lower bound for the size of the tree, it was pruned to four
leaves, which provided a misclassification rate of 35%, actually worse than the naïve
model’s failure rate of 34.5%. A cross-validation function produced a misclassification
rate of 42%, definitely worse than the naïve model. The tree of six leaves provided a
misclassification rate of 31% for the training set, not much better than the naïve model’s
failure rate and a cross-validated misclassification rate of 42%, as well. Additional
attempts to prune the large tree to eight and ten leaves also produced trees with initial
29

misclassification rates close to the rate for the naïve model and extremely large cross-
validated misclassification rates. Typically, the models had one or more terminal leaves
with fairly large groups and extremely poor misclassification rates that greatly increased
the model’s overall misclassification rate. For example, the eight-leaf tree has one
terminal leaf with 123 candidates, over one-third of the entire data set, which predicts
that all graduate, where only 41.5% of that group actually graduated from OCS. Without
this one leaf, the misclassification rates for this model would have been considerably
lower. Overall, it appears that, even though none of the classification trees appears to be
very good, the best is the six-leaf tree, which has a misclassification rate of 32% and a
cross-validated misclassification rate of 42%. All other trees have either a worse initial
misclassification rate or considerably more leaves and virtually the same cross-validated
misclassification rate. This further supports the assertion of complexity in this data set
and indicates that it will be difficult to predict whether or not individuals will graduate
from OCS.
One of the problems with building models from surveys using categorical
responses is that a degree of freedom is used with each response in each question, thus
making the analysis less powerful when large numbers of degrees of freedom are used.
In numeric questions, only one degree of freedom is used regardless of the number of
potential responses for the question. Based upon the lack of a definitive model predicting
success of candidates and in order to save degrees of freedom, responses for 46 questions
in the survey were converted from categorical to numerical responses. The responses to
many questions, such as question two, which asked for the age of candidates, were
written in an ascending order and were easily transformed. Other questions had responses
that ascended from one extreme scale to another. An example of this transformation was
question eleven, which asked the type of physical activity candidates had before coming
to OCS. The responses went from sedentary work to very heavy manual labor, such as
practiced by miners, laborers, and furniture movers.
Once this was complete, another generalized linear model was created using both
categorical questions and questions whose responses were converted to numeric values.
Then, a classification tree was produced on that same data frame. This tree, like the
30

previous ones, over-fits on the data, contains several large leaves that have a high
misclassification rate, and has a cross-validated misclassification rate higher than the
naïve model. When this tree was pruned to four, six, eight, and fifteen leaves, it produced
results much like the pruned trees produced with only categorical responses. The model
chosen by the AIC criterion proved of little value in prediction. In particular, the usual
chi-squared test for decrease in deviance (Hamilton, p. 237) fails to reject the null
hypothesis that none of the included terms has a non-zero coefficient in the population.
Since these models did not provide any particularly useful results, principal
components were applied to the data frame containing only the numeric categories.
Principal components attempts to simplify the analysis of large numbers of variables by
examining a smaller number of linear combinations of variables in the model, to find an
optimal linear combination of them, and to maximize the explained standard deviation of
the derived variables (S-Plus 2000 User’s Guide, 1997). Principal components analysis is
often conducted to reduce data, sometimes with regression. S-Plus® provides the standard
deviations of the principal components, the loadings, and the scores when this algorithm
is applied to a model. Ideally, in a good model, the principal components should indicate
one or two linear combinations of the variables with variances much higher than
subsequent components. Subsequent components should decrease rapidly, providing an
exponential look to the graph of variances by component. The graph below does not
indicate this desired marked difference in standard deviation from the first to second
component and so forth as would be expected in a good model. It also indicates at the top
of each bar the amount of deviance in the model explained by that bar and all the other
bars to the left of it. Thus, the first ten principal components in this model only explain
48.2% of the variance in the model, much less than is desired. Ideally, for a good model,
it would be desirable to see over 70% of the variance in the model explained in the first
three or four principal components. This result again indicates the multi-dimensional
nature of this data set.
31

01
23
4
Comp. 1Comp. 2Comp. 3Comp. 4Comp. 5Comp. 6Comp. 7Comp. 8Comp. 9Comp. 10
Varia
nces
0.0905
0.1520.209
0.2590.304 0.347
0.384 0.420.453
0.482
Principal Components for OCC Numeric Data Frame
Figure 1. Principal Components for OCC Numeric Data Frame
In another attempt to reduce the dimensionality of the data, the set of 46 numeric
questions was clustered using the agglomerative nesting function in S-Plus® called
“agnes.” This algorithm constructs a hierarchy of clusters in which each observation is
its own cluster at the outset. During each period, the algorithm calculates the Euclidean
distances between all clusters, and the two most similar clusters are merged. Eventually,
all clusters merge into one cluster. The object was once again to find groups of questions
that were quite similar in terms of their sets of responses. Such a set of questions would
presumably contain much redundant information. The questions were divided into six
clusters based on examination of the dendrogram. Once this algorithm was run on the
numeric data frame, the single cluster was cut to the six most homogenous clusters.
These clusters contained 22, 9, 12, 1, 1, and 1 questions each. A look at the groups of
32

questions does not seem to indicate any particular patterns in the grouping of the
questions.
Attempts to look at individual factors from the demographic data in this data set
also did not provide much in the way of strong predictors of success or failure. For
example, an attempt to build a GLM which used the binary factor “Grad.Y.N” as the
dependent variable and an aggregated “Religious Preference” column containing four
categories (Catholic, Protestant, Other, and None) indicated no significant difference in
any of the categories. Also, an attempt to build a classification tree using a model
developed using only the questions addressing amount of time spent as prior-service
military and the amount of time a candidate estimated it took for him or her to run a mile,
both of which are anecdotally believed to be significant predictors of OCS success,
resulted in a 36.3% misclassification rate. Attempts to do better with this model using
AIC provided no better results.
Consequently, it was determined that attempts to build models on only the OCC
candidates using logistic regression, AIC, classification trees, and principal components
did not provide any worthwhile models for predicting graduation of individuals.
However, it was determined that there does not appear to be much redundancy among
questions.
3. Analysis of Complete Data Set Using All Commissioning Sources
Once it appeared that separating the data into groups by source of commissioning
was not helpful in creating a model for predicting success, all sources of commissioning
were aggregated to see if anything better could be determined. Initial models appeared to
indicate the significance of the source of commissioning, as expected. Initial
classification trees using all questions and categorical responses to all questions provided
models not much better than those created only with candidates from the OCC program.
Generally, the misclassification rates for these trees were approximately 20%, and cross-
validated misclassification rates were about 22%. Plots of classification trees may
provide hints of the importance of factors in the model in two ways: first, through the
way the splits occur, and, second, by the vertical distance between a split and the splits 33

immediately below it. Plots of these trees for this model show that the first split occurred
on the question asking the candidate’s commissioning source. Further, the distance
between the first split on OCS Class Code and its “children” leaves is much larger than
the vertical distance anywhere else in the tree. Note that the split for question 4 from the
survey differentiates between OCC and non-OCC candidates and that question 4 does not
separate PLC candidates into their three separate groups. Interestingly, when another tree
was built using the separate PLC codes (Juniors, Seniors, and Combined) from the
demographic data, the first split was on the OCS Class Code, and the split contained
OCC and PLC Combined on one side and all other programs on the other side.
|Q4:A
Q29:C,D,E
Q59:A,B,D
Q58:A,B,C
Q23:A,B,C
Q21:C,D,E
Q29:D,E Q56:B,D
Q21:A,C
Q16:A,D,E
Q34:A,B,D
Q5:B,D,E
Q2:B,C,E
Q26:C,D
Q3:B,C,D
Yes Yes
No
No
Yes Yes Yes No Yes
Yes No
No Yes
Yes Yes Yes
Plot of Classification Tree with Fifteen LeavesUsing Entire Categorical Set
Figure 2. Classification Tree with Fifteen Leaves Derived from Categorical Data Set
Next, those questions that could be converted to numeric responses were changed
in a new data frame. Trees created with this new data set provided approximately the
same results as earlier trees. Akaike Information Criterion and principal components run
34

on a GLM based of this data set using binomial response variables provided roughly the
same results as previously obtained using the same algorithms.
A look at the correlations between numeric questions, the numeric class code, and
the response variable using Spearman’s rho on all 2000 of the candidates in the survey
indicated that only 16 of 1178 pairs had a correlation coefficient greater than 0.4 or less
than –0.4. For correlation coefficients either greater than 0.6 or less than –0.6, there were
only five in this data set. This is an extremely low number of high correlations, especially
for a questionnaire like this that contains so many questions that seem to be closely
related on the surface, which indicates that the questions very rarely duplicated each
other, even though many asked similar questions about similar topics. This finding
further illustrates the high dimensionality of this data set.
When these methods did not provide particularly useful in predicting success of
individual candidates, Bayesian networks were used to attempt to better predict success
of individual candidates. Bayesian networks use Bayes’ rule for probabilistic inference
and are closely related to influence diagrams, combining probability theory and graph
theory. In Bayesian networks, a person with knowledge of the system prepares a data set
for analysis through the creation of nodes and directed arcs that indicate relationships
between factors and the response variable. Arcs are created between nodes if it is felt that
one node influences another one. In this data set, the questions serve as nodes, some of
which, based upon prior knowledge of what has been found to be true in similar data sets.
Nodes may have more than one arc flowing into them and may flow out to either other
nodes representing questions, to the response variable, or to both other questions and the
response variable (Murphy, 2001). To prevent extremely long computing time, it is
important to have, in a data set of this size, only five or so major nodes feeding into the
response variable. In this data set, it was felt that, based upon previous studies, question
4, asking the candidate’s source of commissioning, influenced whether or not he or she
graduated from OCS. It was also felt that question 9, addressing whether or not the
candidate had any prior military experience, and question 10, addressing whether or not
the candidate had family members in the military, influenced question 4, so arcs from 9
and 10 to 4 were added to the network prior to any computations being done. Bayesian
35

networks attempt to calculate probabilities and make predictions based upon the
percentages of responses to each question. A more complex network with many nodes
directly leading to the response variable greatly increases computation time for the
model. The model created from this influence diagram provided an extremely low
misclassification rate of 8%, but the cross-validated misclassification rate was much
higher, 28%, indicating that this model was not better than previous ones.
Then Hartigan’s k-means clustering algorithm was used on the data set containing
numeric questions. In k-means, data points are randomly assigned to one of a pre-
designated number of clusters and then are reassigned to another cluster if the Euclidean
distance to the center of that cluster is less than the distance to the current cluster’s
center. K-means provides a score for each cluster. A small score indicates that the
Euclidean distances from the cluster center to all points in the cluster are small and that,
thus, the cluster is good. Unfortunately, the clusters from this model were quite large,
which indicates that the clusters were not very good (Hand, et al, 2001, p. 303).
Additional analysis of k-means using techniques recommended in S-Plus® recommend
that 17 is the best number of clusters for this data set, again supporting the difficulty of
breaking this data set into small, distinct groups.
Finally, a technique called bagging (Breiman), was used on the data set including
categorical responses. In bagging, a classification tree previously produced is used with
cross-validation to produce an estimate of the error rate for the model. An estimate using
all candidates without missing values in their responses and all survey questions with
three trees provided a misclassification rate of 28%, more than the rate for the naïve
model. An estimate using 101 trees provided a misclassification rate of 22.3%, about the
same as the overall failure rate. Thus, the result from this technique is no better at
predicting success than the naïve model.
Due to the relatively high success rate in this model, it is difficult to predict with
any accuracy whether or not candidates will graduate from OCS. Also, other than the
predicted probability of graduation often produced, most models do not indicate whether
a candidate is a strong “Graduate” or “Don’t Graduate” or very close to going either way.
Thus, one source suggests that there may be data points that fall in the region of extreme
36

difficulty in making correct predictions. For instance, these may be the points discussed
earlier on the trees that have terminal leaves with relatively balanced graduation and
failure rates. Hand recommends that there may be times in which it is best to simply
delete these points with certain characteristics from the data set and not attempt to predict
them, which will likely greatly reduce the misclassification rate. It may be necessary to
accept the fact that it is impossible to accurately predict candidates who meet these
criteria (Hand, 1981, pp. 190-197).
Once all these statistical analysis techniques had been examined, it was
determined that it was not possible to predict individual candidates’ success with any
degree of accuracy any better than the naïve model because of the heterogeneity of this
data set. In particular, in all but the model discussed in Chapter IV, greater than half of
the individuals has predicted probability of success between 40% and 80%. For such
individuals the chance of misclassification is greater than 20%. It is clear that, with the
information given in the survey, the overall misclassification rates cannot be reduced
below the 27% that the naïve model produces. Consequently, the next attempt was to find
the best model created to date and to see if it would at least be possible to accurately
estimate the probability of success of groups of candidates. After some analysis, it was
determined that the following model containing a mix of both categorical and numeric
questions was the best one.
37

glm(formula� =� Grad.Y.N� ~� OCS.Class.Code� +� Q23� +� Q21� +� Q1� �+� Q66� +� Q29� +� Q9� +� Q2� +� Q56� +� Q43� +� Q58� +� Q34� +� Q32� �+� Q40� +� Q52� +� Q46� +� Q10� +� Q3� +� Q14� +� Q54,� �family� =� binomial,� data� =� all.numeric.surveys.x)�
�Coefficients:�� � � � � � � � � � � � � � � � � � � � � � � � � Value� � � Std.� Error� � � � �� � � � � � � � � � � (Intercept)� � -4.255� � � 1.020� � � �� � � OCS.Class.CodeNROTC� � -0.161� � � 0.476� �� � � � � OCS.Class.CodeOCC� � -1.068� � � 0.460� �� OCS.Class.CodePLCComb� � -1.317� � � 0.454� �� � � OCS.Class.CodePLCJr� � -0.077� � � 0.461� �� � � OCS.Class.CodePLCSr� � � 0.263� � � 0.485� � �� � � � � � � � � � � � � � � � � � � Q23� � � 0.336� � � 0.081� � �� � � � � � � � � � � � � � � � � � � Q21� � � 0.214� � � 0.078� � �� � � � � � � � � � � � � � � � � � � � Q1� � -0.582� � � 0.205� �� � � � � � � � � � � � � � � � � � � Q66� � � 0.192� � � 0.077� � �� � � � � � � � � � � � � � � � � � � Q29� � � 0.274� � � 0.099� � �� � � � � � � � � � � � � � � � � � � � Q9� � � 0.315� � � 0.080� � �� � � � � � � � � � � � � � � � � � � � Q2� � -0.311� � � 0.096� �� � � � � � � � � � � � � � � � � � � Q56� � � 0.208� � � 0.081� � �� � � � � � � � � � � � � � � � � � Q43B� � � 0.520� � � 0.171� � �� � � � � � � � � � � � � � � � � � Q43C� � � 0.822� � � 0.364� � �� � � � � � � � � � � � � � � � � � Q43D� � � 0.200� � � 0.225� � �� � � � � � � � � � � � � � � � � � Q43E� � � 0.558� � � 0.307� � �� � � � � � � � � � � � � � � � � � Q58B� � � 0.317� � � 0.161� � �� � � � � � � � � � � � � � � � � � Q58C� � -0.084� � � 0.266� �� � � � � � � � � � � � � � � � � � Q58D� � � 0.978� � � 0.426� � �� � � � � � � � � � � � � � � � � � Q58E� � -1.043� � � 1.652� �� � � � � � � � � � � � � � � � � � � Q34� � -0.231� � � 0.069� �� � � � � � � � � � � � � � � � � � � Q32� � � 0.197� � � 0.077� � �� � � � � � � � � � � � � � � � � � � Q40� � -0.129� � � 0.076� �� � � � � � � � � � � � � � � � � � � Q52� � � 0.172� � � 0.115� � �� � � � � � � � � � � � � � � � � � Q46B� � � 0.132� � � 0.169� � �� � � � � � � � � � � � � � � � � � Q46C� -13.137� � 14.428� �� � � � � � � � � � � � � � � � � � Q46D� � -1.194� � � 1.673� �� � � � � � � � � � � � � � � � � � Q46E� � � 0.294� � � 1.190� � �� � � � � � � � � � � � � � � � � � Q10B� � -0.200� � � 0.250� �� � � � � � � � � � � � � � � � � � Q10C� � -0.117� � � 0.272� �� � � � � � � � � � � � � � � � � � Q10D� � � 0.139� � � 0.252� � �� � � � � � � � � � � � � � � � � � Q10E� � -0.101� � � 0.744� �� � � � � � � � � � � � � � � � � � � Q3B� � -0.292� � � 0.274� �� � � � � � � � � � � � � � � � � � � Q3C� � -0.433� � � 0.232� �� � � � � � � � � � � � � � � � � � � Q3D� � � 0.367� � � 0.337� � �� � � � � � � � � � � � � � � � � � � Q3E� � � 0.547� � � 0.439� � �� � � � � � � � � � � � � � � � � � � Q14� � � 0.092� � � 0.059� � �� � � � � � � � � � � � � � � � � � � Q54� � � 0.066� � � 0.046� � ��Degrees� of� Freedom:� 1755� Total;� 1711� Residual�Residual� Deviance:� 1478.543� �
38

� � � �
This GLM was built by starting with all 67 questions and deleting terms according to the
AIC. The data frame contained only those candidates who had no missing values in their
responses to the survey, and the resulting model contained only 20 terms. It also used
numeric responses for all questions that could be converted to numeric answers, to save
degrees of freedom. The intercept coefficient is an aggregate for all the responses for
what the model determines to be a baseline candidate. In other words, the baseline
candidate in this model is in the MECEP program and is assumed to have answered “A”
to all the questions that could not be converted to numeric responses. The contribution to
the estimated logit of a candidate’s probability of success for a question with numeric
responses is calculated by multiplying the candidate’s numeric response to that question
by the question’s coefficient. For example, if a candidate answered “D” for question 21,
the 4 times the coefficient value for the question (0.214) would be added to the logit. For
a question with individual coefficients for each possible response, the coefficient for the
chosen response is added to the logit. The candidate’s probability of graduation is
calculated by adding the intercept coefficient, the coefficient of his or her OCS Class
Code if not from MECEP, the coefficients from all questions with numeric responses,
and coefficients from the answers to questions with non-numeric responses that the
candidate did not answer as “A.” This number provides the logit or log odds estimated by
the model. The relationship between the logit and the probability of graduation is
logit log( )1
pp
=−
.
Solving for p gives
log
11 itp
e−=+
.
39

THIS PAGE INTENTIONALLY LEFT BLANK
40

IV. MODEL DEVELOPMENT
A. OFFICER SELECTION OFFICER RISK ESTIMATION TOOL
The Officer Selection Officer Risk Estimation Tool (OSOREM) was intended to
be a computer desktop tool that an OSO or MOI could use to help determine whether or
not a candidate is ready for OCS. Now that a model was selected, it was necessary to
determine how good that model is at estimating the probability of success for groups of
candidates. In order to do that, the responses for the 1755 candidates in the model were
run through the model to produce a vector of probabilities of success in a continuous
range from 0 to 1. These were then sorted from the smallest predicted probability of
success to the largest and were then binned into 26 separate groups of 65 candidates, and
the means of the predicted probabilities of success in each bin were calculated and stored
as a separate vector. The actual percentages of graduates for these same 26 groups were
then calculated and stored. The graph below indicates that the model created does a very
good job in estimating the probability of success for groups of candidates in this data set
(Appendices B and C).
41

0.2 0.4 0.6 0.8 1Predicted Probability of Graduation
.0
0.4
0.6
0.8
1.0
Gra
duat
ion
Rat
e
Predicted Probability of Grad vs. Graduation RateFor Training Set
Figure 3. Predicted Probability of Graduation vs. Graduation Rate for Training Set
The correlation between the predicted probability of graduation and the actual graduation
rate for this set of candidates is 99.82%. The following table indicates the predicted
probability of each bin, the graduation rate for that bin, and the absolute value of the
difference in the predicted probability of graduation and actual graduation rate for that
group.
42

Bin Prob(Grad) Pct(Grad) | Prob(Grad) – Pct(Grad) | 1 0.1729 0.2524 0.0795 2 0.4000 0.4129 0.0129 3 0.4925 0.4943 0.0018 4 0.5587 0.5598 0.0011 5 0.6092 0.6103 0.0011 6 0.6487 0.6490 0.0003 7 0.6867 0.6854 0.0013 8 0.7259 0.7254 0.0005 9 0.7588 0.7600 0.0012
10 0.7844 0.7846 0.0002 11 0.8053 0.8062 0.0009 12 0.8246 0.8237 0.0009 13 0.8433 0.8445 0.0013 14 0.8593 0.8595 0.0001 15 0.8732 0.8735 0.0003 16 0.8853 0.8859 0.0005 17 0.8977 0.8982 0.0005 18 0.9086 0.9084 0.0002 19 0.9172 0.9176 0.0004 20 0.9267 0.9276 0.0009 21 0.9352 0.9353 0.0000 22 0.9429 0.9427 0.0002 23 0.9503 0.9507 0.0004 24 0.9585 0.9582 0.0002 25 0.9682 0.9671 0.0011 26 0.9865 0.9838 0.0027
Table 1. Comparison of Predicted Probability of Graduation (Prob(Grad)) with Actual Graduation Rate (Pct(Grad)) for Bins in Training Set
The only cases in which the predicted probability of graduation differed from the actual
graduation rate by more than 1% were the first and second bins, on the extreme end of
the data set. Even then, the most that the two differed was by 8%, which indicates that
this is likely a good estimation tool.
Once it was apparent from this graph that the model was adequately estimating
the probability of success of groups of candidates, the coefficients from this model and
responses to the questions were then input into a Microsoft Excel® data sheet and Visual
Basic® was used to create a tool that OSOs and MOIs could use to estimate the
43

probability of success for each candidate. By answering all the questions that the model
finds to be important to estimate the probability, the OSO or MOI receives an estimate of
the probability of graduation for each candidate. Thus, the OSO or MOI could compare
the candidate’s probability of success with historical probabilities of success and help
determine if he or she feels that the candidate is ready for OCS.
B. OFFICER CANDIDATE SCHOOL ATTRITION PREDICTION MODEL
The intent for the Officer Candidate School Attrition Prediction Model was for a
model that would provide an indication of the likely areas in which a candidate might
have difficulties at OCS and a way in which the OSO or MOI might better prepare the
candidates by indicating the areas in which the candidate could best improve his or her
probability of success at OCS (Statement of Work, 16 October 2001). This same desktop
tool meets the requirements for the second tool, as well. Once the OSO or MOI has
entered the responses to the twenty questions that are required, he or she may then
change any of the question responses to see how the candidate’s probability of success
would change with those new responses. Coefficients from the responses appear on the
“Model” page of the spreadsheet. The larger each coefficient and, thus, the sum of the
coefficients, the higher the probability of graduation is. Those responses that have the
highest coefficients will have the greatest impact upon the predicted probability of
graduation for a candidate. Each failure to answer a question will result in a comment
directing the person entering the data to fill in the blank. Such missing responses make
the model less accurate in predicting success for the candidate in question.
C. MODEL VALIDATION
Once it was determined that the model performed well with predicting success of
groups of officer candidates, the method for determining the predictive power of the
model was applied to the test set, C-179, an OCC company that completed OCS on
March 29, 2002, after all the other companies in the training set had completed OCS.
This data set had 287 candidates once those with missing values were removed. A
predicted probability of graduation was calculated for each candidate in the test set using 44

the same GLM as for the training set. These probabilities were then sorted from lowest to
highest and then divided into ten sets with either 28 or 29 predictions in each. The means
of these predictions and the actual percentages of graduates in each group were
calculated and graphed against each other as indicated below:
0.0 0.2 0.4 0.6 0.8
Predicted Probability of Graduation
0.0
0.2
0.4
0.6
0.8
Gra
duat
ion
Rat
e
Predicted Probability of Graduation vs. Graduation RateFor Test Set
Figure 4. Predicted Probability of Graduation vs. Graduation Rate for Test Set
The code generated in S-Plus® to do this is contained in Appendix E. As can be seen in
this graph, there is, again, a very high correlation between the predicted probability of
success and the actual percentage of success for the candidates. In other words, the
predicted probability of success of each group of candidates is very close to the actual
percentage of graduates in the group. Thus, the model does a very good job in predicting
success in candidates, validating the work done with the training set. This graph further
supports the assertion that this model is likely a good one for use in predicting success for
subsequent candidates. The correlation between the predicted probabilities and the actual
45

percentages is 99.88%, clearly indicating success in predicting graduation percentages.
As in the previous table, the following table indicates the predicted probability of each
bin, the graduation rate for that bin, and the absolute value of the difference in the
predicted probability of graduation and actual graduation rate for that group.
Bin Prob(Grad) Pct(Grad) | Prob(Grad) – Pct(Grad) | 1 0.0000 0.0000 0.0000 2 0.0000 0.0000 0.0000 3 0.0532 0.0267 0.0266 4 0.1498 0.1534 0.0036 5 0.2426 0.2525 0.0099 6 0.3336 0.3360 0.0024 7 0.4323 0.4272 0.0051 8 0.5489 0.5480 0.0009 9 0.6593 0.6541 0.0053
10 0.8239 0.7846 0.0392 Table 2. Comparison of Predicted Probability of Graduation (Prob(Grad)) with Actual
Graduation Rate (Pct(Grad)) for Bins in Test Set
The table above indicates that in no case does the predicted probability of graduation
differ from the actual graduation rate of a bin by more than 4%, and, even then, as with
the training set graph, the greatest difference in predicted probability of graduates and
actual percentage of graduates is at an extreme, which is to be expected. This confirms
that the model for predicting probability of graduation is valid for use.
46

V. SUMMARY, CONCLUSIONS, AND RECOMMENDATIONS
A. SUMMARY
It was originally thought that this survey and data set might allow for the
prediction of whether or not individuals would graduate from Marine Corps OCS. Even
removing the variability from commissioning source by doing analysis on only OCC
candidates did not prove any better than the naïve model at predicting success or failure.
However, by doing logistic regression on the data, it was possible to produce a
generalized linear model that could be used to produce a value that estimates the
graduation rate for groups of candidates. This model has proven to be extremely robust in
both initial model building and in model testing done on a separate data set. The model
performed well on a test set, never being off by more than 4% from the actual graduation
rate. The correlation between the predicted probabilities and actual percentages was more
than 99% for the test set, indicating that this is a good model for providing an estimated
probability of graduation for groups of candidates at Marine Corps OCS.
B. CONCLUSIONS
It was more difficult to predict graduation for individuals from this data set than
originally expected. The survey does not contain the information needed to reduce
misclassification rates below the 27% naïve model rate. However, the best model and the
analysis done on it indicate that, although it is not possible to predict whether or not an
individual candidate will graduate with accuracy, it is possible with a high level of
confidence to estimate the probability of success for groups of candidates attending
Marine Corps Officer Candidates School.
Additionally, it is apparent from the models created that the source of
commissioning is significant in estimating the probability of success of candidates at
Marine Corps OCS. In every classification tree created as well as most of the GLM’s, it
appears that commissioning source is important.
47

C. RECOMMENDATIONS
Data management. The large number of errors from typographical errors greatly
increased the time required to process information for this study. Data appeared in
different formats, and much of the demographic data had been manually typed into the
Microsoft Access® database. This form of data entry resulted in hundreds of
typographical errors that required much time to correct. The building of a macro with a
pull-down menu including the main categories for each question would dramatically
reduce the number of errors of this type and likely markedly reduce the amount of time
required to enter the data, as well. Such a macro could, as well, have a category titled
“Other” that, when selected, would open another entry line that the person entering data
could use to manually enter categories not appearing in the pull-down menu.
Likewise, the survey is written in such a way that, in numerous questions, data is
artificially aggregated from the start. This makes analysis of the data more difficult
because those who write the survey may not know the correct way to aggregate the data
before anyone has taken the survey. Once the data is aggregated in this manner, it is often
impossible – or at least very difficult – to separate the data again. An example of this
artificial aggregation is in question 2, which asks the candidate’s age. Candidates could
select any of five ranges, each of which is at least two years in length. It would be better
if candidates could respond along a continuous range, which is not difficult to implement
with the proper scanning equipment. Another example of a question whose responses
should be separated is question 4, which asks the candidate’s commissioning source.
Certainly, given findings in this paper, the PLC candidates should be separated into their
separate groups (Junior, Senior, and Combined), and additional insight may be attained
through adding ECP and MCP as options in this question. This may show nothing
significant, but it will provide the ability to easily separate, notably for PLC Combined,
which has an attrition rate similar to that of OCC, not to those of other PLC classes.
Survey Modifications. Results from this study and from the literature review
indicate that Marine Corps Studies and Analysis Division may want to add a few
questions to this questionnaire in order to gain better insight into factors that may be
significant. Other questions may provide better results if they are modified in various
48

ways. For example, the question regarding the classification of knee types (number 64)
should be re-worded so that answers follow an ascending scale from one extreme to
another.
Analyses of recruit training attrition conducted by Mobley and others indicate that
intentions, expectations and role attraction aided in predicting attrition of Marine recruits
from initial training (Mobley, Hand, Baker, and Meglino, 1978, p.22). Additional
research by Butler, Lardent, and Miner (1983) indicates that this was true for a group
training to become Army officers at West Point and at Army OCS. The survey in its
current form does not directly address these issues. Indirectly, questions 21 and 22 ask
the candidate’s level of preparedness for OCS’s mental challenges. Questions that
address candidates’ confidence of successfully completing OCS, successfully completing
their obligated service, and serving longer than their required service obligation, and their
general attitudes toward the Marine Corps and becoming Marine officers may help
predict attrition at OCS.
Feeder Questions. In some instances, the survey includes questions that act as
“feeders.” Several questions addressing an issue appear, and they are then summarized by
another question, such as with questions 21 and 22 that address the issue of mental
preparedness for OCS. In this example, it appears that question 22 feeds into question 21.
Addition of other feeder questions may allow summaries of several other questions and
may likely predict much of the variance from the many questions without using up many
degrees of freedom from so many questions. The feeder questions provide a means, as
well, to indicate several questions influencing the feeder, several of which may feed into
the “Grad.Y.N” variable in a Bayesian network or other statistical analysis technique. For
example, there are already a number of questions addressing the work-out habits of
candidates (numbers 23 through 39), and it may be useful to have a feeder question that
asks how prepared the candidate feels he or she is for the physical challenges of OCS.
PFT Scores. The study by North and Smith indicated the significance of PFT
scores in predicting the success of candidates, but no such data has been maintained in
the OCS demographic database. In order to further pursue whether or not the inventory
PFT score is a significant factor in predicting success of OCS candidates, this should be
49

maintained in either the permanent demographic database or as a question in the survey
that asks the candidate to record his or her most recent PFT score.
Survey Composition. Although the survey is useful in its current form, there is
room for improvement in it. Many of the questions are not written as well or clearly as
they should. Although there is much debate as to the correct number of responses to use
in surveys, it appears that the consensus is between five and nine levels. Most studies
indicate that an odd number is better than an even number (O’Muircheartaigh, Krosnick,
and Helic, 2000). Anecdotally, many believe that questions in surveys should not be
written with only five possible responses because people tend not to favor the extremes in
surveys; they are not likely to give either the first or last response in questions when
those questions span two extremes. Consequently, the answers to the question tend to be
grouped fairly tightly in the center, effectively producing only three responses that the
survey participant is likely to answer rather than the five that the survey writer intends.
Thus, it is recommended that responses to the questions be changed so that, for
appropriate questions, each have seven responses according to Likert scaling, which will
likely spread out the responses to the questions and may help better differentiate between
groups of candidates.
50

APPENDIX A: USMC OFFICER CANDIDATES SCHOOL QUESTIONNAIRE�
Directions:� � The� Studies� and� Analysis� Division� of� the�Marine� Corps� Combat� Development� Command� is� conducting� this�survey.� The� data� collected� from� this� questionnaire� is� for�analytical� purposes� only.� The� company� staff� will� not� have�access� to� any� individual� answer� sheets,� and� your� responses�will� be� kept� in� the� strictest� of� confidence.�
�The� purpose� of� this� survey� is� to� assist� in� identifying�
the� contributing� factors� of� successful� candidates� in� order�to� help� Officer� Selection� Officers� and� Marine� Officer�Instructors� prepare� candidates� in� the� future.�
�Answer� each� question� by� filling� in� the� “bubble”�
corresponding� to� the� appropriate� number� on� the� answer� sheet.� �For� all� questions,� please� fill� in� only� one� response� per�question.�
�GENERAL� DEMOGRAPHIC� SECTION:� � This� section� will� attempt�
to� capture� your� general� background� information.� � This�information� will� be� used� to� determine� how� best� to� tailor�pre-OCS� training� to� the� background� of� the� candidate.�
�1)�I� am:�
a)�Male�b)�Female�
2)�My� age� is:�a)�18-21�b)�22-24�c)�25-27�d)�28-29�e)�over� 29�
3)�I� consider� myself:�a)�Caucasian�b)�African� American�c)�Hispanic�d)�Asian�e)�Other�
�
51

4)�Commissioning� program:�a)�OCC�b)�PLC�c)�ROTC�d)�Other�
5)�Did� you� come� to� OCS� under� a� waiver?�a)�No�b)�Yes,� academic� waiver� (GPA,� GT,� EL� score,� etc)�c)�Yes,� moral� waiver� (moving� violations,� drugs,� arrest�
record,� etc)�d)�Yes,� physical� waiver�e)�Yes,� multiple� waivers� (of� one� kind� or� combined)�
��
6)�Which� statement� best� describes� the� climate� in� which� you�trained� to� prepare� for� OCS?�a)�Very� cold� (typically� below� 20� deg� F)�b)�Cold� (20-40� deg� F)�c)�Moderate� (40-60� deg� F)�d)�Warm� (60-80� deg� F)�e)�Very� Warm� (80+� deg� F)�
�7)�Choose� the� geographical� region� where� you� prepared� for� OCS�
(if� you� came� from� outside� CONUS,� choose� the� best�approximation� by� climate):�a)�Southeast� (FL,� AL,� MS,� GA,� SC,� NC,� TN,� LO,� AR,� KY,� VA,�
WV,� MD,� DE)�b)�Northeast� (NJ,� PA,� NY,� MA,� CT,� RI,� NH,� VT,� ME)�c)�Midwest� � � (OH,� IN,� IL,� MO,� IO,� MN,� WI,� KS,� MI,� OK,� NE,�
ND,� SD)�d)�Northwest� (MO,� UT,� ID,� WA,� OR,� WY,� CO)�e)�Southwest� (TX,� NM,� AZ,� CA,� NV)�
�8)�In� which� range� does� your� cumulative� undergraduate� Grade�
Point� Average� fall?�a)�<2.0�b)�2.0-2.5�c)�2.6-3.0�d)�3.1-3.5�e)�>3.5�
�9)�Do� you� have� any� prior� military� experience?�
a)�No� �b)�Yes,� less� than� 1� year�c)�Yes,� 1-4� years�d)�Yes,� 5-8� years�e)�Yes,� more� than� 8� years�
�
52
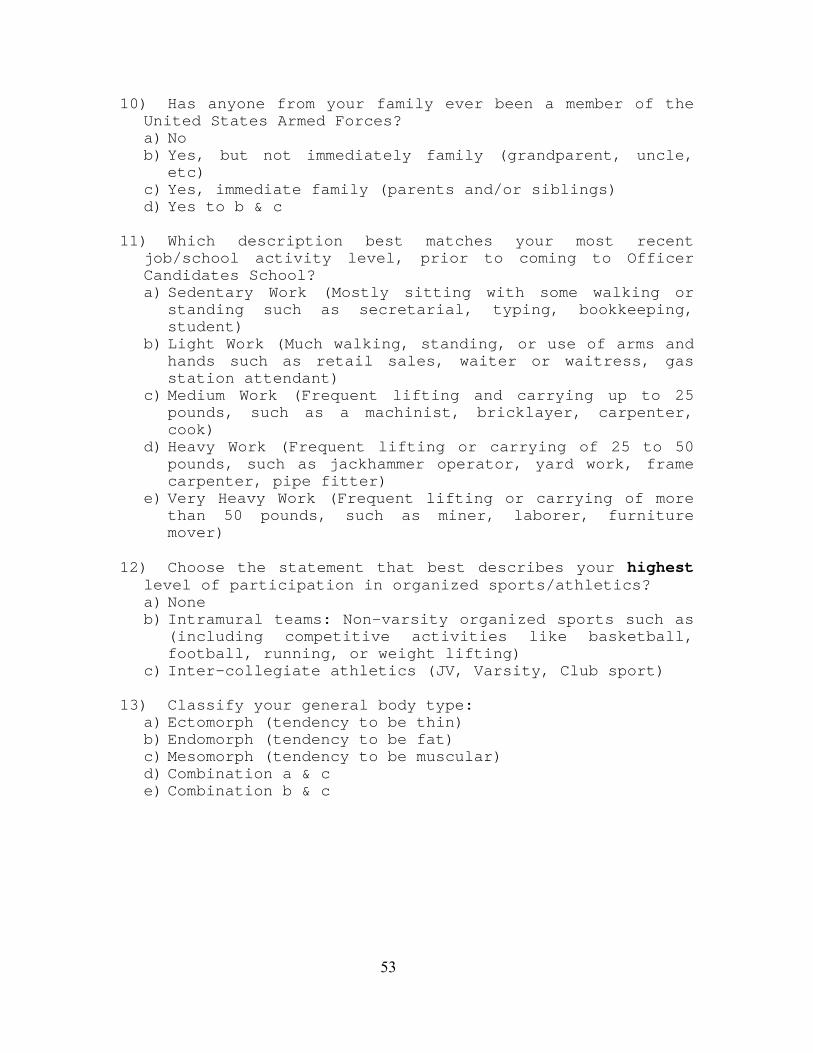
10)� Has� anyone� from� your� family� ever� been� a� member� of� the�United� States� Armed� Forces?� �a)�No� � �b)�Yes,� but� not� immediately� family� (grandparent,� uncle,�
etc)�c)�Yes,� immediate� family� (parents� and/or� siblings)�d)�Yes� to� b� &� c�
�11)� Which� description� best� matches� your� most� recent�
job/school� activity� level,� prior� to� coming� to� Officer�Candidates� School?�a)�Sedentary� Work� (Mostly� sitting� with� some� walking� or�
standing� such� as� secretarial,� typing,� bookkeeping,�student)� �
b)�Light� Work� (Much� walking,� standing,� or� use� of� arms� and�hands� such� as� retail� sales,� waiter� or� waitress,� gas�station� attendant)� � � �
c)�Medium� Work� (Frequent� lifting� and� carrying� up� to� 25�pounds,� such� as� a� machinist,� bricklayer,� carpenter,�cook)� � �
d)�Heavy� Work� (Frequent� lifting� or� carrying� of� 25� to� 50�pounds,� such� as� jackhammer� operator,� yard� work,� frame�carpenter,� pipe� fitter)�
e)�Very� Heavy� Work� (Frequent� lifting� or� carrying� of� more�than� 50� pounds,� such� as� miner,� laborer,� furniture�mover)��
12)� Choose� the� statement� that� best� describes� your� highest�level� of� participation� in� organized� sports/athletics?� �a)�None�b)�Intramural� teams:� Non-varsity� organized� sports� such� as�
(including� competitive� activities� like� basketball,�football,� running,� or� weight� lifting)�
c)�Inter-collegiate� athletics� (JV,� Varsity,� Club� sport)��
13)� Classify� your� general� body� type:�a)�Ectomorph� (tendency� to� be� thin)�b)�Endomorph� (tendency� to� be� fat)�c)�Mesomorph� (tendency� to� be� muscular)�d)�Combination� a� &� c�e)�Combination� b� &� c�
�
53

GENERAL� OCS� PREPARATION:� � The� information� in� this�section� seeks� to� identify� information� about� your� general�preparation� for� OCS� and� the� help� you� may� or� may� not� have�received� in� getting� ready.�
�14)� Which� statement� best� describes� when� you� were� notified�
of� your� acceptance� to� OCS?�a)�I� was� notified� 1-2� weeks� prior� to� reporting�b)�I� was� notified� 3-4� weeks� prior� to� reporting�c)�I� was� notified� 1-2� months� prior� to� reporting�d)�I� was� notified� 3-4� months� prior� to� reporting� �e)�I� was� notified� 5� or� more� months� prior� to� reporting�
�15)� Did� you� receive� military� issue� boots� from� your� OSO/MOI�
office� prior� to� reporting?� �a)�No� �b)�No,� but� he/she� aided� me� in� obtaining/purchasing�
military� issue� boots�c)�Yes�
�16)� Which� statement� best� describes� when� you� purchased� or�
received� your� boots?� �a)�When� I� arrived� at� OCS�b)�1-2� weeks� prior� to� reporting� to� OCS�c)�3-4� weeks� prior� to� reporting� to� OCS� �d)�1� to� 4� months� prior� to� reporting� to� OCS� �e)�5� or� more� months� prior� to� reporting� to� OCS�
�17)� Which� response� best� describes� the� information� you� may�
have� received� on� breaking� in� your� boots� prior� to�reporting� to� OCS?�a)�Did� not� have� my� boots� prior� to� reporting� to� OCS� �b)�Received� no� information� on� breaking� in� my� boots�c)�I� was� provided� instructions� and/or� training� from� a�
source� other� than� the� OSO/MOI� office�d)�I� was� provided� instructions� from� the� OSO/MOI� office�e)�I� was� provided� hands� on� training� and/or� instruction�
from� the� OSO/MOI� office��
18)� Describe� the� condition� of� your� boots� prior� to� arriving�at� OCS?� �a)�Not� applicable�b)�Not� broken� in� at� all�c)�Broken� in� some�d)�Well� broken� in�
�
54

19)� Which� response� best� describes� your� access� to� the� OCS�website� and� your� usage� of� it� for� information� on� the� OCS�program?�a)�I� did� not� know� the� web� site� existed�b)�I� knew� the� web� site� existed� but� I� chose� not� to� access�
it�c)�I� knew� the� web� site� existed� and� I� was� unable� to� access�
it�d)�Yes,� I� visited� the� site,� but� referred� to� the�
site/information� infrequently�e)�Yes,� I� visited� the� site,� and� referred� to� the�
site/information� frequently��
20)� Did� you� follow� the� training� program� provided� on� the� OCS�website?� �a)�No,� I� never� saw� the� information� on� the� web� site�b)�No,� I� chose� not� to� follow� the� training� program� on� the�
web� site�c)�I� followed� the� training� program� in� parts� but� not� in�
others�d)�I� followed� the� training� program� with� some� modifications�e)�I� followed� the� training� program� to� the� best� of� my�
abilities��
21)� On� a� scale� of� 1� to� 5,� with� 1� being� totally� unprepared�to� 5� being� most� prepared,� how� ready� do� you� feel� for� the�mental� challenges� (stress,� chaos,� uncertainty,� etc.)� of�the� OCS� environment?� �a)�1�b)�2�c)�3�d)�4�e)�5�
�22)� On� a� scale� of� 1� to� 5,� with� 1� representing� nothing� to� 5�
being� the� most� possible,� rate� how� much� did� your� OSO/MOI�do� to� prepare� you� for� the� mental� challenges� of� OCS?�a)�1�b)�2�c)�3�d)�4�e)�5�
�
55
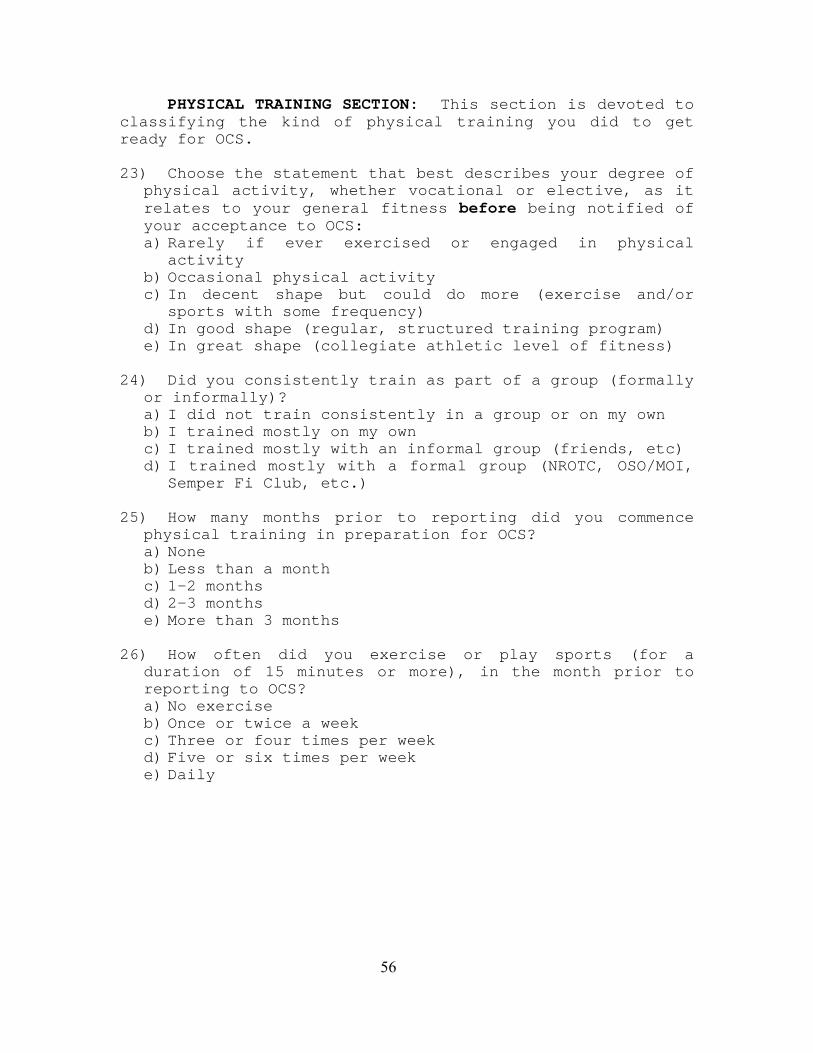
PHYSICAL� TRAINING� SECTION:� � This� section� is� devoted� to�classifying� the� kind� of� physical� training� you� did� to� get�ready� for� OCS.�
�23)� Choose� the� statement� that� best� describes� your� degree� of�
physical� activity,� whether� vocational� or� elective,� as� it�relates� to� your� general� fitness� before� being� notified� of�your� acceptance� to� OCS:� �a)�Rarely� if� ever� exercised� or� engaged� in� physical�
activity�b)�Occasional� physical� activity�c)�In� decent� shape� but� could� do� more� (exercise� and/or�
sports� with� some� frequency)�d)�In� good� shape� (regular,� structured� training� program)�e)�In� great� shape� (collegiate� athletic� level� of� fitness)�
�24)� Did� you� consistently� train� as� part� of� a� group� (formally�
or� informally)?� �a)�I� did� not� train� consistently� in� a� group� or� on� my� own�b)�I� trained� mostly� on� my� own�c)�I� trained� mostly� with� an� informal� group� (friends,� etc)�d)�I� trained� mostly� with� a� formal� group� (NROTC,� OSO/MOI,�
Semper� Fi� Club,� etc.)��
25)� How� many� months� prior� to� reporting� did� you� commence�physical� training� in� preparation� for� OCS?�a)�None�b)�Less� than� a� month�c)�1-2� months�d)�2-3� months�e)�More� than� 3� months�
�26)� How� often� did� you� exercise� or� play� sports� (for� a�
duration� of� 15� minutes� or� more),� in� the� month� prior� to�reporting� to� OCS?�a)�No� exercise� � �b)�Once� or� twice� a� week� �c)�Three� or� four� times� per� week�d)�Five� or� six� times� per� week� � � �e)�Daily�
�
56

27)� Choose� the� statement� that� best� describes� the� type� of�running� or� jogging� you� did� in� preparation� for� OCS:�a)�None�b)�Occasional� slow� runs� (ran� no� more� than� once� a� week,� 2-3�
miles� at� time,� 10� minute� a� mile� or� slower� pace)�c)�Regular� runs,� of� moderate� distance,� and/or� easy� pace�
(ran� 2-3� times� a� week,� 2-4� miles� at� a� time,� 8-10� minute�a� mile� pace)�
d)�Frequent� running,� with� some� runs� of� more� than� moderate�distance,� and/or� faster� than� easy� pace� (ran� 3-5� times� a�week,� 3-6� miles� at� time,� 7-9� minute� a� mile� pace)�
e)�Race� training��
28)� On� average,� how� many� miles� per� week� did� you� run� or� jog,�in� the� month� prior� to� reporting� to� OCS?�a)�None�b)�Less� than� 6� �c)�6� to� 12� �d)�12� to� 20� �e)�More� than� 20�
�29)� Estimate� your� usual� pace� while� running� or� jogging?�
a)�I� am� not� sure� what� my� pace� is�b)�More� than� a� 10� minute� mile� pace�c)�Between� a� 8:30� and� 10� minute� mile�d)�Between� a� 7� and� 8:30� minute� mile�e)�Less� than� a� 7� minute� mile�
�30)� Prior� to� reporting� to� OCS,� how� many� days� per� week� did�
you� do� resistance� training� (i.e.,� free� weights,�universal,� nautilus,� pushups� and� pull-ups,� etc.)?� �a)�No� exercise� � �b)�Once� or� twice� a� week� �c)�Three� or� four� times� per� week�d)�Five� or� more� times� per� week�
�31)� Describe� the� duration� of� these� workouts:�
a)�Not� applicable�b)�Less� than� 15� minutes�c)�15-30� minutes�d)�31-45� minutes�e)�More� than� 45� minutes�
�
57

32)� Choose� the� statement� that� best� describes� the� type� of�hiking� or� road� marching� you� did� in� preparation� for� OCS:�a)�None�b)�A� couple� of� long� walks� in� non-issues� shoes/boots� with�
light� or� no� gear�c)�A� few� moderate� paced� (easy� walking� speed)� short� hikes�
(3-6� miles)� with� light� to� moderate� load� (20-35� lbs)�with� combat� boots�
d)�A� few� hikes� but� either� longer� (>6� miles),� and/or� faster�(fast/speed� walking� pace),� and/or� heavier� load� (35+�lbs)�
e)�A� regular� hike� training� plan� with� increasing� distance,�load� and/or� pace� on� a� weekly� basis��
33)� How� many� miles� per� week� did� you� hike� in� the� month� prior�to� reporting� to� OCS?�a)�None�b)�Less� than� 5�c)�5� to� 10�d)�11� to� 15�e)�More� than� 15�
�34)� How� many� hikes� did� you� conduct� prior� to� reporting� to�
OCS?�a)�None�b)�1-2�c)�3-4�d)�5-6�e)�7� or� more�
�35)� While� hiking,� did� you� carry� a� loaded� pack?�
a)�I� did� not� hike� in� preparation� for� OCS�b)�I� hiked� but� did� not� carry� a� loaded� pack�c)�Yes,� the� pack� weighed� less� than� 20� pounds� � �d)�Yes,� the� pack� weighed� between� 20� and� 35� pounds�e)�Yes,� the� pack� weighed� more� than� 35� pounds�
���
36)� How� frequently� did� you� cross-train� (do� another� form� of�training� like� swimming,� biking,� aerobics,� martial� arts,�etc.)?�a)�Did� not� cross-train� � �b)�Once� or� twice� a� week� �c)�Three� or� four� times� per� week�d)�Five� or� more� times� per� week� � �
�
58

37)� Choose� the� statement� that� best� describes� the� focus� of�your� OCS� preparation� training� time:�a)�Running�b)�Strength� training�c)�Hiking�d)�Cross-training�e)�Combination� of� the� above�
�38)� In� your� training� preparation� for� OCS� did� you� stretch�
your� muscles� prior� to� exercising?�a)�I� did� not� exercise� � � �b)�No�c)�Yes,� sometimes�d)�Yes,� most� of� the� time�e)�Yes,� every� time�
�39)� In� your� training� preparation� for� OCS� did� you� stretch�
your� muscles� after� exercising?� �a)�I� did� not� exercise�b)�No�c)�Yes,� sometimes� �d)�Yes,� most� of� the� time� � �e)�Yes,� every� time�
�HEALTH/LIFESTYLE� SECTION:� � This� section� gathers�
information� on� your� lifestyle� and� health� habits.� � Remember,�none� of� this� information� will� be� revealed� to� the� training�staff� or� even� related� to� you� as� an� individual.� � The�information� will� be� used� strictly� for� a� statistical� analysis�of� the� OCS� candidate� population.� �
�40)� Which� statement� best� describes� your� smoking� habits?� �
a)�I� have� never� smoked� �b)�I� quit� smoking� more� than� a� year� ago� � �c)�I� quit� smoking� in� the� past� year� � � � �d)�I� currently� smoke� less� than� a� pack� per� day� �e)�I� currently� smoke� more� than� a� pack� per� day�
�41)� Which� statement� best� describes� your� use� of� smokeless�
tobacco� (chewing,� dipping� or� pinching)?� �a)�I� have� never� used� smokeless� tobacco�b)�I� used� smokeless� tobacco� in� the� past� but� quit� � � � �c)�I� currently� use� smokeless� tobacco� infrequently� (less�
than� daily)� � � � �d)�I� currently� use� smokeless� tobacco� a� 1-5� times� daily� � �e)�I� currently� use� smokeless� tobacco� more� than� 5� times� per�
day��
59

42)� Which� statement� best� describes� your� alcohol� consumption�habits� during� the� last� year?� �a)�I� do� not� drink� alcohol� at� all�b)�I� consume� between� 1� and� 5� alcoholic� beverages� a� week� � �c)�I� consume� between� 6� and� 10� alcoholic� beverages� a� week� � � � � � �d)�I� consume� between� 11� and� 20� beverages� a� week� � � � � � �e)�I� consume� more� than� 20� alcoholic� beverages� a� week�
�43)� Which� statement� best� describes� your� alcohol� consumption�
habits� during� the� last� year?� �a)�I� do� not� drink� alcohol� at� all�b)�I� drink� beer� or� wine� coolers� mostly�c)�I� drink� wine� mostly�d)�I� drink� mixed� drinks� mostly�e)�I� drink� liquor� mostly�
�44)� What� statement� best� describes� your� use� of� illegal,�
recreational� drugs� (marijuana,� cocaine,� heroin,� LSD,�ecstasy,� etc.)� in� the� past� year?�a)�I� did� not� use� illegal� drugs�b)�I� experimented� with� illegal� drugs�c)�I� used� illegal� drugs� occasionally�d)�I� used� illegal� drugs� frequently�
�45)� When� was� the� last� time� you� used� an� illegal,�
recreational� drug?�a)�Within� the� last� 90� days�b)�The� last� 180� days�c)�The� last� year�d)�1-5� years� ago�e)�Never�
�46)� If� you� used� illegal� drugs,� what� kind� of� drug� did� you�
use� primarily?�a)�Did� not� use� drugs�b)�Marijuana�c)�Pills� (uppers,� downers,� speed,� etc)�d)�Cocaine,� crack,� heroin,� opium�e)�LSD,� PCP,� ecstasy�
�47)� During� the� past� year,� have� you� taken� vitamin�
supplements� with� any� regularity?�a)�No�b)�Yes,� but� not� consistently�c)�Yes,� regularly� (1� to� 4� times� per� week,� most� of� the�
year)�d)�Yes,� daily� (5� or� more� times� a� week)�
�
60

48)� In� the� last� year,� have� you� taken� calcium� Supplements?�a)�No�b)�Yes,� but� not� consistently�c)�Yes,� regularly� (1� to� 4� times� per� week,� most� of� the�
year)�d)�Yes,� daily� (5� or� more� times� a� week)�
�49)� In� the� last� year,� have� you� taken� nutritional�
supplements� other� than� vitamins� (i.e.� protein� drinks,�energy� supplements,� creatine,� weight� gaining� supplements,�etc.)?� � �a)�No�b)�Yes,� but� not� consistently�c)�Yes,� regularly� (1� to� 4� times� per� week,� most� of� the�
year)�d)�Yes,� daily� (5� or� more� times� a� week)�
�50)� Did� you� anticipate� being� able� to� use� vitamin� and�
nutritional� supplements� during� OCS� training?�a)�No� �b)�Yes�
�MEDICAL� HISTORY� SECTION:� � This� section� asks� important�
questions� about� your� medical� history� and� your� body.� � Answer�with� confidence� as� none� of� this� information� will� be� revealed�to� the� training� staff.� � It� will� strictly� be� used� for�statistical� purposes.�
�51)� Have� you� sustained� an� injury� or� accident� that� caused�
you� to� miss� two� days� of� school/work� or� more� in� the� past:�a)�90� days�b)�180� days�c)�year�d)�1-5� years� �e)�Never�
�52)� Have� you� had� major� surgery� in� the� past:�
a)�90� days� �b)�180� days� �c)�year� �d)�1-5� years�e)�Never�
�53)� Have� you� been� hospitalized� overnight� in� the� past:�
a)�90� days�b)�180� days� �c)�year� �d)�1-5� years�e)�Never�
�
61

54)� Have� you� sustained� an� exercise� or� sports� related� injury�that� caused� you� to� decrease� or� quit�exercise/training/practicing� for� a� week� or� more� in� the�past:�a)�90� days� �b)�180� days� �c)�year� �d)�1-5� years�e)�Never�
�55)� Have� you� been� treated� or� sought� care� for� a� mental�
health� problem� in� the� past:�a)�90� days� �b)�180� days� �c)�year� �d)�1-5� years�e)�Never�
�56)� Where� you� sick� in� the� two� weeks� prior� to� reporting� to�
OCS?�a)�Sick� the� whole� time� –� severe� bronchitis,� flu,� etc.� �b)�Sick� for� a� couple� of� days� -� cold,� cough,� fever,� etc.�c)�Had� a� minor� ailment� -� mild� cold,� allergy,� etc.�d)�No� ailments� –� healthy�
�57)� Choose� the� best� statement� with� regards� to� your� health�
insurance� in� the� past� year:�a)�Did� not� have� health� insurance� -� was� denied� care� or� did�
not� seek� care� because� of� it�b)�Did� not� have� health� insurance� -� had� no� problems�c)�Was� covered� (whether� through� military,� parents,�
employer,� HMO,� etc.)��
58)� How� would� you� classify� your� feet?�a)�Flat�b)�Normal�c)�High� arch�d)�I� don’t� know�
�59)� Do� you� pronate� or� supinate?�
a)�Pronate� (sole� of� the� foot� faces� laterally,� turns� out)�b)�Neutral� �c)�Supinate� (sole� of� the� foot� faces� medially,� turns� in)� �d)�I� don’t� know�
�
62

60)� Do� you� wear� orthotics� (arch� support,� shoe� insert,�etc.)?�a)�No,� never� had� any� reason� to�b)�No,� although� I� have� been� referred� to� use� them�c)�Yes,� although� I� have� never� been� referred� to� use� them�d)�Yes,� I� was� referred� to� use� them�
�61)� Describe� the� type� of� shoes� you� wear� the� most?�
a)�sneakers/running� shoes� (the� same� shoes� I� run/train�with)�
b)�sneakers/running� shoes� (different� shoes� than� I�run/train� with)�
c)�rubber-soled� shoes� (normal� walking� shoes,� not� � athletic�shoes)�
d)�Leather-soled� shoes� (dress� shoes)�e)�Boots�
�62)� When� did� you� most� recently� have� a� foot/ankle/lower-leg�
problem� that� caused� you� to� limit� any� daily� activities?�a)�I� have� one� now� �b)�In� the� past� month�c)�1-3� months� ago�d)�More� than� 3� months� ago�e)�Never�
�63)� Choose� the� response� that� most� accurately� describes� your�
most� recent� foot/ankle/lower-leg� problem:�a)�Not� applicable�b)�Hot� spots,� active� or� healing� blisters,� etc.�c)�Other� foot� pain� (arches,� stress� fracture,� sore� heel,�
Achilles� tendon� pain,� etc)�d)�Twisted/sprained/sore/weak� ankle(s)�e)�Shin� splint,� calf� sprain,� lower-leg� pain�
�64)� How� do� you� classify� your� knee� type?�
a)�Definitely� Knock� kneed� (knees� point� in)� �b)�Definitely� Bow� legged� �c)�Normal�d)�Slightly� knock� kneed� �e)�Slightly� Bow� legged� (knees� point� out)�
�65)� When� did� you� most� recently� have� a� knee� problem� that�
caused� you� to� limit� any� daily� activities?�a)�I� have� one� now� �b)�In� the� past� month�c)�1-3� months� ago�d)�More� than� 3� months� ago�e)�Never�
�
63

66)� When� did� you� most� recently� have� a� back� problem� that�caused� you� to� limit� any� daily� activities?�a)�I� have� one� now� �b)�In� the� past� month�c)�1-3� months� ago�d)�More� than� 3� months� ago�e)�Never�
�67)� When� did� you� most� recently� have� a� shoulder� problem� that�
caused� you� to� limit� any� daily� activities?�a)�I� have� one� now�b)�In� the� past� month�c)�1-3� months� ago�d)�More� than� 3� months� ago�e)�Never�
�
64

APPENDIX B: MICROSOFT EXCEL® SPREADSHEET EXAMPLE
The following screen shot provides an example of the first sheet in the Microsoft
Excel® spreadsheet. In this sheet, an OSO, MOI, or candidate may enter responses to the
twenty questions determined to be most important by the model.
65

The spreadsheet calculates coefficients based upon the responses to each of the questions that were input on the previous page. These coefficients indicated in blocks L11 to L50 are then added together to provide a logit in block L51. This number is then used to calculate a probability of graduation, which appears in block L52.
66

APPENDIX C: S-PLUS® CODE USED TO GENERATE PROBABILITY PLOTS
function()�{�#� Construct� probability� estimates.�#� all.numeric.glm.forward� is� a� generalized� linearized� model�#� that� was� created� and� stored� in� S-Plus� based� upon� a� �#� particular� data� set.��pred.numeric.glm� <-� predict(all.numeric.glm.forward,� type� =� �� � "response")� #�#�#� Divide� predictions� into� 27� categories.� Start� by� setting� up�#� the� categories'� boundaries�#�boundaries� <-� quantile(pred.numeric.glm,� c(seq(0,� 1,� length�� � � =� 27)))�categories� <-� cut(pred.numeric.glm,� boundaries)� #�#�#� Compute� within-group� proportions�#�props� <-� tapply(pred.numeric.glm,� categories,� mean)� #�#�#� Compute� mid-points� of� each� group.�#�mid� <-� (boundaries[-1]� +� boundaries[� -� length(boundaries)])/�� � 2� #�#�#� Draw� picture,� add� line�#�plot(mid,� props)�abline(0,� 1)� #�#�#� Compute� correlation�#�cor(mid,� props)�}��
67

THIS PAGE INTENTIONALLY LEFT BLANK
68

LIST OF REFERENCES
Breiman, Leo, Friedman, Jerome H., Olshen, Richard A., and Stone, Charles J. Classification and Regression Trees. Belmont, CA: Wadsworth International Group, 1984.
Breiman, L. “Bagging Predictors,” Machine Learning 24:2, 1996, pp. 123-140.
Butler, Richard B., Charles L Lardent, and John B. Miner. “A Motivational Basis for Turnover in Military Officer Education and Training.” Journal of Applied Psychology. 68:3, 1983, pp. 496 – 506.
Carroll, Rodney D., and Philbert J. Cole, Jr. A Study of Black Officer Candidate Attrition in the United States Air Force, Patterson Air Force Base, OH: Thesis, Air Force Institute of Technology, September 1993.
Commandant of the Marine Corps UNCLASSIFIED letter 7131: CMC to Commanding General, Marine Corps Recruiting Command, Subject: Subsistence Allowance for Platoon Leader’s Class (PLC), 8 November 2001.
Fitzgerald, Cheryl. Analysis of Female Attrition from Marine Corps Officer Candidate School, Naval Postgraduate School, Monterey, CA: Thesis, Naval Postgraduate School, March 1996.
Fowler, Floyd J., Jr. Improving Survey Questions: Design and Evaluation. Thousand Oaks, CA: Sage Publications, Inc., 1995.
Hamilton, Lawrence C. Regression with Graphics: A Second Course in Applied Statistics, Belmont, CA: Duxbury Press, 1992.
Hand, David J. Discrimination and Classification. New York: John Wiley & Sons Ltd., 1981.
Hand, David J., Heikki Mannila, and Padhraic Smyth. Principles of Data Mining. Cambridge, MA: The MIT Press, 2001.
69

Interview between Major Blake M. Wilson, USMC, Marine Corps Recruiting Command and the author, 27 November 2001.
Marine Corps Order (MCO) 1040.43A, Enlisted-to-Officer Commissioning Programs, 02 May 2000.
Marine Corps Order (MCO) 1560.15L, Marine Corps Enlisted Commissioning Program (MECEP), 16 August 1994.
Marine Corps Order (MCO) 7220.43B, Financial Assistance Program (FAP), 02 May 1991.
Marine Corps Order (MCO) 1560.33, Marine Corps Tuition Assistance Program (MCTAP), 04 May 2000.
Marine Corps Order (MCO) P1100.73B, Military Personnel Procurement Manual, Volume 3, Officer Procurement (Short Title: MPPM OFFPROC), 29 September 1989.
Miner, John B. “Testing a Psychological Typology: Relation to Subsequent Entrepreneurial Activity Among Graduate Students in Business Management.” Journal of Applied Behavioral Science, 2000 Mar; 36(1), pp. 43-69.
Mobley, William H., Herbert H. Hand, Robert L. Baker, and Bruce M. Meglino. Organizational Effectiveness Research Programs Office of Naval Research, Arlington, VA, February, 1978. “An Analysis of Recruit Training Attrition in the U. S. Marine Corps.”
Mobley, William H., Herbert H. Hand, Robert L. Baker, and Bruce M. Meglino. “Conceptual and Empirical Analysis of Military Recruit Training Attrition.” Journal of Applied Psychology 64:1, 1979. pp. 10-18.
Murphy, Kevin. “A Brief Introduction to Graphical Models and Bayesian Networks,” [http://www.cs.berkeley.edu/~murphyk/Bayes/bayes.html], October 2001.
NAVMC 10462 (REV. 5-93), Service Agreement (1100) (Series).
70

North, James H. and Karen D. Smith. Officer Accession Characteristics and Success at Officer Candidate School, Commissioning, and The Basic School, Alexandria, VA: Center for Naval Analyses, December 1993.
O’Muircheartaigh, Colm, Krosnick, Jon A., and Helic, Armin, “Middle Alternatives, Acquiescence, and the Quality of Questionnaire Data,” [http://www.harrisschool.uchicago.edu/pdf/wp_01_3.pdf], December 2000.
Prague, Cary N. and Michael R. Irwin. Access 97 Bible. Chicago, IL, IDG Books Worldwide, Inc., 1997.
S-Plus 2000 User’s Guide. Data Analysis Products Division, Seattle, WA: Insightful, 1999.
Statement of Work for the OCS Data Analysis Study. Marine Corps Studies and Analysis Division, Marine Corps Combat Development Command, 16 October 2001.
Telephone conversation between Mrs. Tonya L Durden, Marine Corps Recruiting Command, and the author, 16 August 2002.
Telephone conversation between Master Sergeant Ricardo A. Hudson, USMC, Marine Corps Recruiting Command and the author, 16 August 2002.
Telephone conversation between Major Timothy J. Kornacki, USMC, Naval Postgraduate School, and the author, 20 June 2002.
Telephone conversation between Sergeant Kevin R. Scheaffer, USMC, Officer Candidates School, and the author, 16 September 2002.
“United States Marine Corps Officer Candidates School,” [http://www.ocs.usmc.mil/], May 2002.
“United States Marine Corps Officer Candidates School History,” [http://www.ocs.usmc.mil/history.htm], May 2002.
71

“United States Navy Reserve Officer Training Corps Application,” [https://www.nrotc.navy.mil/scholarships_application.html], August 2002.
“United States Navy Reserve Officer Training Corps Frequently Asked Questions,” [https://www.nrotc.navy.mil/faqs.cfm], August 2002.
Venables, W. N. and Ripley, B. D. Modern Applied Statistics with S-Plus. New York: Springer-Verlag, 1994.
Youngblood, Stuart A., Mobley, William H., and Meglino, Bruce M. “ A Longitudinal Analysis of Turnover Process.” Journal of Applied Psychology 68:3, 1983, pp. 507-516.
72

INITIAL DISTRIBUTION LIST
1. Defense Technical Information Center Ft. Belvoir, Virginia
2. Dudley Knox Library Naval Postgraduate School Monterey, California
3. Marine Corps Representative
Naval Postgraduate School Monterey, California
4. Director, Training and Education, MCCDC, Code C46
Quantico, Virginia
5. Director, Marine Corps Research Center, MCCDC, Code C40RC Quantico, Virginia
6. Marine Corps Tactical Systems Support Activity (Attn: Operations Officer) Camp Pendleton, California
7. Director, Studies and Analysis Division, MCCDC, Code C45 Quantico, Virginia
8. Major Donald B. McNeill, Jr.
Manassas, Virginia
73