Embed Size (px)
Citation preview
NAVAL POSTGRADUATE SCHOOL Monterey, California
THESIS
Approved for public release; distribution is unlimited
PRIVATIZATION IN THE CZECH REPUBLIC DURING THE TRANSITION YEARS: SUCCESS OR FAILURE?
by
Ladislav Svitek
June 2002
Thesis Advisor: Robert E. Looney Second Reader: Peter C. Frederiksen

THIS PAGE INTENTIONALLY LEFT BLANK
i
REPORT DOCUMENTATION PAGE Form Approved OMB No. 0704-0188 Public reporting burden for this collection of information is estimated to average 1 hour per response, including the time for reviewing instruction, searching existing data sources, gathering and maintaining the data needed, and completing and reviewing the collection of information. Send comments regarding this burden estimate or any other aspect of this collection of information, including suggestions for reducing this burden, to Washington headquarters Services, Directorate for Information Operations and Reports, 1215 Jefferson Davis Highway, Suite 1204, Arlington, VA 22202-4302, and to the Office of Management and Budget, Paperwork Reduction Project (0704-0188) Washington DC 20503. 1. AGENCY USE ONLY (Leave blank)
2. REPORT DATE June 2002
3. REPORT TYPE AND DATES COVERED Master’s Thesis
4. TIT LE AND SUBTITLE: Privatization in the Czech Republic during the Transition Years: Success or Failure? 6. AUTHOR(S) Ladislav Svitek
5. FUNDING NUMBERS
7. PERFORMING ORGANIZATION NAME(S) AND ADDRESS(ES) Naval Postgraduate School Monterey, CA 93943-5000
8. PERFORMING ORGANIZATION REPORT NUMBER
9. SPONSORING /MONITORING AGENCY NAME(S) AND ADDRESS(ES) N/A
10. SPONSORING/MONITORING AGENCY REPORT NUMBER
11. SUPPLEMENTARY NOTES The views expressed in this thesis are those of the author and do not reflect the official policy or position of the Department of Defense or the U.S. Government. 12a. DISTRIBUTION / AVAILABILITY STATEMENT Approved for public release; distribution is unlimited
12b. DISTRIBUTION CODE
13. ABSTRACT (maximum 200 words)
This thesis tests an important question: was privatization in the Czech Republic in the transformation period from a command economy to a market economy a success or failure. The importance of answering this question arises because privatization was the keystone for the stabilization and transformation of Central European countries.
Privatization played a significant role as the private sector was missing or played an insignificant role in the command economy. Privatization was not only the most observed part of the stabilization and transformation process but also the most complicated part of this process.
The Czech government’s top priority was to quickly denationalize a large number of state enterprises. A unique method of privatization was implemented to speed up privatization and distribute for free a significant part of state assets. The pace was more important than moral arguments. In contrast, Poland and Hungary used more moderate methods of privatization.
This thesis discusses the basic facts about the privatization process in the Czech Republic, introduces the privatization methods used in the Visegrad countries, compares the pace of privatization, reveals what remains for further privatization and provides a macroeconomic comparative analysis. In addition, it discusses the success and failure of the voucher privatization method.
15. NUMBER OF PAGES
123
14. SUBJECT TERMS Transition, Privatization, Denationalization, Voucher privatization, Comparative analysis, Visegrad countries, Czech Republic, Hungary, Poland, Slovak Republic
16. PRICE CODE
17. SECURITY CLASSIFICATION OF REPORT
Unclassified
18. SECURITY CLASSIFICATION OF THIS PAGE
Unclassified
19. SECURITY CLASSIFICATION OF ABSTRACT
Unclassified
20. LIMITATION OF ABSTRACT
UL
NSN 7540-01-280-5500 Standard Form 298 (Rev. 2-89) Prescribed by ANSI Std. 239-18

ii
THIS PAGE INTENTIONALLY LEFT BLANK
iii
Approved for public release; distribution is unlimited
PRIVATIZATION IN THE CZECH REPUBLIC DURING THE TRANSITION YEARS: SUCCESS OR FAILURE?
Ladislav Svitek
Major, Army of the Czech Republic Eng., Antonín Zápotocký Military Academy, 1984
Submitted in partial fulfillment of the requirements for the degree of
MASTER OF SCIENCE IN INTERNATIONAL RESOURCE PLANNING AND MANAGEMENT
from the
NAVAL POSTGRADUATE SCHOOL June 2002
Author: Ladislav Svitek
Approved by: Robert E. Looney
Thesis Advisor
Peter C. Frederiksen Second Reader
Douglas A. Brook, Ph.D. Dean, Graduate School of Business and Public Policy

iv
THIS PAGE INTENTIONALLY LEFT BLANK
v
ABSTRACT This thesis tests an important question: was privatization in the Czech Republic in
the transformation period from a command economy to a market economy a success or
failure. The importance of answering this question arises because privatization was the
keystone for the stabilization and transformation of Central European countries.
Privatization played a significant role as the private sector was missing or played
an insignificant role in the command economy. Privatization was not only the most
observed part of the stabilization and transformation process but also the most
complicated part of this process.
The Czech government’s top priority was to quickly denationalize a large number
of state enterprises. A unique method of privatization was implemented to speed up
privatization and distribute for free a significant part of state assets. The pace was more
important than moral arguments. In contrast, Poland and Hungary used more moderate
methods of privatization.
This thesis discusses the basic facts about the privatization process in the Czech
Republic, introduces the privatization methods used in the Visegrad countries, compares
the pace of privatization, reveals what remains for further privatization and provides a
macroeconomic comparative analysis. In addition, it discusses the success and failure of
the voucher privatization method.
vi
THIS PAGE INTENTIONALLY LEFT BLANK

vii
TABLE OF CONTENTS
I. INTRODUCTION........................................................................................................1 A. BACKGROUND ..............................................................................................1
1. Starting Position...................................................................................1 2. Importance of Privatization................................................................2 3. Privatization Goals...............................................................................2 4. Visegrad Countries ..............................................................................3
B. OBJECTIVES ..................................................................................................3 C. THE RESEARCH QUESTIONS....................................................................4 D. SCOPE, LIMITATIONS AND ASSUMPTIONS .........................................5 E. METHODOLOGY ..........................................................................................6 F. ORGANIZATION OF STUDY......................................................................6
II. PRIVATIZATION IN THE CZECH REPUBLIC ...................................................9 A. TRANSITION ................................................................................................10
1. Liberal Transition Strategy ..............................................................11 2. Privatization Goals.............................................................................12
B. PRIVATIZATION METHODS ...................................................................13 1. Restitution to Original Owners .........................................................14 2. Small Scale Privatization through Public Auctions ........................15 3. Large Scale Privatization ..................................................................16
C. VOUCHER PRIVATIZATION ...................................................................17 1. The Voucher Privatization Process..................................................18 2. The Privatization Projects .................................................................19 3. The First Wave of Voucher Privatization........................................19
a. Dedicated Assets......................................................................20 b. Participation............................................................................21 c. Role of IPFs.............................................................................21 d. Participation in Bidding..........................................................22 e. Bidding Information and Behavior........................................22 f. Bidding Pricing System...........................................................23 g. Bidding Behavior ....................................................................24 h. Bidding Outcomes ...................................................................24 i. The Voucher Book Value .......................................................25
4. The Second Wave of Voucher Privatization....................................25 5. The Investment Privatization Funds (IPF) ......................................26
III. PRIVATIZATION IN HUNGARY AND POLAND ..............................................29 A. PRIVATIZATION IN HUNGARY..............................................................29
1. The Speed of Privatization................................................................29 2. Privatization Programs and Methods ..............................................32
a. Free Distribution.....................................................................32 b. Spontaneous Privatization......................................................33
viii
c. First Privatization Program....................................................34 d. Small Scale Privatization (Pre-Privatization)........................34 e. The Self-Privatization .............................................................35 f. The Simplified Privatization...................................................36 g. Liquidation ..............................................................................37 h. Preferential Privatization by Management and Employee....37
B. PRIVATIZATION IN POLAND..................................................................38 1. The Speed of Privatization................................................................38
a. Entry into Privatization...........................................................38 b. Completed Privatization Transactions ...................................39 c. Privatization Revenue .............................................................40 d. What was Achieved? ...............................................................40
2. Privatization Methods ........................................................................41 a. Capital Privatization (Commercialization) ............................42 b. Direct Privatization .................................................................42 c. Coupon Privatization ..............................................................43 d. Small-Scale Privatization........................................................43 e. Complementary Methods of Privatization..............................43
IV. COMPARATIVE ANALYSIS..................................................................................45 A. MACROECONOMIC INDICATORS.........................................................45
1. Inflation...............................................................................................47 2. Economic Growth ..............................................................................49 3. Unemployment ...................................................................................52 4. Foreign Direct Investments (FDI) ....................................................54 5. Current Account ................................................................................56
B. INDICATORS OF TRANSITION ...............................................................59 1. Price and Trade Liberalization.........................................................59 2. Progress in Privatization...................................................................62 3. Private Sector .....................................................................................63
a. Private Sector Development....................................................63 b. Private Sector Employment ....................................................65
4. What Left for Privatization? .............................................................65 a. Czech Republic........................................................................65 b. Hungary...................................................................................68 c. Poland......................................................................................69 d. Slovak Republic.......................................................................70
V. SUCCESS OR FAILURE..........................................................................................73 A. THE GOVERNMENT’S MAIN OBJECTIVES.........................................74
1. Ownership Transformation ..............................................................74 2. Public Support....................................................................................75 3. Governance of Privatized Firms .......................................................76 4. Foreign Dominance Prevention ........................................................78
B. OTHER PRIVATIZATION GOALS ..........................................................78 1. Revenue Collection from Privatization............................................79 2. Improved Efficiency of Privatized Firms ........................................80

ix
3. Private Sector Development ..............................................................81 4. Enterprise Ownership Structure ......................................................81 5. Emergence of a Competitive Free Market Environment ...............83
C. POSITIVE AND NEGATIVE OUTCOMES ..............................................84 1. Speed of Privatization........................................................................84 2. Transparency......................................................................................85 3. Distribution for Free..........................................................................85 4. Access to Information........................................................................86 5. Fairness...............................................................................................87 6. Equity ..................................................................................................88 7. Role of Investment Funds ..................................................................88
a. The Positive Results................................................................88 b. The Undesirable Results.........................................................89
VI. CONCLUSION ..........................................................................................................91 A. SUMMARY....................................................................................................91 B. RECOMMENDATIONS...............................................................................94
SELECTED BIBLIOGRAPHY............................................................................................97
INITIAL DISTRIBUTION LIST.......................................................................................105

x
THIS PAGE INTENTIONALLY LEFT BLANK
xi
LIST OF FIGURES
Figure 1. Average Inflation Rate (Average CPI %). .......................................................48 Figure 2. Real GDP Growth Rate in the Visegrad Countries..........................................51 Figure 3. Registered Unemployment in the Visegrad Countries between 1990-2000. ...54 Figure 4. Foreign Direct Investments in Central Europe. ...............................................55 Figure 5. Current Account Balance in the Visegrad Countries. ......................................57 Figure 6. The Private Sector's Share of GDP in the Visegrad Countries. .......................64 Figure 7. The Private Sector's Employment in the Visegrad Countries. .........................65

xii
THIS PAGE INTENTIONALLY LEFT BLANK

xiii
LIST OF TABLES
Table 1. Privatization Revenues of SPA and 1990-1995 (HUF Billion). ......................32 Table 2. The Number of Privatization Transaction Started Each Year in Poland. ........39 Table 3. The Number of Completed Privatization Transaction in Poland by
Method. ............................................................................................................40 Table 4. Revenues from Privatization. ...........................................................................40 Table 5. Enterprises Undergoing Ownership Transformation (as of Dec. 31, 1997). ...41 Table 6. Progress in Liberalization. ...............................................................................62 Table 7. Progress in Privatization. .................................................................................63 Table 8. The Unfinished Privatization Agenda in the Czech Republic (June 30,
1998). ...............................................................................................................67 Table 9. The Quality of Governance..............................................................................78

xiv
THIS PAGE INTENTIONALLY LEFT BLANK
xv
ACKNOWLEDGMENTS
I acknowledge and thank the following people for their help in the successful
competition of this thesis:
I am extremely grateful to my wife, Jaroslava, who has been a constant support
and devotion during the time I have worked on this thesis process.
I appreciate the support, patience, encouragement, and mentoring by Professors
Robert Looney and Peter Frederiksen.
I would like to thank those who gave me an opportunity to study and continue
studies at NPS Monterey, and those who have helped my family to overcome hardship
and sorrow.

xvi
I dedicate this thesis to my younger son Lukáš, who was very ambitious and
hardworking. However, he did not get an opportunity to mature and overcome a severe
disease he faced.

1
I. INTRODUCTION
A. BACKGROUND
The collapse of the communist regimes in Central Europe in the 1990’s created a
strategic problem for the transition from a command economy to a market economy. The
main goal of economic reforms was to rationalize the allocation of resources, privatize
state owned enterprises, liberalize trade, deregulate prices, and lower protection but also
reduce public expenditures and increase revenue. Each of these countries had to face a
dilemma of what to choose, either a radical strategy of reforms with a rapid decline in
consumption and early recovery or a gradual strategy with a moderate decline in
consumption and a later recovery. 1
Privatization and private sector development have played an important role in the
transition period of the Visegrad countries2, which were ranked among the most
industrialized and economically developed countries of the former Soviet block.
Privatization has been not only the most observed part of the stabilization and
transformation process but also the most complicated part of this process. These countries
did not have much experience on how to quickly and efficiently privatize almost the
entire economy.
1. Starting Position
Privatization was not very well received in the beginning in the former
Czechoslovakia 3. The state sector in Czechoslovakia comprised more than 98% of the
entire economy.4 In contrast, the private sector was larger in neighboring Poland or
Hungary. The Czechoslovak communist regime was not inclined towards private
1 See Adam Przeworski, “The Political Dynamics of Economic Reform,” Democracy and the Market: Political and Economic Reforms in Eastern Europe and Latin America (Cambridge: Cambridge University Press, 1991), pp. 136-187.
2 After the disintegration of the COMECON and of the Warsaw Pact, leaders of the former Czechoslovakia, Hungary and Poland established the Visegrad group at a summit in Visegrad in February 15, 1991. They affirmed that they would cooperate in matters of common interest, which led later to the establishment of the Central European Free Trade Agreement (CEFTA) to encourage trade and reduce tariff barriers.
3 The political development led to the split of the former Czechoslovakia in 1993 and the establishment of the Czech and Slovak Republics.
4 See Nemat Shafik, “Making a Market: Mass Privatization in the Czech and Slovak Republics,” Washington D.C.: The World Bank, Policy Research Paper No. 1231, 1993, p. 1.
2
ownership, and did not create the foundations for the private sector until 1988. Therefore,
the Czechoslovak post-communist government had to start almost from scratch. The state
had to sell or transfer most of its productive assets.
2. Importance of Privatization
It is widely recognized that the privatization5 of state assets is one of the key
elements of reforms during the transition from a command economy to a market
economy.6 Privatization, which is one of the key elements of the Washington
Consensus 7, became a symbol of structural change in the post communist countries. The
most important explanation for the support of privatization in the former centrally
planned economies is improved efficiency, performance and corporate governance of
enterprises. The main claim for the transfer of ownership from state hands to private
hands is that privately owned enterprises are more efficient and profitable than state
owned enterprises. Evidence suggests that reforms such as price deregulation, market
liberalization and the use of incentives coupled with privatization are more effective.8
Thus, privatization is not only the most observed part of the stabilization and
transformation process but also the most complicated part of this process.
3. Privatization Goals
Prince Waterhouse described six main goals of privatization. The first goal is to
raise revenue for the state from the transfer of ownership. The second aim is to improve
the economic efficiency of privatized enterprises. The third purpose is to reduce the
5 Privatization is broadly defined as “the deliberate sale by a government of state owned assets or assets to private agents. “ See William L. Megginson and Jeffrey M. Netter, “From State to Market: A Survey of Empirical Studies on Privatization,” Journal of Economic Literature, Vol. XXXIX (June 2001) p. 321.
6 The statistical evidence provided by Fisher and Sahay confirms the importance of privatization as one of the key elements in the reform process. The authors found that stabilization policies and structural reforms, particularly privatization, contributed to growth recovery in transition economies. They concluded that the faster the pace of reforms, the quicker the recovery and the greater the growth. See Fisher Stanley and Sahay Ratna, “The Transition Economies after Ten Years,” Cambridge: National Bureau of Economic Research, Inc., Working Paper No. 7664, 2000.
7 Williamson (1990) classified a list of policy actions known as the Washington Consensus: Actions based on stabilization-cum-adjustment policies recommended by the Bretton Woods organizations and U.S. economic officials. It emphasizes the need for prudent macroeconomic and financial policies, unified and competitive exchange rates, trade and financial liberalization, privatization, and deregulation. See Joachim Ahrens, Toward a Post-Washington Consensus: The Importance of Governance Structures in Less Developed Countries and Economies in Transition. Available [Online]: <http://www.sigov.si/zmar/apublici/iib/iib0400/08-ahren.pdf> [2 February 2002], p. 5.
8 See William L. Megginson and Jeffrey M. Netter, “From State to Market: A Survey of Empirical Studies on Privatization,” Journal of Economic Literature, Vol. XXXIX (June 2001) p. 380.

3
government’s involvement in the economy. The fourth objective is to broaden the
enterprise ownership structure. The fifth goal is create a competitive environment. The
final objective is to subordinate state owned enterprises to free market discipline.9
4. Visegrad Countries
The privatization experience from the Visegrad countries is not straightforward.
The Czech Republic implemented radical reforms and a rapid pace of privatization by
using a unique mass privatization method. In addition, the Czech government decided to
distribute a significant part of state owned assets for free. In contrast, Poland and
Hungary favored a gradual pace for transition, more moderate privatization methods and
the distribution of state assets for free played a less important role in the privatization
strategy.
B. OBJECTIVES
The primary objective of this thesis is to test an important question: was
privatization in the Czech Republic in the transformation period from the Soviet style
economy to a market economy a success or failure. The importance of answering this
question arises because privatization was the keystone for stabilization and
transformation of command economies in Central and Easter European countries.
Privatization played a significant role as the private sector was missing or played an
insignificant role in the Soviet style economy. Privatization was not only the most
observed part of the stabilization and transformation process but also the most
complicated part of this process.
The Czech government’s top priority was to quickly privatize the state sector. The
major problem was how to quickly privatize a large number of state enterprises. In
addition, the democratic government decided to use new methods of privatization. A
unique method of privatization was implemented to speed up privatization and distribute
a significant part of state owned property to the citizens. The pace was more important
than moral arguments because leading political forces decided to undertake this task
radically. In contrast to the rapid and radical privatization in the Czech Republic, Poland
and Hungary used more moderate methods of privatization.
9 See William L. Megginson and Jeffrey M. Netter, “From State to Market: A Survey of Empirical Studies on Privatization,” Journal of Economic Literature, Vol. XXXIX (June 2001) p. 30.

4
This goal of this thesis is to examine if the new method of privatization used in
the Czech Republic was really the “Czech miracle” or a disappointment, and in addition,
examine whether the privatization methods used in the Czech Republic were faster and
more efficient than those followed in Hungary and Poland. The next objective is to
review the current information known concerning the privatization process in the Czech
Republic, and the privatization methods used in Poland and Hungary. A comparison will
then be done on the pace and methods of privatization used in the Czech Republic with
those used in Poland and Hungary. A summary of the views concerning the success or
failure of privatization in the Czech Republic will be presented. Then, a comparative
analysis is provided on how privatization methods affected macroeconomic development
in these countries. Moreover, an assessment of the importance of the pace of the
transition period and how the pace of privatization affected its credibility will be given.
Finally, it will be determined if the new method of privatization used in the Czech
Republic was really a miracle or a disappointment.
The purpose of this thesis in dealing with the results of the privatization methods
used in the Visegrad countries is threefold. First, it presents and discusses the basic facts
about the privatization process in the Czech Republic because a unique privatization way
was implemented to speed up privatization and distribute a significant part of state owned
property to the citizens. Second, it introduces the privatization methods used in other
Visegrad countries and compares the pace of privatization among them and reveals what
is still needed for further privatization. Third, it provides a macroeconomic comparative
analysis of the Visegrad countries by focusing on the last decade in order to reveal to
what extent the Czech privatization approach was successful or not.
C. THE RESEARCH QUESTIONS
This thesis attempts to answer the following questions:
• Can privatization in the transformation period from the Soviet style economy to a market economy in the Czech Republic be described as a success or failure?
• What is voucher privatization and the reason for its implementation in the Czech Republic?
• Which political forces affected the selection of the privatization methods and what was the reasoning behind it?
5
• Is it possible to ascertain how the newly created voucher funds affected corporate governance?
• What were the drawbacks of voucher privatization?
• What kinds of privatization methods were used in the Visegrad countries?
• How did privatization methods affect the pace of privatization?
• What was the extent of the state property distribution to citizens in the Visegrad countries and how was the equality of distribution affected by the privatization methods?
• How did the privatization methods affect macroeconomic development in the Visegrad countries?
• How much is still left to privatize in the Visegrad countries at the end of the millennium?
D. SCOPE, LIMITATIONS AND ASSUMPTIONS
The focus of this study is on the Czech experience because it represents an
attempt to accelerate the privatization process by adopting a voucher privatization
method in one of the strongest institutional settings among transition countries from the
former Soviet block. The study examines what privatization methods were used in other
Visegrad countries. This study explores what was achieved in privatization in Visegrad
countries and compares the achieved macroeconomic developments. In addition, it tries
to find and discuss the positive and negative aspects of voucher privatization.
This study does not endeavor to address the entire scope of concerns and criticism
of the implemented privatization methods. It does not examine in depth the privatization
process in Hungary, Poland and the Slovak Republic. Rather, this study focuses on a
unique privatization method and its implementation. The goal is to review the
achievements and drawbacks of privatization in the Czech Republic because the extent of
privatization was greater there than in other Visegrad countries.
The goal of this thesis is to evaluate to what extent the government objectives and
public expectations were fulfilled. Understanding the Czech privatization example is
important for the future as well as being important to those who would like to follow this
example.
The majority of studies about privatization and macroeconomic development are
restricted by the limited availability of primary sources of information. Also, the quality
6
of data available for comparative analysis is limited. It is difficult to obtain current data at
the same time for a group of countries. Researchers mainly draw from secondary data
sources. However, the future promises improvements in the case of Visegrad countries.
Why? They are forced by the European Union to release more information to the public
and make the institutional settings more transparent.
E. METHODOLOGY
The overall purpose of this thesis is twofold. First, it is to analyze the success or
failure of the Czech privatization example by examining the privatization process itself.
The goal is to investigate to what extent the Czech government was able to fulfill its
privatization objectives. Second, it is to conduct a macroeconomic comparative analysis
of Visegrad countries focusing on the last decade to reveal to what extent the Czech
privatization approach was successful or not. The information for this research is drawn
from a literature search of books, journal articles, working papers, and other library
materials relevant to the subject.
The first approach used in this thesis is the descriptive analysis of the
privatization process in the Czech Republic and methods implemented with the main
focus on the coupon privatization method during the transition to a market economy. In
addition, a descriptive analysis of privatization methods used in other Visegrad countries
is provided. The second approach used in this study is to conduct a macroeconomic
comparative analysis of the Visegrad countries. The comparative analysis includes a
comparison of macroeconomic indicators such as economic growth, inflation,
unemployment, equity and foreign investment. It also encompasses a comparison of
elements of free market development such as free trade, price liberalization, deregulation
and corporate governance.
F. ORGANIZATION OF STUDY
This chapter has presented an overview of research questions and explains the
purpose of the study. Chapter II provides an overview of the privatization process in the
Czech Republic and mainly focuses on the unique coupon privatization method. Chapter
III briefly discusses the privatization methods used in Hungary and Poland. Chapter IV
provides a macroeconomic comparative analysis of Visegrad countries in order to reveal

7
to what extent the pace of privatization affected macroeconomic development in these
countries. Chapter V gives an overview of the current evaluations of the Czech
privatization approach. Chapter VI summarizes the findings of the thesis and derives
recommendations for further research.

8
THIS PAGE INTENTIONALLY LEFT BLANK
9
II. PRIVATIZATION IN THE CZECH REPUBLIC
The disintegration of the communist regime in 1989 caused the strategic problem
of transitioning from a command economy to a market economy. The main goal of
economic reforms was to rationalize the allocation of resources, privatize state owned
enterprises, liberalize trade, deregulate prices, and lower tariffs. In addition, the plan was
to reduce public expenditures and at the same time increase tax revenues. The dilemma
was whether to chose between a radical strategy of reforms leading to a rapid decline in
consumption and an early recovery or a gradual strategy leading to a moderate decline in
consumption and a later recovery. 10
The first part of this chapter presents a brief overview of where the former
Czechoslovakia began to rebuild itself after the fall of the communist regime. Next, the
people who shaped the transition strategy and its basic principles are discussed. The goal
of privatization is also reviewed.
The second part of the chapter presents an overview of the privatization programs
used in the Czech Republic. The restitution program is described followed by a summary
of the small scale privatization method. Finally, the large scale privatization program is
described.
The third part of the chapter focuses on the unique coupon privatization method11,
which occurred in two waves, and had a significant impact on the political sustainability
of radical reform. First, the voucher privatization process is described followed by a
discussion of the privatization projects. Next, information about the first wave of voucher
privatization is introduced, and the results of the second wave are then summarized. The
last part of the chapter describes the investment privatization funds and their importance.
10 See Adam Przeworski, “The Political Dynamics of Economic Reform.” Democracy and the Market:
Political and Economic Reforms in Eastern Europe and Latin America (Cambridge: Cambridge University Press, 1991), pp. 136 -187.
11 In this paper I use the coupon method and voucher method interchangeably.
10
A. TRANSITION
Privatization was not favorably received when it was first introduced in the
former Czechoslovakia12. The Czechoslovak economy had been almost entirely owned
by the state.13 Firms were either directly or indirectly state owned through state owned
banks. Shafik insists that 98% of the assets were in state hands and private property rights
did not exist.14 On the other hand, however, income distribution was more equal, and
inflation, unemployment and the external debt were lower than in Hungary and Poland.
The party system was relatively stable. When the Czechoslovak economy started over it
was often claimed to be the best as far as foreign indebtedness was concerned.15 For a
long time, Czechoslovakia was traditionally oriented towards manufacturing, had one of
the highest living standards of the former Soviet block and had very low-income
inequality. 16
The communist regime was inclined to state ownership, and did not become
involved in the private sector until 1988. The Czechoslovak post-communist government
had to start almost from scratch. For example, the state had to sell or transfer most of its
productive assets. By all accounts, the start was slow. In mid-1992, more than 95% of the
economy was still controlled by the state.17 The key to the transformation was coupon
privatization that involved every adult citizen. The idea was to offer each an incentive to
own property directly. Moreover, the goal was to cause these property owners to support
privatization, and by doing so, create political and economic stability.
12 The political development led to a split of the former Czechoslovakia in 1993 and the establishment of the Czech and Slovak Republic.
13 In 1989, the private sector was employing only 1.2% of the work force. See “The Current State of the Czech Privatization”, Czech Business and Trade, February 19, 2002, Available [Online]: http://www.mpo.cz/gc/0003/page0012.htm.
14 Nemat Shafik, “Information and Price Determination under Mass Privatization,” Washington D.C.: The World Bank, Policy Research Working Paper No. 1305, 1994, p. 22.
15 Václav Klaus, “A Perspective on Economic Transition in Czechoslovakia and Eastern Europe,” Washington D.C.: The World Bank, Keynote Address, The World Bank Annual conference on development economics, 1990, p. 14.
16 John Nellis, “External Advisors & Privatization in Transition Economies,” Washington D.C.: The World Bank, Working Paper No. 3, February 2002, p. 22.
17 Carol Graham, “Voucher Privatization in the Czech Republic,“ Private Markets for Public Goods: Raising the Stakes in Economic Reform, Washington, D.C.: Brooking Institution Press, 1998, p. 217.

11
1. Liberal Transition Strategy
The most important figure in shaping the strategy of the economic transformation
in Czechoslovakia was Václav Klaus, the Minister of Finance in the first elected
government coalition, and the Czech Prime Minister after the 1992 elections. His
rhetorical commitment to free market principles was virtually absolute. He fought for
what he repeatedly called a “market without adjectives” – not a “socialist market
economy” or a “mixed” economy, but a full-blown free market economy.”18 The pace at
which this happened was more important than moral arguments.
Václav Klaus preferred a transition from a centrally planned economy to a market
economy. He was strongly against the introduction of any combination of a centrally
planned and market economy. The goal was a rapid transition that would initially create a
short period of zero or negative growth rate followed shortly thereafter by a positive
growth rate. The focal points of the transition strategy were privatization, price
liberalization and foreign trade liberalization. 19
There was a general agreement among Czechoslovak economists and politicians
concerning the basic principles of economic transition. The basic principles for a
transition from a command economy to a market economy were the fast dismantling of
the administrative system of central planning, price liberalization, liberalization of
foreign trade and exchange rates, restrictive fiscal and monetary policies to prevent
hyperinflation and privatization of an important part of state controlled assets.20
The main conflict was between the liberal right wing economists led by Václav
Klaus, Tomas Ježek, Vladimír Dlouhý and the left-center wing led by Valtr Komárek,
Miloš Zeman and Ota Šik. Their main disagreement concerned the method and the pace
18 Oskar Krejcí, “Economic Transition,” Czechoslovak National Interests: A Historical Survey of Czechoslovak National Interests and Relations on the Demise of Czechoslovak Communism (New York: Columbia University Press, 1996), p. 180.
19 Václav Klaus was appointed on December 10, 1989 as the first Minister of Finance of the Czech and Slovak Federal Republic after the Velvet revolution. In 1990, shortly after his appointment, he hammered out a provisional budget for fiscal year 1991, followed by a new budget with the goal of transforming the former budget from a deficit to a surplus. Václav Klaus, “A Perspective on Economic Transition in Czechoslovakia and Eastern Europe.” Washington D.C.: The World Bank, Keynote Address, The World Bank Annual Conference on Development Economics, 1990, pp. 13-18.
12
of economic transition. The former group supported rapid privatization and the rapid
introduction of a free market. In contrast, the later group favored gradual privatization
with the government playing an active role in the economy. Valtr Komárek supported a
slower pace of privatization because he saw “shock therapy” as the killer of reforms. The
President of the former Czechoslovakia, Václav Havel, supported a third method of
transition based on the example of the Asian Tigers. This transformation was based on
protectionism in domestic markets, and supporting exports in areas with a comparative
advantage.
Václav Klaus defeated this form of transformation. In 1991, the rapid course of
actions was implemented. In contrast, there was no disagreement about the rapid pace of
small privatization. 21 Under pressure from other political parties, Klaus agreed to the
restitution of property nationalized by the Communists after 1948. The reason for this
limitation was to make the privatization process faster and easier to accomplish. Sensitive
enterprises known as “family jewels” remained in state hands. The basic procedures for
privatization were outlined in law in February 1991. Each adult citizen had the right to
purchase a voucher book.
2. Privatization Goals
Prince Waterhouse described six main goals of privatization. The first is to raise
revenue for the state from the transfer of ownership. The second is to improve the
economic efficiency of privatized enterprises. The third is to reduce the government’s
involvement in the economy. The fourth is to broaden the enterprise ownership structure.
The fifth is to create a competitive environment. The final goal is to subordinate state
owned enterprises to free market discipline.22
The first main objective of Czech privatization was to attain ownership
transformation and gain pubic support for privatization. The Czechoslovak public did not
20 Oldrich Kyn, “Market with Vouchers and Investment Funds,” Prague: CERGE, 1992, Available
[Online]: <http://econc10.bu.edu/okyn/Okpers/Vouchers/vouchers1.htm>, February 19, 2002. 21 Ibid., p. 2. 22 See William L. Megginson and Jeffrey M. Netter, “From State to Market: A Survey of Empirical
Studies on Privatization,” Journal of Economic Literature, Vol. XXXIX (June 2001) p. 30.
13
immediately support a Western style parliamentary democracy with a free market.23 The
second reason for supporting privatization was to improve efficiency, performance and
the governance of enterprises. The main claim is that privately owned enterprises are
more efficient and profitable than state owned enterprises. The next objectives were to
prevent the domination of foreigners or the domination of the communist nomenclature in
the privatization process.24 In contrast, the objective of privatization was not to address
issues such as regional development, unemployment and fiscal shortfalls.
The importance of the pace and equality of privatization led to the voucher
method. The major priorities became the need for rapid ownership transformation,
preparation for privatization, limited involvement of the government in companies and a
quick sale of state owned enterprises. In contrast, the sale price and collecting the revenue
were less important. Why was the pace so important? It was important in order to reduce
the time in which the firms would be in limbo without effective possessors. There were
two reasons why political parties were afraid. The first was that foreign investors would
outbid domestic investors whose total private savings amounted to only about 300 billion
CZK in 1991. The second was that the wealthier citizens would benefit more as 60% of
households had savings of less than 20,000 CZK. Equal public participation was
politically crucial in order to avoid the perception that only the wealthier citizens and
foreigners were benefiting from privatization. 25
B. PRIVATIZATION METHODS
Privatization in the former Czechoslovakia was accomplished under the three
programs of restitution, small scale privatization and mass privatization and direct sale.
The restitution program was designed to return assets nationalized after February 1948
under communist rule. The small scale privatization focused on small business units that
were sold at public auctions. The main privatization program was mass privatization in
23 Based on the public opinion poll from December 1989, only 22% of the population favored wholesale privatization of industry and 13% supported privatization of agriculture. The median orientation was favored by 47% of citizens while 45% of the citizens still wanted to follow reformed socialism, and only 3% favored capitalism. Carol Skalnik Leff, “The Velvet Revolution of 1989 and the Politics of Democratization,” The Czech and Slovak Republics: Nation versus State (Boulder, Colorado: Westview Press, 1997), p. 83.
24 Carol Graham, “Voucher Privatization in the Czech Republic,” Private Markets for Public Goods: Raising the Stakes in Economic Reform (Washington, D. C: Brooking Institution Press, 1998), p. 217.

14
which ownership rights of a large number of enterprises were transferred from the state to
private hands.
A special Board for the Temporary Administration of the State Property and Its
Privatization under the Ministry of Finance prepared the fundamental concept of the
privatization scheme and organized the privatization process.26 Its head, Dušan Tríska,
was the primary creator of coupon privatization. He stressed the importance of the pace
in order for privatization to succeed.27 The privatization process was divided into two
waves. The first wave included commercialization of the state owned enterprises that
meant the creation of state joint stock companies with a given number of shares in the
crucial part of the economy. The second wave covered the sale of shares to the public
through auctions. The voucher privatization scheme anticipated the distribution of a large
part of state assets for free to the public in the form of vouchers and a quick
transformation of property rights.28
1. Restitution to Original Owners
The restitution method of privatization focused on the return of specific property
seized by force after 25 February 1948. This restriction meant that most industrial assets
were excluded from restitution. 29 Also, financial assets, company shares and Nazi
property rewards were excluded from restitution. Small scale restitution encompassed the
return of about 80,000 buildings to include hotels, pubs and shops nationa lized after
1955. Large scale restitution encompassed only small assets since only 13.7% of
productive assets remained in private hands by February 1948.30
25 Nemat Shafik, “Making a Market: Mass Privatization in the Czech and Slovak Republics,” Washington D.C.: The World Bank, Policy Research Paper No. 1231, 1993, pp. 2-3.
26 Václav Klaus, “A Perspective on Economic Transition in Czechoslovakia and Eastern Europe.” Washington D.C.: The World Bank, Keynote Address, The World Bank Annual conference on development economics, 1990, p. 17.
27 John Nellis, “External Advisors & Privatization in Transition Economies,” Washington D.C.: The World Bank, Working Paper No. 3, February 2002, p. 25.
28 Václav Klaus, “A Perspective on Economic Transition in Czechoslovakia and Eastern Europe.” Washington D.C.: The World Bank, Keynote Address, The World Bank Annual Conference on Development Economics, 1990, p. 17.
29 By February 1948, 82.3% of Czechoslovak capital assets were nationalized and private sector accounted for 33.4% of total national product. See John S. Earle, Roman Frydman, Andrzej Rapaczynski and Joel Turkewitz, “Small Privatization: The Transformation of Retail trade and Consumer services in the Czech Republic, Hungary and Poland”. New York: Central European University Press, 1994, p. 54.
30 Eva Marikova, “Voucher Privatization in Czechoslovakia,” Comparative Economic Studies, Flushing: Fall 1993; Leeds, p. 2.
15
The restitution law was linked to 25 February 1948. Properties nationalized before
that date were excluded from privatization that created a controversy. The German
Government tried to push the Czech Government to revise that date and tried to open
discussions about the claims of Sudeten Germans. Around three million Sudeten
Germans were forced to leave Czechoslovakia after World War II. President Vaclav
Havel expressed his regret concerning the treatment of Germans at the end of war.
However, a revision of the dates by the Czech parliament was not on its agenda.
The restitution described above was not meant to correct every existing mistake.
Instead, it was designed to bring restitution into the spirit of the law. Claims prior to 1948
and those who were not Czech citizens were excluded from restitution. During the
restitution process, many claims for numerous shops, restaurants, hotels, workshops,
houses, land parcels and small factories were eligible for restitution. The applicants
submitted their claims to organizations that had the property in question in their custody.
If a return was not possible, the former owners received monetary compensation in the
form of shares in an investment restitution fund. Over 100,000 items, mainly residential
houses31 and approximately 17,000-20,000 trade and service establishments have been
returned to former owners or their heirs.32
2. Small Scale Privatization through Public Auctions
The small scale privatization method was applied to small size business units33 in
the form of public auctions. The number of auctioned units in a tender reached 21,768 by
the end of 1992. The total opening price for these units reached 25.1 billion CZK and
total sales revenues reached about 31.1 billion CZK.34 On average, the selling price
31 John S. Earle, Roman Frydman, Andrzej Rapaczynski and Joel Turkewitz, “Small Privatization: The
Transformation of Retail Trade and Consumer Services in the Czech Republic, Hungary and Poland”. New York: Central European University Press, 1994, p. 57.
32 John S. Earle. Roman Frydman, Andrzej Rapaczynski and Joel Turkewitz, “Eastern European Experience with Small Scale Privatization,” CFS Discussion Paper, No. 104, New York: The World Bank, 1999, p. 16.
33 Shafik defined the size of enterprise as small (book value under CZK 100,000,000), medium (book value more than CZK 100,000,000 and less than 500, 000,000), and large (book value greater than CZK 500,000,000). Nemat Shafik, “Making a Market: Mass Privatization in the Czech and Slovak Republics,” Washington D.C.: The World Bank, Policy Research Paper No. 1231, 1993, p. 54.
34 Ibid., p. 53.

16
exceeded the opening price by 51%.35 Although the auctions offered an equal opportunity
for all participants, the successful bidders were mainly the former communist
nomenclature, who had enriched themselves under the communist regime.
The starting price at the public auctions was set at one-half of the book value. The
first wave was only open to domestic investors. Foreign investors were only allowed to
participate in the second wave. The average final price as a percent of the average starting
price reached 149%. Only 28% of the items represented full privatization. In 72% of
cases the winners acquired equipment, inventory and received the right to rent the unit for
a fixed term.36 The program was successfully finished at the end of 1993. The small scale
privatization proceeded faster than restitution as litigation was avoided. In short, small
scale privatization was fast and successful because it created revenue and maximized it
during the bidding process at the auctions.
3. Large Scale Privatization
Large scale privatization has been accomplished through several privatization
techniques. Small size enterprises were auctioned or sold through public tenders. Medium
size enterprises were sold in public tender or through direct sales. The largest enterprises
were sold through the voucher method. In the first stage of large scale privatization, the
medium and the large size enterprises were transformed into joint stock companies with a
given number of shares in an important part of the economy. The government in reality
did not attempt to restructure enterprises before privatization and did not ask for
submissions of such proposals, as it was aware that it would delay privatization.
However, interested buyers could submit their restructuring proposals. The approved
restructuring proposals mainly concerned the break up of the large firms into smaller
units. The second stage covered the sale or transfer of shares of joint stock companies to
the public or another entities through auctions.37
35 John S. Earle, Roman Frydman, Andrzej Rapaczynski and Joel Turkewitz, “Eastern European
Experience with Small Scale Privatization.” CFS: Discussion Paper, No. 104. New York: The World Bank, 1999, p. 16.
36 Ibid., p. 17. 37 Nemat Shafik, “Making a Market: Mass Privatization in the Czech and Slovak Republics,”
Washington D.C.: The World Bank, Policy Research Paper No. 1231, 1993, p. 5.

17
Estrin pointed out the limitations of mass privatization. The first limitation is the
issue and transfer of coupons or certificates. The second limitation is exchanging them
for shares. The third limitation is about trading them. The voucher privatization method
allows for the fast transfer of ownership in the absence of owners capable of purchasing
state assets. Estrin positively assessed the activities of the central authorities, who
maintained relatively effective control over state owned firms in the former
Czechoslovakia, and allowed firms to break up to a significant degree prior to
privatization. 38
The goal of the mass privatization program was the distribution of a large part of
the state’s assets almost for free to the public in the form of vouchers and the quick
transformation of property rights. A combination of techniques was implemented in the
mass privatization process such as a coupon scheme, direct sale, joint ventures,
restitution, the transformation of cooperatives and the transfer to municipalities.
C. VOUCHER PRIVATIZATION
Švejnar proposed a method to the Czechoslovak government based on the
distribution of state assets for free to eligible citizens through several investment funds
instituted and administrated by the state. After the transfer of state assets to the
investment funds the shares are distributed equally to all citizens. Each citizen could
obtain an equa l share in a larger number of privatized enterprises. Švejnar’s double
portfolio decentralization method offers less risk, more equal distribution of property, but
does not initiate the progress of a secondary capital market and sparks the interest of
citizens in the stock market.39
On the one hand, the savings of the Czech population were not enough to procure
firms at their actual price. On the other hand, the sale of the crucial part of state assets to
foreign investors was not considered desirable.40 Thus, the solution was the distribution
of the crucial part of the state’s assets almost for free. The idea was to lure the population
38 Saul Estrin, “Privatization in Central and Eastern Europe,” Centre for Economic Reform and
Transformation, London, 1996, September 1, 2001, Available [Online]: <http://www.hw.ac.uk/ecoWWW/cert/wpa/1996/dp9605.pdf>, pp. 1-37.
39 Oldrich Kyn, “Market with Vouchers and Investment Funds,” Prague: CERGE, 1992, February 19, 2002, Available [Online]: <http://econc10.bu.edu/okyn/Okpers/Vouchers/vouchers1.htm >, p. 4.
40 Ibid., p. 3.
18
into becoming direct owners of property, gain their support for the transition, and create
political and economic stability. The idea was to persuade the population that everybody
had the same opportunity, that participation was voluntary and that everyone was in the
same position at the beginning of the process.
1. The Voucher Privatization Process
Voucher privatization, an unt raditional form of privatization, began in October
1991. The political reasoning behind a quick mass privatization was to cut the ties
between firms and the state and rapidly create private property owners. It was designed to
transform state owned assets into private hands in a relatively short time period of time
between 1992 and 1995. Voucher privatization was accomplished in two stages.
In each stage, citizens older than 18 were entitled to purchase one book of
coupons for 1000 CZK, an average one-week salary, with 1,000 investment points.
Whoever acquired a voucher book and registered it at one of the 648 registration
centers41 had an opportunity during each stage to purchase shares of state firms that were
at the same time transformed into joint stock firms.
Kyn pointed out that the quality of the firms privatized by coupons was on the
average lower than those privatized by direct sale.42 The government’s intention was to
use the revenue from the purchase of voucher books to cover the administrative expenses
of running the voucher method. On the other hand, the government decided to keep the
majority of shares in large or strategic corporations. The shares of these firms were sold
during the privatization process to well-known foreign corporations such as VW, Philip
Morris, Procter & Gamble and General Motors. In direct sales, potential buyers had to
demonstrate long term commitment.43 Various restrictions hindered the entry of foreign
investors due to the awareness of the cheap sale off of attractive state assets.
41 Nemat Shafik, Making a Market: Mass Privatization in the Czech and Slovak Republics, Washington D.C.: The World Bank, Policy Research Paper No. 1231, 1993, p. 12.
42 Oldrich Kyn, “Market with Vouchers and Investment Funds,” Prague: CERGE, 1992, February 19, 2002, Available [Online]: <http://econc10.bu.edu/okyn/Okpers/Vouchers/vouchers1.htm >, p. 7.
43 Carol Graham, “Voucher Privatization in the Czech Republic,” Private Markets for Public Goods: Raising the Stakes in Economic Reform (Washington, D. C: Brooking Institution Press, 1998), p. 219.

19
2. The Privatization Projects
The start of the coupon method required that all projects be ready at the same
time. Therefore, the government spent a considerable amount of its time at the beginning
on project processing for voucher privatization.44 The Ministry of Privatization assigned
priorities to the projects and had the authority to make decisions except in the case of
direct sales that required the approval of the republics or the Federal cabinet. On average,
the number of submitted projects reached 3.8 per firm. A total of 18,106 privatization
projects were submitted during the first wave.45
Privatized firms had to submit privatization proposals describing assets and
liabilities as well as the optimal means of privatization to the Ministry of Privatization.
There was no preference for those either inside or outside of the privatized firms, but
insiders had better access to privileged information. There were often several projects
because any competing legal entity, domestic or foreign, had an opportunity to submit a
privatization project using a standard format. Public participation was encouraged.
Proposed projects could encompass one or a combination of permissible privatization
methods such as direct sales to domestic or foreign entities, sealed bids, public auction,
vouchers and restitution. There were 23,607 buyout proposals for 4,338 firms offered
during the two waves from upper and middle management, local governments and
consulting firms.46 However, the project review was flawed. The review of projects that
participated in the coupon scheme did not have strict selection criteria.47
3. The First Wave of Voucher Privatization
In 1991, approximately 6,000 enterprises were taken into consideration for
voucher privatization in Czechoslovakia. 4,400 were in the Czech Republic and 1,600 in
the Slovak Republic. The government committed at least 300 billion CZK of the state’s
assets in the first wave that was accomplished in 1992. Firms privatized in
44 Nemat Shafik, “Making a Market: Mass Privatization in the Czech and Slovak Republics,”
Washington D.C.: The World Bank, Policy Research Paper No. 1231, 1993, p. 4. 45 Ibid., p. 32. 46 Carol Graham, “Voucher Privatization in the Czech Republic,” Private Markets for Public Goods:
Raising the Stakes in Economic Reform (Washington, D. C: Brooking Institution Press, 1998), p. 223. 47 Nemat Shafik, “Making a Market: Mass Privatization in the Czech and Slovak Republics,”
Washington D.C.: The World Bank, Policy Research Paper No. 1231, 1993, p. 5.
20
Czechoslovakia in the first wave were more profitable and their number reached 3,100.
The number of participants reached 8.65 million. 48
The first wave began in 1992. It was slow in the beginning49 but 28 year old
Victor Kožený, a Harvard educated entrepreneur, come up with an aggressive marketing
campaign one month before the auctions. His Harvard Investment Fund attracted more
than 800,000 citizens. Investment funds attracted the attention of people who were
undecided and did not believe in the success of the voucher privatization system by
promising them a quick return on their investments. In May 1992, more than 8 million
people had bought voucher books.
a. Dedicated Assets
The government allocated 299,4 billion CZK of the state’s assets for the
first wave of voucher privatization which was accomplished during the period March
1992 to January 1993. The number of firms privatized in Czechoslovakia either entirely
or partially through the voucher method reached 1,49150. They were more profitable than
those included in the second wave. Firms privatized only by the voucher method had to
allocate three percent of their shares towards restitution claims.
The majority of shares were available to citizens and small portions were
dedicated to the National Property Fund, restitution, investors, municipalities and banks.
The majority of privatized assets based on the book value were from banking, insurance
and from industries such as electric power, iron and steel, metallurgy, chemicals, pulp
and paper, and clothing. 51 The voucher privatization was the main form of privatization
of large state firms. However, the strategic corporations were excluded from privatization
48 Jan Švejnar and Miroslav Singer, “Using Vouchers to Privatize an Economy: the Czech and Slovak
Case,” Economics of Transition, Volume 2 (I), 1994, p. 44. 49 Graham pointed out that in early 1992 only 25% of eligible citizens wanted to participate. Carol
Graham, “Voucher Privatization in the Czech Republic,” Private Markets for Public Goods: Raising the Stakes in Economic Reform (Brooking Institution Press, Washington, D.C., 1998), p. 217.
50 Shafik pointed out that of 1491 privatized firms, 943 were from the Czech Republic with a book value of 206,4 billion CZK, 487 from the Slovak Republic with a book value of 90.1 billion CZK and 61 operated as federal firms with a book value of 2.9 billion. See Nemat Shafik, “Making a Market: Mass Privatization in the Czech and Slovak Republics,” Washington D.C.: The World Bank, Policy Research Paper No. 1231, 1993, p. 7.
51 Ibid., p. 7. Shafik stated that the total portion of shares dedicated in the Czech Republic to citizens was 84 %, to the National Property Fund 7.2%, to domestic investors 3.8%, to foreign investors 1.6%, to banks 1.5%, to municipalities 1.2% and for restitution 0.2%.
21
or were partially privatized. A large portfolio of those corporations was deposited in the
National Property Fund.
b. Participation
The government’s goal was to sale 4-5 million coupon books. The initial
public response to the government’s campaign was significantly lower or around 2
million citizens. The marketing campaigns launched by the Investment Privatization
Funds that were promising several times higher returns on investment 52 rapidly increased
the number of participants. As the number of registered people increased, the estimated
average value of the property per voucher book gradually declined from 150,000 CZK to
35,000. The number of voucher holders in the first wave reached 8.54 million out of 10.5
million eligible citizens or 75% of the citizens entitled to register.53
c. Role of IPFs
Prior to the start of bidding54, coupon book owners had an opportunity to
allocate some or all the coupons to one or more of the 434 IPFs. Approximately 72% of
all points were placed into IPFs during the first wave. The thirteen largest IPFs gained
56% of all points invested in IPFs. After bidding, 66% of all shares were in IPFs.55
Laštovicka pointed out that a large number of IPFs would not survive or that some would
go bankrupt because only a small number of points were collected.56 Regulations
required that all funds had to invest at least in 10 firms. Anderson pointed out that larger
funds invested in 100 or 200 enterprises.57 The strategy of one of the largest funds, the
Harvard Investment Funds, during bidding was to concentrate roughly on 50 firms and to
52 Marikova stressed that Harvard Capital and Consulting was promising to buy back shares at a ten-fold increase from the original investment (10,350CZK). Eva Marikova, “Voucher Privatization in Czechoslovakia,” Comparative Economic Studies, Flushing: Fall 1993; Leeds, p. 5.
53 Nemat Shafik, “Making a Market: Mass Privatization in the Czech and Slovak Republics,” Washington D.C.: The World Bank, Policy Research Paper No. 1231, 1993, pp. 12-13.
54 An electronic trading system with many terminals, the RM -System, was used for the bidding of shares.
55 Evžen Kocenda, “The Current State of the Czech Privatization,” [19 February 2002], Available [Online]: <http://www.mpo.cz/gc/0003/page0012.htm>, p. 2.
56 Radek Laštovicka, “Investment Behavior in the Czech Voucher Privatization,” Prague: CERGE, August 1993, p. 8.
22
significantly influence these companies. Others IPFs invested in a wider range of firms.
The small and medium IPFs focused on smaller firms in the hope of having control over
management.58 The most important feature of IPFs is that they help concentrate
ownership and could better monitor and control the management of privatized companies
since they are more educated and informed.59
d. Participation in Bidding
In both waves, the coupons were used for bidding on state enterprises,
which entered into the particular wave of coupon privatization. Each wave consisted of
five bidding rounds. The participation of voucher holders in each of the five bidding
rounds was high (92%, 88%, 93%, 88.5%, and 90.3%).60 Participants could use the
remaining coupons to play a game in the bidding process and convert coupons into
shares. Investment points were allocated in multiples of one hundred. Bidders were able
to diversify their portfolio only to some extent, as there was only a multiple of 200 points
to a corporation. The most alluring shares for bidders were foreign trade, banking and
insurance firms with a profit/equity ratio four to seven times higher than the average
profit/equity ratio which was 17.6 in 1991.61
e. Bidding Information and Behavior
Two kinds of bidding information were available to bidders. First, the
initial publication and information about bidding was published by the Center for Coupon
57 Anderson examines 27 regulations that have been proposed for funds in transitional countries,
which should encourage funds to play a significant role in corporate governance. He stresses the importance of regulations that requires them to disclose information about the funds’ operations so the shareholders could control fund managers. Robert E. Anderson, “Voucher Funds in Transitional Economies: The Czech and Slovak Experience, Washington D.C.: The World Bank, Policy Research Working Paper No. 1324, 1994, p. 6.
58 Nemat Shafik, “Making a Market: Mass Privatization in the Czech and Slovak Republics, Washington D.C.: The World Bank, Policy Research Paper No. 1231, 1993, p. 17.
59 Radek Laštovicka, “Investment Behavior in the Czech Voucher Privatization,” Prague: CERGE, August 1993, p. 6.
60 Jan Švejnar and Miroslav Singer, “Using Vouchers to Privatize an Economy: The Czech and Slovak Case,” Economics of Transition, Volume 2 (I), 1994, p. 46.
61 Nemat Shafik, “Making a Market: Mass Privatization in the Czech and Slovak Republics,” Washington D.C.: The World Bank, Policy Research Paper No. 1231, 1993, pp. 8-9.
23
Privatization62 on May 13, 1992 as a guide for placing their coupons and public
information in newspapers. The Center warned bidders about data quality and its
relevance due to the rapidly changing economic environment. The second source was
private information about the firms and funds. Shafik demonstrated empirical evidence
that in the first two rounds of bidding, public information about a firm’s past performance
was important since private information about firms was not revealed. The most
significant factors for price determination in the bidding process were size, capital
concentration, location and participation of foreign investors. Even using the best fitting
regression analysis, he was not able to explain more than 29% price variation across
firms. He assumes that unofficial sources of information and prior knowledge about the
firm’s performance should explain the remaining differences that played a diminishing
role as bidders learned bidding techniques from others.63 Laštovicka showed evidence
that in the first wave individual investors preferred cheaper firms. In contrast, investment
funds invested mostly in middle price companies. On average, funds paid more for their
portfolio and more than individual investors did.64
f. Bidding Pricing System
Bidding rounds placed value on the firms by allowing bidders to interact.
A pricing mechanism was created by a committee in the Federal Ministry of Finance to
adjust the values of auctioned shares to the revealed ratios of supply and demand. The
pricing rules for bidding, adopted by the Price Committee of the Federal Ministry of
Finance, were aimed at transferring coupons for shares as soon as possible. In the case of
excess demand for shares by less than 25% of individual citizens, demand was satisfied
and the demand for investment funds was reduced to clear the market at a given price.
When demand exceeded more than 25%, all shares were offered again in the next bidding
62 Ibid., p. 6. Shafik pointed out that this guidance included the following information about privatized
firms: name, address, business activity, identification number, shares offered, book value, value of other enterprise assets, debts, output in 1989-91, book profit in 1989-91, number of employees in 1989-91. In addition, it included the allocation of non-coupon shares (foreign investors, domestic investors, restitution, National Property Fund, state, or sale of shares). The ratio of assets offered for coupon privatization across the Czech and Slovak Republics was 2.29:1 and corresponded to the ratio of voucher holders in both republics.
63 Nemat Shafik, “Information and Price Determination under Mass Privatization,” Washington D.C.: The World Bank, Policy Research Working Paper No. 1305, 1994, p. 20.
64 Radek Laštovicka, “Investment Behavior in the Czech Voucher Privatization,” Prague: CERGE, August 1993, p. 11.
24
round at a higher price. The refore, prices were adjusted according to the degree of excess
demand. A discriminatory pricing system was used to accelerate the bidding process at
the expense of equity. 65
g. Bidding Behavior
The bidding behavior was interesting. The Czech citizens placed 99% of
their vouchers in Czech enterprises and the Slovak citizens placed 90% of their shares in
Slovak firms.66 In the first rounds, bidders focused on high quality companies. In the
third round there was a massive shift to low price firms due to an excess of shares. IPFs
bid more aggressively in the first round. In contrast, individuals who focused on large and
well known firms with foreign participation demonstrated the same tendency in later
rounds when they were more informed. IPFs participation rates were higher and more
successful than were individual participants. Better organization and information could
explain this tendency. The small and medium IPFs focused more on smaller enterprises.67
h. Bidding Outcomes
Five bidding rounds took place from March 1 to December 22, 1992.
Švejnar summarized the success of the bidding in the five rounds (30%, 25.9%, 10.8%,
12.4% and 13.7%). The first two rounds succeeded by selling almost 56% of the shares.
At the end, 7.2% of the shares (62.5 million), 3.5% of the private coupons and 0.3% IPF
vouchers were unsold.68 The IPFs were able to acquire 66% of the book value offered in
the first wave of coupon privatization. 69 Only 251 enterprises out of 1491 were fully sold
out.70 Shares that were not allocated in the bidding process were transferred to the
National Property Fund.71 Shares acquired after the end of the first wave were not able to
65 Nemat Shafik, “Making a Market: Mass Privatization in the Czech and Slovak Republics, Washington D.C.: The World Bank, Policy Research Paper No. 1231, 1993, pp. 14-15.
66 Jan Švejnar and Miroslav Singer, “Using Vouchers to Privatize an Economy: The Czech and Slovak Case,” Economics of Transition, Volume 2 (I), 1994, p. 55.
67 Nemat Shafik, “Making a Market: Mass Privatization in the Czech and Slovak Republics, Washington D.C.: The World Bank, Policy Research Paper No. 1231, 1993, pp. 12, 15-17.
68 Jan Švejnar and Miroslav Singer, “Using Vouchers to Privatize an Economy: The Czech and Slovak case,” Economics of Transition, Volume 2 (I), 1994, p. 46.
69 Nemat Shafik, “Making a Market: Mass Privatization in the Czech and Slovak Republics,” Washington D.C.: The World Bank, Policy Research Paper No. 1231, 1993, p. 16.
70 Eva Marikova, “Voucher Privatization in Czechoslovakia,” Comparative Economic Studies, Flushing: Fall 1993; Leeds, p. 6.
71 Nemat Shafik, “Making a Market: Mass Privatization in the Czech and Slovak Republics, Washington D.C.: The World Bank, Policy Research Paper No. 1231, 1993, p. 14.
25
be traded in the primary market, where the initial distribution of shares would occur, but
in the secondary market. The new ownership structure of privatized firms was more
consolidated than expected in the beginning. An average privatized firm was owned by
three investment funds.72
i. The Voucher Book Value
As number of registered people increased, the estimated average value of
the property per voucher book gradually declined from 130,000 CZK to 30,000.73 The
media proclaimed that the range of outcomes was broad. The average accounting value of
assets per book in the first wave was 35,000.74 Kyn estimates that the “risk free”
expected present value of an average voucher book is 28,600 CZK. After including risk
he concludes that the market value of the voucher books is only 14,000 CZK.75
4. The Second Wave of Voucher Privatization
The second wave was launched in 1994 after Czechoslovakia became the newly
created Czech Republic. The number of voucher holders in the second wave reached 80%
(6.16 million) of eligible citizens entitled to register. It was 75% in the first wave. The
average accounting book value of assets decreased from 35,535 to 25,160 CZK.76 The
total book value allocated for the second wave decreased by almost one quarter from 201
billion to 155 billion CZK. The number of privatized firms declined from 943 to 867.
The number of investment funds competing for coupons increased from 264
during the first wave to 353. In contrast, the percentage of shares allocated to IPFs
decreased from 72.5% to 64%.77 The second wave encompassed 165 firms that had
auctioned shares in the first wave. Firms included in the second wave were mainly larger,
but offered a smaller portion of shares for auction because the government decided to
72 Ibid., p. 23. 73 Oldrich Kyn, “Market with Vouchers and Investment Funds,” Prague, CERGE, 1992, February 19,
2002, Available [Online]: < http://econc10.bu.edu/okyn/Okpers/Vouchers/vouchers2.htm >, p .1. 74 Jan Švejnar and Miroslav Singer, “Using Vouchers to Privatize an Economy: The Czech and Slovak
case,” Economics of Transition, Volume 2 (I), 1994, p. 44. 75 Oldrich Kyn, “Market with Vouchers and Investment Funds,” Prague, CERGE, 1992, February 19,
2002, Available [Online]: < http://econc10.bu.edu/okyn/Okpers/Vouchers/vouchers2.htm>, p. 1. 76 Evžen Kocenda, “The Current State of the Czech Privatization,” [19 February 2002], Available
[Online]: <http://www.mpo.cz/gc/0003/page0012.htm>, p. 1. 77 Roland Egerer, “Capital Markets, Financial Intermediaries, and Corporate Governance: An
Empirical Assessment of the Top Ten Voucher Funds in the Czech Republic,” New York: The World Bank, Policy Research Paper No. 1555, 1995, p. 3.
26
maintain control in strategic companies. In 32 firms, which were mainly water- line firms,
the majority of assets were transferred for free to municipalities.78 The second wave
started in early 1994 and was successfully completed in March 1995.
5. The Investment Privatization Funds (IPF)
Privately sponsored investment privatization funds79 were established mainly by
domestic, but also by foreign institutions, companies and private individuals. The Federal
Parliaments Act number 248, which regulated the performance of the investment funds
and corporations, was passed after the IPFs had started operations. The intention of the
parliament was to reduce the risk for citizens investing in IPFs. The law determined the
reporting requirements and disclosure rules of operations by IPFs and limited their fees to
an initial fee of 2% and a 3% fee for assets management.80
By law, IPFs were not allowed to buy more than 20% of the shares of an
individual company. The shares of an individual company could not exceed 10% of the
total value of assets of one IPF. IPFs established by the same founder could not buy more
than 20% of the shares of an individual company. Shares of a single company could not
exceed more than 20% of the total assets of all funds established by the same person.
“Limits on fund ownership of about 20% do not seem to greatly impair the ability of
funds to govern enterprises”. 81
The Harvard Investment Funds (HIF) issued guarantees for 10,000 CZK, which
indicates that it was not exposed to great risks. In contrast, IPFs issuing higher guarantees
could easily get into difficulties in fulfilling their commitments since the estimated
market value of a voucher book was 15,000 CZK.82 Some funds made unrealistic
promises to the new shareholders and appointed inadequately qualified members to
78 Carol Graham, “Voucher Privatization in the Czech Republic,” Private Markets for Public Goods:
Raising the Stakes in Economic Reform (Washington, D. C.: Brooking Institution Press, 1998), p. 217. 79 The investment privatization funds are voucher funds in which members contribute vouchers. 80 Nemat Shafik, “Making a Market: Mass Privatization in the Czech and Slovak Republics,
Washington D.C.: The World Bank, Policy Research Paper No. 1231, 1993, p. 13. 81 Robert E. Anderson, “Voucher Funds in Transitional Economies, The Czech and Slovak
Experience,” Washington D.C.: The World Bank, Policy Research Working Paper No. 1324, 1994. p. 42. 82 Oldrich Kyn, Market with Vouchers and Investment Funds, Prague, CERGE, 1992, February 19,
2002, Available [Online]: <http://econc10.bu.edu/okyn/Okpers/Vouchers/vouchers2.htm>. p. 8.

27
management boards. They mainly bought shares in companies that had a higher price but
also a greater earning potential. 83
Prior to the start of the bidding, coupon book owners had an opportunity to
allocate some or all coupons to one or more of the 429 registered IPFs, 264 in the Czech
Republic and 165 in the Slovak Republic.84 Those who allocated coupons in the IPFs
received shares in the funds in exchange and became fund shareholders. The IPFs used
accumulated vouchers to bid for shares in enterprises in the bidding process. At the end
of the bidding, they received shares in the former state owned enterprises that were
transferred into private hands. Funds became owners of the newly privatized funds after
share distribution in April 1993.
The largest IPFs85 had been established by domestic financial institutions such as
Ceská Sporitelna, Komercní Banka, Investicni Banka, Živnostenská Banka and Ceská
Pojištovna, and one by Creditanstalt, which is a foreign financial institution and three by
the private agents of HCC, PPF and YSE. The largest and most popular IPFs were run by
commercial and saving banks, and insurance companies, which had credibility and
reputations. In the first wave, the IPFs attracted many participants. The Czech Savings
Bank acquired 6.9% of the shares, the Czech Commercial Bank 2.9%, and the Slovak
Commercial Bank 2.6%. The ten largest IPFs controlled 23.6% of all the shares.86 Kyn
warned that a large increase in the sale of shares in certain IPFs could unleash a
snowballing effect and could lead to the collapse of such funds.87 On the other hand, it
could lead to the further concentration of ownership in some companies. Foreign as well
as domestic capital could create additional demand for shares.
83 Robert E. Anderson, “Voucher Funds in Transitional Economies, The Czech and Slovak
Experience,” Washington D.C.: The World Bank, Policy Research Working Paper No. 1324, 1994. p. 7. 84 Ibid., p. 18. 85 Shafik defined the size of an IPF as small (shares less than 100,000), medium (shares greater than
100,000 and less than 1,000,000) and large (shares greater than 1,000,000). Nemat Shafik, “Making a Market: Mass Privatization in the Czech and Slovak Republics,” Washington D.C.: The World Bank, Policy Research Paper No. 1231, 1993, p. 54.
86 Ibid., p. 16. 87 Oldrich Kyn, “Market with Vouchers and Investment Funds,” Prague, CERGE, 1992, February 19,
2002, Available [Online]: <http://econc10.bu.edu/okyn/Okpers/Vouchers/vouchers5.htm>, p. 2.

28
THIS PAGE INTENTIONALLY LEFT BLANK
29
III. PRIVATIZATION IN HUNGARY AND POLAND
This chapter explores the privatization methods implemented in Hungary and
Poland dur ing the transition from a command economy to a free market economy. Both
countries chose a moderate pace of reforms, but their approach to privatization differed in
terms of the implemented methods and in the speed of privatization. Poland was very
slow to privatize its state-owned enterprises.
A. PRIVATIZATION IN HUNGARY
This section reveals the speed of privatization and privatization methods used by
the Hungarian government. Privatization in Hungary occurred in three stages. In the first
stage (1990-1994), the state sold enterprises that were easy to sell and encouraged
employee and management buyouts. During the second stage (1995-1997), privatization
was accelerated by the sale of the large strategic firms such as energy suppliers, banks
and strategic firms to strategic investors. In the third stage (from 1997), the government
sold its minority stakes and used capital market methods of privatization. 88
1. The Speed of Privatization
The starting conditions for Hungary were more favorable than those for the Czech
Republic. When the communist regime collapsed, state ownership in the competitive
sector accounted for 85%89 of the GDP while the private sector was generating 20% of
the GDP due to previous reforms initiated in the 1980’s. In 1989, the state owned
approximately 1,832-2200 large and about 10,000 smaller enterprises valued at
approximately HUF 2,000 billion ($30 billion).90
The Hungarian post-communist government’s privatization policy emphasized:
(a) economic efficiency, (b) commercial privatization and involvement of larger
investors, (c) sale to foreign investors, (d) gradual privatization, and (e) transparency and
88 A paper by the State Audit Office, “Privatization in Hungary 1990-2000,” Budapest: The State Audit Office, Hungary, Presented to INTOSAI Working Group, June 11-12, 2001, Available [Online], <http://www.nao.gov.uk/intosai/wgap/8thmeeting/8thhungary2.htm>, p .48.
89 Eva Voszka, “Privatization in Hungary: Results and Open Issues,” Economic Reform Today: Privatization in the Digital Age, No.2, 1999, Available [Online], <http://www.cipe.org/ert/e32/e32_03.php3>.
90 Michael S. Borish and Michael Noel, “Private Sector Development during Transition: The Visegrad Countries,” Washington D.C.: The World Bank, Discussion Paper No. 318, February 1996, p. 66.
30
accountability. The target set by the government was to privatize 50% of state assets by
1994.91
Two institutions managed the privatization program in Hungary. The State
Property Agency (SPA) established in 1990 managed the privatization of small and
medium size enterprises. The State Holding Company (SHC) established in 1992
managed the transfer of larger enterprises into private hands. In 1995, the SPA and SHC
merged into the Hungarian Privatization and State Holding Company.
The privatization process started at a slow pace in the second quarter of 1990. The
first privatization program was launched by the SPA in September 1990 and involved 20
successful companies. However, it was a failure.92 The Hungarian privatization processes
started to accelerate in the summer of 1994 when the government decided to make the
sale of state assets a higher priority. The government, led by Gyula Horn, introduced a
new strategy for privatization: (a) acceleration of privatization, (b) sale of assets rather
than distributive methods, (c) increasing the role of enterprise management, (d)
encourage private firms to manage state-owned enterprises.93
In 1994, Hungary generated only $300 million from privatization that was only
20% of the target set.94 Privatization accelerated dramatically in 1995 when details of the
privatization program were resolved and many public utility enterprises were sold. In
May 1995, Parliament implemented a law for greater control of privatization transactions.
The implemented law lacked clarity and even contradicted a number of points. The
strategic sectors were not prioritized. The goal was at least to partially retain ownership
91 Anna Canning and Paul Hare, “Political Economy of Privatization in Hungary: A Progress Report,”
Centre for Economic Reform and Transformation, Edinburgh: Heriot-Watt University, September 1996, p. 6.
92 The State Property Agency (SPA), which was under government’s supervision, was established in 1990 to act on behalf of the state, as owner and supervisor in transactions.
93 Anna Canning and Paul Hare, “Political Economy of Privatization in Hungary: A Progress Report,” Centre for Economic Reform and Transformation, Edinburgh: Heriot-Watt University, September 1996, p. 10.
94 Michael S. Borish and Michael Noel, “Private Sector Development during Transition: The Visegrad Countries,” Washington D.C.: The World Bank, Discussion Paper No. 318, February 1996, p. 75.
31
and keep a majority of the shares in the strategic sector. In contrast, the Parliament
decided to sell 50% of its stake in the power generating and distributing sector.95
By mid 1995, 1460 privatization transactions had been completed mainly through
open tender. It involved the liquidation of 536 larger enterprises and the privatization of
924. The value of involved assets reached $10 billion and generated a profit of $3.5
billion. The value of the state’s share held in 740 enterprises accounted for HUF 1.500
billion ($10.5 billion).96 The state held a majority of the stakes in 441 enterprises. Among
them, 24 were considered strategic with a value of HUF 1,007 billion. 97
At the end of year 1995, the book value of privatized state owned enterprises
peaked and HUF 481 billion state-owned assets were transferred to private owners. It was
more than the sum of the previous five years. The cash revenue totaled HUF 438 billion.
Only 12 completely state owned companies remained, but there were several hundred
with majority and minority state ownership. About 60% of the banking sector was in
private hands. In some sectors, the state’s share was even higher. Trade was 90%,
construction and textiles 75%, and the paper industry 60%.98 The new governments set a
new target to privatize about half of the state equity holdings valued at HUF 700 billion
($5 billion) by the end of 1997.99
At the end of 1997, the bulk of state property had been privatized and the private
sector generated 75% of the GDP. The largest 200 state companies accounted for more
than one third of the country's production and half of its profits.100 At the end of June
1998 only 228 companies belonged to the Hungarian Privatization and State Holding
Company. Less than 100 strategic enterprises would remain in state ownership. The
95 Eva Voszka, “Privatization in Hungary: Results and Open Issues,” Economic Reform Today: Privatization in the Digital Age, No. 2, 1999, Available [Online], <http://www.cipe.org/ert/e32/e32_03.php3>,p. 1.
96 Michael S. Borish and Michael Noel, “Private Sector Development during Transition: The Visegrad Countries,” Washington D.C.: The World Bank, Discussion Paper No. 318, February 1996, pp. 66, 74.
97 Ibid., p. 83. 98 Eva Voszka, “Privatization in Hungary: Results and Open Issues,” Economic Reform Today:
Privatization in the Digital Age, No. 2, 1999, Available [Online], <http://www.cipe.org/ert/e32/e32_03.php3>, p. 1.
99 Michael S. Borish and Michael Noel, “Private Sector Development during Transition: The Visegrad Countries,” Washington D.C.: The World Bank, Discussion Paper No. 318, February 1996, p. 67.
100 Eva Voszka, “Privatization in Hungary: Results and Open Issues,” Economic Reform Today: Privatization in the Digital Age, No. 2, 1999, Available [Online], http://www.cipe.org/ert/e32/e32_03.php3>, p. 1.
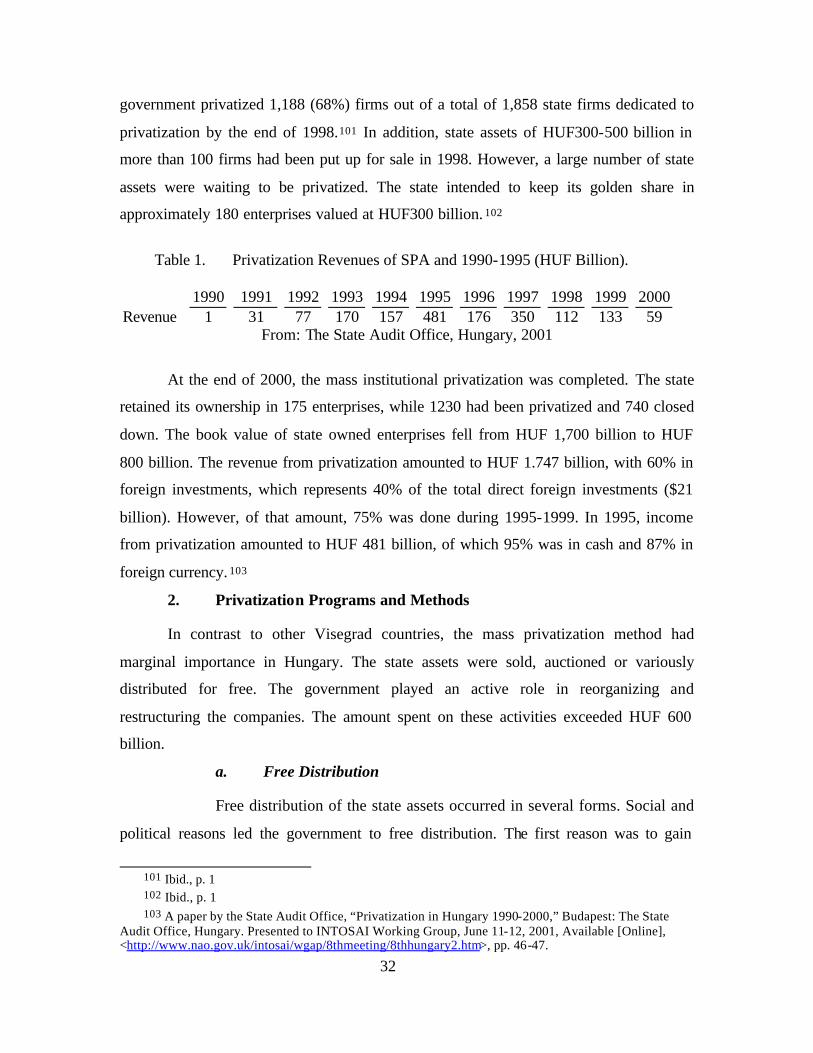
32
government privatized 1,188 (68%) firms out of a total of 1,858 state firms dedicated to
privatization by the end of 1998.101 In addition, state assets of HUF300-500 billion in
more than 100 firms had been put up for sale in 1998. However, a large number of state
assets were waiting to be privatized. The state intended to keep its golden share in
approximately 180 enterprises valued at HUF300 billion. 102
Table 1. Privatization Revenues of SPA and 1990-1995 (HUF Billion).
1990 1991 1992 1993 1994 1995 1996 1997 1998 1999 2000
Revenue 1 31 77 170 157 481 176 350 112 133 59 From: The State Audit Office, Hungary, 2001
At the end of 2000, the mass institutional privatization was completed. The state
retained its ownership in 175 enterprises, while 1230 had been privatized and 740 closed
down. The book value of state owned enterprises fell from HUF 1,700 billion to HUF
800 billion. The revenue from privatization amounted to HUF 1.747 billion, with 60% in
foreign investments, which represents 40% of the total direct foreign investments ($21
billion). However, of that amount, 75% was done during 1995-1999. In 1995, income
from privatization amounted to HUF 481 billion, of which 95% was in cash and 87% in
foreign currency. 103
2. Privatization Programs and Methods
In contrast to other Visegrad countries, the mass privatization method had
marginal importance in Hungary. The state assets were sold, auctioned or variously
distributed for free. The government played an active role in reorganizing and
restructuring the companies. The amount spent on these activities exceeded HUF 600
billion.
a. Free Distribution
Free distribution of the state assets occurred in several forms. Social and
political reasons led the government to free distribution. The first reason was to gain
101 Ibid., p. 1 102 Ibid., p. 1 103 A paper by the State Audit Office, “Privatization in Hungary 1990-2000,” Budapest: The State
Audit Office, Hungary. Presented to INTOSAI Working Group, June 11-12, 2001, Available [Online], <http://www.nao.gov.uk/intosai/wgap/8thmeeting/8thhungary2.htm>, pp. 46-47.
33
political support for reforms. The second reason was to create a broad middle class. Free
distribution occurred through: (a) restitution, (b) transfer of property rights, (c)
compensation notes, and (d) the Small Investor Share Program.
Restitution was the prevalent method used for free distribution. Restitution
occurred in the form of a compensation scheme. About $650 million in notes were issued
to purchase loans, apartments, or shares in properties owned by SPA, AVU or SHC.104
The state freely transferred a part of state assets to churches, local governments, social
security funds and certain groups of individuals. Compensation notes valued at HUF 220
billion were distributed to two million citizens whose property was deprived or whose
human rights had been violated. This method proceeded slowly and was not completed
by the spring of 1999. The unsuccessful Small Investor Share Program that started in
1994 was a project similar to the Czech voucher coupon system. This method offered all
Hungarian citizens an opportunity to become company owners. However, the new
government, elected in 1994, decided to stop this program, because it was contrary to its
privatization strategy. 105
b. Spontaneous Privatization
The first privatization method known as spontaneous privatization lasted
from 1988 until the establishment of the SPA in March 1990. This method led to the
commercialization of enterprises. However, the state retained its majority ownership in
the newly formed enterprises. The spontaneous privatization consisted of two forms.
First, large enterprises divided themselves into smaller companies. The restructured
enterprise took some of its assets into a new joint venture with an external partner, mainly
a foreign company. The main goal was to segregate profitable and non-profitable units
and give the more profitable units a chance to survive and find new partners. Second, the
large restructuring holding companies formed new companies from their factories and
other assets, often with the involvement of foreign partners. The holding companies kept
majority stakes in the newly formed enterprises.
104 Michael S. Borish and Michael Noel, “Private Sector Development during Transition: The
Visegrad Countries,” Washington D.C.: The World Bank, Discussion Paper No. 318, February 1996, p. 67. 105 Eva Voszka, “Privatization in Hungary: Results and Open Issues,” Economic Reform Today:
Privatization in the Digital Age, No. 2, 1999, Available [Online], <http://www.cipe.org/ert/e32/e32_03.php3>.
34
This method boosted the formation of a large number of new companies
but lacked state supervision and its scope was small. Often the state assets were sold or
transferred below their market value. Spontaneous privatization attracted only a slow
inflow of foreign capital. The majority of enterprises using this method failed because
they were not able to attract an inflow of capital and enter new markets. The estimated
value of assets transferred from the state to newly formed companies is HUF100
billion. 106
c. First Privatization Program
The first privatization program was launched by the SPA in September
1990. The program attempted to implement privatization methods and procedures used in
western countries and gain experience. This program involved 20 successful larger
companies from all sectors of the economy. The value of assets devoted to this program
accounted for HUF 70 billion. The foreign consultants estimated that the revenue from
privatization would reach HUF 30-40 billion.
This program was a failure due to the slow pace of privatization
procedures, considerable decline in the market value of company assets and the changing
economic environment. Only ten out of twenty firms were restructured at the end of
1991. Six firms involved in this program went into liquidation. Eventually, only ten
enterprises were privatized with a revenue of HUF 22 billion. 107
d. Small Scale Privatization (Pre-Privatization)
The so-called small privatization was the main avenue for privatizing the
retail and trade sectors. The small privatization program, which involved retail and
catering, and service sectors started in the spring of 1990. The government chose a
gradual approach to privatization with an emphasis on insiders and the privatization of
entire enterprises. The small scale privatization program was designed to privatize
approximately 9,800 small-scale enterprises, nearly US $200 million in assets, during
106 A paper by the State Audit Office, “Privatization in Hungary 1990-2000,” Budapest: The State
Audit Office, Hungary. Presented to INTOSAI Working Group, June 11-12, 2001, Available [Online], <http://www.nao.gov.uk/intosai/wgap/8thmeeting/8thhungary2.htm>, p. 23.
107Ibid., p. 25.
35
1990-1994.108 A number of programs were designed for particular segments. Only a
small portion of enterprises has been transferred to private owners. The majority of small
enterprises were grouped into integrated commercial entities before privatization.
Although over 10,300 small units have been privatized through a
Preprivatization Program109, over 12,00 units remained in state hands. More than 70% of
the transfers involved leases for a ten-year period. Auctions and negotiated sales were the
preferred methods of sale.110 By mid 1999, the revenue from small scale privatization
amounted to HUF 20.1 billion. 111 The pace of small scale privatization was slower than
in the Czech Republic or in Poland. The long delays were caused by legal disputes
regarding land registration and leasehold rights.
e. The Self-Privatization
The self-privatization program for small to medium firms initiated by the
SPA in 1991 occurred in two stages. In the first stage, the selected companies were
transformed into commercial corporations. The SPA reserved for itself legal control, but
delegated rights and responsibilities for selling state assets to private consulting firms,
which conducted the enterprise evaluation and created the transformation and
privatization plans. The consultants were motivated by compensation depending on the
pace of privatization and price. In addition, the SPA encouraged enterprise management
participation. As a result, most enterprises covered by the program were sold. The second
stage of self-privatization incorporated the sale of shares.
The first phase started in September 1991 with 83 small enterprises.112
The criteria for the selection of enterprises were: (a) the number of employees had to be
108 Michael S. Borish and Michael Noel, “Private Sector Development during Transition: The Visegrad Countries,” Washington D.C.: The World Bank, Discussion Paper No. 318, February 1996, p. 67.
109 The SAP ran the Preprivatization Program designed to maintain governmental control over privatization and to generate revenue. This program involved more than 30% of the state establishments or about 10,000-15,000 units. See John S. Earle, Roman Frydman, Andrzej Rapaczynski and Joel Turkewitz, “Eastern European Experience with Small-Scale Privatization,” New York: The World Bank, Cofinancing and Financial Advisory Services (CFS), CFS Discussion paper No. 104, April 1994, pp. 46-47.
110 Ibid., pp. 1-6. 111 A paper by the State Audit Office, “Privatization in Hungary 1990-2000,” Budapest: The State
Audit Office, Hungary. Presented to INTOSAI working group, June 11-12, 2001, Available [Online], <http://www.nao.gov.uk/intosai/wgap/8thmeeting/8thhungary2.htm>, p. 27.
112 Eva Voszka, “Privatization in Hungary: Results and Open Issues,” Economic Reform Today: Privatization in the Digital Age, No. 2, 1999, Available [Online], <http://www.cipe.org/ert/e32/e32_03.php3>.
36
less than 300, (b) turnover had to be less than HUF 100 million, and (c) the value of
equity had to be less than HUF 300 million. In total, this phase involved 457 firms.113
The second phase that began in August 1992 involved larger firms with
less than 1,000 employees, with a value less than HUF1 billion, and with an annual
turnover under HUF1 billion. 114 In total, this phase involved 292 enterprises.115
The self-privatization program ended in March 1994. Out of 478
transformed enterprises, 412 enterprises were sold. Domestic investors purchased two
thirds of the sold enterprises through E-credit or compensation vouchers.116
f. The Simplified Privatization
The State Privatization and Holding Company (SPHC) launched the
simplified privatization scheme in May 1995. SPHC exercised greater bureaucratic
authority over privatization transactions and emphasized the case-by-case evaluation.117
The simplified privatization scheme was designed for small and medium size business
establishments with fewer than 500 employees and assets less than HUF600 million. The
senior management of privatized enterprises mainly managed the privatization process
and recommended the sale price. Mainly, domestic investors succeeded in privatizing 37
firms by the end of 1995. In the meantime, 34 enterprises failed to do so. The
privatization of the next group of 48 enterprises was launched in March 1996.118
In total, the simplified privatization included 138 enterprises. The
privatization revenue from 90 sold enterprises amounted to HUF 6.2 billion. The limited
price was the main weakness of this program that was concluded in 1997.
113 A paper by the State Audit Office, “Privatization in Hungary 1990-2000,” Budapest: The State
Audit Office, Hungary. Presented to INTOSAI Working Group, June 11-12, 2001, Available [Online], <http://www.nao.gov.uk/intosai/wgap/8thmeeting/8thhungary2.htm>, p. 28.
114 John S. Earle, Roman Frydman, Andrzej Rapaczynski and Joel Turkewitz, “Eastern European Experience with Small-Scale Privatization,” New York: The World Bank, Cofinancing and Financial Advisory Services (CFS), CFS Discussion Paper No. 104, April 1994, pp. 54-56.
115 A paper by the State Audit Office, “Privatization in Hungary 1990-2000,” Budapest: The State Audit Office, Hungary. Presented to INTOSAI Working Group, June 11-12, 2001, Available [Online], <http://www.nao.gov.uk/intosai/wgap/8thmeeting/8thhungary2.htm>, p. 28.
116 Ibid., p. 28. 117 Anna Canning and Paul Hare, “Political Economy of Privatization in Hungary: A Progress
Report,” Centre for Economic Reform and Transformation, Edinburgh: Heriot-Watt University, September 1996, pp. 11-12.
118 Ibid., pp. 33-34.
37
g. Liquidation
When the transition began, a large number of state owned enterprises were
close to bankruptcy. In Hungary, more than 400 state firms were closed down. The loss
of equity due to liquidation reached 40-50%.119 Liquidation and asset stripping had been
common procedures in Hungary. Banks often filed claims to liquidate enterprises failing
to repay. “Asset stripping has frequently occurred, reflecting weaknesses in the legal
framework that have undermined the effectiveness of bankruptcy and liquidation
procedures.”120 By mid 1995 approximately 536 enterprises had been liquidated.121 This
number increased to 740 by the end of 2000.122
h. Preferential Privatization by Management and Employee
The goal of preferential privatization was to develop a middle class and
entrepreneurs. In many sectors, domestic buyers had an opportunity to purchase state
property. Since they lacked resources, the government supported the establishment of
several schemes: (a) E-credit, (b) Employee share scheme, (c) Small Investors' Share
Purchase Program, and (d) Privatization leasing.
Domestic private individuals had an opportunity to acquire an E-credit at
an interest rate of 7% for up to 15 years to purchase shares, land or state property. E-
credit contributed to employee and management buyouts in more than 400 transactions
valued at HF 68.15 billion between 1990 and 2000.
In 1992, the Hungarian government made employee share ownership of 5-
10 % of the company’s stock a higher priority. Employees of all firms had the
opportunity to purchase shares in their own firms on preferential terms other than E-
credit up to 10% of the assets, even if the firm was sold to outside investors. The
119 A paper by the State Audit Office, “Privatization in Hungary 1990-2000,” Budapest: The State
Audit Office, Hungary. Presented to INTOSAI Working Group, June 11-12, 2001, Available [Online], <http://www.nao.gov.uk/intosai/wgap/8thmeeting/8thhungary2.htm>, pp. 11-12.
120 Michael S. Borish and Michael Noel, “Private Sector Development during Transition: The Visegrad Countries,” Washington D.C.: The World Bank, Discussion Paper No. 318, February 1996, p. 65.
121 Ibid., p. 66. 122 A paper by the State Audit Office, “Privatization in Hungary 1990-2000,” Budapest: The State
Audit Office, Hungary. Presented to INTOSAI Working Group, June 11-12, 2001, Available [Online], <http://www.nao.gov.uk/intosai/wgap/8thmeeting/8thhungary2.htm>, p. 46.
38
employee share program was subsidized by the state. The terms were a 10-year credit
with an interest rate of 7% and a two-year repayment plan. The receipts under this
scheme were valued at HUF 70.4 billion. The less preferred privatization leasing scheme
has been used only in 27 cases valued at HUF 6 billion.
B. PRIVATIZATION IN POLAND
1. The Speed of Privatization
The start of privatization was more favorable for Poland than for the Czech
Republic. The private sector in Poland had strong roots. In 1989 in Poland, around 56%
of the total retail trade, consumer and service sector were private.123
The Polish political representatives favored gradual privatization. The political
forces were not opened to a rapid and broad privatization. In addition, parliamentary
decisions and government policies influenced the pace of privatization. ”Many politicians
still fail to grasp the importance of privatization for the whole economy and the
consequences of its delay.”124
The gradual pace of privatization was positive for many enterprises, but it had
negative consequences for those on the waiting list. The gradual pace of privatization
created conditions that allowed the newly privatized firms to prosper but other firms
suffered. The case-by-case approach to privatization was slow, because the administrative
apparatus was not able to handle the quick transfer of state owned assets into private
hands.
a. Entry into Privatization
At the start of privatization, the state owned a total of 8,441 enterprises.
Based on the statistical data provided by the Polish Ministry of the Treasury, during
1991-2001, privatization transactions began with 5,353 enterprises, or about 63 % of the
total state-owned enterprises at the start of privatization. The number of state-owned
enterprises privatized peaked in 1992 when 819 cases were opened. However, after that
the pace of privatization decreased. In the period since July 1990 to December 1997, the
123 Louisa Vinton, “Privatization in Poland: A Statistical Picture,” Available [Online], <http://ciesin.ci.uw.edu.pl/poland/privatizationintro.html>, p. 1.
124 Barbara Blaszczyk,” Moving Ahead: Privatization in Poland, Economic Reform Today,” Privatization in Digital Age, No.2, 1999, Center for International Private Enterprise (CIPE), <http://www.cipe.org/ert/e32/e32_04.php3>.
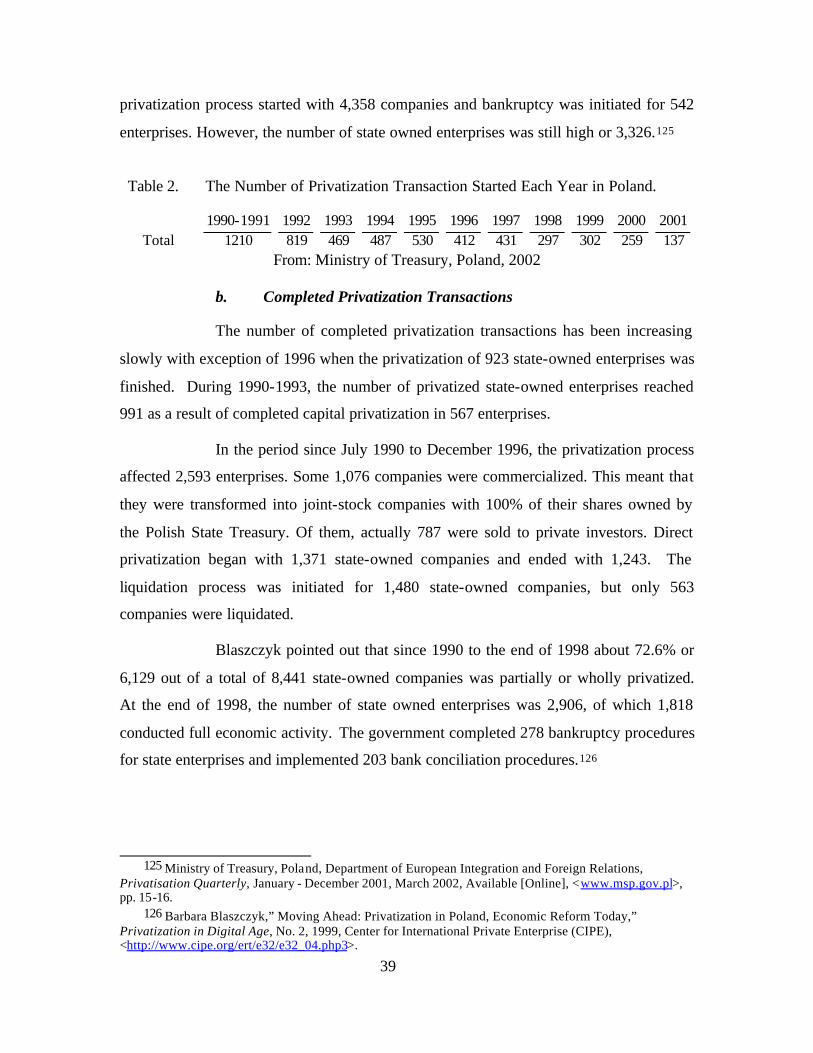
39
privatization process started with 4,358 companies and bankruptcy was initiated for 542
enterprises. However, the number of state owned enterprises was still high or 3,326.125
Table 2. The Number of Privatization Transaction Started Each Year in Poland.
1990-1991 1992 1993 1994 1995 1996 1997 1998 1999 2000 2001
Total 1210 819 469 487 530 412 431 297 302 259 137 From: Ministry of Treasury, Poland, 2002
b. Completed Privatization Transactions
The number of completed privatization transactions has been increasing
slowly with exception of 1996 when the privatization of 923 state-owned enterprises was
finished. During 1990-1993, the number of privatized state-owned enterprises reached
991 as a result of completed capital privatization in 567 enterprises.
In the period since July 1990 to December 1996, the privatization process
affected 2,593 enterprises. Some 1,076 companies were commercialized. This meant that
they were transformed into joint-stock companies with 100% of their shares owned by
the Polish State Treasury. Of them, actually 787 were sold to private investors. Direct
privatization began with 1,371 state-owned companies and ended with 1,243. The
liquidation process was initiated for 1,480 state-owned companies, but only 563
companies were liquidated.
Blaszczyk pointed out that since 1990 to the end of 1998 about 72.6% or
6,129 out of a total of 8,441 state-owned companies was partially or wholly privatized.
At the end of 1998, the number of state owned enterprises was 2,906, of which 1,818
conducted full economic activity. The government completed 278 bankruptcy procedures
for state enterprises and implemented 203 bank conciliation procedures.126
125 Ministry of Treasury, Poland, Department of European Integration and Foreign Relations, Privatisation Quarterly, January - December 2001, March 2002, Available [Online], <www.msp.gov.pl>, pp. 15-16.
126 Barbara Blaszczyk,” Moving Ahead: Privatization in Poland, Economic Reform Today,” Privatization in Digital Age, No. 2, 1999, Center for International Private Enterprise (CIPE), <http://www.cipe.org/ert/e32/e32_04.php3>.
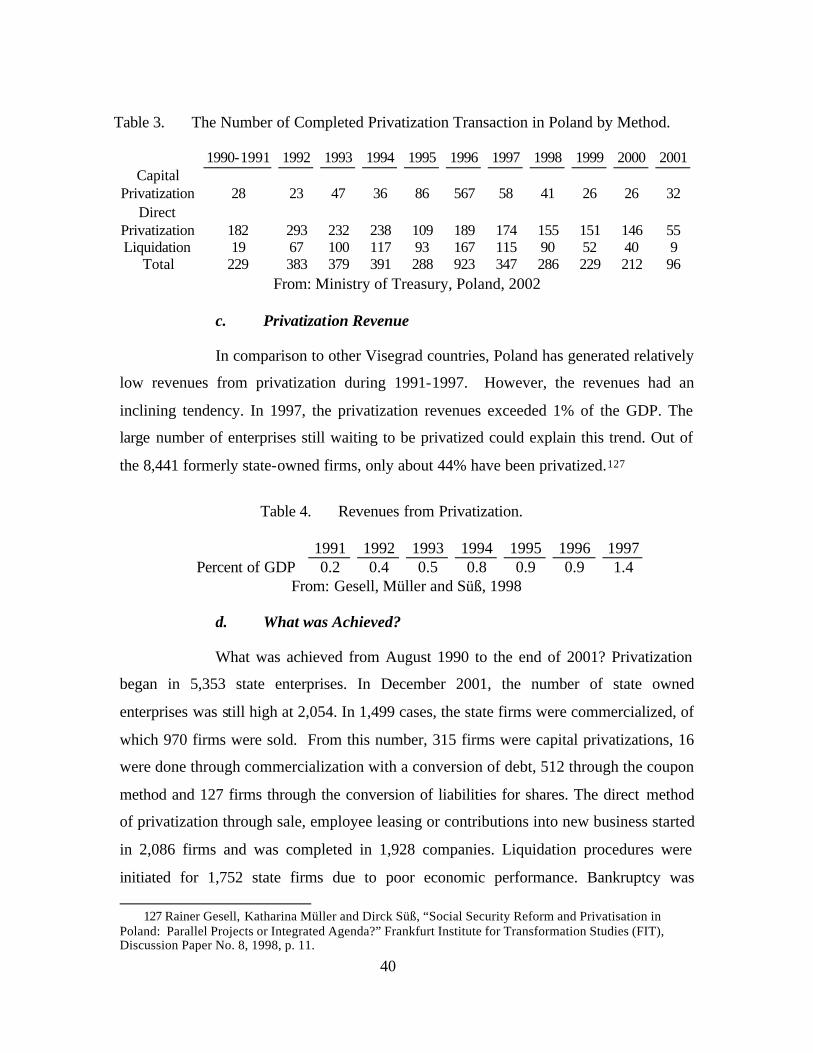
40
Table 3. The Number of Completed Privatization Transaction in Poland by Method.
1990-1991 1992 1993 1994 1995 1996 1997 1998 1999 2000 2001
Capital Privatization 28 23 47 36 86 567 58 41 26 26 32
Direct Privatization 182 293 232 238 109 189 174 155 151 146 55 Liquidation 19 67 100 117 93 167 115 90 52 40 9
Total 229 383 379 391 288 923 347 286 229 212 96 From: Ministry of Treasury, Poland, 2002
c. Privatization Revenue
In comparison to other Visegrad countries, Poland has generated relatively
low revenues from privatization during 1991-1997. However, the revenues had an
inclining tendency. In 1997, the privatization revenues exceeded 1% of the GDP. The
large number of enterprises still waiting to be privatized could explain this trend. Out of
the 8,441 formerly state-owned firms, only about 44% have been privatized.127
Table 4. Revenues from Privatization.
1991 1992 1993 1994 1995 1996 1997
Percent of GDP 0.2 0.4 0.5 0.8 0.9 0.9 1.4 From: Gesell, Müller and Süß, 1998
d. What was Achieved?
What was achieved from August 1990 to the end of 2001? Privatization
began in 5,353 state enterprises. In December 2001, the number of state owned
enterprises was still high at 2,054. In 1,499 cases, the state firms were commercialized, of
which 970 firms were sold. From this number, 315 firms were capital privatizations, 16
were done through commercialization with a conversion of debt, 512 through the coupon
method and 127 firms through the conversion of liabilities for shares. The direct method
of privatization through sale, employee leasing or contributions into new business started
in 2,086 firms and was completed in 1,928 companies. Liquidation procedures were
initiated for 1,752 state firms due to poor economic performance. Bankruptcy was
127 Rainer Gesell, Katharina Müller and Dirck Süß, “Social Security Reform and Privatisation in
Poland: Parallel Projects or Integrated Agenda?” Frankfurt Institute for Transformation Studies (FIT), Discussion Paper No. 8, 1998, p. 11.
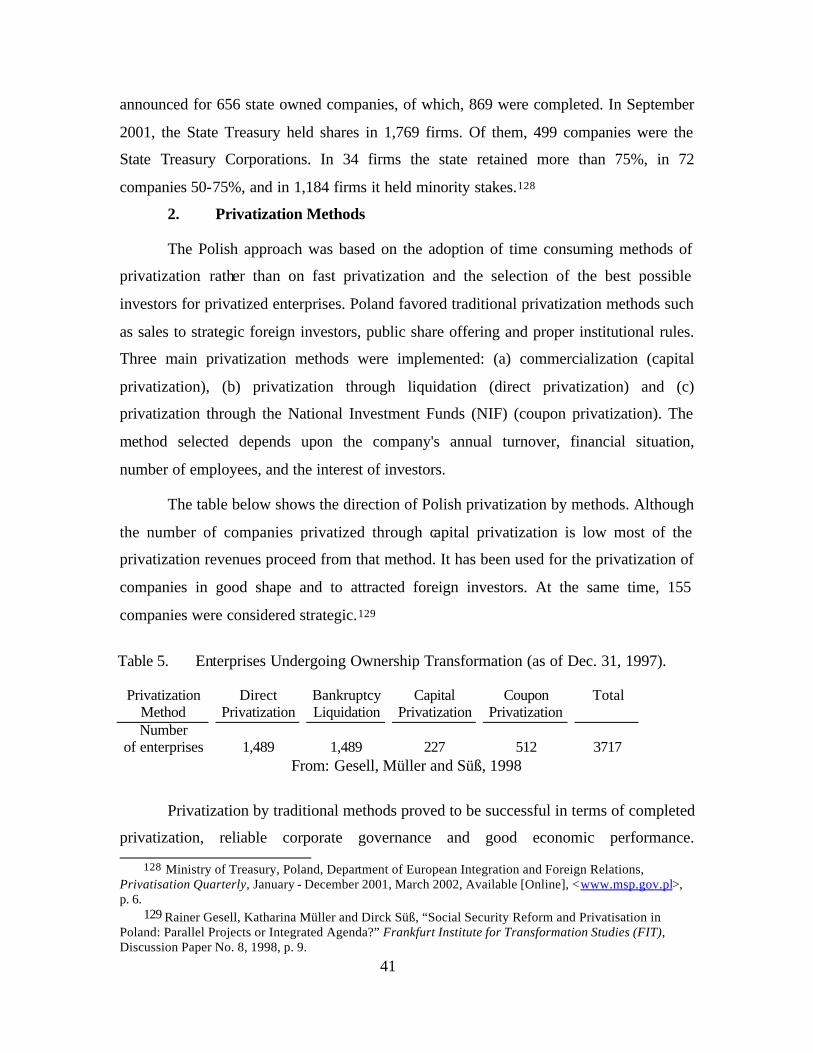
41
announced for 656 state owned companies, of which, 869 were completed. In September
2001, the State Treasury held shares in 1,769 firms. Of them, 499 companies were the
State Treasury Corporations. In 34 firms the state retained more than 75%, in 72
companies 50-75%, and in 1,184 firms it held minority stakes.128
2. Privatization Methods
The Polish approach was based on the adoption of time consuming methods of
privatization rather than on fast privatization and the selection of the best possible
investors for privatized enterprises. Poland favored traditional privatization methods such
as sales to strategic foreign investors, public share offering and proper institutional rules.
Three main privatization methods were implemented: (a) commercialization (capital
privatization), (b) privatization through liquidation (direct privatization) and (c)
privatization through the National Investment Funds (NIF) (coupon privatization). The
method selected depends upon the company's annual turnover, financial situation,
number of employees, and the interest of investors.
The table below shows the direction of Polish privatization by methods. Although
the number of companies privatized through capital privatization is low most of the
privatization revenues proceed from that method. It has been used for the privatization of
companies in good shape and to attracted foreign investors. At the same time, 155
companies were considered strategic.129
Table 5. Enterprises Undergoing Ownership Transformation (as of Dec. 31, 1997).
Privatization Direct Bankruptcy Capital Coupon Total
Method Privatization Liquidation Privatization Privatization Number
of enterprises 1,489 1,489 227 512 3717 From: Gesell, Müller and Süß, 1998
Privatization by traditional methods proved to be successful in terms of completed
privatization, reliable corporate governance and good economic performance.
128 Ministry of Treasury, Poland, Department of European Integration and Foreign Relations, Privatisation Quarterly, January - December 2001, March 2002, Available [Online], <www.msp.gov.pl>, p. 6.
129 Rainer Gesell, Katharina Müller and Dirck Süß, “Social Security Reform and Privatisation in Poland: Parallel Projects or Integrated Agenda?” Frankfurt Institute for Transformation Studies (FIT), Discussion Paper No. 8, 1998, p. 9.

42
Traditionally privatized firms reinvested 10% to 30% of their sales annually. On the other
hand, state-owned firms, and partly privatized firms invested only 1% to 3% of their
sales. The private sector investments in the second half of 1997 reached 53.4% of the
total investments.130
a. Capital Privatization (Commercialization)
In the first phase, the capital privatization involved the transformation of
state firms into state treasury corporations in the form of joint stock or limited liability
firms. In the initial phase, the state fully retains its ownership. In the second phase, the
Treasury shares or stakes are sold through negotiations with potential buyers or persons
other than the Treasury. Privatization is carried out through public offerings, public
tender and negotiations. It was assumed that the Minister of the Treasury would carry out
capital privatization for approximately 90 companies.131
b. Direct Privatization
Direct privatization through liquidation was used for small and medium
size firms in good financial condition. This method allowed employee and management
buyouts. Liquidated firms were permitted to sell assets without passing through a court
insolvency procedure. They were sold, incorporated into another firms or leased to a firm
owned by a majority of the employees. For instance, a state firm is liquidated and its
assets are leased to a company that is created for that purpose. Managers and workers of
the former state enterprise mainly controlled these companies. This method became the
principal method for starting small and medium size enterprises. Direct privatization has
generated little income because it favors insiders. Leasing was applied in about 65% of
the cases by the end of 1997. The leasing rates were set at a level low enough not to
pressure enterprises’ financial capacity and still allow restructuring investment.132
130 Barbara Blaszczyk,” Moving Ahead: Privatization in Poland, Economic Reform Today,” Privatization in Digital Age, No. 2, 1999, Center for International Private Enterprise (CIPE), <http://www.cipe.org/ert/e32/e32_04.php3>.
131 A Review of Poland's Privatization Methods, Central and Eastern Europe Business Information Center (CEEBIC), June 1997, Available [Online], <http://www.mac.doc.gov/eebic/pub/plfp/1197/priv.htm>, p. 1 .
132 Rainer Gesell, Katharina Müller and Dirck Süß, “Social Security Reform and Privatisation in Poland: Parallel Projects or Integrated Agenda?” Frankfurt Institute for Transformation Studies (FIT), Discussion Paper No. 8, 1998, p. 10.
43
c. Coupon Privatization
Only a small part of the Polish economy was privatized by the coupon
privatization method. This method was not designed to speed up privatization but to
reassure Polish citizens that they were the principal beneficiaries of privatization. Coupon
privatization started with the commercialization of 512 large and medium size companies
involved in this program. Then, they were transferred to 15 National Investment Funds
(NIF) designed to sell shares to domestic or foreign investors and establish joint ventures
by NIF. Frequent changes in the government delayed the implementation of coupon
privatization until 1994. NIF share certificates were distributed for free to the public in
1995-96. This method was applied to 10% of the public assets.133 The experience
demonstrated that it is very difficult to settle extensive privatization with the intended
outcome and good corporate governance.
d. Small-Scale Privatization
Poland had to privatize less in so-called small privatization than the
former Czechoslovakia. In contrast with Hungary, the privatization of small
establishments mainly in retail and services in Poland proceeded rapidly. From its start in
1989 up to the end of 1992, about 82% of small units (194,000) were privatized. They
were mainly sold to former employees below their market value.134
e. Complementary Methods of Privatization
There were two complementary methods of privatization in Poland: (a)
privatization through restructuring, and (b) bankruptcy liquidation. Privatization through
restructuring was designed for companies that needed to improve their financial
condition. After successful restructuring, the companies are sold. When using the method
of bankruptcy liquidation method, enterprises were dissolved, assets sold and revenues
used to pay off the enterprises’ debts. This method has not generated any revenue at all.
133 Barbara Blaszczyk,” Moving Ahead: Privatization in Poland, Economic Reform Today,”
Privatization in Digital Age, No. 2, 1999, Center for International Private Enterprise (CIPE), <http://www.cipe.org/ert/e32/e32_04.php3>.
134 John Nellis, “Privatization and Enterprise Reform in Transition Economies: A Retrospective Analysis,” Washington D.C.: The World Bank, 2002, p. 8.

44
THIS PAGE INTENTIONALLY LEFT BLANK

45
IV. COMPARATIVE ANALYSIS
The first part of this chapter provides macroeconomic comparisons of the
Visegrad countries in order to reveal to what extent the pace of privatization and
privatization methods affected macroeconomic development among these countries. The
goal is to determine to what extent the Czech Republic differed from the other Visegrad
countries. All of them had to transform their economies and privatize an enormous part of
state assets into private hands, but their approaches to privatization varied. The pace was
important to the Czech Republic. In contrast, Poland and Hungary favored gradual
transformation.
The second part of this chapter compares the progress in the transition among the
Visegrad countries that have made remarkable progress in the last decade in terms of the
pace and scope of economic transition. First, it compares the progress in price and trade
liberalization. Next, it looks at the progress in privatization. Then, it reveals the extent of
private sector development and employment. Finally, it examines the progress in
privatization and what remains for further privatization.
A. MACROECONOMIC INDICATORS
This section attempts to answer the question of why people were talking about the
Czech miracle. It indicates that important differences exist among the Visegrad countries.
However, it is difficult to examine the link between privatization and its economic
outcomes. The examination of the economic performance of the Visegrad countries
shows some similarities but also significant differences in terms of GDP growth, inflation
and unemployment.
This multi cross-country survey is supported by positive and negative findings. In
1995, the so-called Czech miracle, the economic transformation from a command
economy to a liberal economy with minimum unemployment as seen in Figure 3 and no
hyperinflation as seen in Figure 1, has been seen by many as a new pattern to follow.
Within the last decade, the Czech government outperformed its neighbors in terms of
lower inflation and more balanced current accounts as indicated in Figures 1 and 5. In

46
terms of lower unemployment it was successful up to 1998, but since 1999, the
Hungarian performance has been slightly better as shown in Figure 3.
The next two macroeconomic indicators, the growth rate and foreign direct
investments, have been less favorable for the Czech government. The Polish economy
has grown significantly faster than the economies of its neighbors. From the lowest level
of economic growth, achieved from the start of the transition process to 1998, the GDP in
the Polish economy grew by 42.5% compared to a growth in the GDP in Slovakia of
32.9%, and in Hungary of 16.2%. The Czech performance was the worst among the
Visegrad countries with growth rate of 12.7%.135
During 1991-1997, Hungary received the greatest inflow of direct foreign
investment among the Visegrad countries. However, the inflow of foreign investments
rapidly increased in the Czech Republic in 1998 and in Slovakia in 1999. In contrast,
Poland maintained a moderate growing inflow of investments. This significant change in
the pattern of investments was caused by the increased pace of privatization through
direct sale in the Czech Republic, Slovakia and Poland. In contrast, ending privatization
in Hungary has reduced the flow of direct foreign investments.
The findings disapprove that there was a Czech economic miracle because the
macroeconomic performance of the Czech Republic in the last decade was to some extent
similar to that of other Visegrad countries. The Czech government has had lower inflation
and unemployment but the economic growth and the flow of direct foreign investment
has been less than in some of the other Visegrad countries. Hungary and Poland
performed better on a number of variables in the late 1990s. Industrial restructuring in the
Czech Republic hardly occurred during the last decade and has not reached the previous
levels of 1990.
The Czech Republic’s failure to restructure is particularly striking compared to the steady growth of industrial output in both Poland and Hungary since 1995 (OECD, 1999). These large differences in the pace of industrial restructuring have recently become reflected in GDP growth. In
135 From 1989 to 1998, the GDP of the Polish economy grew by 17%, while the growth of the Slovak
economy remained the same and the GDP of the Czech and Hungarian economies declined by 5%. See Gomulka, Stanislav. “Ten Years in Retrospect: Secrets of Successful macroeconomic Policies,” Transition Newsletter, Washington D.C.: The World Bank/The William Davidson Institute, Vol. 11, No. 5, August-October 2000, p. 18.
47
1998 GDP in the Czech Republic contracted by 3%, in contrast to a 5% expansion in Poland and Hungary. 136
1. Inflation
Shortly after the start of the transition process, inflation increased in the former
Czechoslovakia for a short period of time. In 1990, inflation increased to 10.8% of the
GDP and in the next year inflation in the Czech Republic reached 56.7% of the GDP. The
Slovak Republic followed a similar pattern with a higher inflation rate of 61.2% of the
GDP in 1991. This sharp increase was caused by the implementation of a profound price
liberalization policy, and by currency devaluation. 137 This high rate of inflation led to a
sharp decline of real wages.138 In 1992, inflation significantly decreased to 11.1% in the
Czech Republic and to 10.1% in the Slovak Republic.
The Velvet divorce once caused again an increase in inflation. In the newly
established Czech Republic, the inflation rate reached 20.8% of the GDP, and in the
Slovak Republic 23% of the GDP. During 1994-1998, inflation in the Czech Republic
was quite stable, mainly in the single digits, or 8-10.2% of the GDP. The following year
inflation dropped to 1.8% of the GDP and more than doubled in 2000. In the Slovak
Republic, inflation followed a bathtub curve during 1994-2000. The years 1994 and
2000 saw it at its maximum of 14% and 12.1% of the GDP respectively, and at a
minimum in 1996 of 5.8% of the GDP.
Hungary and Poland when compared to the Czech Republic had higher average
rates of inflation with the one exception of Hungary in 1991. In the last decade, inflation
in Hungary in 1991 reached 34.2% of the GDP. In the following years, inflation dropped
to 19% in 1994. However, in 1995, the inflation rate sharply increased to 28.3% of the
GDP when the Hungarian government introduced some macroeconomic adjustment
measures. Inflation further declined in the years 1996-2000. The year-on-year inflation
rate fell almost by 5% of the GDP yearly despite a 20% increase in the gross average
wages in 1998. At the end of the decade the inflation rate remained stabilized at 10%.
136 Andrew Spicer, Gerry McDermott and Bruce Kogut, “Entrepreneurship and Privatization in Central Europe: The Tenuous Balance Between Destruction and Creation,” A Working Paper of the Reginald H. Jones Center, No. 04, The Wharton School University of Pennsylvania, August 1999, p. 17.
137 In 1990, the currency devaluation reached 113.5%. See a World Bank Country Study, No. 19650, “Czech Republic: Toward EU Accession, Main Report”, Washington, D.C.: The World Bank, 1999, p. 2.
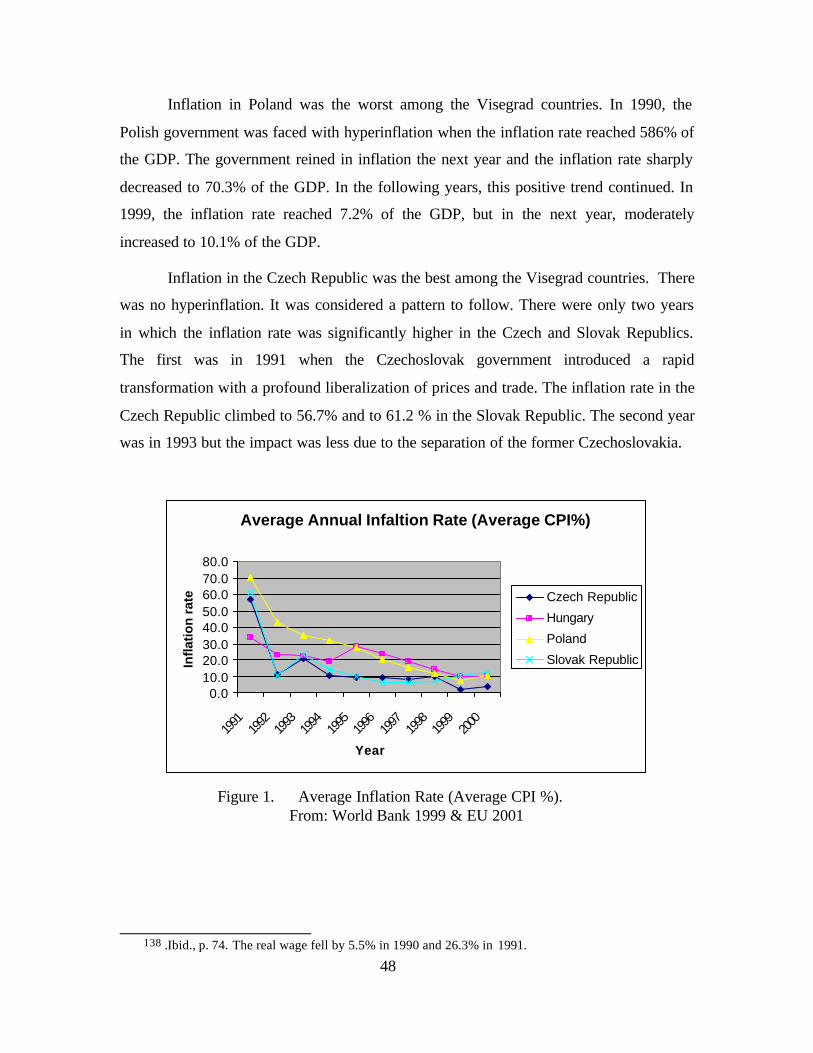
48
Inflation in Poland was the worst among the Visegrad countries. In 1990, the
Polish government was faced with hyperinflation when the inflation rate reached 586% of
the GDP. The government reined in inflation the next year and the inflation rate sharply
decreased to 70.3% of the GDP. In the following years, this positive trend continued. In
1999, the inflation rate reached 7.2% of the GDP, but in the next year, moderately
increased to 10.1% of the GDP.
Inflation in the Czech Republic was the best among the Visegrad countries. There
was no hyperinflation. It was considered a pattern to follow. There were only two years
in which the inflation rate was significantly higher in the Czech and Slovak Republics.
The first was in 1991 when the Czechoslovak government introduced a rapid
transformation with a profound liberalization of prices and trade. The inflation rate in the
Czech Republic climbed to 56.7% and to 61.2 % in the Slovak Republic. The second year
was in 1993 but the impact was less due to the separation of the former Czechoslovakia.
Average Annual Infaltion Rate (Average CPI%)
0.010.020.030.040.050.060.070.080.0
1991
1992
1993
1994
1995
1996
1997
1998
1999
2000
Year
Infl
atio
n r
ate Czech Republic
Hungary
Poland
Slovak Republic
Figure 1. Average Inflation Rate (Average CPI %).
From: World Bank 1999 & EU 2001
138 .Ibid., p. 74. The real wage fell by 5.5% in 1990 and 26.3% in 1991.
49
The extensive stabilization program implemented by the government during the
early years of the transition process led to this success.139 In 1995, when everybody was
talking about “the Czech miracle”, the Czech Republic had the lowest inflation rate
among the transition countries. However, problems appeared soon afterwards. Due to the
first post communist recession and growing inflation in early 1998, the Czech Central
Bank (CNB) introduced a monetary policy targeting inflation. The target for 1998 was in
the range of 5.5-6.5%. The strict monetary policy, declining domestic demand and
commodity prices helped push inflation down sharply from 9.7 to 1.8%. After a sharp
decline in inflation, the CNB aggressively tried to reduce the interest rate.140 As a result
of this strict monetary policy, inflation fell to an average rate of only 1.8% in 1999.
However, the inflation rate more than doubled in the following year mostly due to an
increase in commodity prices.
2. Economic Growth
The economic growth of all the Visegrad countries after the fall of communism
was negative. Among them, only Poland was able to improve the negative growth rate in
1992. Since then Poland has maintained the highest economic growth rate. Two years
later the other countries were also able to reach and maintain a positive growth rate.
However, the Czech Republic was not able to sustain positive economic growth and in
1998 was again in the red.
The introduction of transition reforms in 1991 culminated in an economic decline
in the former Czechoslovakia. In the Czech Republic, GDP growth reached -14.2 % and
in the Slovak Republic -14.6%. The economy began to recover during the next two years,
but still remained in the red. In 1993, after the separation, the economic growth was -
0.5% in the Czech Republic and -4.1% in Slovakia. The economic situation improved in
1994, when an increase in exports due to more a competitive exchange rate caused the
139 Ibid., pp. 2-3. The stabilization program included a basket-pegged exchange rate, tight fiscal
policy and wage discipline. 140 Ibid., pp. 11-12. Inflation targeting is “a monetary policy characterized by the public
announcement of official inflation rate targets over a specific time horizon. The ultimate goal of inflation targeting is to reduce inflation uncertainty. Inflation uncertainty is costly. It exacerbates the volatility of relative prices and increases the risk of financial instruments and contracts set in nominal terms. By making explicit the central bank's medium-term policy intentions, inflation targets reduce volatility in financial markets, improve planning in the private sector, enhance the public debate about the direction of the monetary policy, and increase the accountability of the central bank.”
50
GDP to grow at a rate of 2.7% in 1994 and 5% in 1995. The recovery in growth was
simultaneously accompanied by: (a) a decline in unemployment which dropped below
3% by the end of 1995, (b) significant accomplishments in privatization, (c) a decline in
the inflation rate to below 10%, (d) a temperate current account deficit, and (e) balanced
fiscal accounts.141 It seemed that the government overcame the structural reforms.
Therefore, many people considered this to be a transition miracle.
Several reasons caused the so-called miracle to stumble in May 1997. The
economic slowdown caused by: (a) a currency crisis, (b) heavy floods in significant areas
of Moravia, (c) a decline in consumer’s confidence,142 (d) an economic slowdown in
Germany which is the Czech Republic’s largest trading partner, (e) bad financial
management, (f) and an intensified political crisis. The political crisis arouse from the
suspicion of corruption tied to the leading political party (Civic Democratic Party) headed
by Prime Minister Václav Klaus, who was forced by other political parties to resign in
November 1997.143
During 1997-1998, Czech economic performance was a real disappointment. It
was apparent that reforms adopted by the post communist government had been deficient
and unable to maintain sustainable economic growth. 144 The Czech Republic had been
facing its first post-transition recession accompanied by increased unemployment,
unsustainable current account balances, large current deficits and external speculative
attacks on the currency. This unfavorable situation forced the temporary government to
adopt strict fiscal and monetary policies.145 In early 1998, the CNB introduced new
monetary procedures to target inflation.
141 Ibid., pp. 2-3. At the same time most transitional economies had experienced high unemployment
rates around 7 to 15%. 142 Ibid., p. 9. The heavy flooding lowered the output growth by an estimated 0.5 percentage point.
The growth in private consumption fell from 7% in 1996 to 2.1% in 1997. 143 When Václav Klaus resigned, the President Václav Havel had appointed a temporary government,
which governed until a new government had been created from the general election in mid 1998. 144 The economic growth was negative during 1997-1998. The growth rate declined to –0.8% in 1997
and in the next year reached –1.2%. 145 Ibid., p. 95. The international financial community helped to trigger the currency crisis of April-
May 1997.

51
Growth Rate (Percentage of GDP)
-20
-15
-10
-5
0
5
10
1990
1991
1992
1993
1994
1995
1996
1997
1998
1999
2000
Year
Gro
wth
Rat
e (%
)
Czech Republic
Hungary
Poland
Slovak Republic
Figure 2. Real GDP Growth Rate in the Visegrad Countries.
From: World Bank 1999 and EU 1999-2001
The new regular government led by Miloš Zeman struggled with deficit budgets
that had been approved by Parliament for the fiscal years 1999 and 2000.146 In addition,
the new government introduced less restrictive fiscal policies and monetary policies that
helped to improve the process of structural reforms. In the second quarter of 1999, the
Czech economy started to recover when GDP growth resumed. In the next year,
economic growth reached 2.9% of the GDP.147
In the early years of reforms, Slovakia followed a path very similar to the
neighboring countries surrounding the Czech Republic. In 1993, the Slovak economy was
very slowly recovering from transition reforms that had been adopted. Its growth was -
4.9%. The next year, the growth rate outperformed the Czech growth rate and reached
4.8%. The growth rate in Slovakia in 1995 culminated in 7% and remained quite stable
for the next two years at 6.2%. In 1998, it declined to 4.1% and the following years
stabilized around 2%.
146 Ibid., p. 15. The Czech Parliament approved the state budget for 1999 with a deficit of 2% in the
GDP to avoid the buildup of hidden liabilities. 147 This recovery was driven by external demand mainly from the EU and private consumption. See a
“Regular Report on the Czech Republic’s Progress Toward Accession: 2000,” Commission of the European Communities, November 8, 2000, Available [Online], <http://europa.eu.int/comm/enlargement/czech/>, p. 28.
52
All Visegrad countries experienced a deep recession in the early stages of their
transition. Denizer pointed out that the cumulative output in the Visegrad countries
declined approximately by 20% between 1989 and 1994.148 This recession originated
primarily from: (a) the collapse of the Council of Mutual Economic Assistance (CMEA)
and its trade arrangements, (b) price and trade liberalization, and (c) reductions in
subsidies. The Czech and Slovak Republic as well as Hungary began to recover from the
early recession in 1993-94. In contrast, Poland experienced the best growth rate. Since
1992, the economic growth in Poland has remained positive up to the end of the last
decade as a result of advancing reforms. Its growth rate culminated in 7% of the GDP in
1995. Afterwards, economic growth slowed but still remained higher than 4% of the
GDP.
The Hungarian economy had been recovering longer. Since 1994, its growth rate
fluctuated between 4-5% with the exception of 1996 when it experienced a growth rate of
1.3% of the GDP. While the other Visegrad economies were able to consolidate their
recovery in the following years, Hungary experienced a sharp slowdown. During 1995-
1996, Hungary had the poorest macroeconomic performance among the Visegrad
countries with the highest rates of inflation and the lowest rates of output growth. 149 This
slowdown was caused by the adjustment measures adopted by the Hungarian government
in 1995.
3. Unemployment
The so-called Czech miracle, economic transformation with low unemployment
and inflation, and mass privatization was seen as a transition pattern to follow. The
recovery in growth between 1993-95 was accompanied by a decline in the already low
rate of unemployment that was below 4% as well as by a drop in the inflation rate below
10%. Few skeptics were suspicious as the unemployment rate seemed extremely low
when compared to the other transitional countries and the major banks remained in state
hands and experienced problems with loans. There were doubts about the effectiveness of
148 Cevdet Denizer, “Stabilization, Adjustment and Growth Prospects in Transition Economies,”
World Bank Working Paper No. 1955, Washington D.C.: The World Bank, February 1997, p. 6. 149 A World Bank Country Study, No. 19923, “Hungary on the Road to the European Union,”
Washington D.C.: The World Bank, November 1999, pp. 19-20.
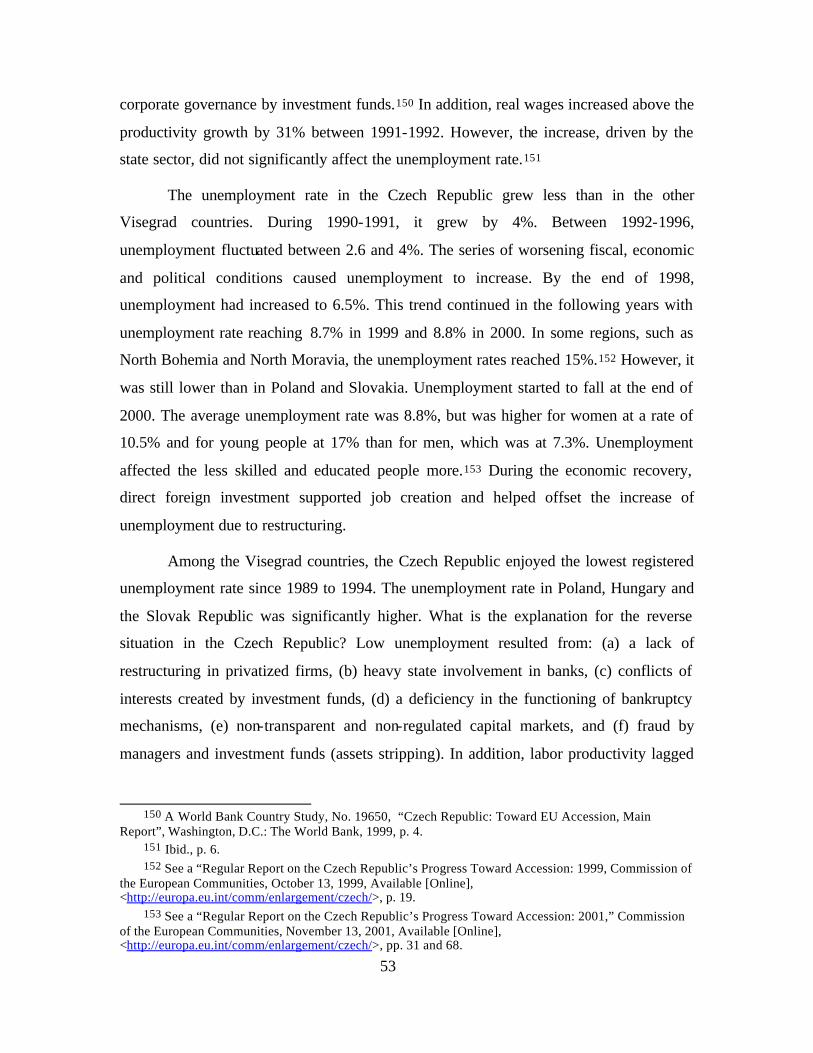
53
corporate governance by investment funds.150 In addition, real wages increased above the
productivity growth by 31% between 1991-1992. However, the increase, driven by the
state sector, did not significantly affect the unemployment rate.151
The unemployment rate in the Czech Republic grew less than in the other
Visegrad countries. During 1990-1991, it grew by 4%. Between 1992-1996,
unemployment fluctuated between 2.6 and 4%. The series of worsening fiscal, economic
and political conditions caused unemployment to increase. By the end of 1998,
unemployment had increased to 6.5%. This trend continued in the following years with
unemployment rate reaching 8.7% in 1999 and 8.8% in 2000. In some regions, such as
North Bohemia and North Moravia, the unemployment rates reached 15%.152 However, it
was still lower than in Poland and Slovakia. Unemployment started to fall at the end of
2000. The average unemployment rate was 8.8%, but was higher for women at a rate of
10.5% and for young people at 17% than for men, which was at 7.3%. Unemployment
affected the less skilled and educated people more.153 During the economic recovery,
direct foreign investment supported job creation and helped offset the increase of
unemployment due to restructuring.
Among the Visegrad countries, the Czech Republic enjoyed the lowest registered
unemployment rate since 1989 to 1994. The unemployment rate in Poland, Hungary and
the Slovak Republic was significantly higher. What is the explanation for the reverse
situation in the Czech Republic? Low unemployment resulted from: (a) a lack of
restructuring in privatized firms, (b) heavy state involvement in banks, (c) conflicts of
interests created by investment funds, (d) a deficiency in the functioning of bankruptcy
mechanisms, (e) non-transparent and non-regulated capital markets, and (f) fraud by
managers and investment funds (assets stripping). In addition, labor productivity lagged
150 A World Bank Country Study, No. 19650, “Czech Republic: Toward EU Accession, Main
Report”, Washington, D.C.: The World Bank, 1999, p. 4. 151 Ibid., p. 6. 152 See a “Regular Report on the Czech Republic’s Progress Toward Accession: 1999, Commission of
the European Communities, October 13, 1999, Available [Online], <http://europa.eu.int/comm/enlargement/czech/>, p. 19.
153 See a “Regular Report on the Czech Republic’s Progress Toward Accession: 2001,” Commission of the European Communities, November 13, 2001, Available [Online], <http://europa.eu.int/comm/enlargement/czech/>, pp. 31 and 68.
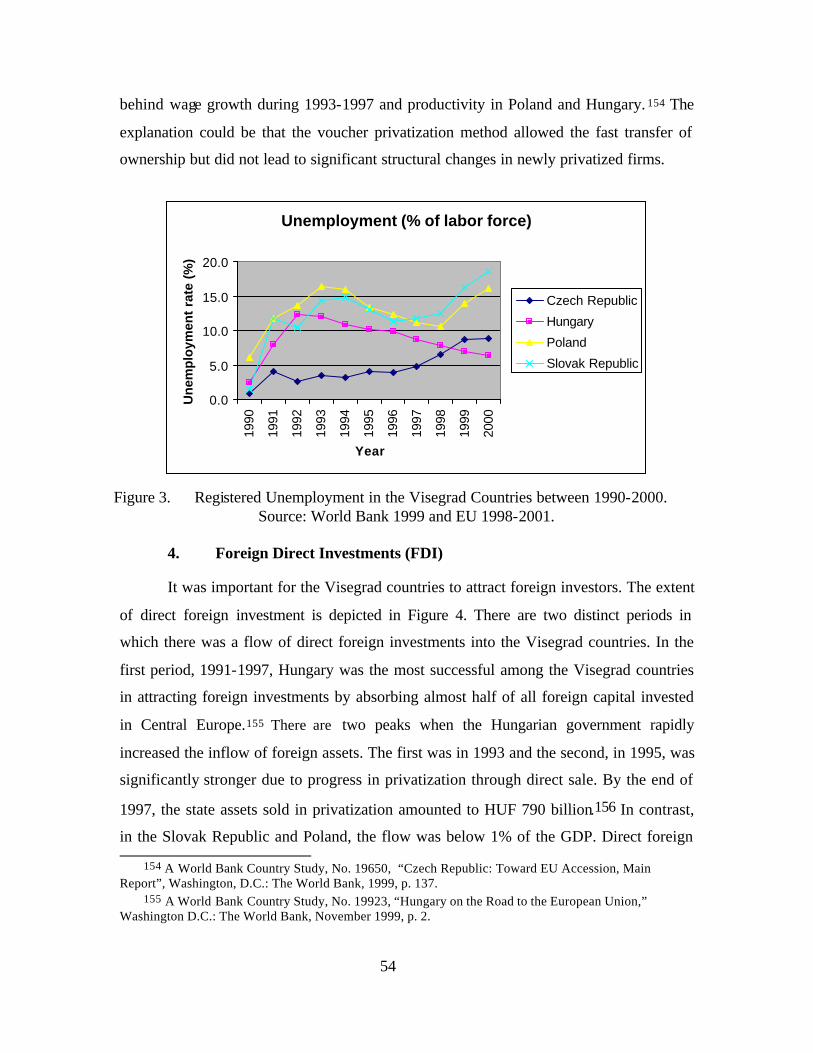
54
behind wage growth during 1993-1997 and productivity in Poland and Hungary. 154 The
explanation could be that the voucher privatization method allowed the fast transfer of
ownership but did not lead to significant structural changes in newly privatized firms.
Unemployment (% of labor force)
0.0
5.0
10.0
15.0
20.019
90
1991
1992
1993
1994
1995
1996
1997
1998
1999
2000
Year
Un
emp
loym
ent
rate
(%
)
Czech Republic
Hungary
Poland
Slovak Republic
Figure 3. Registered Unemployment in the Visegrad Countries between 1990-2000.
Source: World Bank 1999 and EU 1998-2001.
4. Foreign Direct Investments (FDI)
It was important for the Visegrad countries to attract foreign investors. The extent
of direct foreign investment is depicted in Figure 4. There are two distinct periods in
which there was a flow of direct foreign investments into the Visegrad countries. In the
first period, 1991-1997, Hungary was the most successful among the Visegrad countries
in attracting foreign investments by absorbing almost half of all foreign capital invested
in Central Europe.155 There are two peaks when the Hungarian government rapidly
increased the inflow of foreign assets. The first was in 1993 and the second, in 1995, was
significantly stronger due to progress in privatization through direct sale. By the end of
1997, the state assets sold in privatization amounted to HUF 790 billion.156 In contrast,
in the Slovak Republic and Poland, the flow was below 1% of the GDP. Direct foreign
154 A World Bank Country Study, No. 19650, “Czech Republic: Toward EU Accession, Main Report”, Washington, D.C.: The World Bank, 1999, p. 137.
155 A World Bank Country Study, No. 19923, “Hungary on the Road to the European Union,” Washington D.C.: The World Bank, November 1999, p. 2.
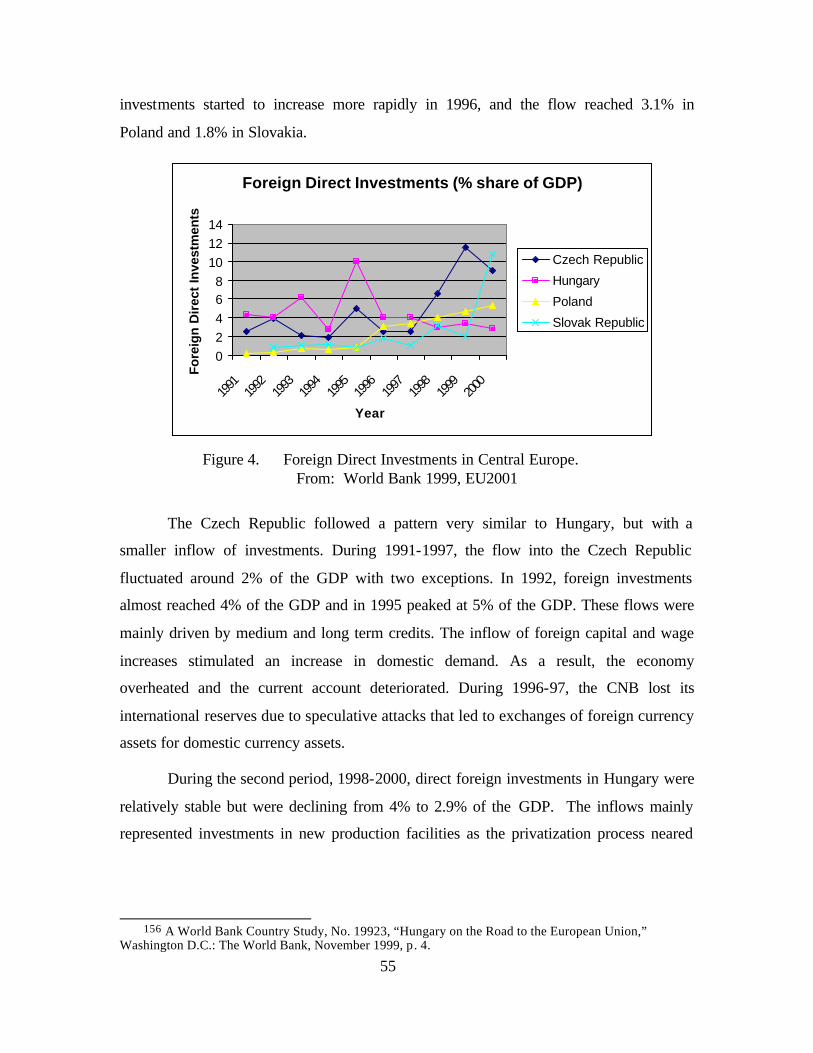
55
investments started to increase more rapidly in 1996, and the flow reached 3.1% in
Poland and 1.8% in Slovakia.
Foreign Direct Investments (% share of GDP)
02468
101214
1991
1992
1993
1994
1995
1996
1997
1998
1999
2000
Year
Fo
reig
n D
irec
t In
vest
men
ts
Czech Republic
Hungary
Poland
Slovak Republic
Figure 4. Foreign Direct Investments in Central Europe.
From: World Bank 1999, EU2001
The Czech Republic followed a pattern very similar to Hungary, but with a
smaller inflow of investments. During 1991-1997, the flow into the Czech Republic
fluctuated around 2% of the GDP with two exceptions. In 1992, foreign investments
almost reached 4% of the GDP and in 1995 peaked at 5% of the GDP. These flows were
mainly driven by medium and long term credits. The inflow of foreign capital and wage
increases stimulated an increase in domestic demand. As a result, the economy
overheated and the current account deteriorated. During 1996-97, the CNB lost its
international reserves due to speculative attacks that led to exchanges of foreign currency
assets for domestic currency assets.
During the second period, 1998-2000, direct foreign investments in Hungary were
relatively stable but were declining from 4% to 2.9% of the GDP. The inflows mainly
represented investments in new production facilities as the privatization process neared
156 A World Bank Country Study, No. 19923, “Hungary on the Road to the European Union,”
Washington D.C.: The World Bank, November 1999, p. 4.
56
completion. Only a very few large enterprises were left for sale.157 At the same time, the
inflow of investment into Poland increased from 4% to 5.3% of the GDP. A large share
of investments was because of privatization. The struggle to complete the current
privatization program also attracted more investments in new production capacities.158
The flow was more moderate in Slovakia but in 2000 the flow climbed to 10.8% of the
GDP ($1.1 billion) due to privatization through the direct sale of firms with strategic
importance such as Slovak Telecom, Slovnaft and VSŽ. 159
Meanwhile, the Czech Republic attracted a significantly higher inflow of
investments than its neighbors. This trend of high inflows was caused by: (a) increased
investment incentives introduced in 1998 and made uniform by law since 2000, (b)
renewed privatization efforts, and (c) the economic recovery. In 1999, the flow peaked at
11.6% of the GDP. The Czech Republic received almost $20 billion of the foreign
investments since 1989, but about one half of these investments were invested during
1999-2000.160 There have been significant investment inflows in the banking sector due
to the privatization of large banks and industrial companies. This trend is expected to
continue in 2001-2002 partly due to renewed privatization efforts that include the direct
sale of the telecommunications and energy companies.
5. Current Account
During 1993-2000 the current account in the Visegrad countries fluctuated
between +5 to –11.2 % of the GDP. Only in the Czech Republic was the current account
positive in 1993. However, in the next year, the current account shifted from a surplus to
a deficit and remained there to the end of the last decade. The level of the deficit
remained moderate to the GDP. It gave the impression that the country had entered a
157 See an EBRD Investment Profile, “Hungary Investment Profile,” London: European Bank for
Research and Development (EBRD), April 2001, Available [Online], <http://www.mac.doc.gov/eebic/countryr/hungary.htm>, p. 6.
158 See an EBRD Investment Profile, “Poland Investment Profile,” London: European Bank for Research and Development (EBRD), April 2001, Available [Online], <http://www.mac.doc.gov/eebic/countryr/poland.htm>, p. 7.
159 See an EBRD Investment Profile, “Slovak Republic Investment Profile,” London: European Bank for Research and Development (EBRD), April 2001, Available [Online], http://www.mac.doc.gov/eebic/countryr/slovakr.htm, p. 6.
160See an EBRD Investment Profile, “Czech Republic Investment Profile,” London: European Bank for Research and Development (EBRD), April 2001, Available [Online], <http://www.mac.doc.gov/eebic/countryr/czechr.htm>, pp. 6-7.

57
sustainable period of high growth. During 1996-1997, the CNB international reserves
decreased due to speculative attacks on the Czech currency. The CNB reacted with a
number of policy options to prevent the overheating of the economy: (a) exchanging
foreign currency assets for domestic assets, (b) restrictions on short-term flows, and (c)
an increase in the exchange rate band.161 However, it was not successful in sustaining the
exchange rate level. The reserve losses were accompanied by an increasing current
account deficit, which peaked in 1996 at 7.4% of the GDP. The lack of credibility in
sustaining the exchange rate led to a boom in consumption. As a result, the exchange rate
regime collapsed.162
Current Account Balance (%of GDP)
-15
-10
-5
0
5
10
1993
1994
1995
1996
1997
1998
1999
2000
Year
Cur
ent
Acc
ount
(%
of
GD
P)
Czech Republic
Hungary
Poland
Slovak Republic
Figure 5. Current Account Balance in the Visegrad Countries.
Source: World Bank 1999, EU 2001
The current account deficit narrowed to 2.4% of the GDP in 1998 as a result of a
prudent monetary policy. The Czech Republic had been facing recession with a decline in
output by 2.3% in 1998 and with glum prospects of economic growth in the next year. In
addition, unemployment had doubled and climbed to over 8% in the first half of 1999.163
In 1999, the current account started to increase again and in the following year the deficit
reached 4.8% of the GDP.
161 A World Bank Country Study, No. 19650, “Czech Republic: Toward EU Accession, Main
Report”, Washington, D.C.: The World Bank, 1999, p. 4. 162 Ibid., p. 19. 163 Ibid., p. 1.
58
The Hungarian economy began to recover from the transition recession in 1993
and 1994. The recovery was accompanied by a significant increase in the external debt
and by a sharp rise in the current account deficit to 9.5%% of the GDP in 1994. The
country suffered from a loss in creditworthiness due to large fiscal imbalances and slow
privatization. In March 1995, the Hungarian government adopted a drastic stabilization
program to avoid a potential crisis in the balance of payments.164 This program has
shown impressive results. Economic growth has accelerated while the current account
deficit and external debt sharply declined. In 1997, the current account deficit declined to
–2.2%. However, in the following year, it more than doubled. During 1999-2000 the
current account recovered slightly.
During 1993-199 the Polish government managed to keep the current account
balance under control. However, during the second half of 1997 the Polish trade and
current account deficits started to increase due to the Russian crisis. Poland’s current
account deficit expanded from –1% in 1996 to –8.1% in 1999. The Polish government
had to undertake fiscal consolidation. Whereas exports increased and foreign direct
investments remained high due to the privatization of large enterprises, an increase in
imports was more robust due to the rapid increase in domestic demand.165
The Slovak Republic had the most fluctuating current account balance among the
Visegrad countries. The separation of the former Czechoslovakia caused a deficit in the
current account balance of 5% of the GDP. The following years saw positive results.
During 1996-1998, the Slovak government was challenged by high current account and
government budget deficits and macroeconomic and structural problems. The
government’s stabilization policies generated the desired results in the following years of
1999-2000. As a result, the trade and current account deficits were brought under control.
164 The stabilization program included: (a) a strong fiscal adjustment, with an initial sharp exchange
rate depreciation, followed by a declining devaluation to control inflation and (b) a wage restraint, with a decline of real wages by 9 and 3% in 1995 and 1996. See A World Bank Country Study, No. 19923, “Hungary on the Road to the European Union,” Washington D.C.; The World Bank, November 1999, p. 4.
165 See a ”Regular Report on Poland’s Progress Toward Accession: 2000,” Co mmission of the European Communities, November 8, 2000, Available [Online], <http://europa.eu.int/comm/enlargement/poland/index.htm>, p. 22.
59
B. INDICATORS OF TRANSITION
At the start of the transition process, the main goal of all Visegrad countries was
stabilization, liberalization, and privatization with a big bang. The pace was important to
shorten the period of social consequences of the transition. All Visegrad countries
managed to liberalize and stabilize their economies before 1993.166 However, the pace
and progress differed. The Czechoslovak rapid strategy of liberalization helped it to catch
up to Poland and Hungary. In 1995, the Czech Republic achieved a moderate advantage
in terms of the progress in liberalization.
The Czech and Slovak Republics started with almost non-existent private sectors.
In contrast, the private sector was more developed in Poland and Hungary. The Czech
Republic’s rapid privatization strategy was a counter-example to the moderate and
evolutionary strategy implemented in Poland and Hungary. The mass privatization
method implemented in the Czech and Slovak Republics was effective in quickly
converting state assets to private hands. The implementation of two waves of
privatization through the voucher method helped the Czech Republic advance faster with
privatization. However, after a quick start, privatization in the Czech Republic faltered
and a large amount of assets remained in state hands. A new wave of rapid progress in
privatization began once again at the end of the last decade. The Czech government
encouraged privatization through the direct sale of state assets. This has helped to bring
privatization closer to an end. However, the evolutionary Hungarian approach showed
that the moderate speed of privatization in Hungary led to faster privatization in the end.
1. Price and Trade Liberalization
All Visegrad countries undertook price and trade liberalization reforms at a
different pace. At the start of privatization, the Czech and Slovak Republics were
significantly behind Hungary and Poland in terms of price liberalization. The experiments
with liberalization in Hungary began in the 1960s. Private agents freely set about 60 and
70% of the retail prices, when the communist regime fell.
166 See Gomulka, Stanislav. “Ten Years in Retrospect: Secrets of Successful Macroeconomic
Policies,” Transition Newsletter, The World Bank/The William Davidson Institute, Vol. 11, No. 5, August-October 2000, p. 18.
60
The price adjustments were linked to the convertible currency for goods traded on
the foreign markets. The price liberalization initiated a boom in private commercial
establishments. However, the communist government did not allow private entrepreneurs
to enter into wholesale and foreign trade.167 At the start of transformation, Hungary
differed from the Czech Republic. There were a significant number of private
establishments already in existence. This had a significant impact on the consumer
sector.168
The goal of the liberalization and stabilization programs in the Visegrad countries
was to achieve stabilization and liberalization imprints, move from state controlled and
regulated prices toward free market prices, and disconnect the state monopoly over
foreign trade at the same time. This policy incorporated unilateral liberalization and
bilateral free trade agreements with the most important trading partners, including the
European Union (EU) and the Central European Free Trade Agreement (CEFTA). The
goal was to remove central control over prices and trade and begin to create a free
market.
The liberalization programs included: (a) liberalization of wages, (b) liberalization
of prices, (c) tariff reductions, (d) removal of non-tariff barriers, and (e) reorientation of
the foreign trade from East to West. The degree of protection for domestic production
significantly declined to the level comparable to EU countries. It was accompanied by a
strong currency devaluation, which helped reorient trade from the former socialist
markets to the Western markets, and mainly to the EU countries. The trade expansion to
the EU countries had been triggered by the collapse of the CMEA and by the
liberalization of trade and exchange rates. The main feature of liberalization was the
adoption of policies intended to affect fiscal accounts. As a result, all Visegrad countries
went through a sharp recession followed eventually by a recovery in all countries.169
Cata, who examined the transition of the former Soviet block countries, can prove that:
(a) price decontrol had a substantial and temporary effect on the price level; (b) price
167 See a World Bank, Discussion Paper, No. 104, “Eastern European Experience with Small-Scale
Privatization”, Washington, D.C.: The World Bank, April 1994, p. 49. 168 Ibid., p. 3. 169 A World Bank country study, No. 19650, “Czech Republic: Toward EU Accession, Main Report”,
Washington, D.C.: The World Bank, 1999, p. 13.
61
decontrol has no lasting adverse effect on the rate of inflation; and (c) monetary
expansion has been the fundamental determinant of inflation. 170
The Hungarian post-communist government relaxed the state monopoly on
foreign trade in January 1990. The value of exports to the EU countries in Hungary
increased by 76% between 1989 and 1992. In 1989, the EU market accounted for 34% of
Hungarian exports. In two years, the EU share of trade increased to 50%. This expansion
trend slowed down in 1993, when the value of the EU-oriented exports fell by 12%. By
the end of 1997, exports to the EU countries reached 70%.171
Czechoslovakia began the transition towards a free market by launching a
stabilization and transformation program in 1991. The success in liberalization and small-
scale privatization helped the Czech and Slovak Republics to reach the same level as
Poland and Hungary. After a large jump in 1991, the liberalization process in the Czech
and Slovak Republics slowed down and only moderate improvements can be seen.
Moreover, significant differences among the Visegrad countries in price liberalization
cannot be found. See the table below. 172
170 Ernesto Hernandez Cata, “Price Liberalization, Money Growth, and Inflation during the Transition to a Market Economy,” Washington D.C.: International Monetary Fund, African Department, Working Paper No. 76, June 1999, p. 3.
171 A World Bank Country Study, No. 19923, Hungary on the Road to the European Union, Washington D.C.; The World Bank, November 1999, pp. 59-60.
172 The data in Table 1 are organized according to the Cumulative Liberalization Index (CLI). The CLI is annual and covers the early stages of transition (1989 – 1995) in Visegrad countries. CLI is composed of three subgroups and each varies between zero, which represents a command economy and one, representing a market economy. The first group is internal or domestic price liberalization and competition with a weight of 0.3. The second is foreign trade liberalization and current and capital account convertibility with a weight of 0.3. The final group is progress in privatization, new entry regulations and enterprise development with a weight of 0.4. The CLI captures the intensity and duration of reforms. See Cevdet Denizer, “Stabilization, Adjustment and Growth Prospects in Transition Economies,” Washington D.C.: The World Bank, Working Paper No. 1955, February 1997, p. 4.

62
Table 6. Progress in Liberalization. 1990 1991 1992 1993 1994 1995
Czech Republic
0.16 0.79 0.86 0.9 0.9 0.93
Hungary 0.57 0.74 0.78 0.82 0.86 0.93 Poland 0.68 0.72 0.82 0.82 0.86 0.89 Slovak
Republic 0.16 0.79 0.86 0.86 0.86 0.86
From: Denizer 1997
2. Progress in Privatization
The main reason for the economic failure of the socialist system was the
inefficiency of the state owned firms. The transitional economies of the Visegrad
countries had to restructure and privatize on a large scale. It was hoped that privatization
would contribute to the restructuring and improvement of productivity of state owned
enterprises. The immediate negative consequence of reforms was a large decline in
output and employment.
In the former Czechoslovakia, almost entire industrial assets were in state hands.
Privatization through public offerings in the Visegrad countries was not feasible since
private savings were not adequate enough to acquire immense industrial assets at market
prices. The pace was important in order to avoid the stripping of assets from firms
waiting for privatization. First, the solution was to sell state assets to foreign investors,
which was not politically desirable at the start of privatization in the Visegrad countries
with the exception of Hungary, which had been willing to sell a significant portion of
state owned assets to foreign investors. The second solution, the management and
employee buyouts, had been an important element in Polish privatization. The third
feasible approach was restitution to the former owners. This method played an important
role in the privatization in Visegrad countries with the exception of Hungary, where
restitution took the form of government bonds. The Hungarian approach was more
complex and slowed down the pace of privatization. The fourth solution was mass
privatization. Other countries, with the exception of Hungary, implemented mass
privatization methods. The main goal of the Polish government was to prevent the
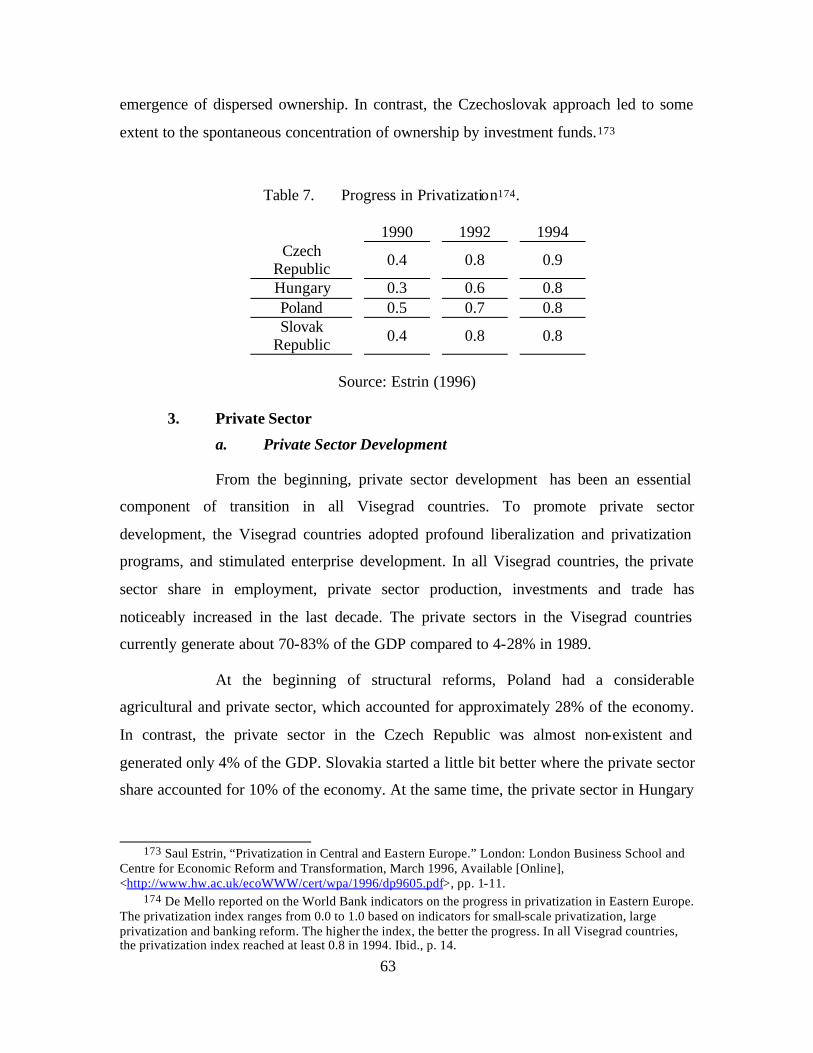
63
emergence of dispersed ownership. In contrast, the Czechoslovak approach led to some
extent to the spontaneous concentration of ownership by investment funds.173
Table 7. Progress in Privatization174.
1990 1992 1994 Czech
Republic 0.4 0.8 0.9
Hungary 0.3 0.6 0.8 Poland 0.5 0.7 0.8 Slovak
Republic 0.4 0.8 0.8
Source: Estrin (1996)
3. Private Sector
a. Private Sector Development
From the beginning, private sector development has been an essential
component of transition in all Visegrad countries. To promote private sector
development, the Visegrad countries adopted profound liberalization and privatization
programs, and stimulated enterprise development. In all Visegrad countries, the private
sector share in employment, private sector production, investments and trade has
noticeably increased in the last decade. The private sectors in the Visegrad countries
currently generate about 70-83% of the GDP compared to 4-28% in 1989.
At the beginning of structural reforms, Poland had a considerable
agricultural and private sector, which accounted for approximately 28% of the economy.
In contrast, the private sector in the Czech Republic was almost non-existent and
generated only 4% of the GDP. Slovakia started a little bit better where the private sector
share accounted for 10% of the economy. At the same time, the private sector in Hungary
173 Saul Estrin, “Privatization in Central and Eastern Europe.” London: London Business School and
Centre for Economic Reform and Transformation, March 1996, Available [Online], <http://www.hw.ac.uk/ecoWWW/cert/wpa/1996/dp9605.pdf>, pp. 1-11.
174 De Mello reported on the World Bank indicators on the progress in privatization in Eastern Europe. The privatization index ranges from 0.0 to 1.0 based on indicators for small-scale privatization, large privatization and banking reform. The higher the index, the better the progress. In all Visegrad countries, the privatization index reached at least 0.8 in 1994. Ibid., p. 14.
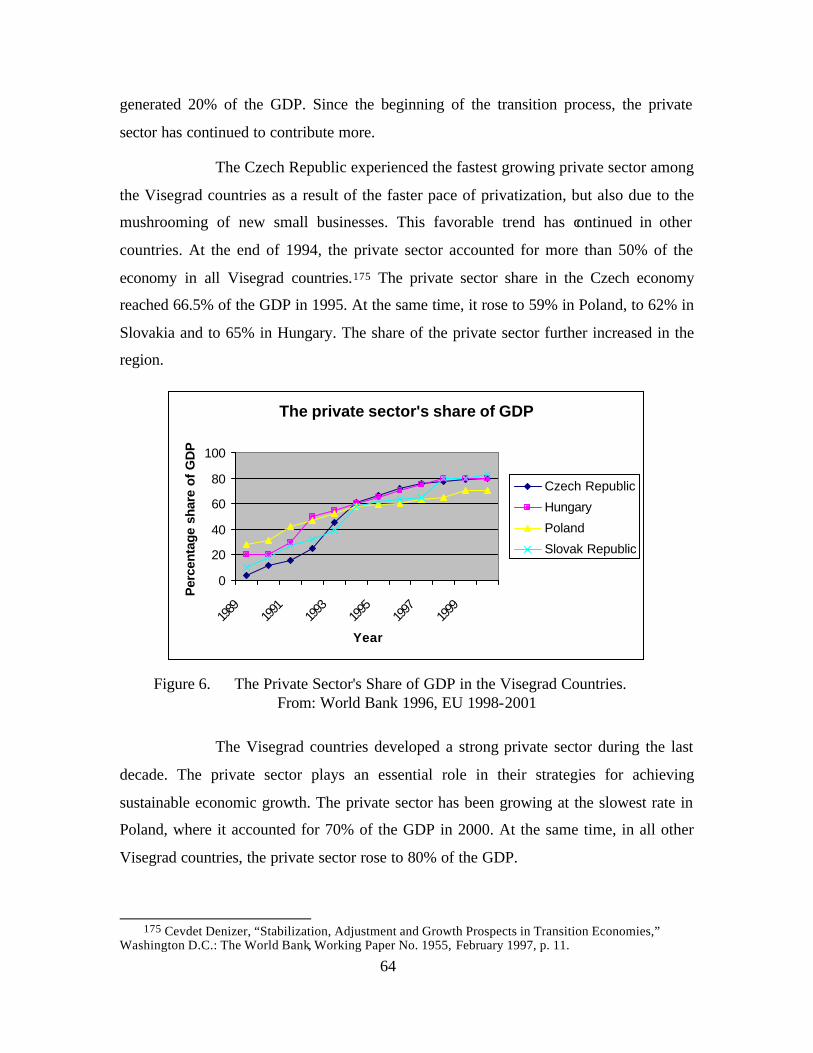
64
generated 20% of the GDP. Since the beginning of the transition process, the private
sector has continued to contribute more.
The Czech Republic experienced the fastest growing private sector among
the Visegrad countries as a result of the faster pace of privatization, but also due to the
mushrooming of new small businesses. This favorable trend has continued in other
countries. At the end of 1994, the private sector accounted for more than 50% of the
economy in all Visegrad countries.175 The private sector share in the Czech economy
reached 66.5% of the GDP in 1995. At the same time, it rose to 59% in Poland, to 62% in
Slovakia and to 65% in Hungary. The share of the private sector further increased in the
region.
The private sector's share of GDP
0
20
40
60
80
100
1989
1991
1993
1995
1997
1999
Year
Per
cent
age
shar
e of
GD
P
Czech Republic
Hungary
Poland
Slovak Republic
Figure 6. The Private Sector's Share of GDP in the Visegrad Countries.
From: World Bank 1996, EU 1998-2001
The Visegrad countries developed a strong private sector during the last
decade. The private sector plays an essential role in their strategies for achieving
sustainable economic growth. The private sector has been growing at the slowest rate in
Poland, where it accounted for 70% of the GDP in 2000. At the same time, in all other
Visegrad countries, the private sector rose to 80% of the GDP.
175 Cevdet Denizer, “Stabilization, Adjustment and Growth Prospects in Transition Economies,”
Washington D.C.: The World Bank, Working Paper No. 1955, February 1997, p. 11.
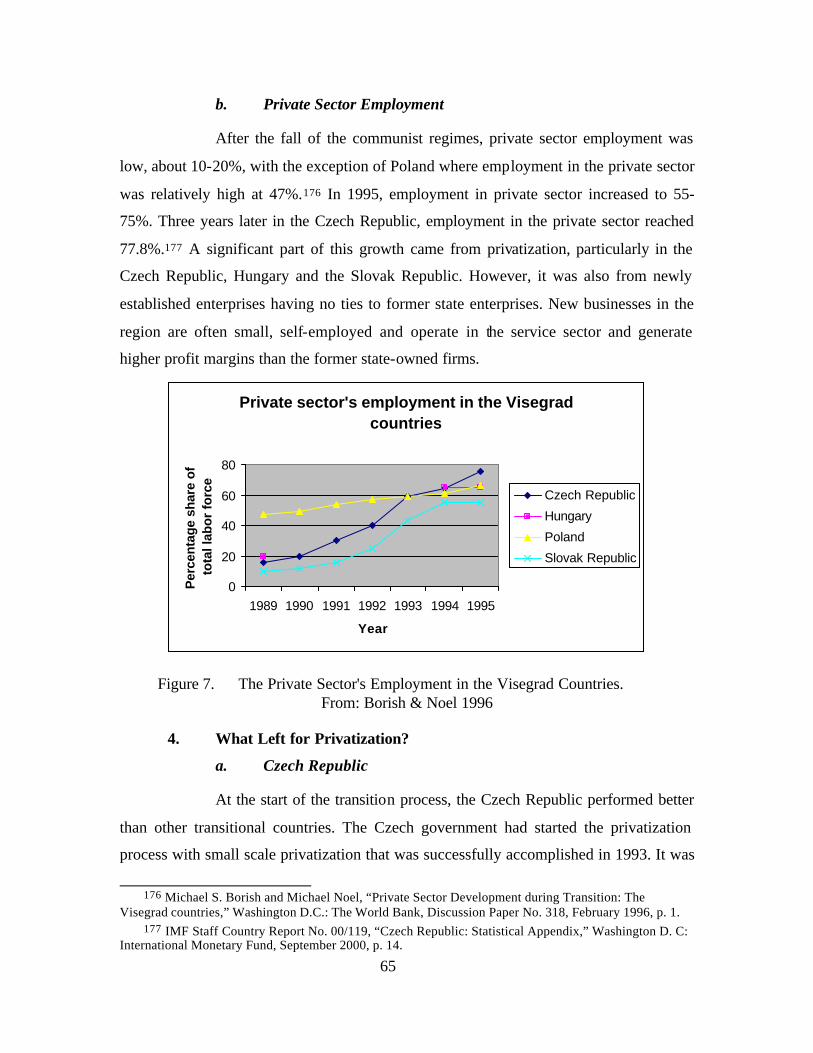
65
b. Private Sector Employment
After the fall of the communist regimes, private sector employment was
low, about 10-20%, with the exception of Poland where employment in the private sector
was relatively high at 47%.176 In 1995, employment in private sector increased to 55-
75%. Three years later in the Czech Republic, employment in the private sector reached
77.8%.177 A significant part of this growth came from privatization, particularly in the
Czech Republic, Hungary and the Slovak Republic. However, it was also from newly
established enterprises having no ties to former state enterprises. New businesses in the
region are often small, self-employed and operate in the service sector and generate
higher profit margins than the former state-owned firms.
Private sector's employment in the Visegrad countries
0
20
40
60
80
1989 1990 1991 1992 1993 1994 1995
Year
Per
cent
age
shar
e of
to
tal l
abor
for
ce
Czech Republic
Hungary
Poland
Slovak Republic
Figure 7. The Private Sector's Employment in the Visegrad Countries. From: Borish & Noel 1996
4. What Left for Privatization?
a. Czech Republic
At the start of the transition process, the Czech Republic performed better
than other transitional countries. The Czech government had started the privatization
process with small scale privatization that was successfully accomplished in 1993. It was
176 Michael S. Borish and Michael Noel, “Private Sector Development during Transition: The
Visegrad countries,” Washington D.C.: The World Bank, Discussion Paper No. 318, February 1996, p. 1. 177 IMF Staff Country Report No. 00/119, “Czech Republic: Statistical Appendix,” Washington D. C:
International Monetary Fund, September 2000, p. 14.
66
followed by the voucher privatization program that led to the quick privatization of a
large number of enterprises. By 1995, the Czech Republic led in terms of the private
sector share, which approached 66.5% of the GDP. At the end of 1997, the privatized
assets of medium and large enterprises were approximately CZK700 billion and the total
revenues from privatization by all methods reached CZK176 billion. Revenues from
small-scale privatization accounted for 23% of collected revenue. In 1996, the revenues
from sales to foreign investors accounted for only 3-4%.178
Rapid and extensive privatization accounted for much of this change.
However, there were doubts as to whether the new owners, particularly the investment
funds, would actively exercise corporate governance and drive restructuring. In addition,
the regulatory framework for enterprises and capital market institutions contained flaws
that hindered the expected gains from privatization. Furthermore, there was less progress
in privatizing the state banks and solving the problem of bad debts. These deficiencies led
later to the worsening macroeconomic performance and crisis in 1997.
At the start of the reforms, the voucher privatization method encouraged
the privatization process. However, afterwards the Czechs government slowed the pace
of privatization and shifted to a direct sale method of privatization by using cash or case-
by-case methods. A large amount of strategic assets had been waiting for privatization.
The state kept a majority stake in a set of 40 strategic firms and banks, and stakes in more
than 30 non-strategic companies, and minority stakes in about 300 firms. The estimated
state’s share in SPT Telecom is CZK74 billion, in Ceské Radiokomunikace CZK 9
billion, in CEZ CZK33 billion and in the regional power and gas distribution companies
CZK30 billion. 179 The Czech government decided to sell its share in 236 non strategic
holdings where its share was less then 5% for approximately CZK8 billion. 180
Bank privatization proceeded very slowly up to the end of 1997. Five
state-owned banks (KB, ŽB, CS, IPB, and CSOB) were partially privatized through the
voucher method. In 1992, the first state-owned bank, ŽB, was fully privatized. The first
178 A World Bank Country Study, No. 19650, “Czech Republic: Toward EU Accession, Main
Report”, Washington, D.C.: The World Bank, 1999, pp. 142-143. 179 Ibid., p. 143. 180 Ibid., p. 144.

67
major bank privatization (IPB) began in 1996.181 In 1997, the state stakes in the banking
sector remained still high with the Czech Savings Bank at 45.0%, Komercní Banka at
48.7% and CSOB at 65.7%.182 Privatization of the IPB was accomplished in March 1998
when the IPB bank was sold to the Nomura Bank.183 At the same time, total state
ownership in the banking sector accounted for 84% of the banking sector.184 The
privatization process for the three major banks KB, CSOB and CS started in 1999.
During 1999-2000, the market share of the foreign-owned banks was expected to increase
to about 90%.185
Table 8. The Unfinished Privatization Agenda in the Czech Republic (June 30, 1998).
State assets Book Value Market
Value Number of
(Held by) (CZK mil.) (CZK mil.) Companies National Property Fund
Strategic companies 155,463 202,821 40 None strategic companies 15,285 5,032 329
Restitution Investment Fund 1,243 1,161 1 Other property 3,941 569
National Property Fund 170,748 207,853 369 Ceská Financní 13,942 4,000 Over 60
Konsolidacni Banka 11,318 6,000 9
From: World Bank 1999
In 1999, the Czech Republic accelerated structural reforms, and
privatization activities were under review. The foreign direct investments in 1999 were
significantly influenced by the sale of CSOB to a foreign bank for over € 1 billion. 186 In
June 2000, the state sold its 30% share in Škoda Auto and the Ceská Sporitelna Bank for
181 Ibid., p. 114. 182 Ibid., p. 43. 183 A World Bank Country Study, “Czech Republic: Completing the Transformation of Banks and
Enterprises, Washington, D.C.: The World Bank, No. 21440, November 2000, p. 4. 184 A World Bank Country Study, No. 19650, “Czech Republic: Toward EU Accession, Main
Report”, Washington, D.C.: The World Bank, 1999, p. 110. 185 Ibid., p. 108. 186 See a “Regular Report on the Czech Republic’s Progress Toward Accession: 1999, Commission of
the European Communities, October 13, 1999, Available [Online], <http://europa.eu.int/comm/enlargement/czech/index.htm>, p. 21.
68
€ 515 million. 187 At the end of June 2001, with the sale of Komercní Banka, the
privatization of the banking sector was completed. Foreign banks controlled about 90%
of the banking sector. The take-over of IPB by CSOB, after IPB had been put into forced
administration, has still not been completely settled.188 The Government approved the
sale of its 30% stake in Ceská Pojištovna, the country’s largest insurance company.189
The privatization of large enterprises in the energy, engineering and telecommunications
sector has been scheduled for 2001 and 2002.190
b. Hungary
The privatization process in Hungary has been proceeding slowly. By mid
1995, only 35% of state assets had been sold. Running disputes delayed the privatization
process. Moreover, the Privatization Law excluded major utilities from privatization.191
Privatization through direct sale peaked in the second half of 1995. At the end of 1995,
the revenue from privatization amounted to HUF 178,388 mil. In the following year, it
peaked at HUF 260,621 mil. By the end of 1997, the privatized assets accounted for HUF
790 billion and the shares transferred to the social security funds and municipalities were
worth HUF 65 billion. 192 The Hungarian parliament decided to retain a stake in 116
companies.193 At the end of 1998, the state held stakes in 388 firms of which 150 were
undergoing bankruptcy proceedings. In 1999, the state sold a 5.7% minority stake in
187 See a “Regular Report on the Czech Republic’s Progress Toward Accession: 1999, Commission of
the European Communities, October 13, 1999, Available [Online], <http://europa.eu.int/comm/enlargement/czech/index.htm>, pp. 33-34.
188 See a “Regular Report on the Czech Republic’s Progress Toward Accession: 2001, Commission of the European Communities, November 13, 2001, Available [Online], <http://europa.eu.int/comm/enlargement/czech/index.htm>, p. 36.
189 Ibid.,p. 3. 190 See an EBRD Investment Profile, “Czech Republic Investment Profile,” London: European Bank
for Research and Development (EBRD), April 2001, Available [Online], <http://www.mac.doc.gov/eebic/countryr/czechr.htm>, pp. 6-7.
191 A World Bank country study, No.19650, “Czech Republic: Toward EU Accession, Main Report”, Washington, D.C.: The World Bank, 1999, p. 4.
192 See a World Bank Country Study No. 19923, “Hungary on the Road to the European Union,” Washington D.C.; The World Bank, November 1999, p. 4.
193 See a “Regular Report on Hungary’s Progress Toward Accession: 1998,” Commission of the European Communities, November 1998, Available [Online], <http://europa.eu.int/comm/enlargement/hungary/index.htmp >, p.15.

69
MATAV for € 300.2 million, 194 and the remaining stakes were in a number of financial
institutions. However, it was decided to keep minority stakes in privatized companies.
The state still holds assets with a book value of € 3.4 billion, and
maintains a majority ownership in 134 enterprises, compared to 1,859 firms with state
ownership in 1990. The state has been preparing for the privatization of the
pharmaceuticals retailer Hungaropharma and the largest steel enterprise Danaher.195 At
the end of 1999, the private sector accounted for over 80% of the GDP. In 2000,
privatization was almost completed. Only a few large firms remained for direct sale.196
Most of the privatization projects have been postponed, such as the national airline
MALEV, due to the unfavorable stock exchange environment and further restructuring
needs. Other firms, such as Postabank, have been reclassified as strategic. The banking
sector is mainly private.197
c. Poland
Privatization and structural reforms have been slowly progressing in
Poland. The Polish government expected the total revenue from the privatization
program, which encompassed about 1,800 companies, to amount to ECU 25 billion. 198 In
1998, the Polish authorities decided that 44 enterprises would remain under state
ownership and that 70% of state assets were to be privatized by 2001, and would collect
revenue of more than € 35 billion. By the end of 1998, approximately 3,000 firms were
still to be privatized and around half of them through the direct sales method. In 1998, the
number of privatized firms through direct sale reached 156, through commercialization
244, and by tender 16. The sale of 15% of the shares of Poland’s national
194 See a “Regular Report on Hungary’s Progress Toward Accession: 1999,” Commission of the European Communities, October 13, 1999, Available [Online], <http://europa.eu.int/comm/enlargement/hungary/index.htmp >, p. 20.
195 See a “Regular Report on Hungary’s Progress Toward Accession: 2000,” Commission of the European Communities, November 8, 2000, Available [Online], <http://europa.eu.int/comm/enlargement/hungary/index.htmp >, p. 27.
196 See an EBRD Investment Profile, “Hungary Investment Profile,” London: European Bank for Research and Development (EBRD), April 2001, Available [Online], <http://www.mac.doc.gov/eebic/countryr/hungary.htm>, p. 6.
197 See a “Regular Report on Hungary’s Progress Toward Accession: 2001,” Commission of the European Communities, November 13, 2001, Available [Online], <http://europa.eu.int/comm/enlargement/hungary/index.htmp >, p. 33.
70
telecommunications operator TPSA has generated revenue over € 765 million.
“Privatization revenue of € 1.9 billion in 1998 exceeded expectations. The sale of about
70 firms in 1999 is expected to contribute € 3.6 billion to government revenue.”199
In 1999, the pace of privatization was encouraging. The number of sold
enterprises reached 150 across a wide range of sectors. Revenues from privatization
exceeded expectations.200 The next year the number of privatized firms through direct
sale reached 165. Revenues from privatization were used to finance four large social
reforms. Revenues from privatization significantly affected the inflows of foreign
investment that amounted to € 9bn or slightly less than in 1999.201 The state still owns a
major share in a number of firms in sectors such as steel, energy, gas, oil,
telecommunications, heavy chemical industry, air transport, railways, spirits and sugar.202
The Polish government expects that privatization will be completed by the end of 2002.
d. Slovak Republic
The privatization process in Slovakia started with small scale privatization
that generated $0.5 billion. The first wave of voucher privatization helped to accelerate
privatization in Slovakia and convert state assets worth $38 billion to private hands.203
There are two reasons why Slovakia lagged behind in the pace of privatization. First,
after separation, the second round of voucher privatization, which was expected to
privatize state assets with a book value of $6.5 billion, was abandoned. The government
led by Vladimir Meciar had started to privatize manufacturing firms through public
tenders to owners politically connected to the leading political party at very low prices
198See a “Regular Report on Poland’s Progress Toward Accession: 1998,” Commission of the
European Communities, November 1998, Available [Online], <http://europa.eu.int/comm/enlargement/poland/index.htm>, p. 16.
199 See a “Regular Report on Poland’s Progress Toward Accession: 1999,” Commission of the European Communities, October 13, 1999, Available [Online], <http://europa.eu.int/comm/enlargement/poland/index.htm>, pp. 21-22.
200 See a “Regular Report on Poland’s Progress Toward Accession: 2000,” Commission of the European Communities, November 8, 2000, Available [Online], <http://europa.eu.int/comm/enlargement/poland/index.htm>, p. 23.
201 See a “Regular Report on Poland’s Progress Toward Accession: 2001,” Commission of the European Communities, November 13, 2001, Available [Online], <http://europa.eu.int/comm/enlargement/poland/index.htm>, p. 27.
202 Ibid., p. 71. 203 Michael S. Borish and Michael Noel, “Private Sector Development during Transition: The
Visegrad Countries,” Washington D.C.: The World Bank, Discussion Paper No. 318, February 1996, p. 70.
71
and with long payment periods. 204 Second, the Slovak government was unable to attract
an inflow of foreign direct investments. During 1993-1994, the flow of direct investments
accounted for only $240 million. 205
In 1998, Slovakia made notable progress in restructuring and privatization
through direct sale. Stakes in several industrial firms, strategic enterprises in banking and
telecommunication sectors mainly, have been sold at preferential rates. However, in
many cases, there was a lack of transparency and fairness. The lack of foreign direct
investments, the government’s interventions, and inefficiency in the privatization process
negatively affected the enterprise restructuring process. In addition, the government
exerted significant influence over the economy by excluding some essential firms from
privatization. 206
In 1999, new political representation focused on the program of structural
reforms and privatization of banks and enterprises. The new government decided to
review the privatization process of some enterprises due to a lack of transparency and the
suspicion of corruption. Although no dominant privatization has been completed, the new
government launched a plan for the privatization of the telecommunication, utility and
banking sectors. The state owned bank’s share was still high and was 46% of the banking
sector. The parliament abolished the Act that prevented the privatization of strategic
enterprises207
Privatization in Slovakia advanced further in 2000. The government sold
its majority stake in Slovak Telecom. 208 The full privatization of the state banks is almost
completed and the sale of minority stakes in the utility sector is still being prepared. Due
204 John Nellis, “Enterprise Reform in Transition Economies: A Retrospective Analysis,” Washington
D.C.: The World Bank, Center for Global Development, January 2002, p. 27. 205 Michael S. Borish and Michael Noel, “Private Sector Development during Transition: The
Visegrad Countries,” Washington D.C.: The World Bank, Discussion Paper No. 318, February 1996, p. 62. 206 See a “Regular Report on Slovak’s Progress Toward Accession: 1998,” Commis sion of the
European Communities, November 1998, Available [Online], <http://europa.eu.int/comm/enlargement/slovakia/index.htm>, pp. 16-21.
207 See a “Regular Report on Slovak’s Progress Toward Accession: 1999,” Commission of the European Communities, October 13, 1999, Available [Online], <http://europa.eu.int/comm/enlargement/slovakia/index.htm>, pp. 15-23.
208 See a “Regular Report on Slovak’s Progress Toward Accession: 2000,” Commission of the European Communities, November 8, 2000, Available [Online], <http://europa.eu.int/comm/enlargement/slovakia/index.htm>, pp. 24-30.
72
to the sale of the state’s majority stake in Slovak Telecom and minority stakes in Slovnaft
and VSŽ, foreign investments amounted to $1.1 billion in 2000. Within 1990-2000, the
accumulated foreign direct investment stock reached $3.6 billion. 209 Slovakia made
significant progress in the privatization of the banking sector in 2001. The government
sold its majority stakes in the largest banks and advanced in the privatization of the
largest insurance company and remaining smaller banks. The private sector share of the
GDP increased to about 85%.210 The government has accelerated the privatization of 38
companies for a total accounting value of approximately € 5.8 billion. Privatization in
Slovakia is almost at an end.
209 See an EBRD Investment Profile, “Slovak Republic Investment Profile,” London: European Bank
for Research and Development (EBRD), April 2001, Available [Online], <http://www.mac.doc.gov/eebic/countryr/slovakr.htm>, p. 6.
210 See a “Regular Report on Slovak’s Progress Toward Accession: 2001,” Commission of the European Communities, November 13, 2001, Available [Online], <http://europa.eu.int/comm/enlargement/slovakia/index.htm>, pp. 30-32.
73
V. SUCCESS OR FAILURE
It is widely recognized that the privatization of state owned enterprises is one of
the key reforms during the transition process. However, the best arrangement for
privatization and its advantages and drawbacks is less clear. The voucher method
implemented by the Czech government became one of the most discussed issues during
the transition process.
This chapter provides an overview and current evaluation of the Czech
privatization approach. The criteria for measuring the success or failure of a particular
market reform or development are often ignored and unpublished. How successful was
voucher privatization in the Czech Republic? To answer this question, indicators of
success or failure assessment need to be introduced.
This paper introduces some assessment indicators in order to analyze the success
or failure of voucher privatization. It tries to look at more than one alterna tive
perspective. To what extent are these indicators relevant? The relevance of the indicators
is subjective to some extent. However, the success of the voucher scheme in terms of the
pace and the emergence of the private sector are not in doubt.
How can success or failure be accessed? The first set of indicators of success or
failure in privatization is the extent to which the Czech government was able to meet its
objectives. The voucher scheme was successful in (a) the fast transformation of property
rights from the state to private owners, (b) gaining wide pubic support for privatization,
and (c) preventing foreigners from dominating the privatization process. However, it
failed to accomplish its third objective of improving performance and the governance of
privatized enterprises in the short run.
The second group of indicators of success or failure in privatization is the extent
to which the Czech privatization was able to meet objectives recognized by liberal
economists. The voucher scheme was successful in (a) private sector development, (b)
emergence of ownership concentration similar to the United Kingdom, and (c)
transformation from a command economy to a consolidated market economy. The

74
voucher scheme failed (a) to maximize revenue collection from privatization, (b) had a
mainly negative impact on efficiency in privatized firms due to delayed structural
reforms, and (c) failed to implement counter measures against corruption.
The third set of indicators of success or failure is focused on some of the positive
and negative outcomes of coupon privatization. The voucher scheme was successful in
(a) terms of speed of denationalization (b) free distribution of state assets that do not
unleash hyperinflation, (c) developing a good system for equity distribution, and (d) the
emergence of a large number of privatization funds.
In contrast, it failed (a) to follow its original deadline, (b) because the
implementation of the voucher method lacked transparency, (c) because it provided
asymmetric information for participants, (d) to be fair concerning the outcomes that
occurred, and (e) to create regulatory measures against looting, tunneling and other
undesirable behavior.
A. THE GOVERNMENT’S MAIN OBJECTIVES
The first set of indicators of success or failure in privatization is the extent to
which the Czech government was able to meet its objectives. Statements on expectations
made by the government were helpful in the process of evaluating success and failure.
These statements were used as criteria to judge success or failure later. The government’s
main objectives were (a) attain ownership transformation, (b) gain pubic support for
privatization, (c) improve economic efficiency, performance and the governance of
privatized enterprises, and (d) prevent the domination of foreigners in the privatization
process.
1. Ownership Transformation
The first main objective of Czech privatization was to accomplish ownership
transformation and gain pubic support for privatization. The voucher scheme was
successful in the quick transformation of property rights from the state to private owners.
The voucher method made it possible to denationalize a large part of the Czech
economy in a short period of time. In the first wave of voucher privatization that lasted
less than one year, 943 state enterprises with a book value of more than 206 billion CZK
were privatized. In the second wave, additional 867 enterprises with a book value of 155

75
billion CZK were privatized. In addition, the coupon method showed that it is feasible
that an inexperienced government in a single wave could privatize a significant part of
the economy. The coupon method of privatization fulfilled the Czech government’s
expectations. In three and half years, starting in October 1991 and ending in March 1995,
1,810 enterprises were denationalized. The voucher method enabled an enormous number
of majority shares in a great number of state firms to be quickly sold.
2. Public Support
The Czech government was also successful in its objective to gain pubic support
for privatization. In December 1989, only 22% of the population favored wholesale
privatization of industry and 13% supported privatization of agriculture.211 The Czech
government’s goal was to attract at least 50% of its citizens for the first wave of the
voucher privatization method. The initial public response to the government’s campaign
was significantly lower. Only about 20% wanted to participate. However, the marketing
campaign launched by the Investment Privatization Funds rapidly increased the number
of participants.
The rapid pace of reform did not encounter any resistance from inexperienced
citizens since all eligible citizens were able to participate through the coupon method.
Despite not having any capital, they had an opportunity to participate in privatization.
The number of participants was high. In the first wave, the number of participants
increased to 75% of the total number of eligible citizens and in the second wave further
increased to 80%.212
The participation of voucher holders in each wave of the five bidding rounds
exceeded expectations. The number of participants fluctuated between 88-92% of the
total number of bidders. Therefore, the voucher method was successful in fulfilling the
government’s objective to gain public support for radical reforms.
211 Carol Skalnik Leff, “The Velvet Revolution of 1989 and the Politics of Democratization,” The
Czech and Slovak Republics: Nation versus State (Boulder, Colorado: Westview Press, 1997), p. 83. 212 Carol Graham, “Voucher Privatization in the Czech Republic,“ Private Markets for Public Goods:
Raising the Stakes in Economic Reform (Washington, D.C.: Brooking Institution Press, 1998), p. 223.
76
3. Governance of Privatized Firms
The government to some extent failed to accomplish its third objective to improve
performance and the governance of privatized enterprises. What were the shortcomings
of the coupon method? The first drawback of the voucher method was that it still resulted
in continuing state ownership and influence in the banking sector and in privatized firms
through the investment funds owned by domestic financial institutions. A close
relationship between banks and enterprises has not been seen as an undesirable conflict of
interest but as positive monitoring mechanisms to decrease information asymmetries
between banks and privatized firms. “A necessary precondition for success is to change
incentives of both banks and enterprises and privatize them.” Once they were privatized
the “Czech banks started to improve their efficiency.”213 This flaw to some extent
contributed to the first post-communist recession in 1997. Since that time, the
government has taken measures to remove the deficiencies in the legislative and legal
setting, especially in relation to investment funds and capital markets, and has accelerated
the privatization of the commercial banks.
The second drawback was the failure to impose adequate constraints and provide
incentives to the new owners to restructure the newly privatized enterprises. For instance,
labor productivity in the Czech Republic increased by 6% during 1989-1998, compared
with 36% in Hungary and 29% in Poland.214 During the voucher privatization process,
real wages increased by 31% without a significant impact on unemployment. The growth
of real wages was more significant in State enterprises, but also affected the newly
privatized enterprises.215
The Czech approach allowed the fast privatization of state owned enterprises but
left the restructuring process to the new owners. In contrast, Hungary and Poland
emphasized active improvement in corporate governance and struggled to restructure
state-owned enterprises before offering them to new investors. Hungary preferred, rather,
213 Roland Egerer, “Capital Markets, Financial Intermediaries, and Corporate Governance: An Empirical Assessment of the Top Ten Voucher Funds in the Czech Republic,” Washington D.C.: World Bank, December 1995, p. 41.
214 John Nellis, “Privatization and Enterprise Reform in Transition Economies: A Retrospective Analysis,” Washington, D.C.: The World Bank, 2002, p. 27.
215 A World Bank Country Study, No. 19650, “Czech Republic: Toward EU Accession, Main Report”, Washington, D.C.: The World Bank, 1999, p. 6.
77
the gains resulting from a higher quality of corporate governance than the rapid pace of
ownership transfer.216
The third shortcoming of the coupon method was that it led to disperse ownership
structures. However, this flaw was eliminated to some extent by the emergence of IPFs
and their aggressive marketing strategy.
It was also frequently argued that the voucher privatization would create a large number of small and inexperienced owners who would not be in a position to exert a sufficiently strong pressure on managers and perform the entrepreneurial role in restructuring and modernization of privatized firms.217
The IPFs gained 66% of all shares in the first wave of coupon privatization.
However, they were limited to 20% ownership and usually owned far less. This
weakened (a) the role of IPFs representation on boards, (b) their ability to impose their
interests, and (c) their ability to supervise enterprise management. It also undermined
their incentives to exercise control over enterprise management. As a result, IPFs became
portfolio managers focused on aggregate returns.218 Thus, the IPFs did not play the
expected positive role in improving corporate governance in newly privatized firms.
The EBRD, in collaboration with the World Bank, conducted a survey focused on
the quality of governance in 20 transition countries. The survey revealed that the quality
of corporate governance in the Czech Republic was the worst among the Visegrad
countries.219
216 Bartlomiej Kaminski and Micelle Riboud, Foreign Investment and Restructuring: The Evidence
from Hungary, The World Bank Technical Paper No. 453, Washington D.C.: The World Bank, March 2000, pp. 7-9.
217 Oldrich Kyn, Market with Vouchers and Investment Funds, Prague, CERGE, 1992. http://econc10.bu.edu/okyn/Okpers/Vouchers/vouchers1.htm , February 19, 2002, p. 5.
218 Michael S. Borish and Michael Noel, “Private Sector Development during Transition: The Visegrad Countries,” Washington D.C.: The World Bank, Discussion Paper No. 318, February 1996, p. 9.
219 The results are on scale ranging from: 0 (major obstacle), to 3 (no obstacle). See an “EBRD and World Bank Survey Reveals Intimate State-Enterprise Relations,” Transition Newsletter, Volume 10, No. 6, Washington D.C.: The World Bank, December 1999, p. 6.

78
Table 9. The Quality of Governance.
Micro Economic Macro Economic Governance Country Governance Governance Index
Czech Republic 0.8 1.35 1.59 Hungary 0.92 1.72 1.98 Poland 0.96 1.53 1.69
Slovak Republic 0.88 1.68 1.65
From: The World Bank, 1999
4. Foreign Dominance Prevention
The Czech government successfully fulfilled its next objective to prevent
foreigners from dominating the privatization process. The Czech government was
successful in fulfilling its objective. During the period 1991-97, the direct sales of shares
of joint stock to foreign investors amounted to 14.15 billion CZK but it was only a 2.73
share of the total. In small-scale privatization, only 19% of revenues were received from
foreign investors. Revenues from sales to foreigners decreased from 33-36% in 1992-
1993 to 3-4% in 1996-1997.220 In contrast, Hungary generated substantial FDI through
privatization during 1995-1996.221 The share of foreign investors in total investment
reached 62% in 1996.222 The foreign ownership in Hungarian manufacturing firms
reached 51.1% of the total. 223 Firms with foreign capital generated 73% of total exports
and 72% of imports in 1997.224
B. OTHER PRIVATIZATION GOALS
The second set of indicators of success or failure in privatization is the extent to
which the Czech privatization was able to meet objectives recognized by liberal
economists. The next indicators of success or failure are related to the main goals of
privatization described by Prince Waterhouse. These indicators are (a) revenue collection
220 A World Bank country study, No. 19650, “Czech Republic: Toward EU Accession, Main Report”,
Washington, D.C.: The World Bank, 1999, pp. 142-143. 221 John Nellis, “Privatization and Enterprise Reform in Transition Economies: A Retrospective
Analysis,” Washington D.C.: The World Bank, 2002, p. 27. 222 Bartlomiej Kaminski and Micelle Riboud, Foreign Investment and Restructuring: The Evidence
from Hungary, the World Bank Technical Paper No. 453, Washington D.C.: The World Bank, March 2000, p. 7.
223 A World Bank Country Study No. 19923, “Hungary on the Road to the European Union,” Washington D.C.: The World Bank, November 1999, p. 95.
224 Ibid., p. 66.

79
from privatization, (b) improved efficiency of privatized firms, (c) decrease in the
government’s involvement in the economy, (d) greater enterprise ownership structure,
and (e) the emergence of a competitive free market environment.225
1. Revenue Collection from Privatization
Revenue collection is one of the main objectives of privatization. Up to the end of
1997, the Czech government was less successful in revenue collection from privatization
than Hungary. However, since 1998, the Czech economy has achieved a leading role in
the region in revenue collection from privatization.
The Czech government’s main objective was not the maximization of revenue
collection from mass privatization. However, this changed when the voucher
privatization process was completed. The total revenues from privatization by all
methods, mainly when collected from domestic investors, were estimated at CZK176
billion up to the end of 1997. In contrast, Hungary generated substantial FDI through
privatization in 1995/96.226
In 1998/1999, the Czech government accelerated denationalization by privatizing
the leading banks through tenders and direct sales. This has helped the Czech Republic
get ahead of its rivals in terms of per capita FDI. This trend of high inflows was mainly
caused by renewed privatization efforts. In 1999, the flow of FDI peaked at 11.6% of the
GDP. The Czech Republic has received almost $20 billion in foreign direct investments
since 1989, but about one half of these investments were invested during 1999-2000.227
For the year 2002, the estimated flow of FDI is $4.5 billion. The estimated cumulative
total of FDI since the 1990s to 2002 is more than $26.0 billion. The annual receipts from
privatization could exceed $4-5 billion in 2002 and 2003. However, after that, the inflows
are expected to decline as the major privatization process is coming to an end.228
225 See William L. Megginson and Jeffrey M. Netter, “From State to Market: A survey of Empirical
Studies on Privatization,” Journal of Economic Literature, Vol. XXXIX (June 2001) p. 30. 226 A World Bank Country Study, No. 19650, “Czech Republic: Toward EU Accession, Main
Report”, Washington, D.C.: The World Bank, 1999, pp. 142-143. 227 See an EBRD Investment Profile, “Czech Republic Investment Profile,” London: European Bank
for Research and Development (EBRD), April 2001, Available [Online], <http://www.mac.doc.gov/eebic/countryr/czechr.htm>, pp. 6-7.
228 Simon Mackay, “Czech Republic.” Price Water House, Available [Online], March 2002, <http://www.pwcglobal.com/extweb/frmclp11.nsf/DocID/073A4DD123144BF685256B6D008078D5?OpenDocument>.

80
2. Improved Efficiency of Privatized Firms
The second objective of privatization is the improved efficiency of privatized
firms. The voucher privatization method had a mainly negative impact on efficiency in
privatized firms due to delayed structural reforms in privatized firms and in the banking
sector.
Oswald has evidence that enterprises privatized through the voucher privatization
method were more profitable than those not privatized in this manner. “Almost 32% of
them had been profitable firms. In contrast only 13.4% of them were in loss.”229
Harper indicated that the voucher privatization method had a mainly negative
impact on efficiency in privatized firms. Harper analyzed 178 Czech firms that were
privatized in the first wave of coupon privatization to test profitability and changes in
efficiency and profitability. His study reveals that efficiency and profitability decreased
immediately after privatization was completed. His findings are contrary to earlier
studies. He has evidence that changes in the operations of privatized firms do not vary
substantially by size or ownership. However, the type of industry impacts the
performance of the firm. The non-manufacturing firms showed more posit ive, or less,
negative changes. Despite these negative findings, he found one positive outcome.
Employment in privatized firms is decreasing. 230
The delay of structural reforms in the banking and financial sector is one of the
main reasons for the lack of efficiency in privatized enterprises.231 In the Czech Republic,
large banks were the founders of the largest IPFs that gained 44% of all coupon points.232
As a result, banks had excessive economic power over firms and could control firms
through the shares owned by their funds. Banks, as the institutional owners, have
229 Sharon L. Oswald, “Economic Transition in the Czech Republic,” Administration & Society,
Beverly Hills, July 2000, pp. 227-254. 230 Joel T. Harper, “Short-Term Effects of Privatization on Operating Performance in the Czech
Republic,” The Journal of Financial Research, Tempe: Spring 2001, pp. 1-7. 231 Gerhard Schusselbauer, “Privatization and Restructuring in Transition: Theory and Evidence
Revisited,” Europe – Asia Studies, Abingdon, January 1999, p. 9. 232 Robert Cull, Jana Matesova and Mary Shirley, Ownership Structure and Temptation to Loot,
Evidence from Privatized Firms in the Czech Republic, Washington D.C.: The World Bank, Policy Research Paper No. 2568, 2001, p. 19.
81
monitored the performance of the firms but they were not experts in enterprise
management in different industry fields.
3. Private Sector Development
The Czech Republic was successful in private sector development. The measure
of private sector development is the magnitude of the private sector’s share in a country’s
economy. It is mainly measured by the private sector’s share in (a) employment, (b)
production, (c) investment (d) consumption and (e) trade. The Czech Republic
experienced the fastest growing private sector among the Visegrad countries as a result of
the faster pace of privatization in the earlier years of reforms.
In 1989, the private sector in the Czech Republic generated only 4% of the GDP.
The voucher method of privatization significantly helped the country to catch up with the
others. First, in five years, the private sector represented 56% of the GDP. At the end of
the voucher privatization process, the private sector’s share in the Czech economy
reached 66.5% of the GDP compared to 65% in Hungary, 62% in Slovakia and 59% in
Poland. The Visegrad countries developed a strong private sector during the transition
process. In 2000, the private sector increased to more than 80% of the GDP in the
Visegrad countries with the exception of Poland where the private sector accounted for
70% of the GDP.
Second, in 1995 the private sector’s share of employment reached 75.5% of the
total employment in the Czech Republic, compared to 55-65% in the other Visegrad
countries. In terms of private sector development, the voucher method of privatization in
the Czech Republic succeeded because it helped the country overcome its backwardness
in terms of private sector development in comparison with the other Visegrad countries.
4. Enterprise Ownership Structure
There was widely known that the voucher method would lead to dispersed
ownership. The ownership concentration process that followed the voucher privatization
was successful because it resulted in ownership concentration similar to the United
Kingdom. However, the transparency of ownership concentration was a failure.
Approximately 72% of all points were placed into IPFs during the first wave. The
thirteen largest IPFs gained 56% of all points invested in the IPFs. After bidding, 66% of

82
all shares ended up in IPFs hands.233 The greater concentration of ownership during
voucher privatization was a positive development. In the Czech Republic, the IPFs played
an important role in ownership concentration. There were less severe restrictions on
corporate ownership and control. IPFs could invest up to 10% of their assets in a single
company and could hold up to 20% of the equity of a company compared to a limit of
around 5% in the EU.
Individuals that wanted to take advantage and convert their shares into cash as
soon as possible contributed to further ownership concentration. Who was purchasing
shares? It was those who were interested in the management of the firm such as
managers, IPFs, and investors. Shafik remarked that individual investors also formed
shareholder associations.234 The share of strategic investors having more than 30% of
shares in enterprises increased from only 7% in 1993 to 73% in 1997. The ownership
concentration in 1997 reached the level similar to the United Kingdom.235
In Czechoslovakia, large banks were the founders of the largest IPFs. Bank
sponsored investment funds gained 44% of all coupon points. 236 As a result, banks had
excessive economic power over firms and could control firms through the shares owned
by their funds. Banks, as the institutional owners, have monitored the firms’ performance
but they were not experts in enterprise management in different industry fields. The
majority of funds did not play an active role in the governance of enterprises. Created
circumstances, such as a group of funds owning the majority of shares in individual
firms, forced them to elect their representatives to Supervisory and Management Boards.
These representatives had to supervise and monitor the management’s performance.237
233 Evžen Kocenda, “The Current State of the Czech Privatization,” [19 February 2002], Available
[Online]: <http://www.mpo.cz/gc/0003/page0012.htm>, p. 2. 234 Nemat Shafik, Making a Market: Mass Privatization In the Czech and Slovak- Republics,
Washington D.C.: The World Bank, Policy Research Paper No. 1231, 1993, p. 25. 235 A World Bank Country Study No. 19306, “Czech Republic: Capital Market Review,” Washington
D.C.: World Bank, May 1999, p. 47. 236 Robert Cull, Jana Matesova and Mary Shirley, Ownership Structure and Temptation to Loot,
Evidence from Privatized Firms in the Czech Republic, Washington D.C.: The World Bank, Policy Research Paper No. 2568, 2001, p. 19.
237 Robert E. Anderson, “Voucher Funds in Transitional Economies: The Czech and Slovak Experience,” Washington D.C.: The World Bank, Policy Research Working Paper No. 1324, 1994, pp. 11-13.
83
The liberal regulatory framework was marked by lax supervision and a lack of
protection of the minority shareholder. The perception of the general public is that “the
process of ownership concentration was accompanied by non-transparent deals and price
manipulation.”238 Cull, Matesova and Shirley illustrated the presence of two perverse
behaviors of dominant owners and managers after privatization. First, efforts to acquire
greater income occurred through borrowing, looting and defaulting instead of through
profit maximizing efforts. Second, efforts were made to strip assets from privatized firms
and transfer them to their own firms or accounts. Such conduct was almost guaranteed
due to the weak protection of minority shareholders, weak enforcement of rules on
disclosure, virtual government guarantees and dogmatic credit allocation. 239
5. Emergence of a Competitive Free Market Environment
During the last decade, the Czech Republic successfully moved from a command
economy to a consolidated democracy and market economy that failed to implement
counter measures against corruption.
The Czech government led by Vaclav Klaus began the transition period with a
strong commitment to a free market economy and removed regulations in the security
market where government involvement is usually seen as essential. Despite political
changes started in 1997, the government was slow in enhancing transparency,
accountability and creating clear principles for its intervention in the economy. There are
still doubts about the security of property rights. Crime and corruption are their most
serious obstacles to free competition. 240
An EBRD and World Bank survey revealed that the average bribe as a percentage
of the annual revenue of the firms reached 4.5% in the Czech Republic compared to 3.7%
in Slovakia, 3.5% in Hungary and 2.5% in Poland. In contrast, the percentage of firms
frequently bribing or worse was more favorable for the Czech Republic. About 26.3% of
238 A World Bank Country Study No. 19306, “Czech Republic: Capital Market Review,” Washington
D.C.: World Bank, May 1999, p. 6. 239 Robert Cull, Jana Matesova and Mary Shirley, Ownership Structure and Temptation to Loot,
Evidence from Privatized Firms in the Czech Republic, The World Bank, Policy Research Paper 2568, 2001, p. 29.
240 A World Bank Policy Debate, “Anticorruption in Transition: Contribution to the Policy Debate,” Washington, D.C. World Bank, September 2000, Available [Online], < http://www1.worldbank.org/publicsector/anticorrupt/privatesector.htm> , p. 50.
84
firms pay bribes in the Czech Republic compared to 31.3% in Hungary, 32.7% in Poland
and 34.6% in Slovakia.241
The Czech Republic was ranked 42 out of 99 countries surveyed in Transparency
International’s 2000 Corruption Perceptions Index and received a score of 4.2. Since the
start of the transition process, only a very few anti corruption measures were
implemented in the Czech Republic.
The government agencies do not have formal codes of conduct. By law, the president, government ministers, the heads of both chambers of parliament, and other government officials may not participate in private business activities. Elected officials may engage in private business activities without any limitations. There are no restrictions on the participation of family members of government officials in business.242
From the start of economic reforms, the Czech Republic has made significant
progress in the emergence of a free market environment. In 1998, Freedom House
qualified the Czech Republic, Poland and Hungary as countries with consolidated
democracies and market economies.243
C. POSITIVE AND NEGATIVE OUTCOMES
1. Speed of Privatization
In terms of speed, the coupon scheme was successful. In contrast, it failed to
follow its original deadline. First, the major sources of delay were in the preparation and
review of privatization projects. Second, there was a natural delay in the transfer of
shares to the new owners caused by the partition of the former Czechoslovakia.244
Voucher privatization encompassed 1,849 enterprises in the Czech Republic with
a book value of 375.5 billion CZK. It was a great success compared to 1,670 firms in
Poland and 1,460 in Hungary. Shafik pointed out that the economic gains from speed are
241 “EBRD and World Bank Survey Reveals Intimate State-Enterprise Relations,” Transition
Newsletter, Volume 10, No. 6, Washington D.C.: The World Bank, December 1999, p. 9. 242 In the index, 10 represents the least level of corruption and 0 the highest level of corruption. A
Freedom House Report, “The Nations In Transit 1999-2000,” The Freedom House Inc., March 2001, Available [Online], http://www.freedomhouse.org/research/nitransit/2000/pdf_docs.htm, p. 167.
243 Adrian Karatnycky, “Nations in Transit: From Change to Permanence,” Freedom House, 1998, Available [Online],http://www.freedomhouse.org/nit98/, p. 2.
244 Eva Marikova, “Voucher Privatization in Czechoslovakia,” Comparative Economic Studies, Flushing: Fall 1993; Leeds, pp. 7-8.
85
more significant because it reduces the opportunities for asset stripping and spontaneous
privatization in the transition period.245
If privatization proceeds rapidly, the cost of current dislocation is quickly outweighed by the benefits of efficient use. A slow transition represents value of pain, but can increase cost as the private sector adjust to each step in the transition process. Delays in transfer of ownership rights can lead to asset stripping by contemporary management.246
In November 1991, a list of 2,744 medium and large-scale firms selected for the
first wave was published. Six months later the coupon scheme was prepared, privatization
projects selected and a list of firms included in the first wave was published. The bidding
process took longer than expected. It lasted eight months from May to December of 1992.
The whole cycle took 14 months for 1,491 firms. The second wave that involved 867
enterprises started in early 1994 and was successfully completely in March 1995.
2. Transparency
The transparency of the voucher scheme was critical for gaining wide public
support and participation in vouchers. However, the implementation of the voucher
method lacked transparency. The least transparent parts of the coupon scheme were
criticized for unfairness. First, the review and subjective evaluation of privatization
proposals left room for favoritism. Second, price setting by the price committee was
criticized because the auction method forced bidders to invest in overpriced shares. Third,
the discriminatory pricing rule was criticized for allowing the sale of shares of some
enterprises at different prices. Fourth, some people were left with unused points at the
end of the fifth round of bidding. The voucher system was not able to transfer all shares.
Fewer than 2% of coupon points were not transformed into shares.247
3. Distribution for Free
Critics of the free distribution of state assets assumed that it will not give new
owners incentives to manage freely acquired property, will lead to the immediate sale of
245 Nemat Shafik, Making a Market: Mass Privatization In the Czech and Slovak Republics,
Washington D.C.: The World Bank, Policy Research Paper No. 1231, 1993, pp. 20-21. 246 Eva Marikova, Voucher Privatization in Czechoslovakia, “Comparative Economic Studies,”
Flushing: Fall 1993; Leeds, p. 2. 247 Nemat Shafik, Making a Market: Mass Privatization In the Czech and Slovak- Republics,
Washington D.C.: The World Bank, Policy Research Paper No. 1231, 1993, pp. 22-23.

86
the shares and increased consumption of goods, and as a result, will unleash
hyperinflation.
Kyn illustrated that this anxiety is exaggerated and could result in a mild increase
in inflation, which could be prevented by a restrictive monetary policy. 248 However, the
results turned out better than expected. When the transfer of shares was completed only
about 7 to 15% of the participants decided to sell shares immediately. When people
cashed out shares to funds after one year, they were worth much more than they received.
A sudden increase in the supply of shares in the market temporarily reduced the market
price of the shares. About 53% of the participants kept all their shares and 19% of the
participants sold their shares.249
Kyn argues that by exchanging shares for vouchers, enterprises will not acquire
additional capital because the new capital for firms is acquired on primary financial
markets when savings are used to purchase newly issued equity. Privatization is a form of
an exchange of shares for vouchers or their sale for money. Privatization
is similar to secondary financial markets, where only changes in the owners of the existing capital take place. Even when the shares are sold for money, the newly privatized firm receives nothing, because all the proceeds from privatization go to the former owner, i.e. the State.250
4. Access to Information
The voucher method of privatization failed to provide symmetric information for
participants. Unofficial sources of information and prior knowledge about a firm’s
performance played a significant role in the first two rounds of bidding. Shafik has
empirical evidence that, in the first two rounds of bidding, public information about the
past performance of firms was important because private information about the firms was
not revealed.251 In the last rounds, asymmetric information played a decreasing role
because bidders learned from the bidding ways of others.
248 Oldrich Kyn, Market with Vouchers and Investment Funds, Prague, CERGE, 1992, Available [Online], <http://econc10.bu.edu/okyn/Okpers/Vouchers/vouchers1.htm>, February 19, 2002, p. 5.
249 Carol Graham, “Voucher Privatization in the Czech Republic.” Private Markets for Public Goods, Raising the Stakes in Economic Reform (Washington, D.C.: Brooking Institution Press, 1998), p. 233.
250 Oldrich Kyn, Market with Vouchers and Investment Funds, Prague, CERGE, 1992. http://econc10.bu.edu/okyn/Okpers/Vouchers/vouchers1.htm, February 19, 2002, p. 5.
251 Nemat Shafik, “Information and Price Determination under Mass Privatization,” Washington D.C.: The World Bank, Policy Research Working Paper No. 1305, 1994, p. 20.
87
On the one hand, the government actually provided information about enterprises
to the public. The Center for Coupon Privatization published an investor guide for
bidders to place their coupons but also warned the bidders about data quality and
relevancy due to the rapidly changing economic environment. In addition, the bidders had
an opportunity to use public information issued in newspapers.
On the other hand, they allowed the market to interpret the data. Judgment was
left to the wisdom of the coupon holders. “The fact that some people did have ‘insider
information’ about the true value of some enterprises was not considered a systemic bias,
particularly since such privileged information would often be revealed in the bidding
process.“252 The bidding results showed that the public used the information provided by
the government, because in bidding, participants preferred popular firms with high
profits. In addition, informal sources of information played a role. Shafik has evidence
that there was a large portion of sold shares for which the price determination could not
be explained by published information alone.253
5. Fairness
How fair was privatization itself? The voucher method was considered unfair as
well as the resultant outcomes. First, the voucher method led to an unequal distribution of
state assets to eligible citizens. Some of the participants received less value for their
coupons than did others. The average accounting value of assets per book in the first
wave was 35,000. However, those who invested in the investment funds had an
opportunity to gain 2,000-15,000 CZK. Individual investors tended to be more educated
and wealthier. For the less wealthy and educated, it was a means to earn a short-term
profit (2,000-3,000 CZK).
Second, the privatization of insolvent enterprises contributed to the criticism of
the voucher method. The insolvent firms had to advance with privatization that caused
some individuals and IPFs to obtain worthless shares. Although the actua l losses incurred
by shareholders were small as they paid only a nominal fee of 1,000 CZK per coupon
book, it negatively affected political support for privatization and the government’s
252 Nemat Shafik, “Making a Market: Mass Privatization In the Czech and Slovak Republics,” Washington D.C.: The World Bank, Policy Research Paper No. 1231, 1993, p. 21.
88
credibility.254 Thus, the government, instead of excluding or liquidating the non-
profitable parts of enterprises, allowed insolvent firms to participate in the voucher
privatization.
Third, although individual bidders gained from privatization, the winners were the
investment funds. It was clear that asymmetric information played an important role in
privatization. 255
6. Equity
The unique auction system used in voucher privatization was designed to
overcome limitations such as (a) a domestic financial market that was underdeveloped,
(b) a lack of useful assets pricing signals, and (c) a lack of appropriately trained analysts
for enterprise evaluation. Harper demonstrated evidence about pricing and equity
distribution during voucher privatization. He examined the determinants of the share
pricing system used for the auction of shares in the Czech Republic. The resultant
document shows that share valuation and demand in the auction were based on
characteristic such as (a) return on sales, (b) sales growth, and (c) ownership structure.
While share prices undershoot or overshoot in the early rounds, they get close to
equilibrium in the last rounds of bidding.256
The objective of equity was achieved by establishing a process that was largely transparent and created a level playing field for all potential buyers of shares through the coupon scheme. There was no systematic bias in share allocations in favor of "insiders" (either management or workers).257
7. Role of Investment Funds
a. The Positive Results
The first positive outcome of the voucher method was the initial
appearance of privatization funds. More than 400 funds were established in the voucher
253 Nemat Shafik, “Information and Price Determination under Mass Privatization,” Washington D.C.: The World Bank, Policy Research Working Paper No. 1305, 1994, p. 20.
254 Nemat Shafik, Making a Market: Mass Privatization In the Czech and Slovak Republics, Washington D.C.: The World Bank, Policy Research Paper No. 1231, 1993, p. 23.
255 Carol Graham, “Voucher Privatization in the Czech Republic.” Private Markets for Public Goods, Raising the Stakes in Economic Reform (Washington, D.C.: Brooking Institution Press 1998), p. 200.
256 Joel T. Harper, “Equity Valuation in the Czech Voucher Privatization Auctions,” Financial Management, Tampa, Winter 2000, p. 14.
89
privatization process. This situation boosted opportunities for the development of free
market competition. The second positive outcome was that approximately 72% of all
points were placed into IPFs in the first wave and 64% in the second wave. These results
had a positive outcome on ownership concentration.
Shafik predicted that IPFs would play a key role in enterprise restructuring
and will be under enormous pressure to fulfill their promises of quick returns and to
distribute dividends to shareholders. He warns that it may result in decisions weakening
long term restructuring and jeopardizing minority shareholders.258
The Czech government hesitated and moved slowly in the implementation
of regulations for investment funds.
To reduce self dealing and conflict of interest when a fund buys or sells shares, the Czech and Slovak Republics require that the price paid for shares must be no higher than the current market price and the price received for shares must be no lower the current market price.259
b. The Undesirable Results
The Czech Republic did not learn from U.S. history that regulation of
investment funds is essential. At the beginning of a privatization process, strict rules
about information disclosure and penalties for fraud and misappropriation are essential
because unethical administrators of funds appear and try to benefit at the expense of
small investors.260 As a result of loose regulatory measures, some funds started to loot or
tunnel261 assets from privatized firms.262
257 Nemat Shafik, “Making a Market: Mass Privatization In the Czech and Slovak Republics,”
Washington D.C.: The World Bank, Policy Research Paper No. 1231, 1993, p. 21. 258 Ibid., p. 25. 259 Robert E. Anderson, “Voucher Funds in Transitional Economies: The Czech and Slovak
Experience,” The World Bank, Policy Research Working Paper No. 1324, 1994, p. 39. 260 Oldrich Kyn, Market with Vouchers and Investment Funds, Prague, CERGE, 1992, Available
[Online], <http://econc10.bu.edu/okyn/Okpers/Vouchers/vouchers5.htm>, February 19, 2002, p. 2. 261 Tunneling is an undesirable transfer of assets and profits out of enterprises for the benefit of
controlling shareholders. 262 How does looting and tunneling occurs? “Funds can be extracted by owners paying themselves
large dividends or high salaries, or the firm making loans or investments in straw companies set up by owners, buying assets from the straw at inflated prices or selling assets at deep discounts, or making concessional loans to owners.” Poor accounting, lax regulation and low penalties for abuse enables emergence of looting as well as tunneling. See Robert Cull, Jana Matesova and Mary Shirley, “Ownership structure and Temptation to Loot: Evidence from Privatized Firms in the Czech Republic,” Washington D.C.: The World Bank, Policy Research Paper 2568, 2001, p. 6.
90
Funds could employ four types of undesirable behavior during privatization:
monopolization, shrinking, self-dealing and high-risk investments.263
• Monopolization. A fund may acquire controlling ownership in several firms from the same industry or market and later influence them to move from competition to cooperation
• Shrinking. Fund and company managers may shrink their responsibilities and allow the shareholders value reduction on behalf of the funds assets
• Self-dealing. Fund managers make themselves richer or support the interests of others on behalf of the fund shareholders
• High-risk investments. Fund managers are engaged in high-risk investment strategies
Cull, Matesova and Shirley provided empirical evidence that the fund-controlled
joint stock companies under-performed all other firms such as foreign-owned joint stock
companies, domestic joint stock companies not controlled by funds and limited liability
companies, and took liabilities at a faster rate than other firms. This fund-governance
failure can be explained by the existence of looting. They stress that the performance of
fund-controlled joint stock companies in 1996 was considerably worse than in 1993-
1994.264
Anderson in 1994 praised Czechoslovak Ocean Shipping as an example of a
successful enterprise. After the first wave of privatization, four funds owned more than
50% of the company and 30% remained in the state-owned firm FINOP. When the funds
took over control they started to look for short-term gains. In contrast, managers
preferred long-term growth and an expansion strategy. 265 The end result was a disaster
for this profitable enterprise.
263 Robert E. Anderson, Voucher Funds in Transitional Economies, The Czech and Slovak
Experience, The World Bank, Policy Research Working Paper No. 1324, 1994, pp. 26-30. 264 Robert Cull, Jana Matesova and Mary Shirley, “Ownership Structure and Temptation to Loot,
Evidence from Privatized Firms in the Czech Republic,” Washington D.C.: The World Bank, Policy Research Paper 2568, 2001, pp. 26 and 30. The authors examined 392 firms and made 1,017 observations during 1993-1996.
265 Robert E. Anderson, “Voucher funds in transitional Economies: The Czech and Slovak Experience, “Washington D.C.: The World Bank, Policy Research Working Paper No. 1324, 1994, p. 24.
91
VI. CONCLUSION
A. SUMMARY
Privatization became the keystone for stabilization and transformation. It was the
most observed and complicated part of the stabilization and transformation process. The
Czech government used an unique privatization method to (a) speed up privatization
because the private sector was almost non-existent (b) distribute a significant part of state
owned assets for free to gain greater public support for transformation (c) destroy the
communist institutional order and (d) create political and economic stability.
The coupon privatization method fit in the radical strategy of transition from a
command economy to a free market economy. In two waves, from October 1991 to
March 1995, 1,810 state-owned enterprises were privatized. The government committed
about 300 billion CZK of state owned assets to the first wave and 155 billion CZK to the
second wave. Public participation in the first wave reached 75% of all eligible citizens
and 80% in the second wave. Approximately 353 investment funds emerged during both
waves. The percentage of shares allocated to funds decreased from 72.5% to 64%. The
ten largest funds established by domestic financial institutions controlled 23.6% of the
privatized assets.
At the end of the voucher privatization process, the private sector encompassed
66.5% of the economy compared to 65% in Hungary, 62% in Slovakia and 59% in
Poland. However, the government still kept its majority shares or stakes in large and
strategic corporations and postponed the privatization of the banking sector. Various
restrictions hindered the entry of foreign investors due to the awareness of the cheap sale
off of attractive state assets.
The start of privatization was more favorable for Poland and Hungary that
preferred a gradual pace of transition. Both countries first restructured the state owned
enterprises then privatized them. The Polish approach was based on the adoption of
traditional time-consuming methods of privatization. By the end of 1995, privatization
had started in 3,515 enterprises and was completed in 1,670 out of 8,441 enterprises
devoted to privatization. In the early years of the trans ition process, Poland generated
92
relatively low revenue from privatization but this significantly increased as the
privatization process advanced.
In Hungary, which preferred the sale of assets rather than distribution for free, the
privatization of state enterprises advanced very slowly. However, the privatization
process dramatically accelerated in 1995. By the end of 1995, the privatization revenue
mainly acquired from foreign investors amounted to HUF 917 billion. Even so, the state
retained its majority stakes in 441 enterprises. Among them, 24 were considered as
strategic with a value of HUF 1,007 billion.
Findings disapprove that there was a Czech economic miracle because the
macroeconomic performance of the Czech Republic was to some extent similar to that of
other Visegrad countries. Within the last decade, the Czech government outperformed its
neighbors in terms of lower inflation, a more balanced current account and
unemployment until1998. In contrast, the growth rate and direct foreign investment were
less favorable for the Czech Republic. From the lowest level of economic growth,
achieved from the beginning of the transition process to 1998, the Polish economy grew
by 42.5% of the GDP compared to 32.9% in Slovakia, 16.2% in Hungary and 12.7% in
the Czech Republic. Industrial restructuring hardly occurred during the last decade and
has not reached the previous level of 1990. During 1991-1997, Hungary received the
greatest inflow of direct foreign investments mainly from privatization.
The success in liberalization and small-scale privatization helped the Czech and
Slovak Republics to reach the same level as Poland and Hungary by the end of 1992.
Since then no significant differences have appeared among them. The Czech Republic
experienced the fastest growing private sector among the Visegrad countries, and mainly
as a result of the faster pace of privatization. By the end of 1995, the private sector
comprised 66.5% of the economy compared to 65% in Hungary, 62% in Slovakia and
59% in Poland. During 1989-1995, employment in the Czech private sector grew from
16% in 1989 to 75.5%. In 1995, private sector employment in Slovakia grew to 55%, in
Hungary to 65% and in Poland to 66% of total employment.
At the end of 2000, the Hungarian government completed the privatization
process but retained its ownership in 175 enterprises with a value of HUF 800 billion,

93
while 1,230 were privatized and 740 closed down. In contrast, in Poland, by the end of
2001, the number of state owned enterprises was still high at 2,054. In 106 enterprises,
the Polish government retained more than 50% of the shares. Privatization in Poland by
traditional methods proved to be successful in terms of completed privatization, reliable
corporate governance and good economic performance. The Polish government expects
privatization to be completed by the end of 2002.
Implementation of the voucher method helped the Czech Republic rapidly
progress in the privatization of state-owned assets. In contrast, bank privatization
proceeded slowly. At the end of 1997, the value of privatized assets accounted for CZK
700 billion. The state’s share in the banking sector accounted for 84% of the banking
sector. A large amount of strategic assets are still to be privatized. In 1999, the Czech
government accelerated structural reforms and privatization. At the end of June 2001,
privatization of the banking sector was completed.
How successful was voucher privatization? First, the coupon method was
successful in meeting the Czech government’s objectives. It was successful in (a) the fast
transformation of property rights from the state to private owners, (b) gaining wide pubic
support for privatization, and (c) preventing foreigners from dominating the privatization
process. However, it failed to improve the performance and governance of privatized
enterprises.
Second, the voucher method was successful in meeting some of the objectives
recognized by liberal economists. It was successful in (a) private sector development, (b)
emergence of ownership concentration similar to the United Kingdom, and (c)
transformation from a command economy to consolidated market economy. In contrast, it
failed (a) to maximize revenue collection from privatization, (b) because it had a mainly
negative impact on efficiency in privatized firms due to delayed structural reforms, and
(c) to implement counter measures against corruption.
Third, the coupon method was successful in (a) in terms of the speed of
denationalization (b) the free distribution of state assets that did not unleash
hyperinflation, (c) developing a good system for equity distribution, and (d) the
emergence of a large number of privatization funds. However, it failed (a) to follow its
94
original deadline, (b) to create regulatory measures against looting, tunneling and other
undesirable behavior (c) to provide asymmetric information to participants, (d) to be fair
as far as the resultant outcomes were concerned, and (e) because it lacked transparency.
B. RECOMMENDATIONS
What is to be learned from this research? First, the radical privatization method
helps to speed up privatization but leaves the structural reforms to the new owners.
Second, direct sale methods bring a significant inflow of foreign direct investments.
Third, the population favors more distribution of state assets than sales to foreign
investors. Fourth, the implementation of the voucher method does not significantly
impact macroeconomic performance. Fifth, delays in bank privatization extend the
influence of the state in newly privatized enterprises and delays the structural reforms in
privatized companies.
Although the voucher privatization method failed to fulfill some of the objectives
recognized by government and liberal economists, it was demonstrated to be not only a
theoretical construct but also a practical device for denationalization. It illustrated that (a)
it is possible to convert a large amount of state assets to private hands in a short period of
time (b) it could gain wide public support from participants and (c) it enabled a
government to speed up the transition process.
There were, however, some limitations to the voucher method in the Czech
Republic. For those countries interested in trying to implement this method it is necessary
(a) to restructure less viable state-owned enterprises (b) to create regulatory measures
against looting, tunneling and other undesirable behavior (c) to focus more on profit
maximization (d) to enable wider participation by foreign investors, and (e) to implement
standard bankruptcy procedures.
Although the implementation of the voucher method was criticized, it was a real
challenge for the Czech government. First, the private sector was almost non-existent.
Second, it was a new approach to privatization. Third, a new inexperienced government
implemented it. Fourth, there was no previous experience with such a large transfer of
state assets. Fifth, foreign advisors were inexperienced and had limited advice available
as to what to do and how to do it.
95
Privatization was the most observed and complicated part of the stabilization and
transformation process in the Visegrad countries. It was difficult to accomplish but it was
extremely powerful in destroying the prior institutional order. The rapid as well as
moderate pace of privatization produced the expected results. It showed that the process
of implementation might play a more significant role than the implemented method itself.
The following are some recommendations for further research. For a better
understanding of privatization in Eastern Europe, it would be beneficial to examine (a)
the effects of privatization on income distribution (b) the effects of corruption on
privatization, and (c) the extent of the state’s intervention in newly privatized firms.

96
THIS PAGE INTENTIONALLY LEFT BLANK

97
SELECTED BIBLIOGRAPHY
A Freedom House Report, “The Nations in Transit 1999-2000.” The Freedom House Inc., March 2001, Available [Online], <http://www.freedomhouse.org/research/nitransit/2000/pdf_docs.htm>. Ahrens, J., Toward a Post-Washington Consensus: The Importance of Governance Structures in Less Developed Countries and Economies in Transition. Available [Online]: <http://www.sigov.si/zmar/apublici/iib/iib0400/08-ahren.pdf>. Anderson, R. E., “Voucher Funds in Transitional Economies: The Czech and Slovak Experience,” Washington D.C.: The World Bank, Policy Research Working Paper No. 1324, 1994. An “EBRD and World Bank Survey Reveals Intimate State-Enterprise Relations,” Transition Newsletter, Volume 10, No. 6. Washington D.C.: The World Bank, December 1999. An EBRD Investment Profile, “Czech Republic Investment Profile,” London: European Bank for Research and Development (EBRD), April 2001, Available [Online], <http://www.mac.doc.gov/eebic/countryr/czechr.htm>. An EBRD Investment Profile, “Hungary Investment Profile,” London: European Bank for Research and Development (EBRD), April 2001, Available [Online], <http://www.mac.doc.gov/eebic/countryr/hungary.htm>. An EBRD Investment Profile, “Poland Investment Profile,” London: European Bank for Research and Development (EBRD), April 2001, Available [Online], <http://www.mac.doc.gov/eebic/countryr/poland.htm>. An EBRD Investment Profile, “Slovak Republic Investment Profile,” London: European Bank for Research and Development (EBRD), April 2001, Available [Online], http://www.mac.doc.gov/eebic/countryr/slovakr.htm. A Paper by the State Audit Office, “Privatization in Hungary 1990-2000,” Budapest: The State Audit Office, Hungary. Presented to INTOSAI Working Group, June 11-12, 2001, Available [Online], <http://www.nao.gov.uk/intosai/wgap/8thmeeting/8thhungary2.htm>. Appel H., “The Ideological Determinants of Liberal Economic Reform: The Case of Privatization,” World Politics, The Johns Hopkins University Press, 2000, Available [Online], <http://muse.jhu.edu/journals/world_politics/v052/52.4appel.html>. A Regular Report on the Czech Republic’s Progress Toward Accession: 1999, Commission of the European Communities, October 13, 1999, Available [Online], <http://europa.eu.int/comm/enlargement/czech/>.
98
A “Regular Report on the Czech Republic’s Progress Toward Accession: 2001,” Commission of the European Communities, November 13, 2001, Available [Online], <http://europa.eu.int/comm/enlargement/czech/>. A “Regular Report on Hungary’s Progress Toward Accession: 1998,” Commission of the European Communities, November 1998, Available [Online], <http://europa.eu.int/comm/enlargement/hungary/index.htmp>. A “Regular Report on Hungary’s Progress Toward Accession: 1999,” Commission of the European Communities, October 13, 1999, Available [Online], <http://europa.eu.int/comm/enlargement/hungary/index.htmp>. A “Regular Report on Hungary’s Progress Toward Accession: 2000,” Commission of the European Communities, November 8, 2000, Available [Online], <http://europa.eu.int/comm/enlargement/hungary/index.htmp>. A “Regular Report on Hungary’s Progress Toward Accession: 2001,” Commission of the European Communities, November 13, 2001, Available [Online], <http://europa.eu.int/comm/enlargement/hungary/index.htmp>. A “Regular Report on Poland’s Progress Toward Accession: 1998,” Commission of the European Communities, November 1998, Available [Online], <http://europa.eu.int/comm/enlargement/poland/index.htm>. A “Regular Report on Poland’s Progress Toward Accession: 1999,” Commission of the European Communities, October 13, 1999, Available [Online], <http://europa.eu.int/comm/enlargement/poland/index.htm>. A “Regular Report on Poland’s Progress Toward Accession: 2000,” Commission of the European Communities, November 8, 2000, Available [Online], <http://europa.eu.int/comm/enlargement/poland/index.htm>. A “Regular Report on Poland’s Progress Toward Accession: 2001,” Commission of the European Communities, November 13, 2001, Available [Online], <http://europa.eu.int/comm/enlargement/poland/index.htm>. A “Regular Report on Slovak’s Progress Toward Accession: 1998,” Commission of the European Communities, November 1998, Available [Online], <http://europa.eu.int/comm/enlargement/slovakia/index.htm>. A “Regular Report on Slovak’s Progress Toward Accession: 1999,” Commission of the European Communities, October 13, 1999, Available [Online], <http://europa.eu.int/comm/enlargement/slovakia/index.htm>.

99
A “Regular Report on Slovak’s Progress Toward Accession: 2000,” Commission of the European Communities, November 8, 2000, Available [Online], <http://europa.eu.int/comm/enlargement/slovakia/index.htm>. A Review of Poland's Privatization Methods, Central and Eastern Europe Business Information Center (CEEBIC), June 1997, Available [Online], <http://www.mac.doc.gov/eebic/pub/plfp/1197/priv.htm>. A World Bank Country Study No. 19306, “Czech Republic: Capital Market Review,” Washington D.C.: World Bank, May 1999. A World Bank Country Study, No. 19650, “Czech Republic: Toward EU Accession,” Main Report”, Washington, D.C.: The World Bank, 1999. A World Bank Country Study, No. 19923, “Hungary on the Road to the European Union,” Washington D.C.: The World Bank, November 1999. A World Bank Country Study, No. 21440, “Czech Republic: Completing the Transformation of Banks and Enterprises,” Washington D.C.: The World Bank, November 2000. A World Bank Discussion Paper, No. 104, “Eastern European Experience with Small-Scale Privatization,” Washington, D.C.: The World Bank, April 1994. A World Bank Policy Debate, “Anticorruption in Transition: Contribution to the Policy Debate,” Washington, D.C. World Bank, September 2000, Available [Online], < http://www1.worldbank.org/publicsector/anticorrupt/privatesector.htm>. Borish, M. S., and Noel, M., “Private Sector Development during Transition: The Visegrad Countries,” World Bank Discussion Paper No. 318, Washington D.C.: The World Bank, February 1996. Canning A., and Hare, P., “Political Economy of Privatization in Hungary: A Progress Report,” Centre for Economic Reform and Transformation, Edinburgh: Heriot-Watt University, September 1996. Cata, E. H., Price Liberalization, Money Growth, and Inflation during the Transition to a Market Economy, International Monetary Fund, African Department, Working Paper No. 76, June 1999. Cull, R., Matesova J., and Shirley, M., Ownership Structure and Temptation to Loot, Evidence from Privatized Firms in the Czech Republic, Washington: The World Bank, Policy Research Paper 2568, 2001.
100
Claessens S., Djankov S. and Pohl G., “Ownership and Corporate Governance: Evidence from the Czech Republic,” Public Policy for the Private Sector, Washington D.C.: The World Bank Group, Note No. 111, May 1997. Denizer, C., “Stabilization, Adjustment and Growth Prospects in Transition Economies,” World Bank Working Paper No. 1955, Washington D.C.: The World Bank, February 1997. Earle, J. S., Frydman, R., Rapaczynski A., and Turkewitz, J., “Small Privatization: The Transformation of Retail trade and Consumer Services in the Czech Republic, Hungary and Poland”. New York: Central European University Press, 1994. Earle, J. S., Frydman R., Rapaczynski A., and Turkewitz, J., “Eastern European Experience with Small-Scale Privatization.” CFS: Discussion Paper, No. 104. The World Bank: New York, 1999. Egerer, R., “Capital Markets, Financial Intermediaries, and Corporate Governance: An Empirical Assessment of the Top Ten Voucher Funds in the Czech Republic,” New York: The World Bank, Policy Research Paper No. 1555, 1995. Ellerman D., “Lessons from East Europe’s Voucher Privatization,” Washington D.C.: The World Bank, August 2001, Available [Online]: <http://cog.kent.edu/lib/Ellerman5.htm>. Estrin, S., “Privatization in Central and Eastern Europe,” Centre for Economic Reform and Transformation, London, 1996, September 1, 2001, Available [Online]: <http://www.hw.ac.uk/ecoWWW/cert/wpa/1996/dp9605.pdf>. Fisher S. and Sahay R., “The Transition Economies after Ten Years,” Cambridge: National Bureau of Economic Research, Inc., 2000. Working Paper No. 7664, HB 141.N33 No. 7664, 2000. Gesell, R., Müller K., and Süß, D., “Social Security Reform and Privatisation in Poland: Parallel Projects or Integrated Agenda?” Frankfurt Institute for Transformation Studies (FIT), Discussion Paper No. 8, 1998. Gomulka, S., “Ten Years in Retrospect: Secrets of Successful Macroeconomic Policies,” Transition Newsletter, The World Bank/The William Davidson Institute, Vol. 11, No. 5, August-October 2000. Graham, C., “Voucher Privatization in the Czech Republic,” Private Markets for Public Goods: Raising the Stakes in Economic Reform, Washington, D.C.: Brooking Institution Press, 1998. Harper, J. T. “Short-Term Effects of Privatization on Operating Performance in the Czech Republic,” The Journal of Financial Research, Tempe: Spring 2001.

101
Hazlett W. T., “Velvet Devolution,” American Enterprise Institute for Public Research, Articles, March 1998, Available [Online]: < http://www.aei.org/ra/rahazlett74.htm>. Hovorka J. and Galgoczi B., “Employee Ownership in Hungary: The Role of Employers’ and Workers’ Organizations,” International Labor Organization, Available [Online], <http://www.ilo.org/public/english/employment/ent/papers/ippred11.htm>. IMF Staff Country Report No. 00/119, “Czech Republic: Statistical Appendix,” Washington D.C.: International Monetary Fund, September 2000. Kalus-Bystricky I. and Pick J.P., “The Reform Process in Czechoslovakia and the Czech Republic: a Progress Report and the Tale of One Company,” Privatization and Economic Development in Eastern Europe and the CIS, Investment, Acquisition and Managerial, John Willey and Sons Ltd, New York 1994. Kaminski, B., and Riboud, M., “Foreign Investment and Restructuring: The Evidence from Hungary,” Washington D.C.: The World Bank, Technical Paper No. 453, March 2000. Karatnycky, A., “Nations in Transit: From Change to Permanence,” Freedom House, 1998, Available [Online], <http://www.freedomhouse.org/nit98/>. Klaus, V., “A Perspective on Economic Transition in Czechoslovakia and Eastern Europe.” Keynote Address, Washington D.C.: The World Bank, Annual Conference, 1990. Kocenda, E., “The Current State of the Czech Privatization,” [19 February 2002], Available [Online]: <http://www.mpo.cz/gc/0003/page0012.htm>. Krejcí, O., “Economic Transition,” Czechoslovak National Interests: A Historical Survey of Czechoslovak National Interests and Relations on the Demise of Czechoslovak Communism, New York: Columbia University Press, 1996. Kyn, O., “Market with Vouchers and Investment Funds,” Prague: CERGE, 1992, Available [Online]: <http://econc10.bu.edu/okyn/Okpers/Vouchers/vouchers1.htm>, February 19. Laštovicka R., “Investment Behavior in the Czech Voucher Privatization,” Prague: CERGE, August 1993. Mackay, S., “Czech Republic.” Price Water House, Available [Online], March 2002, <http://www.pwcglobal.com/extweb/frmclp11.nsf/DocID/073A4DD123144BF685256B6D008078D5?OpenDocument>. Marikova, E., “Voucher Privatization in Czechoslovakia,” Comparative Economic Studies, Flushing: Fall 1993; Leeds.

102
Megginson L. W. and Netter M. J., “From State to Market: A Survey of Empirical Studies on Privatization,” Journal of Economic Literature, Vol. XXXIX (June 2001). Ministry of Treasury, Poland, Department of European Integration and Foreign Relations, Privatisation Quarterly, January - December 2001, March 2002, Available [Online], <www.msp.gov.pl>. Nellis, J., “External Advisors & Privatization in Transition Economies,” Washington: The World Bank, Working Paper No. 3, February 2002. Nellis, J. “Privatization and Enterprise Reform in Transition Economies: A Retrospective Analysis,” Washington D.C.: The World Bank, 2002. Oswald, S. L., “Economic Transition in the Czech Republic,” Administration & Society; Beverly Hills, July 2000. Przeworski, A., “The Political Dynamics of Economic Reform,” Democracy and the Market: Political and Economic Reforms in Eastern Europe and Latin America. Cambridge: Cambridge University Press, 1991. Schusselbauer, G., “Privatization and Restructuring in Transition: Theory and Evidence Revisited,” Europe – Asia Studies, Abingdon, January 1999. Shafik, N., “Information and Price Determination under Mass Privatization.” Washington D.C.: The World Bank, Policy Research Working Paper No. 1305, 1994. Shafik, N., Making a Market: Mass Privatization In the Czech and Slovak Republics, Washington D.C.: The World Bank, Policy Research Paper No. 1231, 1993. Skalnik C. L., “The Velvet Revolution of 1989 and the Politics of Democratization,” The Czech and Slovak Republics: Nation versus State (Boulder, Colorado: Westview Press, 1997). Spicer, A. McDermott, G., and Kogut, B. “Entrepreneurship and Privatization in Central Europe: The Tenuous Balance Between Destruction and Creation,” The Wharton School University of Pennsylvania, A Working Paper of the Reginald H. Jones Center, No. 04, August 1999. Švejnar J., and Singer M., “Using Vouchers to Privatize an Economy: the Czech and Slovak Case,” Economics of Transition, Volume 2 (I), 1994. “The Current State of the Czech Privatization”, Czech Business and Trade, February 19, 2002, Available [Online]: http://www.mpo.cz/gc/0003/page0012.htm. Vinton, L., “Privatization in Poland: A Statistical Picture,” Available [Online], <http://ciesin.ci.uw.edu.pl/poland/privatizationintro.html>.

103
Voszka, E. “Privatization in Hungary: Results and Open Issues,” Economic Reform Today: Privatization in the Digital Age, Number 2, 1999, Available [Online], <http://www.cipe.org/ert/e32/e32_03.php3>.

104
THIS PAGE INTENTIONALLY LEFT BLANK

105
INITIAL DISTRIBUTION LIST
1. Defense Technical Information Center Fort Belvoir, Virginia
2. Dudley Knox Library Naval Postgraduate School Monterey, California
3. Professor Robert E. Looney Naval Postgraduate School Monterey, California
4. Professor Peter C. Frederiksen Defense Resource Management Institute
Monterey, California
5. Scott W. Salyers Army Attaché Tržní 15
118 01 Praha 1 Czech Republic
6. Ladislav Svitek
Frycajova 8 614 00 Brno Czech Republic