Embed Size (px)
Citation preview
Providing High and Predictable Performance in Multicore Systems
Through Shared Resource Management
Thesis Defense
Lavanya Subramanian
1
Committee:Advisor: Onur Mutlu
Greg GangerJames Hoe
Ravi Iyer (Intel)
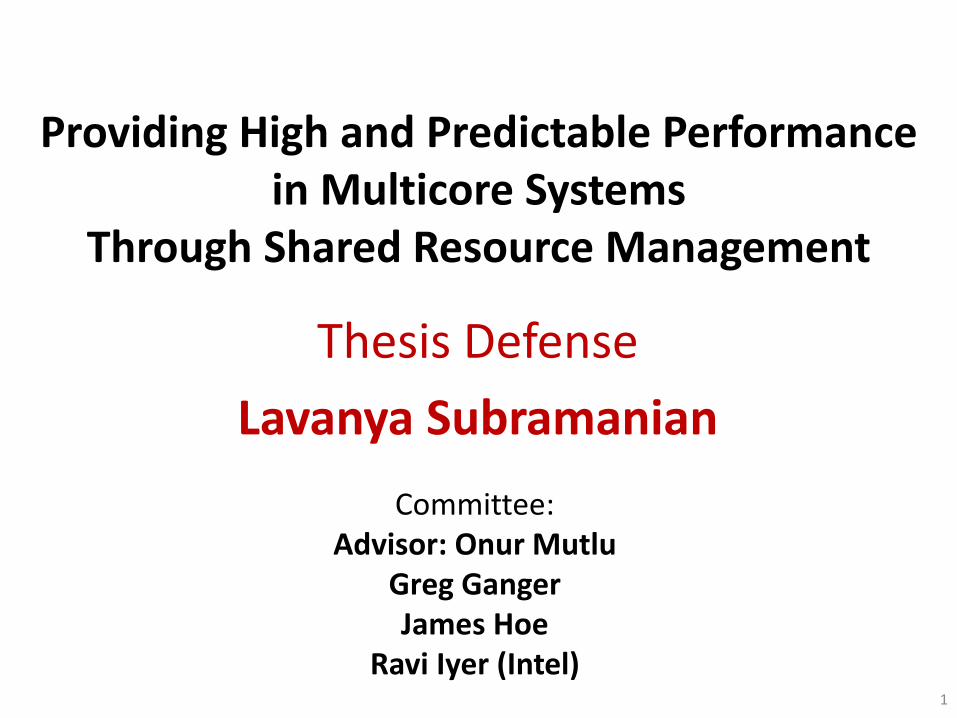
The Multicore Era
2
Main MemoryCacheCore
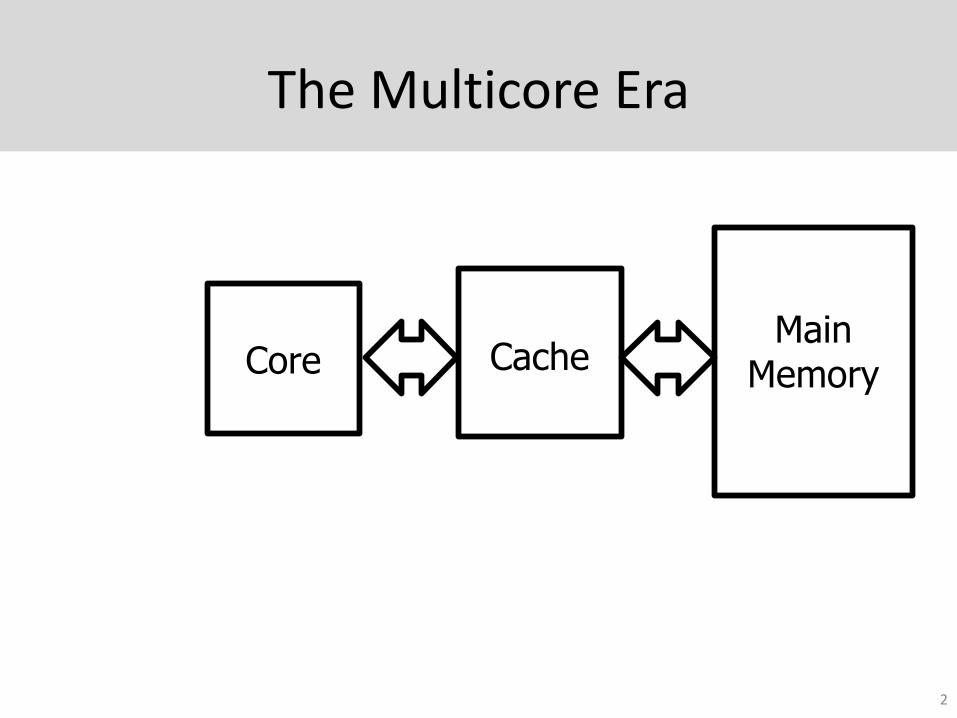
The Multicore Era
3
Main Memory
Shared Cache
CoreCore
CoreCore
Interconnect
Multiple applications execute in parallelHigh throughput and efficiency
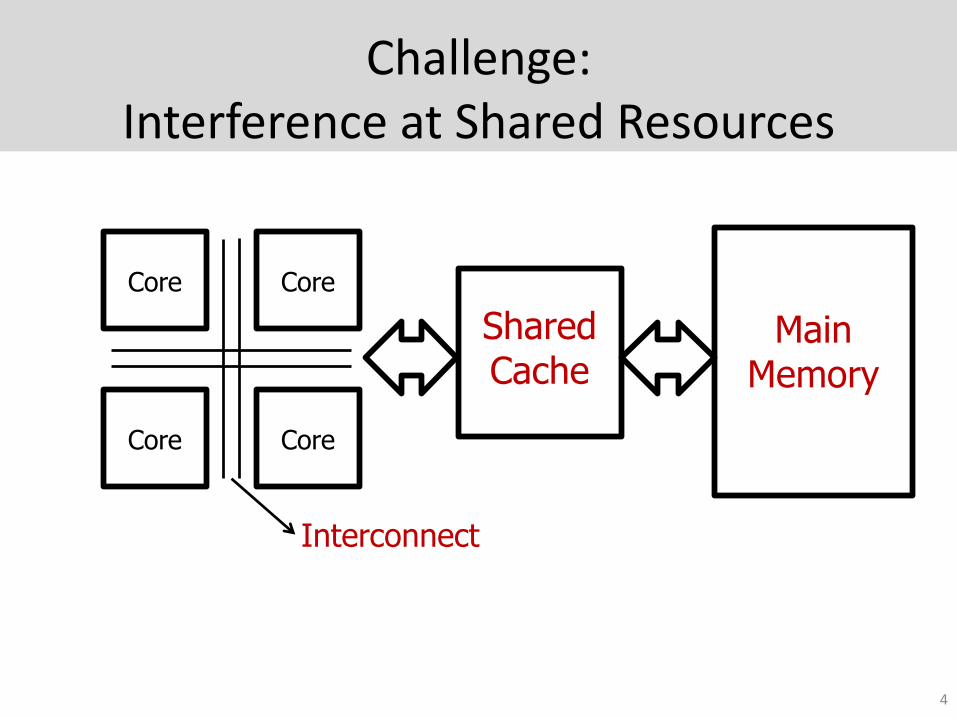
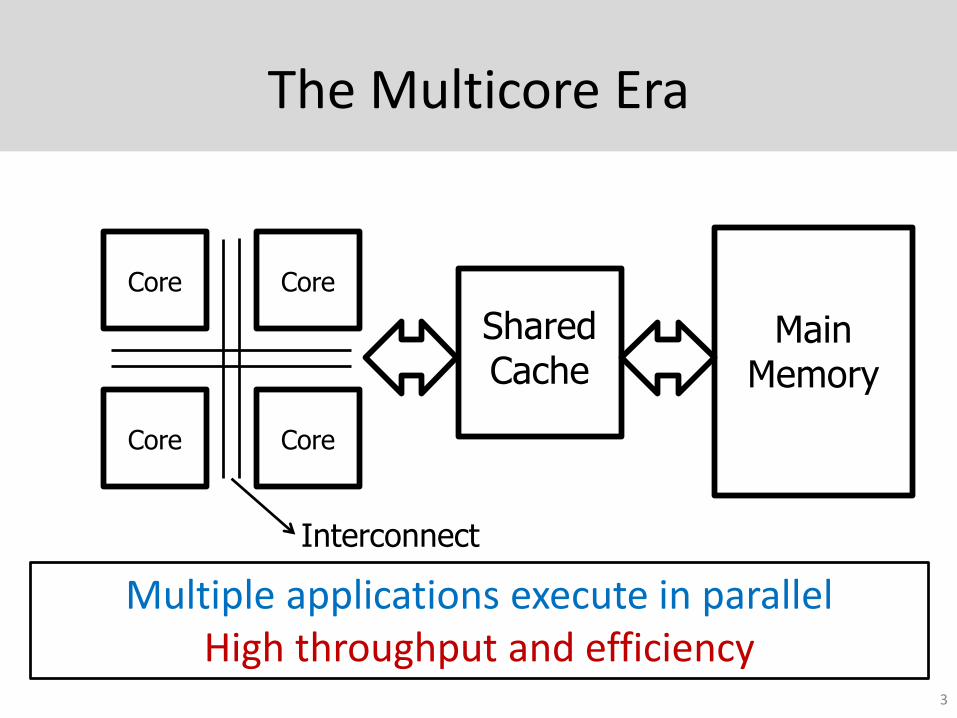
Challenge:Interference at Shared Resources
4
Main Memory
Shared Cache
CoreCore
CoreCore
Interconnect
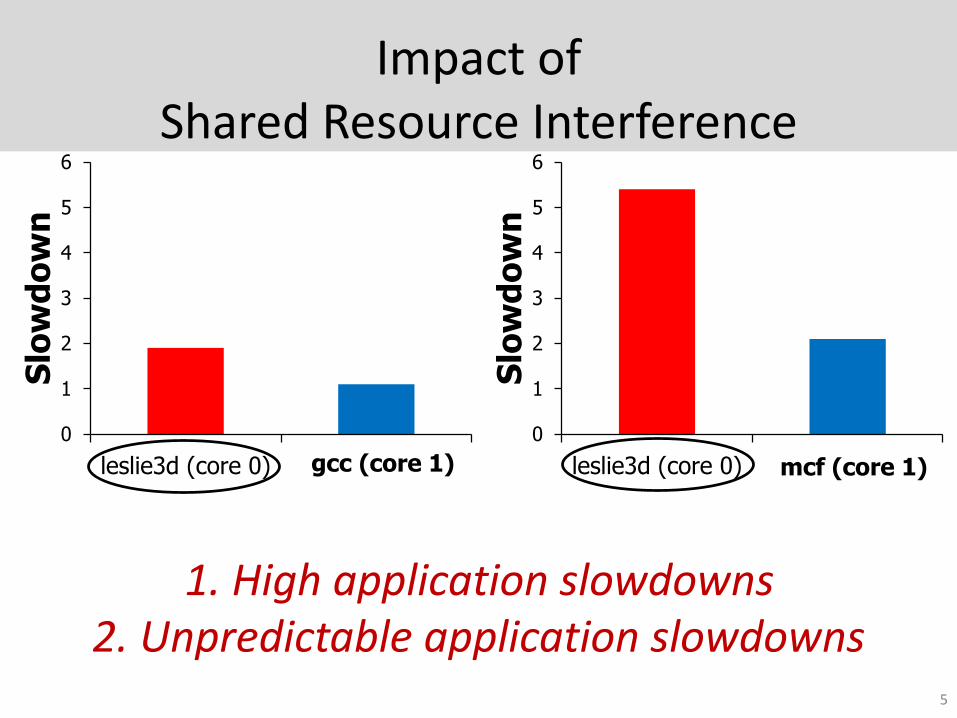
Impact of Shared Resource Interference
0
1
2
3
4
5
6
leslie3d (core 0) gcc (core 1)
Slo
wd
ow
n
0
1
2
3
4
5
6
leslie3d (core 0) mcf (core 1)
Slo
wd
ow
n
2. Unpredictable application slowdowns1. High application slowdowns
5
gcc (core 1) mcf (core 1)
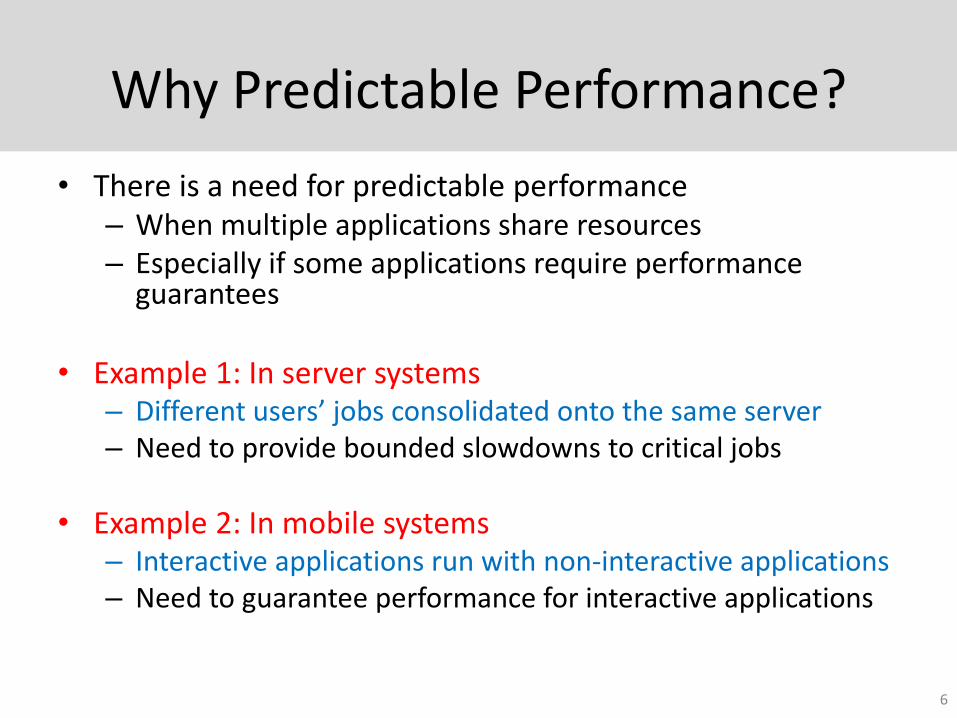
Why Predictable Performance?
• There is a need for predictable performance– When multiple applications share resources – Especially if some applications require performance
guarantees
• Example 1: In server systems– Different users’ jobs consolidated onto the same server– Need to provide bounded slowdowns to critical jobs
• Example 2: In mobile systems– Interactive applications run with non-interactive applications– Need to guarantee performance for interactive applications
6
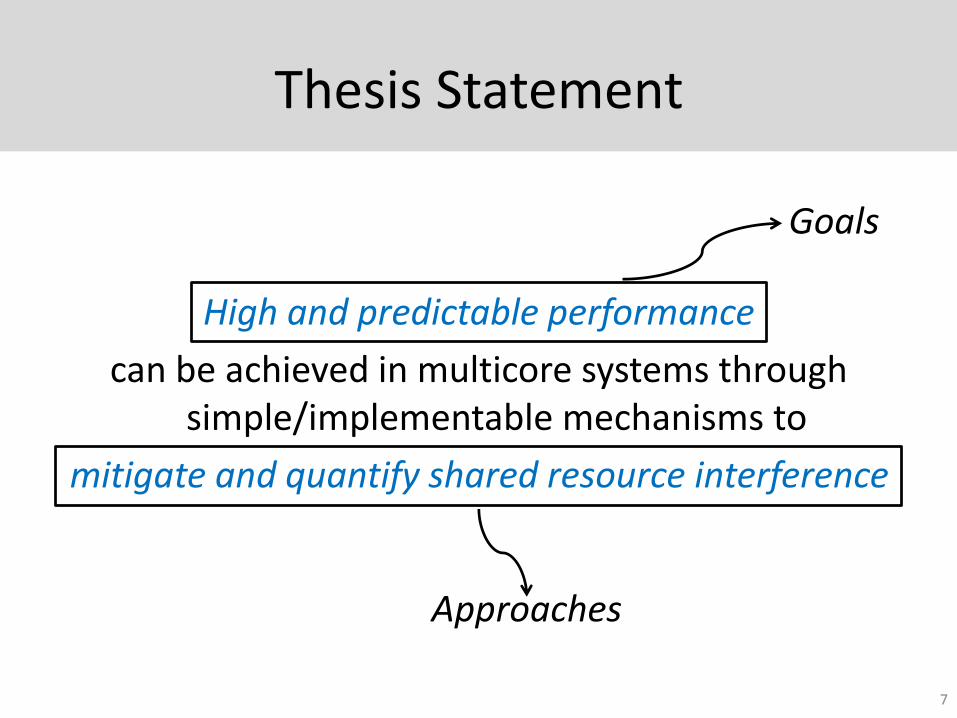
Thesis Statement
High and predictable performance
can be achieved in multicore systems through simple/implementable mechanisms to
mitigate and quantify shared resource interference
7
Goals
Approaches
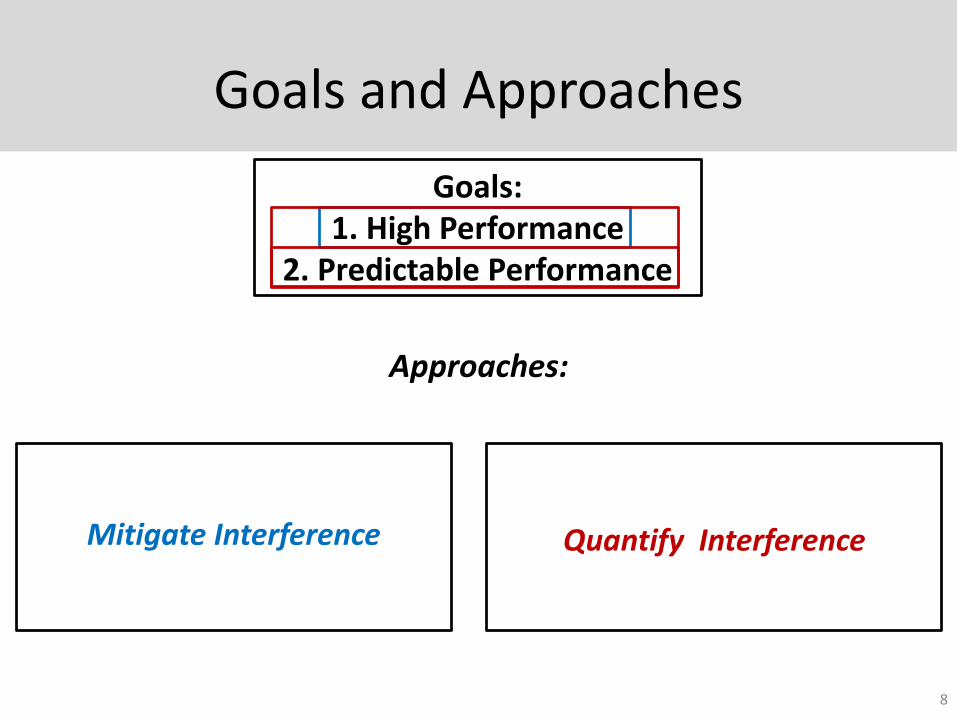
Goals and Approaches
8
Goals:1. High Performance
2. Predictable Performance
Mitigate Interference Quantify Interference
Approaches:
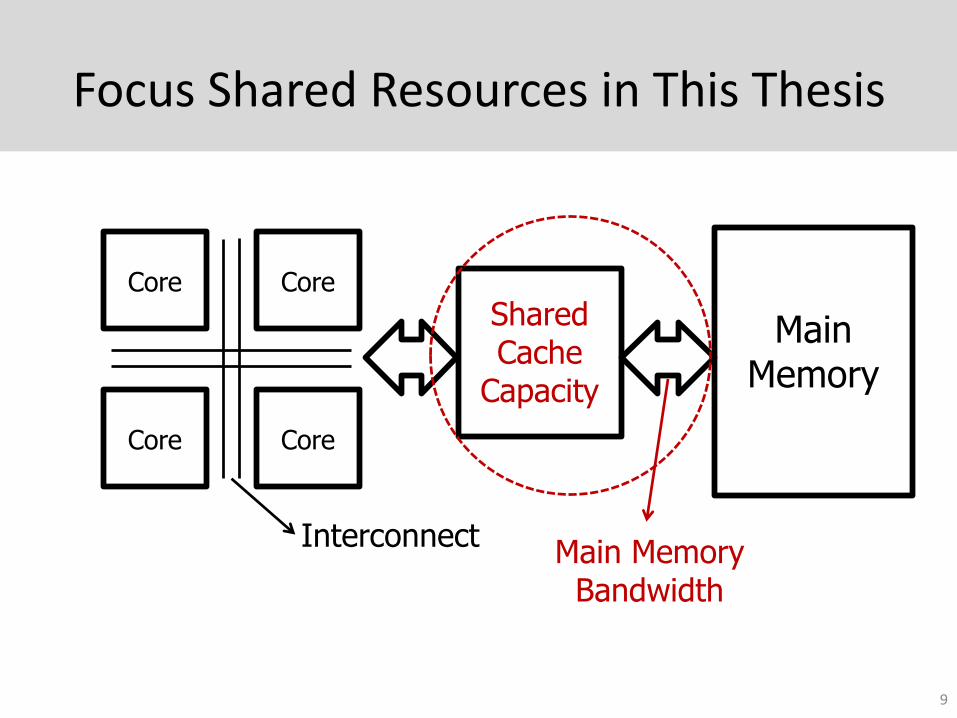
Focus Shared Resources in This Thesis
9
Main Memory
Shared Cache
Capacity
CoreCore
CoreCore
InterconnectMain Memory
Bandwidth
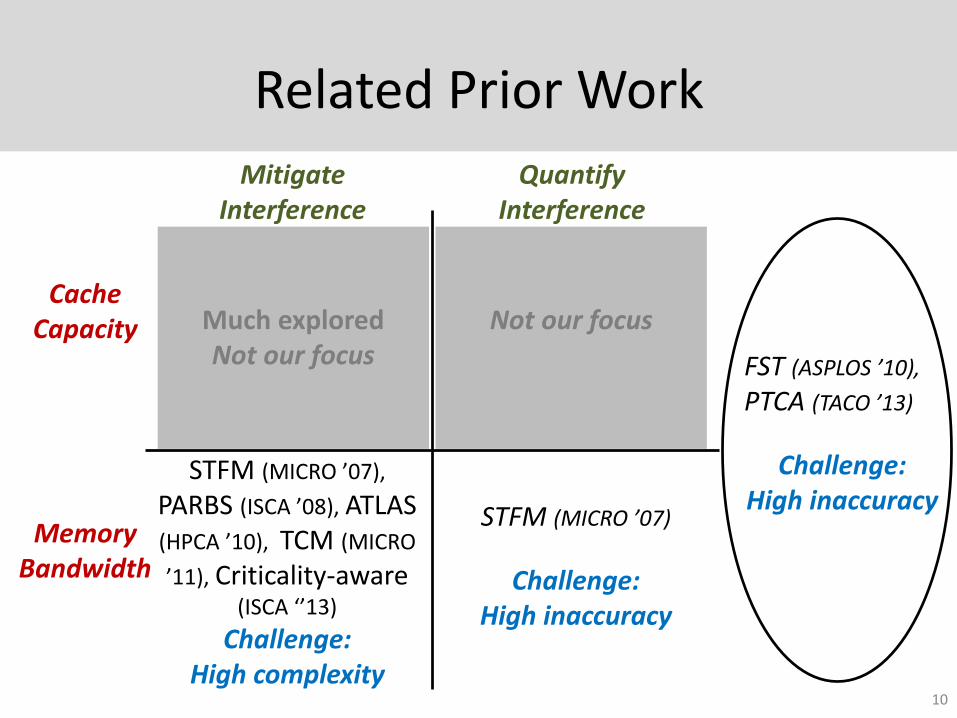
Related Prior Work
10
Mitigate Interference
Quantify Interference
Cache Capacity
Memory Bandwidth
CQoS (ICS ‘04), UCP (MICRO ‘06), DIP (ISCA
‘07), DRRIP (ISCA ‘10), EAF (PACT ‘12)
STFM (MICRO ’07),
PARBS (ISCA ’08), ATLAS (HPCA ’10), TCM (MICRO
’11), Criticality-aware(ISCA ‘’13)
Challenge: High complexity
PCASA (DATE ’12),
Ubik (ASPLOS ’14)
Goal: Meet resource allocation target
STFM (MICRO ’07)
Challenge: High inaccuracy
FST (ASPLOS ’10),
PTCA (TACO ’13)
Challenge: High inaccuracy
Much exploredNot our focus
Not our focus
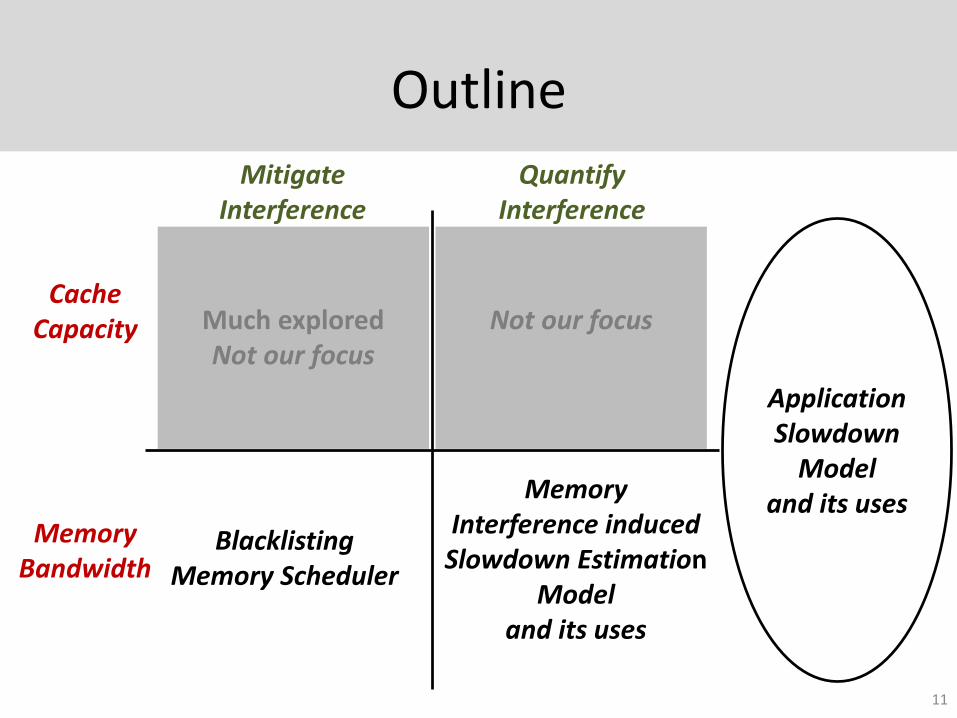
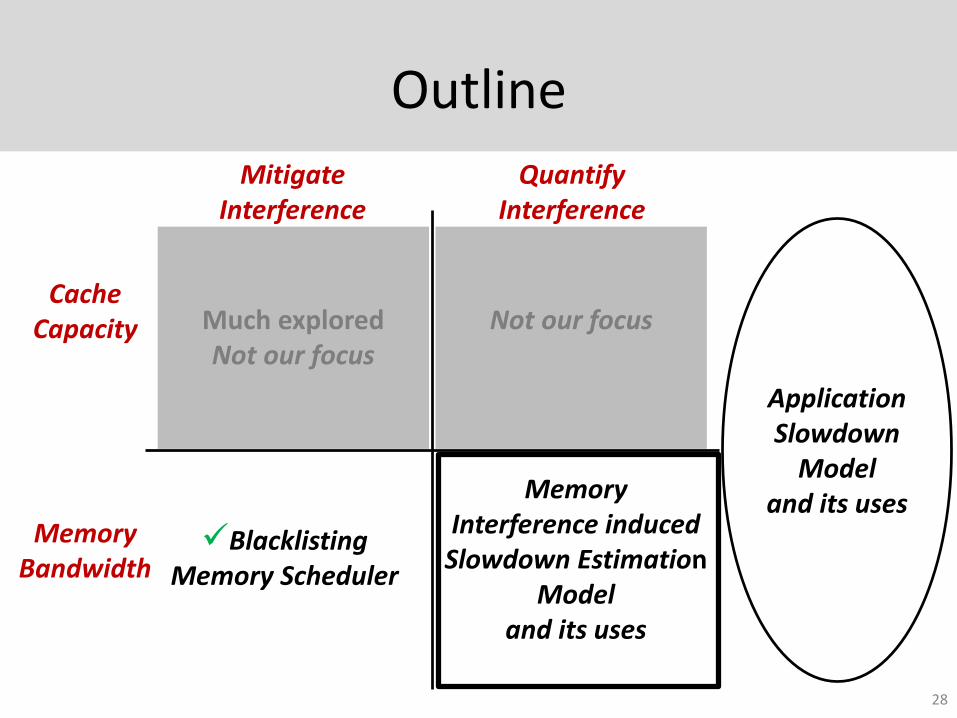
Outline
11
Mitigate Interference
Quantify Interference
Cache Capacity
Memory Bandwidth
Much exploredNot our focus
Blacklisting Memory Scheduler
Not our focus
Memory Interference induced
Slowdown EstimationModel
and its uses
Application Slowdown
Modeland its uses
Outline
12
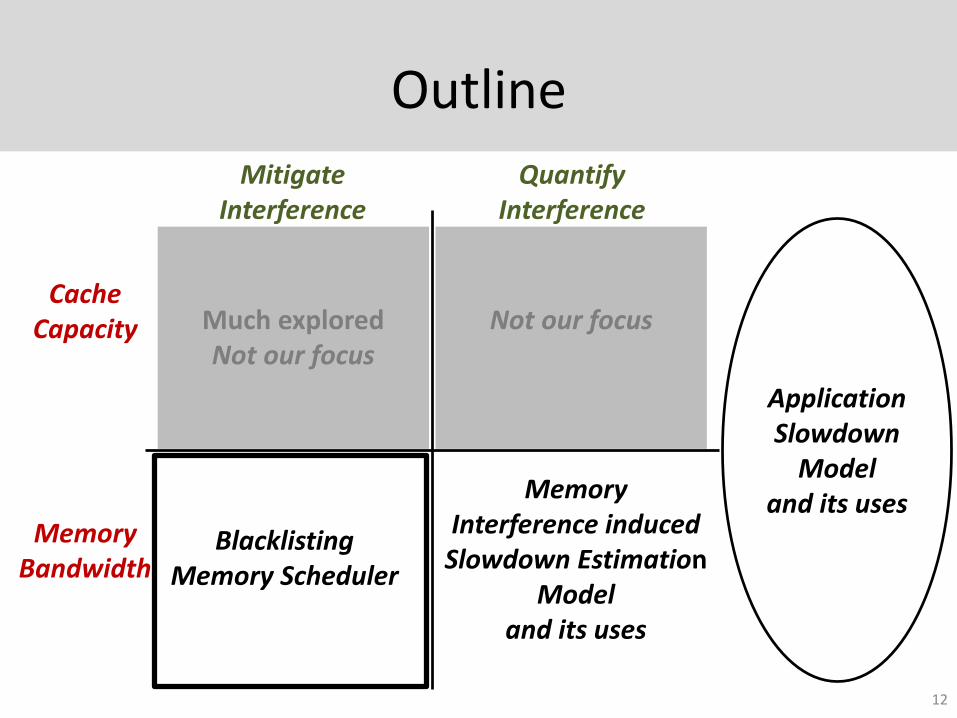
Mitigate Interference
Quantify Interference
Cache Capacity
Memory Bandwidth
Much exploredNot our focus
Blacklisting Memory Scheduler
Not our focus
Memory Interference induced
Slowdown EstimationModel
and its uses
Application Slowdown
Modeland its uses
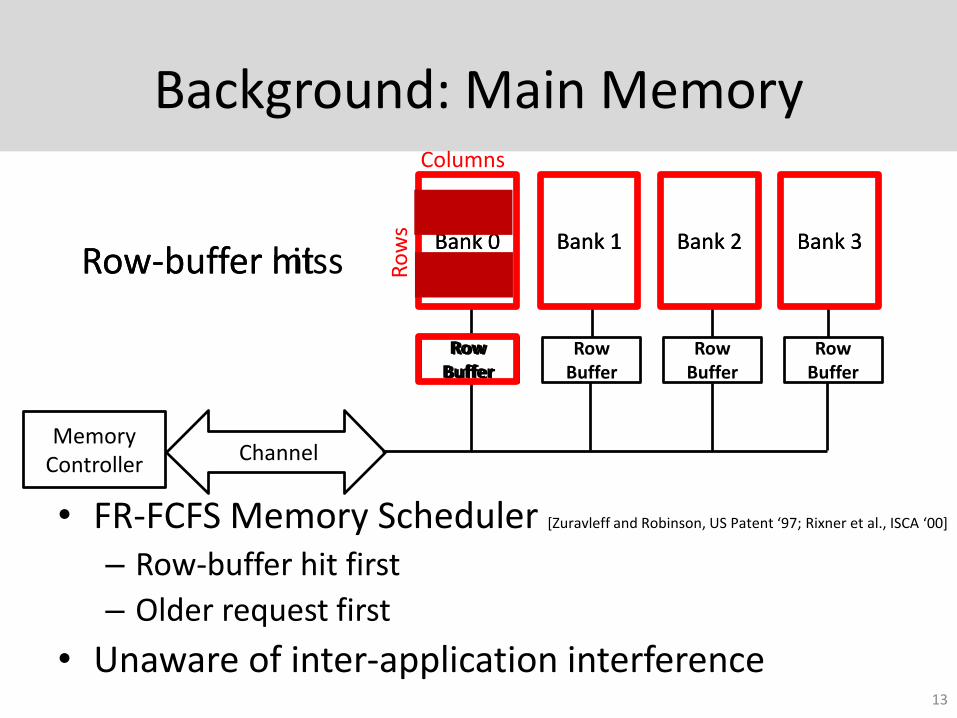
Background: Main Memory
• FR-FCFS Memory Scheduler [Zuravleff and Robinson, US Patent ‘97; Rixner et al., ISCA ‘00]
– Row-buffer hit first
– Older request first
• Unaware of inter-application interference
Row Buffer
Bank 0 Bank 1 Bank 2 Bank 3
Row Buffer
Row Buffer
Row Buffer
Ro
ws
Columns
ChannelMemory
Controller
Bank 0 Bank 1 Bank 2 Bank 3
Row Buffer
13
Row-buffer hitRow-buffer miss
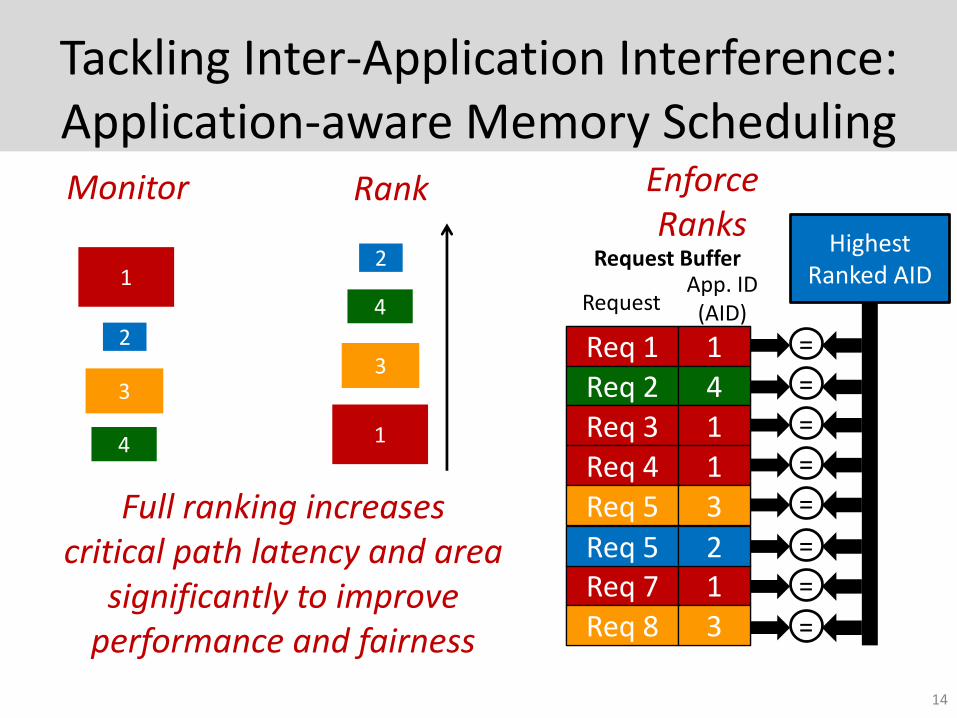
Tackling Inter-Application Interference:Application-aware Memory Scheduling
14
Monitor Rank
Highest Ranked AID
EnforceRanks
Full ranking increases critical path latency and area
significantly to improve performance and fairness
4
3
2
12
4
3
1
Req 1 1Req 2 4Req 3 1Req 4 1Req 5 3
Req 7 1Req 8 3
Request Buffer
Req 5 2
RequestApp. ID
(AID)
=
=
=
=
=
=
=
=
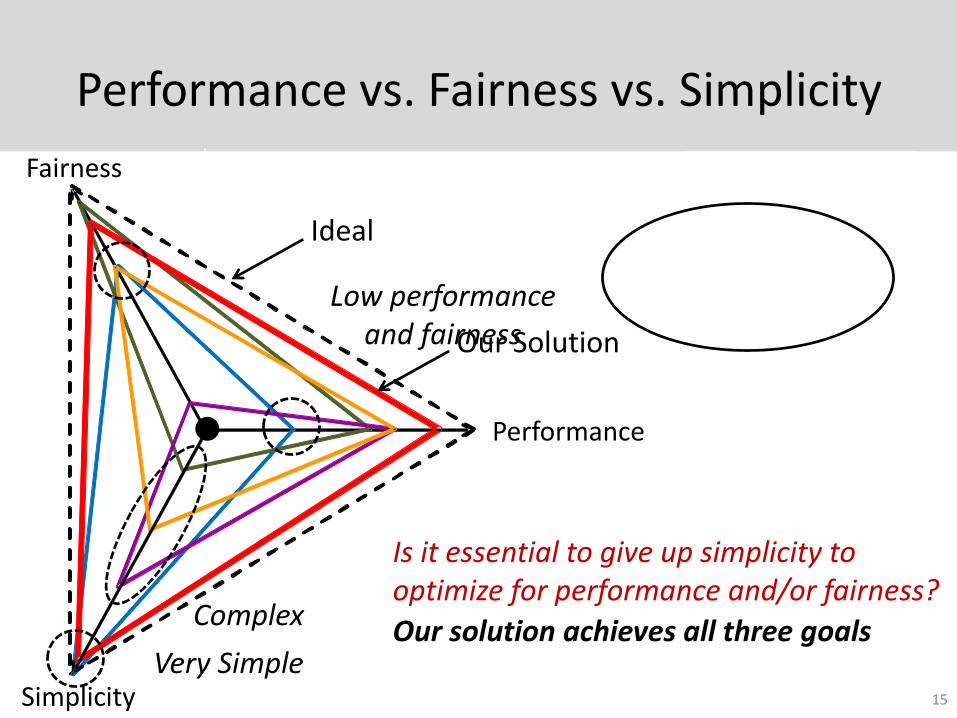
Performance vs. Fairness vs. Simplicity
15
Performance
Fairness
Simplicity
FRFCFS
PARBS
ATLAS
TCM
Blacklisting
Ideal
App-unaware
App-aware (Ranking)
Our Solution (No Ranking)
Is it essential to give up simplicity to optimize for performance and/or fairness?
Our solution achieves all three goalsVery Simple
Low performance and fairness
Complex
Our Solution
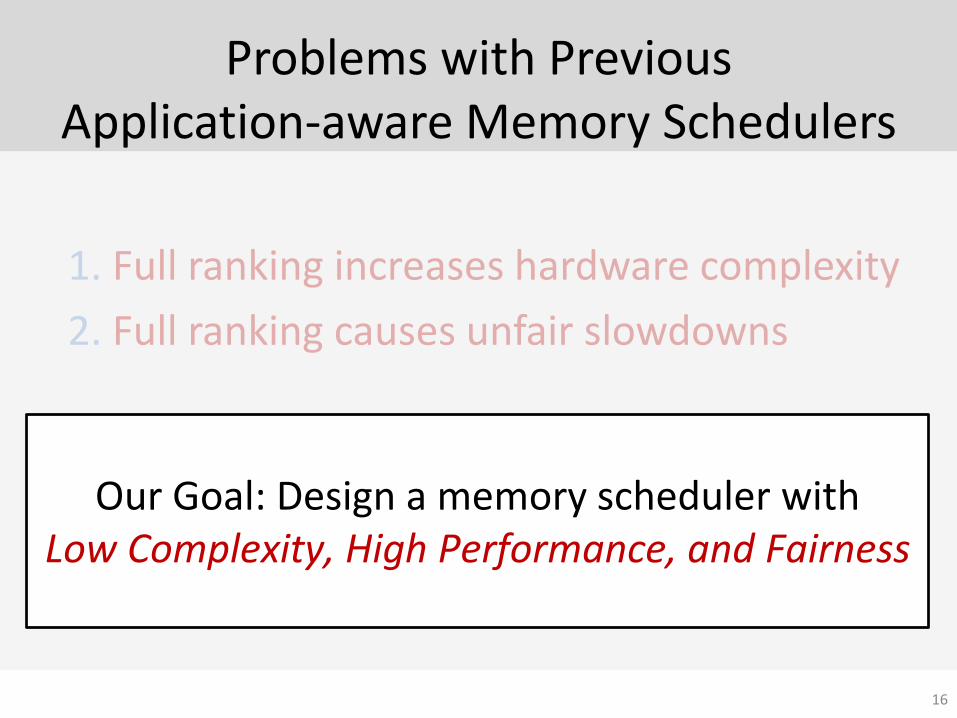
Problems with Previous Application-aware Memory Schedulers
1. Full ranking increases hardware complexity
2. Full ranking causes unfair slowdowns
16
Our Goal: Design a memory scheduler withLow Complexity, High Performance, and Fairness

Key Observation 1: Group Rather Than Rank
Observation 1: Sufficient to separate applications into two groups, rather than do full ranking
17
Benefit 1: Low complexity compared to ranking
Group
VulnerableInterference
Causing
>
Monitor Rank
4
3
2
12
4
3
1
4
2
3
1
Benefit 2: Lower slowdowns than ranking

Key Observation 1: Group Rather Than Rank
Observation 1: Sufficient to separate applications into two groups, rather than do full ranking
18
Group
VulnerableInterference
Causing
>
Monitor Rank
4
3
2
12
4
3
1
4
2
3
1
How to classify applications into groups?
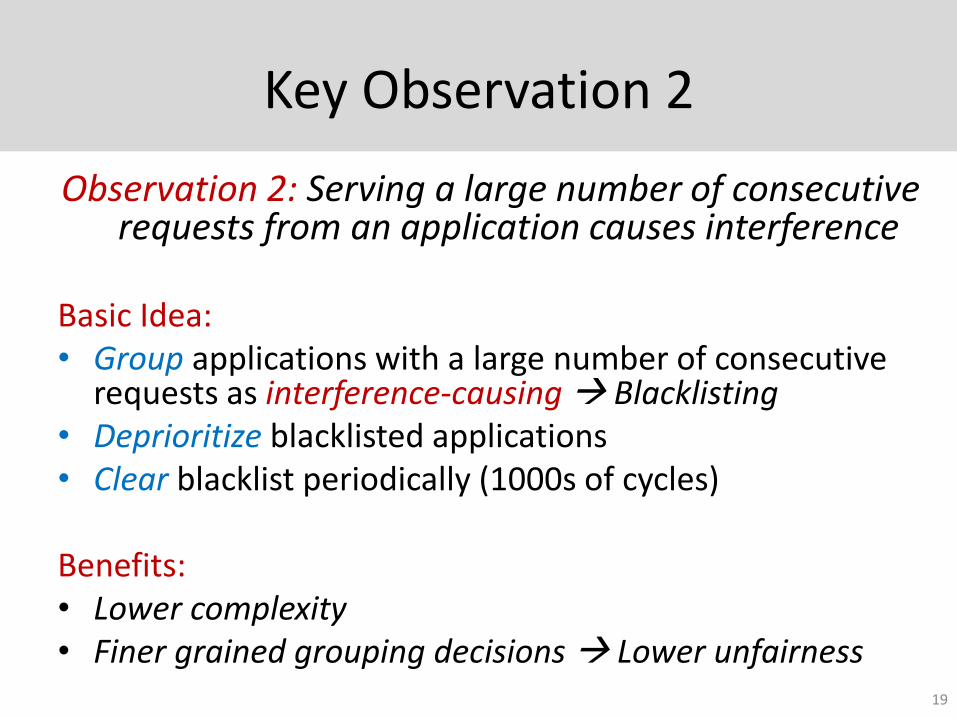
Key Observation 2
Observation 2: Serving a large number of consecutive requests from an application causes interference
Basic Idea:• Group applications with a large number of consecutive
requests as interference-causing Blacklisting• Deprioritize blacklisted applications• Clear blacklist periodically (1000s of cycles)
Benefits:• Lower complexity• Finer grained grouping decisions Lower unfairness
19
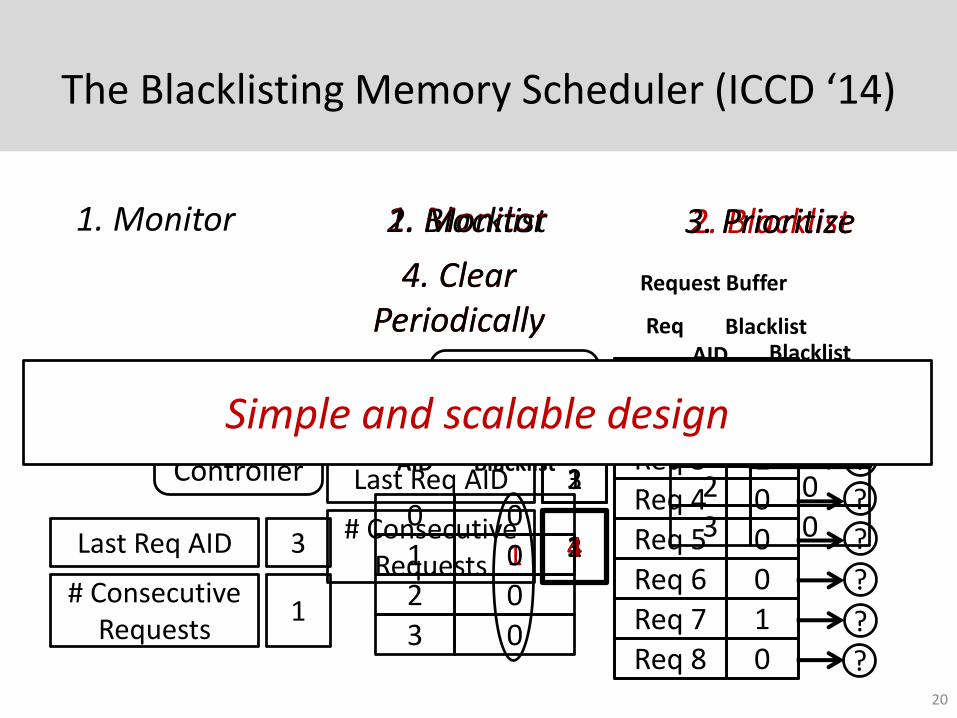
The Blacklisting Memory Scheduler (ICCD ‘14)
20
1. Monitor
Memory Controller
AID2 0 0
AID Blacklist
1 02 0
3 0
AID1AID1AID1AID1
1Last Req AID 3
# Consecutive Requests
1
21
2344
2. Blacklist
Memory Controller
Last Req AID 3
# Consecutive Requests
1
2. Blacklist
0 0
AID Blacklist
12 03 0
1
1. Monitor
Req Blacklist
Req 1 0Req 2 1
Req 3 1Req 4 0Req 5 0
Req 6 0Req 7 1Req 8 0
Request Buffer
?
?
?
3. Prioritize
4. Clear Periodically
0
Simple and scalable design
3. Prioritize
4. Clear Periodically
1. Monitor
?
?
?
?
?
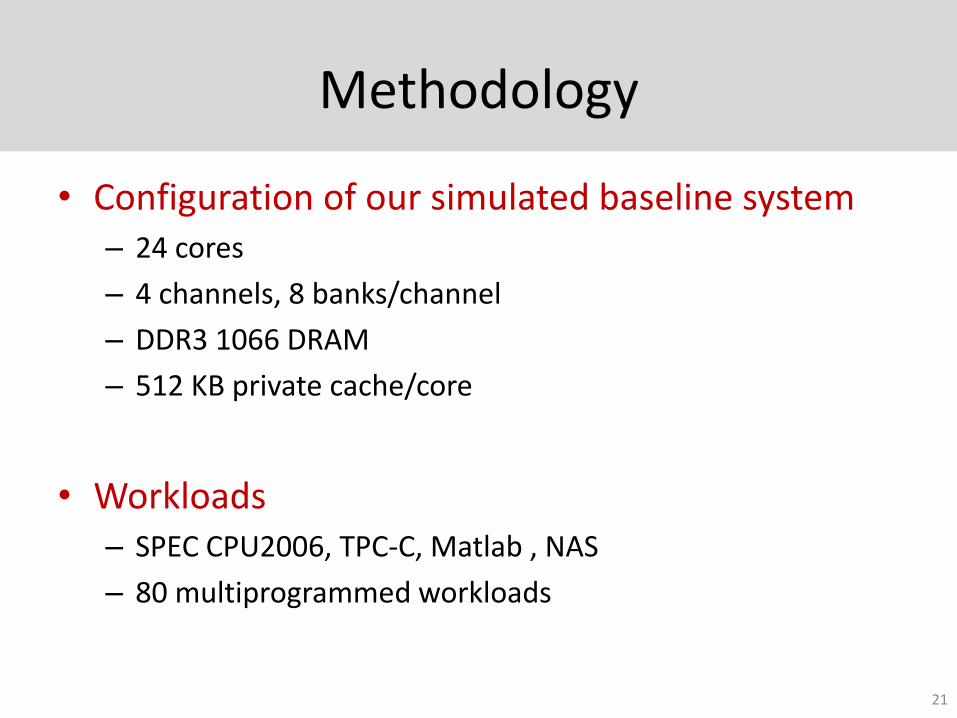
Methodology
• Configuration of our simulated baseline system– 24 cores
– 4 channels, 8 banks/channel
– DDR3 1066 DRAM
– 512 KB private cache/core
• Workloads– SPEC CPU2006, TPC-C, Matlab , NAS
– 80 multiprogrammed workloads
21
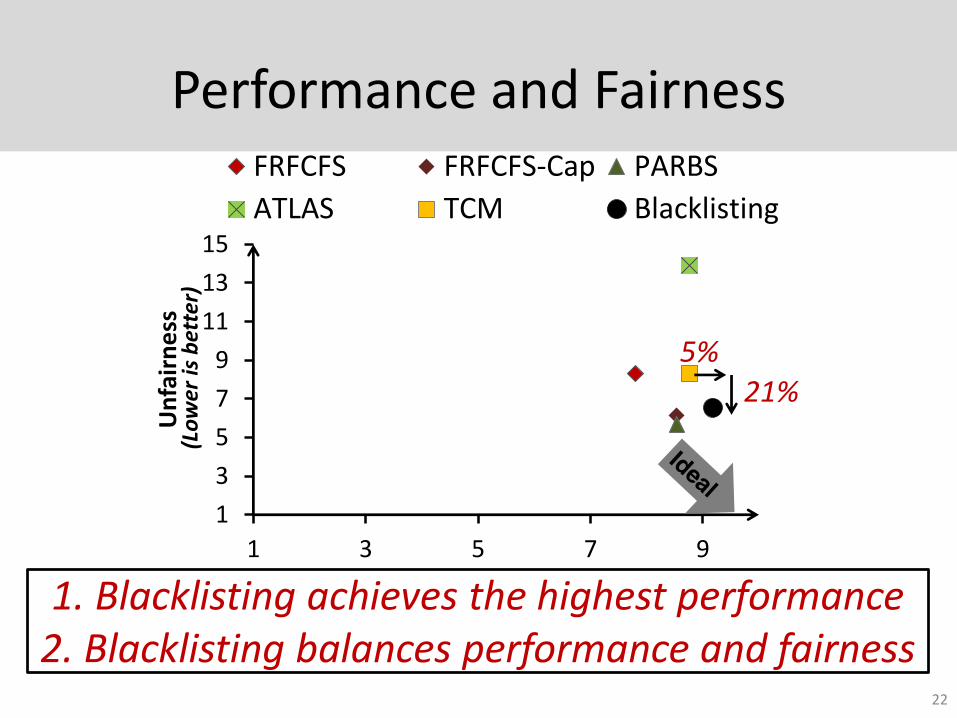
Performance and Fairness
22
1
3
5
7
9
11
13
15
1 3 5 7 9
Un
fair
ne
ss
Performance
FRFCFS FRFCFS-Cap PARBS
ATLAS TCM Blacklisting
5%21%
(Higher is better)
(Lo
wer
is b
ette
r)
1. Blacklisting achieves the highest performance 2. Blacklisting balances performance and fairness
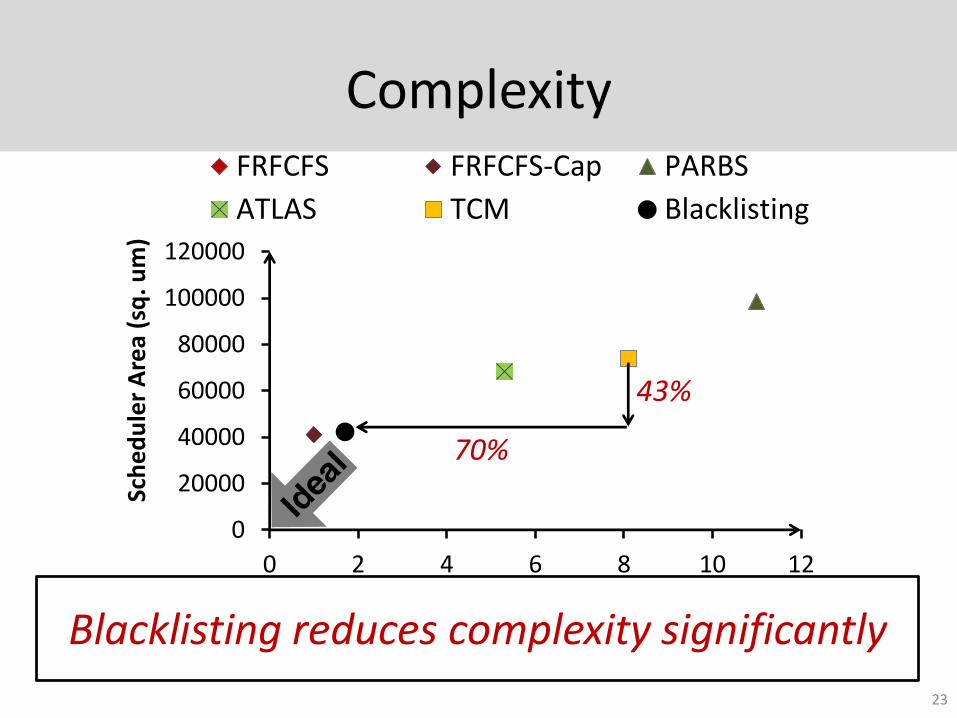
Complexity
23
0
20000
40000
60000
80000
100000
120000
0 2 4 6 8 10 12
Sch
ed
ule
r A
rea
(sq
. um
)
Critical Path Latency (ns)
FRFCFS FRFCFS-Cap PARBS
ATLAS TCM Blacklisting
43%
70%
Blacklisting reduces complexity significantly
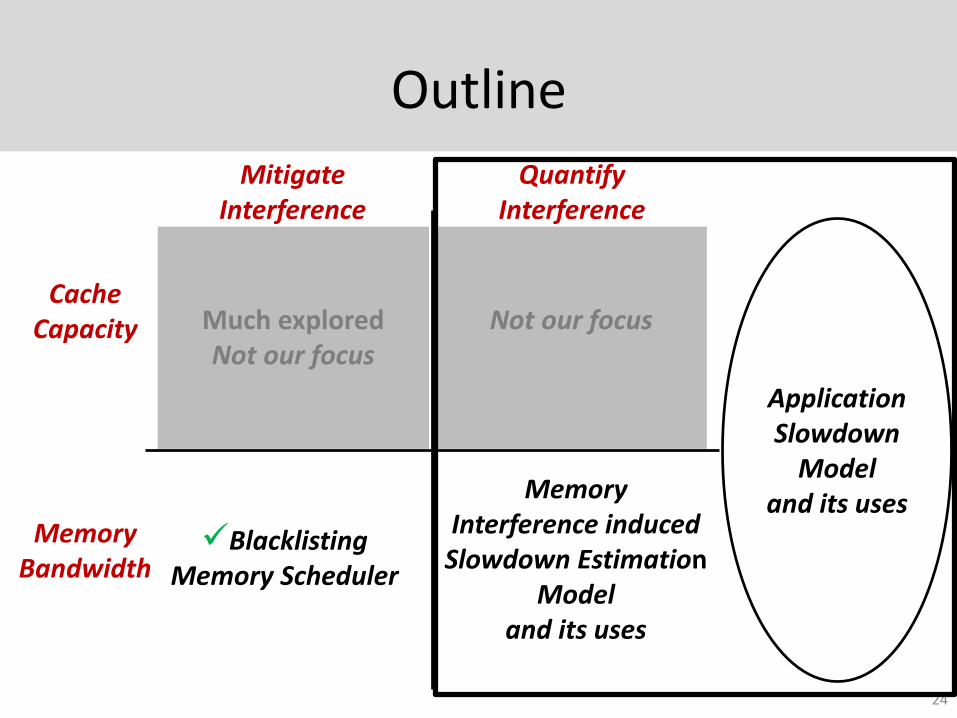
Outline
24
Mitigate Interference
Quantify Interference
Cache Capacity
Memory Bandwidth
Much exploredNot our focus
Blacklisting Memory Scheduler
Not our focus
Memory Interference induced
Slowdown EstimationModel
and its uses
Application Slowdown
Modeland its uses
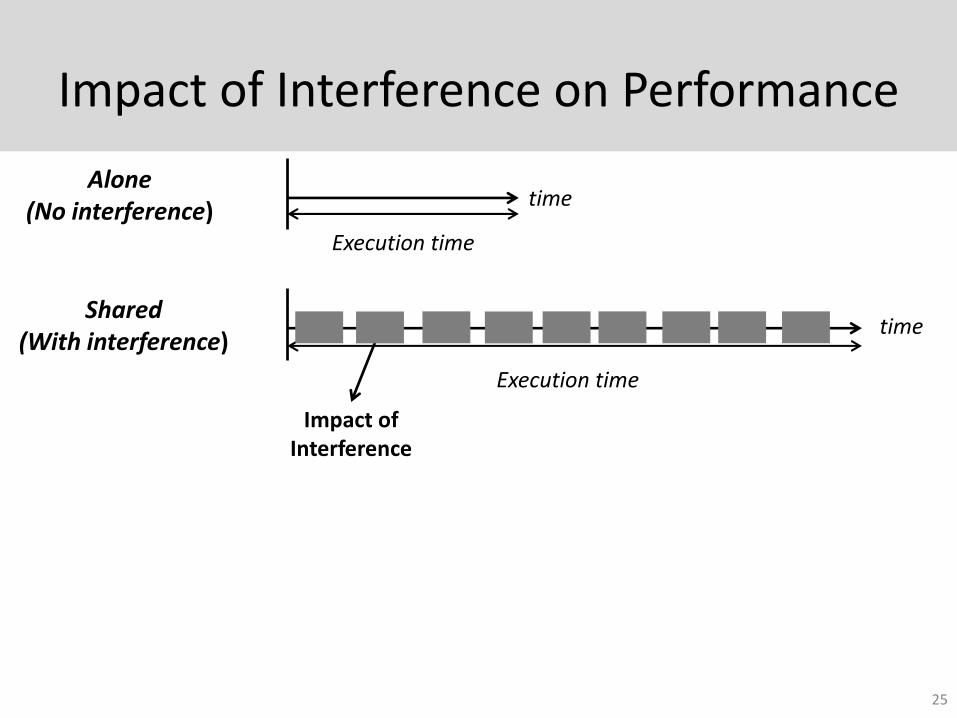
Impact of Interference on Performance
25
Alone (No interference)
time
Execution time
Shared (With interference)
time
Execution time
Impact of Interference
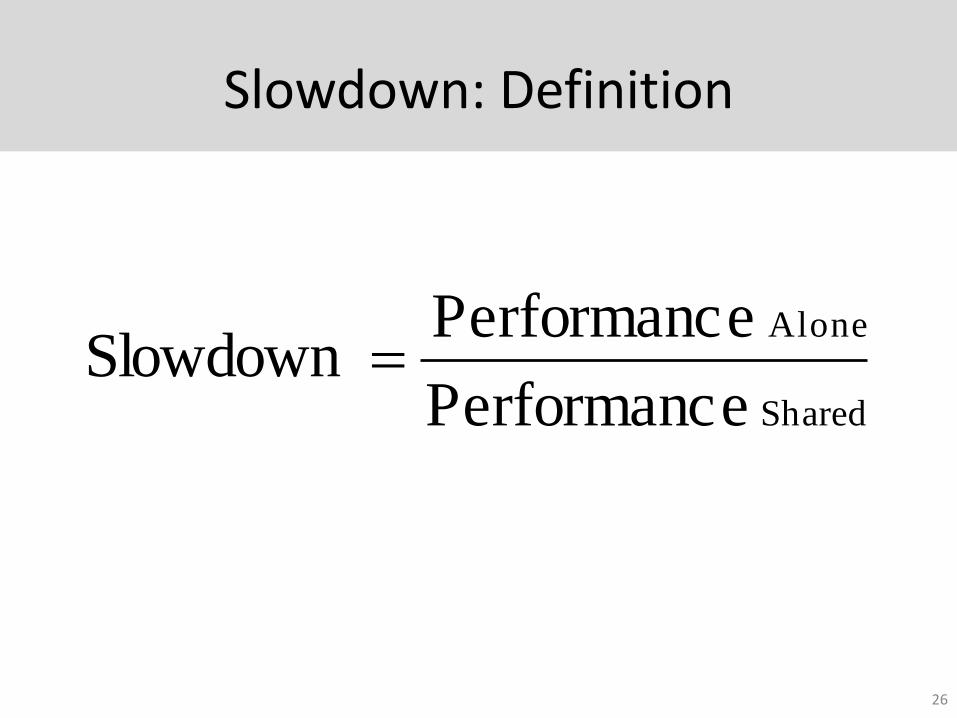
Slowdown: Definition
Shared
Alone
ePerformanc
ePerformanc Slowdown
26
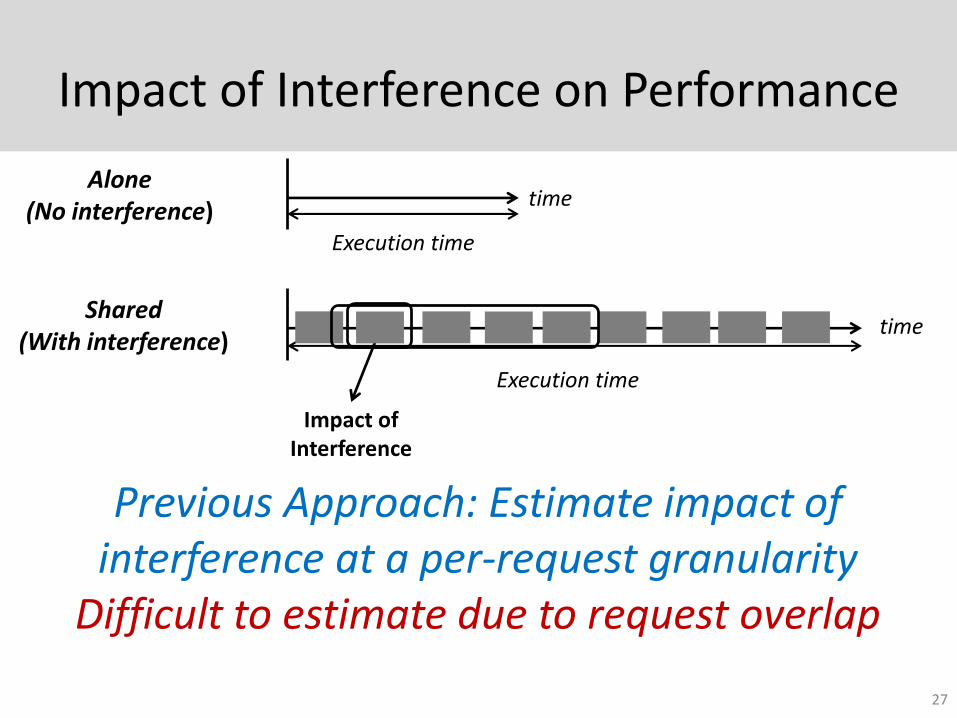
Impact of Interference on Performance
27
Alone (No interference)
time
Execution time
Shared (With interference)
time
Execution time
Impact of Interference
Previous Approach: Estimate impact of interference at a per-request granularity
Difficult to estimate due to request overlap
Outline
28
Mitigate Interference
Quantify Interference
Cache Capacity
Memory Bandwidth
Much exploredNot our focus
Blacklisting Memory Scheduler
Not our focus
Memory Interference induced
Slowdown EstimationModel
and its uses
Application Slowdown
Modeland its uses
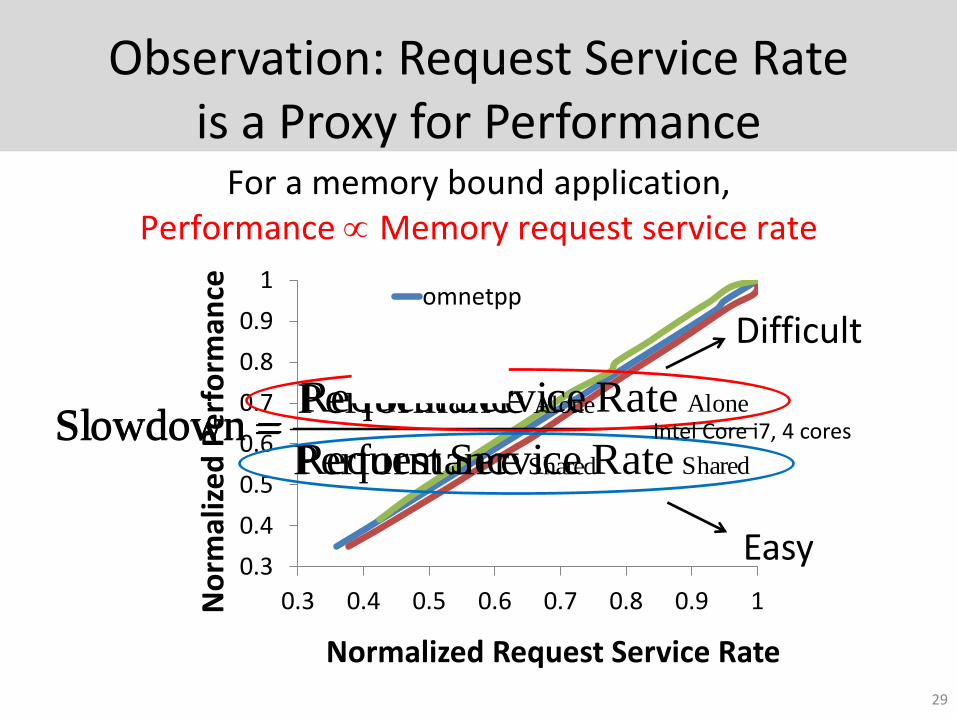
Observation: Request Service Rate is a Proxy for Performance
For a memory bound application, Performance Memory request service rate
0.3
0.4
0.5
0.6
0.7
0.8
0.9
1
0.3 0.4 0.5 0.6 0.7 0.8 0.9 1No
rmal
ize
d P
erf
orm
ance
Normalized Request Service Rate
omnetpp
mcf
astar
Shared
Alone
Rate ServiceRequest
Rate ServiceRequest Slowdown
Shared
Alone
ePerformanc
ePerformanc Slowdown
Easy
Difficult
Intel Core i7, 4 cores
29
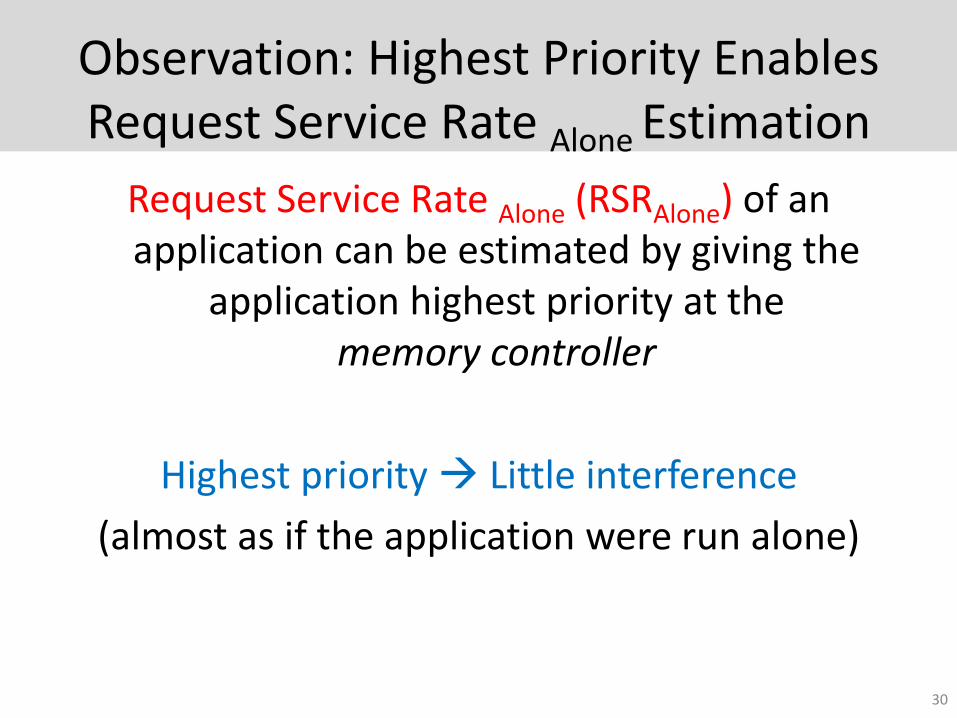
Observation: Highest Priority Enables Request Service Rate Alone Estimation
Request Service Rate Alone (RSRAlone) of an application can be estimated by giving the
application highest priority at the memory controller
Highest priority Little interference
(almost as if the application were run alone)
30
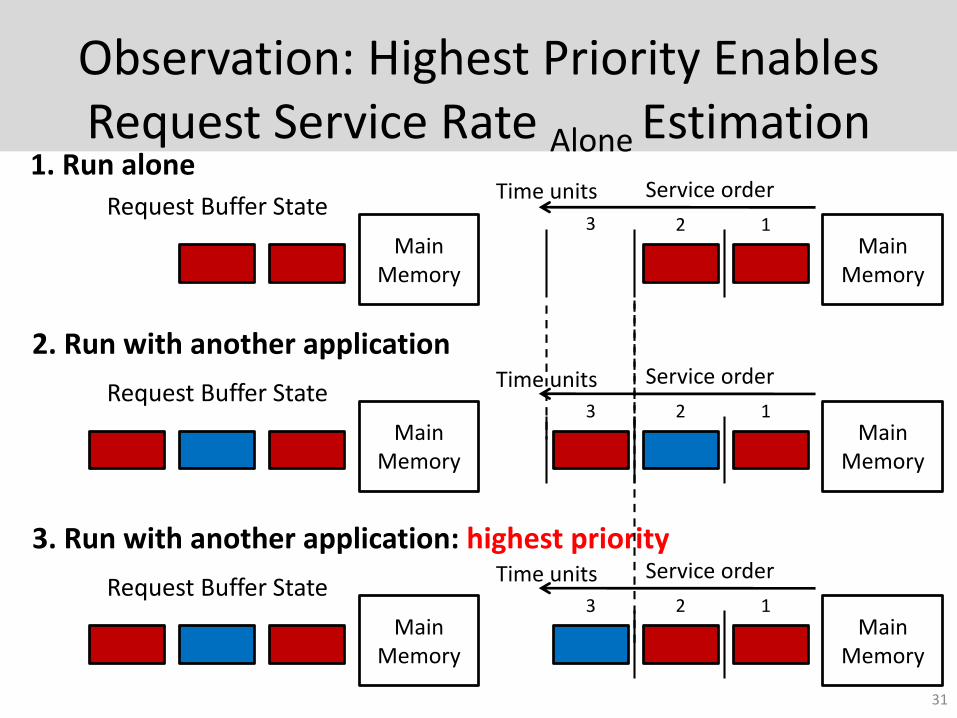
Observation: Highest Priority Enables Request Service Rate Alone Estimation
Request Buffer State
Main Memory
1. Run aloneTime units Service order
Main Memory
12
Request Buffer State
Main Memory
2. Run with another applicationService order
Main Memory
123
Request Buffer State
Main Memory
3. Run with another application: highest priorityService order
Main Memory
123
Time units
Time units
3
31
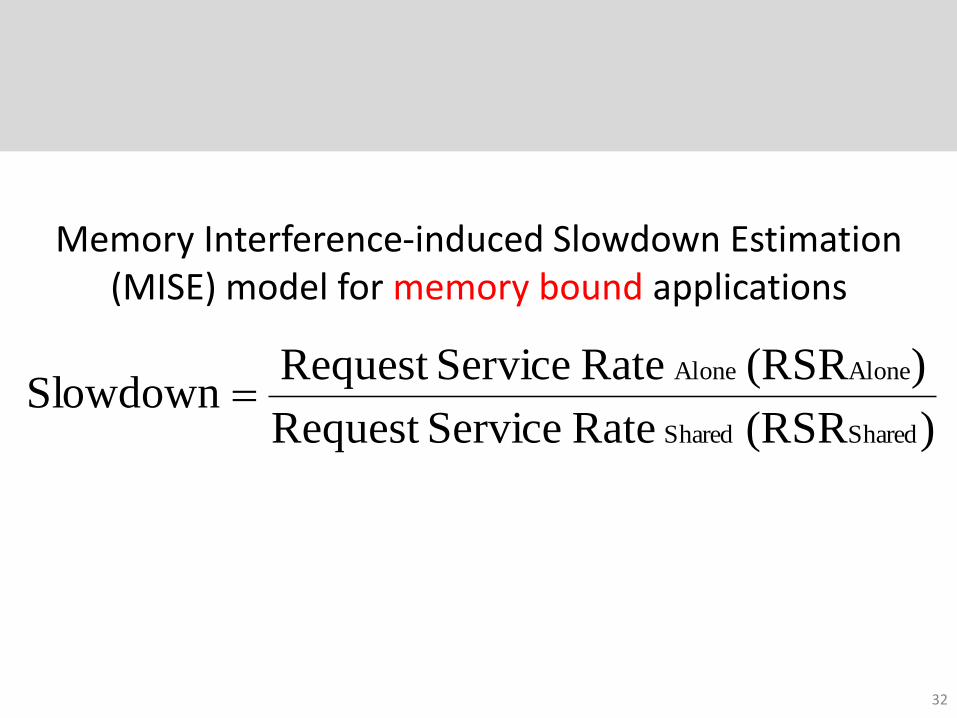
Memory Interference-induced Slowdown Estimation (MISE) model for memory bound applications
)(RSR Rate ServiceRequest
)(RSR Rate ServiceRequest Slowdown
SharedShared
AloneAlone
32
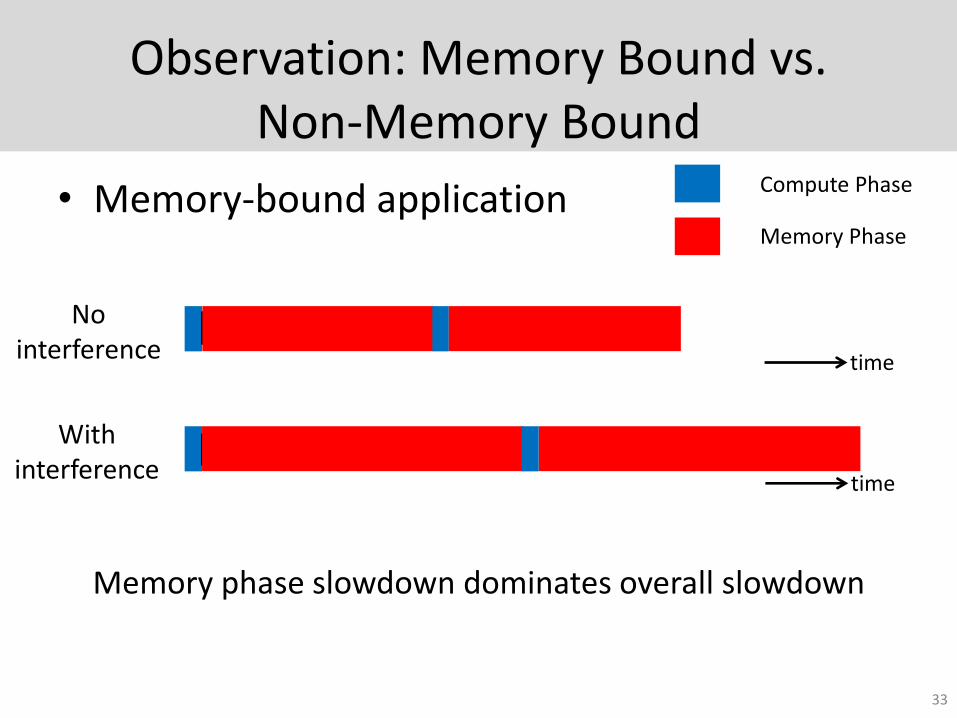
Observation: Memory Bound vs. Non-Memory Bound
• Memory-bound application
No interference
Compute Phase
Memory Phase
With interference
Memory phase slowdown dominates overall slowdown
time
time
Req
Req
Req Req
Req Req
33
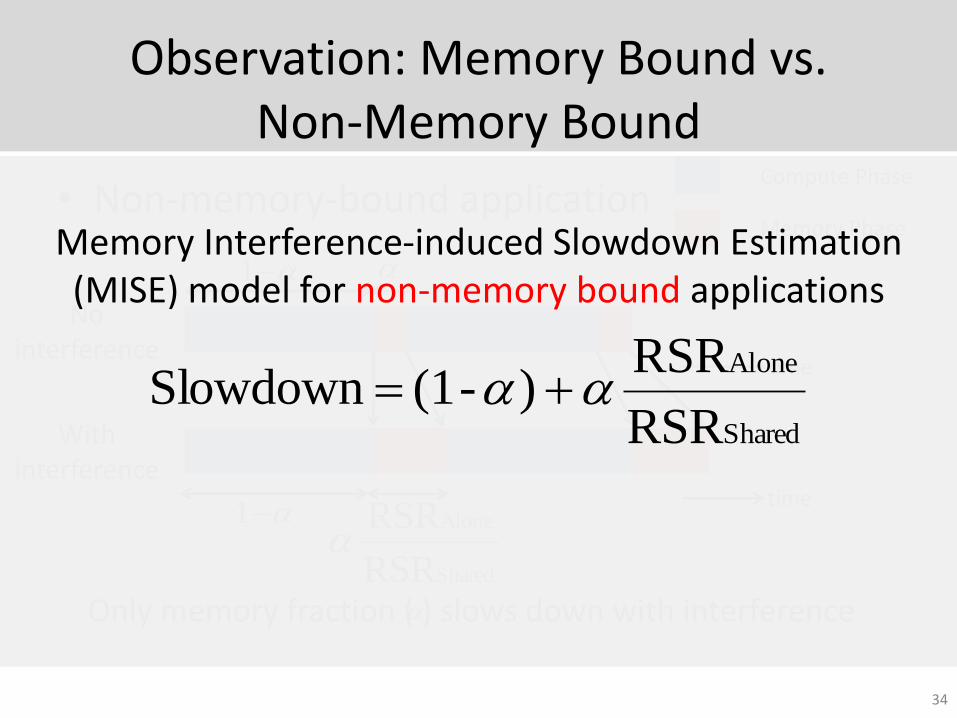
Observation: Memory Bound vs. Non-Memory Bound
• Non-memory-bound application
time
time
No interference
Compute Phase
Memory Phase
With interference
Only memory fraction ( ) slows down with interference
1
1
Shared
Alone
RSR
RSR
Shared
Alone
RSR
RSR ) - (1 Slowdown
Memory Interference-induced Slowdown Estimation (MISE) model for non-memory bound applications
34
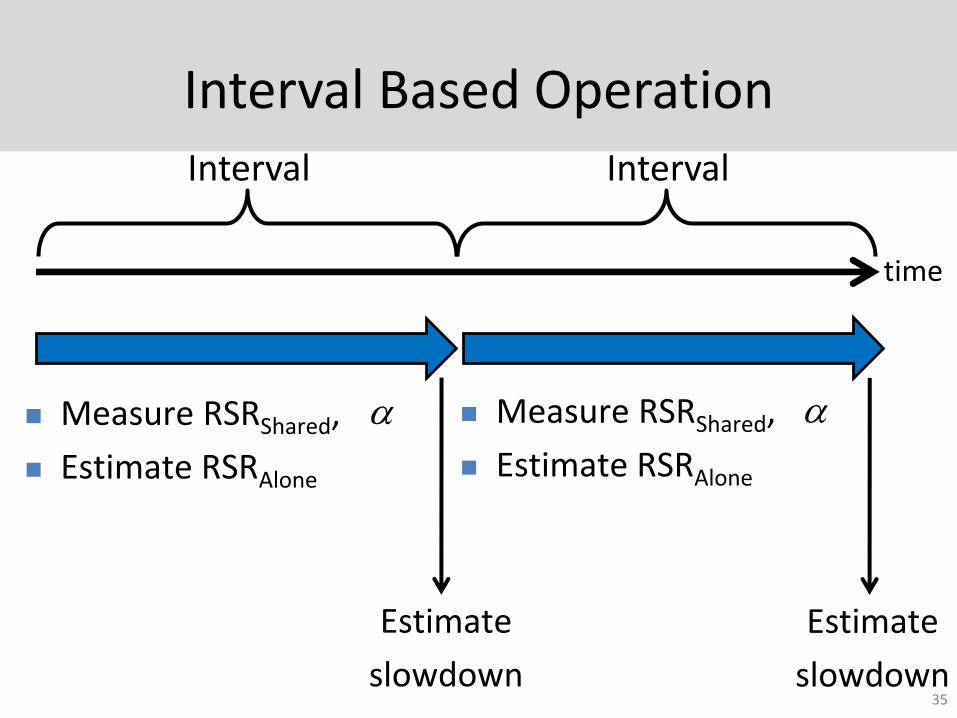
Interval Based Operation
time
Interval
Estimate
slowdown
Interval
Estimate
slowdown
Measure RSRShared,
Estimate RSRAlone
Measure RSRShared,
Estimate RSRAlone
35
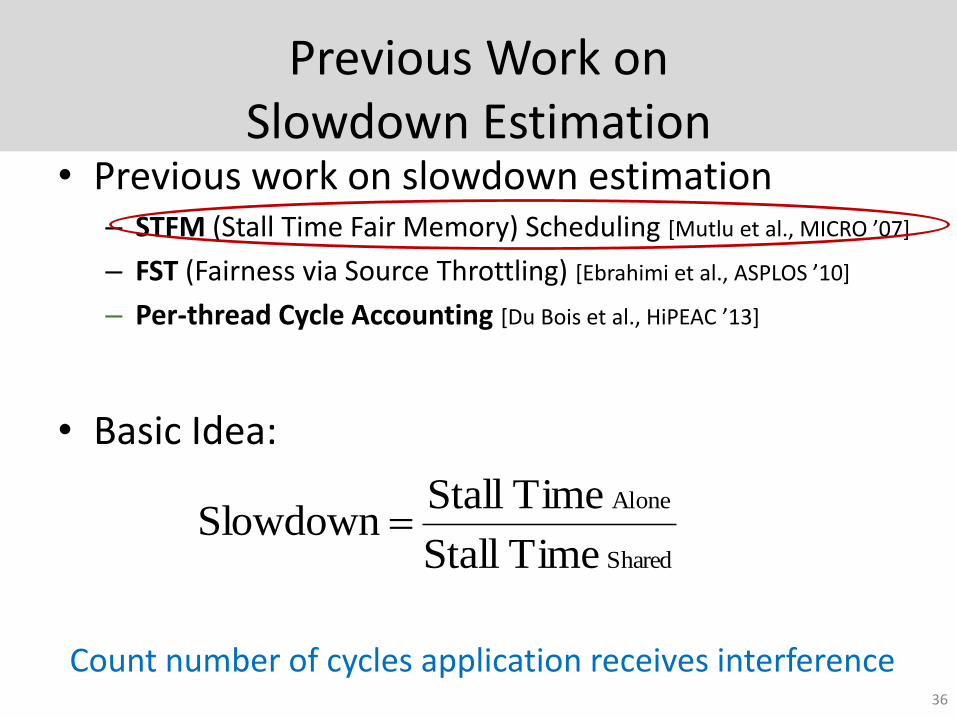
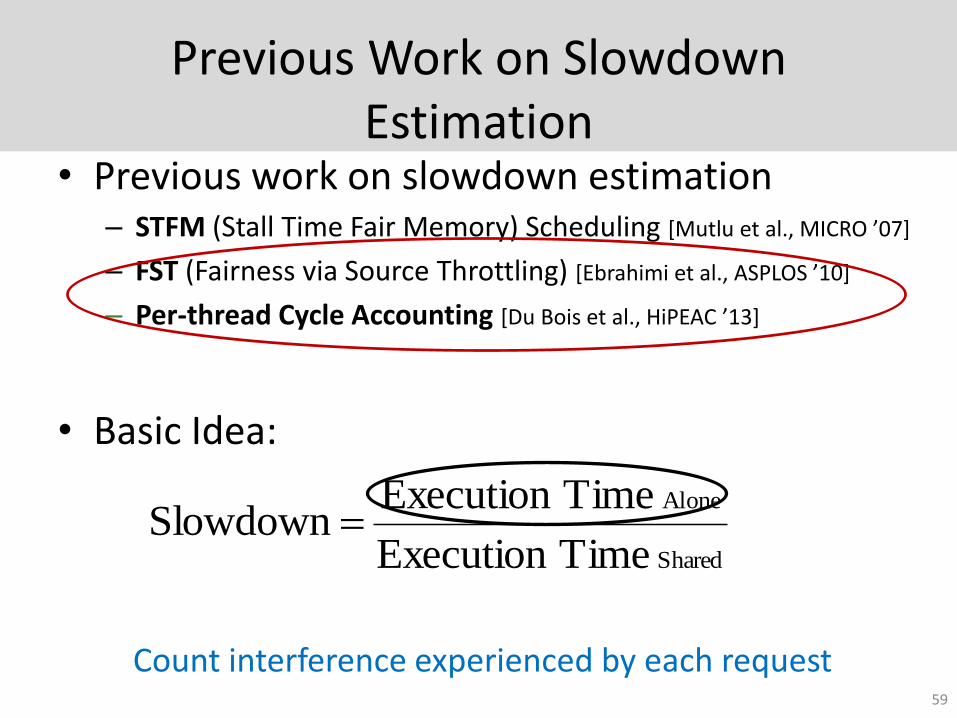
Previous Work on Slowdown Estimation
• Previous work on slowdown estimation– STFM (Stall Time Fair Memory) Scheduling [Mutlu et al., MICRO ’07]
– FST (Fairness via Source Throttling) [Ebrahimi et al., ASPLOS ’10]
– Per-thread Cycle Accounting [Du Bois et al., HiPEAC ’13]
• Basic Idea:
Shared
Alone
Time Stall
Time Stall Slowdown
Count number of cycles application receives interference36
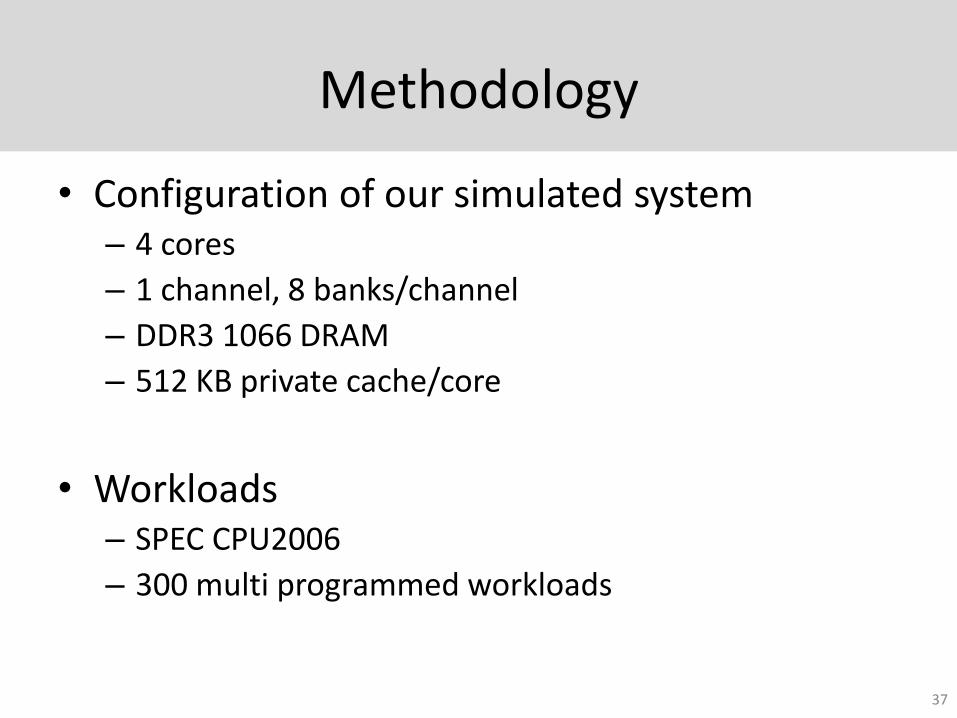
Methodology
• Configuration of our simulated system– 4 cores
– 1 channel, 8 banks/channel
– DDR3 1066 DRAM
– 512 KB private cache/core
• Workloads– SPEC CPU2006
– 300 multi programmed workloads
37
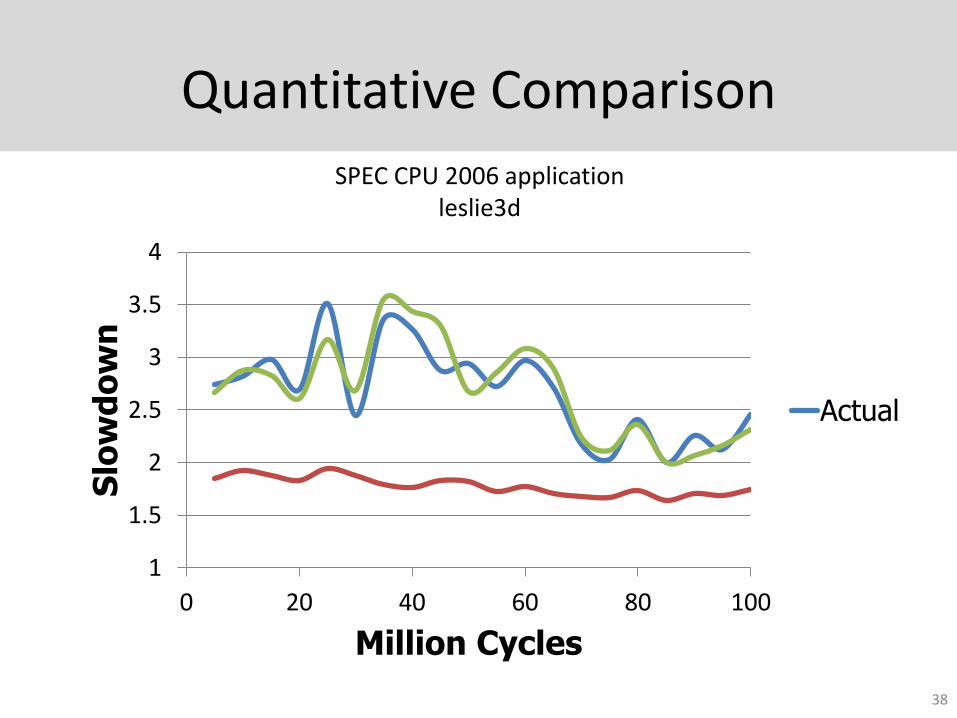
Quantitative Comparison
1
1.5
2
2.5
3
3.5
4
0 20 40 60 80 100
Slo
wd
ow
n
Million Cycles
Actual
STFM
MISE
SPEC CPU 2006 applicationleslie3d
38
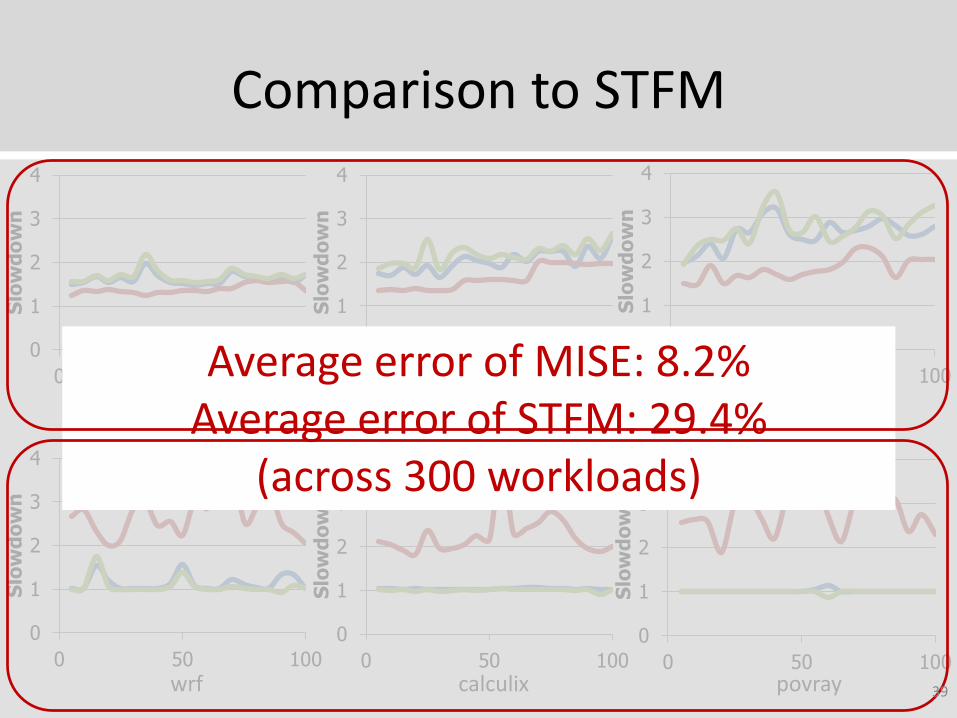
Comparison to STFM
cactusADM
0
1
2
3
4
0 50 100
Slo
wd
ow
n
0
1
2
3
4
0 50 100
Slo
wd
ow
n
GemsFDTD
0
1
2
3
4
0 50 100
Slo
wd
ow
n
soplex
0
1
2
3
4
0 50 100
Slo
wd
ow
n
wrf
0
1
2
3
4
0 50 100
Slo
wd
ow
n
calculix
0
1
2
3
4
0 50 100
Slo
wd
ow
n
povray
Average error of MISE: 8.2%Average error of STFM: 29.4%
(across 300 workloads)
39
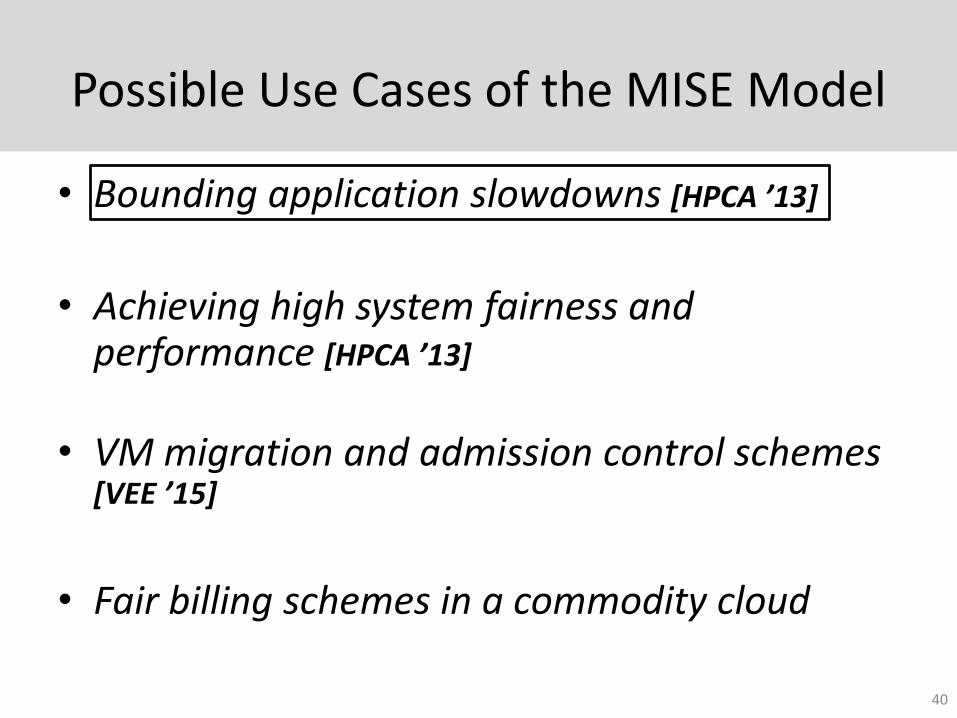
Possible Use Cases of the MISE Model
• Bounding application slowdowns [HPCA ’13]
• Achieving high system fairness and performance [HPCA ’13]
• VM migration and admission control schemes [VEE ’15]
• Fair billing schemes in a commodity cloud
40
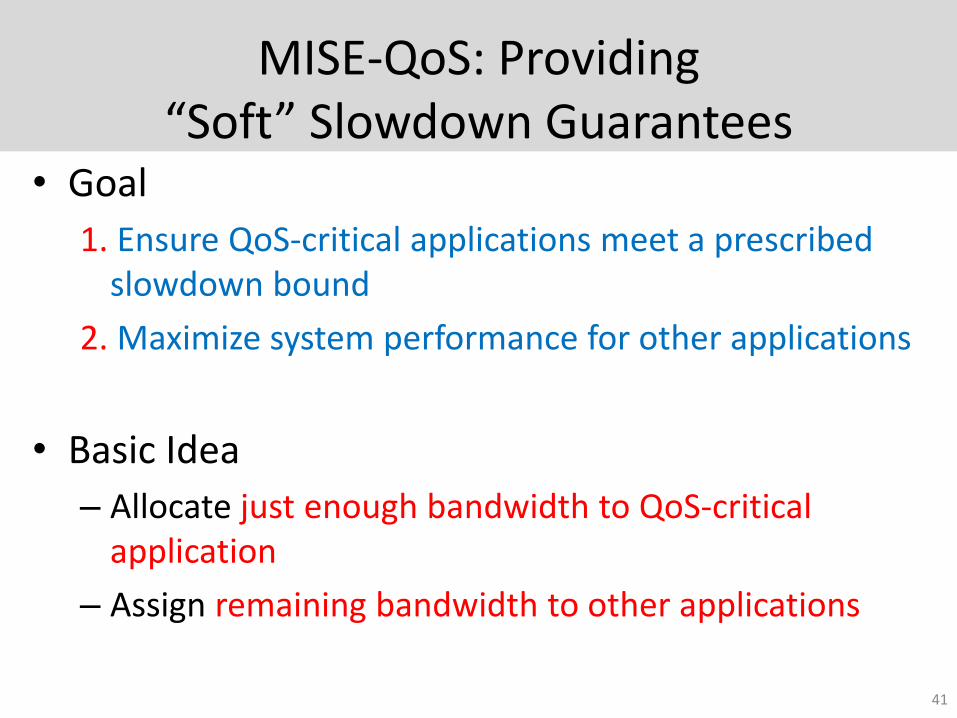
MISE-QoS: Providing “Soft” Slowdown Guarantees
• Goal
1. Ensure QoS-critical applications meet a prescribed slowdown bound
2. Maximize system performance for other applications
• Basic Idea
– Allocate just enough bandwidth to QoS-critical application
– Assign remaining bandwidth to other applications
41
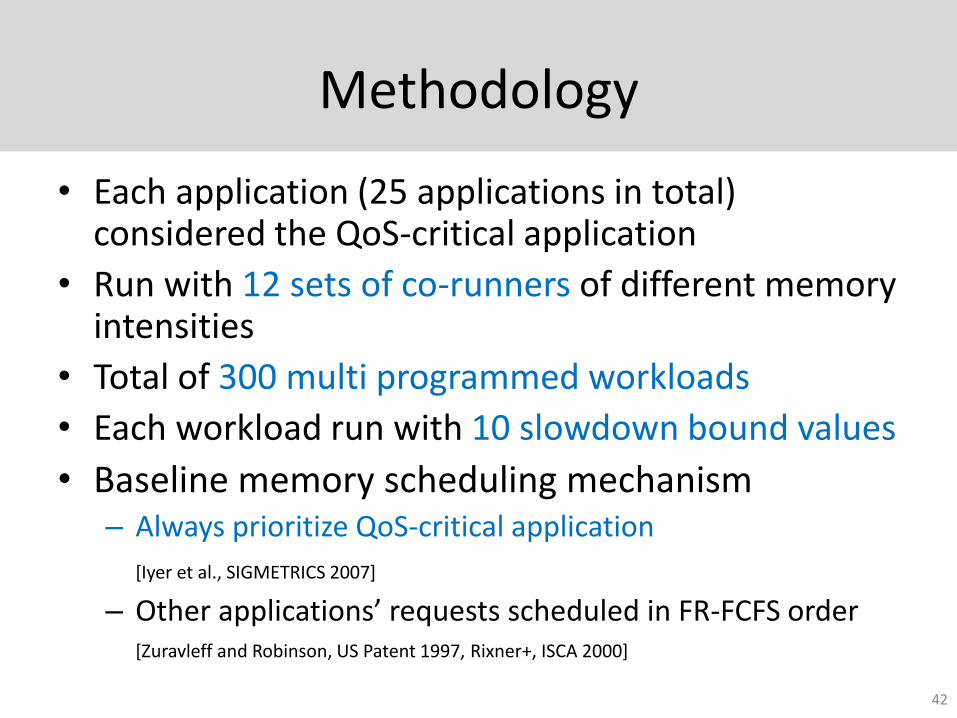
Methodology
• Each application (25 applications in total) considered the QoS-critical application
• Run with 12 sets of co-runners of different memory intensities
• Total of 300 multi programmed workloads
• Each workload run with 10 slowdown bound values
• Baseline memory scheduling mechanism– Always prioritize QoS-critical application
[Iyer et al., SIGMETRICS 2007]
– Other applications’ requests scheduled in FR-FCFS order[Zuravleff and Robinson, US Patent 1997, Rixner+, ISCA 2000]
42
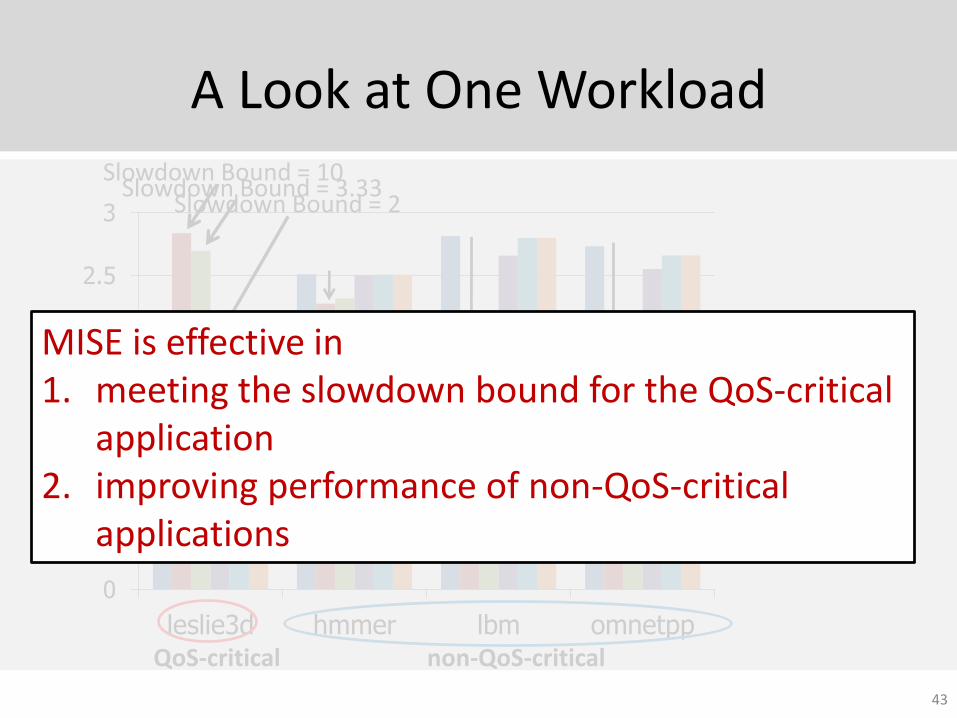
A Look at One Workload
0
0.5
1
1.5
2
2.5
3
leslie3d hmmer lbm omnetpp
Slo
wd
ow
n AlwaysPrioritize
MISE-QoS-10/1
MISE-QoS-10/3
MISE-QoS-10/5
MISE-QoS-10/7
MISE-QoS-10/9
QoS-critical non-QoS-critical
Slowdown Bound = 10 Slowdown Bound = 3.33
Slowdown Bound = 2
43
MISE is effective in 1. meeting the slowdown bound for the QoS-critical
application 2. improving performance of non-QoS-critical
applications
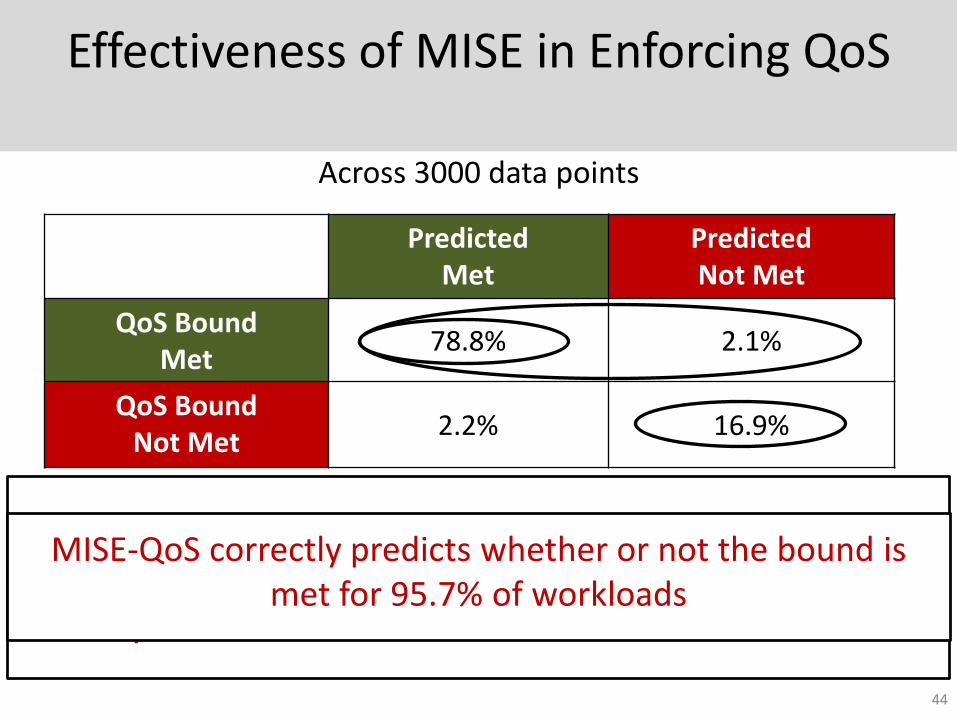
Effectiveness of MISE in Enforcing QoS
Predicted Met
PredictedNot Met
QoS Bound Met
78.8% 2.1%
QoS Bound Not Met
2.2% 16.9%
Across 3000 data points
MISE-QoS meets the bound for 80.9% of workloads
AlwaysPrioritize meets the bound for 83% of workloads
MISE-QoS correctly predicts whether or not the bound is met for 95.7% of workloads
44
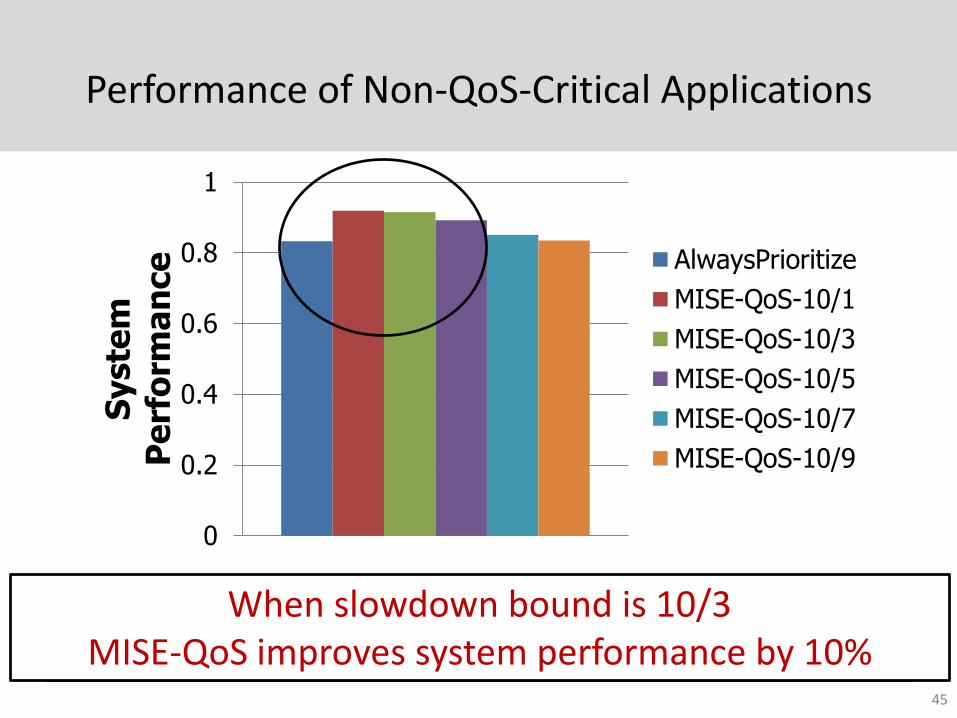
Performance of Non-QoS-Critical Applications
Higher performance when bound is looseWhen slowdown bound is 10/3 MISE-QoS improves system performance by 10%
45
0
0.2
0.4
0.6
0.8
1
Syste
m
Pe
rfo
rma
nce AlwaysPrioritize
MISE-QoS-10/1
MISE-QoS-10/3
MISE-QoS-10/5
MISE-QoS-10/7
MISE-QoS-10/9

Outline
46
Mitigate Interference
Quantify Interference
Cache Capacity
Memory Bandwidth
Much exploredNot our focus
Blacklisting Memory Scheduler
Not our focus
Memory Interference induced
Slowdown EstimationModel
and its uses
Application Slowdown
Modeland its uses
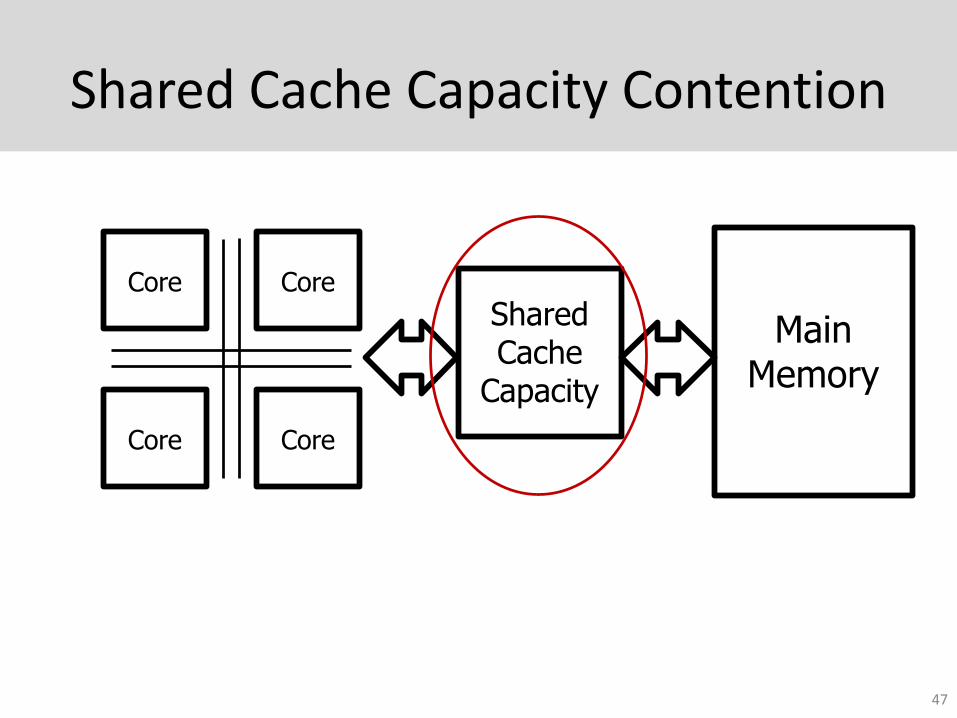
Shared Cache Capacity Contention
47
Main Memory
Shared Cache
Capacity
CoreCore
CoreCore
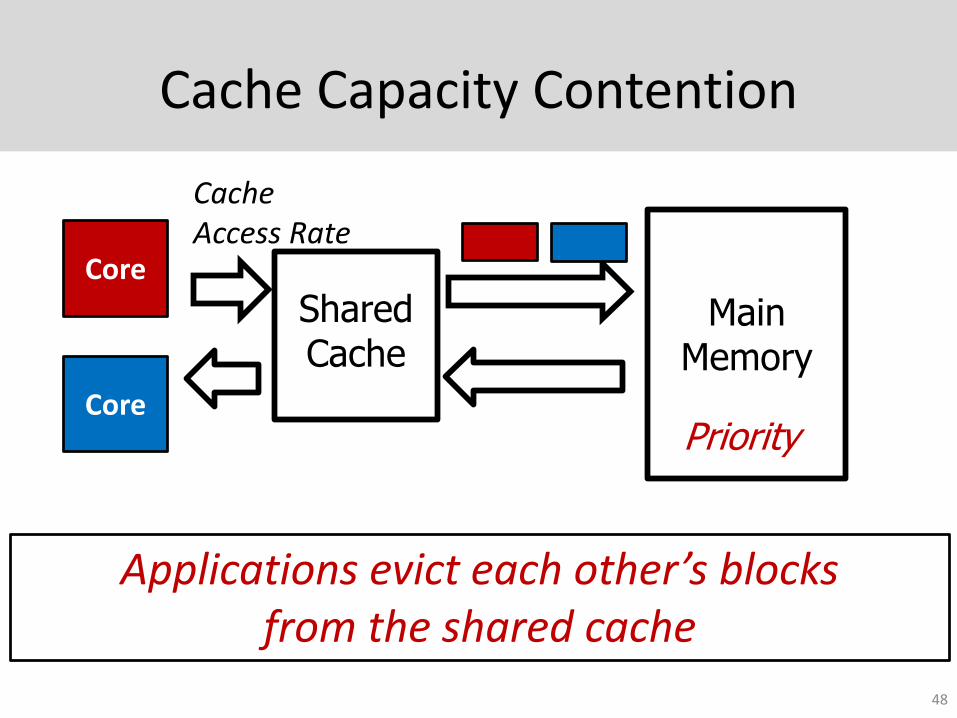
Cache Capacity Contention
48
Main Memory
Shared Cache
Cache Access Rate
Priority
Core
Core
Applications evict each other’s blocks from the shared cache
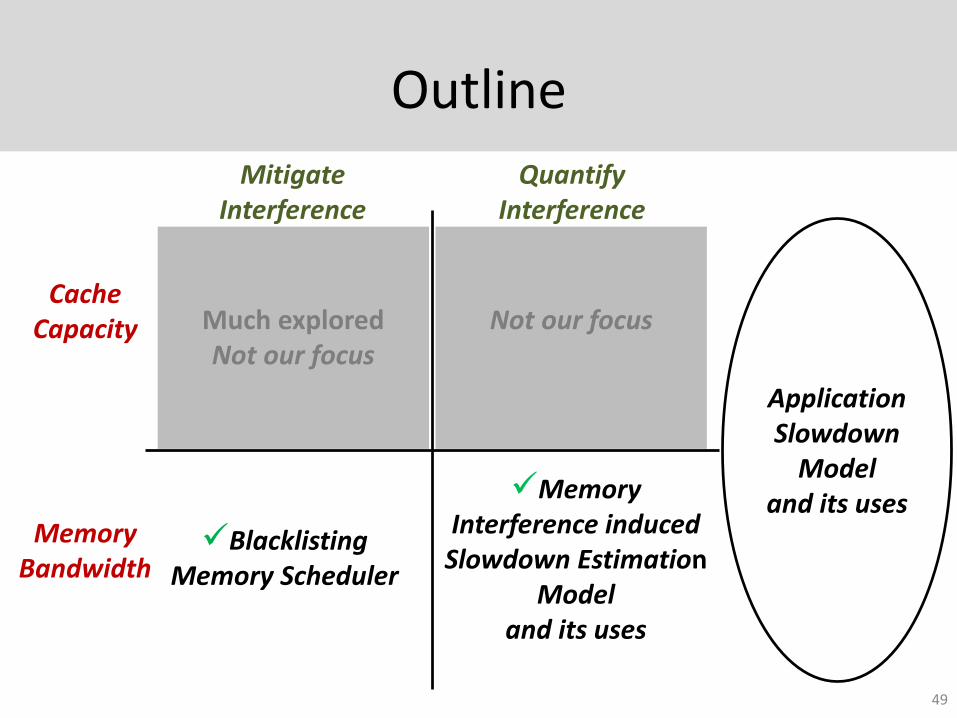
Outline
49
Mitigate Interference
Quantify Interference
Cache Capacity
Memory Bandwidth
Much exploredNot our focus
Blacklisting Memory Scheduler
Not our focus
Memory Interference induced
Slowdown EstimationModel
and its uses
Application Slowdown
Modeland its uses
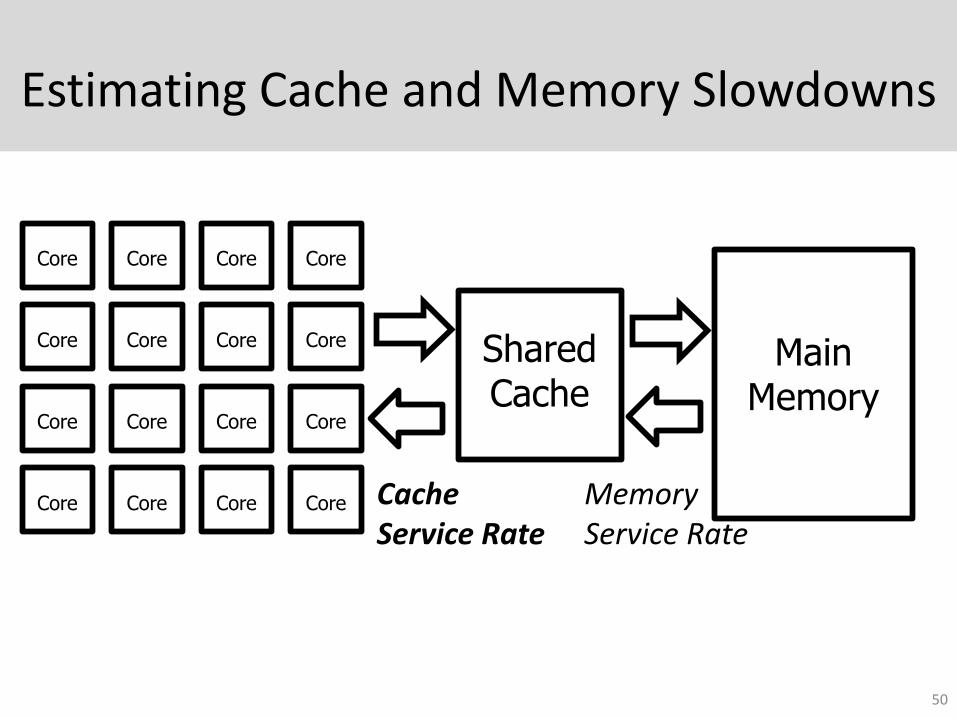
Estimating Cache and Memory Slowdowns
50
Core Core Core Core
Core Core Core Core
Core Core Core Core
Core Core Core Core
Main Memory
Shared Cache
Cache Service Rate
Memory Service Rate
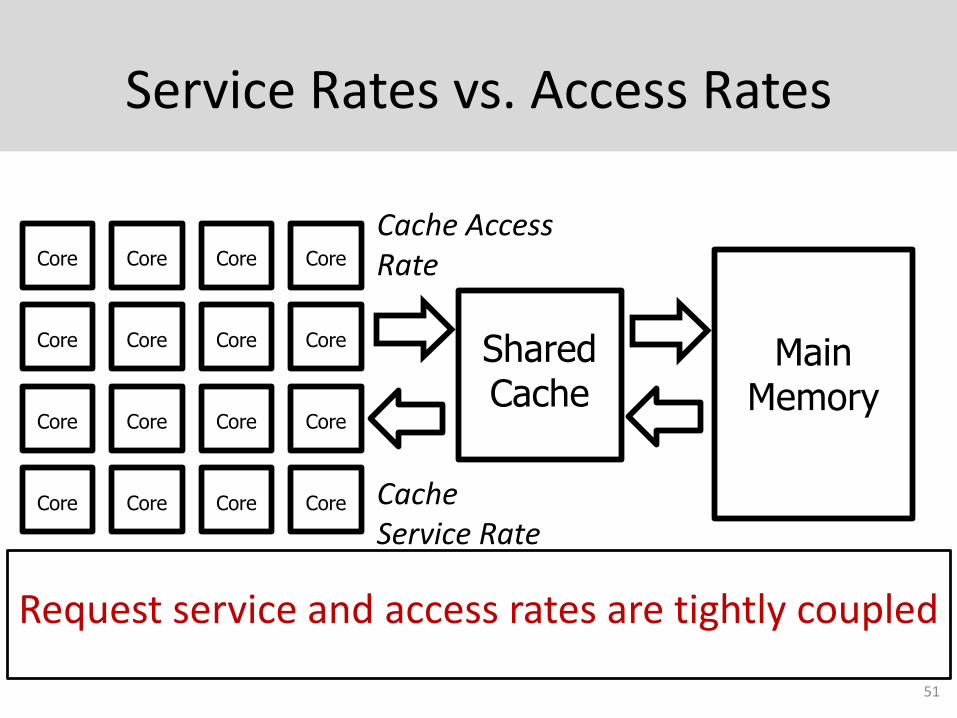
Service Rates vs. Access Rates
51
Request service and access rates are tightly coupled
Core Core Core Core
Core Core Core Core
Core Core Core Core
Core Core Core Core
Main Memory
Shared Cache
Cache Service Rate
Cache Access Rate
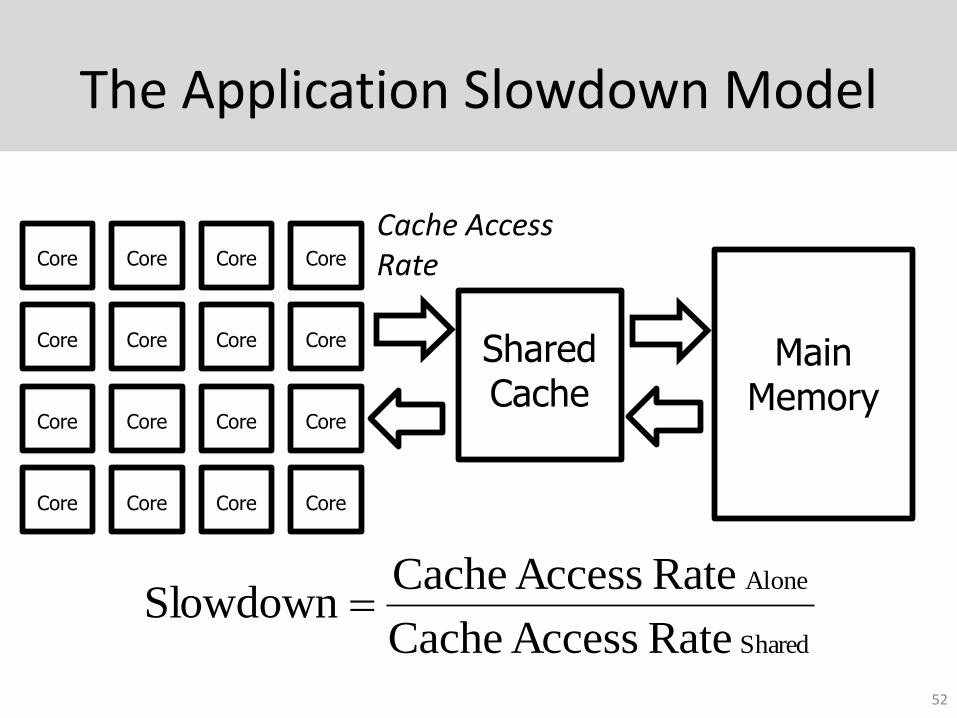
The Application Slowdown Model
52
Core Core Core Core
Core Core Core Core
Core Core Core Core
Core Core Core Core
Main Memory
Shared Cache
Shared
Alone
Rate Access Cache
Rate Access CacheSlowdown
Cache Access Rate
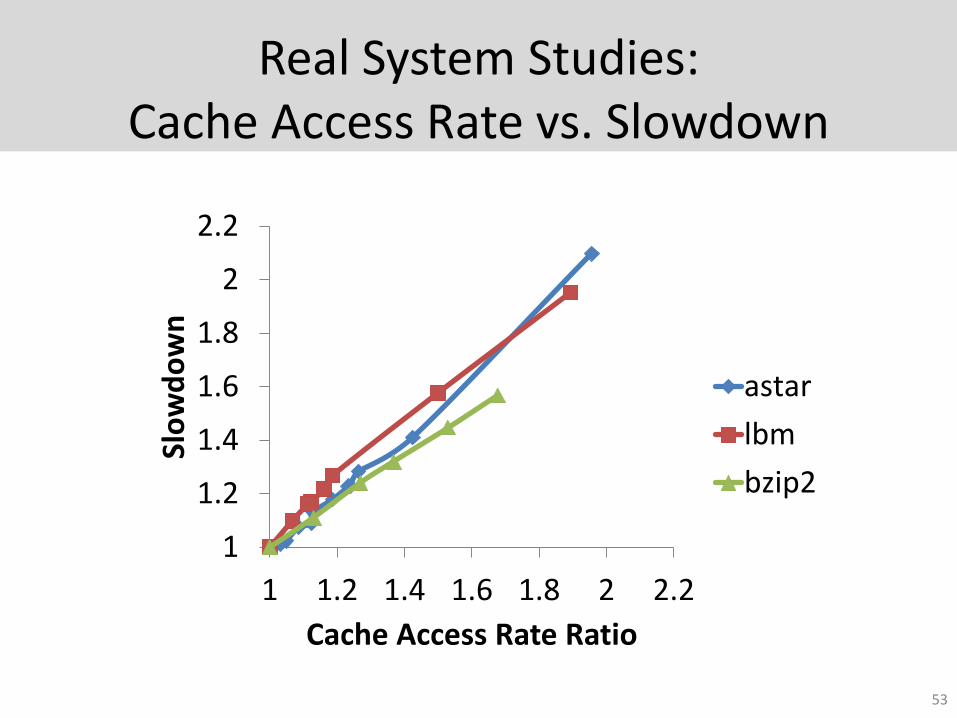
Real System Studies:Cache Access Rate vs. Slowdown
53
1
1.2
1.4
1.6
1.8
2
2.2
1 1.2 1.4 1.6 1.8 2 2.2
Slo
wd
ow
n
Cache Access Rate Ratio
astar
lbm
bzip2
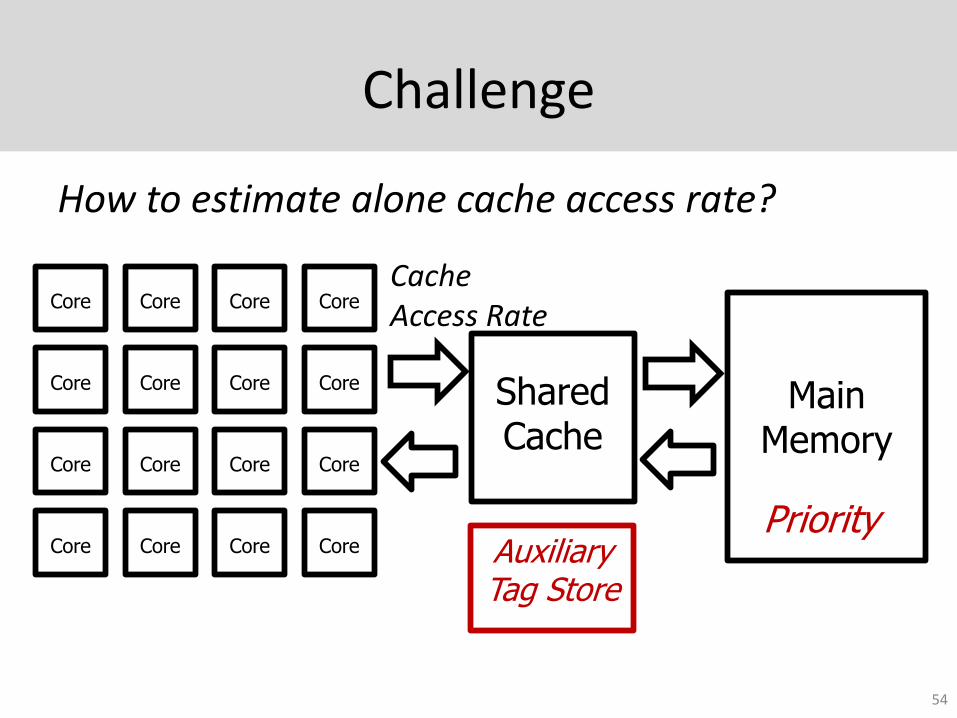
Challenge
How to estimate alone cache access rate?
54
Core Core Core Core
Core Core Core Core
Core Core Core Core
Core Core Core Core
Main Memory
Shared Cache
Cache Access Rate
Auxiliary Tag Store
Priority
Auxiliary Tag Store
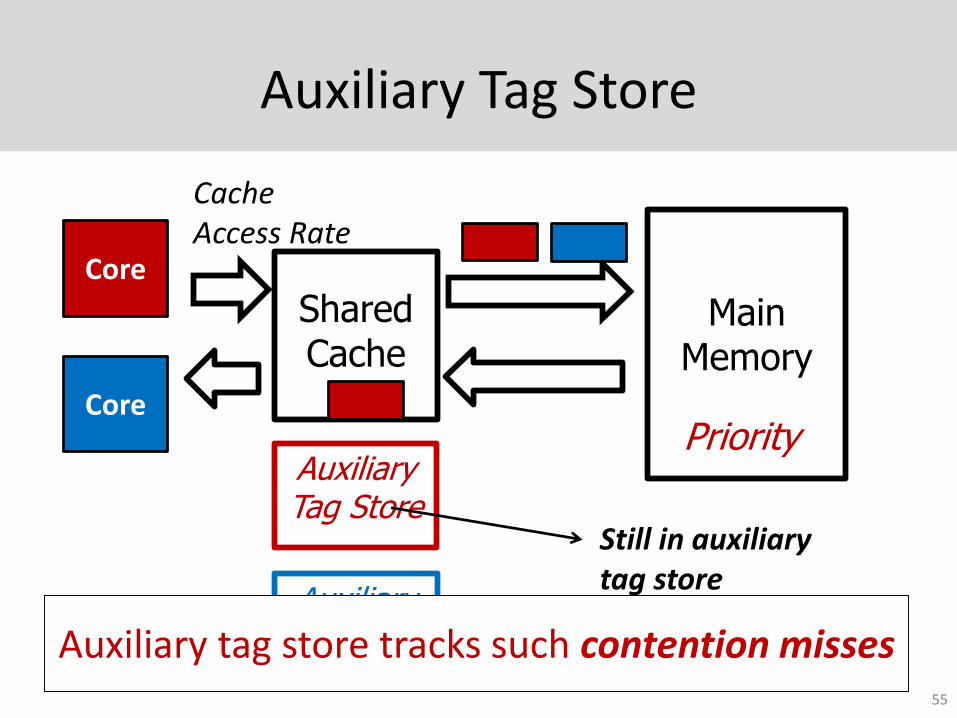
55
Main Memory
Shared Cache
Cache Access Rate
Auxiliary Tag Store
Priority
Core
Core
Still in auxiliary tag store
Auxiliary Tag StoreAuxiliary tag store tracks such contention misses
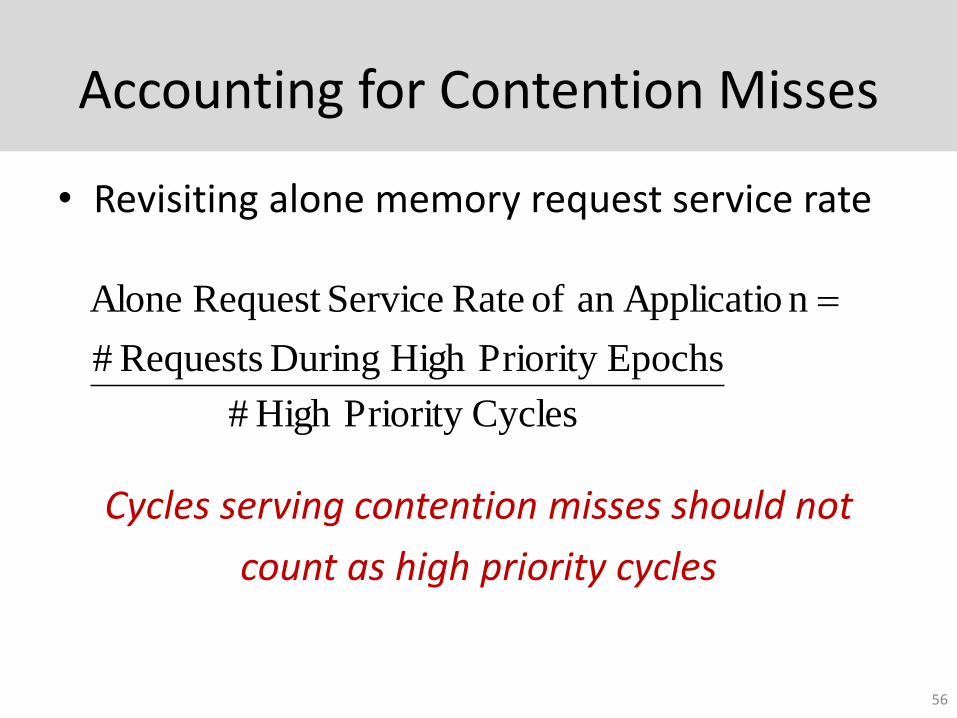
Accounting for Contention Misses
• Revisiting alone memory request service rate
Cycles serving contention misses should not
count as high priority cycles
56
CyclesPriority High #
EpochsPriority High During Requests #
nApplicatioan of Rate ServiceRequest Alone
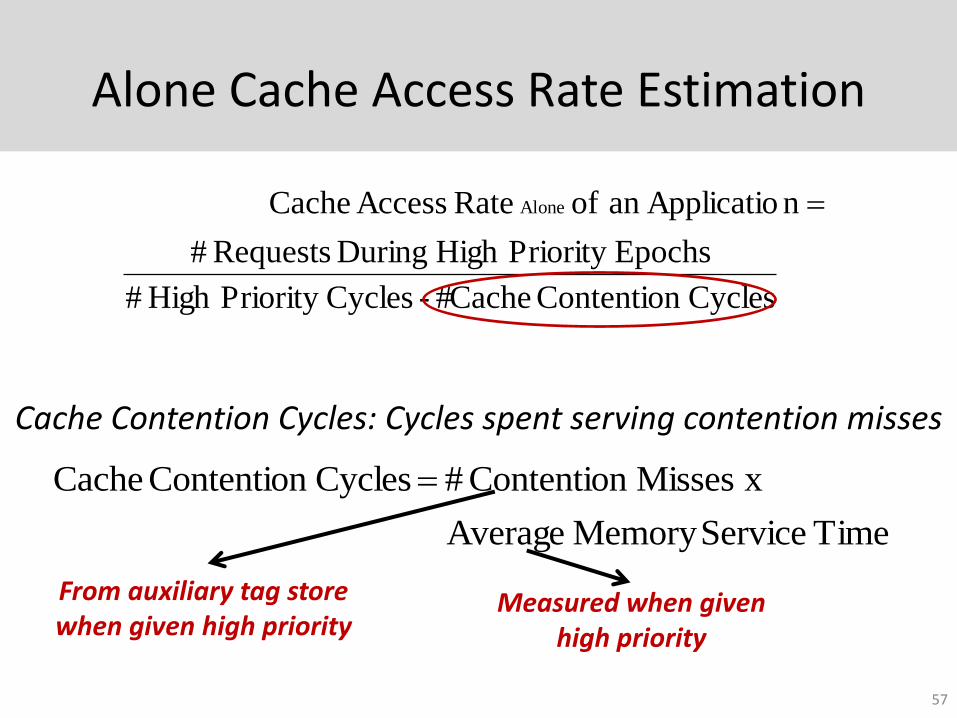
Alone Cache Access Rate Estimation
57
Cycles Contention Cache# - CyclesPriority High #
EpochsPriority High During Requests #
nApplicatioan of Rate Access Cache
Alone
Cache Contention Cycles: Cycles spent serving contention misses
Time ServiceMemory Average
x Misses Contention # Cycles Contention Cache
From auxiliary tag storewhen given high priority
Measured when given high priority
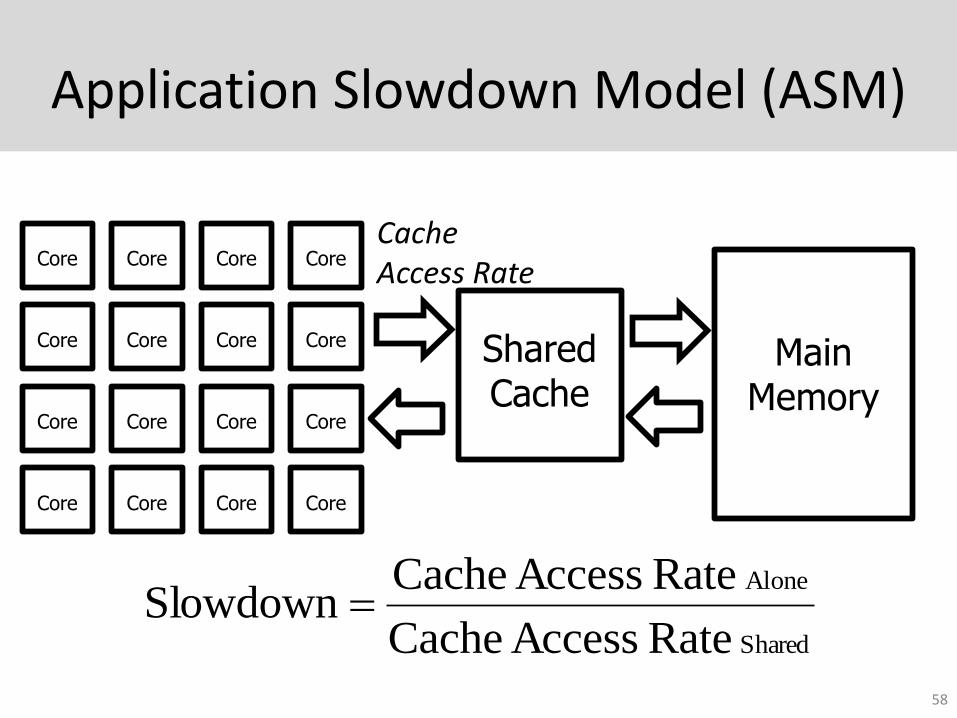
Application Slowdown Model (ASM)
58
Core Core Core Core
Core Core Core Core
Core Core Core Core
Core Core Core Core
Main Memory
Shared Cache
Cache Access Rate
Shared
Alone
Rate Access Cache
Rate Access CacheSlowdown
Previous Work on Slowdown Estimation
• Previous work on slowdown estimation– STFM (Stall Time Fair Memory) Scheduling [Mutlu et al., MICRO ’07]
– FST (Fairness via Source Throttling) [Ebrahimi et al., ASPLOS ’10]
– Per-thread Cycle Accounting [Du Bois et al., HiPEAC ’13]
• Basic Idea:
Shared
Alone
TimeExecution
TimeExecution Slowdown
Count interference experienced by each request59
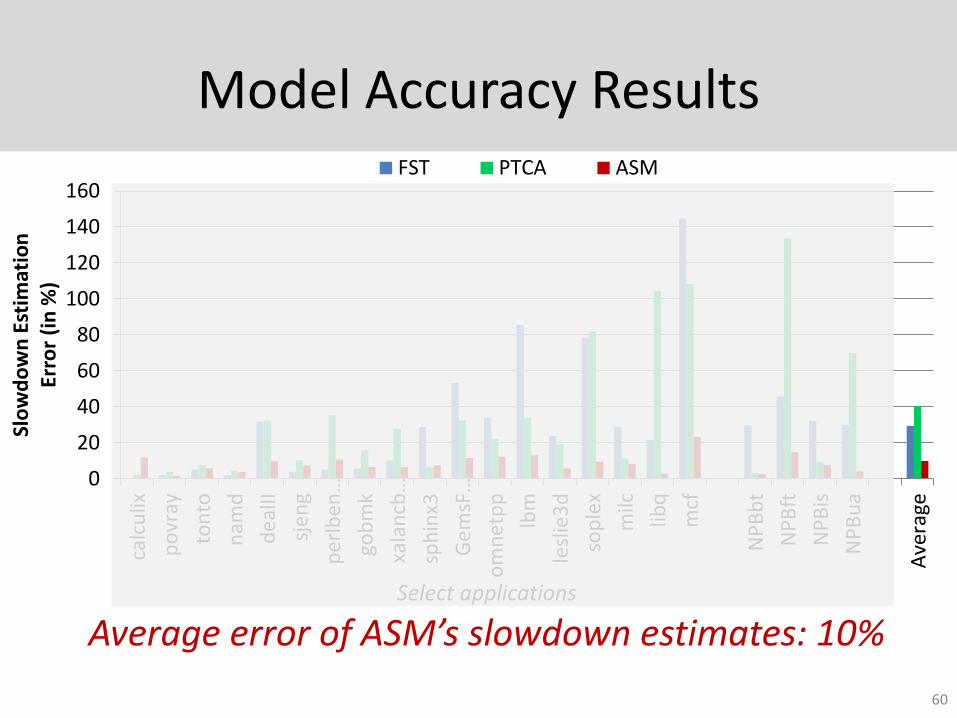
Model Accuracy Results
Average error of ASM’s slowdown estimates: 10%
60
Select applications
0
20
40
60
80
100
120
140
160
calc
ulix
po
vray
ton
to
nam
d
dea
lII
sjen
g
per
lben
…
gob
mk
xala
ncb
…
sph
inx3
Gem
sF…
om
net
pp
lbm
lesl
ie3
d
sop
lex
milc
libq
mcf
NP
Bb
t
NP
Bft
NP
Bis
NP
Bu
a
Ave
rage
Slo
wd
ow
n E
stim
atio
n
Erro
r (i
n %
)
FST PTCA ASM
Leveraging ASM’s Slowdown Estimates
• Slowdown-aware resource allocation for high performance and fairness
• Slowdown-aware resource allocation to bound application slowdowns
• VM migration and admission control schemes [VEE ’15]
• Fair billing schemes in a commodity cloud
61
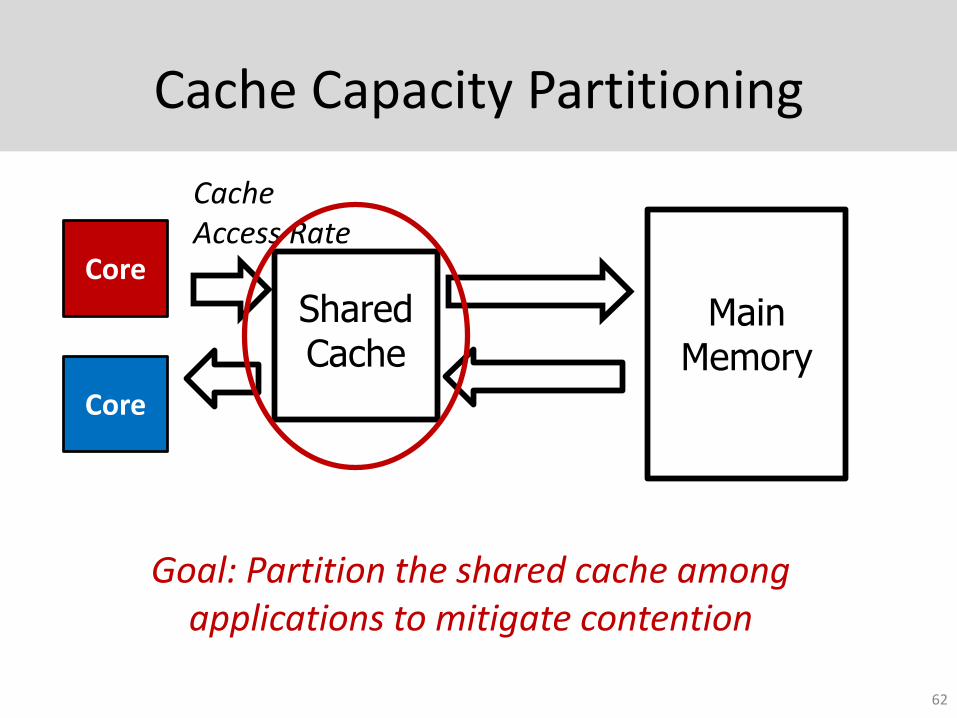
Cache Capacity Partitioning
62
Main Memory
Shared Cache
Cache Access Rate
Core
Core
Goal: Partition the shared cache among applications to mitigate contention
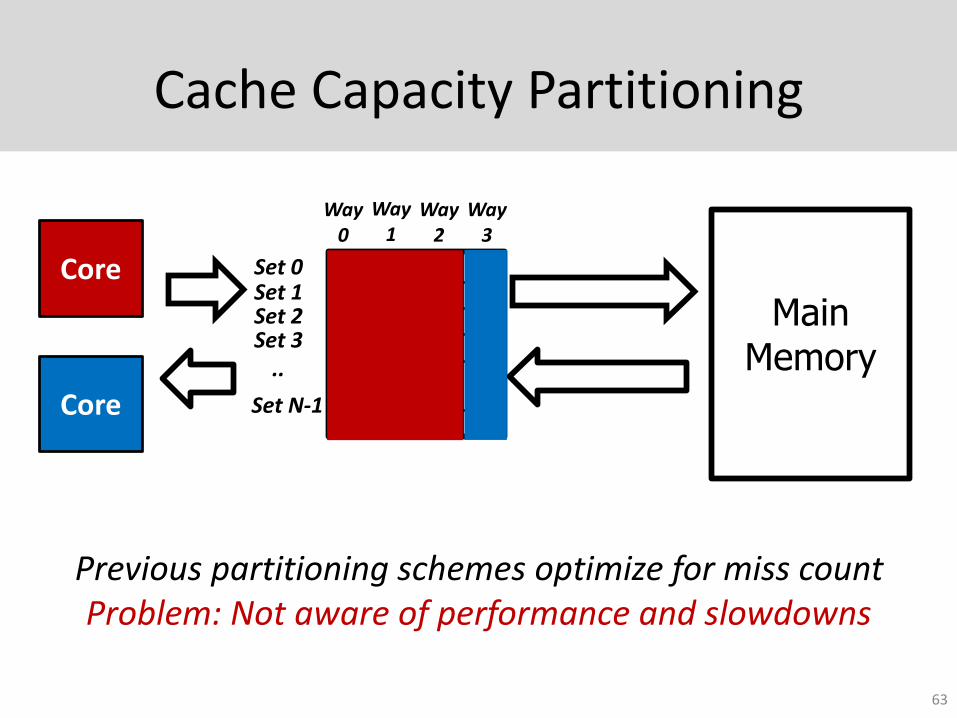
Cache Capacity Partitioning
63
Main Memory
Core
Core
Way 2
Set 0Set 1Set 2Set 3
..
Set N-1
Way 0
Way 1
Way 3
Previous partitioning schemes optimize for miss countProblem: Not aware of performance and slowdowns
ASM-Cache: Slowdown-aware Cache Way Partitioning
• Key Requirement: Slowdown estimates for all possible way partitions
• Extend ASM to estimate slowdown for all possible cache way allocations
• Key Idea: Allocate each way to the application whose slowdown reduces the most
64
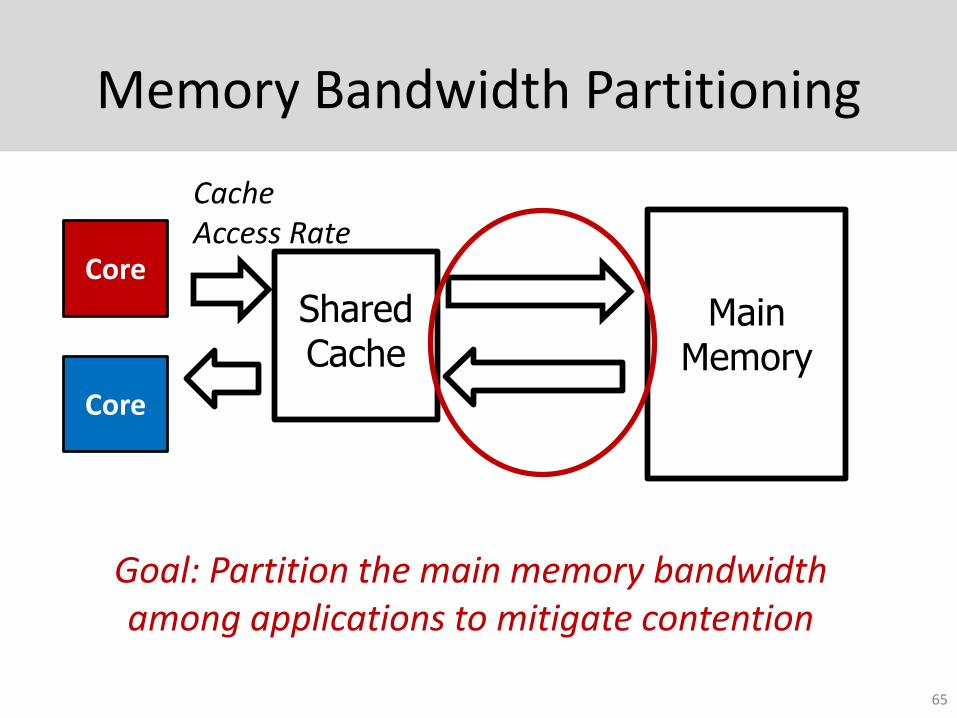
Memory Bandwidth Partitioning
65
Main Memory
Shared Cache
Cache Access Rate
Core
Core
Goal: Partition the main memory bandwidth among applications to mitigate contention
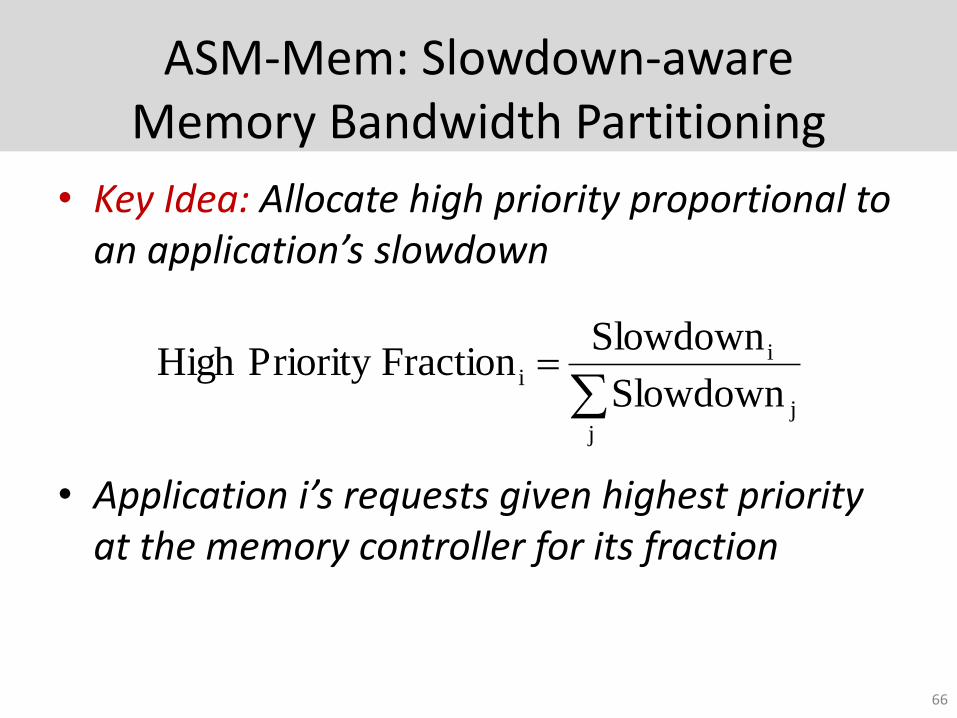
ASM-Mem: Slowdown-aware Memory Bandwidth Partitioning
• Key Idea: Allocate high priority proportional to an application’s slowdown
• Application i’s requests given highest priority at the memory controller for its fraction
66
jj
ii
Slowdown
Slowdown FractionPriority High
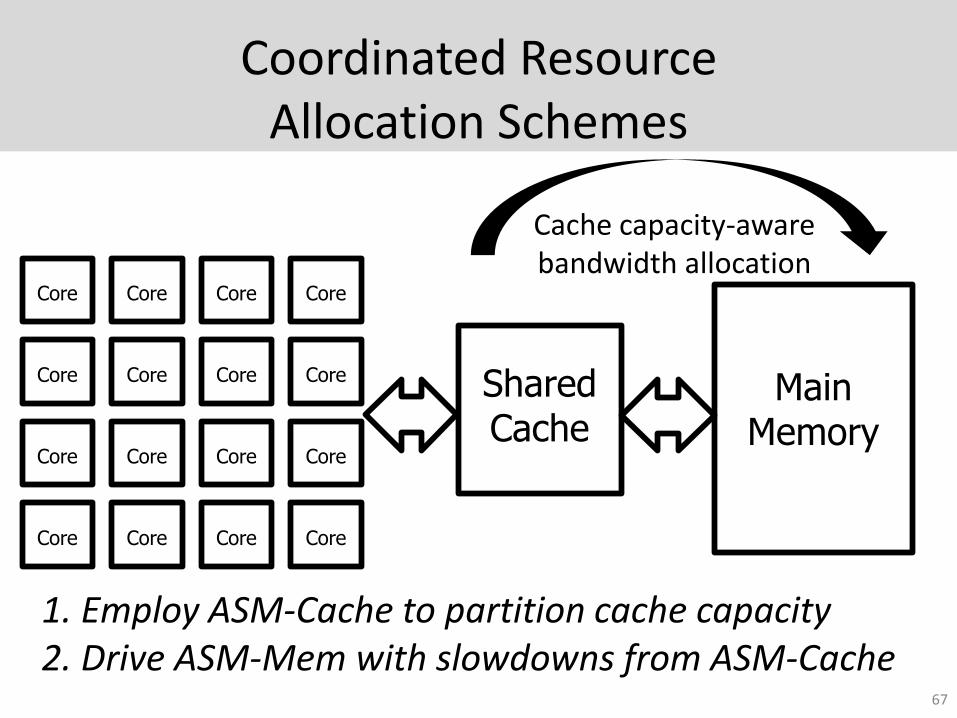
Coordinated Resource Allocation Schemes
67
Core Core Core Core
Core Core Core Core
Core Core Core Core
Core Core Core Core
Main Memory
Shared Cache
Cache capacity-aware bandwidth allocation
1. Employ ASM-Cache to partition cache capacity 2. Drive ASM-Mem with slowdowns from ASM-Cache
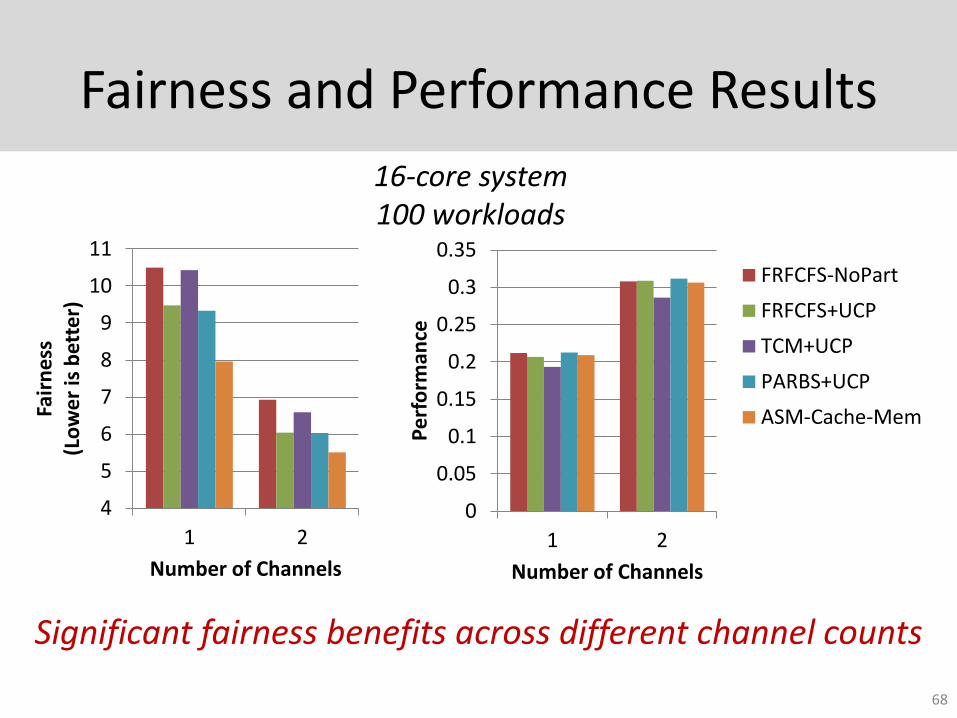
Fairness and Performance Results
68
16-core system 100 workloads
Significant fairness benefits across different channel counts
4
5
6
7
8
9
10
11
1 2
Fair
nes
s (L
ow
er is
bet
ter)
Number of Channels
0
0.05
0.1
0.15
0.2
0.25
0.3
0.35
1 2
Per
form
ance
Number of Channels
FRFCFS-NoPart
FRFCFS+UCP
TCM+UCP
PARBS+UCP
ASM-Cache-Mem

Outline
69
Mitigate Interference
Quantify Interference
Cache Capacity
Memory Bandwidth
Much exploredNot our focus
Blacklisting Memory Scheduler
Not our focus
Memory Interference induced
Slowdown EstimationModel
and its uses
Application Slowdown
Model and its uses
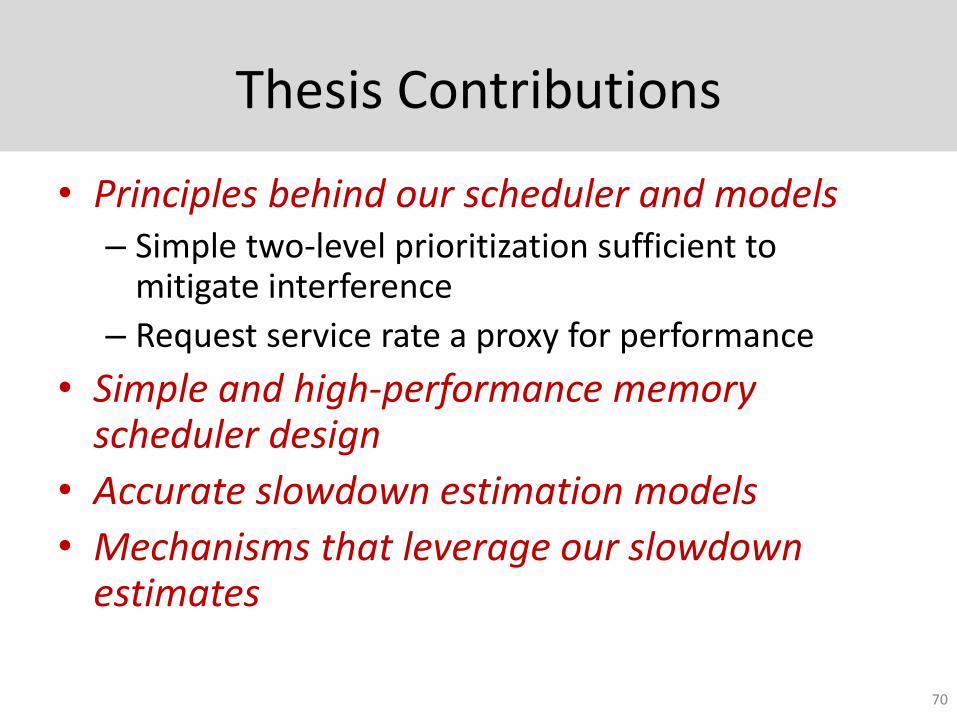
Thesis Contributions
• Principles behind our scheduler and models– Simple two-level prioritization sufficient to
mitigate interference
– Request service rate a proxy for performance
• Simple and high-performance memory scheduler design
• Accurate slowdown estimation models
• Mechanisms that leverage our slowdown estimates
70
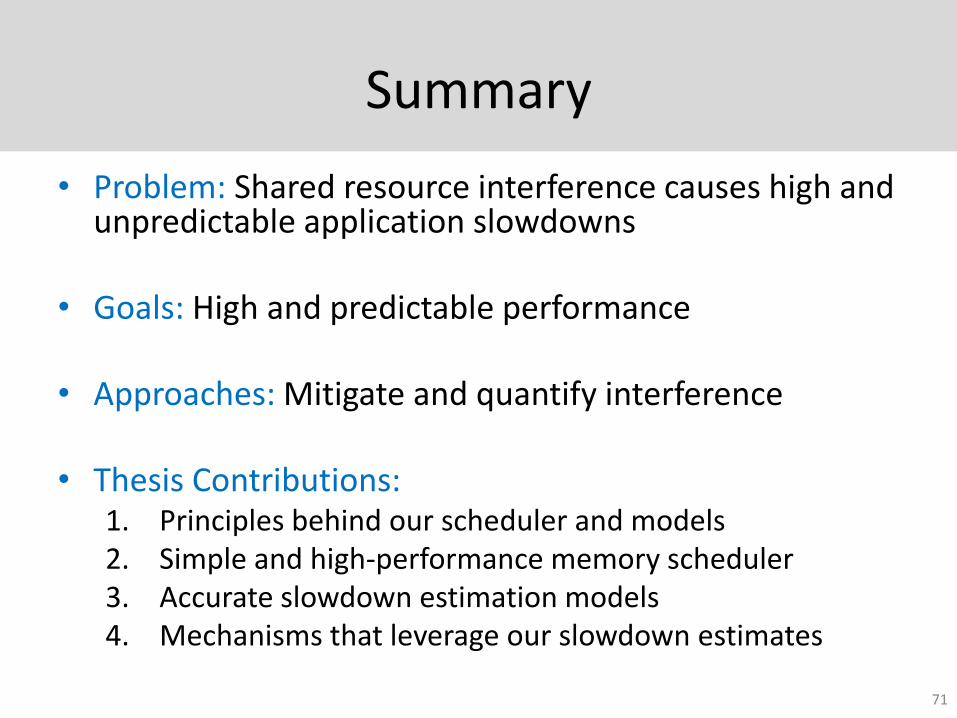
Summary
• Problem: Shared resource interference causes high and unpredictable application slowdowns
• Goals: High and predictable performance
• Approaches: Mitigate and quantify interference
• Thesis Contributions:1. Principles behind our scheduler and models 2. Simple and high-performance memory scheduler3. Accurate slowdown estimation models4. Mechanisms that leverage our slowdown estimates
71
Future Work
• Leveraging slowdown estimates at the system and cluster level
• Interference estimation and performance predictability for multithreaded applications
• Performance predictability in heterogeneous systems
• Coordinating the management of main memory and storage
72
Research Summary
• Predictable performance in multicore systems [HPCA ’13, SuperFri ’14, KIISE ’15]
• High and predictable performance in heterogeneous systems [ISCA ’12, SAFARI Tech Report ’15]
• Low-complexity memory scheduling [ICCD ’14]
• Memory channel partitioning [MICRO ’11]
• Architecture-aware cluster management [VEE ’15]
• Low-latency DRAM architectures [HPCA ’13]
73
Backup Slides
74
Blacklisting
75
Problems with Previous Application-aware Memory Schedulers
1. Full ranking increases hardware complexity
2. Full ranking causes unfair slowdowns
76
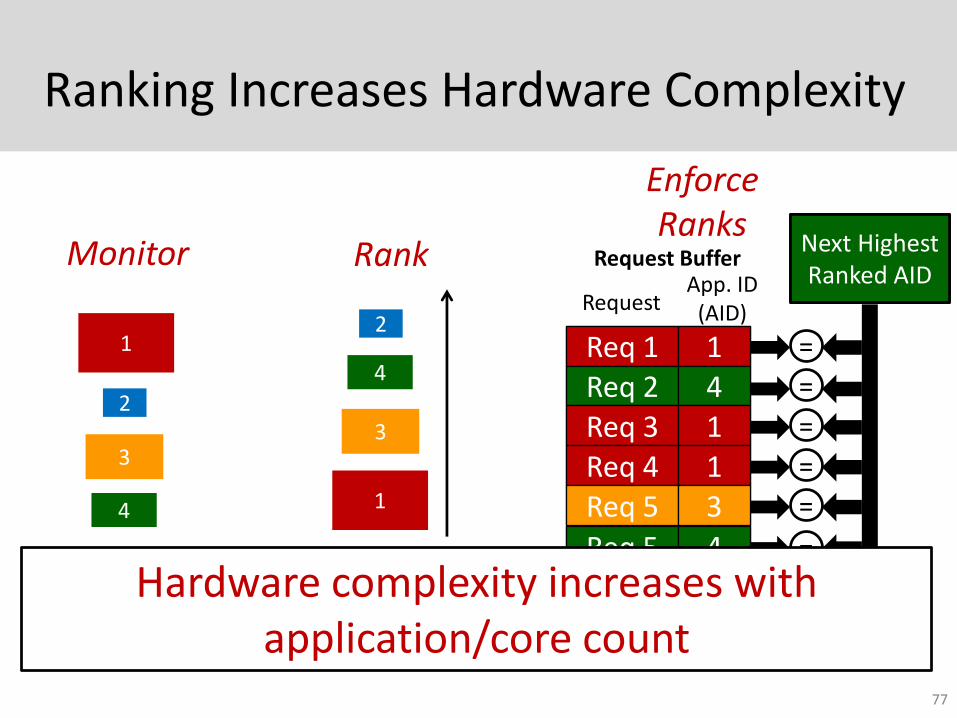
Ranking Increases Hardware Complexity
77
Highest Ranked AID
EnforceRanks
Req 1 1Req 2 4Req 3 1Req 4 1Req 5 3
Req 7 1Req 8 3
Request Buffer
Req 5 4
RequestApp. ID
(AID)
Next Highest Ranked AID
Monitor Rank
4
3
2
12
4
3
1
=
=
=
=
=
=
=
=
Hardware complexity increases with application/core count
78
0
1
2
3
4
5
6
7
8
9
Cri
tica
l Pat
h L
ate
ncy
(in
ns)
App-unaware
App-aware
0
10000
20000
30000
40000
50000
60000
70000
80000
Sch
ed
ule
r A
rea
(in
sq
uar
e u
m)
App-unaware
App-aware
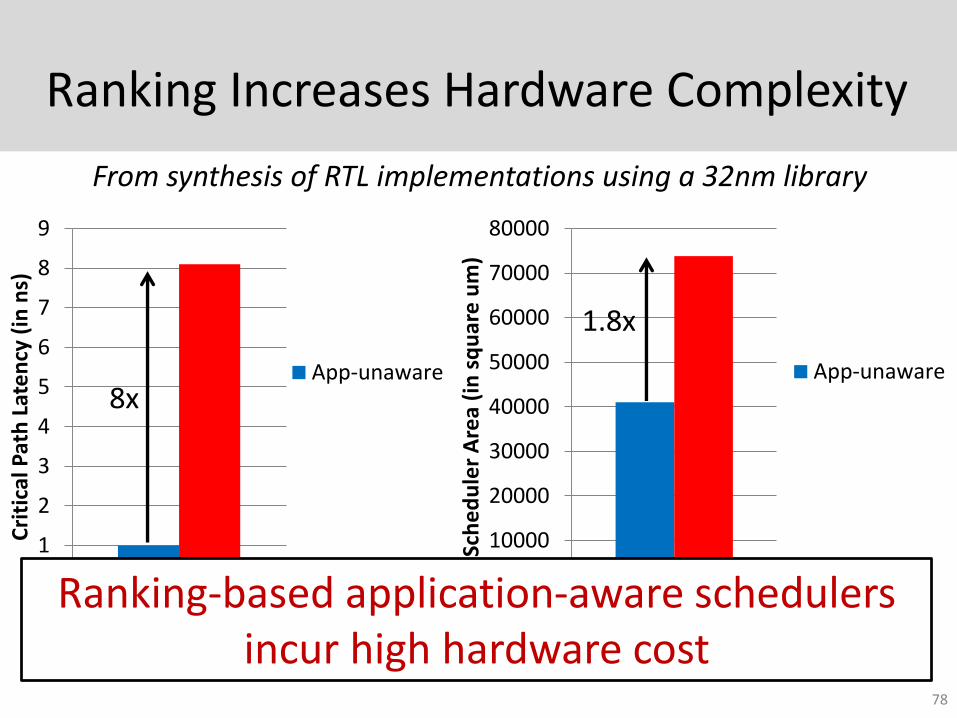
Ranking Increases Hardware Complexity
8x
1.8x
Ranking-based application-aware schedulers incur high hardware cost
From synthesis of RTL implementations using a 32nm library
Problems with Previous Application-aware Memory Schedulers
1. Full ranking increases hardware complexity
2. Full ranking causes unfair slowdowns
79
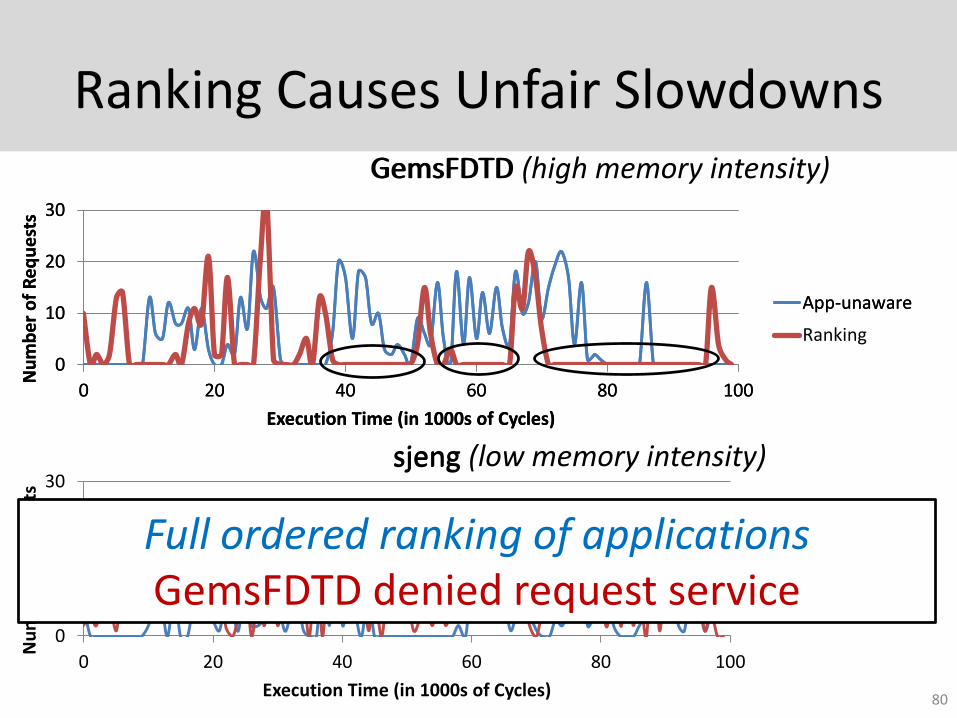
Ranking Causes Unfair Slowdowns
80
GemsFDTD
0
10
20
30
0 20 40 60 80 100
Nu
mb
er
of
Re
qu
est
s
Execution Time (in 1000s of Cycles)
App-unaware
Ranking
GemsFDTD (high memory intensity)
sjeng
0
10
20
30
0 20 40 60 80 100
Nu
mb
er
of
Re
qu
est
s
Execution Time (in 1000s of Cycles)
App-unaware
Ranking
sjeng (low memory intensity)
0
10
20
30
0 20 40 60 80 100
Nu
mb
er
of
Re
qu
est
s
Execution Time (in 1000s of Cycles)
App-unaware
Ranking
Full ordered ranking of applicationsGemsFDTD denied request service
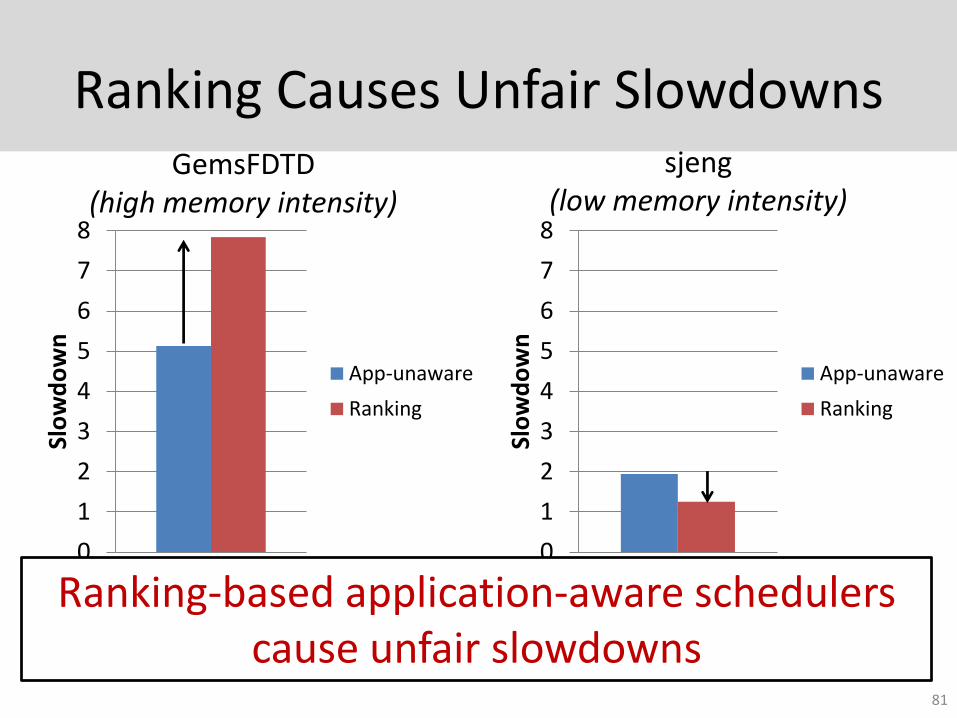
Ranking Causes Unfair Slowdowns
81
0
1
2
3
4
5
6
7
8
Slo
wd
ow
n
App-unaware
Ranking
0
1
2
3
4
5
6
7
8
Slo
wd
ow
n
App-unaware
Ranking
Ranking-based application-aware schedulers cause unfair slowdowns
GemsFDTD(high memory intensity)
sjeng(low memory intensity)
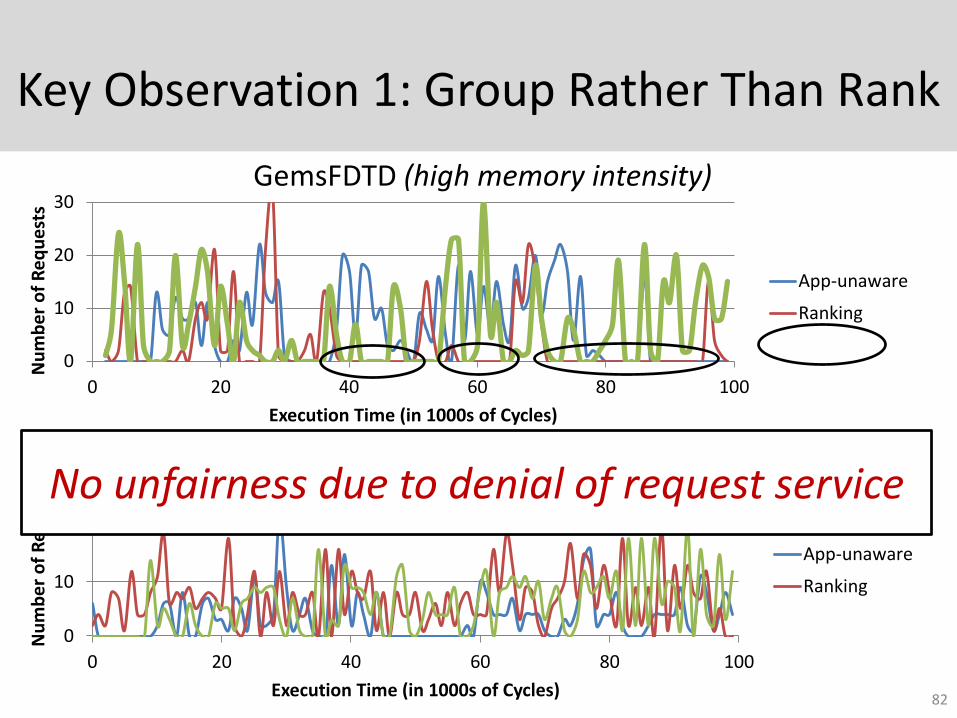
Key Observation 1: Group Rather Than Rank
82
GemsFDTD (high memory intensity)
sjeng (low memory intensity)
0
10
20
30
0 20 40 60 80 100
Nu
mb
er
of
Re
qu
est
s
Execution Time (in 1000s of Cycles)
App-unaware
Ranking
Grouping
0
10
20
30
0 20 40 60 80 100
Nu
mb
er
of
Re
qu
est
s
Execution Time (in 1000s of Cycles)
App-unaware
Ranking
Grouping
No unfairness due to denial of request service
83
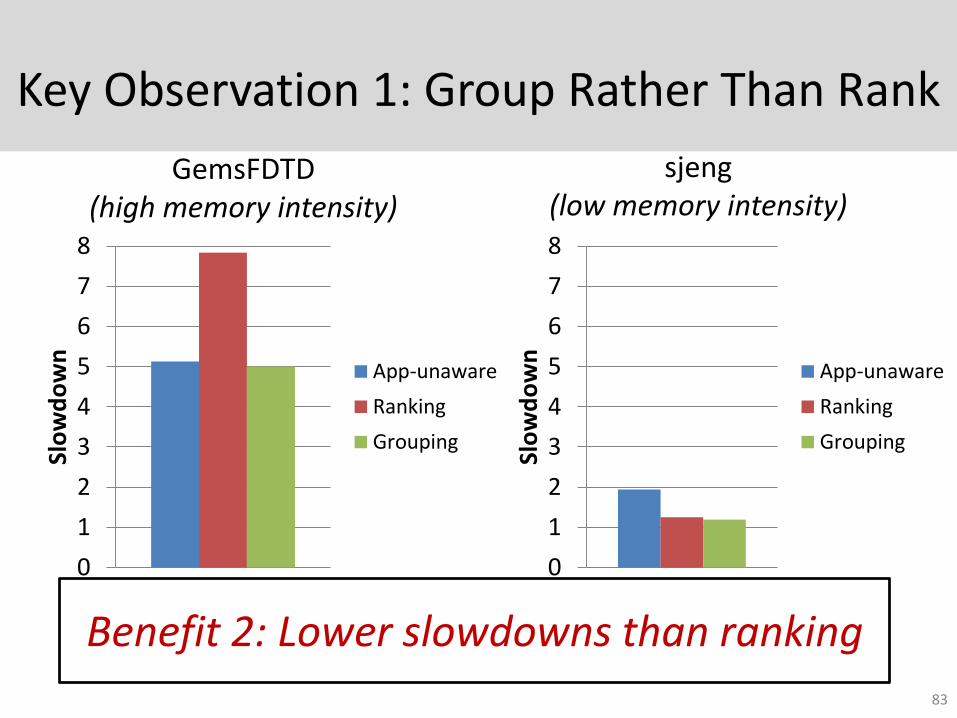
Key Observation 1: Group Rather Than Rank
0
1
2
3
4
5
6
7
8
Slo
wd
ow
n
App-unaware
Ranking
Grouping
0
1
2
3
4
5
6
7
8
Slo
wd
ow
n
App-unaware
Ranking
Grouping
Benefit 2: Lower slowdowns than ranking
GemsFDTD(high memory intensity)
sjeng(low memory intensity)
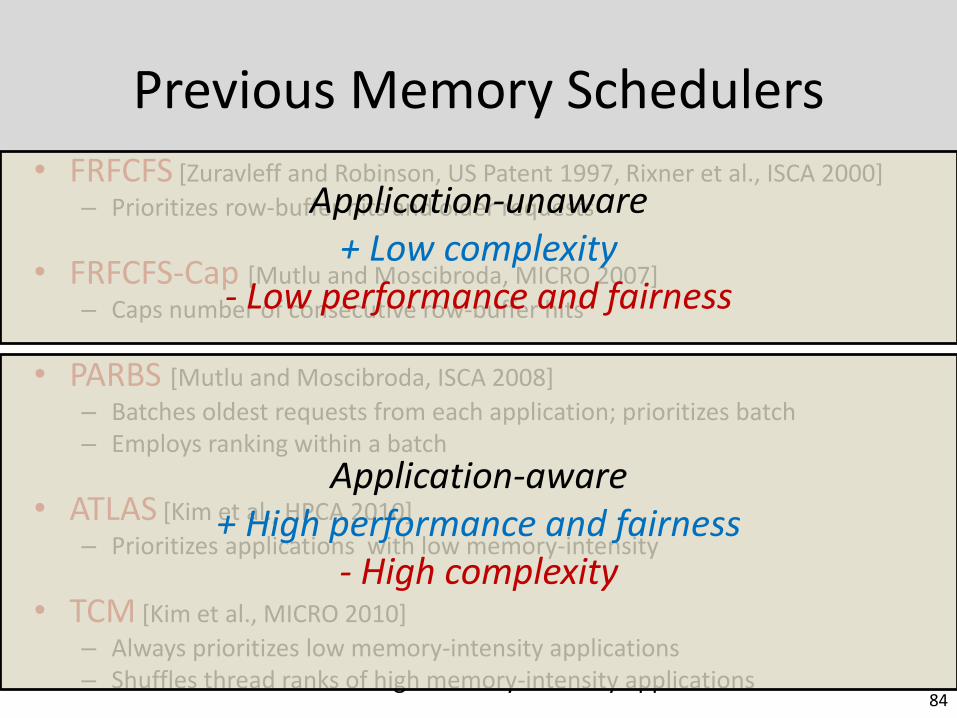
Previous Memory Schedulers
• FRFCFS [Zuravleff and Robinson, US Patent 1997, Rixner et al., ISCA 2000]
– Prioritizes row-buffer hits and older requests
• FRFCFS-Cap [Mutlu and Moscibroda, MICRO 2007]
– Caps number of consecutive row-buffer hits
• PARBS [Mutlu and Moscibroda, ISCA 2008]
– Batches oldest requests from each application; prioritizes batch– Employs ranking within a batch
• ATLAS [Kim et al., HPCA 2010]
– Prioritizes applications with low memory-intensity
• TCM [Kim et al., MICRO 2010]
– Always prioritizes low memory-intensity applications– Shuffles thread ranks of high memory-intensity applications
84
Application-unaware+ Low complexity
- Low performance and fairness
Application-aware+ High performance and fairness
- High complexity
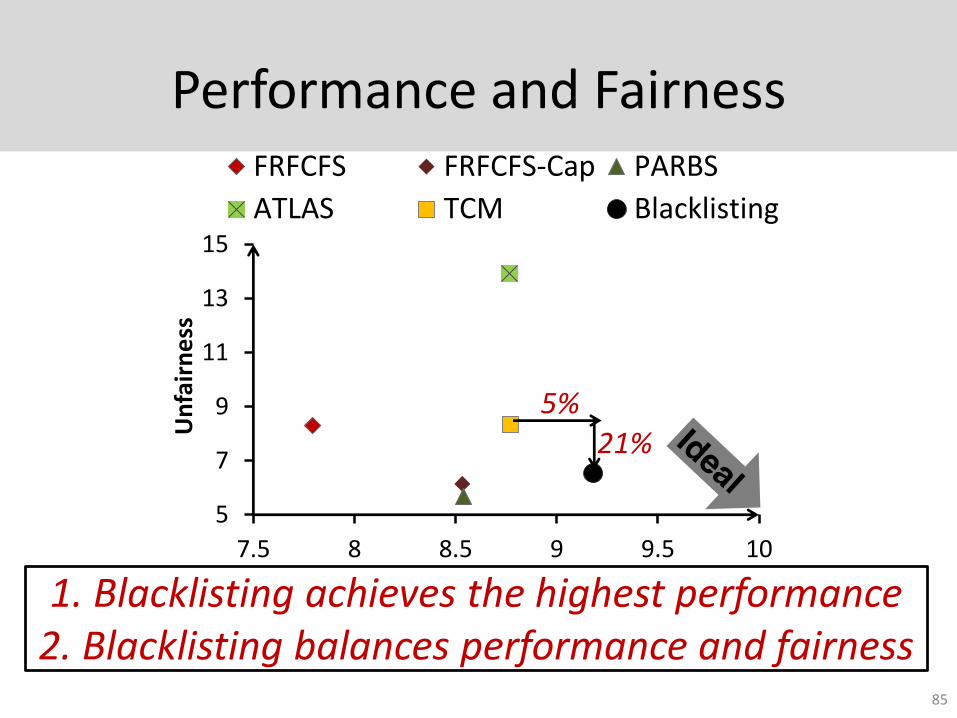
Performance and Fairness
85
5
7
9
11
13
15
7.5 8 8.5 9 9.5 10
Un
fair
ne
ss
Performance
FRFCFS FRFCFS-Cap PARBS
ATLAS TCM Blacklisting
5%21%
1. Blacklisting achieves the highest performance 2. Blacklisting balances performance and fairness
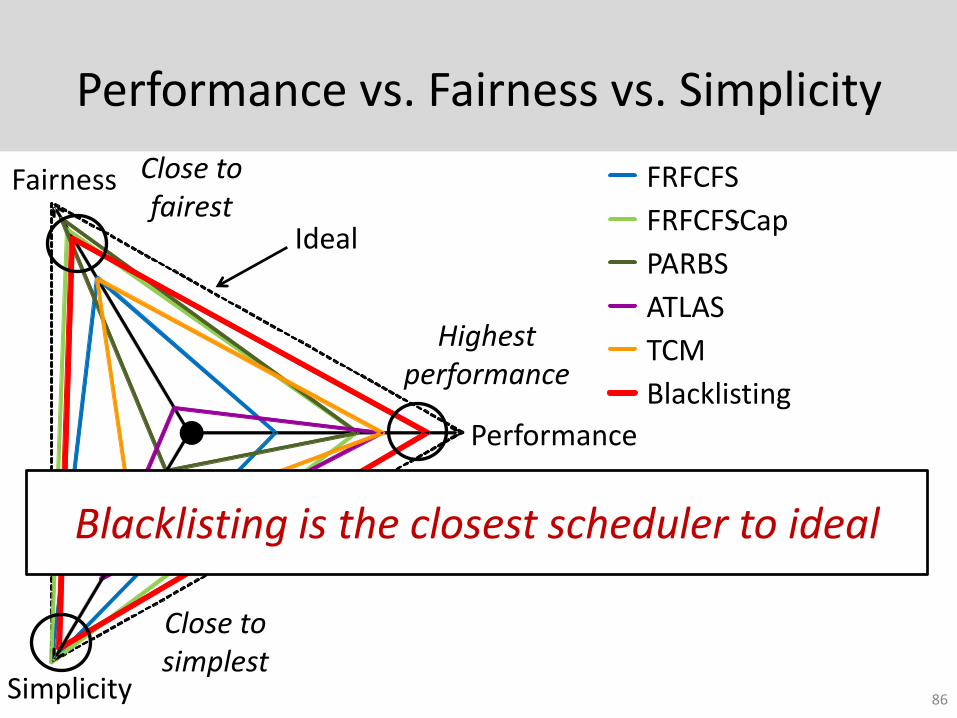
Performance vs. Fairness vs. Simplicity
86
Performance
Fairness
Simplicity
FRFCFS
FRFCFS-Cap
PARBS
ATLAS
TCM
Blacklisting
Ideal
Highest performance
Close to simplest
Close to fairest
Blacklisting is the closest scheduler to ideal
Summary
• Applications’ requests interfere at main memory• Prevalent solution approach
– Application-aware memory request scheduling
• Key shortcoming of previous schedulers: Full ranking– High hardware complexity– Unfair application slowdowns
• Our Solution: Blacklisting memory scheduler– Sufficient to group applications rather than rank– Group by tracking number of consecutive requests
• Much simpler than application-aware schedulers at higher performance and fairness
87
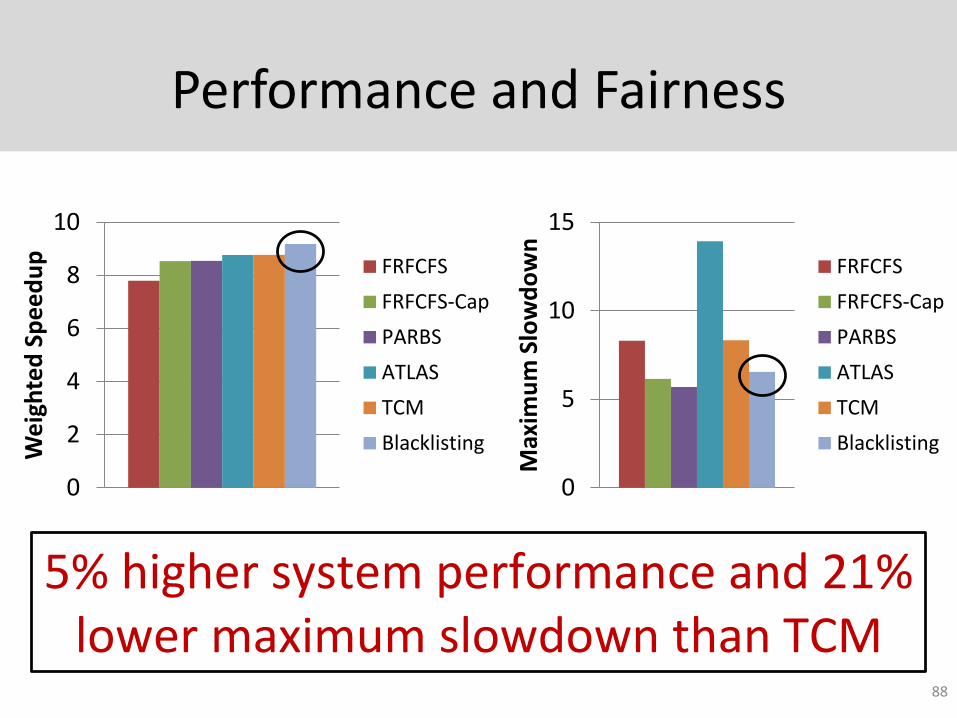
Performance and Fairness
0
2
4
6
8
10
We
igh
ted
Sp
ee
du
p FRFCFS
FRFCFS-Cap
PARBS
ATLAS
TCM
Blacklisting
0
5
10
15
Max
imu
m S
low
do
wn
FRFCFS
FRFCFS-Cap
PARBS
ATLAS
TCM
Blacklisting
5% higher system performance and 21% lower maximum slowdown than TCM
88
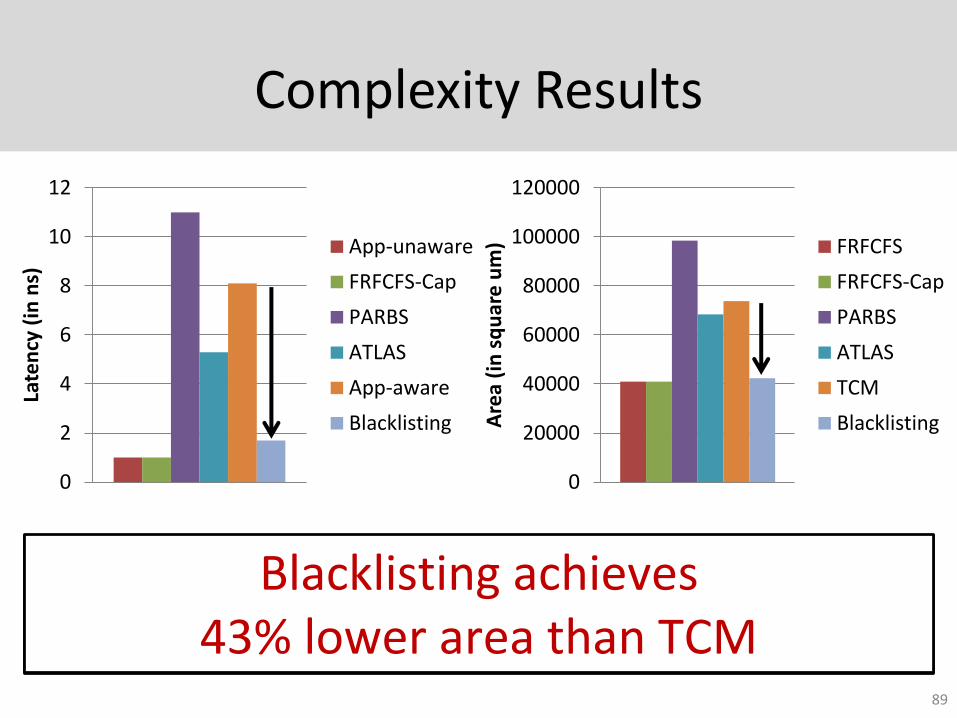
Complexity Results
Blacklisting achieves 70% lower latency than TCM
89
Blacklisting achieves 43% lower area than TCM
0
2
4
6
8
10
12
Late
ncy
(in
ns)
App-unaware
FRFCFS-Cap
PARBS
ATLAS
App-aware
Blacklisting
0
20000
40000
60000
80000
100000
120000
Are
a (i
n s
qu
are
um
) FRFCFS
FRFCFS-Cap
PARBS
ATLAS
TCM
Blacklisting
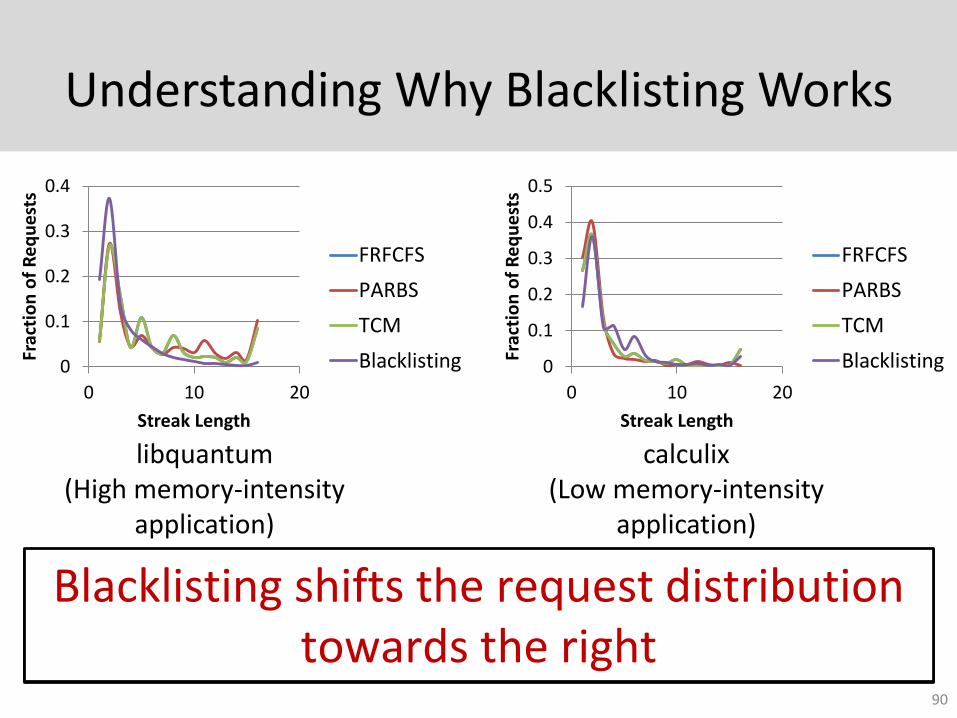
Understanding Why Blacklisting Works
0
0.1
0.2
0.3
0.4
0 10 20
Frac
tio
n o
f R
eq
ue
sts
Streak Length
FRFCFS
PARBS
TCM
Blacklisting 0
0.1
0.2
0.3
0.4
0.5
0 10 20
Frac
tio
n o
f R
eq
ue
sts
Streak Length
FRFCFS
PARBS
TCM
Blacklisting
libquantum(High memory-intensity
application)
Blacklisting shifts the request distribution towards the left
calculix(Low memory-intensity
application)
Blacklisting shifts the request distribution towards the right
90
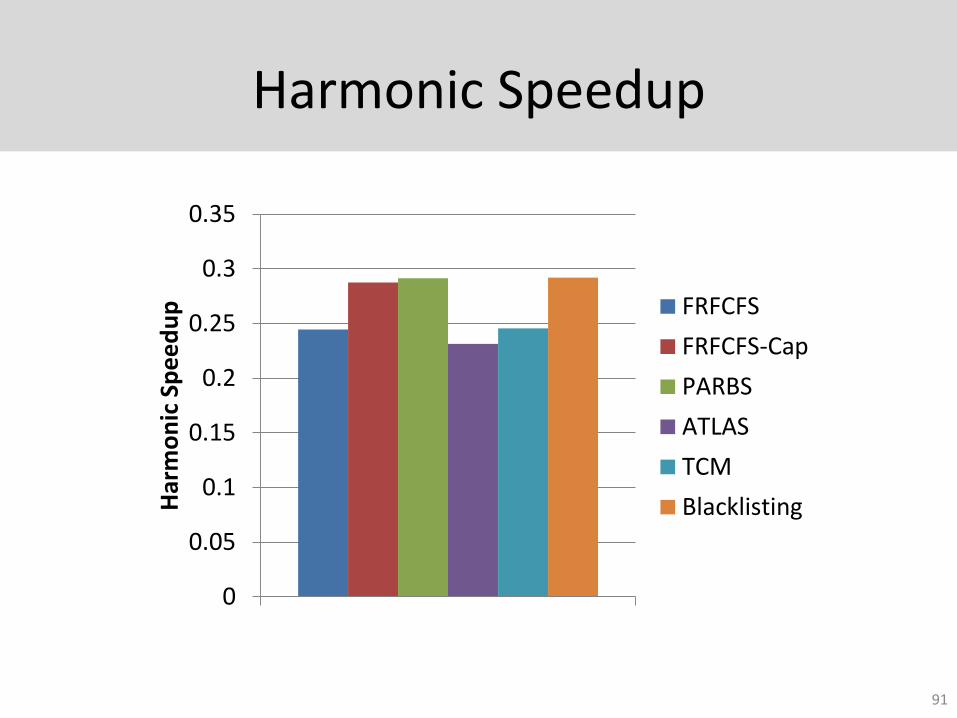
Harmonic Speedup
91
0
0.05
0.1
0.15
0.2
0.25
0.3
0.35
Har
mo
nic
Sp
ee
du
p FRFCFS
FRFCFS-Cap
PARBS
ATLAS
TCM
Blacklisting
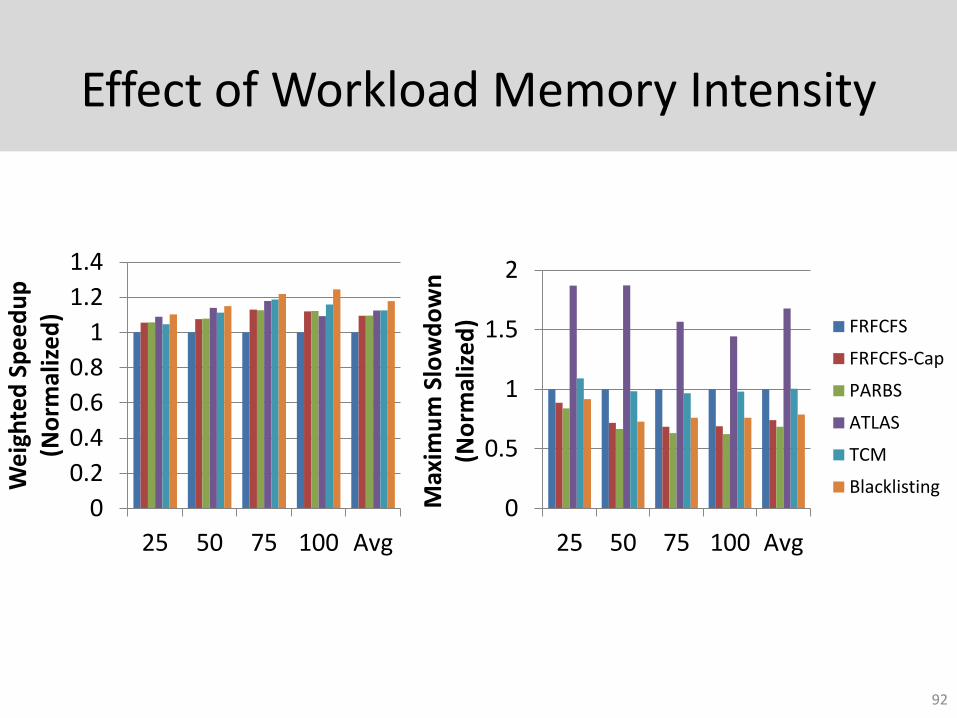
Effect of Workload Memory Intensity
92
0
0.2
0.4
0.6
0.8
1
1.2
1.4
25 50 75 100 Avg
We
igh
ted
Sp
ee
du
p
(No
rmal
ize
d)
0
0.5
1
1.5
2
25 50 75 100 Avg
Max
imu
m S
low
do
wn
(N
orm
aliz
ed
) FRFCFS
FRFCFS-Cap
PARBS
ATLAS
TCM
Blacklisting
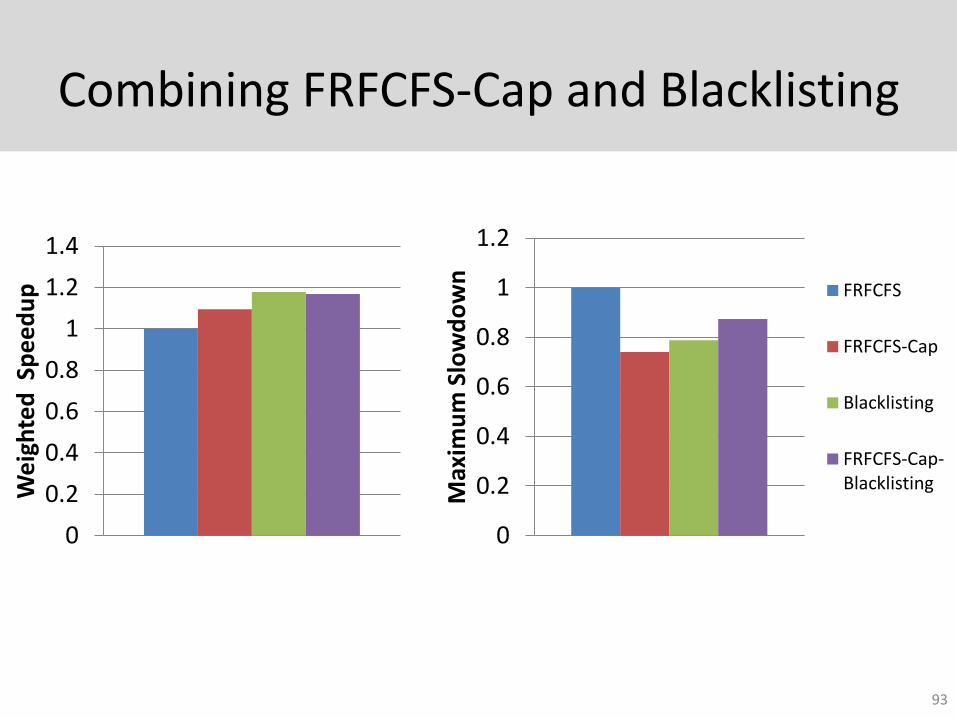
Combining FRFCFS-Cap and Blacklisting
93
0
0.2
0.4
0.6
0.8
1
1.2
1.4
We
igh
ted
Sp
ee
du
p
0
0.2
0.4
0.6
0.8
1
1.2
Max
imu
m S
low
do
wn
FRFCFS
FRFCFS-Cap
Blacklisting
FRFCFS-Cap-Blacklisting
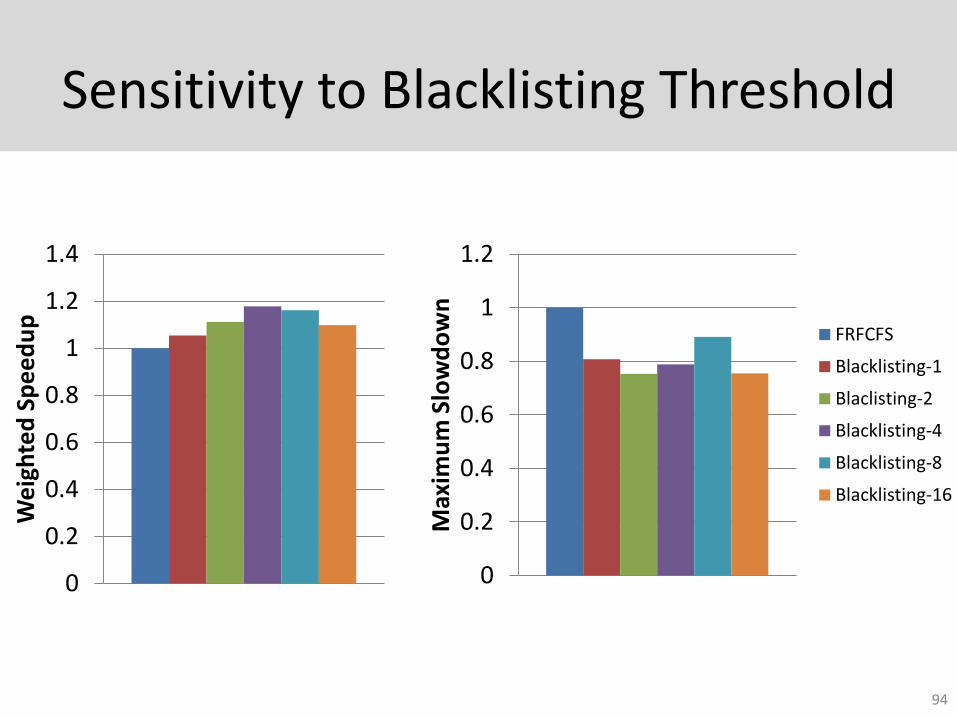
Sensitivity to Blacklisting Threshold
94
0
0.2
0.4
0.6
0.8
1
1.2
1.4
We
igh
ted
Sp
ee
du
p
0
0.2
0.4
0.6
0.8
1
1.2
Max
imu
m S
low
do
wn
FRFCFS
Blacklisting-1
Blaclisting-2
Blacklisting-4
Blacklisting-8
Blacklisting-16
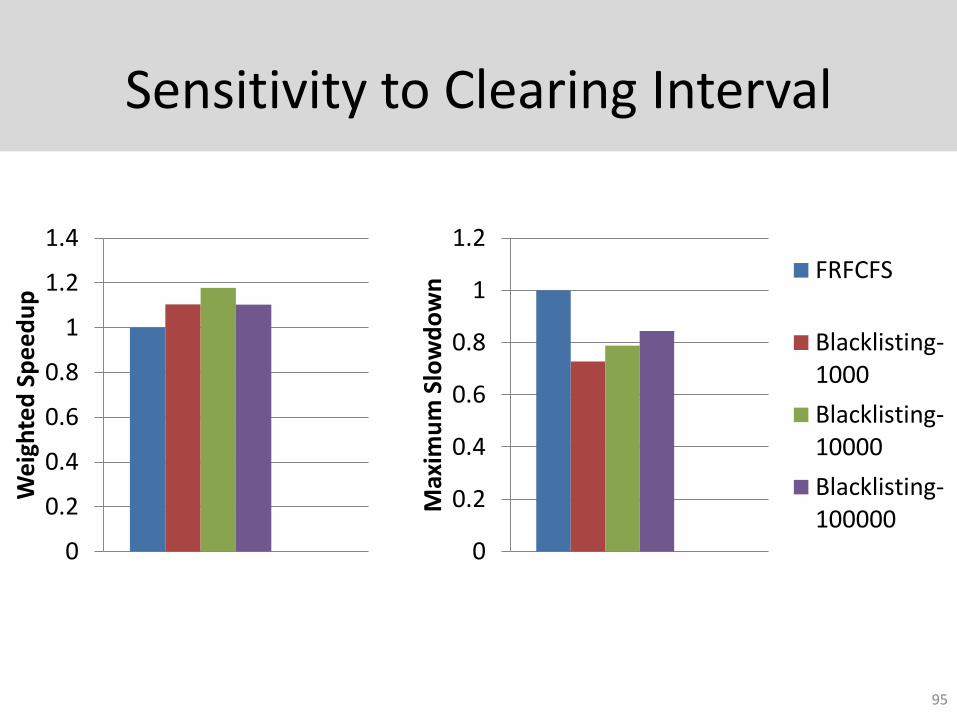
Sensitivity to Clearing Interval
95
0
0.2
0.4
0.6
0.8
1
1.2
1.4
We
igh
ted
Sp
ee
du
p
0
0.2
0.4
0.6
0.8
1
1.2
Max
imu
m S
low
do
wn
FRFCFS
Blacklisting-1000
Blacklisting-10000
Blacklisting-100000
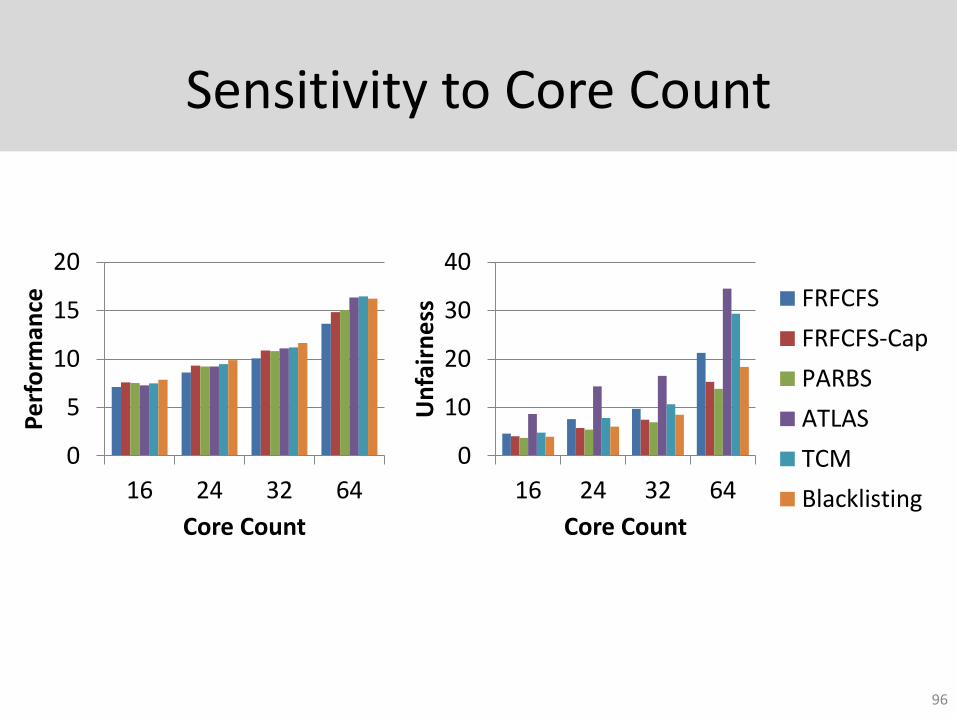
Sensitivity to Core Count
96
0
5
10
15
20
16 24 32 64
Pe
rfo
rman
ce
Core Count
0
10
20
30
40
16 24 32 64
Un
fair
ne
ss
Core Count
FRFCFS
FRFCFS-Cap
PARBS
ATLAS
TCM
Blacklisting
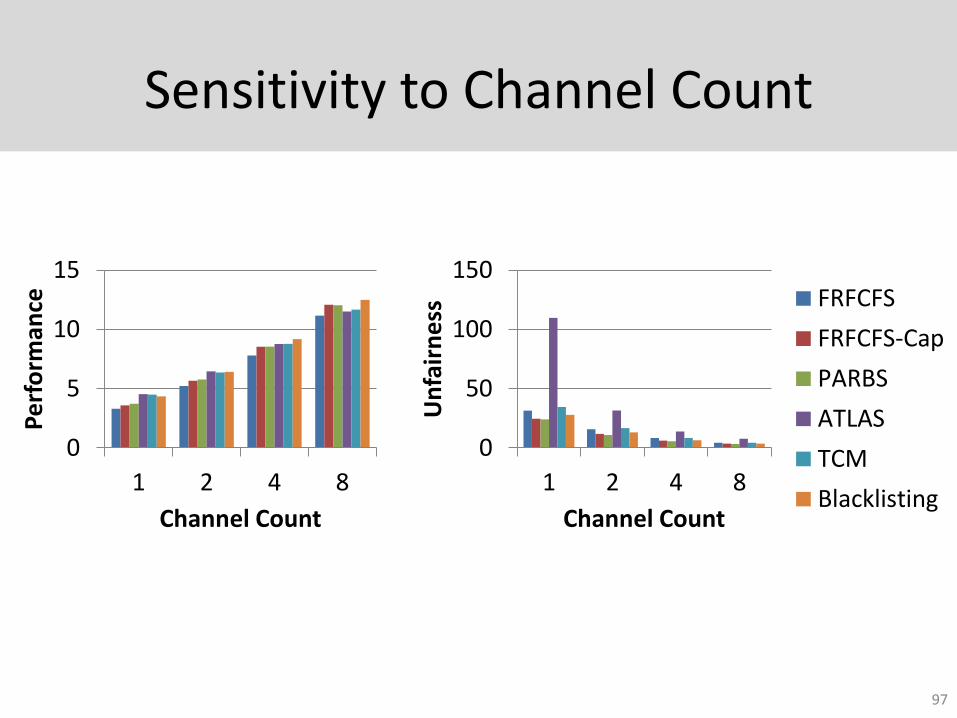
Sensitivity to Channel Count
97
0
5
10
15
1 2 4 8
Pe
rfo
rman
ce
Channel Count
0
50
100
150
1 2 4 8
Un
fair
ne
ss
Channel Count
FRFCFS
FRFCFS-Cap
PARBS
ATLAS
TCM
Blacklisting
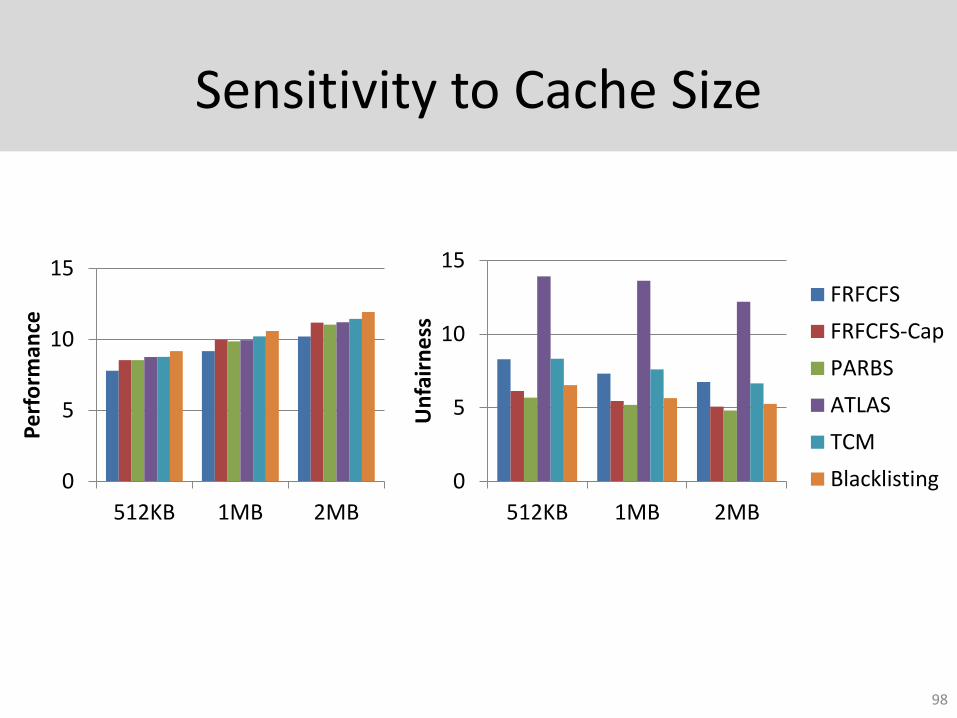
Sensitivity to Cache Size
98
0
5
10
15
512KB 1MB 2MB
Pe
rfo
rman
ce
0
5
10
15
512KB 1MB 2MB
Un
fair
ne
ss
FRFCFS
FRFCFS-Cap
PARBS
ATLAS
TCM
Blacklisting
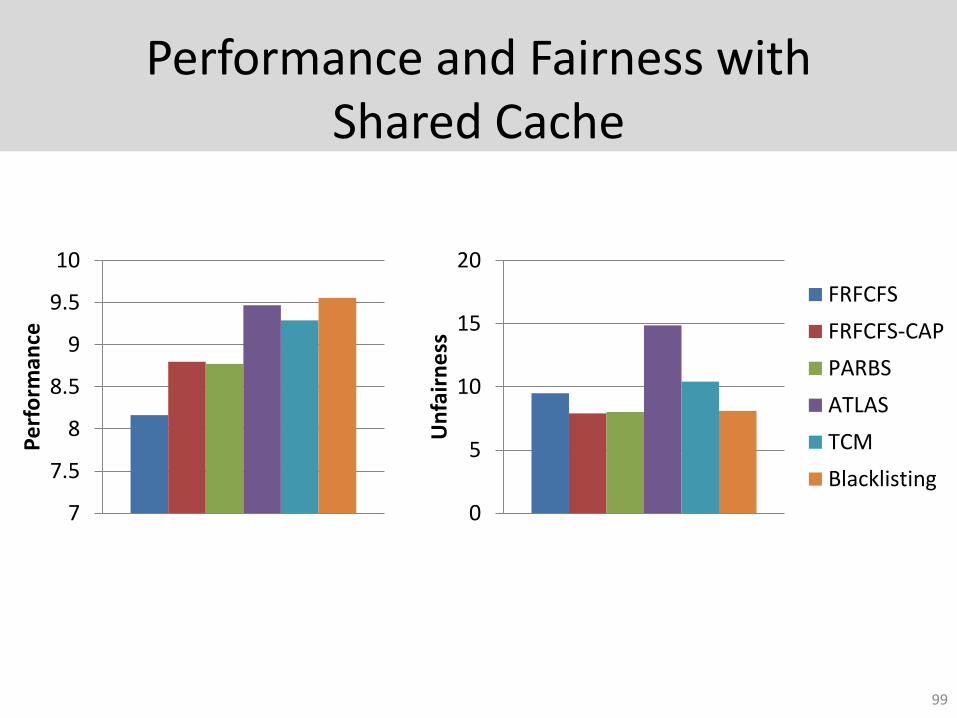
Performance and Fairness with Shared Cache
99
7
7.5
8
8.5
9
9.5
10
Pe
rfo
rman
ce
0
5
10
15
20
Un
fair
ne
ss
FRFCFS
FRFCFS-CAP
PARBS
ATLAS
TCM
Blacklisting
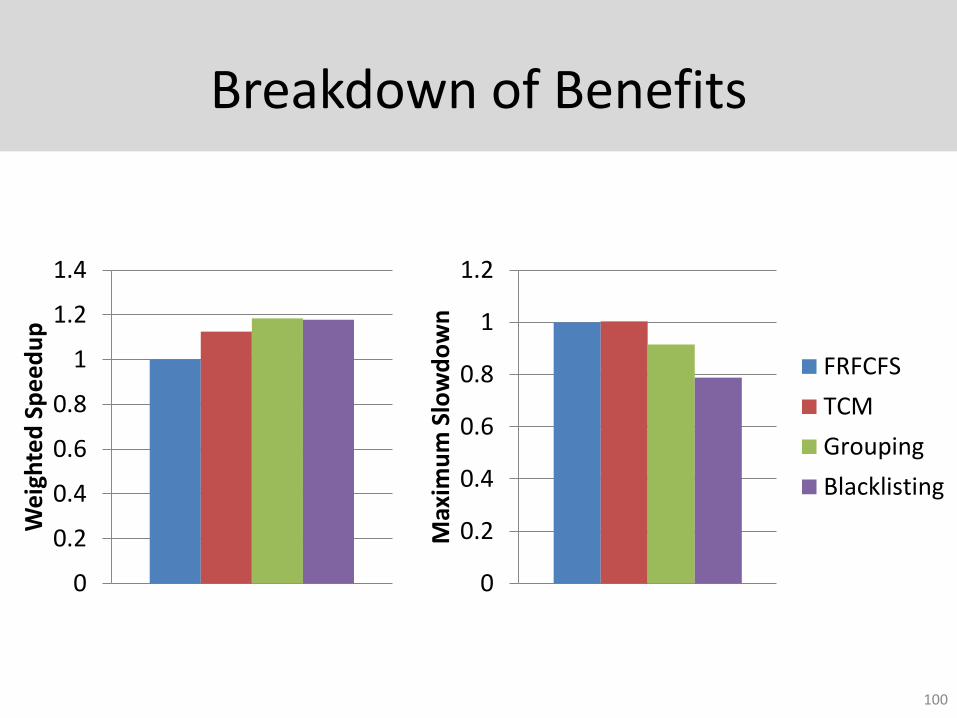
Breakdown of Benefits
100
0
0.2
0.4
0.6
0.8
1
1.2
1.4
We
igh
ted
Sp
ee
du
p
0
0.2
0.4
0.6
0.8
1
1.2
Max
imu
m S
low
do
wn
FRFCFS
TCM
Grouping
Blacklisting
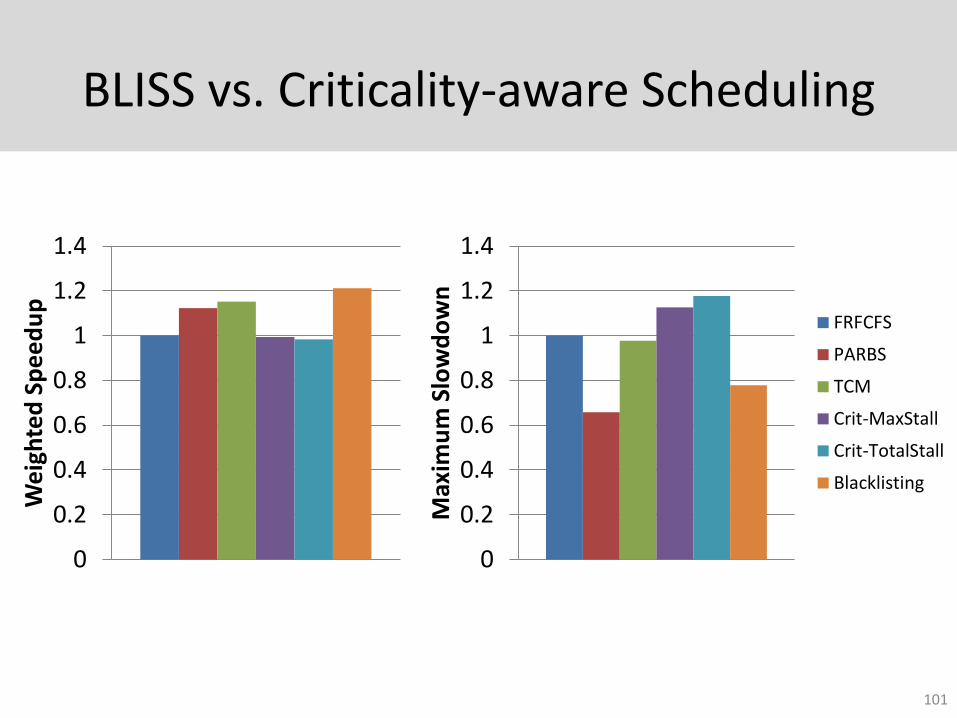
BLISS vs. Criticality-aware Scheduling
101
0
0.2
0.4
0.6
0.8
1
1.2
1.4
We
igh
ted
Sp
ee
du
p
0
0.2
0.4
0.6
0.8
1
1.2
1.4
Max
imu
m S
low
do
wn
FRFCFS
PARBS
TCM
Crit-MaxStall
Crit-TotalStall
Blacklisting
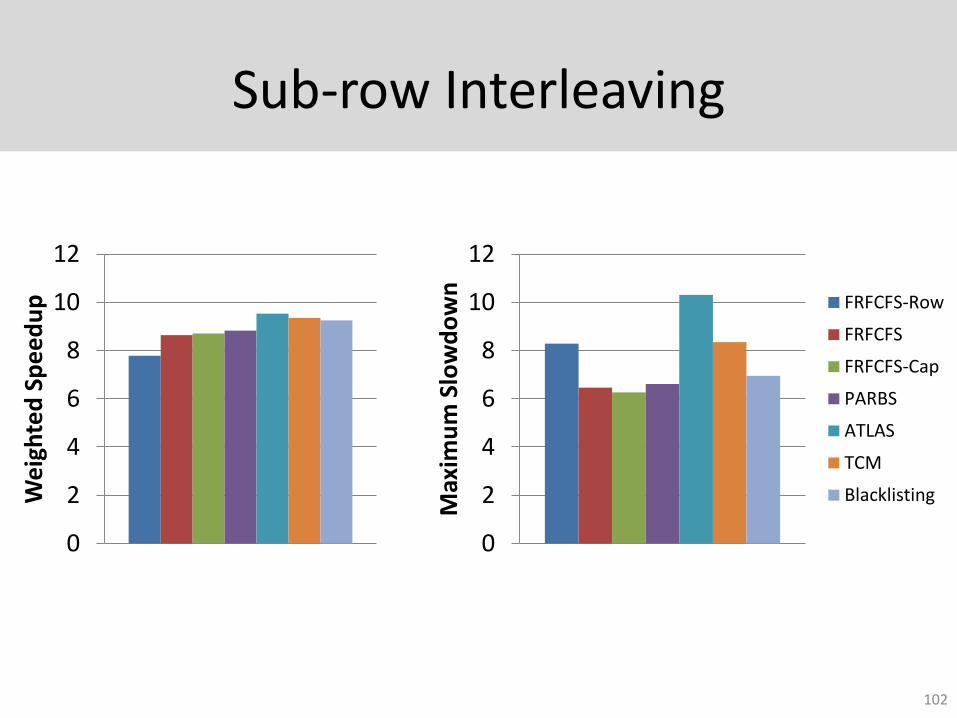
Sub-row Interleaving
102
0
2
4
6
8
10
12
Max
imu
m S
low
do
wn
FRFCFS-Row
FRFCFS
FRFCFS-Cap
PARBS
ATLAS
TCM
Blacklisting
0
2
4
6
8
10
12
We
igh
ted
Sp
ee
du
p
MISE
103
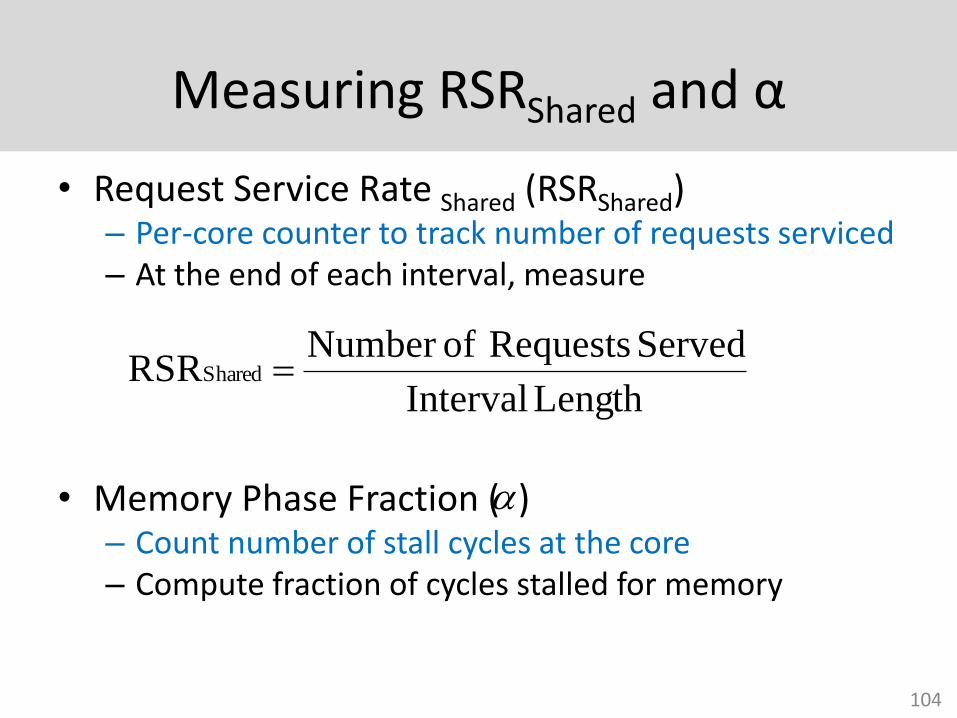
Measuring RSRShared and α
• Request Service Rate Shared (RSRShared)– Per-core counter to track number of requests serviced– At the end of each interval, measure
• Memory Phase Fraction ( )– Count number of stall cycles at the core– Compute fraction of cycles stalled for memory
Length Interval
Served Requests ofNumber RSRShared
104
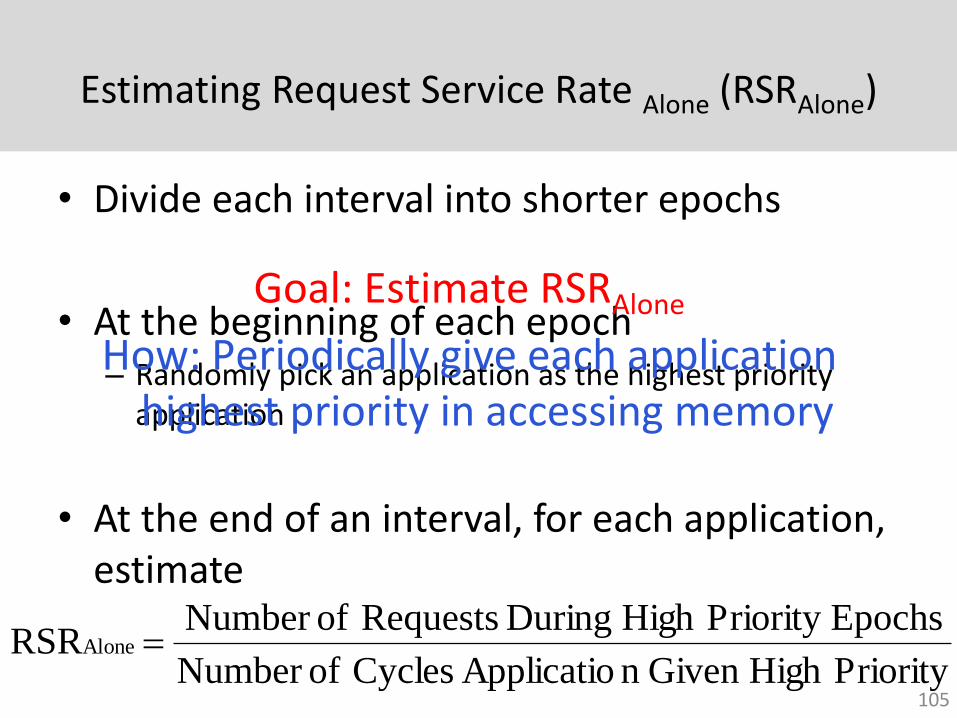
Estimating Request Service Rate Alone (RSRAlone)
• Divide each interval into shorter epochs
• At the beginning of each epoch– Randomly pick an application as the highest priority
application
• At the end of an interval, for each application, estimate
PriorityHigh Given n Applicatio Cycles ofNumber
EpochsPriority High During Requests ofNumber RSR
Alone
105
Goal: Estimate RSRAlone
How: Periodically give each application highest priority in accessing memory
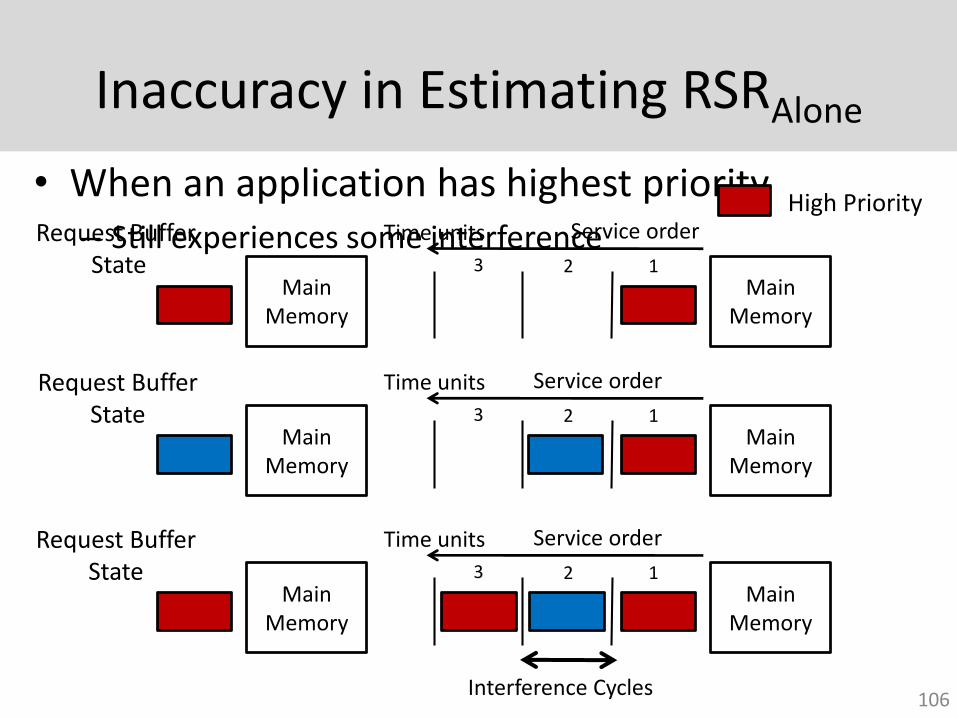
Inaccuracy in Estimating RSRAlone
106
Request BufferState
Main Memory
Time units Service order
Main Memory
123
• When an application has highest priority– Still experiences some interference
Request Buffer State
Main Memory
Time units Service order
Main Memory
123
Request Buffer State
Main Memory
Time units Service order
Main Memory
123
Interference Cycles
High Priority
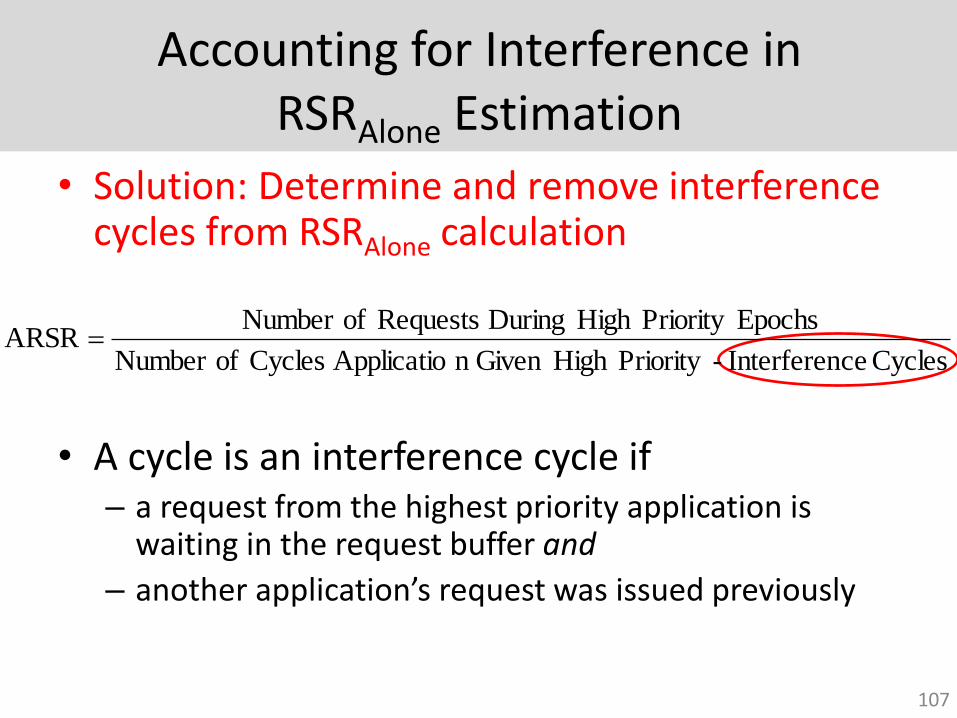
Accounting for Interference in RSRAlone Estimation
• Solution: Determine and remove interference cycles from RSRAlone calculation
• A cycle is an interference cycle if– a request from the highest priority application is
waiting in the request buffer and
– another application’s request was issued previously
107
Cycles ceInterferen -Priority High Given n Applicatio Cycles ofNumber
EpochsPriority High During Requests ofNumber ARSR
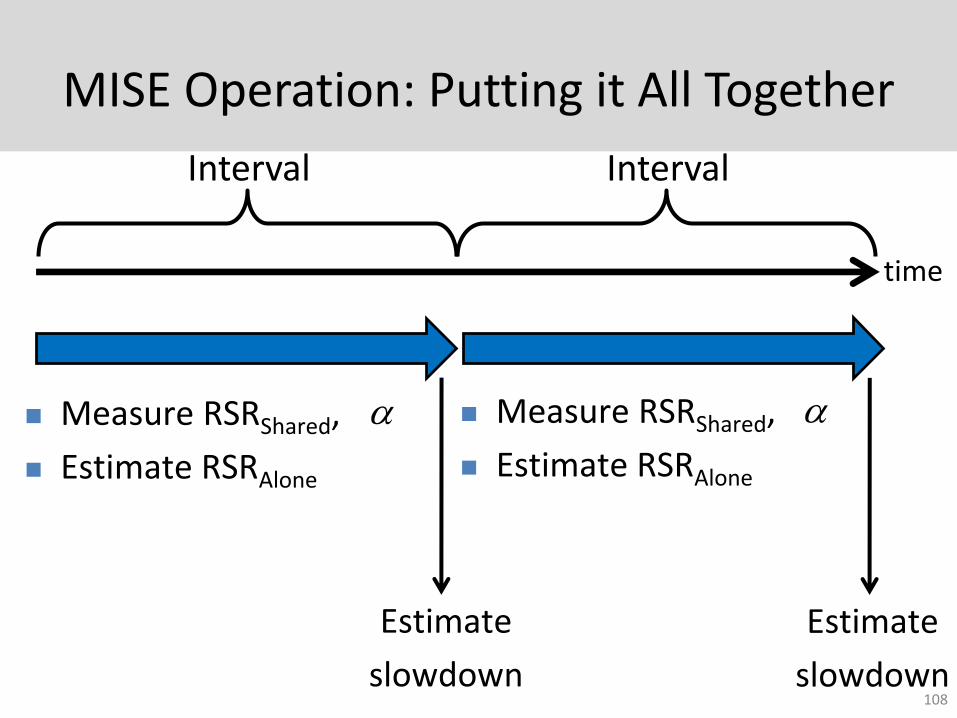
MISE Operation: Putting it All Together
time
Interval
Estimate
slowdown
Interval
Estimate
slowdown
Measure RSRShared,
Estimate RSRAlone
Measure RSRShared,
Estimate RSRAlone
108
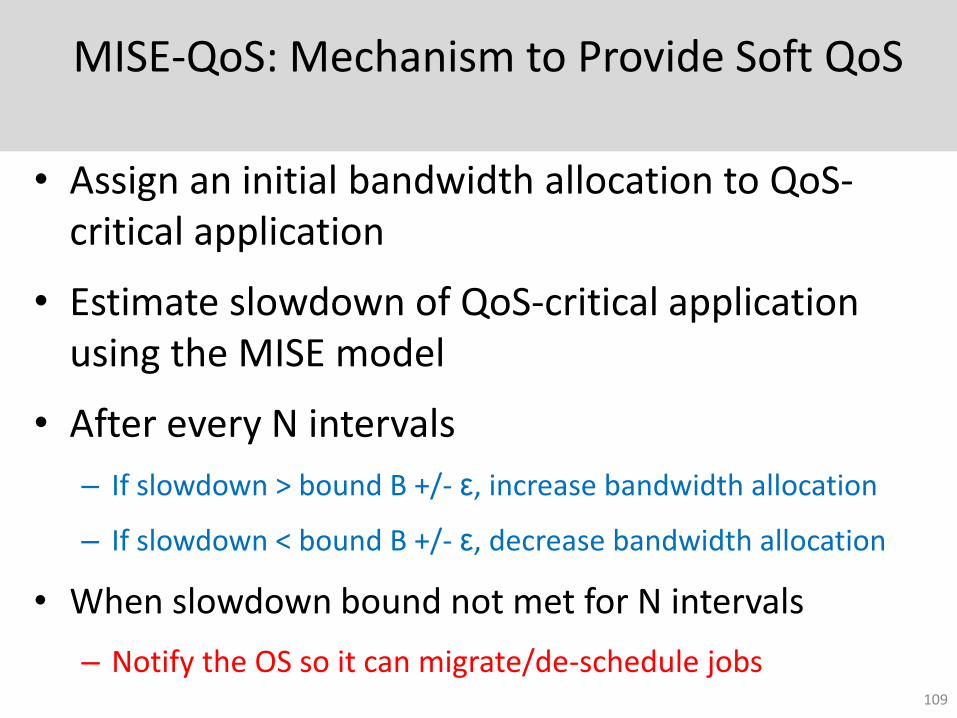
MISE-QoS: Mechanism to Provide Soft QoS
• Assign an initial bandwidth allocation to QoS-critical application
• Estimate slowdown of QoS-critical application using the MISE model
• After every N intervals
– If slowdown > bound B +/- ε, increase bandwidth allocation
– If slowdown < bound B +/- ε, decrease bandwidth allocation
• When slowdown bound not met for N intervals
– Notify the OS so it can migrate/de-schedule jobs109
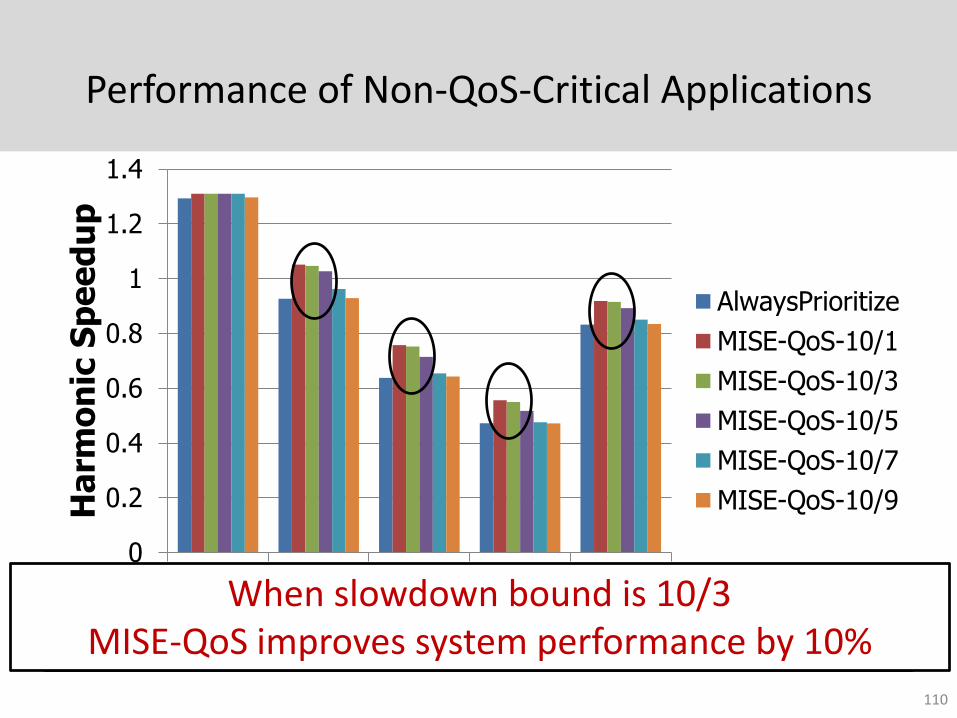
Performance of Non-QoS-Critical Applications
0
0.2
0.4
0.6
0.8
1
1.2
1.4
0 1 2 3 Avg
Ha
rmo
nic
Sp
ee
du
p
Number of Memory Intensive Applications
AlwaysPrioritize
MISE-QoS-10/1
MISE-QoS-10/3
MISE-QoS-10/5
MISE-QoS-10/7
MISE-QoS-10/9
Higher performance when bound is looseWhen slowdown bound is 10/3 MISE-QoS improves system performance by 10%
110
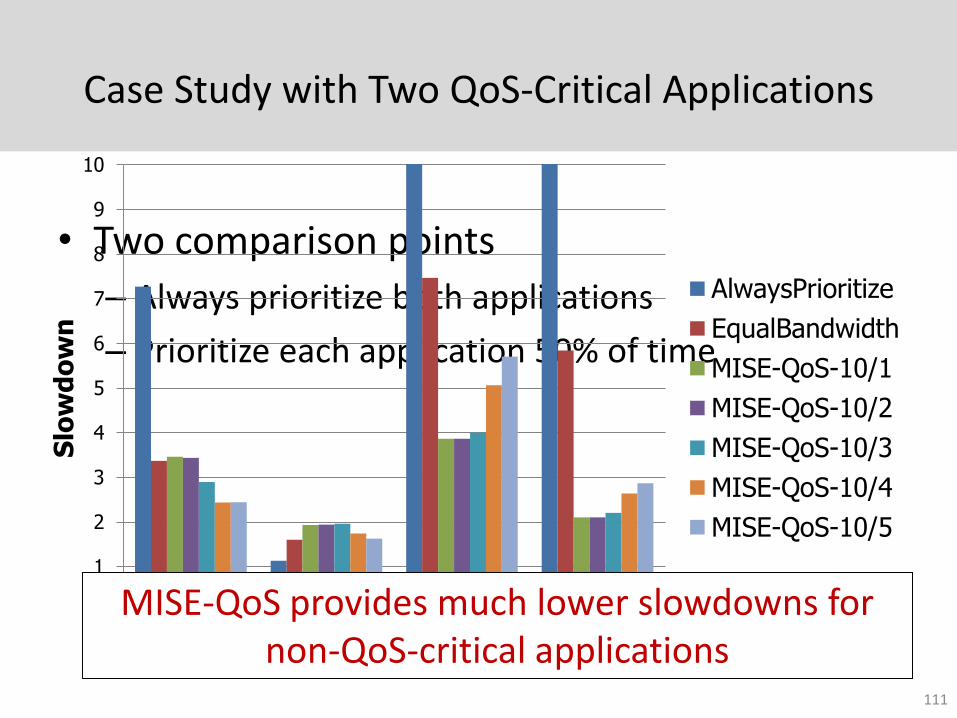
Case Study with Two QoS-Critical Applications
• Two comparison points
– Always prioritize both applications
– Prioritize each application 50% of time
0
1
2
3
4
5
6
7
8
9
10
astar mcf leslie3d mcf
Slo
wd
ow
n
AlwaysPrioritize
EqualBandwidth
MISE-QoS-10/1
MISE-QoS-10/2
MISE-QoS-10/3
MISE-QoS-10/4
MISE-QoS-10/5
MISE-QoS can achieve a lower slowdown bound for both applications
MISE-QoS provides much lower slowdowns for non-QoS-critical applications
111
Minimizing Maximum Slowdown
• Goal– Minimize the maximum slowdown experienced by any
application
• Basic Idea– Assign more memory bandwidth to the more slowed
down application
112
Mechanism
• Memory controller tracks– Slowdown bound B
– Bandwidth allocation of all applications
• Different components of mechanism– Bandwidth redistribution policy
– Modifying target bound
– Communicating target bound to OS periodically
113
Bandwidth Redistribution
• At the end of each interval,
– Group applications into two clusters
– Cluster 1: applications that meet bound
– Cluster 2: applications that don’t meet bound
– Steal small amount of bandwidth from each application in cluster 1 and allocate to applications in cluster 2
114
Modifying Target Bound
• If bound B is met for past N intervals– Bound can be made more aggressive
– Set bound higher than the slowdown of most slowed down application
• If bound B not met for past N intervals by more than half the applications– Bound should be more relaxed
– Set bound to slowdown of most slowed down application
115
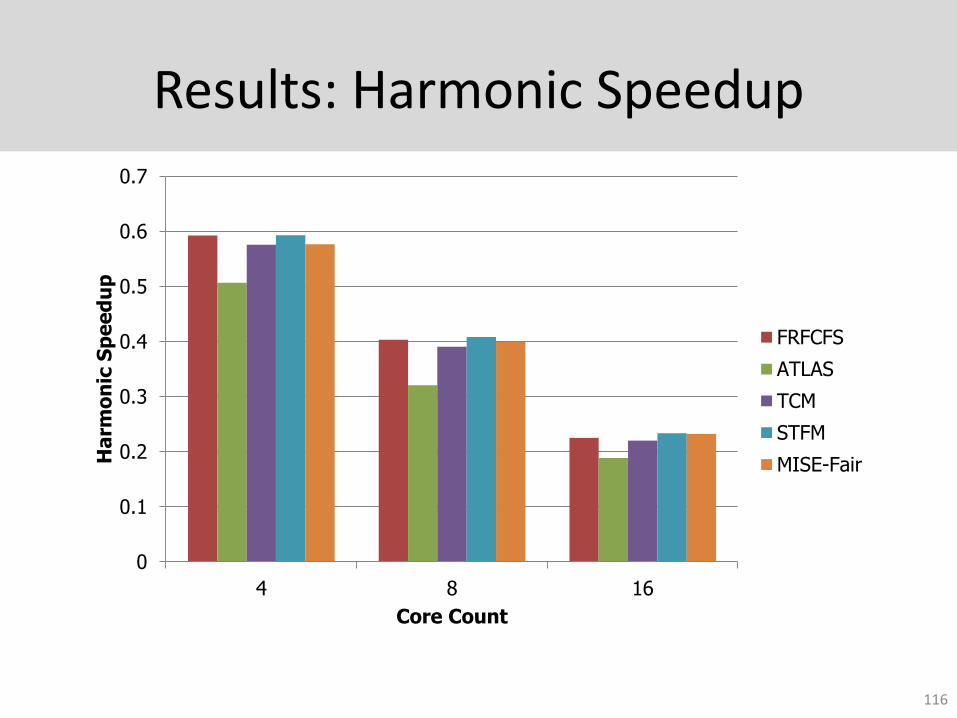
Results: Harmonic Speedup
0
0.1
0.2
0.3
0.4
0.5
0.6
0.7
4 8 16
Ha
rmo
nic
Sp
ee
du
p
Core Count
FRFCFS
ATLAS
TCM
STFM
MISE-Fair
116
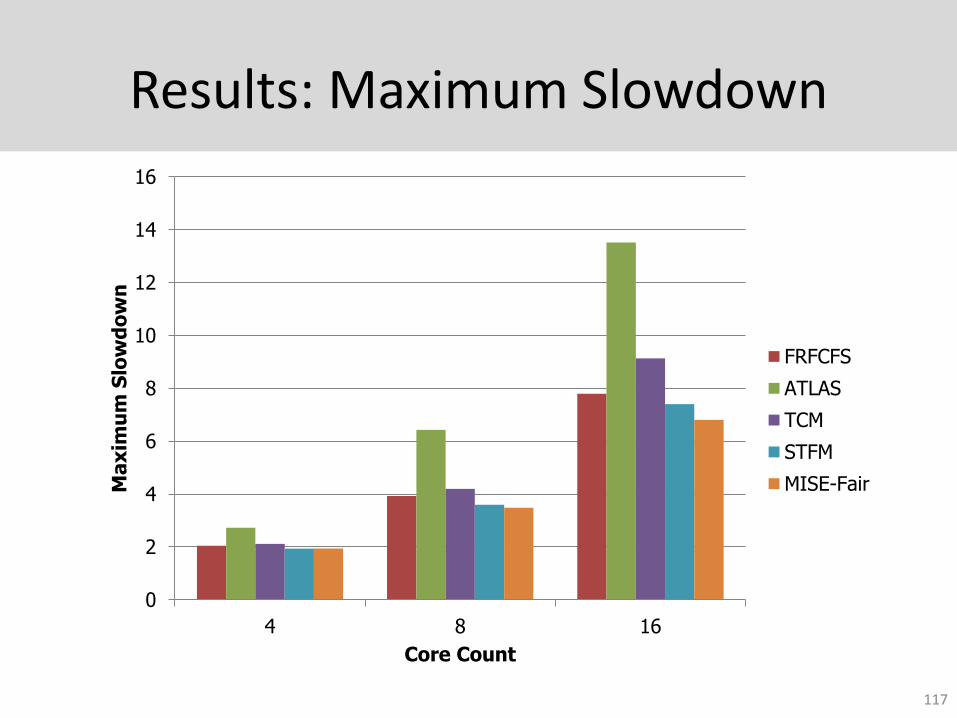
Results: Maximum Slowdown
0
2
4
6
8
10
12
14
16
4 8 16
Ma
xim
um
Slo
wd
ow
n
Core Count
FRFCFS
ATLAS
TCM
STFM
MISE-Fair
117
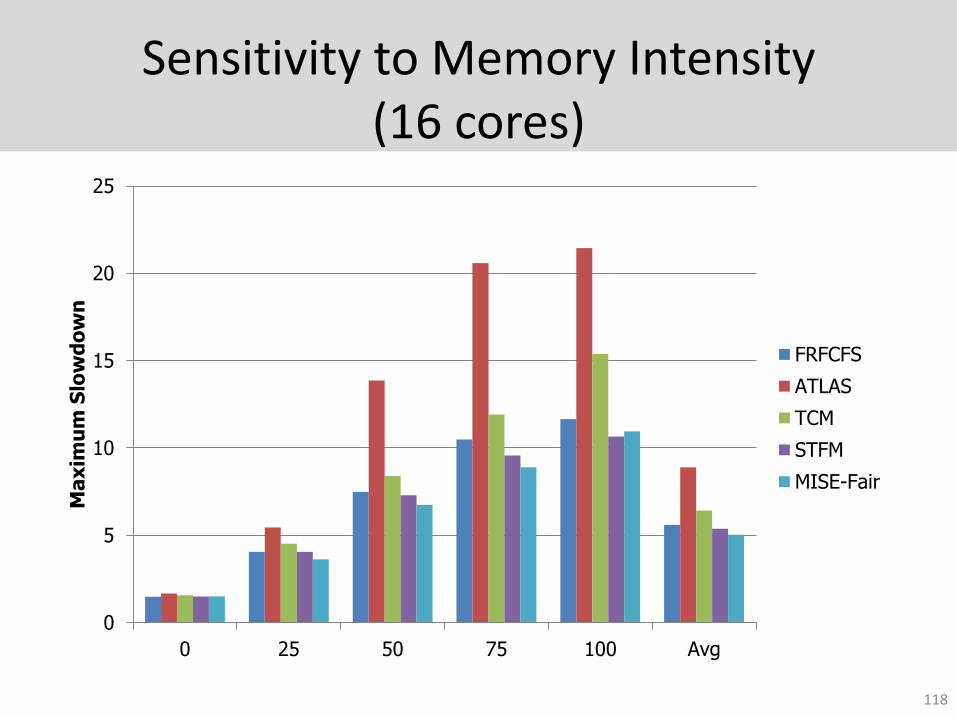
Sensitivity to Memory Intensity(16 cores)
0
5
10
15
20
25
0 25 50 75 100 Avg
Ma
xim
um
Slo
wd
ow
n
FRFCFS
ATLAS
TCM
STFM
MISE-Fair
118
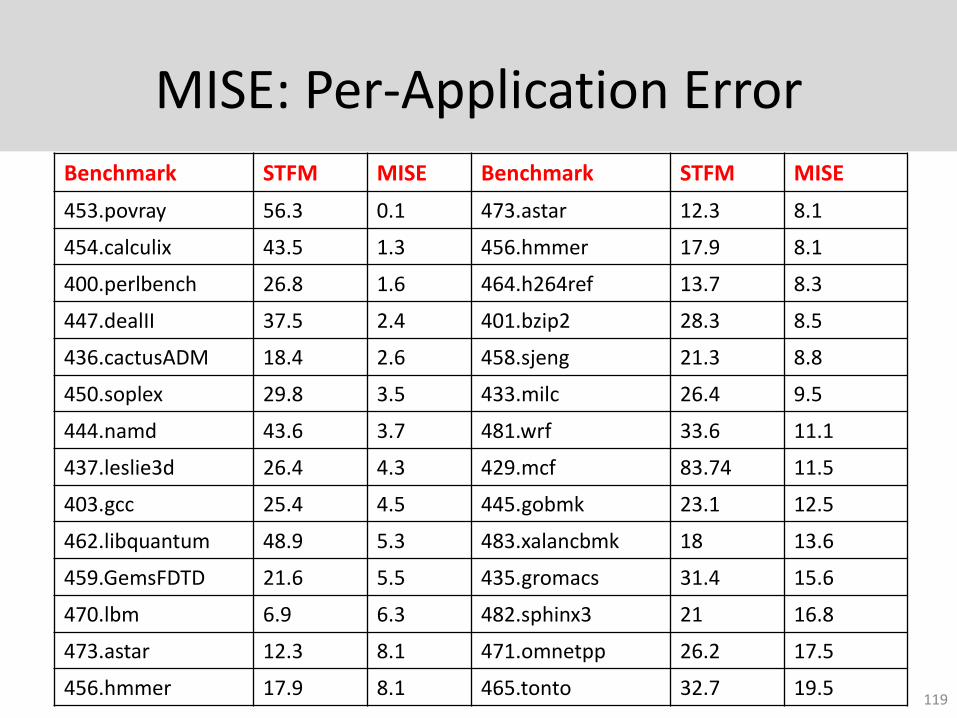
MISE: Per-Application ErrorBenchmark STFM MISE Benchmark STFM MISE
453.povray 56.3 0.1 473.astar 12.3 8.1
454.calculix 43.5 1.3 456.hmmer 17.9 8.1
400.perlbench 26.8 1.6 464.h264ref 13.7 8.3
447.dealII 37.5 2.4 401.bzip2 28.3 8.5
436.cactusADM 18.4 2.6 458.sjeng 21.3 8.8
450.soplex 29.8 3.5 433.milc 26.4 9.5
444.namd 43.6 3.7 481.wrf 33.6 11.1
437.leslie3d 26.4 4.3 429.mcf 83.74 11.5
403.gcc 25.4 4.5 445.gobmk 23.1 12.5
462.libquantum 48.9 5.3 483.xalancbmk 18 13.6
459.GemsFDTD 21.6 5.5 435.gromacs 31.4 15.6
470.lbm 6.9 6.3 482.sphinx3 21 16.8
473.astar 12.3 8.1 471.omnetpp 26.2 17.5
456.hmmer 17.9 8.1 465.tonto 32.7 19.5119
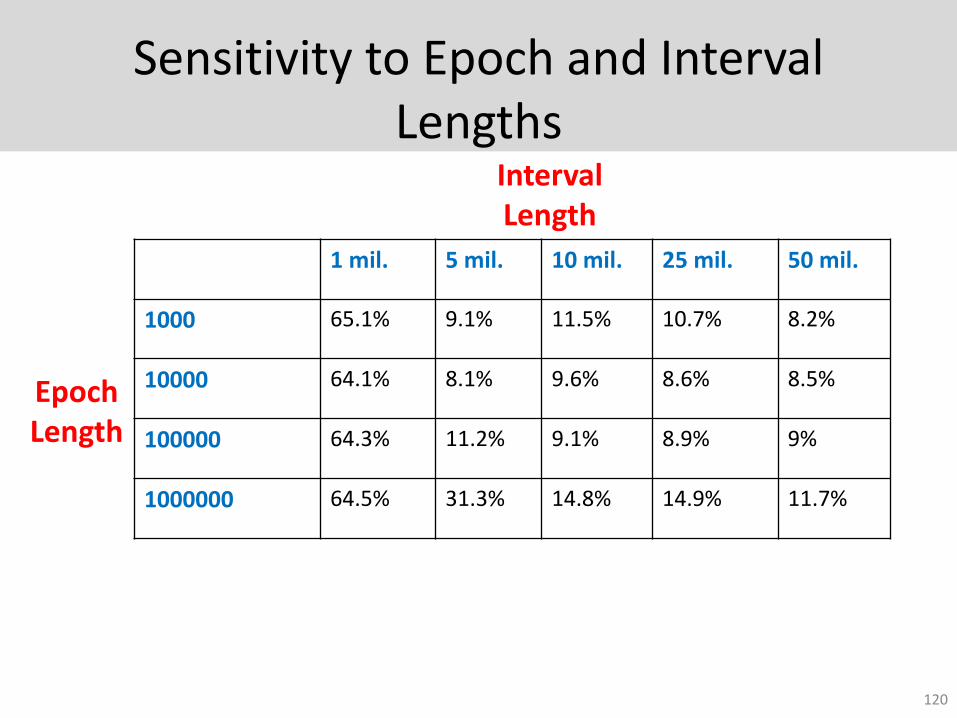
Sensitivity to Epoch and Interval Lengths
1 mil. 5 mil. 10 mil. 25 mil. 50 mil.
1000 65.1% 9.1% 11.5% 10.7% 8.2%
10000 64.1% 8.1% 9.6% 8.6% 8.5%
100000 64.3% 11.2% 9.1% 8.9% 9%
1000000 64.5% 31.3% 14.8% 14.9% 11.7%
Interval Length
Epoch Length
120
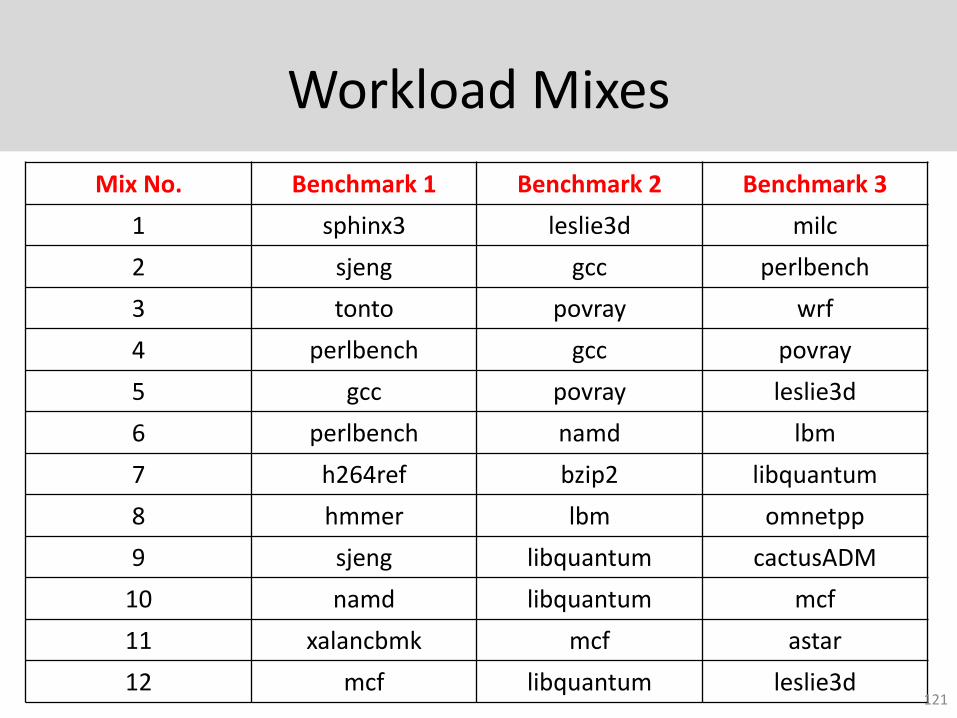
Workload Mixes
Mix No. Benchmark 1 Benchmark 2 Benchmark 3
1 sphinx3 leslie3d milc
2 sjeng gcc perlbench
3 tonto povray wrf
4 perlbench gcc povray
5 gcc povray leslie3d
6 perlbench namd lbm
7 h264ref bzip2 libquantum
8 hmmer lbm omnetpp
9 sjeng libquantum cactusADM
10 namd libquantum mcf
11 xalancbmk mcf astar
12 mcf libquantum leslie3d121
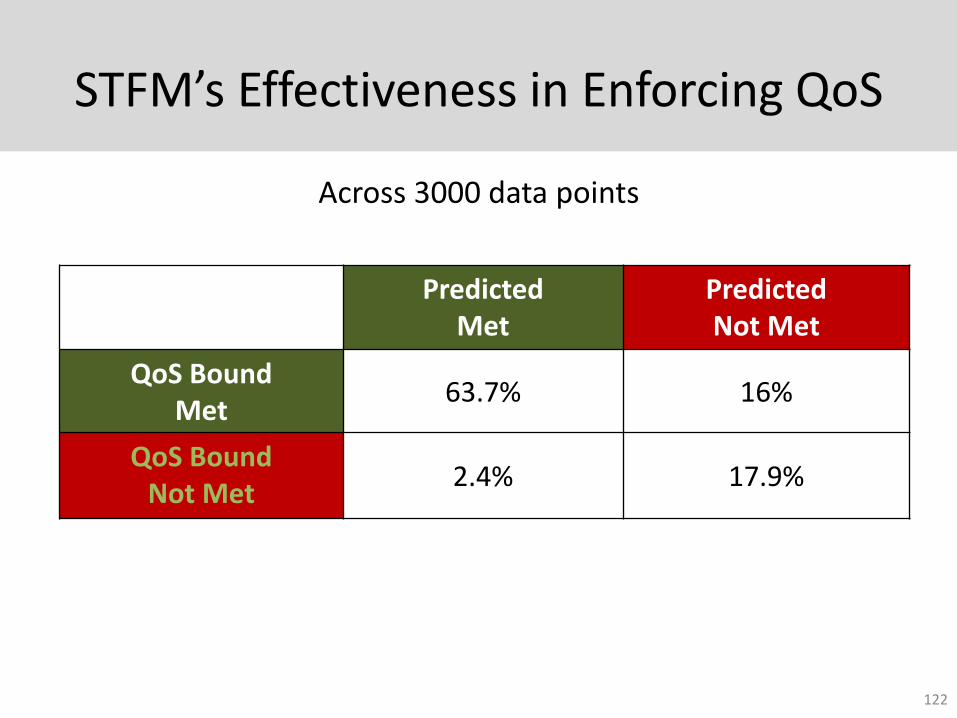
STFM’s Effectiveness in Enforcing QoS
Predicted Met
PredictedNot Met
QoS Bound Met
63.7% 16%
QoS Bound Not Met
2.4% 17.9%
Across 3000 data points
122
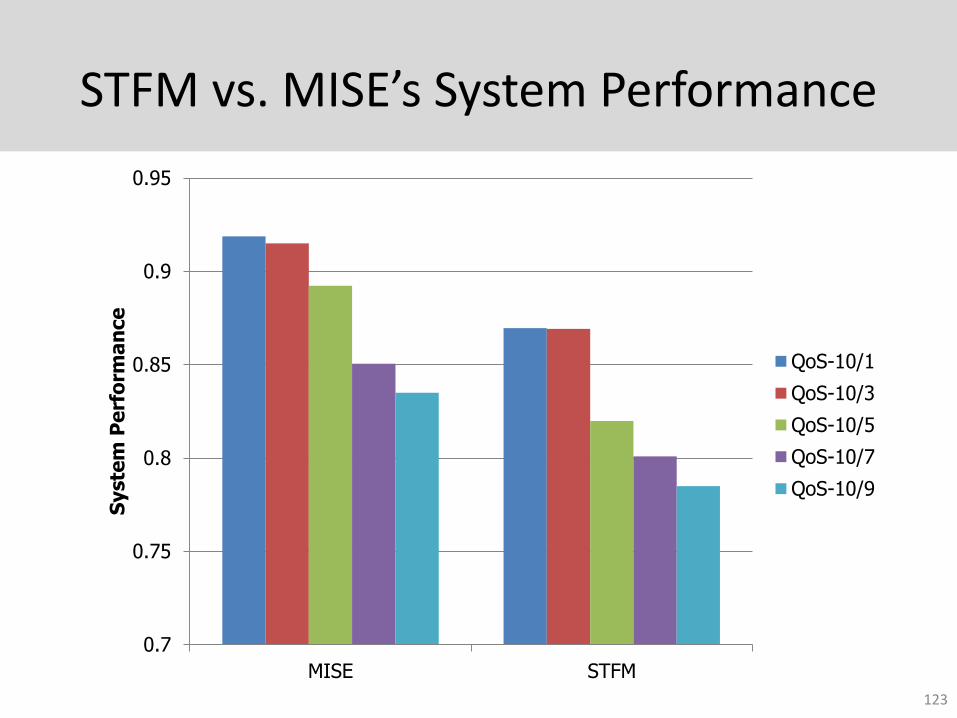
STFM vs. MISE’s System Performance
0.7
0.75
0.8
0.85
0.9
0.95
MISE STFM
Syste
m P
erf
orm
an
ce
QoS-10/1
QoS-10/3
QoS-10/5
QoS-10/7
QoS-10/9
123
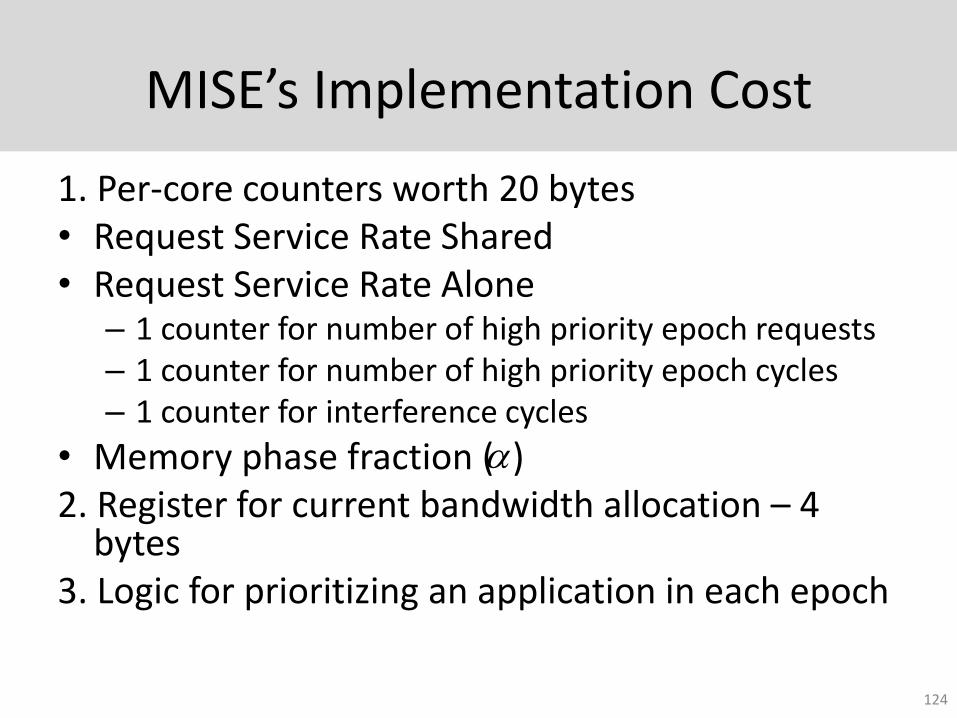
MISE’s Implementation Cost
1. Per-core counters worth 20 bytes• Request Service Rate Shared• Request Service Rate Alone
– 1 counter for number of high priority epoch requests– 1 counter for number of high priority epoch cycles– 1 counter for interference cycles
• Memory phase fraction ( )2. Register for current bandwidth allocation – 4
bytes3. Logic for prioritizing an application in each epoch
124
MISE Accuracy w/o Interference Cycles
• Average error – 23%
125
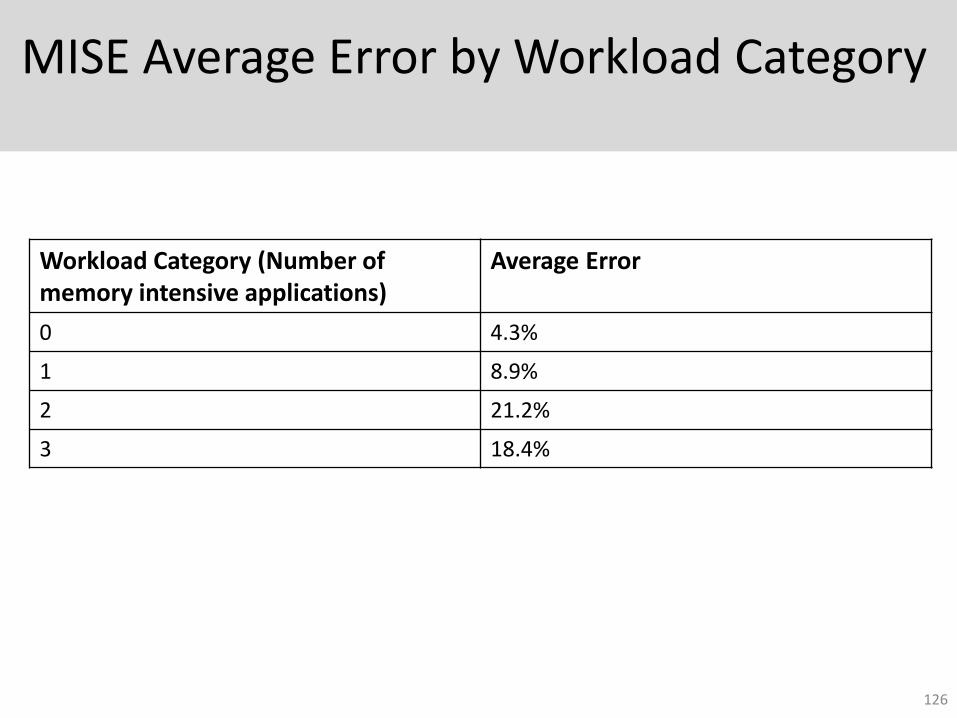
MISE Average Error by Workload Category
Workload Category (Number of memory intensive applications)
Average Error
0 4.3%
1 8.9%
2 21.2%
3 18.4%
126
ASM
127
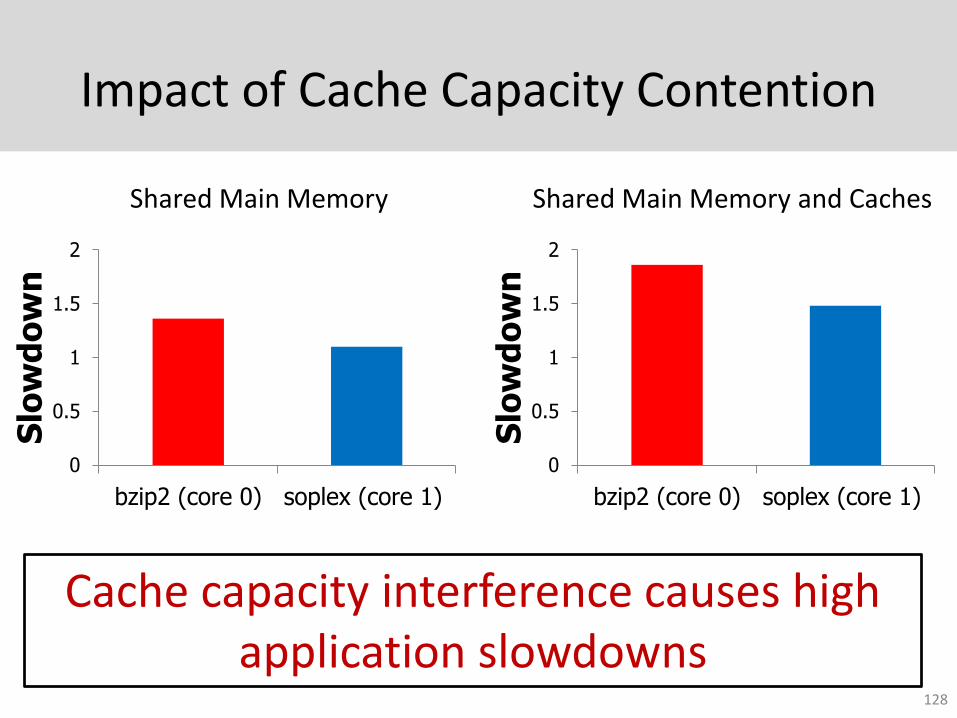
Impact of Cache Capacity Contention
128
Cache capacity interference causes high application slowdowns
Shared Main Memory Shared Main Memory and Caches
0
0.5
1
1.5
2
bzip2 (core 0) soplex (core 1)
Slo
wd
ow
n
0
0.5
1
1.5
2
bzip2 (core 0) soplex (core 1)S
low
do
wn
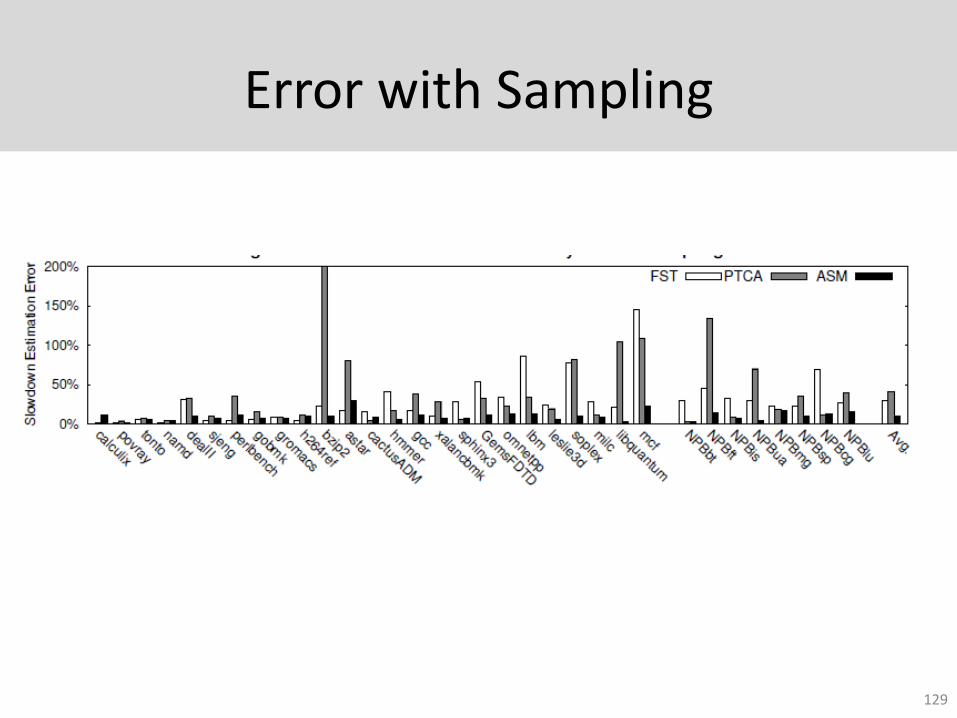
Error with Sampling
129
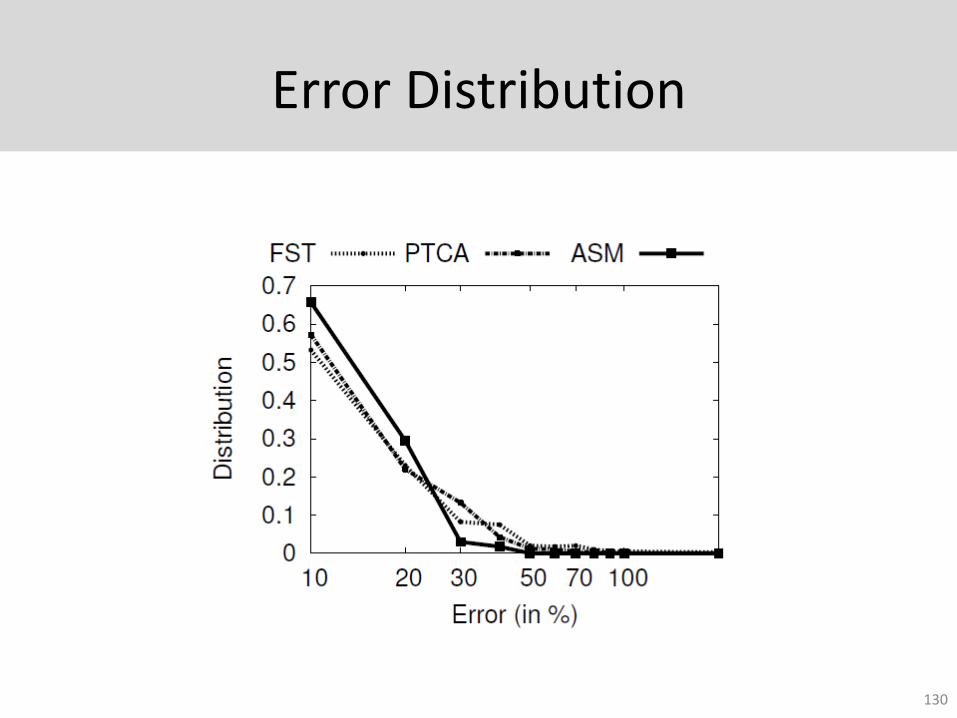
Error Distribution
130
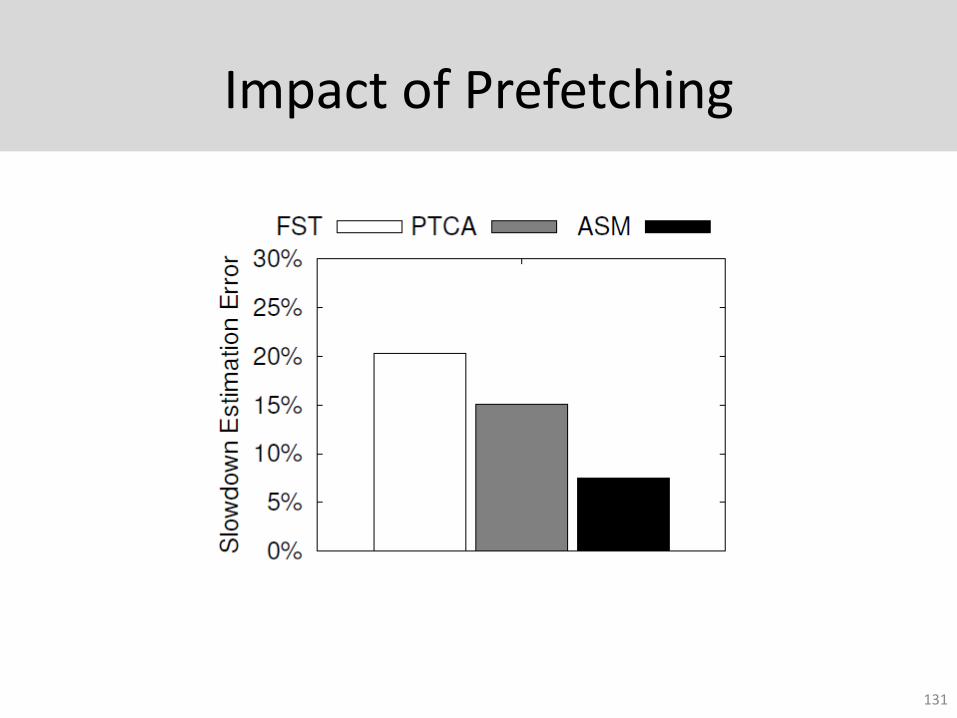
Impact of Prefetching
131
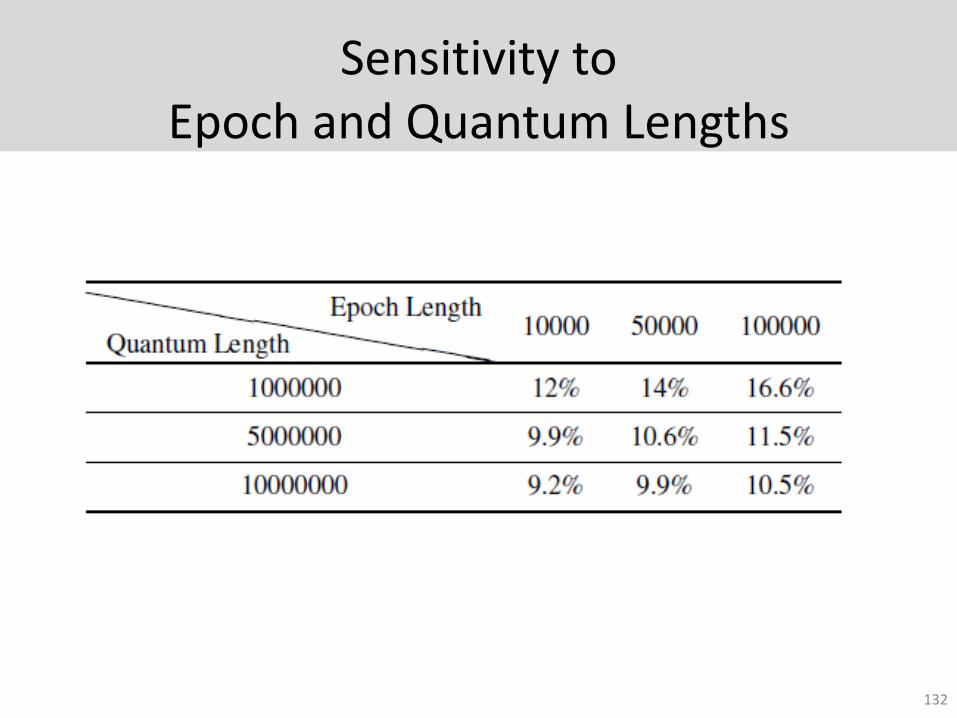
Sensitivity to Epoch and Quantum Lengths
132
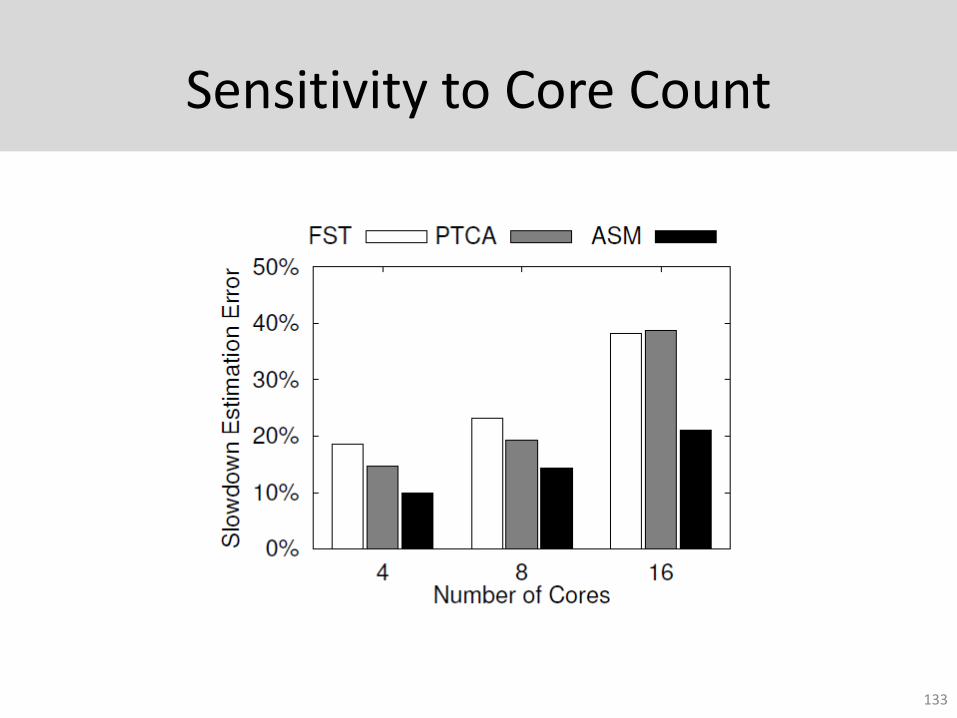
Sensitivity to Core Count
133
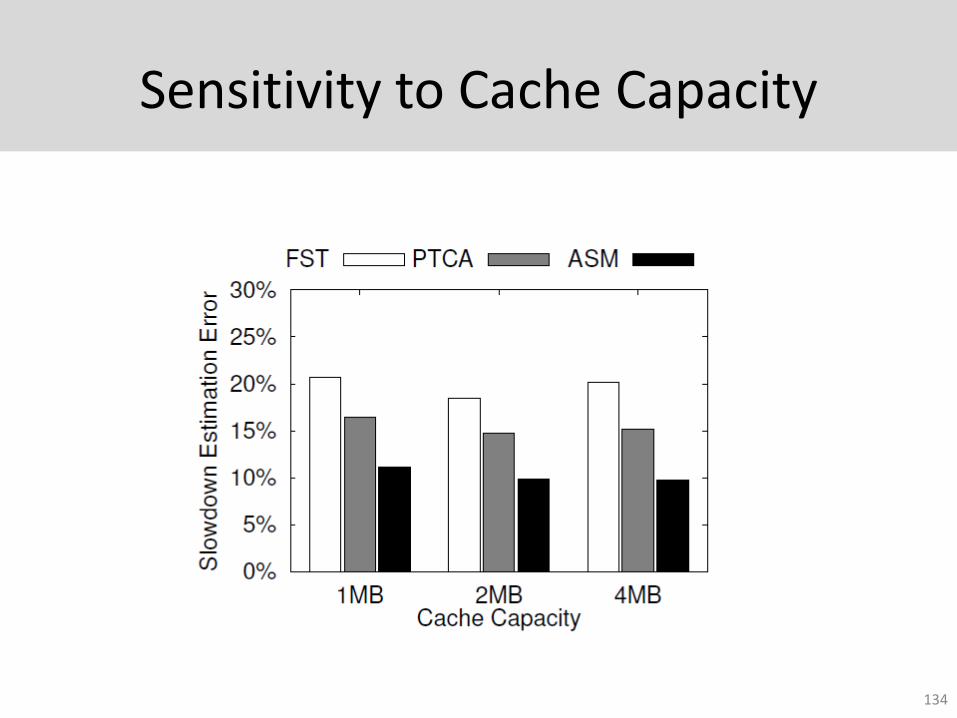
Sensitivity to Cache Capacity
134
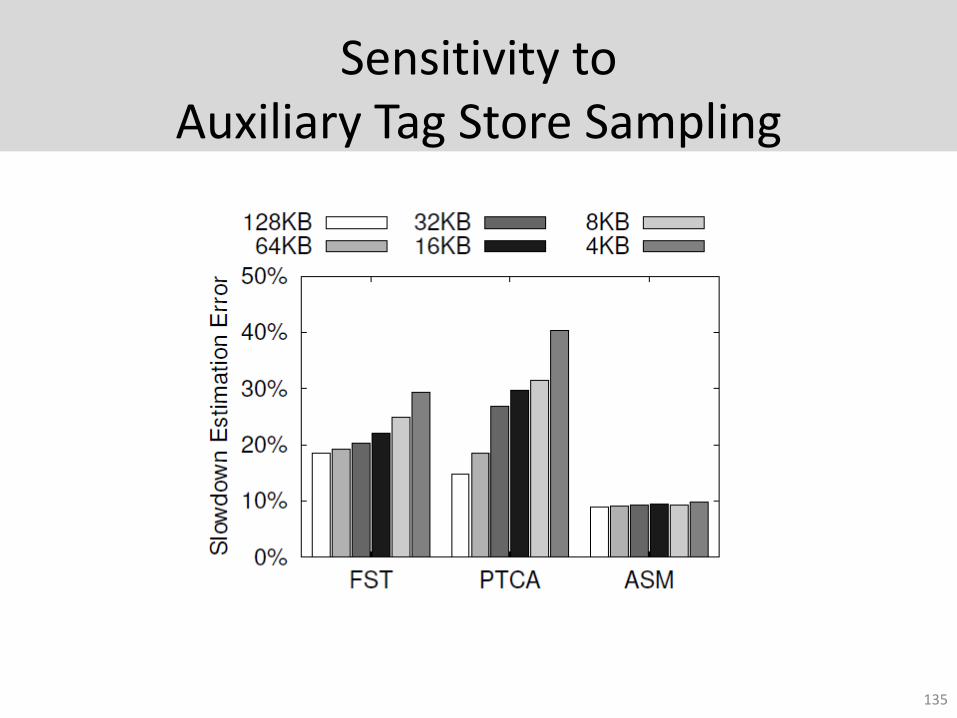
Sensitivity to Auxiliary Tag Store Sampling
135
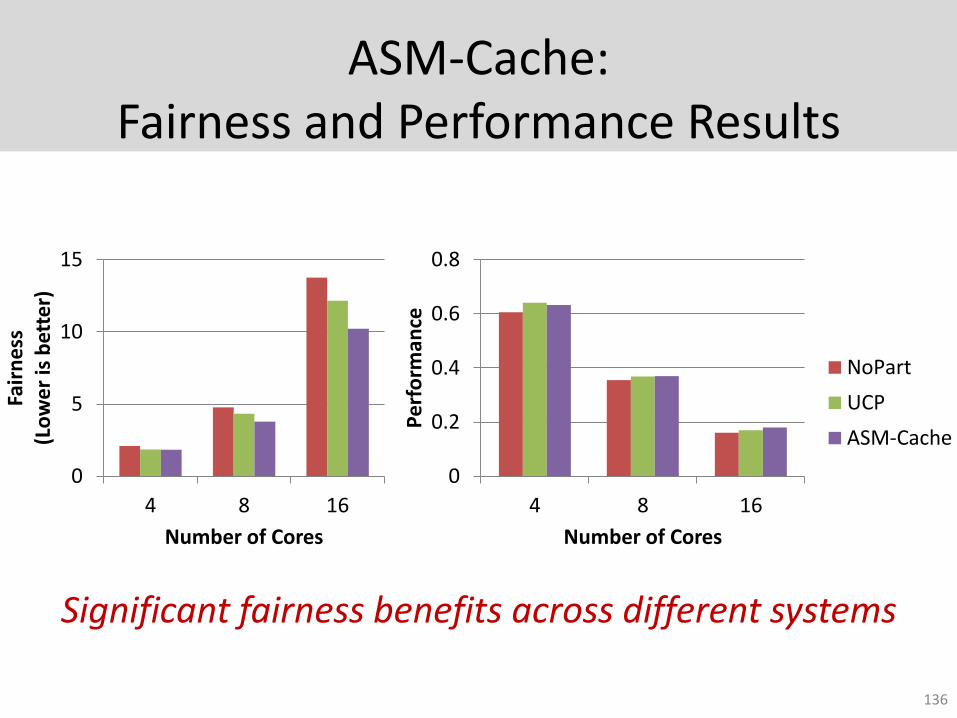
ASM-Cache:Fairness and Performance Results
136
Significant fairness benefits across different systems
0
5
10
15
4 8 16
Fair
nes
s(L
ow
er
is b
ette
r)
Number of Cores
0
0.2
0.4
0.6
0.8
4 8 16
Pe
rfo
rman
ce
Number of Cores
NoPart
UCP
ASM-Cache
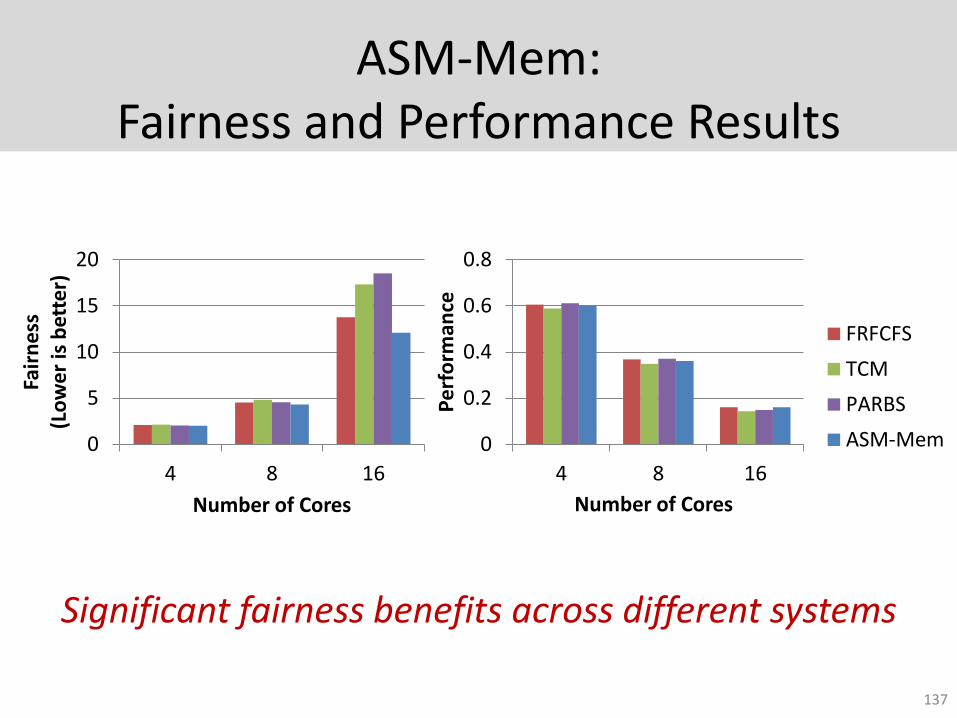
ASM-Mem: Fairness and Performance Results
137
0
5
10
15
20
4 8 16
Fair
nes
s (L
ow
er is
bet
ter)
Number of Cores
0
0.2
0.4
0.6
0.8
4 8 16P
erf
orm
ance
Number of Cores
FRFCFS
TCM
PARBS
ASM-Mem
Significant fairness benefits across different systems
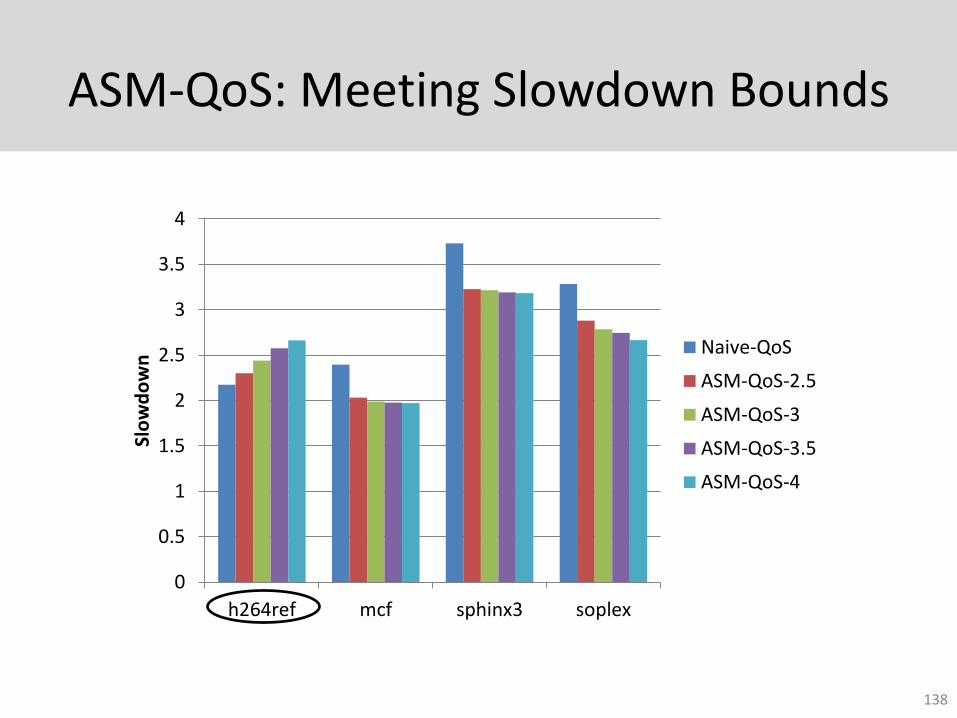
ASM-QoS: Meeting Slowdown Bounds
138
0
0.5
1
1.5
2
2.5
3
3.5
4
h264ref mcf sphinx3 soplex
Slo
wd
ow
n
Naive-QoS
ASM-QoS-2.5
ASM-QoS-3
ASM-QoS-3.5
ASM-QoS-4
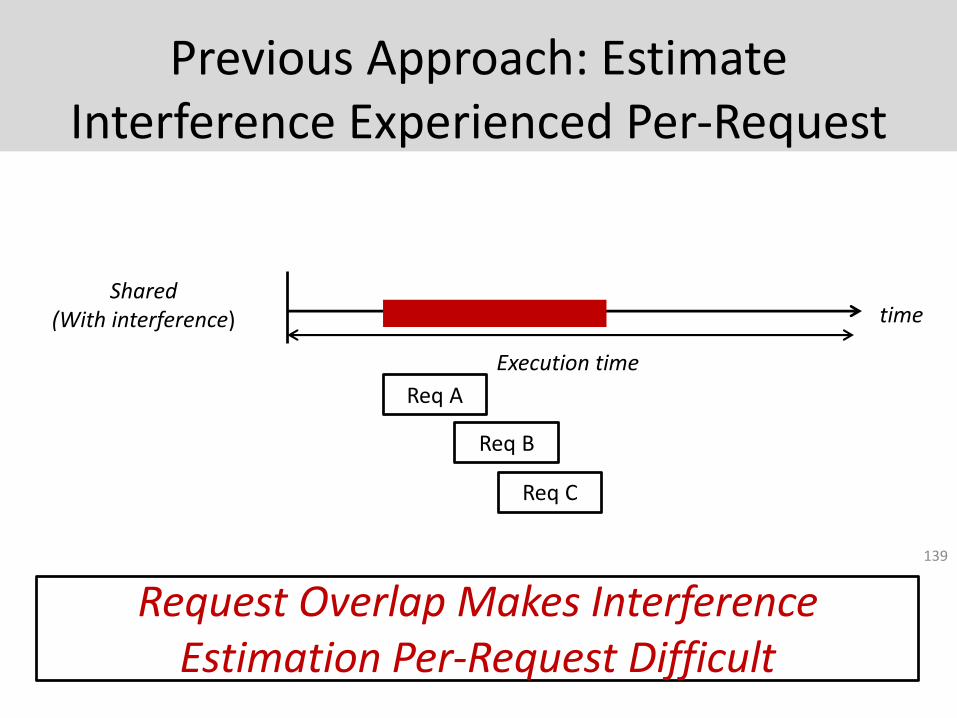
Previous Approach: Estimate Interference Experienced Per-Request
139
Shared (With interference) time
Execution time
Req A
Req B
Req C
Request Overlap Makes Interference Estimation Per-Request Difficult
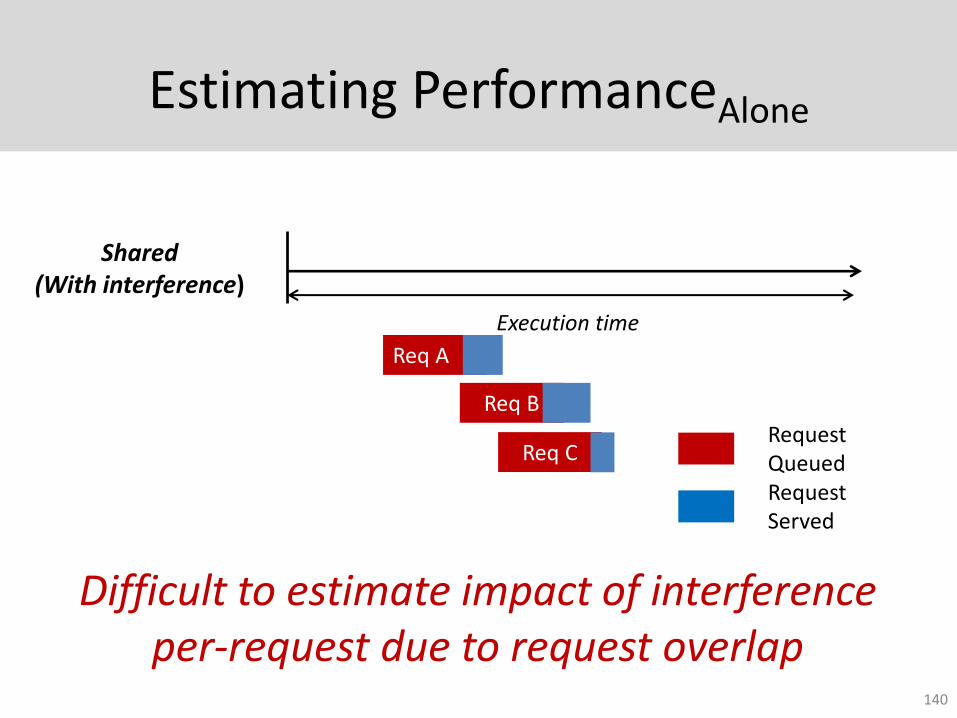
Estimating PerformanceAlone
140
Shared (With interference)
Execution time
Req A
Req B
Req CRequest QueuedRequest Served
Difficult to estimate impact of interference per-request due to request overlap
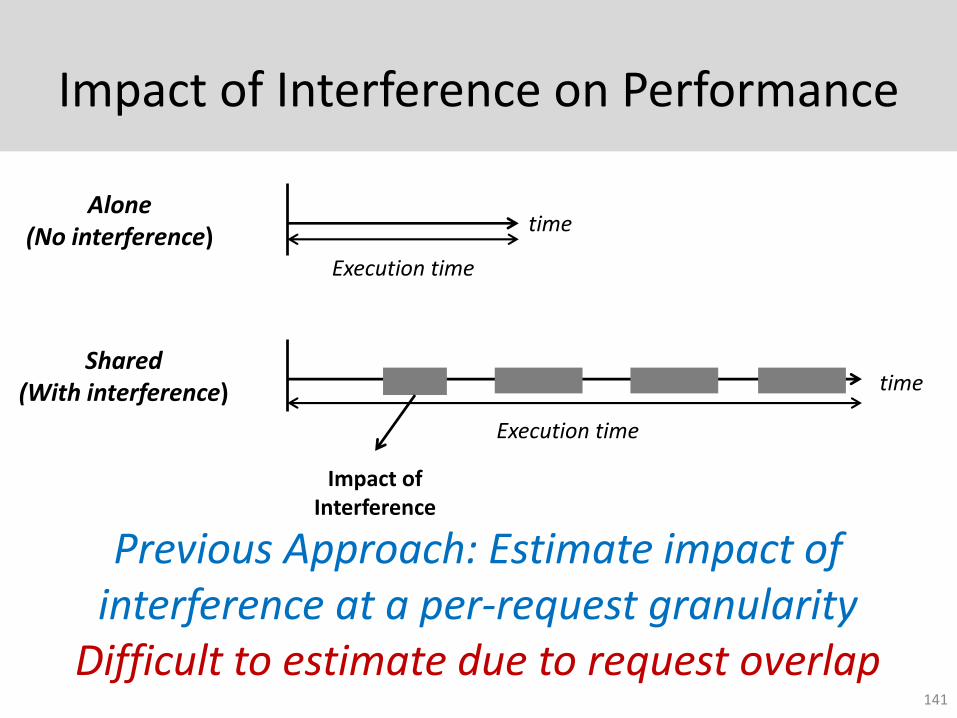
Impact of Interference on Performance
141
Alone (No interference)
time
Execution time
Shared (With interference) time
Execution time
Impact of Interference
Previous Approach: Estimate impact of interference at a per-request granularity
Difficult to estimate due to request overlap
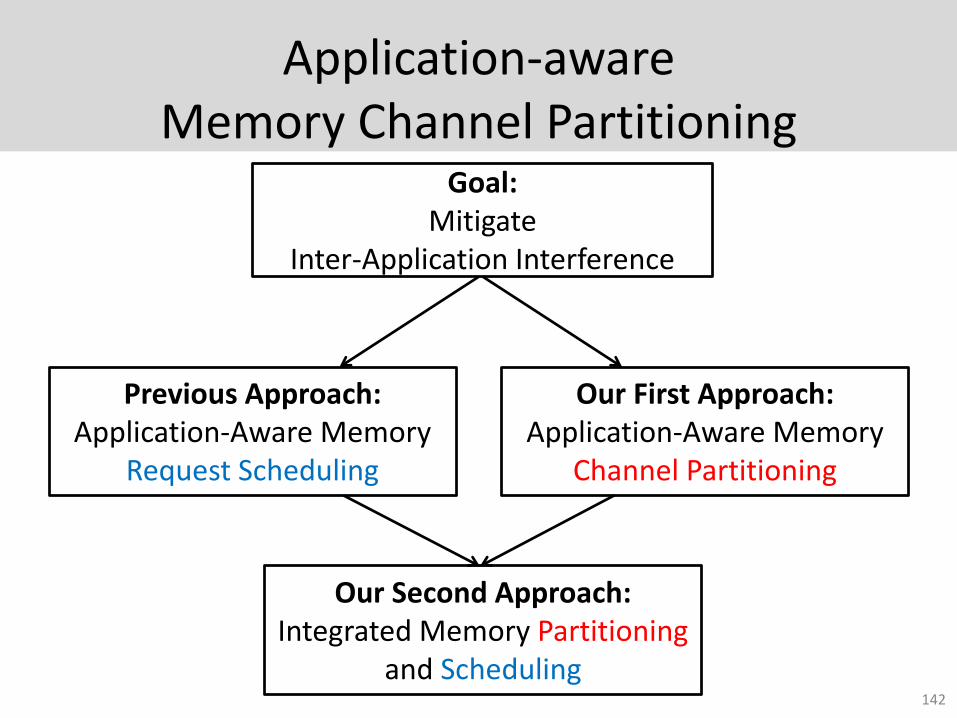
Application-aware Memory Channel Partitioning
142
Goal: Mitigate
Inter-Application Interference
Previous Approach:Application-Aware Memory
Request Scheduling
Our First Approach:Application-Aware Memory
Channel Partitioning
Our Second Approach:Integrated Memory Partitioning
and Scheduling
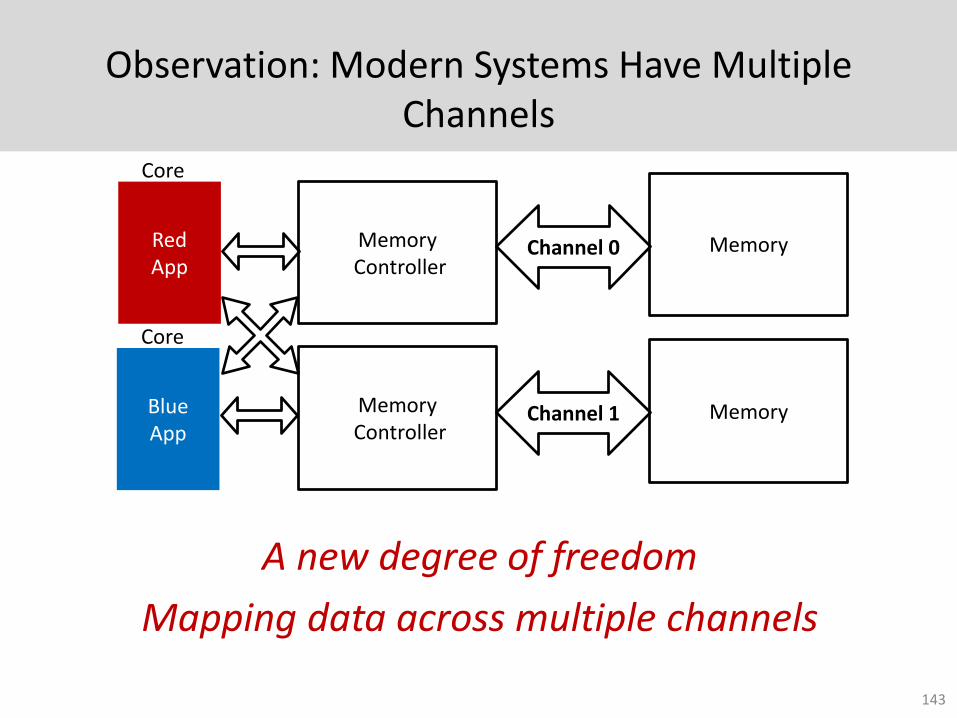
Observation: Modern Systems Have Multiple Channels
A new degree of freedom
Mapping data across multiple channels
143
Channel 0Red App
Blue App
MemoryController
MemoryController
Channel 1
Memory
Core
Core
Memory
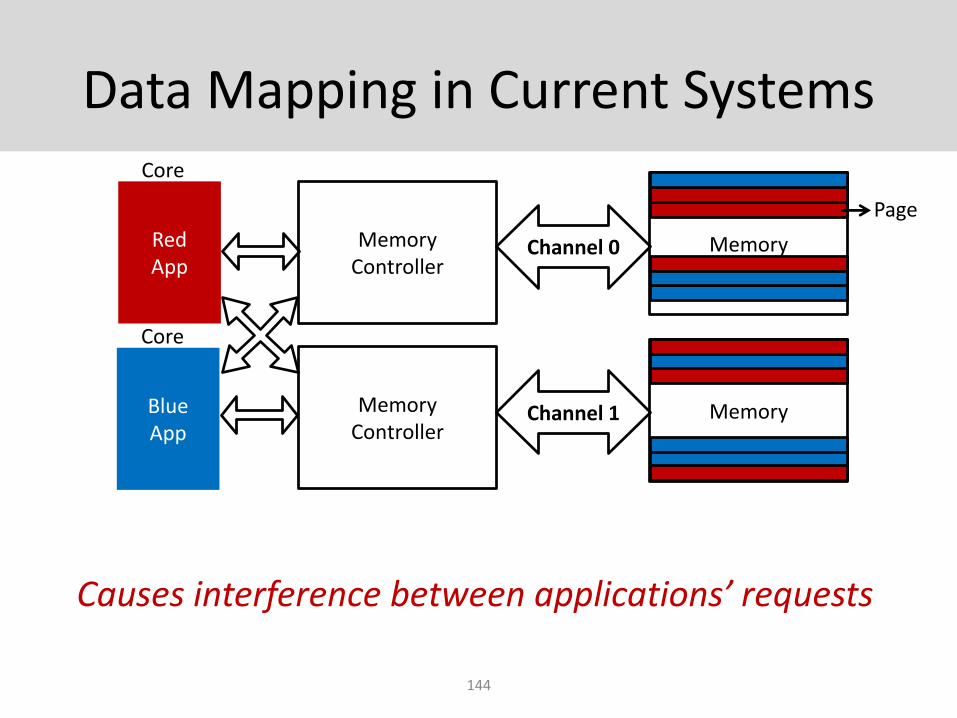
Data Mapping in Current Systems
144
Channel 0Red App
Blue App
Memory Controller
Memory Controller
Channel 1
Memory
Core
Core
Memory
Causes interference between applications’ requests
Page
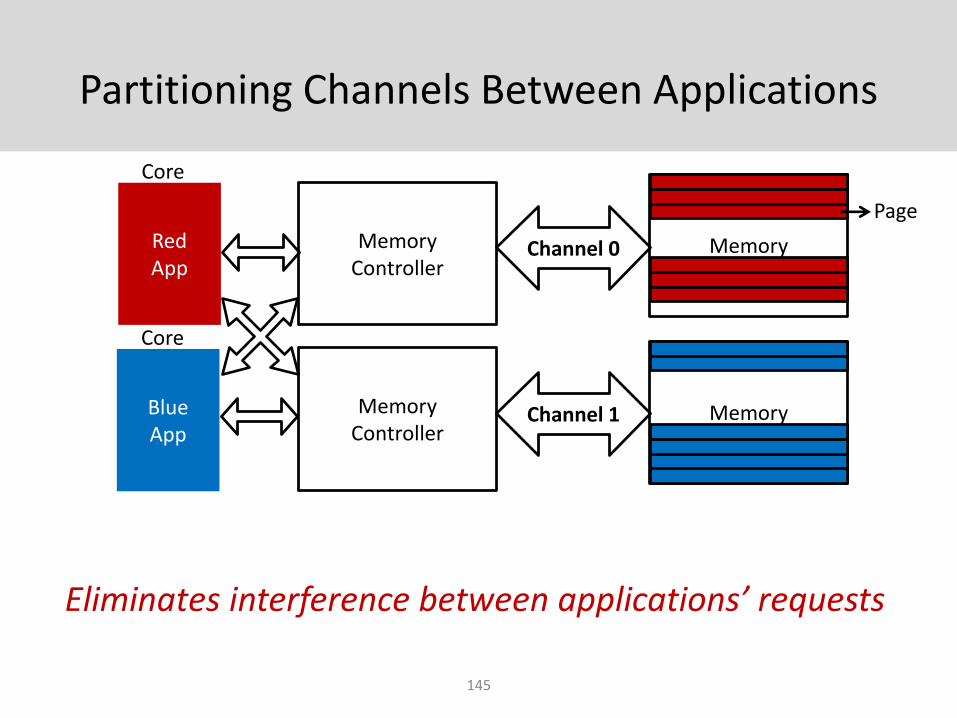
Partitioning Channels Between Applications
145
Channel 0Red App
Blue App
Memory Controller
Memory Controller
Channel 1
Memory
Core
Core
Memory
Page
Eliminates interference between applications’ requests
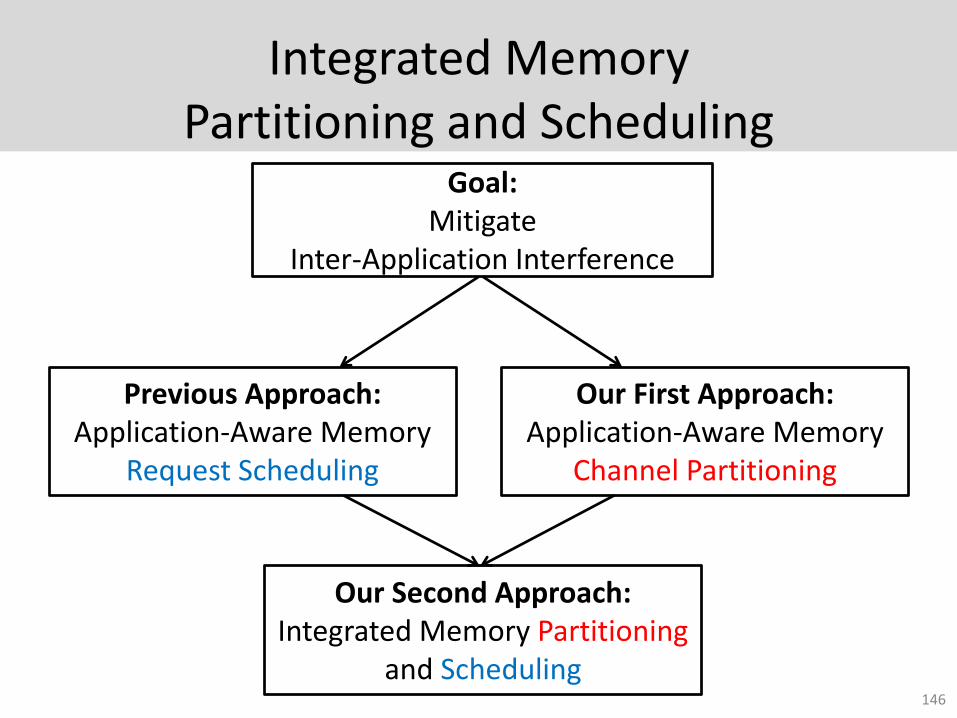
Integrated Memory Partitioning and Scheduling
146
Goal: Mitigate
Inter-Application Interference
Previous Approach:Application-Aware Memory
Request Scheduling
Our First Approach:Application-Aware Memory
Channel Partitioning
Our Second Approach:Integrated Memory Partitioning
and Scheduling
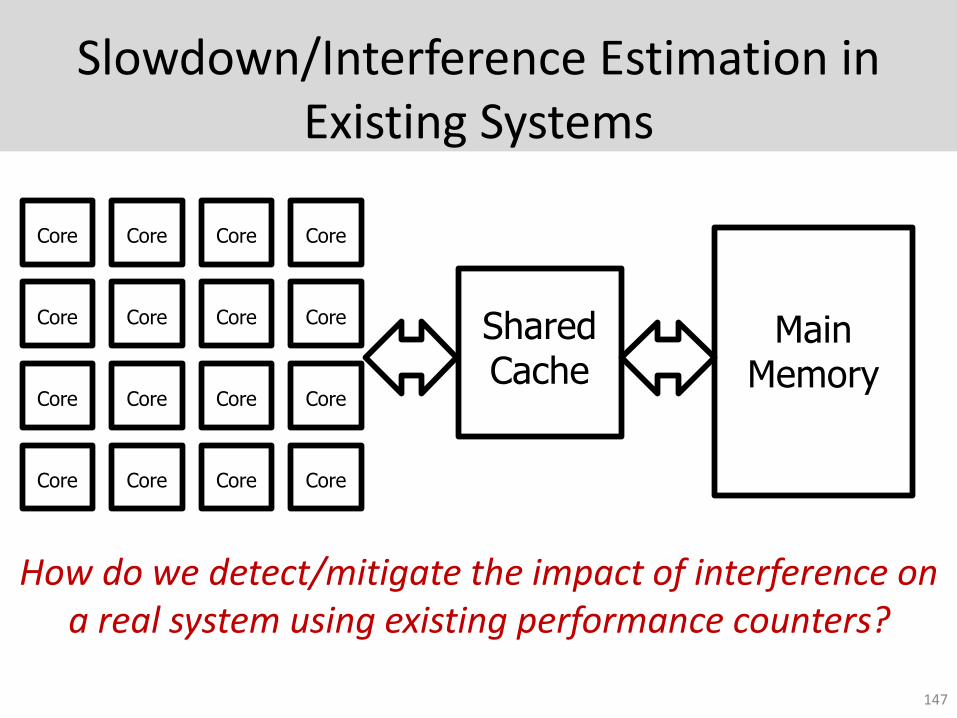
Slowdown/Interference Estimation in Existing Systems
147
Core Core Core Core
Core Core Core Core
Core Core Core Core
Core Core Core Core
Main Memory
Shared Cache
How do we detect/mitigate the impact of interference on a real system using existing performance counters?
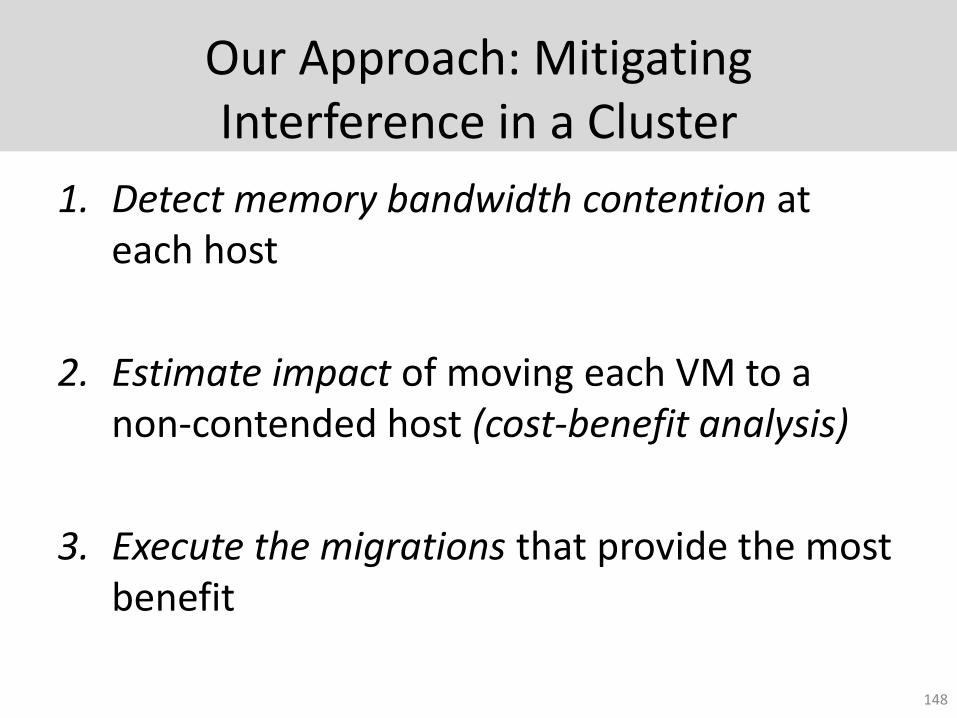
Our Approach: Mitigating Interference in a Cluster
1. Detect memory bandwidth contention at each host
2. Estimate impact of moving each VM to a non-contended host (cost-benefit analysis)
3. Execute the migrations that provide the most benefit
148
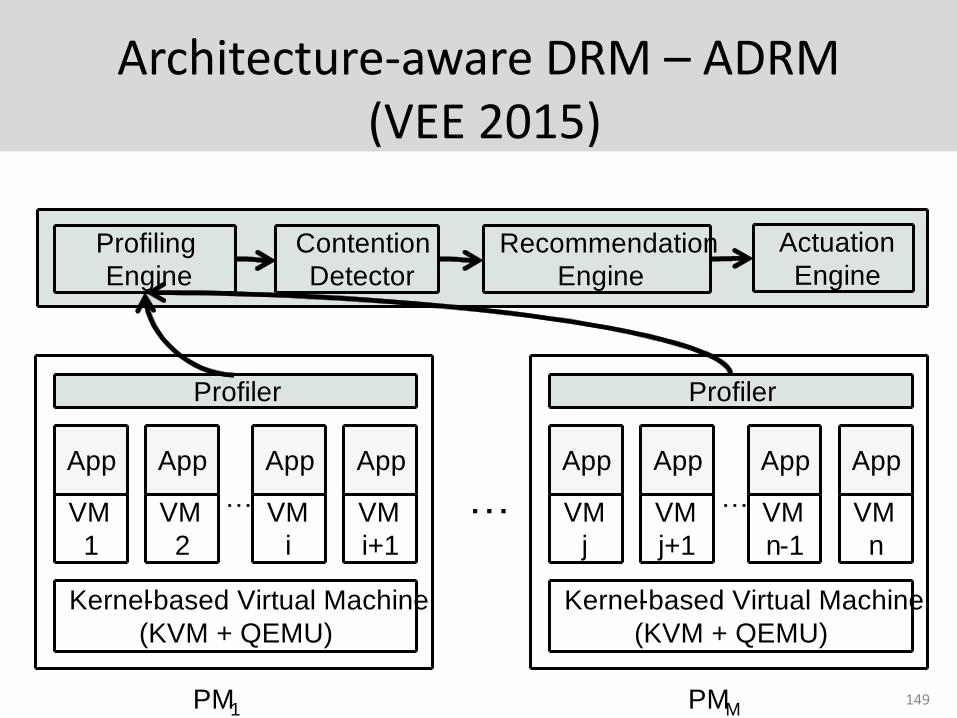
Architecture-aware DRM – ADRM(VEE 2015)
149
VM
1
Kernel-based Virtual Machine
(KVM + QEMU)
App
Profiler
VM
2
App
VM
i
App
VM
i+1
App
PM1
VM
j
Kernel-based Virtual Machine
(KVM + QEMU)
App
Profiler
VM
j+1
App
VM
n-1
App
VM
n
App
PMM
… ……
Profiling
Engine
Contention
Detector
Recommendation
Engine
Actuation
Engine
AI-DRM
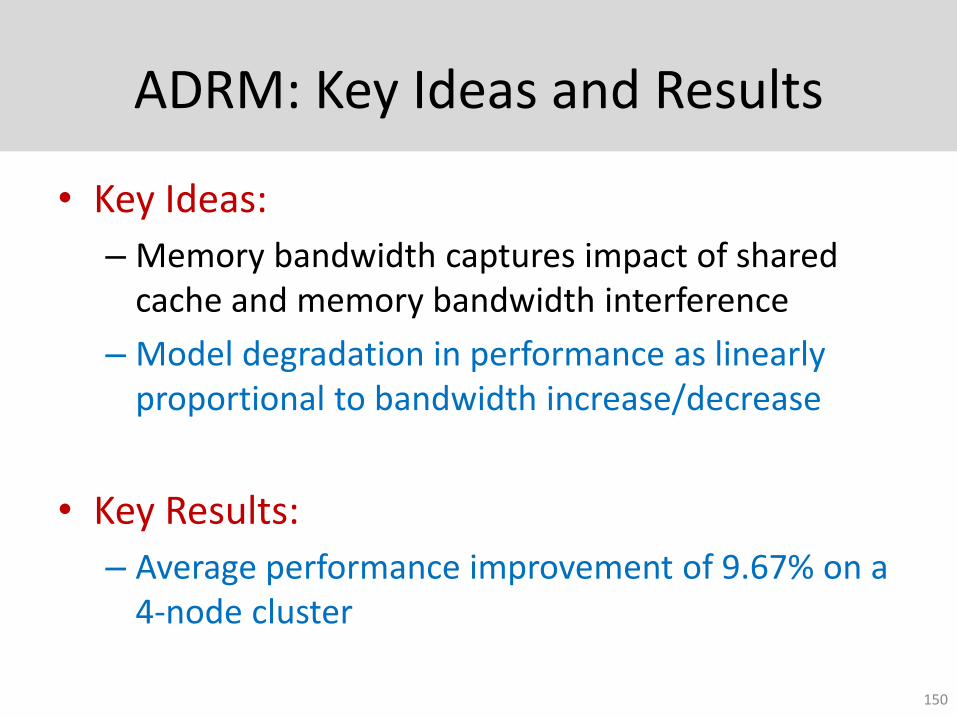
ADRM: Key Ideas and Results
• Key Ideas:
– Memory bandwidth captures impact of shared cache and memory bandwidth interference
– Model degradation in performance as linearly proportional to bandwidth increase/decrease
• Key Results:
– Average performance improvement of 9.67% on a 4-node cluster
150
QoS in Heterogeneous Systems
• Staged memory scheduling – In collaboration with Rachata Ausavarungnirun,
Kevin Chang and Gabriel Loh
– Goal: High performance in CPU-GPU systems
• Memory scheduling in heterogeneous systems– In collaboration with Hiroukui Usui
– Goal: Meet deadlines for accelerators while improving performance
151
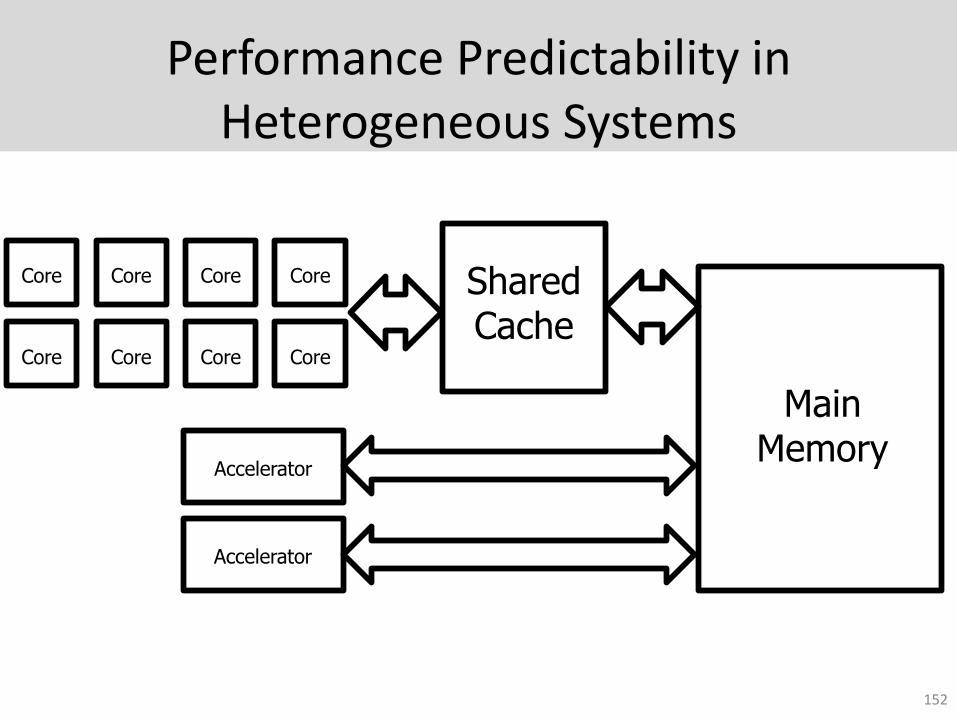
Performance Predictability in Heterogeneous Systems
Core Core Core Core
Core Core Core Core
Main Memory
Shared Cache
152
Accelerator
Accelerator
Goal of our Scheduler (SQUASH)
• Goal: Design a memory scheduler that – Meets accelerators’ deadlines and
– Achieves high CPU performance
• Basic Idea:– Different CPU applications and hardware
accelerators have different memory requirements
– Track progress of different agents and prioritize accordingly
153
Key Observation:Distribute Priority for Accelerators
• Accelerators need priority to meet deadlines
• Worst case prioritization not always the best
• Prioritize accelerators when they are not on track to meet a deadline
154
Distributing priority mitigates impact of accelerators on CPU cores’ requests
Key Observation: Not All Accelerators are Equal
• Long-deadline accelerators are more likely to meet their deadlines
• Short-deadline accelerators are more likely to miss their deadlines
155
Schedule short-deadline accelerators based on worst-case memory access time
Key Observation: Not All CPU cores are Equal
• Memory-intensive cores are much less vulnerable to interference
• Memory non-intensive cores are much more vulnerable to interference
156
Prioritize accelerators over memory-intensive cores to ensure accelerators do not become urgent
SQUASH: Key Ideas and Results
• Distribute priority for HWAs
• Prioritize HWAs over memory-intensive CPU cores even when not urgent
• Prioritize short-deadline-period HWAs based on worst case estimates
157
Improves CPU performance by 7-21%Meets 99.9% of deadlines for HWAs