Embed Size (px)
Citation preview

Le Huy Quang MAKING USE OF TANNERY CHROMIUM CONTAINING SLUDGE AS FEED FOR BIOGAS PLANT
Bachelor Thesis CENTRAL OSTROBOTHNIA UNIVERSITY OF APPLIED SCIENCES Degree Program in Chemistry and Technology April 2011

THESIS ABSTRACT
Department
Technology and Business, Kokkola
Date
April, 2011
Author
Le Huy Quang
Degree programme
Degree Program of Chemistry and Technology
Name of thesis
Making use of tannery chromium containing sludge as feed for biogas plant
Instructor
Jukka-Pekka Parjanen
Pages
67 + Appendices (5)
Supervisor
Maija Rukajärvi-Saarela
This thesis is a part of a leather wastewater management project, carried out by the
company TEKNOLOGIAKESKUS KETEK Oy. The aim of the project is to find out
effective treatments of the sludge coming out of tanneries' wastewater treatment plant.
This thesis investigates the feasibility of using high chromium content tannery sludge as
feed for a biogas plant.
The method used to treat sludge in this thesis is anaerobic digestion. All analysis and
lab-scale digestions were carried out in reference to the Finnish SFS standards. Besides,
the target plant which might be able to treat the sludge, all the cost for transporting and
bringing the sludge to the target biogas plant, as well as the legislative issues were taken
into account.
It was proven that treating the sludge by anaerobic digestion is technically and
economically feasible, but the legislative barriers are still difficult to cover. Therefore,
further investigation are required in order to solve the problem of high metal
concentration in the sludge sustainably.
Key words
Chromium containing sludge, tannery sludge, biogas, biogasification, anaerobic digestion

TABLE OF CONTENTS
1 INTRODUCTION ......................................................................................................... 1
2 TANNERY PROCESS AND ITS OUTPUTS ............................................................... 3
3 ANAEROBIC DIGESTION .......................................................................................... 6
3.1 Hydrolysis .............................................................................................................. 6
3.2 Acidogenesis .......................................................................................................... 7
3.3 Acetogenesis .......................................................................................................... 8
3.4 Metanogenesis ....................................................................................................... 9
3.5 Overall view of anaerobic digestion process ....................................................... 10
4 PROCESS PARAMETERS ......................................................................................... 11
4.1 Concentration of the micro-organisms in the substrate ....................................... 11
4.2 pH value of the substrate ..................................................................................... 12
4.3 Hydrogen partial pressure in equilibrium with the subtrate ................................ 12
4.4 Nature of the substrate ......................................................................................... 13
4.5 Amount of nutrient available in the substrate ...................................................... 14
4.6 Effect of light on anaerobic digestion.................................................................. 15
4.7 Temperature of the substrate ............................................................................... 15
4.8 Specific surface of digested material ................................................................... 17
4.9 Red-ox potential of the substrate ......................................................................... 17
4.10 Substrate disintegration ....................................................................................... 17
4.11 Inhibitors to the metabolism of the microbes ...................................................... 18
4.11.1 Oxygen ........................................................................................................... 19
4.11.2 Nitrogen compounds ...................................................................................... 19
4.11.3 Sulfur compounds .......................................................................................... 20
4.11.4 Organic acids .................................................................................................. 22
4.11.5 Metal ions ....................................................................................................... 22
5 BIOGAS IN FINLAND ............................................................................................... 25
5.1 Finnish biogas abstract ........................................................................................ 25
5.2 Kaustinen biogas plant ........................................................................................ 27
6 SLUDGE COMPOSITION .......................................................................................... 29
6.1 Determination of inorganic contents ................................................................... 29

6.1.1 Drying the sample .......................................................................................... 30
6.1.2 Microwave digestion ...................................................................................... 30
6.1.3 Inductively coupled plasma - Mass spectrometer (ICP - MS) ....................... 31
6.1.4 Ion Chromatography - Mass spectrometry (IC - MS) .................................... 34
6.2 Determination of organic content ........................................................................ 35
7 BIOGASIFICATION ................................................................................................... 40
7.1 Microbe test ......................................................................................................... 40
7.2 Biogasification, standard approach...................................................................... 41
7.2.1 Test medium ................................................................................................... 42
7.2.2 Inoculum ........................................................................................................ 43
7.2.3 Sampling procedure ....................................................................................... 45
7.2.4 Biogasification test ......................................................................................... 46
7.2.5 Results and discussions .................................................................................. 48
7.3 Biogasification, practical approach ..................................................................... 49
7.3.1 First experiment ............................................................................................. 49
7.3.2 Second experiment ......................................................................................... 53
8 ECONOMICS ASPECTS ............................................................................................ 58
8.1 Logistic cost ......................................................................................................... 58
8.2 Entrance fee ......................................................................................................... 60
9 CONCLUSIONS .......................................................................................................... 61
REFERENCES ............................................................................................................. 63
APPENDICES

1
1 INTRODUCTION
The leather industry has a long history in Finland, dating back for centuries. Nowadays,
most of the existing tanneries are very old with over 100 years of operation, and they have
various problems with the chemical content of their sludge, especially with chromium,
sulfate and chloride, common constituents of traditional and indispensable agents used in
the tanneries’ processes. The high chromium content is not only problematic to the
environment but also to the tanneries because, according to the EU Directive 2003/33/EC
and two Finnish Decrees VNp 861/97 and VNp 202/2006 which limit the chemical content
in sludges allowed to be land-filled, tannery sludge cannot go to a land-fill site and has to
be stored in the backyard of the tanneries.
The Central Ostrobothnia region is the center of Finnish tanning industry with the presence
of five big tanneries: Geson, Ahlskog, Kokkolan Nahka, Bröderna Brandt and Lapuan
Nahka. Currently, the output sludge from those tannery comprises of hairing, fleshing (the
proteinaceous sludge, which pose no harm to the environment and are being sent to
composting or biogasification) and the chromium containing sludge (Cr sludge), which is
problematic.
As the tanneries' production is high, the burden of storing the sludges is heavy, and
something should be done to solve the problem. This is why the Leather Waste project
commenced in 2008, administered by Technology Center KETEK Ltd. Up till now,
researchers at KETEK have come up with effective methods to treat the sludge:
incineration and thermal desorption followed by stabilization, or chromium precipitation,
or even land-filling the sludge with special cover. Nevertheless, they are only partially
sustainable, and are fairly expensive, which means that the found methods are not good
choices for the tanneries in the long run, and also there is no guarantee that those methods
can be carried out in the future as the legislation is becoming stricter.
Therefore, more sustainable approaches to the treatment of tannery sludge are considered.
This thesis concentrates on one of such methods: biogasification under anaerobic pathway.
The main task of this work is to estimate the possibility of using tannery chromium sludge

2
as feed for biogas plant. In order to achieve that goal, step by step, the following questions
must be answered:
• Does the Cr sludge contain enough organic matter to be biogasified?
• Is the high metal concentration inhibitory, or even toxic to the anaerobic digestion
process? According to the current legislation and biogas plant's requirement, can it
used as feed?
• If it is possible to biogasify that kind of sludge, how to deal with the end-of-pipe
sludge, according to the current legislation?
• What is the estimated cost (of logistic and biogas plant entrance fee) of treating the
Cr sludge?
To summarize, this method must be checked for its technical feasibility, as well as its
economical viability, and above all, the correspondence to current Finnish environmental
legislations.
First of all in this thesis, the tannery process and chemical usage will be discussed in order
to provide good information from which contents of the output sludges can be estimated.
The inorganic and organic contents of the sludge, which play a decisive role in the success
of the biogasification method, will be determined later, in the experimental part by using
different analysis methods such as ICM-MS, IC-MS, bomb calorimetry. The background
of anaerobic digestion, the way by which chromium containing sludge is degraded,
together with its parameter, are also discussed. Further in the theoretical part, the current
situation of Finnish biogas production and usage, as well as background of the target plant
which do the treatment of the tannery sludge, are presented.
The experiments carried out in this thesis are done in reference to current Finnish standard,
with certain modifications so that they suit the availability of facilities in KETEK, where
mostly all the experimental works were made. And last of all, the cost of transporting and
treating the sludge are also estimated after the method is proved feasible.

3
2 TANNERY PROCESS AND ITS OUTPUTS
In this part, the main processes of tanneries are discussed. The chemicals used are
introduced so that the composition of the outlet sludge streams can be predicted.
The tanning process consists of a sequence of mechanical and chemical processes in which
the animal skins and hides are converted into leather products (Kustula, Salo, Witick &
Kaunismaa 2000, 11; Alibardi 2008, 4). There are four basic stages in the tanning process:
beamhouse, tanning, post-tanning and finishing.
First stage: beamhouse (preliminary processing)
In beamhouse stage, raw materials for the main process are prepared through various
cleaning and conditioning steps:
• Soaking: helps preserved hides to regain their normal water content, as well as
their softness and shape, and also eliminates retained dirt, blood, manure,
preservatives (mainly NaCl), etc. (Kustula et al. 2000, 11; Alibardi 2008, 5).
• De-hairing: “exiles” hairs, wool and keratin from the hides chemically by using
lime (CaO) and sulfur compounds (Kustula et al. 2000, 11).
• Deliming: removes excessive lime used in de-hairing by abundant water flow
containing ammonium sulfate, (NH4)2SO4, or more innovatively, by carbon
dioxide, CO2 (Kustula et al. 2000, 11).
• Bating: eliminates the impurities by adding enzymes (Kustula et al. 2000, 11).
• Pickling: reduces pH (i.e. increases the acidity by adding acids) of the pelts, so that
They are favorable to be tanned by Chromiumr in the following phase; the low pH
condition also inhibits the operation of the enzymes (Kustula et al. 2000, 11). In
this step, salts are also added to prevent the hides from swelling (Alibardi 2008, 5).
The liquid-phase effluent from beamhouse contains excessive chemicals and organic
matter, while other wastes are mainly proteinaceous animal residues, so called hairing and
fleshing sludge (Kustula et al. 2000, 11). This kind of wastewater is readily biodegradable
and does not cause any serious environmental problem.

4
Second stage: tanning
During the tanning phase, the tanning agents interact with the collagen matrix of the hide,
stabilizing both the collagen and proteins. The leather thus attains resistance towards
chemical, thermal and microbiological degradation. (Dhayalan, Fathima, Gnanamani, Rao,
Nair & Ramasami 2006.) Excluding some special cases where vegetal agents and syntans
are used, the leathers are generally (and inexpensively) treated by chromium tanning, with
trivalent chromium sulfate (Kustula et al. 2000, 12). The hides are soaked in chromium
baths of increasing strength, and cross-linkages between chromium ions and free carboxyl
groups in the collagen are formed, giving the hides high thermal and bacterial resistance
(Alibardi 2008, 5 & Dhayalan et al. 2006). During tanning, pH of hides is also increased
gradually through the addition of base for the fixation of chromium (Alibardi 2008, 5).
The output of this stage is acidic stream containing unused chromium tanning agents, and
small amounts of leather residues (Kustula et al. 2000, 12). Due to the stream's high Cr3+
concentration, trace amount of toxic Cr6+ and organic contents, it is regarded as hazardous.
Third stage: post-tanning
The addition of magnesium oxide and fungicide further fixes the chromium into the leather
(Alibardi 2008, 5). Washing is done to eliminate the unfixed tanning agents and this
contributes more chromium to the out flow stream of the process (Kustula et al. 2000, 12).
Last stage: finishing
Tanned hides undergo a chain of mechanical and chemical operations such as dyeing,
trimming and stretching so that they obtain their final color, gloss, softness, “feeling” and
endurance (Kustula et al. 2000, 12). The waste stream from the finishing part contains
residual chemicals and leather pieces.
For a more practical view of tannery process, flow charts describing the process of a
tannery involved in the Leather Waste project and the process of its wastewater treatment
plant are shown in Appendix1.

5
Environmental impacts of tanneries
From the description of the tannery process in the previous section, it is obvious that a
huge amount of resources such as water, raw hides and chemicals are used, but,
unfortunately only a small part of them can reach the final leather products, i.e. large
quantities come out as waste, posing threats to the environment. The resources consumed
by tanneries involved in the Leather Waste project are listed in Table 1.
TABLE 1. Amount of chemicals used by Finnish tanneries involved in Leather Waste
project (reproduced from a tannery's report)
Chemical Amount (kg/year)
Na 462.38
Mg 2173.59
Al 270.20
S 767.56
Ca 1324.56
Cr 1246.60
Fe 771.95
Sulfate 2142.77
Chloride (dissolved) 264.35
Other inorganic 26.04
Total inorganic 9450
Total organic 15279
Water 131624
TOTAL 156353
The above figures are just referential in order to indicate how much waste the tanneries can
produce. The annual output of the sludge containing Cr3+ from the tanneries involved in
this project is currently 184 tons, which cannot go to a land-filling site, and is thus
currently piling up in their backyards, waiting to be treated.

6
3 ANAEROBIC DIGESTION
In this part of the Leather Waste project, the exclusive method used to treat the tannery
sludge is anaerobic digestion (also known as methane fermentation). This is a complex
biochemical method in which different types of polymeric organic materials undergo a
series of microbiological reactions and finally, are reduced into methane and carbon
dioxide. (Miyamoto 1997). The term anaerobic indicates that the process takes place in an
oxygen-free environment.
The process of anaerobic digestion is universally divided into four phases which are
named, according to the main reaction mechanisms: the hydrolysis, acidogenesis,
acetogenesis and finally, methanogenesis. Each individual phase is carried out by a specific
group of micro-organisms which has syntrophic relations with the others, but "operates"
under different environmental conditions (Deublein & Steinhauser 2008, 93.)
The general biochemical reaction for anaerobic digestion is:
[ ]
[ ]
[ ]
2 4 3 2 2( ) 1
1(4 2 3 2 ) 2
81
(4 2 3 3 ) 34
c h o n sC H O N S yH O xCH nNH sH S c x CO
x c h o n s
y c h o n s
+ → + + + −
= + − − −
= − − + +
(Deublein & Steinhauser 2008, 89.)
3.1 Hydrolysis
In the hydrolysis phase, polymeric organic materials are taken up and broken down into
water-soluble fragments by their corresponding hydrolytic enzymes (Miyamoto 1997):
• Polysaccharides (carbohydrates) such as cellulose, starch and pectin are hydrolyzed
by cellulases, amylases, and pectinases, respectively, into monosaccharides.
• Lipids are converted by Lipases into long-chain fatty acids
• Proteins are cleaved into amino acids by proteases.

The hydrolysis of carbohydrates takes place
lipids is a few days. C
facultative anaerobic microbes consume
red-ox potential for the obliga
3.2 Acidogenesis
In the acidogenic phase,
are further degraded into short
propionic acid, acetate, acetic acid
dioxide (Miyamoto 1992
Glycolysis, i.e. Embden
the micro-organisms
intermediate in the conversion
conversion is shown in
D-Glucose
GRAPH 1. Example of
Nicotinamide adenine dinucleotide (NAD) is an important coenzyme in the cell, which
plays the role as "electron carrier" in oxidation through the reaction shown in
GRAPH 2. Red-ox reac
Nicotinamide adenine dinucleotide
The hydrolysis of carbohydrates takes place within a few hours, while
. Celluloses degrade slowly and incompletely
e anaerobic microbes consume dissolved oxygen in water, creating
ox potential for the obligatory microbes. (Deublein & Steinhauser
acidogenic phase, through various pathways the monomers formed in the hydrolysis
are further degraded into short- chain (1–5 C) aliphatic acids
acid, acetate, acetic acid, a small part of ketones, alcohol, hydrogen,
(Miyamoto 1992; Serna 2009). One remarkable degradation pathway is the
Embden-Meyerhof-Parnas (EMP) pathway taking place in the
organisms, in which hexoses and pentoses are broken into
in the conversion to various C2 and C3 compounds
conversion is shown in Graph 1.
Pyruvate
of Glucose' EMP degradation (adapted from Glycolysis
Nicotinamide adenine dinucleotide (NAD) is an important coenzyme in the cell, which
plays the role as "electron carrier" in oxidation through the reaction shown in
ox reactions of Nicotinamide adenine dinucleotide
Nicotinamide adenine dinucleotide 2005)
7
while that of proteins and
degrade slowly and incompletely. During the hydrolysis,
dissolved oxygen in water, creating favorable low
Steinhauser 2008, 94.)
monomers formed in the hydrolysis
C) aliphatic acids such as butyric acid,
, alcohol, hydrogen, and carbon
degradation pathway is the
taking place in the cytoplasm of
, in which hexoses and pentoses are broken into Pyruvate, an
compounds (UM-BD 2000). This
Pyruvate
dapted from Glycolysis 2004)
Nicotinamide adenine dinucleotide (NAD) is an important coenzyme in the cell, which
plays the role as "electron carrier" in oxidation through the reaction shown in Graph 2.
Nicotinamide adenine dinucleotide - NAD (adapted from

8
3.3 Acetogenesis
In this phase, products from the previous phases (excluding acetate, acetic acid, hydrogen
and carbon dioxide) are transformed into hydrogen, carbon dioxide and acetic acid via
acetogenic activities (Deublein & Steinhauser 2008, 96, 97). Typical conversions in
acetogenesis are shown in Table 2.
TABLE 2. Acetogenic degradations (adapted from Deublein & Steinhauser 2008, 96)
Substrate Reaction
Propionic acid 3 2 2 3 2 22 3CH CH COOH H O CH COOH CO H+ → + +
Butyric acid 3 2 2 2 3 2( ) 2 2 2CH CH COO H O CH COO H H− − ++ → + +
Valeric acid 3 2 3 2 3 3 2 2( ) 2 2CH CH COOH H O CH COO CH CH COOH H H− ++ → + + +
Isovaleric acid 3 2 2 3 2 3 2( ) 3CH CHCH COO HCO H O CH COO H H− − − ++ + → + +
Capronic acid 3 2 4 2 3 2( ) 4 3 5CH CH COOH H O CH COO H H− ++ → + +
CO2 and H2 2 2 3 22 4 2CO H CH COO H H O− ++ → + +
Glycerin 3 8 3 2 3 2 23C H O H O CH COOH H CO+ → + +
Lactic acid 3 2 3 3 22 2CH CHOHCOO H O CH COO HCO H H− − − ++ → + + +
Ethanol 3 2 2 3 22CH CH OH H O CH COOH H+ → +
Obviously in Table 2, the acetogenic microbes are obligatory hydrogen-producers.
According to the equilibrium rule, their functions can only be guaranteed in a low
hydrogen concentration. Therefore, it is very often that the acetogens are brought into
symbiosis with obligatory hydrogen-consumers, i.e. micro-organisms which remove
hydrogen during their metabolism. (Deublein & Steinhauser 2008, 97.)
On the other hand, the reactions in this phase are endothermic, i.e. they are energetically
unfavorable, for example the free Gibbs energy change in the degradation of propionic
acid, butyric acid and ethanol is 76.1, 48.1 and 9.6 kJ/mol, respectively. Therefore,
acetogens might be coupled with other microbes whose metabolism is exothermic. Thus,
the net reaction is energetically possible.

9
3.4 Metanogenesis
Methanogenesis, the last phase during which the output from the previous phases are
converted into CH4, takes place under strictly anaerobic conditions and under low red-ox
potential (less than -300 mV). Acetate, together with H2, CO2, are the main substrates
available in the natural environment; however, formate, methanol, methylamines, and CO
are also converted into CH4. (Miyamoto 1997.)
Different types of previous phases' metabolic products are handled by different
methanogenic groups. Methanogens are universally divided into three types (Deublein &
Steinhauser 2008, 98.) as following:
• CO2 type micro-organisms reducing CO2, HCOO-, and CO
• Methyl type micro-organisms reducing CH3OH, CH3NH3, (CH3)2NH2+, CH3SH,
and (CH3)2S, etc.
• Acetate type micro-organisms reducing CH3COO- , this is the main methanogenic
microbial group
Some typical conversions in this phase, together with their free Gibbs energy changes, are
shown in Table 3.
TABLE 3. Methanogenic degradations and the energy changes of reaction (adapted from
Deublein & Steinhauser 2008, 98)
Substrate type Reaction ∆G (kJ/mol)
CO2-Type 2 3 4 24 3H HCO H CH H O− ++ + → + - 135.4
2 2 4 24 2CO H CH H O+ → + - 131.0
CO2-Type 2 4 33HCOO H O H CH HCO− + −+ + → + - 130.4
Acetate 3 2 4 3CH COO H O CH HCO− −+ → + - 30.9
Methyl type 3 4 3 24 3CH OH CH HCO H H O− +→ + + + - 314.3
Methyl type 3 2 4 2CH OH H CH H O+ → + - 113.0
Ethanol 3 2 2 4 32 2CH CH OH CO CH CH COOH+ → + - 116.3

10
3.5 Overall view of anaerobic digestion process
The whole process of anaerobic digestion can be summarized in a few words as following:
Polymeric organic materials are hydrolyzed into monosaccharides and long-chain fatty
acids which are then broken down into hydrogen, acetic acid, acetate, CO2, etc. Finally,
they are converted into CH4 and CO2.
In practice, it is unnecessary for the four phases to be operated separately. The anaerobic
digestion process can be accomplished in just two stages, based on the fact that certain
phases have similar "living conditions" and symbiotic co-relation (Deublein & Steinhauser
2008, 93), for example:
• 1st stage: hydrolysis and acidogenesis
• 2nd stage: acetogenesis and methanogenesis
In the first stage, the combined hydrolytic enzymes and acidogens prepare the substrates
(short-chain organic compounds, part of H2, CO2) for the next stage. In the first stage,
hydrolysis is usually the rate-limiting step (Miyamoto 1997).
While the coupling of the first two phases is optional, the symbiosis of the acetogens and
methanogens is essential and vital. As discussed earlier, the hydrogen generated in
acetogenesis is consumed in the methanogenesis. If this symbiosis is not established,
acetogens will soon be surrounded by hydrogen, consequently ceasing acetate production,
and the output of the acetogenic phase will be predominantly occupied by butyric,
capronic, propionic and valeric acid, which cannot be processed by the methanogens.
(Deublein & Steinhauser 2008, 97, 101; Miyamoto 1997.)
Each phase in the anaerobic digestion has its own optimum conditions where the
corresponding micro-organisms function the best. The parameters of the process will be
discussed with details in the next section.

11
4 PROCESS PARAMETERS
Even though the microorganisms involved in the anaerobic digestion can adapt to different
environmental condition, they are very sensitive, i.e. minor change in the substrate
conditions (temperature, constituents' concentration) may lead to a cease in methane
production. It could take weeks or months for the micro-bacterial communities to adapt
themselves to the new environment and start producing again. Therefore, consistency of
their living conditions is extremely important to the activities of the micro-organisms.
(Deublein & Steinhauser 2008, 100.)
Metabolic functions of the microbes in different phases of the anaerobic digestion take
place under different conditions. Therefore, choosing the right environment that can
harmonize the activities of the microbes would lead to a sustained gas production is a
challenging task. In order to do that, the parameters that directly affect the anaerobic
process must be studied thoroughly, and from that the optimum conditions for the digestion
of a specific substrate can be determined. The optimum can only be set in the two-stage
system as mentioned in Chapter 3.5 (Deublein & Steinhauser 2008, 100). In this part, only
the important parameters which directly relate to the experimental works are discussed in
details.
4.1 Concentration of the micro-organisms in the substrate
It is obvious that the population of microbes directly affect the degradation rate of
substrates. The regeneration time, which is characteristic for each type of microbe, plays a
decisive role in the concentration of the micro-organisms in substrate. The shorter the time,
the higher the concentration. It is reported that the regeneration time for acidogenic
bacteria can be from less than 24 hours up to 36 hours, that of the acetogens is 80–90
hours, while it may increase up to 16 days for the methane producer. Due to the differences
in regeneration times between different types of microbes, it might take up to three-month
time for a biogas plant to establish a stable operational conditions, so that the wash-out of
the microbes can be prevented; this period is called the starting phase. (Deublein &
Steinhauser 2008, 102.)

12
4.2 pH value of the substrate
Most micro-organisms, especially methanogens - the most sensitive ones - grow best under
neutral pH conditions, from 6.5 to 7.5 (Haandel & Lubbe 2007, 386). Beyond this range,
the acidic or alkali properties of the living environments can break down the chemical
equilibrium of microbes, and destroy them, thus suppressing metabolic functions and also
biogas production (Marchaim 1992). Therefore, maintaining the pH in the optimum range
is very important, and this task is often carried out with the assistance of two buffering
systems as following:
• CO2/HCO3-/CO3
2- : protects the micro-bacterial communities from too strong acidic
conditions
• NH4+/NH3 : protects the micro-bacterial communities from too strong alkaline
conditions
(Deublein & Steinhauser 2008, 114.)
It is not stated clearly in the references how the buffers are employed into the process.
However, it is implied that the way the buffers are integrated into the substrate would vary
upon the types of substrates, and also upon the process. Usually, a buffering system is
established in the feed preparation tanks, before the substrates are fed into the fermentation
tanks.
4.3 Hydrogen partial pressure in equilibrium with the subtrate
Hydrogen has different effects on the activities of the microbes present in the second stage
of the anaerobic digestion: the acetogens require a low hydrogen concentration while the
methanogens need a lot of hydrogen in order to maintain their metabolism. Therefore,
hydrogen partial pressure should be kept at a sufficient level in order to balance the need of
those two types of micro-organisms. This hydrogen level varies depending on the species
of bacteria and also on the used substrate. (Deublein & Steinhauser 2008, 101.)For
example, the effect of hydrogen partial pressure to the acetogenesis and methane
production for the substrate consisting of propionate and butyrate is shown clearly in the
Graph 3.

13
GRAPH 3. An example of the effect of H2 partial pressure on the acetogenesis and
methanogenesis (adapted from Deublein & Steinhauser 2008)
The more negative the change in free energy, the more readily the reaction takes place. In
Graph 3, it is quite obvious that in the ideal hydrogen concentration zone, the consumption
of the substrate and of the methane formation are both feasible.
4.4 Nature of the substrate
Substrates provide the microbes with vital nutrients for their metabolisms. Depending on
the substrates' degradability and nutrient contents, they will have different effects on the
rate of the anaerobic degradation. Furthermore, the intermediate products generated from
the break-down of substrates' constituents may have inhibitory effects on the activities of
micro-organisms. For example, the degradation of proteins in the substrate produces
ammonia and hydrogen sulfide, two common inhibitors to the methane production.
Therefore, detailed information about organic and inorganic compositions of the substrate
is needed for the task of choosing good parameters for the process. (Deublein &
Steinhauser 2008, 102, 103.)

14
4.5 Amount of nutrient available in the substrate
Nutrients are, basically, the food for the microbes, thus essential for their survival. In this
section, macro-nutrients (the abundance of carbon, nitrogen and phosphorus) and micro-
nutrients (mineral elements) will be discussed.
Macro-nutrients (C, N, P)
Carbon and phosphorous are two of the most important elements found in any living
things, while the role of nitrogen is also significant to anaerobic digestion (Marchaim
1992), as shown in the following:
• Nitrogen is one of the main components in the synthesis of amino acids, proteins
and nucleic acids
• Nitrogen is converted into ammonia, which helps neutralize the generated fatty
acids, maintaining a healthy pH condition for microbes
The C:N ratio of the substrate should lie between 10:1 and 30:1, optimum for anaerobic
digestion is 20:1 to 30:1 (FAO 1997), beyond this range, there will be negative effects
upon microbial activities, for example:
• Too high a C:N ratio, i.e. lack of nitrogen, leads to adverse effects on the formation
of proteins and metabolism of the micro-organisms.
• Too low a C:N ratio, i.e. abundance of nitrogen, leads to the formation of excessive
ammonia, an inhibitor in biogas production.
(Deublein & Steinhauser 2008, 116; Marchaim 1992.)
Micro-nutrients
For proper metabolism, all kinds of micro-organisms need a certain amount of trace
elements such as Fe, Co, Ni, Se, W, Mg. which have stimulatory effects at low
concentrations. Some minimum concentrations of those elements required by microbes are
given in the Table 4, in sub-topic 4.11.5. However, the presence of these elements in high
concentrations might lead to toxic effects upon the micro-organisms. (Deublein &
Steinhauser 2008, 116; Marchaim 1992.)

15
4.6 Effect of light on anaerobic digestion
Visible and near visible light is reported to suppress the growth, respiration, protein
synthesis and other cellular activities of microbes (Epel 1973). Common yeasts are
reported to be completely inhibited under 3500 lx visible light, at 12 0C (Woodward,
Cirillo & Edmund 1977). So, the light inhibition threshold can be higher at the intended
experimental conditions, at 35 0C. However, the experiment will be carried out in absolute
darkness as light is reported to severely inhibit methanogens' activities, even though not
toxic, i.e. light does not kill the methanogens (Deublein & Steinhauser 2008, 112).
4.7 Temperature of the substrate
Theoretically, anaerobic digestion is feasible in the temperature range of 3–70 0C. Usually,
this temperature range is conveniently divided into three main zones:
• Psychrophilic zone: temperature under 20 0C
• Mesophilic zone: temperature between 20 0C and 40 0C
• Thermophilic zone: temperature from 40 0C to 70 0C
(Kossmann, Pönitz, Habermehl, Hoerz, Krämer, Klingler, Kellner, Wittur, Klopotek, Krieg
& Euler - Volume II, 11.)
Different types of microbes, although belonging to the same group, have different optimum
operational temperature ranges. For example, most of the methanogens are mesophilic, but
there are still some belong to the thermophilic, and some can produce methane even at
water-frost temperature (Deublein & Steinhauser 2008, 112).
The rate of digestion increases with temperature, which is a familiar thermodynamics
principle. However, the rise in reaction rate is accompanied by the increase in ammonia
formation, which can inhibit the micro-bacteria (Krossmann et al.–Volume II, 11). Thus,
there is an optimum mini-zone in each temperature zone where the fermentation rate is the
highest. In Graph 4, which shows the relationship between fermentation time and
temperature for acidifying micro-organisms, there is a "valley" in the fermentation time
(corresponding to a peak in reaction rate) at ca. 32–38 0C for mesophilic zone and about
55–58 0C for the thermophilic zone.

16
GRAPH 4. Influence of temperature upon fermentation time (Adapted from Deublein &
Steinhauser 2008)
Operating the digestion in thermophilic mode has quite a few advantages over the others,
including the following:
• Maximum possible metabolic rate of a thermophilic microbe is superior to that of
mesophilic ones (~ 50 % higher) and a wide range of matters can be handled easily
• High temperature helps eliminate the pathogenic factors
• Oxygen is less soluble at high temperature, maintaining anaerobic conditions
(Deublein & Steinhauser 2008, 113; Haandel & Lubbe 2007, 385.)
Nevertheless, it is not always a good choice to operate anaerobic digestion in the
thermophilic mode, since the biogas yield cannot compensate for the energy used to
maintain the substrate's temperature in the thermophilic range (Haandel & Lubbe 2007,
385). The choice for the temperature range used for the process varies upon each specific
situations. For example, if the waste fed into the biogas plant is already warm (> 55 0C)
itself, thermophilic will be a good choice; otherwise, if the plant is being run in
thermophilic mode, the cost for energy used in heating up the feed must be balanced by the
increase in biogas yield (Marchaim 1992).
Among different kinds of microbes involved in the process, methanogens are the most
sensitive to temperature, especially the thermophilic ones. Any minor change in the
temperature can make them stop their metabolism, thus cease the production of methane.
Therefore, the temperature consistency in the range of +/- 2 0C around the set point is
strictly required. (Deublein & Steinhauser 2008, 113.)

17
Moreover, to optimize the two-stage digestion process, different temperature range can be
applied to each stage. For example, the hydrolysis/acidogenesis can be run in mesophilic
mode while the acetogenesis/methanogenesis in thermophilic, or vice versa. (Deublein &
Steinhauser 2008, 113.)
4.8 Specific surface of digested material
Just as in any other chemical reactions, a larger contact surface gives faster the reaction.
Crushing or grinding the biomass into finer particles might lead to a considerable rise in
biogas yield. (Deublein & Steinhauser 2008, 103.) Moreover, smaller particles are more
soluble in water, can be pumped through pipes much easier, and easier to be homogenized.
4.9 Red-ox potential of the substrate
Low red-ox potential for the methanogenesis is required: -300 to -330 mV because this
low-potential condition is favorable for the reduction of polymeric organic compounds
down to CH4. The fermentation environment has to be kept free of oxygen, sulfate, nitrate,
and other strong oxidizers, so that low red-ox potential is maintained. (Deublein &
Steinhauser 2008, 106.)
4.10 Substrate disintegration
Disintegration is the process of denaturizing the cell structure of the substrate with high
energy impact (Deublein & Steinhauser 2008, 106). Disintegration provides conveniences
such as:
• Increasing the degree of decomposition, decrease the amount of sludge
• Increasing the biogas yield
• Lowering the viscosity of the sludge, improving the heat transfer and mixing
• Reducing the chance of forming floating sludge and foaming
(Deublein & Steinhauser 2008, 106–110.)

18
However, disintegration increases the power consumption of the plant significantly, as well
as poses a threat by corroding the facilities, due to the usage of heat, chemicals, etc. in
disintegrating substrates (Deublein & Steinhauser 2008, 109–110). Extra costs and the
increase in biogas yield must be carefully considered and balanced so that the process is
economically favorable.
4.11 Inhibitors to the metabolism of the microbes
A material may be judged inhibitory when it causes an adverse shift in the microbial
population or suppression upon bacterial growth. Inhibition is usually indicated by a
decrease in the steady-state rate of methane gas production and accumulation of organic
acids (Kroeker, Schulte, Sparling & Lapp 1979). In practice, low biogas yield mostly
comes from the excessive presence of inhibitors, not due to the other parameters such as
pH, temperature, redox potential. which are more easily controlled. The behaviors of
inhibitors are complicated and hardly-controllable because of the following reasons:
• Different microbes have different abilities to adapt to the living environment. The
initial level of inhibition can become normal after a certain period. The ability to
adapt also depends on the microbes present in the symbiosis in reactors.
• As inhibitors do not penetrate immediately into the micro-organisms, the
exposure time is a significant factor. In this case, the type of biogas plant (batch or
continuous flow) is decisive.
• Inhibitors may have mutual interactions: they can neutralize the inhibitory
characteristics of each other (in the case of precipitation between sulfide and
heavy metal cations) or can amplify the inhibition.
• Intermediate products from the digestion may contribute to the inhibitory factor.
(Deublein & Steinhauser 2008, 118.)
Therefore, obtaining a general set of limits for the inhibitors seems to be an impossible
task. However, deep investigation on their inhibitory effects and mechanisms might
uncover some clues about how to deal with the threat of inhibition in anaerobic digestion.
In this part, the inhibition of oxygen, sulfur, nitrogen compounds, organic acids and metals
will be discussed.

19
4.11.1 Oxygen
As the term anaerobic dictates, methane fermentation cannot be realized in the presence of
oxygen. Inhibition towards the methanogenesis begins at the oxygen concentration of
about 0.1 mg/L. However, obligatory anaerobic methanogens often live in symbiosis with
facultative anaerobic acidogenic microbes who can consume oxygen in their metabolism.
Therefore, small amounts of oxygen can be present and the system is still effectively
anaerobic. (Deublein & Steinhauser 2008, 119).
4.11.2 Nitrogen compounds
Nitrogen is a common and abundant element present in organic compounds. Nevertheless,
nitrogen derivatives such as ammonia, ammonium and nitrate can cause serious inhibition.
Ammonia – ammonium
NH3 and NH4+ are generated from the anaerobic degradation of nitrogen compounds
(Kayhanian 1999). Various studies indicate that ammonia is confirmed as an inhibitor
while ammonium is almost harmless, at normal concentration (Deublein & Steinhauser
2008, 123). Ammonia is freely membrane-permeable, and therefore it can passively diffuse
into microbial cells, causing proton imbalance and potassium deficiency, thus limiting the
microbes' activities (Kroeker et al. 1979; Baere, Devocht, Assche & Verstraete 1984;
Gallert, Bauer & Winter 1998; Sprott & Patel 1986). Methanogenic species are the most
sensitive to the inhibitory effects of ammonia.
According to several research results, the nitrogen inhibition threshold for ammonia is 80
ppm (Marchaim 1992), while that of ammonium is higher than 1500 ppm (Deublein &
Steinhauser 2008, 123). Moreover, as ammonia and ammonium are conjugated acid/base
pair, existing in chemical equilibrium, their relative concentration ratio is dictated by the
pH and temperature of the substrate, making their behavior more unpredictable. On the
other hand, preceding studies show that the inhibition of ammonia can be relieved by the
presence of certain ions such as Na+, Ca2+ and Mg2+ (McCarty & McKinney 1961; Braun,
Huber & Meyrath 1981; Hendriksen & Ahring 1991).

20
Nitrate
Nitrate is found inhibitory to the methane formation process with the nitrogen
concentration over 50 ppm. Fortunately, most of the nitrate is usually denitrified in the
composition stage before methanogenesis. However, denitrification can lead to a shortage
in carbon supply for the methanogens, i.e. competition for nutrients between denitrificating
microbes and methanogenic ones , thus lowering the biogas yield. (Deublein & Steinhauser
2008, 122.)
4.11.3 Sulfur compounds
Sulfide and sulfate are the two most common inhibitors among the sulfur compounds. The
sludges from the tanneries involved in the Leather Waste project have a very high content
of sulfur, mainly in the form of sulfate due to the usage of Cr2(SO4)3, (NH4)2SO4 and
H2SO4 in the process. Therefore, it is worth investigating the inhibitory effect of the sulfur
compounds carefully.
Sulfide
The most common and toxic form of sulfide is hydrogen sulfide, H2S. Sulfide is generated
as a by-product throughout the digestion of sulfur containing proteins and sulfate in the
substrate (Haandel & Lubbe 2007, 387). They are both evacuated out together with the
biogas and dissolved back into the substrate. Hydrogen sulfide in the substrate, especially
the in the undissociated form, is the main cause for micro-biological inhibition (Deublein
& Steinhauser 2008, 120).
The inhibitory effect of H2S is due to the fact that it can diffuse through the cell membrane,
into the cytoplasm, where it starts denaturing native proteins by forming sulfide anions and
disulfide cross-link between polypeptide chains. Moreover, H2S can interfere with many
coenzyme sulfide linkage or with the assimilatory metabolism of sulfur. Those behaviors
of hydrogen sulfide inside the cells can seriously inhibit the activities of the microbes, or
even lethal to the micro-organisms. (Conn, Stumpf, Bruening & Doi 1987; Vogels,
Kejtjens & Drift 1988, 988.)

21
Furthermore, sulfide can inhibit the process indirectly by precipitating the essential trace
elements (Deublein & Steinhauser 2008, 120).
It is determined that a concentration of dissolved undissociated H2S of about 50–400 mg/L
is poisonous for the cells, while up to 600 mg/L of Na2S and 1000 mg/L of H2S can be still
tolerable through the acclimation mechanisms of the micro-organisms (Deublein &
Steinhauser 2008, 119–120; Parkin, Lynch, Kuo, Keuren & Bhattacharya 1990).
However, the toxic thresholds stated above are just for reference, according to various
studies. In practice, those values may vary upon the change in pH and temperature of the
substrate, for example:
• The toxicity of sulfide increases with the rise of pH (McCartney & Oleszkiewicz
1991)
• The toxicity of sulfide increases with the rise of temperature (Deublein &
Steinhauser 2008, 121)
On the other hand, the presence of sulfide in the substrate may be favorable, as it helps
remove the excessive heavy metal ions through precipitation (Deublein & Steinhauser
2008, 121).
Sulfate
Sulfate is reported to cause inhibition at the concentration of 5000 ppm. Firstly, sulfate
inhibits the production of biogas through a reaction called sulfate-reducing process
competing with the methanogenis. Reducing sulfate is more energetically favorable as free
Gibbs energy changes are more negative.
The more severe problem, and also the main cause of sulfate inhibition, is that, when
sulfate is reduced , toxic hydrogen sulfide is generated as shown in the following reactions:
[ ][ ]
24 2 2 2
24 3 2 3
4 2 2 6
2 7
SO H H S H O OH
SO CH COOH H S HCO
− −
− −
+ → + +
+ → +
(Deublein & Steinhauser 2008, 119.)

22
4.11.4 Organic acids
Organic acids present in the methane fermentation process are aliphatic and amino acids
generated in hydrolysis, acidogenesis and partly in acetogenesis. Normally, these acids stay
in biochemical equilibrium, and pose virtually no threat, but if there is a disruption in the
anaerobic process, the acidogenesis will predominate and produce excessive acids which
seriously inhibit the digestion.
Like sulfide, these acids can be in the non-toxic ionized form or in the undissociated form
which is toxic. It can penetrate through the cell membrane into the cells, due to its
lipophilic nature, and then dissociate in the cytoplasm, upsetting the pH equilibrium of the
cell, or even interfere with the transport and protective function of the cells (Haandel &
Lubbe 2007, 387; Deublein & Steinhauser 2008, 121; Rinzema, Boone, Knippenberg &
Lettinga 1994).
Moreover, the accumulation of organic acids leads to a drop in pH value, intensifying the
inhibition (Deublein & Steinhauser 2008, 121). Here are some reported inhibiting
thresholds for fatty acids:
• Acetic acid: 1000 mg/L at pH < 7
• Iso-butyric and Iso-valeric acid: 50 mg/L at pH < 7
• Propionic acid: 700 mg/L at pH = 7, and 5 mg/L at pH < 7
• Oleic acid and lauric acid: 4.3 mmol/L leads to 50 % reduction of methane
formation
(Deublein & Steinhauser 2008, 121–122; Chen, Cheng & Creamer 2007.)
4.11.5 Metal ions
In the tannery process, a great deal of inorganic compounds is employed. As a
consequence, the metal contents of tannery sludges are very high, diversified and can cause
serious inhibition, even toxicity to the anaerobic microbes. Therefore, it is important to
take into account the inhibiting effects of metal ions. Metal ions are universally divided
into two types: the light metal ions and the heavy ones.

23
Light metal ions
Ions are not really a problem; in fact they are essential for the growth of bacteria, to some
extent, and only become inhibiting at high concentration as they cause dehydration in cells
due to osmotic pressure (Baere et al. 1984; Yerkes, Boonyakitombut & Speece 1997). In
this part, the effects of Al, Ca, K and Na are discussed.
Aluminum: aluminum is reported to be an inhibitor as it adheres to the microbes' cell
membrane and compete with iron and manganese, suppressing the microbial growth.
Methanogenic and acetogenic activities are reduced by 50 % and 72 %, respectively when
exposed to Al(OH)3 1000mg/L for 59 days (Cabirol, Barragán, Durán & Noyola 2003).
However, microbes can acclimatize and tolerate Al3+ up to a concentration of 2500 mg/L
(Chen et al. 2007).
Calcium: contradictory results have been published about the inhibiting effects of Calcium.
Ca2+ is said to pose no threat to the anaerobic digestion at all, even at the concentration of
7000 mg/l (Jackson-Moss, Duncan & Cooper 1989). In another source, Ca2+ ions are
determined to cause moderate inhibition at concentration of 2500–4000 mg/L and strong
inhibition at 8000 mg/L (Kugelman & McCarty 1964). However, too high calcium
concentrations may lead to problems with carbonate precipitations that reduce buffering
capacity (Chen et al. 2007).
Potassium: a high concentration of K+ negatively affects the osmosis of methanogens.
Potassium concentration in the range of 2500–5000 mg/L is reported as inhibitory.
(Deublein & Steinhauser 2008, 126).
Sodium: just as calcium, sodium at a low concentration (100–200 mg/L) is essential for the
survival of methanogens due to its role in synthesis of adenosine triphosphate and
oxidation of NADH (McCarty 1964; Dimroth & Thomer 1989). At very high
concentrations, sodium ions interfere with the metabolism of the micro-biological species
(Kugelman & McCarty 1964). Inhibition threshold range for sodium is 5000–30 000 mg/L
(Deublein & Steinhauser 2008, 126). For mesophilic methanogens, sodium concentrations
of 3500–5500 mg/L lead to moderate inhibition while 8000 mg/L causes strong inhibition
(McCartney 1964).

24
Heavy metal ions
Heavy metal content is a serious and complicated problem for industrial sludges as the
heavy metal ions are often toxic and persistent, i.e. not biodegradable and in some cases
not easily treated. The toxic effect of heavy metal ions is due to their destructivity to
enzyme function and structure by binding to the thiol and other groups of proteins or by
replacing native metals in the enzyme (Vallee & Ulner 1972). Most of the heavy metals are
required as trace element for the microbial metabolism, i.e. they are only good at very low
concentration. The common heavy metals involved in anaerobic digestion of industrial
sludge together with their inhibiting and toxic threshold ranges are shown in Table 4.
TABLE 4. Inhibiting and toxic concentration of heavy metals (adapted from Deublein &
Steinhauser 2008)
Substance Minimum amount
required as trace element
(mg/L)
Inhibiting concentration
(mg/L)
Toxic concentration
(mg/L)
Cd Not available 70–600 200–600
Cu Not available 5–300 170–300
Cr 0.005–50 28–300 500
Zn Not available 3–400 250–600
Pb 0.02–200 8–340 340
Ni 0.005–0.5 10–300 30–1000
Mn 0.005–50 1500 Not available

25
5 BIOGAS IN FINLAND
In this section, an overall view of Finnish biogas production and usage are introduced.
Moreover, information about the Kaustinen biogas plant who is willing to take in the
tannery sludges as feed are also discussed.
5.1 Finnish biogas abstract
This sub-section, with its information and figures, is written in reference to the document
uomen biokaasulaitosrekisteri n:o 13 (Kuittinen, Huttunen & Leinonen 2009).
Currently in Finland, biogas is generated by two methods: by reactor plants at municipal
wastewater treatment plants (WWTP) and by landfill gas recovery plants. Biogas is mainly
used in the production of either electricity or heat with the total production of 436.5 GWh
in 2009 (149.7 GWh from the reactor plants and 286.8 GWh from the landfill gas recovery
plants). Besides, biogas can also be used as vehicle fuel. For example at Kalmari Farm, in
Laukaa, biogas is produced entirely for usage in vehicles. The amount of gas generated
during the last 16 years is clearly shown in Graph 5.
GRAPH 5. Finnish biogas production from 1994 to 2009, green columns are fractions of
utilized gas, red one are of leftover, i.e. unused gas (adapted from Kuittinen et al. 2009)
mill
ion
m3
year

26
According to the 2009 figures, there were 35 landfill gas recovery plants and 16 reactor
plants in Finland. Biogas reactor plants consist of 4 types: communal WWTP, industrial
WWTP, agricultural production and co-digestion plants. The biogas productions of those
types of plants in 2009 are shown in Graph 6.
GRAPH 6. Finnish biogas production by different type of plants, in cubic meters (Adapted
from Kuittinen et al. 2009)
Biogas production, the amount of utilized gas and the different types of energy generated
from different types of biogas plants mentioned above are all shown in Table 5.
TABLE 5. Biogas yield, usage and energy production of different types of plants (Adapted
from Kuittinen et al. 2009)
Plant type Biogas
production
(106 m3)
Biogas
Utilization
(106 m3)
Electricity
production
(GWh)
Heat
production
(GWh)
Mechanical
energy
production
(GWh)
CH4
content
(%)
Commual WWTP 24.777 22.510 33.700 78.600 1.800 43–72
Industrial WWTP 1.192 1.145 0.000 7.100 0.000 65–72
Agricultural 0.815 0.810 1.019 3.087 0.047 55–67
Co-digestion 6.781 4.349 6.409 17.980 0.000 59–66
Reactor plants 33.565 28.814 41.100 106.700 1.900 43–72
Landfills 110.925 67.685 17.040 251.484 18.247 31–63
million m3
Agriculture
Industrial WWTP
Co-digestion plants
Communal WWTP
Landfills

27
5.2 Kaustinen biogas plant
Kaustinen biogas plant is currently willing to accept the sludge from the tanneries. This
part is written in reference to the Kaustinen plant's environmental permit and
environmental impacts assessment.
The plant is designed to produce energy to supply the nearby lithium mine. The feed for
the Kaustinen plant consists of communal household sludge, industrial sludge, agricultural
sludges, fur farming sludges and manure, small carcasses from local fur farms and
different kinds of plant based wastes.
Wastes are degraded into a mixture of CH4, CO2 and a small amount of other gases. The
biogas is fed to a gas fuelled generator to produce electricity that cover the needs of the
lithium mine. Moreover, the CO2 in the residual gas can be used in the lithium mine
processes, thus it is cleaned out from the end-of-pipe waste gas and not to be emitted to the
environment. Stabilized digested sludge has the form of hummus mass and can then be
used as fertilizer or in soil improvement. It can also be blended with enriched sand or
mineral masses from the lithium mine to form a mixture which has many applications.
The Kaustinen plant consists of an area of waste reception, an area of pre-treatment for
each reactor, three biogas reactors, biogas treatment facilities and biogas storage, a steam
production unit, a process water tank, temporary storage and loading hall for humus mass
and temporary storage for ash.
The plant is designed to operate 312 days a year. It takes in, then treats communal
household and industrial sludges, agricultural and fur farming sludges and manure, small
carcasses from the local fur farms and also different kinds of plant based wastes. Feed
limits for the Kaustinen plant, as set by its environmental permit are briefly shown in
APPENDIX 2, which also contains a flow chart of the Kaustinen biogas plant process.
It would be good if the digested Cr sludge can be used in soil improvement. However,
Finland has strict legislation about soil improvement. Constituent concentrations of the
material going to soil improvement are restricted. The concentrations are determined by
leaching and metal analysis. Their allowed concentrations are given in Table 6.

28
TABLE 6. Thresholds for constituent concentrations of material going to soil improvement
(adapted from Maa- ja metsätalousministeriön asetus nro 19/09).
Element Maximum
concentration
Maximum concentrations in fertilizing
side product used directly in forest
industry
mg/kg dry matter mg/kg dry matter
Arsenic (As) 25 30
Mercury (Hg) 1 1
Cadmium (Cd) 1,5(1) 15(2)
Chromium (Cr) 300(3) 300
Copper (Cu) 600(4) 700
Lead (Pb) 100 150
Nickel (Ni) 100 150
Zinc (Zn) 1500(4) 4500(4)
Therefore, after the biogasification of the Cr sludge, the residual digested sludge has to be
analyzed in order to determined if it satisfies the restricted values shown above or not. In
the worst case, it has to be land-filled.
(1) Limit of 2.5 mg Cd/kg dry matter in the field biomass ash used in land and garden applications as well as green building and landscaping (2) Limit of 17.5 mg Cd/kg dry matter in the wood, peat and field biomass ash used in the forest industry (3) Limit for soluble Cr6+ is 2.0 mg/kg dry matter (4) Over crossing can be allowed in a fertilizing product if land analysis has shown that the application land area has a deficiency of copper or zinc. In forest industry, an over cross can be allowed only when using zinc at swamp forests and in this case a deficiency must be shown first. In this case, the maximum allowed concentration of zinc can be extended to 6000 mg Zn/kg dry matter

29
6 SLUDGE COMPOSITION
As stated before, the tannery sludge often has high inorganic contents such as sulfate and
metal ions, which can be inhibitory to the anaerobic digestion process. Therefore, careful
investigations to determine the inorganic constituents of the sludge are significant and will
be carried out by two methods: Inductively Coupled Plasma - Mass Spectrometry (ICP-
MS) and Ion Chromatography - Mass spectrometry (IC-MS).
On the other hand, the availability of organic matter in the sludge can dictate the yield of
biogas through anaerobic digestion. Therefore, good knowledge of the sludge's organic
content may, to some extent, indicate the feasibility of the usage of sludge as anaerobic
digestion substrate. In this thesis work, the organic content of sludge is determined using
the bomb calorimetry method with the assumption that the combustible part of sludge is
organic.
There are five tanneries involved in this Leather Waste project, and their waste sludges
compositions are very heterogeneous. Therefore, the "worst-case" sludge, i.e. containing
the largest amount of inorganic matter (according to the previous analysis), will be taken as
the representative sample. The idea is that if the biogasification is successful with this
sample, the method will most probably work with any other sample as well.
6.1 Determination of inorganic contents
According to the SFS-EN 12506 standard, the two methods used to determine the
inorganic contents of sludge are ICP-MS, for the metal contents, and IC-MS, for the sulfate
and chloride contents. In those two analysis methods, the sample must be injected as
solution form (BERGHOF).
The tannery sludges are not so readily soluble when handled by conventional dissolution
methods. Therefore, it must be dissolved into aqueous phase by microwave digestion, a
more intensive and extreme method.

30
6.1.1 Drying the sample
The original sludge contains a lot of moisture, making its composition vary greatly due to
the vaporization of water. Therefore, drying the sludge before hand to completely eliminate
its moisture content will make the analysis easier and the results more reliable.
In reference to the EU standard EN 15170 : 2008, the wet-based original sludge should be
dried at quite low temperature (less than 40 0C) in order to prevent loss of volatile organic
compound.
In an oven, five aluminum vessels containing the sludges were dried at ca. 34 0C for about
64 hours. Dry sludge samples were then stored in a desiccators (low-humidity storage
vessel) to maintain their dry state for further analysis. Weights of the samples before and
after drying, together with their calculated moisture contents, are all shown in Table 7.
TABLE 7. Weights of samples before and after drying, together with their moisture
contents
Sample Empty vessel, Wet sample Wet sample, Dry sample Dry sample, Moisture-
g and vessel, g g and vessel, g g content, %
1 0.9404 7.2426 6.3022 2.5555 1.6151 74.37
2 0.9469 6.0038 5.0569 2.2531 1.3062 74.17
3 1.0131 4.2447 3.2316 1.8602 0.8471 73.79
4 0.9311 3.2701 2.3390 1.5430 0.6119 73.84
5 0.9415 10.7114 9.7699 3.5443 2.6028 73.36
Avgerage 73.91 %
6.1.2 Microwave digestion
Microwave digestion method is designed for achieving rapid complete dissolution of the
analyte together with complete decomposition of the sample's matrix while avoiding
sample losses or contamination.

31
The principle is quite simple: the hard-to-dissolve sample is heated by absorbing
microwave radiation in a heat-and-pressure-resistant vessels which is transparent to
microwave radiation, under extreme conditions (>200 0C, >20 bar and strong acid)
(BERGHOF). More details about the principle and experimental procedure of this method
can be found in Appendix 3.
As referred to the Microwave Oven's cookbook, such dried biological sludge as the
tanneries' should be dissolved with 7 ml of HNO3 65 % and 1 ml of H2O2 30 % with oven
power 700 W, up to 200 0C. Two dry sludge samples with masses of 0.1459 g and 0.1433 g
were digested in two different vessels. The digestion time was 20 minutes. After the
digestion, the apparatus was allowed to cool down for 1 hour, and each digested liquid, the
eluant, was transferred from the vessel to a plastic bottle and the bottle was filled with ultra
pure water up to 100 ml. The aqueous samples were stored at temperature less than 0 0C
for further analysis.
6.1.3 Inductively coupled plasma - Mass spectrometer (ICP - MS)
The basic components of an ICP - MS are shown in Graph 7.
GRAPH 7: Schematic diagram of an ICP-MS

32
This method is used to determine extremely low concentration (up to ppt - part per trillion)
of a wide range of elements present in the sample. ICP - MS functions as following:
• Liquid sample is introduced into the system, then nebulized (splitted into fine
droplets) by a stream of Argon (Ar) gas.
• Fine droplets of sample are led to the plasma torch, where the sample's
constituents undergo phase changes, and finally escape as singly charged gaseous
ions.
• Ions enter the interface, where vacuum is applied, and are then led to the lens
which uses an electric field to focus them into beams that are fed into the
quadrupole, a filter for the ions according to their mass - charge ratio (m/z).
• The quadrupole generates an alternating electromagnetic field. At any instance,
the field has a certain frequency which only corresponds to a single value of m/z
ratio. Therefore, at any moment, there is only one type of ions allowed to pass the
quadrupole, then hit the detector placed after the quadrupole. Each collision onto
the detector generates an electric signal, which is then processed by computer.
• The abundance of elements in the sample is proportional to the number of counts
made by the detector.
The sample containing 0.1459 g dried sludge prepared by microwave digestion was diluted
into 4 different solutions, by a factor of 10, from 1:10 to 1:10000 with HNO3 2 %. Before
making any analysis, ICP - MS must be tuned for best performance with the standard
tuning solution. The ICP - MS was calibrated first with blank solution (water) and then
with standard solutions with concentrations from 1 to 1000 ppb, then the diluted solutions
were analyzed. The outputs of ICP - MS (elemental constituents' concentrations) are given
in ppb. Only the values lying in the range of calibration are valid, the others would be
discarded (that is why the samples are diluted by various dilution factor). The final results,
in comparison with previous ICP - MS analysis are shown in Table 8. There are some
discrepancies in the elemental concentrations obtained from the analysis of differently
diluted solution.
More details about the principle, experimental equipment and procedure of the ICP - MS
method, the complete original results of all the diluted samples and the calculation to
obtain the results in mg/kg dry sludge can be found in Appendix 4.

33
TABLE 8. Abundance of elements in the sludge, obtained from ICP - MS analysis of
aliquots of different dilution factor, expressed in mg/kg, and comparison with previous
analysis.
Element Sludge concentration (mg/kg d.m.) Previous results (2006) (mg/kg d.m.)
Li 5.61 1.55
Be 13.93 0.04
B 2869.77 73.60
Na 18923.92
33300.00 37176.15
Mg 33337.90
7620.00 38272.79
Al 4200.82 3890.00
K 1847.84 504.00
Ca 73817.68 27500.00
V 0.00 50.40
Cr 63632.63
62400.00 66641.54
Mn 282.59 0.00
Fe 4912.27
38400.00 5100.07
Ni 0.00 12.60
Cu 0.00 103.00
As 0.00 1.44
Zn 1008.91 0.00
Sr 94.65 75.50
Ba 70.05 124.00
The result is quite in agreement with the previous analysis, especially with the element of
interest, Chromium. There are some discrepancies, especially with B, Mg, Ca, Fe, Zn. This
may result from the fact that tanneries sludges are very heterogeneous, making the task of
getting a representative sample extremely difficult.

34
6.1.4 Ion Chromatography - Mass spectrometry (IC - MS)
The chloride and sulfate content of the dry sludge is determined by IC-MS analysis.
The microwave digested sample containing 0.1459 g dry sludge per 100 ml solution is sent
to Eurofins scientific Finland Oy for Ion Chromatography analysis.
The Ion Chromatography was performed according to the standard DIN EN ISO 10304-1.
And the sample's chloride and sulfate contents are:
• Chloride: 42.5 mg/dm3
• Sulfate: 158 mg/ dm3
As 100 ml of the sample contains 0.1459 g dry sludge, each dm3 of sample contains 1.459
g dry sludge. Therefore, the chloride and sulfate content of the dried Cr sludge can be
calculated and expressed in mg/kg dry matter as in equation [9]
[ ]3
3
10001000
91.4591.459
mg gx
x mgdm kgc
g kgdm
×= =
Thus, the chloride and sulfate content of the sample are:
• Chloride: 29129.5 mg/kg dry matter
• Sulfate: 108293.4 mg/kg dry matter
The sulfate content is quite close to that of the previous analysis done in 2006, which
shows that the sulfate concentration of the Cr sludge coming from the same company is
about 142000 mg/kg dry matter.
As predicted, the Cr sludge have high concentration of sulfate and chloride, well above the
inhibiting thresholds mentioned in various literature. This would be challenging, not only
for the anaerobic digestion process but also for the treatment of residual sludge coming out
of the biogas plant.

35
6.2 Determination of organic content
With the assumption that all the organic matter in the dry sludge sample is combustible, the
sludge organic content can be determined by the bomb calorimetry method. In this thesis
work, the bomb calorimetry is carried out by the automatic bomb calorimeter IKA C5003
under the scope of the EU standard EN15170.
The principle of this method is quite simple: the pelletized sample is burned at constant
volume in high pressure oxygen atmosphere (normally 3.0 MPa) in a small cup, called
crucible inside an adiabatic bomb whose components are shown in Graph 8. The usage of
pelletized sample is to prevent too vigorous combustion, i.e. explosion. Energy generated
by combusting the sample contribute to heating up the water jacket and the combustion
bomb. Changes in the temperature of the water jacket and also of the bomb are measured
by a high-resolution thermometer which provides the reading to the nearest 0.0001 K.
GRAPH 8. Basic components of a bomb calorimeter.
1 Combustion bomb
2 Stirrer
3 Thermostat lid
4 Ignition leads
6 Calorimeter can
7 Thermostat (water jacket)

36
For determining the calorific value of the sample precisely, the heat capacity of the bomb
and bomb's surrounding, ignition energy of incinerating the cotton fuse to initiate the
combustion must be known. Usually, heat contribution by the fuse is given as a
manufacturing parameter, and the bomb's heat capacity can be obtained through
calibrations, using standard benzoic acid pellets IKA C723 with known calorific value.
Due to the high content of chloride in the sample, according to previous analysis, a special
type of bomb should be used to prevent corrosion.
The calibration procedure is carried out as follows:
• A 10 ml volume of distilled water is added into the bomb
• Cotton fuse (type C710.4) is tightened to the ignition circuit
• Benzoic acid pellets are put into the crucible, in contact with the fuse
• Combustion bomb is capped, tightened and inserted into the system
• Parameters (sample weight, fuse type, etc.) are input into the controlling system
• "START" button is clicked, and the process will run automatically
• After 20–25 minutes the process will be over. The bomb is taken out and the
remaining pressure inside the bomb is released from the hole on top of the cap with
a special needle. Then the bomb is uncapped, washed carefully and the ignition
circuit is cleaned thoroughly with special brush provided by the manufacturer.
Calibration is done 5 times, each with 1 g benzoic acid (2 standard pellets) to calculate the
heat capacity of the bomb and its surrounding. This calculation is done automatically by
the system.
After calibration of the bomb calorimeter, the experiment is carried out similarly to
calibration, with a few notices:
• Dried sludge sample must be ground into fairly fine particle and then pressed into
pellets weighing about 0.5 g for each
• Exactly the same amount of distilled water as in the calibration (10 ml) must be
added to the bomb in order to avoid error.
More details about the principle, experimental procedure, calculations related to the bomb
calorimetry can be found in the Appendix 5.

37
The output of the bomb calorimeter is directly the gross calorific value (at constant
volume) which is defined, according to the EU standard EN 15170, as absolute value of the
specific energy of combustion, in Joules, for unit mass of a solid sludge burned in oxygen
in a calorimetric bomb under the conditions specified. The products of combustion are
assumed to consist of gaseous oxygen, nitrogen, carbon dioxide and sulfur dioxide, of
liquid water (in equilibrium with its vapor) saturated with carbon dioxide under the
conditions of the bomb reaction, and of solid ash, all at the reference temperature.
From the gross calorific value (at constant volume) of the dried sample, that calorific value
of the wet sludge is calculated as in equation [8], adapted from the standard EN 15170.
, , ,
100[8]
100V gr V gr d
Mq q
−= ×
Where: qV,gr,d gross calorific value of the dried-basis sample (at constant volume)
qV,gr gross calorific value of the as received sample (at constant volume)
M is the moisture content of the sludge, 73.91 %, in this case.
The mass calorific values of different samples are shown is Table 9.
TABLE 9. Calorific value of the samples analyzed by automated bomb calorimeter.
Sample Mass Gross (dry) Gross (wet)
g MJ/kg MJ/kg
Test 0.5812 7.207 1.880
1 1.007 6.969 1.818
2 1.4892 6.918 1.805
3 1.0091 6.941 1.811
4 1.5537 6.921 1.806
Average 6.991 1.824 MJ/kg
These average values are quite close to previous analysis made in 2006: the wet-basis and
dried-basis calorific value are 1.49 and 7.83 MJ/kg, respectively.

38
However, there are quite a few inorganic compounds in the sludge and therefore the
combustion inside the bomb cannot be fully completed, there are always residues left in the
crucible. The after-combustion crucible, together with residues inside are dried to eliminate
moisture coming from the vapor generated during the combustion. With the assumption
that all the organic matter in the dried sludge is burned, the combustible content of the
dried sludge can be calculated through weighing the combusted residues. Those values are
shown in Table 10.
TABLE 10. Masses of the crucibles, the pre-combustion samples, the post-combustion
crucibles and the residues, residues and the calculated combustible content of the samples
Sample Crucible,
g
Sample,
g
Crucible +
residue, g
Residue,
g
% combustible,
%
Test 10.1044 0.5812 10.3982 0.2938 49.45
1 10.13 1.007 10.671 0.541 46.28
2 9.9857 1.4892 10.7838 0.7981 46.41
3 10.1534 1.0091 10.6871 0.5337 47.11
4 10.2311 1.5537 11.0475 0.8164 47.45
Average 47.34 %
Thus, the organic content of the dried sludge is 47.34 %, very promising for
biogasification. On the other hand, the common parameter to indicate organic content is
the TOC (Total Organic Carbon). The previous analysis results of the same tannery sludge,
done in 2009, can be used: TOC = 26.9 %
The organic contents of the sludges can be expressed by the representative formula of
CnH2n. Therefore, the hydrogen content of the dry sample can be roughly estimated by
equation [10].
2( ) % [10]
141 47.34
( ) % 6.763% [11]7 7
d
d
nw H combustible
n
w H combustible
= ×
= × = ≈

39
Nevertheless, in practice, the calorific value of interest is often the net calorific value (at
constant pressure), which is defined, also by EN 15170, as absolute value of the specific
energy of combustion, in Joules, for unit mass of a solid sludge burned in oxygen at
constant pressure under such conditions that all the water of the reaction products remains
as water vapor (in a hypothetical state at 0.1 MPa), the other products being as for the
gross calorific value, all at the reference temperature.
Relations between these values of the wet-basis and dried-basis samples are expressed in
equations [1] and [2], Appendix 5. The net calorific value of the dried-basis sample at
constant pressure and the net calorific value at constant pressure of the wet sample are
calculated as in the following way:
[ ] [ ], , , , , ,
6 6, ,
, ,
212.2 ( ) 0.8 ( ) ( ) 212.2 ( ) 12
6.991 10 212.2 6.763 6.9896 10
6.9896
p net d V gr d d d d V gr d d
p net d
p net d
q q w H w O w N q w H
J J Jq
kg kg kg
MJq
kg
= − × − × + ≈ − ×
≈ × − × ≈ ×
⇒ =
The coefficient of w(O)d and w(N)d, the oxygen and nitrogen contents is 0.8, much smaller
than 212.2, it can thus be left out without making any considerable error.
[ ], , , ,
6 6, ,
, ,
(1 0.01 ) 24.43 13
6.9896 10 (1 0.01 73.91) 24.43 73.91 1.8218 10
1.8218
p net m p net d
p net m
p net m
q q M M
J J Jq
kg kg kg
MJq
kg
= × − − ×
⇒ = × × − × − × ≈ ×
⇒ ≈
So, the net calorific value (at constant pressure) of the wet original sludge sample is
approximately 1.82 MJ/kg, equal to that of low-quality coal. This value implies that the
tannery sludges store quite a big amount of energy in them, and the method of
biogasification can help unleash this energy under the form of useful biogas.

40
7 BIOGASIFICATION
The relatively high organic matter content obtained through the bomb calorimetric analysis
ensures the feasibility of using this tannery sludge as a substrate for a biogas plant.
However, the high inorganic contents of sulfate, metal ions, especially chromium, pose a
threat of inhibition, or even lethality to the bacteria that is going to be inoculated to the
sludge. Therefore, it is essential to perform a test to affirm the suitability of the sludge as a
growing-environment for the micro-organisms.
7.1 Microbe test
Different sludge samples of the involved tanneries were sent to the University of Jyväskylä
laboratory service called Ambiotica. There were two kinds of test performed upon the
samples, and only tresults of the sample that is going to be biogasificated are shown.
Microscopic test (gram staining and microscopic screening)
The sludge is colored with a special dye, making the bacterial species, if present, become
more visible under microscopic observation. Unfortunately, no large micro-organisms such
as bacterial strands, fungi, algae or protozoan were detected.
Growth colony analysis
Bacteria are implanted into optimum condition, with nutrients so that it can grow, i.e
multiply. After a certain time, the number of bacterial clusters formed will be counted,
from which the suitability of the sludge as growing environment for different types of
micro-organisms can be deduced. Each type of bacteria is cultivated in a specific type of
environment, as dictated by the existing standards. For example, aerobic and anaerobic
bacteria are usually raised in blood-agar.
In micro-bacterial culture, sterilized conditions and equipment play a very important role
to the validity of the tests' results.

41
Results from the growth colony analysis are expressed in colony forming units per gram of
dry matter (cfu/g) in Table 11.
TABLE 11. The number of different type of colonies formed in various growth colony
analysis (reproduced from Ambiotica's report).
Analysis Method
Number of colonies
formed
(cfu/g)
Yeast and molds NMKL 98, 2005 30
Aerobic bacteria in
blood-agar at 37 0C 30,000,000
Anaerobic bacteria in
blood-agar at 37 0C 25,000,000
Fecal streptococcus SFS-EN ISO 7899-2 61
Coliform bacteria 35 0C SFS 3016 30
Coliform bacteria 44 0C SFS 4088 3
From Table 11, we can see that there is a huge amount of anaerobic bacteria present in the
sludge. On the other hand, these figures are quite high (in million order) for some samples,
meaning that it is possible to use the tannery sludge as substrate for biogas production
under anaerobic treatment.
7.2 Biogasification, standard approach
In this part, the biogasification of tannery sludges was carried out mainly according to the
SFS standard EN ISO 11734:1998, with some modifications. All the water used in this
experiment is ultrapure, provided by the Milipore Q-Gard purification pack. At 25 0C,
ultrapure water has the electric conductivity of 18.2 MΩ.cm and TOC 5 ppb.
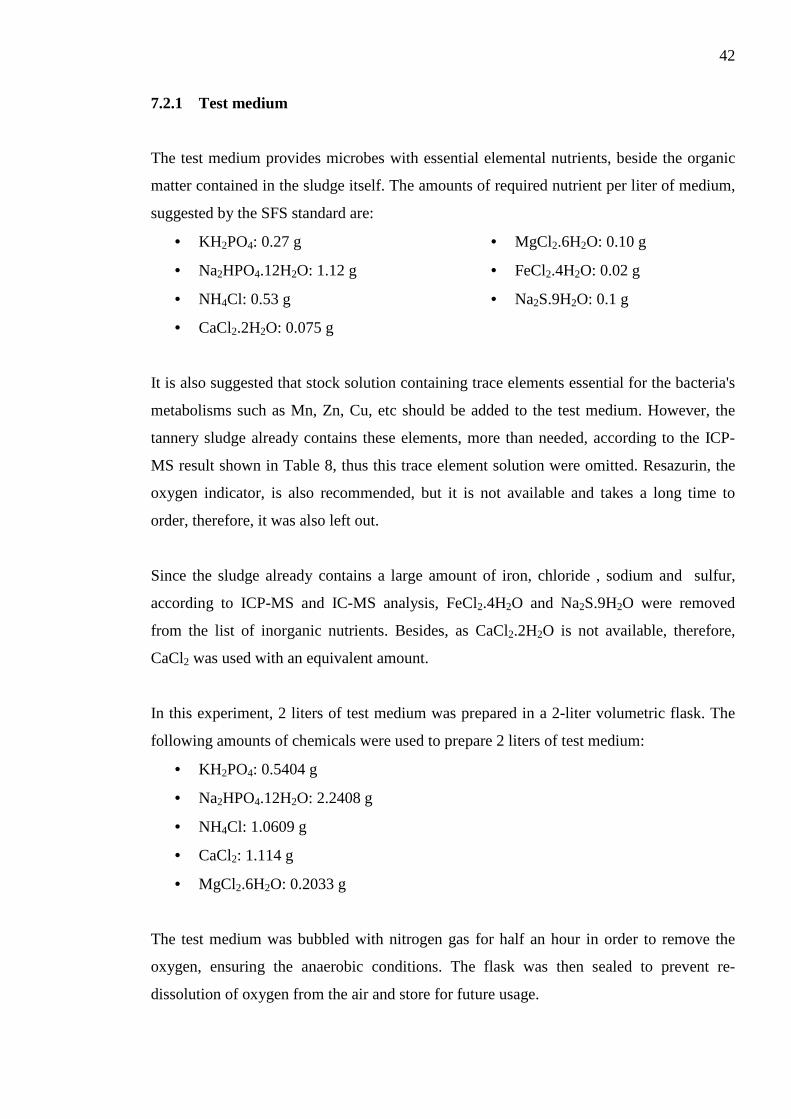
42
7.2.1 Test medium
The test medium provides microbes with essential elemental nutrients, beside the organic
matter contained in the sludge itself. The amounts of required nutrient per liter of medium,
suggested by the SFS standard are:
• KH2PO4: 0.27 g
• Na2HPO4.12H2O: 1.12 g
• NH4Cl: 0.53 g
• CaCl2.2H2O: 0.075 g
• MgCl2.6H2O: 0.10 g
• FeCl2.4H2O: 0.02 g
• Na2S.9H2O: 0.1 g
It is also suggested that stock solution containing trace elements essential for the bacteria's
metabolisms such as Mn, Zn, Cu, etc should be added to the test medium. However, the
tannery sludge already contains these elements, more than needed, according to the ICP-
MS result shown in Table 8, thus this trace element solution were omitted. Resazurin, the
oxygen indicator, is also recommended, but it is not available and takes a long time to
order, therefore, it was also left out.
Since the sludge already contains a large amount of iron, chloride , sodium and sulfur,
according to ICP-MS and IC-MS analysis, FeCl2.4H2O and Na2S.9H2O were removed
from the list of inorganic nutrients. Besides, as CaCl2.2H2O is not available, therefore,
CaCl2 was used with an equivalent amount.
In this experiment, 2 liters of test medium was prepared in a 2-liter volumetric flask. The
following amounts of chemicals were used to prepare 2 liters of test medium:
• KH2PO4: 0.5404 g
• Na2HPO4.12H2O: 2.2408 g
• NH4Cl: 1.0609 g
• CaCl2: 1.114 g
• MgCl2.6H2O: 0.2033 g
The test medium was bubbled with nitrogen gas for half an hour in order to remove the
oxygen, ensuring the anaerobic conditions. The flask was then sealed to prevent re-
dissolution of oxygen from the air and store for future usage.

43
7.2.2 Inoculum
In order to start the biogasification test, the presence of anaerobic bacteria in the substrate
is needed. As suggested by the standard (and also as practically done in many biogas
plants), bacteria is transferred, or in other word, inoculated, to the substrate from the
already-digested sludge, taken from a biogas plant.
On 18th January, 2011, the digested sludge was taken from the biogas plant Lakeuden
Etappi Oy, Ilmajoki. During the transportation, the sludge was keep in a closed plastic
vessel, in order to maintain a low-oxygen-concentration atmosphere, with a built-in water-
lock (as shown in Graph 9.) in order to release the excess pressure, guaranteeing safety
condition as the sludge was still quite active (it was reported to release liters of gas after
being taken out from the reactor). In addition, the whole vessel was covered with insulating
blanket to maintain temperature consistency, minimizing the thermal shock upon the
bacteria community.
GRAPH 9. The water-lock used in the transportation of digested sludge

44
As soon as the digested sludge arrived at the laboratory, it was reactivated. Reactivation
serves the purpose of removing the background gas formation, which can interfere the
biogasification test results. As mentioned in the standard, because the tannery sludge is
expected to be poorly degradable since it possesses high concentration of inhibitors, the
digested sludge was pre-exposed to the high-chromium content tannery sludge during the
reactivation so that the bacteria could pre-adapt before the real biogasification test.
About 1.5 liters of the sludge taken from the biogas plant, pre-exposed to about 200 ml Cr
containing sludge, was allowed to be digested in a dark and anaerobic conditions without
being fed with new nutrient . The reacting system was prepared as follows:
• The reacting bottle was wrapped with aluminum foil to prevent exposure to light.
• After the sludge had been added to the bottle, bottle's head space was purged
through with nitrogen, the bottle was then quickly capped to prevent the re-invasion
of oxygen.
• The bottle was connected to the gas-storing vessel, the idea is just the same as in
the main biogasification experiment, which is shown in Graph 14.
• The reacting bottle was kept in the water bath at 35 ± 2 0C, ideal for the growth of
bacteria and production of gas .
Until 24th January, 2011, i.e. after 5 days of digestion, there was no visible evidence of gas
forming from the reacting bottle. The sludge could then be used as inoculum.
As referred to the standard, the digested sludge was centrifuged with the speed of 1500g
for 10 minutes. The centrifugation divided the digested sludge into two separate phases:
the liquid phase and the more condensed phase, where the bacterial communities are
supposed to live.
The liquid phase was discarded while the condensed one was collected into a beaker. The
condensed phase was diluted with the prepared test medium, this process is defined by the
standard as "digested sludge washing".
The solution was then centrifuged again with the speed of 2000g for 7 minutes. Once
again, the condensed phase was collected.

45
In order to carry out the inoculum as described in the standard, the condensed phase
collected after the washing step was suspended into the test medium in such way that the
total solid concentration in the medium lies between 1 and 3 mg/liter of medium.
Therefore, about 5.03 g of the washed sludge was put into the 2 liter vessel containing the
test medium, the vessel was then shaken well. After that, the test medium was bubbled
again with nitrogen for 30 minutes, the volumetric flask was then capped. Test medium
was inoculated with anaerobic bacteria.
7.2.3 Sampling procedure
Three different types of tannery sludge were used in this experiment:
• Chromium containing sludge (Cr sludge): taken directly from the tannery's
wastewater treatment plant and then stored at low temperature
• Hairing sludge
• Fleshing sludge
This experiment is made mainly to determine the biodegradability of the Cr sludge through
anaerobic digestion. However, it would be interesting and also significant to examine the
biodegradability of the mixture of those three sludges. The hairing sludge is currently
treated by composting and the fleshing is sent to a biogas plant. Therefore, if the
biogasification of the sludge mixture is proven feasible, not being inhibited by the high
metal contents of Cr sludge, there would be a new, more economical and sustainable
approach to the solution of all tannery sludges: mixing and then bringing them altogether
to a biogas plant.
In order to make a representative sample for the case where those three types of tannery
sludge are mixed together and then biogasified, a mixture of those three sludges should be
prepared exactly by the ratio in which those sludges are let out from the tannery. As
reported by the tannery providing the samples for this experiment, the annual outputs of
the Cr, hairing, fleshing sludges streams are 1040 tons, 3770 tons, 364 tons, respectively.
Therefore, the mixture was prepared by adding 55.2332 g Cr sludge, 200.713 g hairing
sludge and 20.006 g fleshing sludge together.

46
7.2.4 Biogasification test
The going-to-be-biogasificated samples were suspended in the test medium, then stored in
a thick-walled DURAN glass bottle. The bottle was capped, with several layers of Teflon
tape wrapping around the bottle's neck and mouth, in order to make sure that the reacting
system is gas-tight. The silicon tube was attached to the reacting bottle through a drilled
hole on the cap, leading the formed biogas (if there is any) to an inversely placed graduated
cylinder, immersed in a beaker containing water in order to determine the volume of gas
formed. Bottles were wrapped with aluminum foil in order to ensure dark condition, as
light is inhibitory to the anaerobic digestion.
In this set of experiment, 5 samples are involved:
• Blank sample: containing only the inoculated medium, it is used in order to
determine the residual background gas formation.
• Cr 250 sample: containing 3.9 g Cr sludge, filled up to 250 ml with inoculated
medium. Roughly taking the Cr concentration of the Cr sludge as 66 000 mg/kg dry
sludge (see Table 6) and the moisture content of the Cr sludge as 73.91 % (see
Table 7). Therefore, the Cr concentration of this sample is about 268.6 mg/L, i.e in
the Cr inhibitory range, as shown in Table 4. The usage of inhibitory Cr
concentration is to investigate the microbe adaptability.
• Cr 500 sample: containing 7.6 g Cr sludge, filled up to 500 ml with inoculated
medium. Calculating in the same way as for the Cr 250 sample, Cr concentration of
this sample is about 261.7 mg/L.
• Mixture sample: containing 18.925 g mixed sludge (prepared as shown in 7.2.3),
then filled up to 250 ml with inoculated medium.
• Reference sample: containing about 4 g sodium benzoate, as suggested by the SFS
standard, filled up to 250 ml with inoculated medium. This sample is used to
indicate whether the micro-bacteria function properly or not.
During the adding of reacting mixture into each bottle, nitrogen was purged through the
bottle to minimize the presence of oxygen, then the bottle was quickly capped.The reacting
bottles were placed in a water bath whose temperature is kept stable at ca. 35 0C by a
thermostat. The system is shown in Graph 10 and 11.

47
GRAPH 10. The reacting system
GRAPH 11. The reacting bottles are immersed in the water bath kept warm by the
thermostat at 35 0C.

48
7.2.5 Results and discussions
Twenty five days elapsed since this set of experiment had been set off. Unfortunately, the
gas production was very modest:
• Blank sample: almost no gas production
• Cr 250 sample: less than 5 ml of gas production
• Cr 500 sample: almost no gas production
• Mixture sample: about 10 ml of gas production
• Reference sample: about 20 ml of gas production
When the bottles were emptied for cleaning, it was found that there were white mould-like
things mixed together with the sludges inside the bottle. It might be due to the failure to
maintain anaerobic conditions, leading to the forming of aerobic bacteria colonies in the
substrate, thus suppressing the metabolism and activities of the anaerobic ones, resulting in
virtually-no-gas-production.
The breakdown of anaerobic conditions might result from the following reasons:
• All the preparation steps should be prepared strictly anaerobically, i.e. in nitrogen
atmosphere, as required by the standard, but those facilities were not available for
this experiment. As a consequence, too prolonged contact with oxygen (in open
atmosphere) during the preparation for inoculum, inhibits the anaerobic bacteria,
especially the methanogens.
• The migration of oxygen into the reacting bottle through the slit on the bottle's cap
where the hoses were attached. This is because the hose's outer diameter is about 6
mm, exactly the same as the drilled hole's diameter, therefore, the attachment was
not really tight, leaving gaps for outer air to come in and maybe for the formed gas
to leak out. As a consequence, as mentioned above, this condition is more favorable
for aerobic bacteria, finally resulting in the death of anaerobic bacteria.
This set of experiment is regarded as failed, however, it points out valuable experiences
and remarks for the next sets.

49
7.3 Biogasification, practical approach
The standard way to determine the biogas production is found to be an unsuitable method,
at least in this case, as it requires high resolution pressure sensor (with the detecting range
down to mbar) embedded in the septum bottle containing reacting mixture, and from the
pressure increase, the volume of biogas formed can be calculated. However, that kind of
device is not available, and the volume measurement for biogas using graduated cylinders
as described earlier is not exact enough. Therefore, a more practical approach, mimicking
reacting conditions in a real biogas plant, is considered.
In this approach, the digested sludge would directly be mixed with the sludge whose bio-
degradability needs to be determined. Same kind of digested sludge is used as before, the
preparation of going-to-be-digested sludge and gas-formed-volume measurement are
carried out just the same as in the standard approach. For this approach, two sets of
experiment are carried out.
7.3.1 First experiment
This set of experiment commenced on 07th February, 2011.With experiences obtained from
the failure of the first set of experiment, the reacting bottles in this one were made more
carefully in order to ensure the gas-tight conditions.
Samples preparation
The mixture of sludges was prepared by mixing 57.4 g Cr sludge, 201 g hairing sludge and
21.59 g fleshing sludge. The first experiment's digested sludge stored in the refrigerator
was used again in this set.
There are ten samples containing different reacting sludge mixtures in this set of
experiment. The composition and amount of sludge contained in those samples are given in
Table 12.

50
TABLE 12. Composition and amount of sludges used in the first experiment of practical
approach to biogasification.
Amount of sludge used (g)
Sample Composition Digested Cr Mixed
1 Blank (Digested sludge) 25.308 0.000 0.000
2 Blank (Digested sludge) 25.102 0.000 0.000
3 Digested sludge + Cr sludge 25.166 27.855 0.000
4 Digested sludge + Cr sludge 25.006 25.125 0.000
5 Digested sludge + Cr sludge 25.015 25.193 0.000
6 Digested sludge + Cr sludge 25.149 50.076 0.000
7 Digested sludge + Cr sludge 25.240 50.366 0.000
8 Digested sludge + Mixed sludge 25.131 0.000 43.044
9 Digested sludge + Mixed sludge 25.102 0.000 43.005
10 Digested sludge + Mixed sludge 25.429 0.000 25.103
The bottles were nitrogenified after sludges had been added, then they were quickly
capped. In this experiment, the capping of bottles was supported by parafilm instead of
Teflon tape as in the previous experiment. Then the joint of the cap and the bottle, as well
as that of the hose and the cap, were wrapped with air-conditioning tape. The gas-tight
condition of this kind of wrapping was tested by blowing nitrogen gas back into the bottle
through the hose and it showed that this kind of wrapping make the reacting system really
gas-tight. The whole bottle was then wrapped with aluminum foil, and then with several
layers of plastic foil. The purpose of using plastic foil is to prevent the wearing of
aluminum foil by exposing to running fluid in the water bath. Hoses were connected to the
volume measuring device as in previous experiment. Bottles were placed in the water bath
where temperature is keep at about 35 0C. Every day, Bottles were shaken well to prevent
sedimentation and superficial scum of sludges. The whole system is the same as the
system shown in Graph 13 and 14.

51
Results and discussion
Volume of gas produced by each bottle was recorded daily. After 20 days, there was
almost no gas production in sample 1, 2, 4, 5, 6, 7 and gas productions of other samples
started leveling off. As 1 and 2 are blank samples, there is no need to subtract background
gas production from results of other samples. Results of are shown in Table 13.
TABLE 13. Gas production after 20 days, first experiment of practical approach.
Day Volume of gas formed (ml)
Sample 3 Sample 8 Sample 9 Sample 10
0 0 0 0 0
1 0 0 0 0
2 0 0 0 0
3 1 1 1 1
4 1 1 1 1
5 47 1 3 1
6 53 1 20 2
8 65 1 47 2
9 70 27 53 2
10 71 27 55 1
11 73 26 60 2
12 75 25 65 20
13 76 24 72 23
15 78 22 78 23
16 80 23 80 24
17 80 24 80 23
18 81 24 78 23
19 82 25 82 24
20 82 25 82 23

52
Graph 12 shows the diagrams of plotting gas productions (in ml) of sample 3, 8, 9 and 10
time (in days).
GRAPH 12. Gas productions of samples 3, 8, 9 and 10 in the first set of experiment,
practical approach during 20 days.
Before discarding the reacting bottles, their gas-tightness was tested by immersing the
bottles into water and then blowing nitrogen gas with moderate flow back to the bottle
through the hose. If gas tight conditions are not ensured, there will be bubbles coming up.
It was found that leaking occurs in bottles 5, 6 and 10, this can explain low gas production
in those samples. Besides, the long storage time of digested sludge, leading to reduction in
amount of bacteria, can be blamed for the virtually-no-gas-production in sample 4, 6 and 8
Through this set of experiment, it is shown that the "active time", i.e. the period where
most of the gas production takes place, comes quite early, from 4 to 10 days from the
beginning of the test. This is very encouraging, as it indicates that the retention time of
tannery sludges in a real biogas plant will be short. Moreover, the gas productivity of Cr
sludge, i.e. its biodegradability, is surprisingly better than that of mixed sludge. Therefore,
it would be better to digest the Cr sludge alone, without mixing with other tannery sludge,
in order to minimize the chromium containing residual sludges coming out of the biogas
plant.
0
5
10
15
20
25
30
35
40
45
50
55
60
65
70
75
80
85
0 5 10 15 20
Volu
me
of g
as fo
rmed
(m
l)
Time (days)
Sample 3
Sample 8
Sample 9
Sample 10

53
7.3.2 Second experiment
From the first set of experiments in the practical approach, it is shown clearly that the
mixture of sludges can produce biogas. Moreover, it seems that the Cr sludge can yield
biogas no less than the mixture, quite surprising and unexpected. Therefore, one more set
of experiment was conducted to study carefully the biodegradability of Cr sludge.
Samples preparation
It seems that the digested sludge prepared on 24th January was not so active, therefore, the
reserved part of the sludge taken from Lakeuden Etappi was reactivated. The procedure
was just the same as in the very first experiment in standard approach, including the pre-
exposure to Cr sludge.
After the gas production of the digested sludge had exhausted, it was used to prepare
samples for this experiment. The composition and amount of sludges contained in the
samples are given in Table 14.
TABLE 14. Compostion and amount of sludges used in the second experiment of practical
approach to biogasification.
Amount of sludge used (g)
Sample Composition Digested Cr
1 Blank (Digested sludge) 75.0 0.0
2 Digested sludge + Cr sludge 75.2 50.0
3 Digested sludge + Cr sludge 75.2 75.2
4 Digested sludge + Cr sludge 106.4 100.8
The nitrogenification, capping, wrapping hosing were carried out similarly as in the
previous experiment, with the only exception that plastic foil was replaced by parafilm.
The whole reacting system is shown in Graph 13 and 14.

54
GRAPH 13. The reacting bottles of the second set of experiment (practical approach) lying
in the water bath at 35 0C
GRAPH 14. The whole reacting system, second experiment of practical approach.

55
7.3.2.1 Results and discussion
Same as before, the reacting system was allowed to proceed for 19 days, during that
period, the volumes of gas in the cylinders were recorded every day. Results are shown in
Table 15.
TABLE 15. Gas production after 19 days, second experiment of practical approach.
Day
Volume (ml)
Sample 1 Sample 2 Sample 3 Sample 4
0 0 0 0 0
1 15 64 77 70
2 22 87 146 185
3 18 95 177 238
4 23 89 200 268
5 22 91 212 282
6 20 101 216 295
7 23 106 230 314
8 24 108 237 320
9 19 111 241 326
10 16 119 242 337
11 12 120 244 338
12 11 118 250 339
13 12 118 259 347
14 13 115 264 339
15 13 115 268 332
16 7 98 243 304
17 7 89 237 304
18 8 89 243 309
19 8 89 250 313
56
Gas productions (in ml) of the sample are plotted against time (in days). The diagrams are
shown in Graph 15.
GRAPH 15. Gas production of the samples in the second set of experiment, practical
approach during 19 days.
As it is shown in Graph 15 , the Cr sludge is an "early-producer", most of the gas is formed
in the first 6 or 8 days in the beginning. However, after a maximum in the total amount of
gas produced, there is a drop occurring in the period from day 8 to day 14, depending of
the samples. The only possible explanation for this is that after the methane production has
ended, there is a growth of bacterial communities that consume the gas stored in the
cylinder, leading to a reduction in the total gas volume. Therefore, the maximum amount
of gas produced by a sample during the 19-day period of experiment is regarded as its
biogas production.
In Table 16, compositions of the samples and their biogas production are shown.
0
25
50
75
100
125
150
175
200
225
250
275
300
325
350
375
0 2 4 6 8 10 12 14 16 18 20
Volu
me
of g
as fo
rmed
(m
l)
Time (days)
Sample 1
Sample 2
Sample 3
Sample 4

57
TABLE 16. Samples' compositions and biogas production.
Amount of sludge used (g)
Sample Composition Digested Cr Biogas production (ml)
1 Blank (Digested sludge) 75.0 0.0 24
2 Digested sludge + Cr sludge 75.2 50.0 120
3 Digested sludge + Cr sludge 75.2 75.2 268
4 Digested sludge + Cr sludge 106.4 100.8 347
From the data in Table 16, productivities (denoted by p) of the sludges can be calculated.
Firstly, productivity of the digested sludge (background as production) needs to be
determined:
[ ]240.32 14
75blank
ml mlp
g g= =
Productivity of Cr sludge can be calculated by removing the contribution of digested
sludge in the samples' productivities:
[ ]3
15sample digested blankCr
Cr
V m p dmp
m kg
− ×=
Where: Vsample is the volume of gas produced by the sample
mdigested and mCr are the mass of digested sludge and Cr sludge in the sample
Using equation [15] and the value of pblank from equation [14], the gas productivity of Cr
sludge in the samples can be calculated:
• Sample 2: 1.92 dm3/kg
• Sample 3: 3.24 dm3/kg
• Sample 4: 3.10 dm3/kg
Mean value of Cr sludge gas productivity of Cr sludge in this experiment is: 2.76 dm3/kg
The gas yield of Cr-sample (sample 3) in the first experiment, practical approach is
calculated with the same method, and the result is about 2.94 dm3/kg.

58
8 ECONOMICS ASPECTS
8.1 Logistic cost
It has been proven through the experiment that the Cr sludge is suitable to be used as
biogas-production substrate. Therefore, in this part, the logistic cost of transporting the
sludges from each tannery to the target biogas plants is calculated. The main destination
for the sludges is the biogas plant in Kaustinen mentioned earlier in section 5.2. Currently,
the only problem is that the plant is still under construction. Thus, Lakeuden Etappi biogas
plant in Lapua can be a good back-up plant. Accumulative price (taking into account the
driver's salary, fuel cost, loading and unloading cost) for transporting the sludge is
estimated to be about 0.10 € for transporting 1 ton of sludge for 1 km.
On the other hand, it would be much more convenient and economical to transport all the
tannery sludges together to the destination biogas plants without mixing, i.e. each type of
sludge is stored in separated compartment of the truck. The logistic costs for Cr sludge,
hairing and fleshing are shown in Table 17.
TABLE 17. Annual output of Cr sludge and logistic cost of transporting the Cr sludge from
each tannery to the two target biogas plants.
To Kaustinen To Lakeuden Etappi
Output Distance Cost Distance Cost
(tons/year) (km) (€/year) (km) (€/year)
Company 1 60 29.1 174.60 148.0 888.00
Company 2 12 41.8 50.16 146.0 175.20
Company 3 12 34.1 40.92 161.0 193.20
Company 4 30 43.3 129.90 164.0 492.00
Company 5 70 78.8 551.60 39.3 275.10

59
Hairing and fleshing sludges will be brought together to the biogas plants, therefore, in
Table 18, the tanneries' outputs are given in total amount of hairing and fleshing.
TABLE 18. Annual output of hairing and fleshing sludge and logistic cost of transporting
those kinds of sludge from each tannery to the two target biogas plants.
To Kaustinen To Lakeuden Etappi
Output Distance Cost Distance Cost
(tons/year) (km) (€/year) (km) (€/year)
Company 1 4,134.0 29.1 12,029.94 148.0 61,183.20
Company 2 136.3 41.8 569.73 146.0 1,989.98
Company 3 0.0 34.1 0.00 161.0 0.00
Company 4 30 43.3 129.90 164.0 492.00
Company 5 601.6 78.8 4,740.61 39.3 2,364.29
TABLE 19. Total annual logistic cost of transporting all kinds of sludge from each tannery
to the two target biogas plant
To Kaustinen To Lakeuden Etappi
Total cost Total cost (€/year)
(€/year) (€/year)
Company 1 12,204.54 62,071.20
Company 2 619.89 2,165.18
Company 3 40.92 193.20
Company 4 259.80 984.00
Company 5 5,292.21 2,639.39

60
8.2 Entrance fee
The biogas plant must be paid for taking in the sludge. However, Kaustinen biogas plant
has not fixed the price for waste entering the plant. Therefore, the cost for waste entering
Lakeuden Etappi is taken as reference. Gate fee paid to the plant for accepting this kind of
waste is 95.71 €/ton. The cost for taking in all the sludges from the tanneries, as well as the
total cost (for both logistic and entrance fee) are shown in Table 20.
TABLE 20. Entrance fee (taken 95.71 €/ton of waste as reference price) and total cost of
treating all the waste sludges from the tanneries involved in Leather Waste project.
Total cost
Total output Entrance fee To Kaustinen To Lakeuden Etappi
(tons/year) (€/year) (€/year) (€/year)
Company 1 4,194.0 401,407.74 413,612.28 463,478.94
Company 2 148.3 14,193.79 14,813.69 16,358.97
Company 3 12.0 1,148.52 1,189.44 1,341.72
Company 4 60.0 5,742.60 6,002.40 6,726.60
Company 5 671.6 64,278.84 69,571.04 66,918.22
The total cost is quite high, especially for the first tannery. However, the Kaustinen plant,
not Lakeuden Etappi, is the main destination to which the waste would be sent. After the
Kaustinen plant has been brought into operation, there might be a shortage of feed for its
steady run. In that case, tannery sludge would be a great source of feed: nearby, nutritious,
with high abundance, and the gate fee would be reduced to a reasonable level, which
considerably reduces the total treatment cost for the tanneries.
On the other hand, the residual sludge from treating the hairing and fleshing (containing no
Cr) can be used as a kind of fertilizer in forestry. Currently, Lakeuden Etappi is selling this
kind of fertilizer at the price of 25 €/ton.

61
9 CONCLUSIONS
The aim of this study was to determine whether the level of organic matter content in the
sludge is suitable so that it can be biogasified. Moreover, technical and legislative metal
concentration limits for anaerobic digestion process were also examined. Furthermore, the
treatment of residual sludge is proposed as well. Lastly, economical aspects of the
treatment used in this thesis were also briefly estimated.
In the effort to answer these research questions, positive and encouraging results came out.
Technically and economically, it was found to be better to treat the tannery Cr sludge by
biogasification rather than using any existing methods. The biogas yield of 2.76 dm3/kg Cr
sludge can be higher in a real biogas plant with proper dilution (which helps minimizing
the inhibitory effect), higher bacterial concentration and with continuous mixing.
However, this method still encounter legislative barriers of dealing with residual Cr sludge,
as its Cr concentration far exceeds the limit for soil improvement. One possibility is to mix
it with other sludge streams in other to lower the Cr concentration to below the legal limits:
• In the Kaustinen case, there might to be a separate reacting tank reserved
exclusively for the Cr sludge, in order not to contaminate the other stream. The Cr
content of the digested Cr sludge will be monitored. And Cr sludge will be mixed
with other non-Cr sludge in such ratio that the mixture fulfills the requirement for
soil improvement. In this way, the Cr problem in tannery sludge will be completely
solved. Even though the Kaustinen plant is willing to take in all the tannery sludge,
the plant has not been built yet, no deal was made, no technical investigation about
the "dilution" of Cr sludge was done. So, nothing is for sure at this moment, this
scheme is for the future.
• Temporarily, the tannery sludge can be sent to Lakeuden Etappi to be treated. As
Etappi only has one reacting tank, they require the incoming sludge to meet the soil
improvement limits (as shown in Table 8). In this case, a more detailed
investigation must be carried out to find a way to mix the Cr sludge with other
streams coming to the plant (might include also the hairing and fleshing) so that the
requirements of feed concentrations are fulfilled. Thus, this scheme requires further
negotiation with Lakeuden Etappi so that they accept to take in tannery sludge.

62
• In the worst case, the residual digested Cr sludge has to be land-filled. But the land-
filling cost can be partly relieved by the earnings from energy production.
In conclusion, the biogasification method still needs to be further investigated in the future
concerning the mixing pattern with other sludges, the methane productivity and above all
legislation values so that this approach to the tannery's problem could be truly sustainable.

63
REFERENCES
Alibardi, L. 2008. Innovative treatments of Tannery sludge. Padova, Italy: Università degli
Studi di Padova.
Baere, L. A. d., Devocht, M., Assche, P. v. & Verstraete, W. 1984. Influence of high NaCl
and NH4Cl salt levels on methanogenic associations. Water Research 18, 543–548.
BERGHOF. Theory of sample preparation using Acid Digestion, Pressure Digestion and
Microwave Digestion (Microwave Decomposition). BERGHOF product + instruments,
Germany.
Braun, B., Huber, P. & Meyrath, J. 1981. Ammonia toxicity in liquid piggery manure
digestion. Biotechnology Letters 3, 159–164.
Cabirol, N., Barragán, E. J., Durán, A. & Noyola, A. 2003. Effect of aluminum and
sulphate on anaerobic digestion of sludge from wastewater enhanced primary treatment.
Water Science and Technology 48 (6), 235–240.
Chen, Y., Cheng, J. J. & Creamer, K. S. 2007. Inhibition of anaerobic digestion process: A
review. Bioresource technology 99, 4044–4064.
Conn, E. E., Stumpf, P. K., Bruening, G. & Doi, R. H. 1987. Outlines of Biochemistry.
New York: John Wiley and Sons.
Deublein, D. & Steinhauser, A. 2008. Biogas from Waste and Renewable Resources: An
Introduction. Weinheim, Germany: WILEY-VCH Verlag GmbH & Co. KGaA.
Dhayalan, K., Fathima, N. N., Gnanamani, A., Rao, J. R., Nair, B. U. & Ramasami, T.
2006. Biodegradability of leathers through anaerobic pathway. Waste Management 27,
760–767.

64
Dimroth, P. & Thomer, A. 1989. A primary respiratory Na+ pump of an anaerobic
bacterium: the Na+-dependent NADH: quinone oxidoreductase of Klebsiella pneumoniae.
Archive of Microbiology 151, 439–444.
Epel, B. L. 1973. Inhibition of growth and respiration by visible and near visible light.
Photophysiology 8, 209–229. Academic Press Inc., London.
FAO (Food and Agriculture Organization of the United Nations). 1997. A system approach
to biogas technology. Available:
http://www.fao.org/waicent/faoinfo/sustdev/Egdirect/Egre0022.htm
Accessed 11 January 2011.
Gallert, C., Bauer, S. & Winter, J. 1998. Effect of ammonia on the anaerobic degradation
of protein by a mesophilic and thermophilic biowaste population. Applied Microbiology
and Biotechnology 50, 495–501.
Glycolysis 2004. Wikipedia. Available:
http://en.wikipedia.org/wiki/Glycolysis
Accessed 19 November 2010.
Haandel, A. v. & Lubbe, J. v. d. 2007. Handbook Biological Wastewater Treatment.
Netherland: Uuitgeverij Quist.
Hendriksen, H. V. & Ahring, B. K. 1991. Effects of ammonia on growth and morphology
of thermophilic hydrogen-oxidizing methanogenic bacteria. Federation of European
Microbiological Societies - Microbiological Ecology 85, 241–246.
Jackson-Moss, C. A., Duncan, J. R. & Cooper, D. R. 1989. The effect of calcium on
anaerobic digestion. Biotechnological Letters 11 (3), 219–224.
Kayhanian, M. 1999. Ammonia inhibition in high-solids biogasification: An overview and
practical solutions. Environmental Technology 20, 355–365.
65
Kossmann, W., Pönitz, U., Habermehl, S., Hoerz, T., Krämer, P., Klingler, B., Kellner, C.,
Wittur, T., Klopotek, F. v., Krieg, A. & Euler, H. BIOGAS DIGEST: Volume I - Biogas
Basics. Information and Advisory Service on Appropriate Technology - ISAT.
Kossmann, W., Pönitz, U., Habermehl, S., Hoerz, T., Krämer, P., Klingler, B., Kellner, C.,
Wittur, T., Klopotek, F. v., Krieg, A. & Euler, H. BIOGAS DIGEST: Volume II - Biogas -
Application and Product Development. Information and Advisory Service on Appropriate
Technology - ISAT.
Kroeker, E. J., Schulte, D. D., Sparling, A. B. & Lapp, H. M. 1979. Anaerobic treatment
process stability. Journal - Water Pollution Control Federation 51, 718–727.
Kugelman, I. J. & McCarty, P. L. 1964. Cation toxicity and stimulation in anaerobic waste
treatment. Journal - Water Pollution Control Federation 37, 97–116.
Kuittinen, V., Huttunen, M. J. & Leinonen, S. 2009. Suomen biokaasulaitosrekisteri n:o
13. University of Eastern Finland. Joensuu.
Kustula, V., Salo, H., Witick, A. & Kaunismaa, P. 2000. The Finnish Background Report
for the EC Documentation of Best Available Techniques for Tanning Industry. Finnish
Environment Institute. Helsinki 2000.
Maa- ja metsätalousministeriön asetus nro 19/09: Lannoitevalmisteista annetun maa- ja
metsätalousministeriön asetuksen 12/07 muuttamisesta
Marchaim, U. 1992. FAO: Biogas processes for sustainable development - Chapter 4:
Microbiology biochemistry and physiology. Available:
http://www.fao.org/docrep/T0541E/T0541E00.htm.
Accessed 25 November 2010.
McCarty, P. L. & McKinney, R. 1961. Salt toxicity in anaerobic digestion. Journal - Water
Pollution Control Federation 33, 399–415.
McCarty, P. L. 1964. Anaerobic waste treatment fundamentals. Public Work 95, 107–112.

66
McCartney, D. M. & Oleszkiewicz, J. A. 1991. Sulfide inhibition of anaerobic degradation
of lactate and acetate. Water Research 25 (2), 203–209.
Miyamoto, K. 1997. FAO: Renewable biological systems for alternative sustainable energy
production - Chapter 4: Methane production. Available:
http://www.fao.org/docrep/w7241e/w7241e0f.htm
Accessed 05 November 2010.
Nicotinamide adenine dinucleotide 2005. Wikipedia. Available:
http://en.wikipedia.org/wiki/Nicotinamide_adenine_dinucleotide
Accessed 01 November 2010.
Parkin, G. F., Lynch, N. A., Kuo, W., Keuren, E. L. & Bhattacharya, S. K. v. 1990.
Interaction between sulfate reducers and methanogens fed acetate and propionate. Journal
- Water Pollution Control Federation 62, 780–788.
PerkinElmer SCIEX. The 30-Minute guide to ICP-MS: Inductively Coupled Plasma - Mass
Spectrometry. PerkinElmer, Inc., Waltham, United States.
Rinzema, A., Boone, M., Knippenberg, K., v. & Lettinga, G. 1994. Bactericidal effect of
long chain fatty acids in anaerobic digestion. Water Environmental Research 66, 40–49.
Serna, E. 2009. Anaerobic Digestion Process. Available:
http://www.wtert.eu/default.asp?Menue=13&ShowDok=12
Accessed 26 November 2010.
SFS-EN 12506. Characterization of waste. Analysis of eluates. Determination of pH, As,
Ba, Cd, Cl-, Co, Cr, Cr (VI), Cu, Mo, Ni, NO2-, Pb, total S, SO4
2-, V and Zn. 2003.
Helsinki: Finnish Standard Association SFS.
SFS-EN 15170. Characterization of sludges - Determination of calorific value. 2008.
Helsinki: Finnish Standard Association SFS.

67
SFS-EN ISO 11734. Water quality - Evaluation of the "ultimate" anaerobic
biodegradability of organic compounds in digested sludge - Method by measurement of the
biogas production. 1998. Helsinki: Finnish Standard Association SFS.
Sprott, G. D. & Patel, G. B. 1986. Ammonia toxicity in pure cultures of methanogenic
bacteria. Systematic and Applied Microbiology 7, 358–363.
Thomas, R. 2001. A Beginner's guide to ICP-MS: Part I. Spectroscopy Tutorial 16 (4)
Vogels, G. D., Kejtjens, J. T., Drift, C. v. d. 1988. Biology of Anaerobic Microorganisms.
New York: John Wiley and Sons. p. 988.
Vallee, B. L. & Ulner, D. D. 1972. Biochemical effects of mercury, cadmium, and lead.
Annual Review on Biochemistry 41, 91–128.
Weiss, J. 2004. Handbook of Ion Chromatography. Third, Completely Revised and
Enlarged Edition. Weinheim, Germany: WILEY-VCH Verlag GmbH & Co. KGaA
Woodward, J. R., Cirillo, V. P. & Edmunds, L. N. Jr. 1978. Light Effects in Yeast:
Inhibition by Visible Light of Growth and Transport in Saccharomyces cerevisiae Grown
at Low Temperatures. Journal of Bacteriology 133, 692–698.
University of Miami - Department of Biology (UM - DB). 2000. Glycolysis -
Embden/Meyerhof/Parnas Pathway. Available:
http://www.bio.miami.edu/~cmallery/255/255atp/glycolysis.htm
Accessed 05 December 2010.
Yerkes, D. W., Boonyakitombut, S. & Speece, R. E. 1997. Antagonism of sodium toxicity
by the compatible solute betaine in anaerobic methanogenic systems. Water Science and
Technology 37 (6–7), 15–24.

APPENDIX 2/1
PROCESSES OF A TANNERY IN LEATHER WASTE PROJECT
GRAPH 1. Flow chart of tannery process (reproduced from tannery's environmental report)

APPENDIX 2/2
All the waste liquids, except for the hairing and fleshing, are pumped into the waste water
treatment plant (WWTP) in which they are treated by various processes.
GRAPH 2. Flow chart of tannery's WWTP process (reproduced from tannery's
environmental report)
Geotube is a kind of membrane dehydration sac into which wastewater is pumped. Water
will then flow out of the geotube, while the denser sludge remaining inside are taken out
and stored.

APPENDIX 2/1
KAUSTINEN BIOGAS PLANT
GRAPH. Flow chart of Kaustinen biogas plant process (reproduced from the Kaustinen
plant's environmental impact assessment).

APPENDIX 2/2
TABLE. Feed limits and origin of waste for the Kaustinen biogas plant.
Waste Amount, tn/a Origin of the waste
Wood based
recycling fuel 0-10 000
Burnable wood based materials that are not
suitable to other recycle applications, for example
small amounts from the building, forest and other
industry
Slurry and dry
manure 15 000-30 000 Cow, horse and pig farms
Fur farm manure 30 000-35 000 Fur farms
Butcher and carcass
waste 2 000-5 000 Butcher/Carcass-waste treatment facilities
Municipal sludges 5 000-10 000 Kaustinen-Veteli, Kokkola and Pietarsaari
Green mass 2 000-5 000 Agricultural dry and fresh masses, for example
spoiled heyrolls
Industrial sludges 1 000-10 000 Dilute industrial sludges, for example cell liquids
from potato production
Municipal biowaste 2 000-5 000 Area of operation and neighboring municipalities

APPENDIX 3/1
MICROWAVE DIGESTION
INTRODUCTION
Sample used in AAS, AES or ICP-MS are usually in liquid form. Unfortunately, they are
not always readily dissolved. In such cases, the method of acid digestion in a microwave
oven is often employed. This method surpasses the traditional heating-and-stirring-on-hot-
plate method in terms of both time and quality efficiency. The principle of this method is
written based on the document of BERGHOF.
PRINCIPLE
The hard-to-dissolve sample is heated by absorbing the microwave radiation in a closed
vessel which is heat and pressure resistant, as well as transparent to microwave radiation.
The advantages of this method over the traditional ones are that it helps:
• The prevention of loss of volatile substances in the sample
• The development of high pressure inside the vessel, leading to the increase of the
liquid's boiling point, enabling the complete solution of the elements and complete
decomposition of the sample matrix
Moreover, the digestion time drops considerably with this method, only about 20–40
minutes, in comparison to several hours with the traditional ones.
Extreme conditions in the vessel during the digestion (with temperature >200 0C, pressure
>20 bar, and corrosive strong acid) require a very high standard vessel’s materials. In
practice, Teflon material, such as PTFE (Poly Tetra-Fluoro Ethylene) or TFM-PTFE, or
PFA is preferred in manufacturing the vessels.

APPENDIX 3/2
EXPERIMENTAL PROCEDURE
The microwave oven used in this experiment is the Milestone Ethos TC.
Firstly, the type of sample and the analysis requirements must be considered thoroughly so
that a proper digestion pattern is chosen. The parameters of each pattern:
• Solution aid reagents: mineral acids, hydrogen peroxide, etc,
• Power of the oven, time and temperature of the digestion
Parameters can be found in the manual, or the so-called "cook-book", of the microwave
oven.
The sample (usually in fine powder form) is added carefully to the bottom of the Teflon
vessel in order to avoid retained sample particles on the top of the vessel due to
electrostatic charge. The Teflon vessel is put into a ceramic pot, and then placed in the
"housing" (the structure that holds the pot, and fits into the oven), which is also transparent
to the microwave radiation. The housing is tightly sealed with a pressure-protection cap,
which will break and release in-vessel pressure when overpressure develops.
The housing is placed into the oven's chamber, attached with a temperature sensor. Then
the system set-point is adjusted according to the cook-book's recommendation, and the
digestion begins. The process usually takes place for 20–40 minutes and then the sample is
allowed to cool down for an hour before being taken out of the oven. The system
automatically produces a temperature change graph in relation to time for the digestion of a
given sample.
When the sample has cooled down, the seal is loosened to release in-vessel pressure. The
sample (which should be in aqueous form) is then transferred (rinsed with ultra-pure water
several time) into a container for further analysis.

APPENDIX 4/1
INDUCTIVELY COUPLED PLASMA - MASS SPECTROSCOPY
(ICP - MS)
INTRODUCTION
Inductively coupled plasma - mass spectroscopy, often mentioned by its acronym ICP-MS,
is a 27-year-old technique of determining a wide range of elemental constituents of sample
with an incredible detection limit. The following graph is a modified periodic table
showing the able-to-be-detected-by ICP-MS elements and their estimated detection
capabilities. The principle of this analysis method is written in reference to the guide of
PerkinElmer SCIEX.
GRAPH 1. Elements whose concentration possible to be determined by ICP-MS and their
detection limits

APPENDIX 4/2
PRINCIPLE
ICP-MS is based on the detection of separated ionized atoms of a sample by measuring the
differences in the mass- charge ratio (m/z).
GRAPH 2. Schematic diagram of an ICP-MS
The basic components of an ICP-MS apparatus are
• Sample injection system: feeding the sample into the system
• ICP torch: generating plasma at very high temperature, thus atomizing and then
ionizing the sample's atoms
• Interface: linking the ions source and the mass spectrometer
• Lens: converging the ions into a beam, then leading them to the quadrupole
• Quadrupole: acting as a filtering system based on the m/z ratio
• Vacuum system: air is evacuated by pumps, thus providing high vacuum for the
lens and mass spectrometer
• Detector: counting the ions passing through the quadrupole and sending signals to
the computerized system
• Signal processing and system controller: control the whole instrument, handling the
data to give the final results.

APPENDIX 4/3
Sample injection system
It is very common that the feed is introduced into the system as liquid, and then nebulized
by a stream of inert gas (for example: Ar), forming aerosol (fine droplets)
GRAPH 3. Nebulizing the sample
Droplets pass through a screening spray chamber where unsuitable-to-be-feed-into-plasma
droplets are eliminated while those with right size and velocity continue to next part
ICP torch
The selected droplets, containing sample matrix and the elements of interest, go through
extremely hot plasma (up to 6000 0C), and thus undergo phase changes
GRAPH 3. Phases of sample through the plasma zone
Constituents of the sample exit the plasma as mono-charged ions and enter the interface
zone.

APPENDIX 4/4
Interface and lens system
The interface separates the atmospheric pressure plasma and the vacuum regions from each
other, it comprises of a skimmer cone and a sampler cone situated as following
GRAPH 4. Interface region and lens system
Each cone has an opening in the range of one-millimeter, allowing ions to pass through.
The region between the two cones is evacuated down to 10-5 mm Hg pressure by rapid
pumping. Through the cones, the ions are guided towards the lens, which uses electric field
to focus ions into beams (just like optical lens focus light into beam) that are fed into the
quadrupole.
The shadow stop helps eliminate the interfering effects of the plasma's photons or the
neutral particles, as those particles are uncharged, so will not be diverted by the electric
field, thus hit the shadow stop and retain there, while the metal ions is deflected and evade
the stop, thus entering the lens and then continue their ways to the quadrupole.
A high vacuum environment is not only introduced to the interface region, but also to the
later part of the ICP-MS, in order to prevent the collision of the sample's ions with the gas
molecules, leading to faulty results.

APPENDIX 4/5
Quadrupole, detector and the data processing unit
As mentioned from the beginning, this device filters the incoming ions based on their
mass-charge ratio. The quadrupole generates a changing electromagnetic field in the
internal space of the four poles. At any instance, the field has a specific frequency that is
characteristic only for a value of mass/charge ratio. Only the ion with the exact
corresponding m/z ratio can pass the quadrupole, then hits the detector's surface,
generating a measurable electronic signal, the others will be deflected away. Therefore,
during a small time interval (typically about 0.1 s), the quadrupole only make passage for a
single type of ions, and the detector counts the number of ions going through, thus the
concentration of that element in the sample can be determined.
GRAPH 5. Quadrupole mass filter
The signals are then collected and processed to produce useful information about not only
the concentrations of the sample's constituents, but also the abundance of different isotopes
existing in the sample.
The most significant difference between the ICP-MS and the Atomic Absorption/Emission
spectrometer is that in the latter, the light radiation emitted by the analyte is detected while
in the ICP-MS, the analyte's ions themselves are detected.

APPENDIX 4/6
EXPERIMENTAL PROCEDURE
The sample obtained from microwave digestion must be diluted before hand with 2%
HNO3 by factor of 1:10, 1:100, 1:1000 and 1:10000. Those diluted samples are analyzed.
The ICP-MS used in this experiment is Agilent 7500 series ICP-MS. First, the
spectrometer must be tune for the best possible performance. The tune solution (consists of
Li, representative for the light-weight elements; Y, for the middle-weight element and Th,
for the heavy-weight ones). The AUTOTUNE program is chosen, and the spectrometer’s
parameters are changed so that the counting (and also the detection resolution) of the three
elements present in the tune solution is highest possible.
After being tuned, the spectrometer has to be calibrated with the blank solution (only ultra
pure water), and then with 7 standard calibration solutions consisting of many common
elements with the concentration of 1, 5, 10, 50, 100, 500, 1000 ppb. Because of the high
running cost, for each times the ICP-MS start, there should be many samples for it to
analyze.
Because this device is highly automated, the manual work would be fairly simple:
• Place the blank, calibration solutions and then samples in the sample arrays
• Input the information of the sample into the computer controlling the ICP-MS
exactly the sequence by which the samples were placed
• Start the process
The device will analyze the samples in the correct order. Between the analysis of two
sample, the sampling tip is washed with 2 % HCl, 45% HNO3, then with 3 % HNO3, then
2% HNO3 and finally rinsed with water. The washing sequence is, of course, carried out
automatically.
The metal concentrations of the sample is given as ppb, the values lying out of calibration
range (from 0 to 1000) will be discarded. Those values are multiplied with their
corresponding dilution factors to obtain the concentrations of elements in the original
sample.

APPENDIX 4/7
RESULTS AND DATA HANDLING
The solution produced by microwave-digesting 0.1459 dry Cr sludge (mentioned in 6.1.2)
are diluted with different dilution factors for ICP-MS analysis.
ICP-MS results
As the original solution's constituents' concentrations are relatively high, thus only highly
diluted samples (with the dilution factor 100, 1000 and 10000) are analyzed, in order not to
contaminate the apparatus.
Results obtained from the ICP-MS are shown in TABLE 1. Here are some helpful remarks
used to interpret the figures:
• The results are given in part-per-billion (ppb)
• The samples are from the same original solution, the goal is to find out which the
reliable results
• For some elements (e.g. Be, B, Ca, As) the concentrations differ from that of
others
• Only the results lying between 0 and 1000 are taken into consideration
• Negative values show that the element is not present in the sample
• The calibrations are not always good and reliable, the standard concentrations
might deviate much away from the nominal values, e.g. for the element Na, the
measured concentration for standard 1 (expected to have a value near 1 ppb) is
0.4806 ppb. In those poorly calibrated range, the results will also be discarded.
The poor calibration range are marked with red color in TABLE 1
• If several results of the same element all lie in the calibration range, the one with
lowest dilution factor will be chosen
• The chosen values are bolded
• The chosen values are multiplied with their corresponding dilution factor and
divided by 1000 in order to get the concentration of the original solution
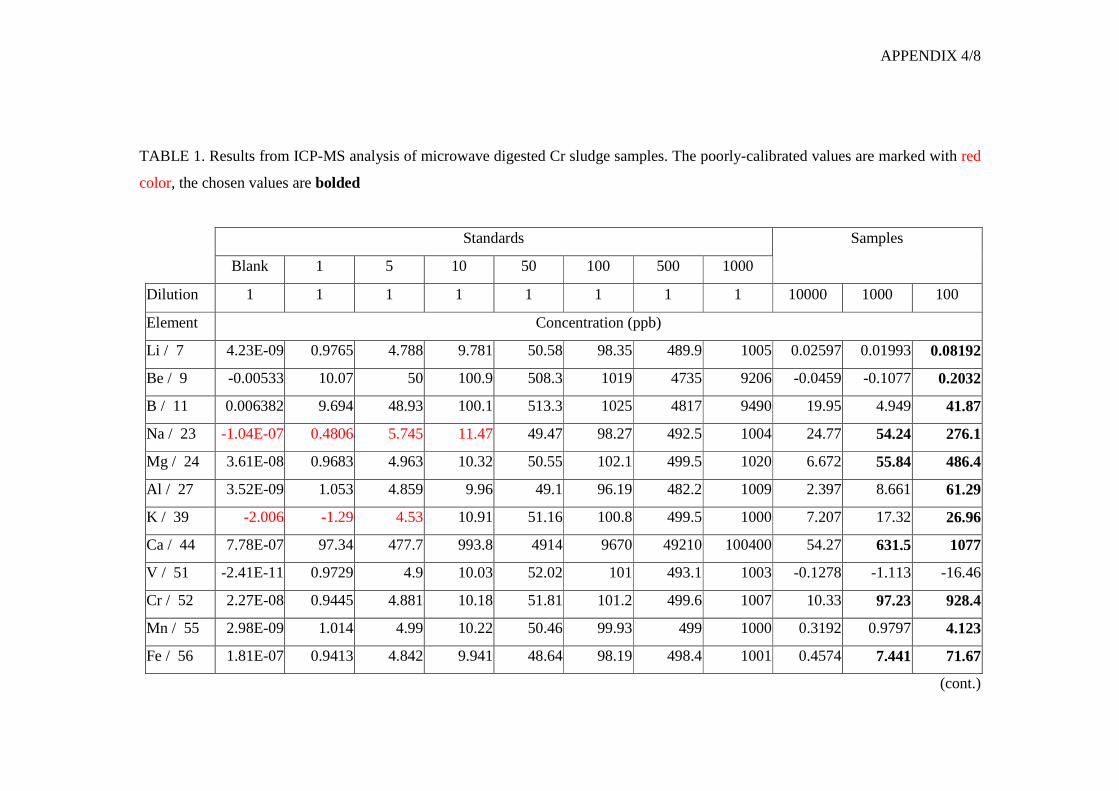
APPENDIX 4/8
TABLE 1. Results from ICP-MS analysis of microwave digested Cr sludge samples. The poorly-calibrated values are marked with red
color, the chosen values are bolded
Standards Samples
Blank 1 5 10 50 100 500 1000
Dilution 1 1 1 1 1 1 1 1 10000 1000 100
Element Concentration (ppb)
Li / 7 4.23E-09 0.9765 4.788 9.781 50.58 98.35 489.9 1005 0.02597 0.01993 0.08192
Be / 9 -0.00533 10.07 50 100.9 508.3 1019 4735 9206 -0.0459 -0.1077 0.2032
B / 11 0.006382 9.694 48.93 100.1 513.3 1025 4817 9490 19.95 4.949 41.87
Na / 23 -1.04E-07 0.4806 5.745 11.47 49.47 98.27 492.5 1004 24.77 54.24 276.1
Mg / 24 3.61E-08 0.9683 4.963 10.32 50.55 102.1 499.5 1020 6.672 55.84 486.4
Al / 27 3.52E-09 1.053 4.859 9.96 49.1 96.19 482.2 1009 2.397 8.661 61.29
K / 39 -2.006 -1.29 4.53 10.91 51.16 100.8 499.5 1000 7.207 17.32 26.96
Ca / 44 7.78E-07 97.34 477.7 993.8 4914 9670 49210 100400 54.27 631.5 1077
V / 51 -2.41E-11 0.9729 4.9 10.03 52.02 101 493.1 1003 -0.1278 -1.113 -16.46
Cr / 52 2.27E-08 0.9445 4.881 10.18 51.81 101.2 499.6 1007 10.33 97.23 928.4
Mn / 55 2.98E-09 1.014 4.99 10.22 50.46 99.93 499 1000 0.3192 0.9797 4.123
Fe / 56 1.81E-07 0.9413 4.842 9.941 48.64 98.19 498.4 1001 0.4574 7.441 71.67
(cont.)

APPENDIX 4/9
TABLE 1. Results from ICP-MS analysis of microwave digested Cr sludge samples. The poorly-calibrated values are marked with red
color, the chosen values are bolded (cont.)
Co / 59 1.07E-07 0.7037 4.603 9.668 50.68 100.6 496 1002 -0.7164 -1.337 -0.6587
Ni / 60 2.174 1.801 5.176 9.691 49.58 100.5 516.7 992.1 -3.038 -4.041 -4.066
Cu / 63 1.00E-08 0.8543 5.115 10.45 53.26 105.8 501.9 998.3 0.6484 0.9802 2.305
Zn / 66 -0.0179 10.04 49.97 100.4 502.7 985.7 4486 8590 2.423 13.82 14.72
Ga / 69 -0.00069 1.019 4.968 10.05 50.19 101 455.5 890.5 -0.0032 -0.0045 0.08008
As / 75 0.01642 9.328 48.08 99.67 518.2 1044 4902 9595 -0.3718 -2.292 1.038
Sr / 88 0.000618 1.015 4.943 10.1 50.34 98.82 493.2 1002 0.1842 0.5856 1.381
Mo / 95 3.565 3.978 6.993 11.43 48.35 98.25 499.5 1000 3.344 3.018 5.866
Cd / 111 8.52E-11 1.016 4.975 10.07 50.34 101.8 500 999.8 0.01232 0.00051 0.02836
Te / 125 0.09344 1.057 5.019 9.908 50.2 100.5 503.5 1016 0.0765 0.09205 0.09543
Ba / 137 0.05541 1.056 5.121 10.25 50.91 102.7 504.5 997.4 0.3124 0.4305 1.022

APPENDIX 4/10
Calculations and final results
It would be much more convenient to express the concentrations of different elements
presenting in the original sample in the unit of mg/kg dry-matter (of sludge).
The conversion are proceeded as shown in the following steps:
a) Let x (unit: ppm = mg/kg = mg/liter) be the concentration of an element in the original
solution going to ICP-MS, i.e. with dilution factor 1.
b) x is calculated by multiplying the chosen values with their corresponding dilution factor
and then divided by 1000.
c) Just after the microwave digestion of 0.1459 g dry Cr sludge, 8 ml of the eluate digested
from the solid sample was diluted with ultrapure water up to 100 ml. Thus, 1 liter of this
solution is equivalent to 1.459 g dry Cr sludge.
d) Therefore, the elemental concentrations of the dry Cr- sludge, expressed in mg/kg dry-
matter, are calculated as shown in equation [1]
[ ]3
3
10. 1
1.459 ( )( ) 1.459 ( )10
mg mg x mgconc x
g dry sludge kgkg dry sludge kg dry sludgell g
= = −− − × ×
The concentration of different elements presenting in the sludge, expressed in mg/kg dry-
matter are shown in TABLE 2.

APPENDIX 4/11
TABLE 2. Concentration of different element in the original solution going to ICP-MS
analysis and in the dry Cr sludge.
Element Chosen value Dilution Original concentration Sludge concentration
(ppb) factor (ppb) (ppm) (mg/kg)
Li 0.0819 100 8.192 0.008 5.61
Be 0.2032 100 20.320 0.020 13.93
B 41.8700 100 4187.000 4.187 2869.77
Na 276.1000 100 27610.000 27.610 18923.92
54.2400 1000 54240.000 54.240 37176.15
Mg 486.4000 100 48640.000 48.640 33337.90
55.8400 1000 55840.000 55.840 38272.79
Al 61.2900 100 6129.000 6.129 4200.82
K 26.9600 100 2696.000 2.696 1847.84
Ca 1077.0000 100 107700.000 107.700 73817.68
Cr 928.4000 100 92840.000 92.840 63632.63
97.2300 1000 97230.000 97.230 66641.54
Mn 4.1230 100 412.300 0.412 282.59
Fe 71.6700 100 7167.000 7.167 4912.27
7.4410 1000 7441.000 7.441 5100.07
Zn 14.7200 100 1472.000 1.472 1008.91
Sr 1.3810 100 138.100 0.138 94.65
Ba 1.0220 100 102.200 0.102 70.05

APPENDIX 4/12
BOMB CALORIMETER
INTRODUCTION
Incineration is a simple and fairly effective way to generate energy as heat from biomass.
Before the biomass is fed into an industrial scale incinerator, its energy potential should be
determined in order to see whether the process is economically feasible or not. The most
common and convenient method is bomb calorimetry. This appendix is written in reference
to the EU standard EN15170.
PRINCIPLE
To determine biomass' calorific value, i.e. the energy potential, a small pelletized sample is
burned inside the bomb calorimeter and changes in temperature are recorded in order to
deduce how much heat is released from the sample.
GRAPH 1. Basic components of a bomb calorimeter.

APPENDIX 4/13
Inside the combustion bomb, there is a small "cup", made of durable material, called
crucible, into which the sample pellet(s) are placed and burned. The incineration takes
place in an oxygen atmosphere at a pressure of about 3.0 MPa. Thus, the reason of using
sample in pellet form is to make the burning process less vigorous, preventing the inner
part of the combustion bomb from being damaged.
In this thesis work, an automated ADIABATIC calorimeter is used, i.e. the whole system is
thermally isolated, and all the heat generated from the incineration of samples goes directly
into warming up the bomb and the surrounding water jacket. The changes in the
temperature of the water jacket (and also of the combustion bomb) are measured by a high-
resolution thermometer which provides the reading to the nearest 0.0001 K.
The energy released from the sample can only be calculated correctly if the heat capacities
of the bomb, the water, the energy contribution of fuse (ignition cotton) are known. In
practice:
• The calorific value of the fuse is determined by using standardized cotton fuse.
• The capacities are obtained through the calibration process of burning standardized
benzoic acid pellets. The calibration is done as instructed in the manual of the
apparatus.
Here are some definitions of the calorific-values-of-interest obtained from the combustion:
• Gross calorific value (at constant volume): absolute value of the specific energy of
combustion, in Joules, for unit mass of a solid sludge burned in oxygen in a
calorimetric bomb under the conditions specified. The products of combustion are
assumed to consist of gaseous oxygen, nitrogen, carbon dioxide and sulfur dioxide,
of liquid water (in equilibrium with its vapor) saturated with carbon dioxide under
the conditions of the bomb reaction, and of solid ash, all at the reference
temperature.
• Net calorific value (at constant pressure): absolute value of the specific energy of
combustion, in Joules, for unit mass of a solid sludge burned in oxygen at constant
pressure under such conditions that all the water of the reaction products remains as
water vapor (in a hypothetical state at 0.1 MPa), the other products being as for the
gross calorific value, all at the reference temperature.

APPENDIX 4/14
The result obtained from the automated adiabatic bomb-calorimeter is directly the gross
calorific value (at constant volume). But the really significant value for the industrial
incineration of biomass is the Net calorific value (at constant pressure). Those two values
are inter-related through the equation:
[ ], , , , 212.2 ( ) 0.8 ( ) ( ) [1]p net d V gr d d d dq q w H w O w N= − × − × +
Where: qV,gr,d is gross calorific value of the dried-basis sample (at constant
volume)
qp,net, d is net calorific value of the dried-basis sample (at constant pressure)
w(H)d is the hydrogen content (% mass) of the dry sample
w(O)d is the oxygen content (% mass) of the dry sample
w(N)d is the nitrogen content (% mass) of the dry sample
The sample going into the bomb is dried beforehand to eliminate moisture, which can be
an interfering factor. In the end, the calorific value of the original sample is determined as:
, , , , (1 0.01 ) 24.43 [2]p net m p net dq q M M= × − − ×
Where: qp,net, m is net calorific value of the as-received sample (at constant pressure)
M is the moisture content of the sample.

APPENDIX 4/15
EXPERIMENTAL PROCEDURE
In this experiment, the automated bomb calorimeter used is IKA C5003, the ignition fuse is
the cotton fuse C710.4 with a calorific value of 50 J per fuse. The bomb is calibrated with
benzoic acid pellet IKA C723, having the calorific value of 26460 J/g and weighing 0.5 g
each pellet.
Samples must be well prepared before analysis in the bomb calorimeter. Dried samples
(with known moisture content) are ground into small particles and then pressed into pellet,
sufficient weight for each pellet is about 0.5 g.
A volume of 10 ml distilled water is added into the combustion bomb (exactly the same
amount of water added in the calibration process, in order to cancel the error). Cotton fuse
is tightened to the ignition circuit; one end of the fuse is put into the crucible. The pellets
are put into the crucible, onto the fuse's end, to ensure the incineration. The combustion
bomb is tightly capped and inserted into the system. Parameters of the experiment (weight
of sample, type of fuse, etc.) are entered, and then the rest of the process is carried out
automatically just simply by clicking "START" in the controlling window. Each
combustion takes 20 - 25 minutes, and the results are given automatically as MJ/kg sample.
The pressure inside the bomb is released (by pressing the special sting into the pressure-
relieve hole on the top of the bomb) so that the cap can be opened. Residue liquid in the
bomb and solid in the crucible can be saved for further analysis. Components are washed
and dried thoroughly; especially, the ignition wire is brushed in order to get rid of the
remaining dirt which might affect the next ignition.
NOTE: For sample with high content of Chloride, a specific bomb with platinum ignition
wire is used because it can withstand highly corrosive environments caused by chloride in
high temperature condition.


![arXiv:1712.06130v2 [math.AP] 17 Dec 2019 · 2019. 12. 18. · thank Claude Zuily and Patrick G´erard for all their help and encouragement, and thank Huy Quang Nguyen for some useful](https://img.pdfslide.us/doc/110x75/613fe182b44ffa75b804824f/arxiv171206130v2-mathap-17-dec-2019-2019-12-18-thank-claude-zuily-and.jpg)