Embed Size (px)
Citation preview
THESIS
ASSESSING EMPLOYEE ENGAGEMENT: A COMPARISON OF THE JOB ENGAGEMENT
SCALE AND THE UTRECHT WORK ENGAGEMENT SCALE
Submitted by
Travis J. Drake
Department of Psychology
In partial fulfillment of the requirements
For the Degree of Master of Science
Colorado State University
Fort Collins, Colorado
Summer 2012
Master’s Committee:
Advisor: Zinta Byrne
Alyssa GibbonsLumina AlbertKathryn Rickard
ABSTRACT
ASSESSING EMPLOYEE ENGAGEMENT: A COMPARISON OF THE JOB ENGAGEMENT
SCALE AND THE UTRECHT WORK ENGAGEMENT SCALE
Two employee engagement measures were compared and contrasted to determine if one is better
than the other, or if both are required to adequately assess the construct domain. The first
measure is Rich, LePine, and Crawford’s (2010) Job Engagement Scale based on Kahn’s (1990)
conceptualization of engagement. The second measure is Schaufeli, Salanova, Gonzalez-Romá,
and Bakker’s (2002) Utrecht Work Engagement Scale, based on Maslach and Leiter’s (1997)
conceptualization of engagement. The measures were compared by examining their convergent
and discriminant construct validity, examining the factor structure of each measure, and
examining the criterion-related validity of each through dominance analysis. Using responses
from 470 working adults, results showed significant differences between the UWES and JES in
terms of construct and criterion-related validity evidence.
ii
TABLE OF CONTENTS
Background on Engagement............................................................................................................3 Perspective One.....................................................................................................................3 Perspective Two.....................................................................................................................4Measures of Employee Engagement...............................................................................................5Current Study...................................................................................................................................9 Construct Validity..................................................................................................................9 Models Tested......................................................................................................................12 Model 2......................................................................................................................12 Model 3......................................................................................................................13 Model 4......................................................................................................................13 Criterion-related Validity.....................................................................................................15Method...........................................................................................................................................17 Participants and Procedures.................................................................................................17 Job Engagement Scale...............................................................................................17 Utrecht Work Engagement Scale...............................................................................18 Stress..........................................................................................................................18 Affect.........................................................................................................................18 Demographics............................................................................................................18 Data Analysis.......................................................................................................................19Results............................................................................................................................................20Discussion......................................................................................................................................24 Strengths and Limitations....................................................................................................28 Theoretical and Practical Contributions..............................................................................29 Future Research...................................................................................................................30 Conclusion...........................................................................................................................31Scales.............................................................................................................................................32Tables and Figures.........................................................................................................................37References......................................................................................................................................50
iii
Assessing Employee Engagement:
Comparison of the Job Engagement Scale and the Utrecht Work Engagement Scale
The study of employee engagement (i.e., the full investment of oneself into work) has
been justified by noted comparisons to disengagement or the lack of engagement. For example,
in the applied arena, engaged employees have been shown to have lower rates of absenteeism (-
37%), turnover (-25% to -49%), internal employee theft (-27%), safety incidents (-49%), patient
safety incidents (-41%), and work quality defects (-60%) than unengaged employees (see Harter,
Schmidt, Killham, & Agrawal, 2009 meta-analysis). Additionally, practitioner publications quote
large financial figures to convey the cost to businesses of disengaged employees, with the
assumption that such losses become gains when organizations can convert disengaged employees
into engaged employees (Van Allen, 2008). Given the substantial differences between engaged
and unengaged employees, as well as the potential upswing of converting unengaged to engaged,
employee engagement as a topic domain has accumulated growing interest amongst practitioners
and researchers.
Though interest is increasing (Macey, Schneider, Barbera, & Young, 2009), only recently
have theoretically grounded definitions been offered and measures of engagement been
developed to describe and assess the construct (Kahn, 1990; Macey & Schneider, 2008; Rich,
LePine, & Crawford, 2010; Schaufeli, Salanova, Gonzalez-Romá, & Bakker, 2002). With the
growing interest in studying employee engagement, its antecedents, and its consequences,
researchers are turning to the few measures that exist without information as to whether one
captures the construct domain better than the other.
The purpose of this study was to investigate the similarities and differences between two
employee engagement measures: Rich et al.’s (2010) Job Engagement Scale (JES) and Schaufeli
1
et al.’s (2002) Utrecht Work Engagement Scale (UWES). Though both scales purport to measure
employee engagement, they are each derived from different theoretical backgrounds suggesting
that there may be differences in their construct, content, and criterion-related validity evidence.
Specifically, the JES was based on Kahn’s (1990) definition of engagement, which is comprised
of three components: physical, cognitive, and affective, and grounded in theories of individuals’
expression of themselves in their work roles (Goffman, 1961). In contrast, the UWES has roots
in the burnout literature (i.e., Maslach, Jackson, & Leiter, 1997). Originally, the UWES intended
to conceptualize engagement as the opposite of burnout, and was comprised of three
components: vigor, dedication, and absorption; opposites of exhaustion, cynicism, and inefficacy,
respectively. Schaufeli et al. have since noted that engagement is not quite the exact opposite of
burnout, but the UWES retains the fundamental scale structure.
To date, no study has examined the two measures side-by-side; hence, there is no
information to suggest whether one assesses the construct better than the other, or whether each
captures some unique aspect of the construct that could make unique theoretical contributions to
the study of engagement. By comparing the scales to each other and evaluating their
psychometric properties, this study serves to inform researchers on which measure may be most
appropriate for assessing employee engagement, or whether both should be considered in some
capacity to fully capture the construct domain. Historically, new or related measures have
received similar treatment (e.g., Ilgen, Nebeker, & Pritchard, 1981), with results serving as a
guide for researchers who may have different purposes or foci for their research. Hence, this
study follows an established practice.
2
Background on Engagement
The empirical study of employee engagement is relatively new, resulting in a few
disparate definitions for the construct (e.g., Saks, 2008; Shuck, 2011). At least three models of
employee engagement have been proposed, each specifying that employee engagement is a
construct unique from other similar constructs (i.e., satisfaction), and some have been supported
by empirical evidence (Kahn, 1990; Macey & Schneider, 2008; Maslach, Schaufeli, & Leiter,
2001; Saks, 2008; Schaufeli et al., 2002). However, only two conceptualizations appear to have
taken hold in the literature and have associated measures. Despite the growing popularity of
these two perspectives, discussion has ensued around what defines employee engagement, how it
should be measured, and whether or not it is a unique construct (e.g., Hallberg & Schaufeli,
2006; Macey & Schneider, 2008; Newman & Harrison, 2008). This next section provides a brief
review of the two dominant models of engagement.
Perspective One
To learn how employees vary in their investment in work, and to explore whether such
investment varied between settings, Kahn (1990) conducted a qualitative study of camp
counselors and workers at an architectural firm. Grounded in the work of Goffman (1961) on
individuals’ attachment and detachment from their work roles, Kahn observed the ‘preferred self’
in everyday activities. The preferred self refers to the identity and behavior that people choose to
use when in different roles. Kahn observed that camp counselors and architects employed
themselves physically, cognitively, and emotionally in their work roles, and he subsequently
defined engagement as this three-component expression of the employee’s self in the work role.
He analyzed work experiences in both settings, gathering contextual and psychological
explanations for why employees engaged or disengaged at work. He further found that three
3
psychological states: meaningfulness, safety, and availability, seemed necessary for fostering
employee engagement (Kahn, 1992). The concepts of the preferred self and the three
psychological states form the basis of Kahn’s conceptualization of engagement. Specifically,
Kahn proposed that people enter a state of engagement, noted by the employment of their
preferred selves cognitively, affectively, and physically, when they find meaningfulness, safety,
and availability in their work roles.
Perspective Two
A second definition of employee engagement was proposed by Maslach and Leiter
(1997), who suggested that engagement was the direct opposite of burnout and comprised of
energy, involvement, and efficacy. These three components were the opposite of the three
burnout components: exhaustion, cynicism, and lack of efficacy, respectively. The authors
recommended that the Maslach Burnout Inventory (MBI; Maslach et al., 1997) could be used to
assess both engagement and burnout, with each falling on an opposite end of the scale. Thus, low
scores on the dimensions of the MBI should correspond with high levels of engagement.
However, Schaufeli et al. (2002) suggested that defining engagement as the opposite of
burnout and using the MBI to assess both constructs created a measurement challenge in
assessing whether they are indeed two distinct constructs, and also in developing validity
evidence for engagement. Hence, Schaufeli et al. redefined engagement as retaining some of the
elements of burnout, but argued that it was indeed a distinct construct. By editing the burnout
inventory, the authors developed the UWES to distinguish between engagement and burnout.
They redefined the three factors of burnout as vigor, dedication, and absorption. Vigor was
defined as having high levels of energy even in challenging situations and serves as the opposite
of the MBI’s exhaustion factor. Dedication referred to enthusiasm, pride, inspiration, and
4
significance, and functions as the opposite of the MBI’s cynicism factor. Absorption, taking the
place of efficacy (which would be considered the opposite of the MBI’s lack of efficacy factor),
was defined as having a high level of concentration while working.
Measures of Employee Engagement
Having a measure with good construct validity evidence is necessary for advancing the
field theoretically and practically. For example, using a measure with poor discriminant validity
evidence can lead to conclusions that suggest a construct relates to another construct, when it
actually does not. Conversely, a scale that has high convergent and discriminant validity
evidence advances the research by appropriately specifying the construct domain (Benet-
Martinez & Oishi, 2000), showing that the construct relates to other similar constructs as it
should (convergence) and is different from constructs that should differ (discrimination).
For practitioners and researchers alike, not using a measure that appropriately captures
the construct domain has far-reaching consequences. One can waste valuable time and resources
chasing down inappropriate solutions or interventions, or specifying and pursing a nomological
network (Cronbach & Meehl, 1955) that is inherently flawed. Research builds on previous
research; hence, results from a measure ill-suited for the purpose can affect an entire stream of
research. Though businesses tend to be more interested in antecedent and outcome variables than
in advancing a research stream (Shuck, 2011), practitioners reliance on well-developed measures
that demonstrate construct validity evidence is justified by evidence-based practice. Evidence-
based practice refers to the practice of using evidence over habit, history, or other non-
scientifically based criteria (Hodgkinson, 2011).
5
The two theoretically established measures for assessing employee engagement examined
in this study are the JES (Rich et al., 2010) and the UWES (Schaufeli et al., 2002). These two
scales were chosen because they represent the two dominant theories of engagement in the field.
Although Kahn’s (1990) conceptualization of engagement has informed research, his
framework has rarely been used or cited for assessing employee engagement; most likely
because of the lack of a measurement instrument designed to assess his conceptualization. An
early attempt to create a measure using Kahn’s framework failed (see May, Gilson, & Harter,
2004), primarily because survey items did not distinguish between the three components of
engagement.
Recently, however, Rich and colleagues (2010) developed and published a measure, the
JES, based on Kahn’s conceptualization. Items for this scale are based on research related to the
three dimensions. For example, Rich et al. drew upon Brown and Leigh’s (1996) research on
work intensity and effort, which showed that employees who work hard exhibit higher levels of
performance. For constructing questions for the cognitive and emotional subscales, Rich et al.
respectively drew upon the work of Rothbard’s (2001) measure of attention and absorption, and
Russell and Barrett’s (1999) work on generalized affect encompassing feeling good and having
energy. Rich et al.’s first examination of their scale, using a sample of 84 full-time employees,
revealed high intercorrelations among the sub-scales (r = .63 to .74), which they suggested
supported the concept of an overall job engagement score.
Subsequent modification of items and confirmatory factor analysis (CFA) on a field
sample of 180 employees at an assisted-living healthcare facility, revealed support for a three
dimension model of physical, cognitive, and emotional, with engagement as a higher-order factor
(Rich et al., 2010). The authors concluded that their resulting measure captured Kahn’s (1990)
6
conceptualization of engagement as a higher-order construct comprised of three distinct
dimensions.
Furthermore, using a sample of 245 full-time firefighters, Rich and colleagues (2010)
conducted CFAs and obtained further construct validity evidence for the second-order with three
first-order factors structure of their measure. To obtain discriminant validity evidence they
examined how job engagement related to a variety of constructs such as perceived support, job
involvement, core self-evaluations (i.e., a higher order positive self-appraisal construct
comprised of self-esteem, locus of control, neuroticism, and self-efficacy), and intrinsic
motivation. To obtain predictive validity evidence, the authors obtained supervisory ratings of
organizational citizenship behavior (OCBs; i.e., extra-role performance behaviors) and task
performance. Their results, using structural equation modeling, supported their hypothesized
relationships – engagement was positively related to support and core self-evaluations, as well as
OCBs and task performance, and engagement was appropriately distinct from job satisfaction,
intrinsic motivation, and job involvement. The JES is still relatively new (Crawford, LePine, &
Rich, 2010), and therefore, no other validity studies were found in a recent search of the
literature. Schaufeli and colleagues (2002) first proposed the UWES as a 17-item scale. Using
exploratory factor analysis, they found three distinct factors of employee engagement: vigor,
absorption, and dedication, consistent with their conceptualization. Schaufeli, Bakker, and
Salanova (2006) later shortened the UWES-17 to create a 9-item version of the measure. The
authors obtained construct validity evidence for the 9-item scale using (CFA) and internal
reliability estimates. The model fit that emerged from the CFA was slightly worse than the 17-
item scale. Fit, or goodness of fit, indicates how well a statistical model describes or explains a
set of real world observed data (Brown, 2006). When comparing the fit of two models, a worse
7
fit indicates that the comparison model does not relate as closely to the observed data as the
previous model, but in this case the difference between the 17-item and 9-item versions was
considered negligible. Thus, there exist two different versions of the UWES, which are both used
and cited in the literature. Because the 9-item measure does not have as much empirical support
and it tends to show slightly worse fit than the 17-item scale for Schaufeli et al.’s
conceptualization of employee engagement for most samples studied, the 17-item scale is used in
this study.
Using the MBI-General Survey (MBI-GS; Maslach, Jackson, & Leiter, 1997) to assess
burnout and the UWES (Schaufeli et al., 2002) to assess engagement, Schaufeli and colleagues
(2002) found that engagement and burnout were psychometrically unique. That is, the authors
used CFA across two Spanish samples (314 college students and 619 professional employees)
and found that the burnout model did not fit as well as the UWES for assessing their definition of
engagement. When modeling a two-factor solution where the MBI-GS subscales (lack of
efficacy, cynicism, exhaustion) load onto one factor and the UWES subscales (vigor, dedication,
absorption) load onto a second factor, this 2-factor higher-order solution of engagement and
burnout emerged after some additional fit effort (see Schaufeli et al., 2002 for details). The
authors concluded that burnout and engagement were not quite opposite sides of the same
construct. Although Schaufeli et al. argue that their new scale, the UWES, is not the exact
opposite of burnout, they obtained strong negative correlations with burnout as measured using
the MBI-GS, most likely because the UWES retains many of the original MBI-GS items
(positively phrased).
The UWES is currently the most commonly used measure to assess work engagement
(Shuck, 2011). Although the initial focus on studying the UWES mainly looked at stress-related
8
outcomes, it has recently been used to examine the relationship between engagement and
efficacy (Schaufeli & Salanova, 2007), and proactive behavior (Salanova & Schaufeli, 2008).
Current Study
With increasing research and practice attention on determining how to foster employee
engagement, the need for understanding which measure to use grows. Given that participant
attention and time is a premium, and researchers are seeking to develop the nomological network
(Chronbach & Meehl, 1955) of engagement, using the instrument that best captures the construct
of employee engagement becomes crucial (Harter, Schmidt, & Hayes, 2002; Rich et al., 2010).
By studying both measures, the JES and UWES, simultaneously, using the same sample and
examining validity evidence, it may be possible to obtain a clearer understanding of where and
when to use each measure when studying employee engagement.
Validity evidence serves to inform conclusions and inferences about test scores; it is not a
property of a test (Lawshe, 1985; Murphy, 2009). A number of strategies exist for accumulating
validity evidence and these include focus on the content, the construct, and what outcomes the
resulting scores correlate with and to what degree. Such evidence can inform a user’s decision as
to which engagement measure, whether the UWES or the JES, is most appropriate for their
specific area of research. Though recent progress in understanding validity has moved towards
referring to a single type of validity, construct validity (Murphy, 2009), it is easiest to discuss
comparing measures by referring to the most relevant individual strategies used to accumulate
validity evidence for the two engagement scales: construct and criterion-related.
Construct Validity
To evaluate if a measurement instrument is accurately and fully capturing a construct, one
needs to investigate its construct validity evidence. Construct validity evidence, however, is not a
9
one-time demonstration; it requires a program of research that includes evidence that speaks to
whether and how the scores on the measure relate to and do not relate to constructs that theory
suggests should be related and unrelated (Campbell & Fiske, 1959). There are two distinct types
of construct validity evidence described in the literature: convergent and discriminant (Campbell
& Fiske, 1959). Convergent construct validity evidence is provided when test scores correlate
with other tests or variables that overlap with the construct. In this case, one measure of
engagement should be related to other measures of engagement, and related to constructs that the
theory suggests should be strongly related to engagement (e.g., satisfaction or performance).
Since both measures, the UWES and JES, are supposed to be measuring the same construct, they
should demonstrate moderate to high correlations with each other. For example, vigor on the
UWES should be highly correlated with physical engagement on the JES. Additionally, their
second-order factor scores should be highly correlated with each other. That is, an overall score
on the UWES should correlate highly with an overall score on the JES.
Discriminant validity evidence is demonstrated when the scores on the measure do not
correlate with variables that should differ, or are expected by theory to not correlate with the
construct. For example, engagement should not correlate with gender, as no theory suggests nor
does evidence exist indicating that engagement differs by gender. However, age has been shown
to be related to engagement in a few studies (James, McKechnie, & Swanberg, 2011; Avery,
McKay, & Wilson, 2007), but there is very little research in the area. Thus, gender and age will
be used to show discriminant validity evidence, with the possibility that age will be slightly
related to engagement. Additionally, positive and negative affect can also be used to demonstrate
discriminant validity evidence. Given that Rich et al.’s (2010) JES is based on Kahn’s definition
of engagement, which includes affect as a component, it is expected that there will be at least
10
some correlation between the affect factor of the JES and both positive and negative affectivity.
Furthermore, Schaufeli et al. (2006) referred to engagement as an affective-cognitive state, which
suggests there may be some evidence of affect being at least minimally related to their definition
of engagement as well. However, high correlations are not expected. It should be noted that these
variables (i.e., age, gender, positive affectivity, negative affectivity) were chosen based on the
available data set for this study.
Another technique used for demonstrating whether two measures assess the same
construct conceptualization is to examine the factor structure of the scale scores. Analyzing
factor structure involves investigating whether or not a large data set can be reduced to a smaller
data set with a fixed number of distinct interpretable factors (Brown, 2006). The factors can be
either different constructs or components of a higher-order construct.
Factor analysis determines factor loadings (e.g., a standardized mathematical score of 0-
1) for each item. Factor loadings represent how correlated an item is with the common factor
underlying the items for a given data set (Brown, 2006). If the construct is conceptualized as
comprised of only one concept, then each item from the questionnaire should load onto one
factor only. For example, all of the vigor items for the UWES should load mainly on to vigor and
not onto absorption or dedication. This means that a question on the vigor subscale should be
representative of the construct of vigor and not overlap with the other factors or other constructs.
If items do not load cleanly (meaning they load significantly on to more than one factor), they
may need to be rewritten or removed from the measurement instrument (Lackey, Pett, &
Sullivan, 2003).
For the current study, confirmatory factor analysis was used to determine whether the
factor structure of the two engagement measures are the same. CFA is used to determine the fit of
11
a predefined model to a set of observed data. For this study, the model for both measures will be
a three-factor model. Based on the previously mentioned studies, both scales are expected to
have three factors. It should be noted that the three factors for each model are not expected to be
the same or equivalent, but that the original authors of the measures each offered three factor
solutions. An exploratory factor analysis (EFA) was not used because EFAs are primarily
appropriate when no hypothesized factors exist or when a previous CFA demonstrates poor fit
(Schmitt, 2011). Since neither of these criteria apply, a CFA is appropriate. The CFAs inform
construct validity by determining if the assigned factor structure is appropriate for the current set
of data (see Figure 1).
Models Tested
In addition to testing the theoretically imposed factor structure suggested by the literature
(i.e., Model 1: JES = three factors, UWES = three factors), three alternative models were also
tested in this study. The first model tests engagement as a single construct with the JES and the
UWES items grouped together (Model 2). The second model explores whether the UWES and
JES each form a separate construct of engagement resulting in two separate factors (a JES factor
and a UWES factor; Model 3). The final model (Model 4) combined the physical, emotional, and
cognitive subscales from the JES with the vigor, absorption, and dedication subscales of the
UWES, creating a single 3-factor scale of engagement as opposed to two scales of three factors
each.
Model 2
The second model tests the idea that engagement is one construct and that all the items
from the JES and UWES are measuring the same construct. Thus, all items from both scales
combined will result in a single factor (see Figure 2). If this model fits well, it indicates that both
12
scales are measuring the same construct and that either scale could be used for measuring
engagement. It is hypothesized that this model will not fit well because the scale items were
based on different foundations. That is, the JES has roots in Kahn’s (1990) conceptualization of
engagement whereas the UWES has roots in the burnout literature (Maslach & Leiter, 1997).
Hypothesis 1: A model with all items from the JES and UWES loading onto one factor
will have poor psychometric fit.
Model 3
The third model tests the idea that the UWES and JES each capture different and unique
pieces of the construct of engagement. Thus, this model is represented by the UWES as one
factor and the JES as second factor (see Figure 3). If this model fits well, it will indicate that
each measure offers a unique contribution to assessing and explaining engagement. It is
hypothesized this model will not fit well because the scales share quite a bit of overlap.
Hypothesis 2: A model with the JES and UWES as separate factors will have poor
psychometric fit.
Model 4
The fourth and final model tests the idea that the JES and UWES are both measuring the
same construct, and that their subscales are just different iterations of the same underlying
constructs of affect, behavior, and cognition. Thus, Rich et al.’s and Schaufeli et al.’s models
should factor such that emotional and absorption capture an affect factor, physical and vigor
capture a behavior factor, and cognition and dedication capture a cognitive factor.
Combining factors has some support; there is evidence that Schaufeli et al. (2002)
originally conceptualized affective, behavioral, and cognitive components when they developed
the UWES. The authors referred to engagement as, “...a more persistent, pervasive affective-
13
cognitive state that is not focused on any particular object, event, individual, or behavior” (p.74),
so the concept of cognition was initially used. They characterized vigor as “...having high levels
of energy and mental resilience, willingness to invest oneself in one’s work” (p.74), which is
very similar to behavior. Furthermore, dedication was originally defined in terms of
“psychological identification with one's work” (p.74), which is very similar to psychological
affect. Although the items of the UWES do not precisely match these three basic psychological
concepts, the general idea is that their model of engagement contains affective, behavioral, and
cognitive components.
As previously noted, Rich and colleagues (2010) were explicit in linking their scale to
affect, behavior, and cognition components of engagement. They note that while these three
constructs have been used as predictors in workplace research, Kahn (1990) suggests the
possibility that individuals “...can choose to invest their affective, cognitive, and physical
energies simultaneously in role performances” (p. 617). As mentioned earlier, Rich et al.
explicitly drew upon some of the research in areas of affect, behavior, and cognition when
crafting their items for the subscales. Holistically, the concepts of emotional, physical, and
cognitive engagement are a close parallel to the constructs of affect, behavior, and cognition,
respectively.
Despite the similarities of the JES and UWES, the overall fit of model 4 is expected to be
poor, but good relative to models 2 and model 3. Although the UWES does encapsulate some
aspects of affect, behavior, and cognition, the items were not written explicitly from this
grounded framework. Items such as, “I find the work I do full of meaning and purpose” and
“When I get up in the morning I feel like going to work” seem to capture concepts that fit in
between the categories. I hypothesize that model 4 will fit better than models 2 and 3, but still
14
have poor overall fit because of the theoretical, temporal, and psychometric differences between
the two scales.
Hypothesis 3: A model with affect, behavior, and cognition as separate factors made up of
items from the JES and UWES will have poor psychometric fit, but it will fit better
than model 2 and model 3.
Criterion-related Validity
Criterion-related validity is demonstrated when engagement measures predict or relate to
relevant workplace outcomes, called criteria. There are many relevant outcomes that researchers
have related to employee engagement. For example, in a meta-analysis, Harter, Schmidt, and
Hayes (2002) found significant relationships between engagement and customer satisfaction,
productivity, profit, turnover, and accidents.
To compare the criterion-related validity evidence for the UWES and the JES, with the
intention of determining whether one might be a better measure than the other in capturing the
construct domain or simply determining if they are different at all, I have selected the criterion
available in the archival data set used for this study; specifically, perceived stress, and job and
organizational tenure.
Using stress as a criterion may provide insight into similarities and differences between
the UWES and JES, since the UWES was originally conceived from the MBI (Maslach & Leiter,
1997), which is a stress-based measure. A substantial portion of the literature on engagement
using the UWES as the measurement instrument has been based in the stress literature (see van
Doornen, Houtveen, Langelaan, Bakker, van Rhenen, & Schaufeli, 2009; Zhang, Gan, & Cham,
2007), and demonstrated that scores on the UWES are related to stress outcomes, such as
burnout and physical stress symptoms. In contrast, the JES was based on a conceptualization of
15
engagement that had no direct relationship to stress. Therefore, it is anticipated that the
concurrent validity evidence (criterion and predictor collected at the same time) will demonstrate
that the UWES is better than the JES for predicting stress-related outcomes.
Hypothesis 4: The UWES will have a stronger relationship with stress outcomes than the
JES.
Job tenure and organizational tenure are generally used as correlates of engagement (see
Kamalanabhan, Sai, & Mayuri, 2009) and not used as criteria, per se; however, they are still
helpful in determining if the two engagement measures are similar. Specifically, if both the
UWES and JES assess job engagement comparably, they should both correlate similarly (i.e.,
same direction and magnitude) with job and organizational tenure.
Additionally, to evaluate whether one measure outperforms the other in relating to the
criteria chosen for this study, I used dominance analysis to compare the importance of predictors
for one or more outcomes. Dominance analysis is a statistical technique for comparing the
relative importance of predictors in multiple regression. Dominance analysis is used in
conjunction with regression analysis to compare and rank order the relative important of
predictor variables (Budescu, 1993). The technique works by comparing the amount of added
variance explained by each variable across all subset models (Azen & Budescu 2003; Budescu,
1993). Such an analysis is particularly informative when ordering of predictors cannot be
hypothesized a priori from theory (Johnson & LeBreton, 2004). Results from this analysis will
show whether the UWES outperforms the JES, or vice-versa, in relating to the outcomes of
interest. Thus, the results of this analysis contribute to the criterion-related validity evidence for
each measure, while also satisfying the objectives of this study. Because there is no theory or
evidence suggesting one of the measures is better than the other in predicting job and
16
organizational tenure, I offer the following as a research question:
Research Question 1: Will the UWES outperform the JES in predicting job tenure and
organizational tenure?
Method
Participants and Procedures
The archival data set, comprised of two samples, used for this study was collected by
undergraduate psychology students for class credit in 2009 and 2010. Students were instructed to
recruit five adults working at least part-time (20 hours or more per week). Students were
supervised during the recruitment process and used scripts approved by the human subjects
review board. Half of the recruits were randomly called to ensure that students followed the
protocol. The recruitment efforts resulted in a data set consisting of 297 adult participants who
worked at least part-time. Participants voluntarily completed a secure web-based survey; no
incentives were offered.
The second data set was collected almost identically, the main difference being that the
collection was temporally separated across two surveys, two weeks apart. The recruit efforts
resulted in a data set consisting of 173 adult participants who worked at least part-time. The data
sets were then combined for a total of 470 participants. Participants were mostly female (56.5%),
Caucasian (90.0%), and reported a mean age of 39.5 years old with a standard deviation of 14.1
years. The data sets were combined because structural invariance was expected. The methods,
sample collection, and scales used across both studies were all very similar.
Job Engagement Scale
The job engagement scale was developed by Rich et al. (2010) based on Kahn’s (1990)
definition of employee engagement and its three dimensions: physical, cognitive, and emotional
17
engagement. Each dimension is represented by six questions. Participants rated their levels of
employee engagement on a 5-point Likert scale (1 = Strongly Disagree to 5 = Strongly Agree).
Example items include: “I work with intensity on my job” (physical), “I am enthusiastic about
my job” (emotional), and “At work, my mind focuses on my job" (cognitive).
Utrecht Work Engagement Scale
The Utrecht Work Engagement Scale was developed by Schaufeli et al. (2002)
originating as the opposite of the MBI (Maslach et al., 1997). The UWES assesses three
dimensions: vigor, dedication, and absorption. There are six questions for vigor and absorption
and five questions for dedication, creating a total of 17 questions. Participants rated their levels
of employee engagement on a 7-point Likert scale (0 = Never to 6 = Always/Every day).
Example items include: “At my work I feel bursting with energy” (vigor), “I find the work I do
full of meaning and purpose” (dedication), and “Time flies when I’m working” (absorption).
Stress
The Perceived Stress Scale (PSS) consisting of ten items was developed by Cohen,
Kamarck, and Mermelstein (1983). Participants rated their perceived stress on a 5-point Likert
scale (0 = Never to 4 = Always/Every day). Example items include: “been upset because of
something that happened unexpectedly” and “felt that you were on top of things” (reverse
coded).
Affect
Affectivity, both positive and negative, was measured using a 20-item scale developed by
Watson, Clark, and Tellegen (1988). The scale contains words that describe different emotions.
Participants are asked to rate the extent to which they feel these emotions (1 = Very Slightly to 5
18
= Extremely). Sample items include: “interested” (positive affect) and “distressed” (negative
affect).
Demographics
Demographic information for the sample included gender, race, and age. Additionally, job
tenure and organizational tenure (in years) were collected as single-item measures (i.e., “what is
your job/organizational tenure in years”).
Data Analysis
Two main statistical analyses were conducted to compare the UWES and the JES. First, a
confirmatory factor analysis was conducted using M-Plus (Muthén & Muthén, 2007). For all
CFAs, there are several different rules of thumb for what constitutes poor or good fit. The
proposed models were assessed using a variety of fit indices including the chi-square statistic,
comparative fit index (CFI), Tucker-Lewis index (TLI), and the root-mean square error of
approximation (RMSEA). Non-significant chi-square values constitute a good fit; however,
because of the sensitivity to sample size, the chi-square statistic is typically significant for large
samples such as this one. Hence, the use of additional fit indices. According to Hu and Bentler
(1998), a cutoff score of .95 or above is recommended for maximum likelihood-based fit indices
such as those used here (the CFI and TLI), and a cutoff value of .06 or less is recommended for
the RMSEA. The authors do caution, however, that it is difficult to designate a specific cutoff
score for each fit index since they function differently based on different model parameters.
Therefore, they recommend that the strict use of rules of thumb is not as important as a reporting
a wide variety of fit indices (Hu & Bentler, 1998; Hayduk, Cummings, Boadu, Pazderka-
Robinson, & Boulianne, 2007).
19
Additionally, in comparing models, one must consider the idea of nested models. A model
is nested when it contains the same number of parameters as the comparison model, but the set of
paths within one model is a subset of the other. Thus, one or more parameters that are freely
estimated in one model are constrained in the other. The change in chi-square (∆χ2∆df) is used
for determining comparative fit of nested models (Hu & Bentler, 1998). Non-nested models of
the JES and UWES cannot be compared using the change in chi-square statistic. The Bayes
information criterion (BIC: Raftery, 1993) is used for this purpose, where lower values indicate a
better fit. If there is no difference in BICs across models (less than 6 points), one favors the
model that is more parsimonious.
Dominance analysis was used to inform the criterion-related validity of the two measures,
assessing whether one is better or worse than the other, or if the scales are the same at predicting
job tenure, organizational tenure, and perceived stress. Dominance analysis was run using
methods described in Azen and Budescu (2003) and Budescu (1993).
Results
Descriptive statistics and overall correlations are shown in Table 1. Table 2 includes
correlations between the JES and UWES subscales and study variables. Examination of the
Pearson correlations in Table 2 provides some initial evidence for both convergent and
discriminant validity. For example, for discriminant validity, there was no relationship between
either the JES or UWES and gender. There were low to moderate correlations between the
measures of engagement and age. For convergent validity, it was expected that positive affect
would have a mild to moderate positive relationship with both the UWES and the JES. This was
confirmed with positive affect being related significantly to both the JES and the UWES. The
higher correlations between the JES and UWES and positive affect, as compared visually to their
20
correlations with negative affect were anticipated, given that positive affect is incorporated in
both conceptualizations of engagement. The JES and UWES were strongly correlated with each
other (Table 1 & 2), suggesting that even though they are based on different theoretical
backgrounds, they are both still assessing a similar construct.
Turning to the sub-scales, they were only moderately related as hypothesized (shown in
Table 2). The moderate correlations between physical and vigor (r = .51), emotional and
absorption (r = .57), and cognitive and dedication (r = .56) subscales of the UWES and JES
demonstrate that the two conceptualizations are similar yet still distinct.
All factor analyses were run using MPlus (Muthén & Muthén, 2007). To test the factor
structure of the measures as originally hypothesized by their respective scale authors (Model 1,
Figure 1), a three-factor model was tested for both the JES and the UWES. In their initial study
of the JES, Rich et al. (2010) found that the three-factor solution fit better than a one-factor
solution, but that the one-factor solution also demonstrated acceptable fit. For the UWES, both a
one-factor structure and a three-factor structure have also been reported. For this study,
acceptable fit will be defined as a model having a CFI greater than or equal to .90. The results in
this study show that for the JES, the three-factor solution fit much better than the one-factor
solution as evidenced by the CFI and ∆χ2 (see Table 3). These results offer strong support for the
three-factor engagement model. For the UWES, the three-factor solution fit similarly to the one
factor solution as evidenced by the fit indices (shown in Table 3). It should be noted that the fit
of the three-factor solution is less adequate than usually reported for the UWES (see Schaufeli et
al., 2002; Salanova & Schaufeli, 2008). That is, other studies have reported higher CFIs and
lower RMSEAs. Overall, the fit of many models was below acceptable. Even though low
residuals and high factor loadings for both the UWES and the JES indicate that there may not be
21
problems with individual items for either measure, because of their less than outstanding fit and
in particular the higher than desired RMSEAs, I examined their discrepancy matrices.
The discrepancy matrices were examined for the three-factor solution for both the JES
and the UWES (see Table 4 for JES; see Table 5 for UWES). Discrepancy matrices provide
information as to whether items are more related to, or less related to, other items than expected.
Generally, items that have high or low values in clusters point to possible problems. Items with
values greater than .1 or less than -.1 are potentially problematic (McDonald, 1999). Problematic
items are then either modified or removed to improve the measure. Results for the JES indicate
that only item 4 should potentially be removed, “I try my hardest to perform well on my job.” It
had three large discrepancies with other items. Results for the UWES suggest that item number
1, “At my work, I feel bursting with energy,” and item number 16, “It is difficult to detach
myself from my job,” should be removed. These items all had two to three large discrepancies.
Determining discrepancies is analyzed by looking for clusters of greater than .1 or less than -.1,
indicating that the item is over or under related to numerous other items. If an item has large
discrepancies with several other items it means the item is not relating to the others in the way
the model predicts.
Looking closely at the discrepancy matrices (Table 4 and Table 5), there are some other
items that future researchers may want to consider for modification. For the JES, item 10, “I am
proud of my job” (emotional), is correlated greater than .1 with items 4 and 5 (both from the
physical subscale). Although intuitively the concept of pride does not seem related to the
physical subscale, if future samples replicate these large discrepancies, it may be worth
examining and editing these items. For the UWES, item 13, “To me, my job is challenging”
(dedication) needs further examination because it is positively related to both item 14 and item
22
16 (both from the absorption subscale). This relationship is not expected since the subscales are
purported to assess distinct subcomponents of engagement.
CFAs on the proposed alternative models comparing the JES and UWES were conducted
(see Table 6). The fit of model 2 (Figure 2), where all items from both scales are combined to
load on a single factor of engagement, was particularly poor. This poor fit, evidence by
inadequate fit indices, is a good indicator that the JES and UWES are measuring constructs that
are not identical. This finding offered support for Hypothesis 1.
Next, model 3 was tested (Figure 3). Although the fit was also not good (Table 6), this
model showed an improvement over the one-factor solution as evidenced by the increase in the
CFI and TLI and decrease in RMSEA and BIC. This lack of fit also offers some evidence that the
two scales are distinct and not capturing the exact same aspect of the construct domain, offering
support for Hypothesis 2.
Model 4 (Figure 4) showed similar fit indices as the two-factor solution (shown in Table
6). These results offer evidence that the two scales, UWES and JES, are structured similarly.
However, the poor overall fit as demonstrated by less than ideal fit indices suggests the two
scales are not identical or similar enough to be interchangeable. These results show support for
Hypothesis 3, with model 4 being the best fitting alternative model, albeit not the best fitting
overall.
Results of dominance analysis (shown in Table 7), which compares the predictive
capability of each measure, showed that the UWES outperformed the JES in predicting all
outcomes, though the variance in job and organizational tenure explained by the JES or UWES
was very minimal (i.e., 1% to 2%). Neither the JES nor the UWES provided strong criterion-
related evidence, with both predictors combined only accounting for 8.8%, 1.9%, and 1.5% of
23
the variance in stress, job tenure, and organizational tenure, respectively. As hypothesized, the
dominance weight favored the UWES (76.14%) over the JES (23.86%) for predicting stress.
Interestingly, dominance weights also favored the UWES over the JES in predicting job and
organizational tenure (65.79% over 24.21%, and 73.33% over 26.67%, respectively).
Discussion
Using correlation matrices, confirmatory factor analysis, and dominance analyses, this
study shows that the two measures of engagement, JES and UWES, were similar, yet also varied
in many different aspects, suggesting that they capture slightly different conceptualizations of the
same engagement construct. One of the ways in which the UWES and the JES differed was in
the factor structure of the two scales. Both the JES and the UWES factored as described by Rich
et al. (2010) and Schaufeli et al. (2002), respectively. Overall, this study sample indicates that the
JES, developed based on Kahn’s (1990) conceptualization of engagement, confirms the factor
structure proposed by Rich et al. in their original study. An examination of the discrepancy
matrix for the JES indicated that improvements to the JES could be made that would potentially
strengthen the overall structure of the measure. The UWES factored best, though not ideally, into
three factors as previously hypothesized and shown by Schaufeli et al. (2002). This is not the
first time that the UWES demonstrated less than desirable fit for its proposed model (for
example, see Storm & Rothman, 2003). Additionally, the factor analysis and discrepancy
analysis for the UWES using the current study sample suggests that there may be some item-
level problems that could be addressed, potentially resulting in a better factor structure and
hence, a cleaner assessment of the construct. For example, an examination of the discrepancy
matrix revealed several items that could be removed or modified to improve the distinctiveness
of the three subscales from one another.
24
In addition to comparing and contrasting the JES and UWES, this study also adds to the
divergent and convergent validity evidence for both measures. For example, as expected gender
was not correlated with either the JES or UWES, and positive affect was correlated moderately
with both. Additionally, negative affect had a small to moderate negative correlation with both
measures. Interestingly, there was a small but significant correlation between age and
engagement. Though both the UWES and the JES were related to age, the UWES had a bigger
correlation to age than did the JES. Although age being related to engagement is not unheard of
(James, McKechnie, & Swanberg, 2011; Avery, McKay, & Wilson, 2007), there is very little
research in the area. Another interpretation of the findings is that the UWES captures a slightly
different interpretation of engagement than does the JES, one that suggests engagement changes
as we age. Exploring possible differences in engagement between ages and the implications of
those differences could be a direction for future engagement research.
In addition to examining construct validity and factor structure, criterion-related validity
was also an important part of this study. I sought to evaluate whether either the JES or the UWES
could account for more variance than the other in stress, job tenure, or organizational tenure. As
hypothesized, the UWES was a better predictor of stress than the JES. Unexpected was that the
UWES was also better at predicting job and organizational tenure in terms of variance explained.
These findings could be explained by the relationship between the UWES and stress; tenure is
related to stress and therefore the UWES may better predict tenure because of this stronger
relationship with stress as compared to the JES. Future research should examine other outcome
variables to extend this study’s findings for criterion-related validity.
Finally, I proposed and answered several questions regarding the overall concept of
engagement as theorized by both Rich et al. (2010) and Schaufeli et al. (2002). The first question
25
was whether or not both the JES and the UWES combined were really measuring one overall
construct of engagement. The findings did not support this supposition and lead to several
possible conclusions. First, the UWES and JES simply offer different conceptualizations of
employee engagement and therefore combining them results in two different concepts stuck
together. Second, because of the diverse theoretical backgrounds of the two scales, the items
written for the scales are different enough that fitting engagement to a single higher order
construct would be challenging using these items. For example, the UWES uses a frequency
Likert scale (i.e., a every day, a few times a week), whereas the JES measures level of
endorsement (i.e., strongly agree, agree). These different response scales capture different ideas
of what it means to be engaged – either it is something that is done frequently or it is like an
attitude or opinion. Furthermore, there is a difference in language between the two scales. For
example, the JES has the item, “I feel energetic about my job,” whereas the UWES has the item,
“at my work, I feel bursting with energy.” Though the items capture the same sentiment, the
language of the item for the UWES is more direct and expressive. As a result, the respondents
might more strongly endorse the UWES item over the JES item even if they had the same level
of energy. Thus, the UWES may capture a more explosive feeling of engagement, whereas the
JES captures a more subtle feeling of engagement. Because of these differences, one can
conclude that a single factor conceptualization using either the JES or the UWES, or a
combination of the two, would be hard to produce without significant changes to the items or
theory behind one or both of the scales.
The second question I sought to answer was whether engagement could be
conceptualized as being made up of two separate factors, the JES and the UWES, each capturing
a unique part of an overall engagement construct. Though results supported this model as more
26
plausible than the single factor model, overall it was still not the best representation of the data
for this sample. These results, however, do provide evidence that the UWES and the JES assess
engagement differently, and that each captures unique pieces to the construct of engagement, in
addition to having some overlap. For example, “vigor” from the UWES and “physical” from the
JES were strongly related and most likely both explain some of the same variance. However, the
other subscales were not as closely related, and thus they may explain unique variance in the
model.
The last question proposed was whether the subscales from both of the measures could be
combined to form a factor of affect, behavior, and cognition. The results suggest that the models
have many similarities, in addition to the previously found differences. Model fit indicated that
the subscales between the two measures (e.g., vigor related to physical) were related at least
modestly, as hypothesized. The implications of these findings are that both the UWES and the
JES contribute unique theoretical contributions to the study of engagement, despite their
commonalities. That is, though they are capturing the engagement construct differently, they
each capture three components: an affective component, a behavioral or physical component, and
a cognitively based component.
Overall, the UWES did not hold up quite as well as the JES in a comparison of
psychometric properties (i.e., factor structure); however, the UWES did outperform the JES in
prediction of outcomes. Although counterintuitive, psychometric quality and criterion-related
validity are not always related. Since factor analysis is the process of explaining data, a stronger
factor structure and better psychometric properties indicates the chosen model for the JES had
acceptable fit with this data set while the chosen model for the UWES did not. The difference in
predicting outcomes is based on how closely related these conceptualizations are to the outcomes
27
of interest (stress, job tenure, and organizational tenure). The UWES was more strongly related
to these outcomes, and the differences in psychometric fit were not pronounced enough to affect
the relationship. The implication of these findings, therefore, is that the UWES is capturing a
conceptualization of engagement that is strongly tied to stress, which studies have shown is
strongly related to tenure. The JES, in contrast, captures a conceptualization of engagement that
is not inherently tied to stress or tenure. The results of this study confirm that researchers
conceptually associating the UWES with stress models are not in the wrong.
Strengths and Limitations
A strength of this study is the large data set that includes participants from a wide range
of professions and industries. On one hand, the diversity of participants can be considered a
strength. On the other hand, that the participants came from a range of organizations could be a
limitation in that there may be differences in the participants for which this study cannot account
(e.g., differences in organizational experiences). However, given that the object of this study was
to compare the UWES and the JES without constraints of organizational culture, the sample used
here can be considered a strength.
Another strength of the study is the rigorous analyses of the two measures. The factor
structure of both the JES and the UWES was analyzed, comparing a number of alternative
models in a manner that goes above and beyond previous employee engagement studies (e.g., the
inclusion of discrepancy and dominance analyses). Past studies generally assumed the originally
hypothesized factor structure of the measures, in particular the UWES (see Schaufeli et al., 2002;
Schaufeli & Salanova, 2007; Salanova & Schaufeli, 2008). I sought to advance the literature and
explore other possible configurations of employee engagement, thereby providing a deeper
understanding of the two measures, in particular the UWES, than previously available.
28
Limitations of this study are related to the use of archival data. First, there were only a
few different constructs with which to examine discriminant and convergent validity evidence.
Second, this same limitation applies to obtaining criterion-related validity, as there were only
three suitable criterion variables available. Additionally, two of the criteria were assessed with
single-item measures, and single-item measures have been criticized for psychometric
deficiencies (Nunnally & Bernstein, 1994). However, job and organizational tenure are
demographic variables and tend to be assessed with single-item questions. Hence, this study is
similar to many others that use job and organizational tenure as outcomes.
Theoretical and Practical Contributions
This study contributes to both theory and practice. First, this study examines both the JES
and the UWES side by side using a large diverse sample to examine the factor structure of both
the measures. Analysis of the discrepancy matrices suggest that both measures, but the UWES in
particular, may need some work at the item level. Taking the results of the discrepancy matrices
together with examining both scales in a similar manner using a different sample could offer
guidance into how to best adjust these scales and their items. Although the UWES has been
examined over many different samples, discrepancy matrices have not been provided in any of
the previously published psychometric work.
This study further contributes to theory by showing that the construct of employee
engagement still has plenty of room for discovery and improvement. Although both measures
had good fit and explained different criterion (to an extent), neither demonstrated excellent fit to
the data. This means that participants view engagement a little differently than how the measures
suggest they should view engagement. Despite the differences these two scales have from each
other, they are correlated at the scale, factor, and item level. Given that each measure was based
29
on a different theoretical framework, it is revealing that the two measures are indeed highly
correlated. This suggests that although their conceptualizations of engagement seem different,
they are actually have some similarities as well. The study findings further suggest that
researchers can discuss at a theoretical level engagement as a three component construct
comprised of an affect, physical/behavior, and cognitive component. However, the model did still
have poor fit overall. further studying the similarities and differences of these scales at the
criterion level, researchers could determine more precisely which measure is more appropriate
for any given research question or practical application, or devise a single measure that captures
the uniqueness of the UWES and JES that captures their core similarities, removing the need for
two measures.
Future Research
Future research exploring the similarities and differences between these engagement
scales should first seek to expand upon this study by examining more variables for both
criterion-related and construct-related validity evidence. For example, performance,
organizational citizenship behaviors, and burnout measures could all provide insight into how
these measures perform in different situations. Though these criteria have been studied for each
scale separately, they have not been studied with both measures as independent variables to see
where any shared variance lies. Evaluating strong criterion-related evidence for the UWES and
JES simultaneously would further support an evaluation of the appropriateness of using either or
both scales. A good starting point would be picking variables that are theoretical related to the
different conceptualizations of engagement as defined by the JES and UWES.
Future research could also examine other measures of engagement (i.e., Saks, 2006). By
comparing another measure that purports to measure engagement to the JES and UWES,
30
researchers could create a clearer picture of how other conceptualizations of engagement are
possibly related to the JES and UWES conceptualizations. Creating a clear understanding of the
measured constructs of engagement contributes to both science and practice. If the current scales
all function mostly equivalently, then choosing a scale would be a matter of preference; however,
if the scales capture different components of engagement, then using the most appropriate
measure would make more sense.
Conclusion
Given the lack of information about how the different engagement measures relate to one
another, specifically the JES and UWES, the goal of the current study was to explore and
identify the similarities, differences, strengths, and weaknesses of the JES and the UWES. By
exploring engagement as assessed with these measures and how they are related, the findings of
this study serves as a preliminary guide as to when one scale is more appropriate or useful than
the other. The results suggest that the UWES has less psychometric strength than the JES,
however, it is more strongly related to stress-related criterion than the JES. Researchers are
encouraged to replicate the findings and extend them in future research.
31
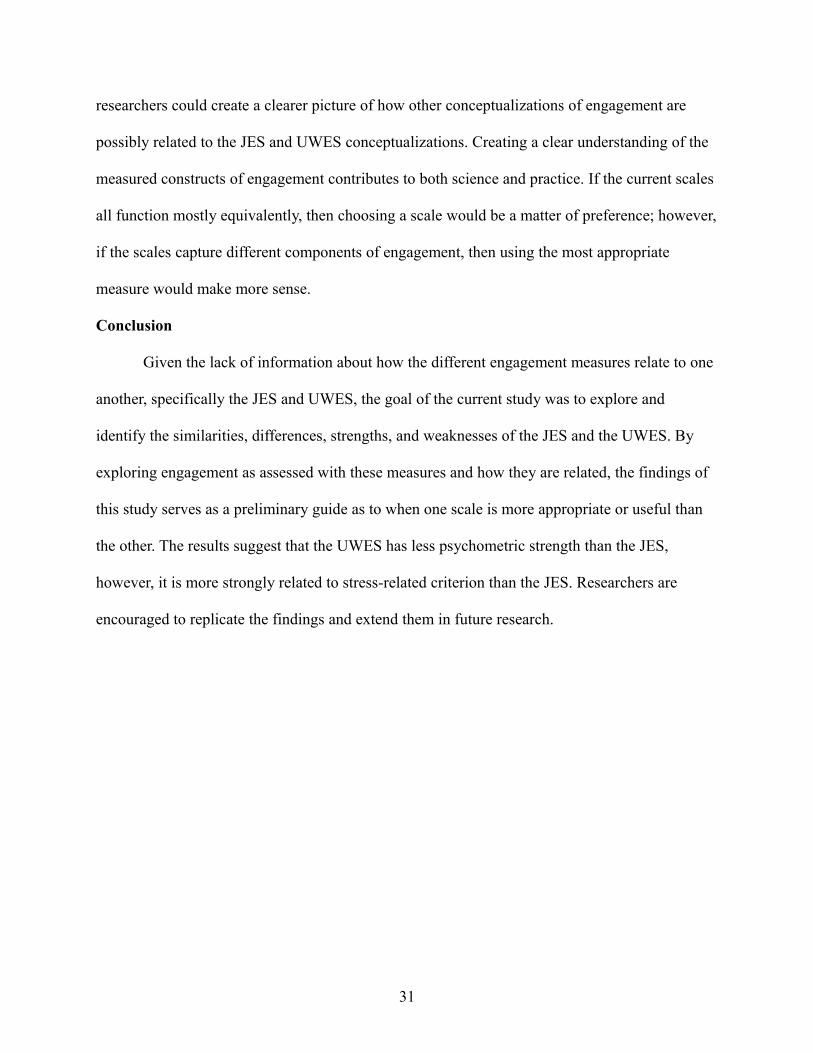
JES (Rich, LePine, & Crawford, 2010)
Strongly Disagree
DisagreeNeither Agree nor Disagree
Agree Strongly Agree
1 2 3 4 5
1. I work with intensity on my job. (physical)2. I exert my full effort to my job. (physical)3. I devote a lot of energy to my job. (physical)4. I try my hardest to perform well on my job. (physical)5. I strive as hard as I can to complete my job. (physical)6. I exert a lot of energy on my job. (physical)7. I am enthusiastic about my job. (emotional)8. I feel energetic about my job. (emotional)9. I am interested in my job. (emotional)10. I am proud of my job. (emotional)11. I feel positive about my job. (emotional)12. I am excited about my job. (emotional)13. At work, my mind is focused on my job. (cognitive)14. At work, I pay a lot of attention to my job. (cognitive)15. At work, I concentrate on my job. (cognitive)16. At work, I focus a great deal of attention on my job. (cognitive)17. At work, I am absorbed in my job. (cognitive)18. At work, I devote a lot of attention to my job. (cognitive)
32
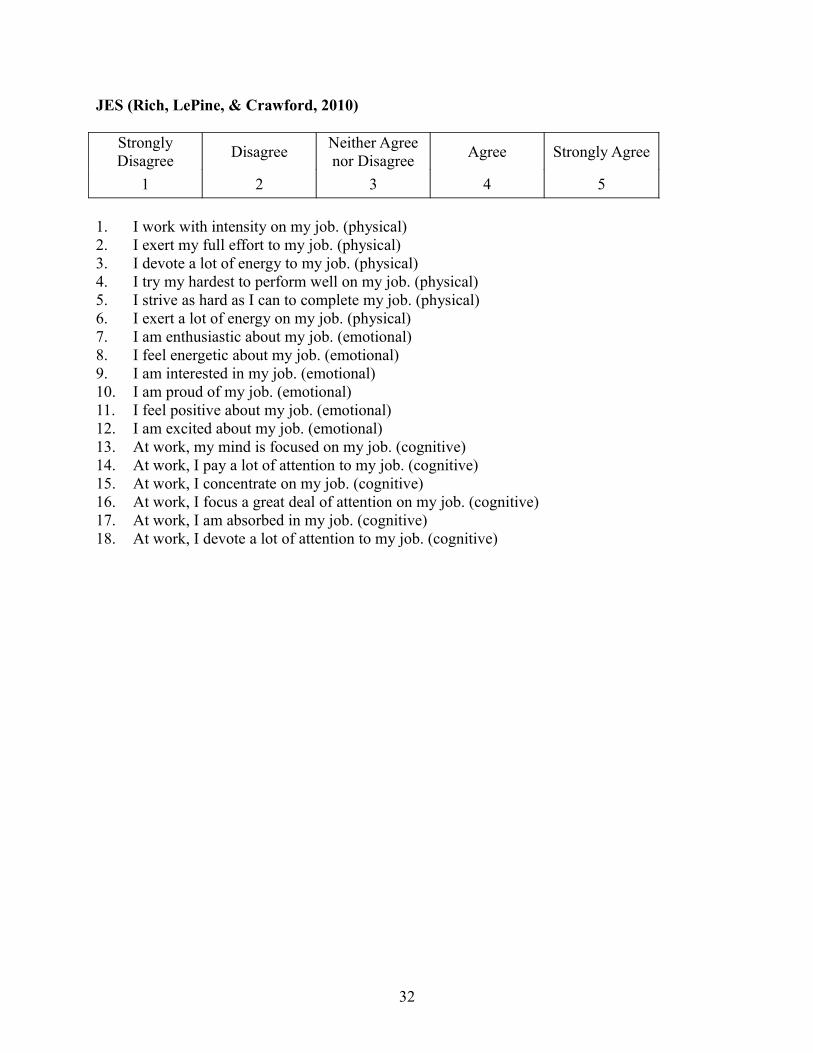
UWES (Schaufeli & Bakker, 2003)
The following 17 statements are about how you feel at work. Please read each statement carefully and decide if you ever feel this way about your job. If you have never had this feeling, cross the “0” (zero) in the space after the statement. If you have had this feeling, indicate how often you feel it by crossing the number (from 1 to 6) that best describes how frequently you feel that way.
Almost never Rarely Sometimes Often Very often Always
0 1 2 3 4 5 6
Never A few times a year or less
Once a month or
less
A few times a month
Once a week
A few times a week
Every day
1. At my work, I feel bursting with energy. (vigor)2. I find the work that I do full of meaning and purpose. (dedication)3. Time flies when I’m working. (absorption)4. At my job, I feel strong and vigorous. (vigor)5. I am enthusiastic about my job. (dedication)6. When I am working, I forget everything else around me. (absorption)7. My job inspires me. (dedication)8. When I get up in the morning, I feel like going to work. (vigor)9. I feel happy when I am working intensely. (absorption)10. I am proud of the work that I do. (dedication)11. I am immersed in my work. (absorption)12. I can continue working for very long periods at a time. (vigor)13. To me, my job is challenging. (dedication)14. I get carried away when I’m working. (absorption)15. At my job, I am very resilient, mentally. (vigor)16. It is difficult to detach myself from my job. (absorption)17. At my work I always persevere, even when things do not go well. (vigor)
33

Perceived Stress Scale (Cohen, Kamarck, & Mermelstein, 1983)
The questions in this scale ask you about your feelings and thoughts during the last month. In each case, you will be asked to indicate by circling how often you felt or thought a certain way.
Never Almost Never Sometimes Fairly Often Very Often
0 1 2 3 4
1. In the last month, how often have you been upset because of something that happened unexpectedly?
2. In the last month, how often have you felt that you were unable to control the important things in your life?
3. In the last month, how often have you felt nervous and “stressed”?4. In the last month, how often have you felt confident about your ability to handle your
personal problems?5. In the last month, how often have you felt that things were going your way?6. In the last month, how often have you found that you could not cope with all the things that
you had to do?7. In the last month, how often have you been able to control irritations in your life?8. In the last month, how often have you felt that you were on top of things?9. In the last month, how often have you been angered because of things that were outside of
your control?10.
In the last month, how often have you felt difficulties were piling up so high that you could not overcome them?
34
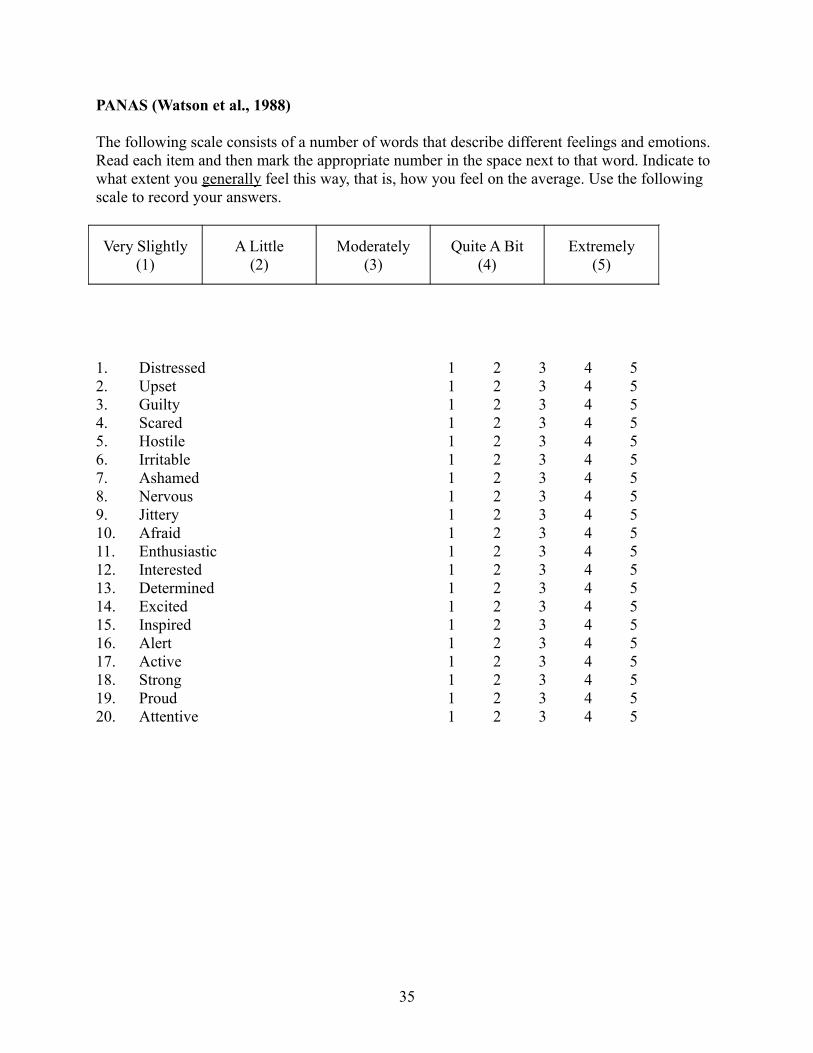
PANAS (Watson et al., 1988)
The following scale consists of a number of words that describe different feelings and emotions. Read each item and then mark the appropriate number in the space next to that word. Indicate to what extent you generally feel this way, that is, how you feel on the average. Use the following scale to record your answers.
1. Distressed 1 2 3 4 52. Upset 1 2 3 4 53. Guilty 1 2 3 4 54. Scared 1 2 3 4 55. Hostile 1 2 3 4 56. Irritable 1 2 3 4 57. Ashamed 1 2 3 4 58. Nervous 1 2 3 4 59. Jittery 1 2 3 4 510. Afraid 1 2 3 4 511. Enthusiastic 1 2 3 4 512. Interested 1 2 3 4 513. Determined 1 2 3 4 514. Excited 1 2 3 4 515. Inspired 1 2 3 4 516. Alert 1 2 3 4 517. Active 1 2 3 4 518. Strong 1 2 3 4 519. Proud 1 2 3 4 520. Attentive 1 2 3 4 5
35
Very Slightly(1)
A Little(2)
Moderately(3)
Quite A Bit(4)
Extremely(5)
Demographic Variables
1. In what year were you born? (years range from 1915-1995)
2. Gender (M/F)
3. Race a. Hispanic or Latinob. Whitec. Black or African Americand. Native Hawaiian or other Pacific Islandere. Asianf. American Indian or Alaska Nativeg. Two or more races
4. Are you…a. Part-time (at least 20 hrs/wk but less than 40 hrs/wk)b. Full-time (at least 40 hrs/wk)
5. What is your tenure in years…a. With your companyb. In your current job
36
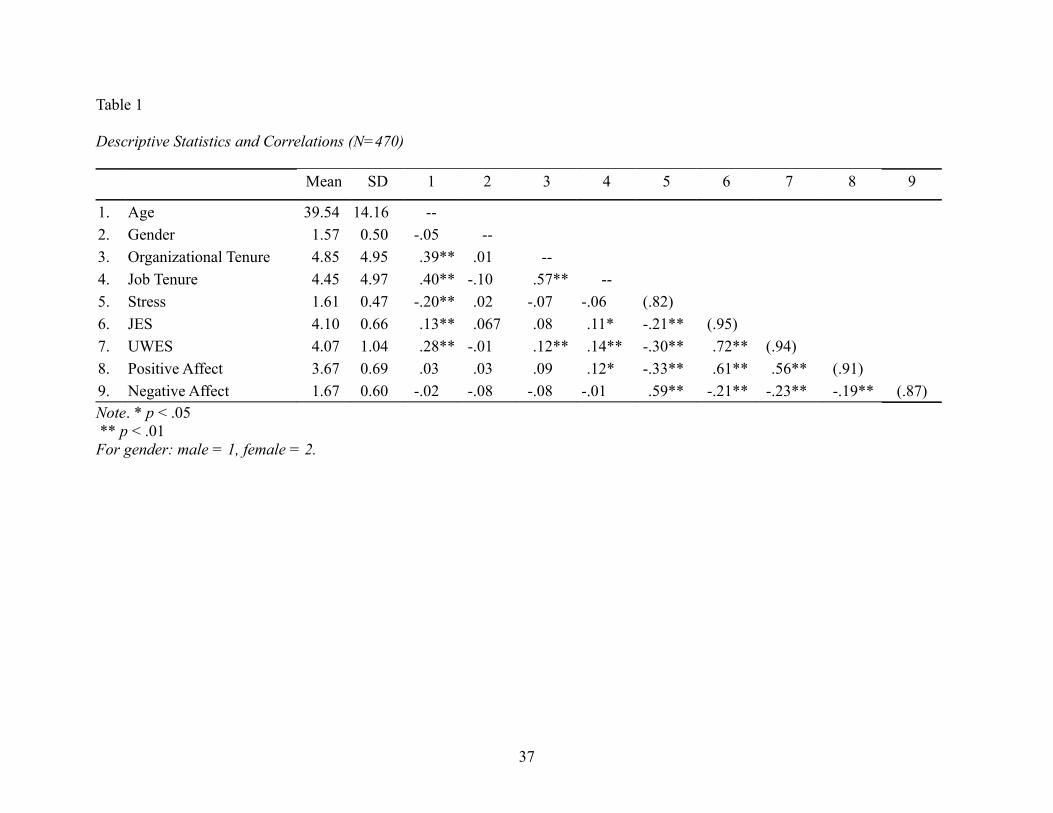
Table 1
Descriptive Statistics and Correlations (N=470)
Mean SD 1 2 3 4 5 6 7 8 9
1. Age 39.54 14.16 --
2. Gender 1.57 0.50 -.05 --
3. Organizational Tenure 4.85 4.95 .39** .01 --
4. Job Tenure 4.45 4.97 .40** -.10 .57** --
5. Stress 1.61 0.47 -.20** .02 -.07 -.06 (.82)
6. JES 4.10 0.66 .13** .067 .08 .11* -.21** (.95)
7. UWES 4.07 1.04 .28** -.01 .12** .14** -.30** .72** (.94)
8. Positive Affect 3.67 0.69 .03 .03 .09 .12* -.33** .61** .56** (.91)
9. Negative Affect 1.67 0.60 -.02 -.08 -.08 -.01 .59** -.21** -.23** -.19** (.87)Note. * p < .05 ** p < .01For gender: male = 1, female = 2.
37
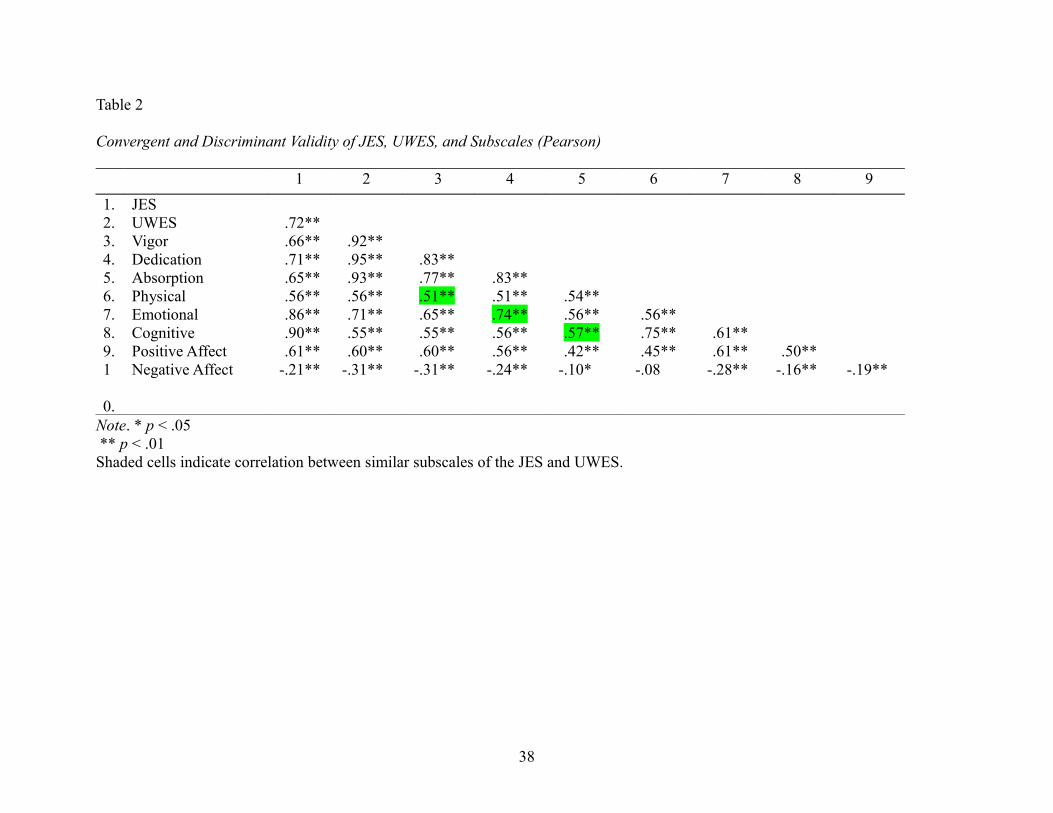
Table 2
Convergent and Discriminant Validity of JES, UWES, and Subscales (Pearson)
1 2 3 4 5 6 7 8 9
1. JES2. UWES .72**3. Vigor .66** .92**4. Dedication .71** .95** .83**5. Absorption .65** .93** .77** .83**6. Physical .56** .56** .51** .51** .54**7. Emotional .86** .71** .65** .74** .56** .56**8. Cognitive .90** .55** .55** .56** .57** .75** .61**9. Positive Affect .61** .60** .60** .56** .42** .45** .61** .50**1
0.
Negative Affect -.21** -.31** -.31** -.24** -.10* -.08 -.28** -.16** -.19**
Note. * p < .05 ** p < .01Shaded cells indicate correlation between similar subscales of the JES and UWES.
38
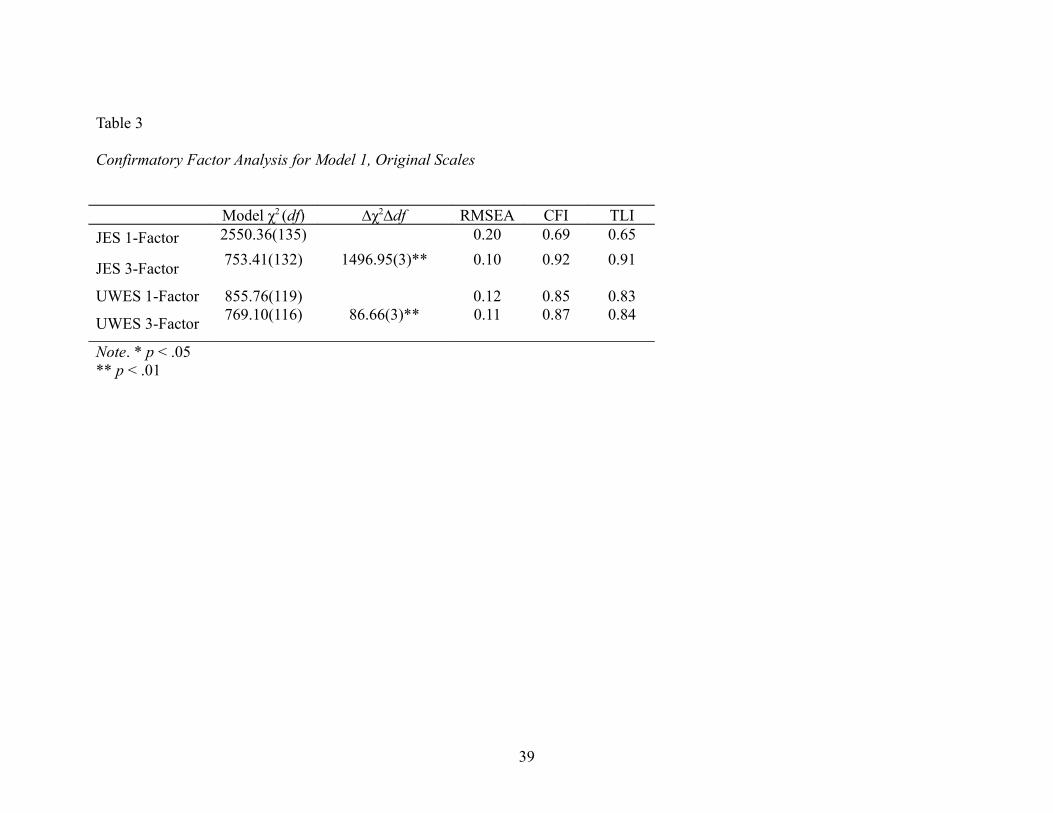
Table 3
Confirmatory Factor Analysis for Model 1, Original Scales
Model χ2 (df) ∆χ2∆df RMSEA CFI TLI
JES 1-Factor 2550.36(135) 0.20 0.69 0.65
JES 3-Factor753.41(132) 1496.95(3)** 0.10 0.92 0.91
UWES 1-Factor 855.76(119) 0.12 0.85 0.83
UWES 3-Factor769.10(116) 86.66(3)** 0.11 0.87 0.84
Note. * p < .05** p < .01
39
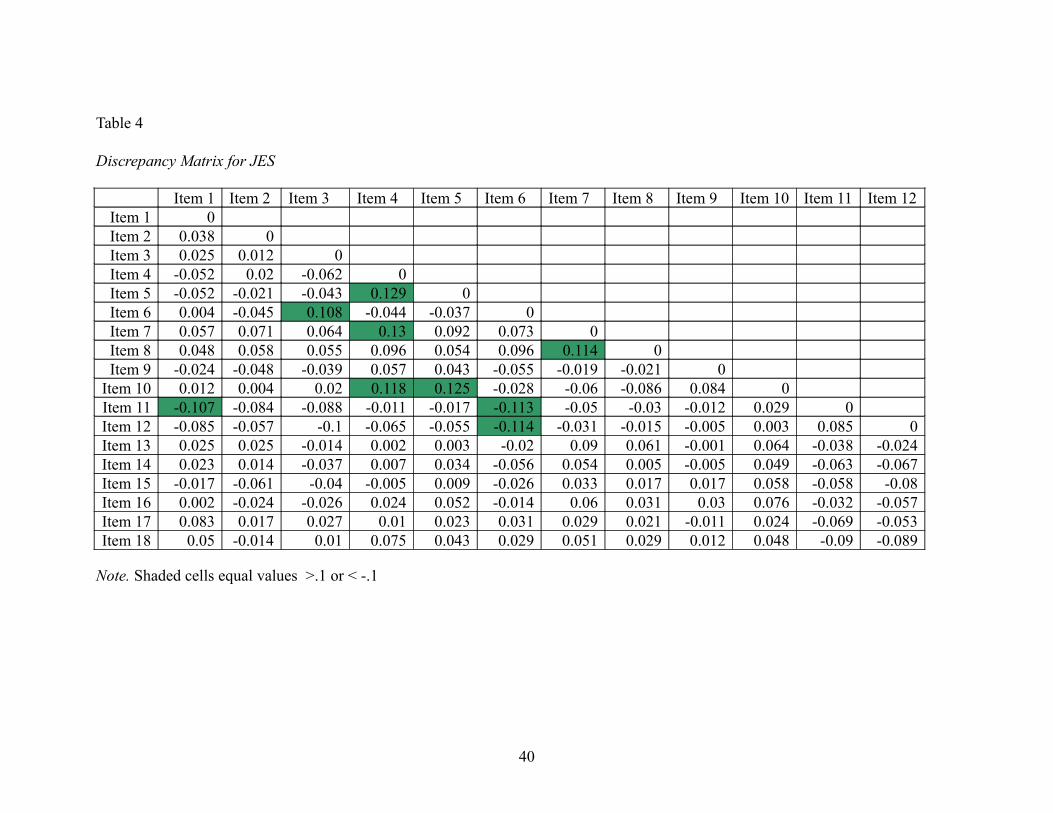
Table 4
Discrepancy Matrix for JES
Item 1 Item 2 Item 3 Item 4 Item 5 Item 6 Item 7 Item 8 Item 9 Item 10 Item 11 Item 12Item 1 0 Item 2 0.038 0 Item 3 0.025 0.012 0 Item 4 -0.052 0.02 -0.062 0 Item 5 -0.052 -0.021 -0.043 0.129 0 Item 6 0.004 -0.045 0.108 -0.044 -0.037 0 Item 7 0.057 0.071 0.064 0.13 0.092 0.073 0 Item 8 0.048 0.058 0.055 0.096 0.054 0.096 0.114 0 Item 9 -0.024 -0.048 -0.039 0.057 0.043 -0.055 -0.019 -0.021 0
Item 10 0.012 0.004 0.02 0.118 0.125 -0.028 -0.06 -0.086 0.084 0 Item 11 -0.107 -0.084 -0.088 -0.011 -0.017 -0.113 -0.05 -0.03 -0.012 0.029 0 Item 12 -0.085 -0.057 -0.1 -0.065 -0.055 -0.114 -0.031 -0.015 -0.005 0.003 0.085 0Item 13 0.025 0.025 -0.014 0.002 0.003 -0.02 0.09 0.061 -0.001 0.064 -0.038 -0.024Item 14 0.023 0.014 -0.037 0.007 0.034 -0.056 0.054 0.005 -0.005 0.049 -0.063 -0.067Item 15 -0.017 -0.061 -0.04 -0.005 0.009 -0.026 0.033 0.017 0.017 0.058 -0.058 -0.08Item 16 0.002 -0.024 -0.026 0.024 0.052 -0.014 0.06 0.031 0.03 0.076 -0.032 -0.057Item 17 0.083 0.017 0.027 0.01 0.023 0.031 0.029 0.021 -0.011 0.024 -0.069 -0.053Item 18 0.05 -0.014 0.01 0.075 0.043 0.029 0.051 0.029 0.012 0.048 -0.09 -0.089
Note. Shaded cells equal values >.1 or < -.1
40
Table 4 (continued)
Discrepancy Matrix for JES
Item 13 Item 14 Item 15 Item 16 Item 17 Item 18Item 1 Item 2 Item 3 Item 4 Item 5 Item 6 Item 7 Item 8 Item 9
Item 10 Item 11 Item 12 Item 13 0 Item 14 0.027 0 Item 15 -0.007 0.012 0 Item 16 -0.023 -0.005 0.022 0 Item 17 0.024 -0.028 -0.023 -0.02 0 Item 18 -0.01 -0.011 -0.019 -0.002 0.076 0
Note. Shaded cells equal values >.1 or < -.1
41
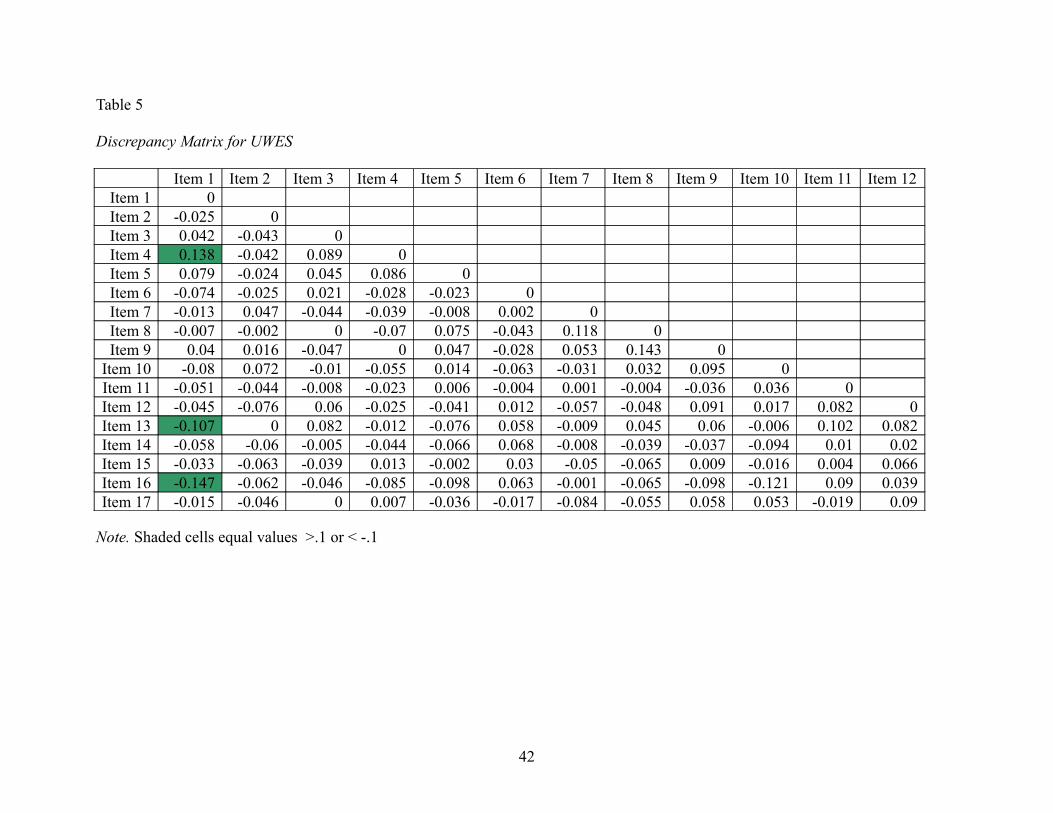
Table 5
Discrepancy Matrix for UWES
Item 1 Item 2 Item 3 Item 4 Item 5 Item 6 Item 7 Item 8 Item 9 Item 10 Item 11 Item 12Item 1 0 Item 2 -0.025 0 Item 3 0.042 -0.043 0 Item 4 0.138 -0.042 0.089 0 Item 5 0.079 -0.024 0.045 0.086 0 Item 6 -0.074 -0.025 0.021 -0.028 -0.023 0 Item 7 -0.013 0.047 -0.044 -0.039 -0.008 0.002 0 Item 8 -0.007 -0.002 0 -0.07 0.075 -0.043 0.118 0 Item 9 0.04 0.016 -0.047 0 0.047 -0.028 0.053 0.143 0
Item 10 -0.08 0.072 -0.01 -0.055 0.014 -0.063 -0.031 0.032 0.095 0 Item 11 -0.051 -0.044 -0.008 -0.023 0.006 -0.004 0.001 -0.004 -0.036 0.036 0 Item 12 -0.045 -0.076 0.06 -0.025 -0.041 0.012 -0.057 -0.048 0.091 0.017 0.082 0Item 13 -0.107 0 0.082 -0.012 -0.076 0.058 -0.009 0.045 0.06 -0.006 0.102 0.082Item 14 -0.058 -0.06 -0.005 -0.044 -0.066 0.068 -0.008 -0.039 -0.037 -0.094 0.01 0.02Item 15 -0.033 -0.063 -0.039 0.013 -0.002 0.03 -0.05 -0.065 0.009 -0.016 0.004 0.066Item 16 -0.147 -0.062 -0.046 -0.085 -0.098 0.063 -0.001 -0.065 -0.098 -0.121 0.09 0.039Item 17 -0.015 -0.046 0 0.007 -0.036 -0.017 -0.084 -0.055 0.058 0.053 -0.019 0.09
Note. Shaded cells equal values >.1 or < -.1
42
Table 5 (continued)
Discrepancy Matrix for UWES
Item 13 Item 14 Item 15 Item 16 Item 17Item 1Item 2 Item 3 Item 4 Item 5 Item 6 Item 7 Item 8 Item 9
Item 10 Item 11 Item 12 Item 13 0 Item 14 0.184 0 Item 15 0.045 0.064 0 Item 16 0.176 0.132 0.01 0 Item 17 -0.023 -0.04 0.216 -0.019 0
Note. Shaded cells equal values >.1 or < -.1
43
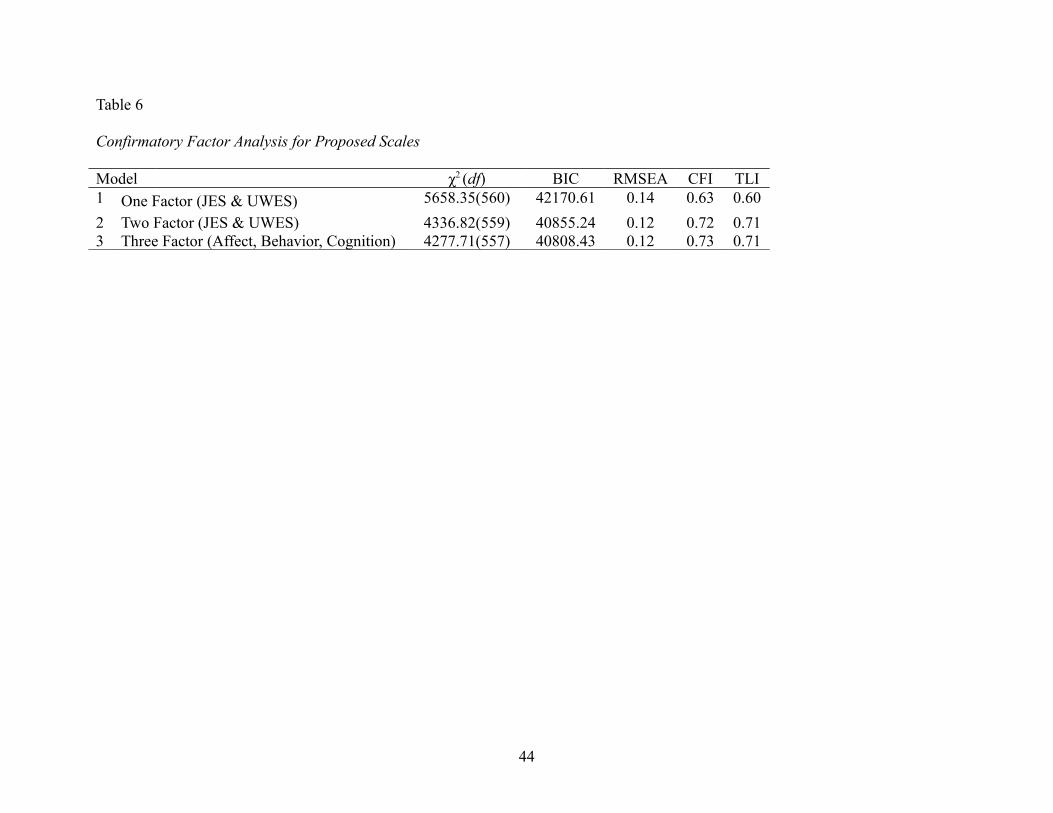
Table 6
Confirmatory Factor Analysis for Proposed Scales
Model χ2 (df) BIC RMSEA CFI TLI1 One Factor (JES & UWES) 5658.35(560) 42170.61 0.14 0.63 0.60
2 Two Factor (JES & UWES) 4336.82(559) 40855.24 0.12 0.72 0.713 Three Factor (Affect, Behavior, Cognition) 4277.71(557) 40808.43 0.12 0.73 0.71
44
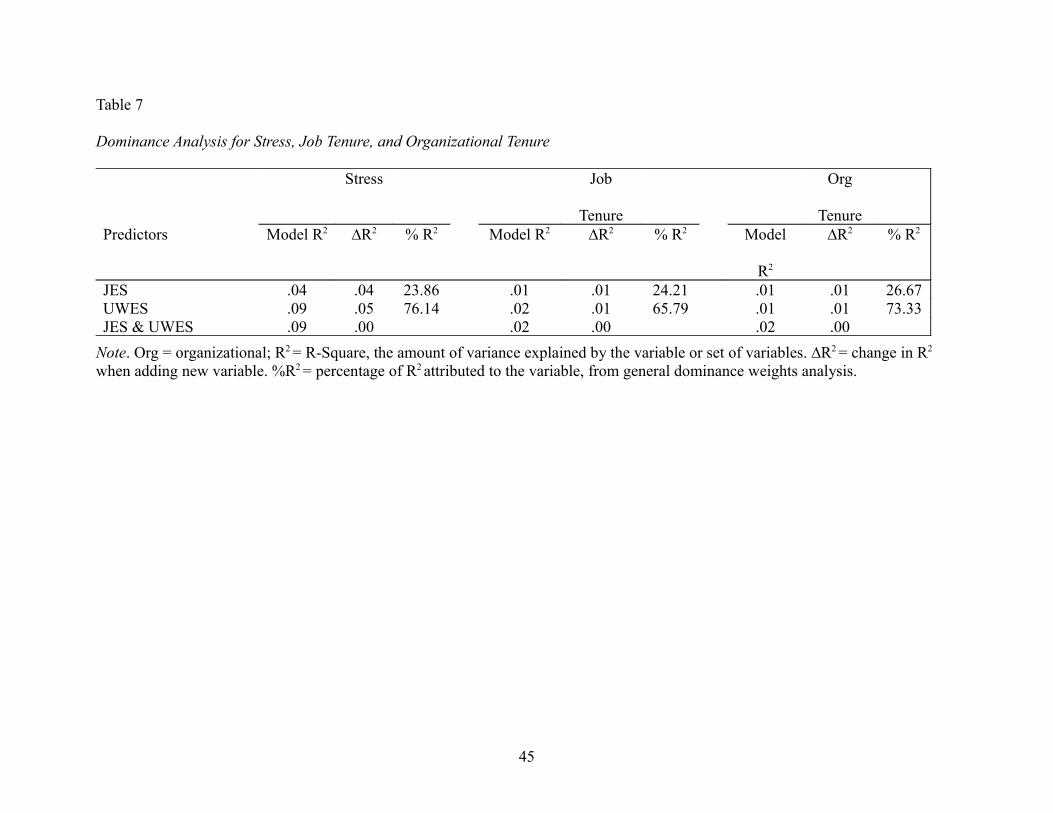
Table 7
Dominance Analysis for Stress, Job Tenure, and Organizational Tenure
Stress Job
Tenure
Org
TenurePredictors Model R2 ∆R2 % R2 Model R2 ∆R2 % R2 Model
R2
∆R2 % R2
JES .04 .04 23.86 .01 .01 24.21 .01 .01 26.67UWES .09 .05 76.14 .02 .01 65.79 .01 .01 73.33JES & UWES .09 .00 .02 .00 .02 .00
Note. Org = organizational; R2 = R-Square, the amount of variance explained by the variable or set of variables. ∆R2 = change in R2
when adding new variable. %R2 = percentage of R2 attributed to the variable, from general dominance weights analysis.
45
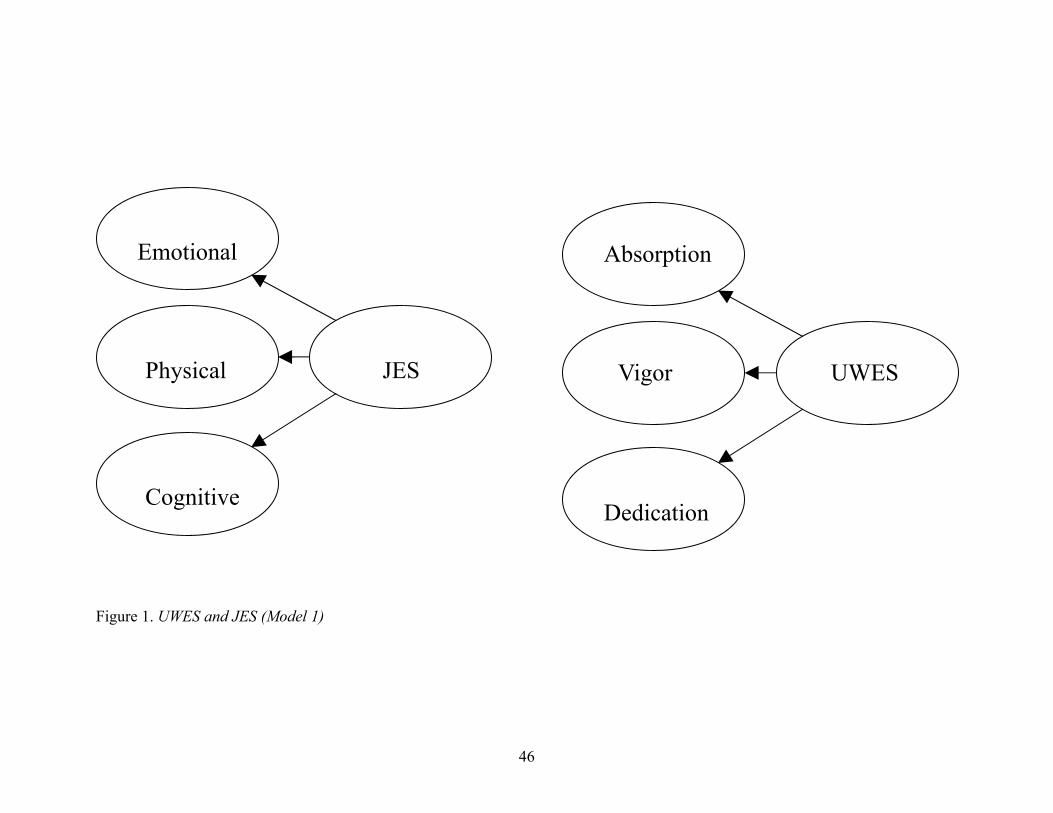
Figure 1. UWES and JES (Model 1)
46
Cognitive
Emotional
Physical JES
Dedication
Absorption
Vigor UWES
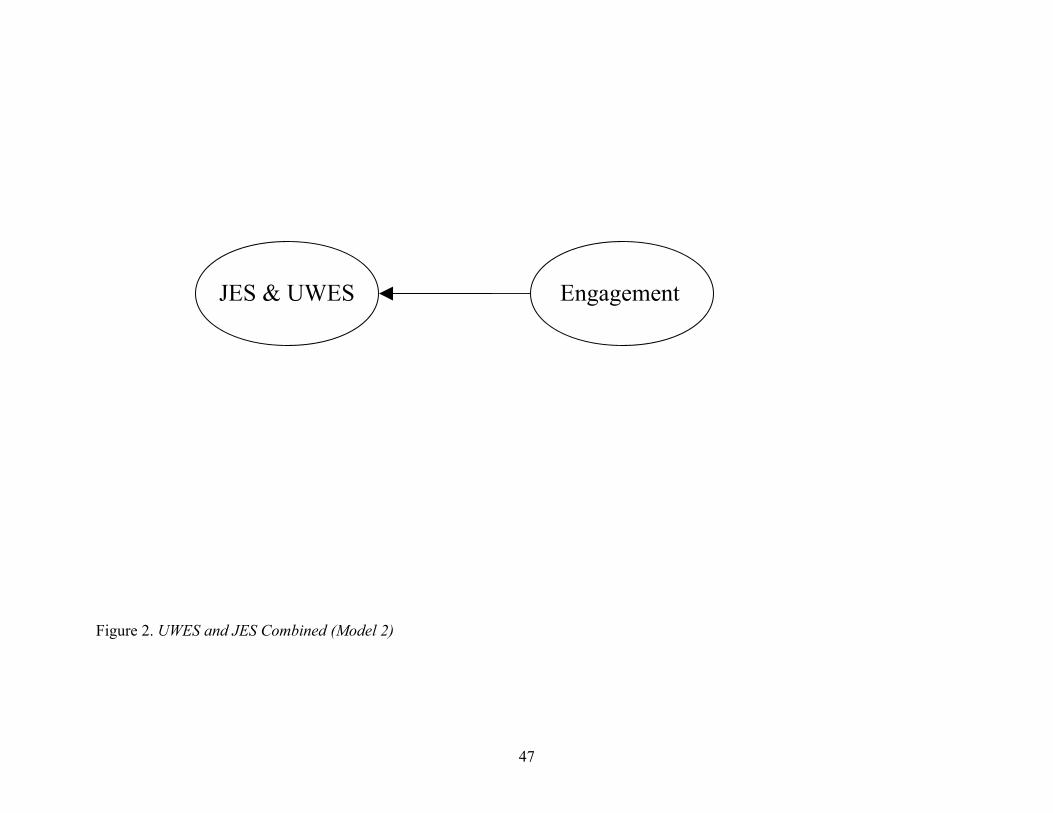
Figure 2. UWES and JES Combined (Model 2)
47
JES & UWES Engagement
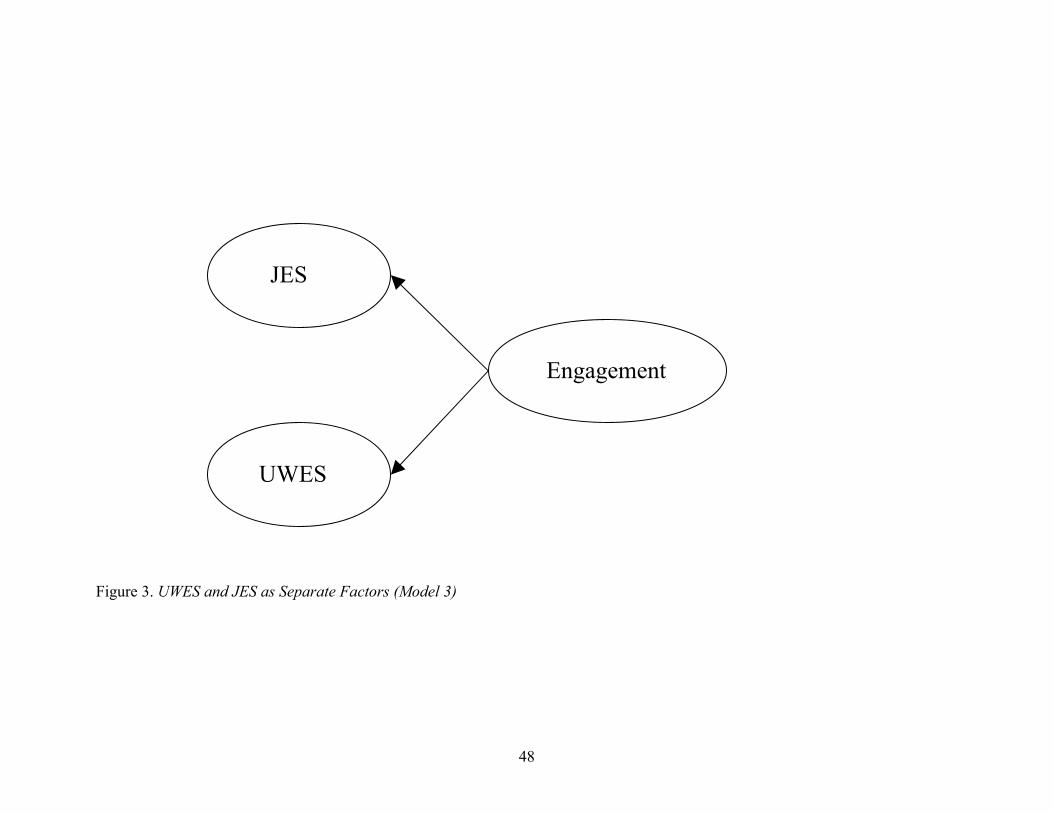
Figure 3. UWES and JES as Separate Factors (Model 3)
48
JES
UWES
Engagement
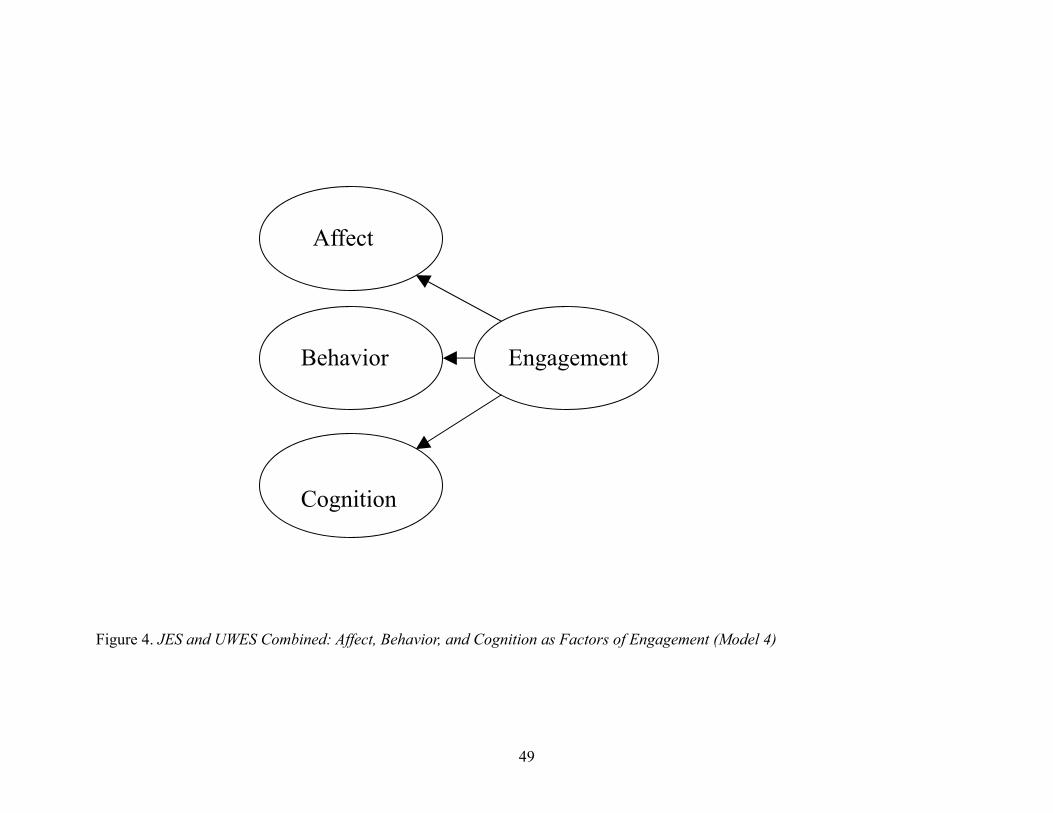
Figure 4. JES and UWES Combined: Affect, Behavior, and Cognition as Factors of Engagement (Model 4)
49
Cognition
Affect
Behavior Engagement
References
Ashforth, B. E., & Humphrey, R. H. 1995. Emotion in the workplace: A reappraisal. Human
Relations, 48, 97–125. doi:10.1177/1742715009343032
Avery, D. R., McKay, P. F., & Wilson, D. C. (2007). Engaging the aging workforce: The
relationship between perceived age similarity, satisfaction with coworkers, and employee
engagement. Journal of Applied Psychology, 92, 1542-1556. doi:10.1037/0021-
9010.92.6.1542
Azen, R., & Budescu, D. V. (2003). The dominance analysis approach for comparing predictors
in multiple regression. Psychological Methods, 8, 129-148.
Bakker, A. B., & Schaufeli, W. B. (2008). Positive organizational behavior: Engaged employees
in flourishing organizations. Journal of Organizational Behavior, 29, 147-154.
doi:10.1002/job.515
Benet-Martínez, V., & Oishi, S. (2008). Culture and personality. In O. P. John, R. W. Robins, &
L. A. Pervin, (Eds.) , Handbook of personality: Theory and research, 542-567. New York,
NY: Guilford Press.
Brown, S. P., & Leigh, T. W. (1996). A new look at psychological climate and its relationship to
job involvement, effort, and performance. Journal of Applied Psychology, 81, 358–368.
doi:10.1037/0021-9010.81.4.358
Brown, T. A. (2006). Confirmatory factor analysis for applied research. New York: Guilford
Press.
Buckingham, M., & Coffman, C. (1999). First, break all the rules: What the world’s greatest
managers do differently. Simon & Schuster Trade.
50
Budescu, D. V. (1993). Dominance analysis: A new approach to the problem of relative
importance of predictors in multiple regression. Psychological Bulletin, 114(3), 542-551.
doi:10.1037/0033-2909.114.3.542
Campbell, D. T., & Fiske, D. W. (1959). Convergent and discriminant validation by the
multitrait-multimethod matrix. Psychological Bulletin, 56, 81-105.
doi:10.1037/h0046016
Cohen, S., Kamarck, T., & Mermelstein, R. (1983). A global measure of perceived stress.
Journal of Health And Social Behavior, 24, 385-396. doi:10.2307/2136404
Crawford, E. R., LePine, J. A., & Rich, B. (2010). Linking job demands and resources to
employee engagement and burnout: A theoretical extension and meta-analytic test.
Journal of Applied Psychology, 95, 834-848. doi:10.1037/a0019364
Cronbach, L. J., & Meehl, P. E. (1955). Construct validity in psychological tests. Psychological
Bulletin, 52, 281-302. doi:10.1037/h0040957
Goffman, E. (1961). Encounters: Two studies in the sociology of interaction. Oxford England:
Bobbs-Merrill.
Hallberg, U. E., & Schaufeli, W. B. (2006). ‘Same Same’ But Different? Can Work Engagement
Be Discriminated from Job Involvement and Organizational Commitment? European
Psychologist, 11(2), 119-127.
Harter, J. K., Schmidt, F.L., & Hayes, T.L. (2002). Business unit-level relationship between
employee satisfaction, employee engagement, and business outcomes: A meta-analysis,
Journal of Applied Psychology, 87, 268-279. doi:10.1037/0021-9010.87.2.268.
51
Harter, J. K., Schmidt, F. L., & Keyes, C. M. (2003). Well-being in the workplace and its
relationship to business outcomes: A review of the Gallup studies. In C. M. Keyes, J.
Haidt, (Eds.), Flourishing: Positive psychology and the life well-lived (pp. 205-224).
Washington, DC: American Psychological Association. doi:10.1037/10594-009
Harter, J. K., Schmidt, F. L., Killham, E. A., & Agrawal, S. (2009). Q12® Meta-analysis: The
relationship between engagement at work and organizational outcomes [Self published
study]. Retrieved 2011, from:
http://www.gallup.com/consulting/126806/MetaAnalysis_Q12_WhitePaper_2009.pdf.
Hayduk, L., Cummings, G., Boadu, K., Pazderka-Robinson, H., & Boulianne, S. (2007). Testing!
Testing! One, two, three--Testing the theory in structural equation models!. Personality
and Individual Differences, 42, 841-850. doi:10.1016/j.paid.2006.10.001
Hodgkinson, G. P. (2011). Why evidence-based practice in I-O psychology is not there yet:
Going beyond systematic reviews. Industrial and Organizational Psychology:
Perspectives on Science and Practice, 4(1), 49-53.
Hu, L., & Bentler, P. M. (1998). Fit indices in covariance structure modeling: Sensitivity to
underparameterized model misspecification. Psychological Methods, 3, 424–453.
Ilgen, D. R., Nebeker, D. M., & Pritchard, R. D. (1981). Expectancy theory measures: An
empirical comparison in an experimental simulation. Organizational Behavior & Human
Performance, 28, 189-223. doi:10.1016/0030-5073(81)90022-2
James, J., McKechnie, S., & Swanberg, J. (2011). Predicting employee engagement in an age-
diverse retail workforce. Journal of Organizational Behavior, 32(2), 173-196.
doi:10.1002/job.681
52
Johnson, J. W., & LeBreton, J. M. (2004). History and use of relative importance indices in
organizational research. Organizational Research Methods, 7(3), 238-257.
doi:10.1177/1094428104266510
Kahn, W. A. (1990). Psychological conditions of personal engagement and disengagement at
work. Academy of Management Journal, 33(4), 692-724. doi:10.2307/256287
Kahn, W. A. (1992). To be fully there: Psychological presence at work. Human Relations, 45,
321-349. doi:10.1177/001872679204500402
Kamalanabhan, T. J., Sai, L. P., & Mayuri, D. (2009). Employee engagement and job satisfaction
in the information technology industry. Psychological Reports, 105, 759-770.
Lackey, N. R., Pett, M.A., & Sullivan, J. J. (2003). Making sense of factor analysis: The use of
factor analysis for instrument development in health care research. Thousand Oaks, CA:
Sage Publications.
Lawshe, C. H. (1985). Inferences from personnel tests and their validity. Journal Of Applied
Psychology, 70, 237-238. doi:10.1037/0021-9010.70.1.237
Macey, W. H., & Schneider, B. (2008). The meaning of employee engagement. Industrial and
Organizational Psychology: Perspectives on Science and Practice, 1(1), 3-30.
doi:10.1111/j.1754-9434.2007.0002.x
Macey, W. H., Schneider, B., Barbera, K. M., & Young, S. A. (2009). Employee engagement:
Tools for analysis, practice, and competitive advantage. Wiley-Blackwell.
doi:10.1002/9781444306538
Maslach, C., Jackson, S. E., & Leiter, M. P. (1997). Maslach Burnout Inventory: Third edition. In
C. P. Zalaquett, & R. Wood (Eds.). Evaluating stress: A book of resources (pp. 191-218).
Lanham, MD: Scarecrow Education.
53
Maslach, C., Schaufeli, W. B., & Leiter, M. P. (2001). Job burnout. Annual Review of
Psychology, 52, 397-422. doi:10.1146/annurev.psych.52.1.397
May, D. R., Gilson, R. L., & Harter, L. M. (2004). The psychological conditions of
meaningfulness, safety and availability and the engagement of the human spirit at work.
Journal of Occupational and Organizational Psychology, 77, 11-37.
doi:10.1348/096317904322915892
McDonald, R. P. (1999). Test theory: A unified treatment. Mahwah, N.J.: L. Erlbaum
Associates.
Murphy, K. R. (2009). Validity, validation and values. The Academy of Management Annals,
3(1), 421-461. doi:10.1080/19416520903047525
Muthén, L.K. & Muthén, B.O. (1998-2007). Mplus User’s Guide. Fifth Edition. Los Angeles,
CA: Muthén & Muthén.
Newman, D., & Harrison, D. (2008). Been there, bottled that: Are state and behavioral work
engagement new and useful construct ‘wines’? Industrial and Organizational
Psychology: Perspectives on Science and Practice, 1, 31-35. doi:10.1111/j.1754-
9434.2007.00003.x
Nunnally, J. C. (1970). Introduction to psychological measurement. New York, NY: McGraw-
Hill.
Nunnally, J. C., & Bernstein, I. H. (1994). Psychometric theory (3rd ed.). New York: McGraw-
Hill.
Raykov, T., & Marcoulides, G.A., (2011). Introduction to Psychometric Theory. New York:
Taylor and Francis Group.
54
Rich, B. L., LePine, J. A., & Crawford, E. R. (2010). Job engagement: Antecedents and effects
on job performance. Academy of Management Journal, 53, 617-635.
Rothbard, N. P. (2001). Enriching or depleting? The dynamics of engagement in work and family
roles. Administrative Science Quarterly, 46, 655-684. doi:10.2307/3094827
Russell, J. A., & Barrett, L. (1999). Core affect, prototypical emotional episodes, and other
things called emotion: Dissecting the elephant. Journal of Personality and Social
Psychology, 76, 805-819. doi:10.1037/0022-3514.76.5.805
Saks, A. M. (2006). Antecedents and consequences of employee engagement. Journal of
Managerial Psychology, 21, 600-619. doi:10.1108/02683940610690169
Saks, A. M. (2008). The meaning and bleeding of employee engagement: How muddy is the
water? Industrial and Organizational Psychology: Perspectives on Science and Practice,
1, 40-43.
Salanova, M. M., & Schaufeli, W. B. (2008). A cross-national study of work engagement as a
mediator between job resources and proactive behaviour. The International Journal of
Human Resource Management, 19, 116-131.
Schaufeli, W. B., & Bakker, A. B. (2003). Test manual for the Utrecht Work Engagement Scale.
Unpublished manuscript, Utrecht University, the Netherlands. Retrieved 2012, from:
http://www.schaufeli.com.
Schaufeli, W. B., Bakker, A. B., & Salanova, M. (2006). The measurement of work engagement
with a short questionnaire: A cross-national study. Educational and Psychological
Measurement, 66, 701-716. doi:10.1177/0013164405282471
55
Schaufeli, W. B., & Salanova, M. (2007). Efficacy or inefficacy, that’s the question: Burnout and
work engagement, and their relationships with efficacy beliefs. Anxiety, Stress & Coping:
An International Journal, 20(2), 177-196.
Schaufeli, W. B., Salanova, M., Gonzalez-Romá, V., & Bakker, A. B. (2002). The measurement
of engagement and burnout: A two sample confirmatory factor analytic approach.
Journal of Happiness Studies, 3, 71-92. doi:10.1023/A:1015630930326
Shirom, A. (in press). Feeling energetic at work: On vigor’s antecedents. In A. B. Bakker & M. P.
Leiter (Eds.) Work engagement: Recent developments in theory and research. New York,
NY: Psychology Press.
Shirom, A. (2003). Feeling vigorous at work? The construct of vigor and the study of positive
affect in organizations. Research in Occupational Stress and Well-being, 3, 135-164.
Schmitt, T. A. (2011). Current methodological considerations in exploratory and confirmatory
factor analysis. Journal of Psychoeducational Assessment, 29, 304-321.
doi:10.1177/0734282911406653
Shraga, O., & Shirom, A. (2009). The construct validity of vigor and its antecedents: A
qualitative study. Human Relations, 62, 271-291. doi:10.1177/0018726708100360
Storm, K., & Rothmann, S. (2003). The validation of the Utrecht Work Engagement Scale in the
South African Police Services. South African Journal of Industrial Psychology, 29, 62–
70.
Shuck, B. (2011). Four emerging perspectives of employee engagement: An integrative literature
review. Human Resource Development Review, 10, 304-328.
doi:10.1177/1534484311410840
56
Van Allen, S. (2008). Employee engagement: What’s your engagement ratio [Brochure].
Retrieved 2011, from: http://www.gallup.com/consulting/52/employee-engagement.aspx
Van Beek, I., Taris, T. W., & Schaufeli, W. B. (2011). Workaholic and work engaged employees:
Dead ringers or worlds apart? Journal of Occupational Health Psychology, 16, 468-482.
doi:10.1037/a0024392
Van Doornen, L. P., Houtveen, J. H., Langelaan, S., Bakker, A. B., van Rhenen, W., & Schaufeli,
W. B. (2009). Burnout versus work engagement in their effects on 24-hour ambulatory
monitored cardiac autonomic function. Stress and Health: Journal of the International
Society for the Investigation of Stress, 25, 323-331. doi:10.1002/smi.1279
Watson, D., Clark, L. A., & Tellegen, A. (1988). Development and validation of brief measures
of positive and negative affect: The PANAS scales. Journal of Personality and Social
Psychology, 54, 1063-1070. doi:10.1037/0022-3514.54.6.1063
Weick, K. E., & Roberts, K. H. 1993. Collective mind in organizations: Heedful interrelating on
flight decks. Administrative Science Quarterly, 38, 357–381. doi:10.2307/2393372
Zhang, Y., Gan, Y., & Cham, H. (2007). Perfectionism, academic burnout and engagement
among Chinese college students: A structural equation modeling analysis. Personality
and Individual Differences, 43, 1529-1540.
57