Embed Size (px)
Citation preview
Thesis7/2019
Liite 6. Stabiliteettilaskentatulosteet, vesistökohde pohjamaatyyppi 1. Yksiraiteinen ratapenger.
Heidi Kotiranta
DEVELOPMENT OF BIM PROCESS THROUGH KNOWLEDGE MANAGEMENT

Heidi Kotiranta
Development of BIM process through knowledge management
Thesis 7/2019
Finnish Transport Infrastructure Agency
Helsinki 2019
Online publication (pdf) (www.vayla.fi)
ISSN 2490-1202ISBN 978-952-317-713-0
Finnish Transport Infrastructure Agency P.O. Box 33 FI 00521 HELSINKI Tel. +358 (0)295 34 3000
Thesis 7/2019 3
Heidi Kotiranta: Development of BIM process through knowledge management. Finnish Transport Infrastructure Agency. Helsinki 2019. Thesis 7/2019. 64 pages and 4 appendices. ISSN 2490-1202, ISBN 978-952-317-713-0.
Keywords: Knowledge Management, Building Information Modelling [BIM], Knowledge Transfer
Abstract
Building Information Modelling [BIM] is a tool enabling management of information of a built asset from planning to demolition. Previous research has focused on its technical use cases, neglecting the organizational support processes. The link between knowledge management actions, more specifically knowledge transfer, and BIM development are studied with this research.
The studied elements are measuring the level of BIM use, knowledge transfer and finding possible solutions to take BIM development work forward, using the principles of knowledge management.
This qualitative research is conducted as a single case study. Primary data sources are semi-structured interviews. The studied organization is a big organization in the Finnish infrastructure industry.
The findings were that supporting knowledge transfer does create benefits for the BIM process. Knowledge transfer can be used to enhance the organizational capability of BIM use.
Thesis 7/2019 4
Heidi Kotiranta: BIM prosessin kehitys tiedonhallinnan avulla. Opinnäytetyö 7/2019. Väylävirasto 2019. 64 sivua ja 4 liitettä. ISSN 2490-1202, ISBN 978-952-317-713-0. Avainsanat: tietojohtaminen, tieto, mallinnus, BIM, tiedonsiirto
Tiivistelmä
Tietomallinnus tai yleisesti alalla käytetty termi BIM on työkalu, joka mahdol-listaa rakennetun ympäristön tiedonhallinnan koko elinkaaren ajan suunnitte-lusta purkuun. Aikaisempi tutkimus on keskittynyt tietomallinnuksen teknisiin ominaisuuksiin, jättäen huomiotta organisaatioiden tarvitsemat tukiprosessit. Yhteyttä tiedon-hallinnan, tarkemmin tiedon siirron, ja tietomallinnuksen kehittämisen välillä kartoitetaan tällä tutkimuksella. Tutkittavia elementtejä ovat tietomallinnuksen tason määrittäminen ja tiedon-siirron taso. Näiden avulla pyritään löytämään mahdollisia ratkaisuja tiedon-hallintaan, jotka tukevat tietomallinnuksen kehitystyötä. Tutkimus toteutetaan laadullisena tapaustutkimuksena, jonka ensisijaisena lähteenä toimivat teemahaastattelut. Tutkittava organisaatio on suuri toimija suomen infrarakennuksen alalla. Tutkimuksen löydökset osoittavat, että tukemalla tiedonsiirtoa organisaatio saavuttaa hyötyjä tietomallinnuksen prosessille. Tiedonsiirtoa voidaan käyttää parantamaan tietomalleihin liittyviä organisatorisia valmiuksia.
Thesis 7/2019 5
Heidi Kotiranta: Utveckling av BIM-processen med informationshantering. Trafikleds-verket. Helsingfors 2019. Lärdomsprov 7/2019. 64 sidor och 4 bilagor. ISSN 2490-1202, ISBN 978-952-317-713-0.
Sammandrag
Informationsmodellering eller BIM, som är den allmänt använda termen i branschen, är ett verktyg som möjliggör informationshantering av bygd miljö under hela livscykeln, från planeringen till rivningen. Den tidigare studien fokuserade på de tekniska egenskaperna i informations-modelleringen, utan att ta hänsyn till de stödprocesser som organisationerna behöver. Sambandet mellan utvecklingen av informationshanteringen, närmare sagt informationsöverföringen, och informationsmodelleringen kartläggs med denna studie. De element som undersöks utgörs av definitionen av nivån på informations-modelleringen och nivån på informationsöverföringen. Med dessa försöker man hitta potentiella lösningar för informationshantering, vilka stöder utvecklings-arbetet inom informationsmodellering. Studien genomförs som en kvalitativ fallstudie, vars primära källa utgörs av temaintervjuer. Den undersökta organisationen är en stor aktör inom finskt infrabyggande. Fynden i studien visar att en organisation, genom att stöda informations-överföring, uppnår nytta för informationsmodelleringsprocessen. Informations-överföring kan användas för att förbättra de organisatoriska färdigheter som anknyter till informationsmodellerna.
Thesis 7/2019 6
Preface
The use of BIM in large infrastructure projects has become a standard. However, how it is used is not as widely recognized. Capturing relevant information and knowledge about BIM processes is essential. Thus, this thesis looks at the connection between knowledge management and BIM processes. This thesis was written by Heidi Kotiranta at Lappeenranta-Lahti University of Technology, School of Business and Management, Strategy, Innovation and Sustainability. The work was conducted and supervised by Jukka-Pekka Bergman and Laura Albareda from Lappeenranta-Lahti University of Technology. The work was steered and advised by Tarmo Savolainen and Kristiina Laakso from Finnish Transport Infrastructure Agency. Helsinki September 2019 Finnish Transport Infrastructure Agency
Thesis 7/2019 7
Table of Contents
1 INTRODUCTION ............................................................................................................. 10 1.1 Research Background ................................................................................................ 10 1.2 Research Objectives and Research Problem ...................................................... 10 1.3 Key Concepts ................................................................................................................. 11 1.4 Delimitations ................................................................................................................. 11
2 THEORETICAL FRAMEWORK ..................................................................................... 12 2.1 Knowledge Management .......................................................................................... 12
2.1.1 Knowledge Management Strategy in Organizations .......................... 13 2.1.2 Project Knowledge Management .............................................................. 16 2.1.3 Knowledge Management and Digitalization ......................................... 17
2.2 Measuring Knowledge Transfer in Organizations ........................................... 18 2.2.1 Measuring Knowledge Retention ............................................................. 19
2.3 Utilization of BIM in Organizations ........................................................................ 21 2.4 Information Systems Strategy............................................................................... 28
3 RESEARCH FRAMEWORK .......................................................................................... 32
4 RESEARCH METHODOLOGY ...................................................................................... 34 4.1 Research context and brief case description ................................................... 34 4.2 Methods of Data Collection .................................................................................... 37 4.3 Interview Settings ...................................................................................................... 37 4.4 Methods of Data Analysis ....................................................................................... 38 4.5 Reliability and Validity .............................................................................................. 39
5 FINDINGS ....................................................................................................................... 40 5.1 Primary Data Findings .............................................................................................. 40
5.1.1 Information ...................................................................................................... 40 5.1.2 BIM Use ............................................................................................................. 42 5.1.3 Process Development .................................................................................. 43 5.1.4 BIM Maturity ................................................................................................... 44 5.1.5 Infrastructure and IT-systems ................................................................. 46
5.2 Secondary Data Findings ......................................................................................... 46 5.2.1 Standardisation of Built Environment: RASTI-project ...................... 46 5.2.2 International Guideline: Handbook for the introduction of
Building Information Modelling by the European Public Sector .... 47 5.2.3 BIM Maturity Map .......................................................................................... 48
6 DISCUSSION .................................................................................................................. 49 6.1 Measuring Knowledge Transfer in BIM .............................................................. 50 6.2 Creating an Assessment Matrix for BIM Maturity........................................... 52 6.3 Concrete Steps for Further Development in the Organization ................... 53 6.4 Supporting Knowledge Transfer ........................................................................... 56
6.4.1 Instructions ..................................................................................................... 56 6.4.2 Competencies .................................................................................................. 57 6.4.3 IT-Systems and Infra .................................................................................... 58
7 CONCLUSIONS ...............................................................................................................59 7.1 Theoretical contributions ........................................................................................ 59 7.2 Practical implications .............................................................................................. 60

Thesis 7/2019 8
REFERENCES ............................................................................................................................... 61 APPENDICES Appendix 1 Knowledge Retention Measurement table (Arif et al. 2012, 59) Appendix 2 Preliminary Interview Structure and Questions (in Finnish) Appendix 3 Maturity Matrix, Heidi Kotiranta 2019 Appendix 4 Kypsyysmatriisi, Heidi Kotiranta 2019
Thesis 7/2019 9
List of figures Figure 1 Organized data creates information
(Adapted from Ganesh 2001, 69) .............................................................. 13 Figure 2 Information and interpretation create knowledge.
(Adapted from Ganesh 2001, 69) .............................................................. 13 Figure 3 Conceptual framework (of KMS and KMI and their effect on
knowledge management processes, which lead to individual competences). Kushwaha & Rao 2015, 379. .......................................... 15
Figure 4 SECI model of knowledge creation. Nonaka & Toyama 2003, 5. .... 19 Figure 5 Model of knowledge retention process. Arif et al. 2009, 101. ......... 20 Figure 6 Three interlocking Fields of BIM activity — venn diagram. Succar 2009, 361. ........................................................................................... 23 Figure 7 Main project lifecycle phases. (Adapted from Succar 2009) ......... 25 Figure 8 Presentation of sub-steps under leadership. (Adapted from
Succar 2009, 369) ......................................................................................... 25 Figure 9 Components of information systems strategy.
Galliers 2004, 241. ......................................................................................... 30 Figure 10 Towards a more inclusive framework for information systems
strategizing. Galliers 2004, 256. ............................................................... 31 Figure 11 Research Framework. .................................................................................. 32 Figure 12 The Finnish Transport Infrastructure Agency’s Field of
Operation. ........................................................................................................ 35 Figure 13 Key Steps of the Research Process. ....................................................... 37 Figure 14 Compilation of interview results under information. ........................ 41 Figure 15 BIM Maturity Map. CEN 2017, 7. ................................................................ 48 Figure 16 The research process for identifying solutions for knowledge
transfer at FTIA. ............................................................................................. 50 Figure 17 Top-down approach from strategic level to operational level. .... 54
List of tables Table 1 Key concepts of the research. ..................................................................... 11 Table 2 Stage Definitions. (Adapted from Succar, 2009) ................................ 24 Table 3 Key Performance Indicators [KPI] by chapters.
(Adapted from Sebastian & van Berlo 2010). ...................................... 26 Table 4 BIMM factors by author(s). (Adapted from Succar 2010,
Sebastian & Van Berlo 2010, Chen, Dib & Cox 2014). ......................... 27 Table 5 BIM related thesis work at FTIA by year and title. ............................. 36
Thesis 7/2019 10
1 Introduction
The introduction will present the research background, the objectives of the research, the research questions, key concepts and delimitations of the research.
1.1 Research Background
The aim for more efficient processes, driven by government interests, is to develop better working policies through digitalization in the infrastructure sector (Hallituksen strategiasihteeristö 2018, 39-50). Building information modelling [BIM] involves a holistic approach including a software that allows the geometrical modelling and the input of information, a project management (PM)-related tools and processes for project managers in improving collaboration between stakeholders, reducing the time needed for documentation of the project and, hence, producing beneficial project outcomes (Bryde, Broquetas & Volm, 2013). Thus making it a viable option in infrastructure digitalization. Possible BIM benefits include, according to Bryde et al. (2013), decrease in project duration, positive effect on the schedule and quality. Increased quality includes better processes, enhanced designs and improved documentation. Risks of implementing BIM consist of re-training, computer upgrades and time increases related to remodelling and converting drawings to digital form and into models. The negative effects would diminish over time and could be decreased significantly, should the project be BIM-based from the start. (Bryde et al. 2013) The thesis topic is very relevant to the whole industry of built environment, including buildings, infrastructure and data, and especially to infrastructure planning, development, construction and maintenance. Recent work on the infrastructure field includes standardization, requirements and international guidebooks. Implementation without a well thought plan has become an issue, and the level of BIM use in organizations is unknown. This leads to not knowing, when potential benefits can be expected. This case study research pursues to find an answer to how can the BIM process be measured and what kind of actions can be taken from a knowledge management point of view.
1.2 Research Objectives and Research Problem
The objective of the study is to better the BIM process through active knowledge transfer in order to attain the benefits of BIM. The goal is to have a functioning BIM process, which enables better asset management, cost savings and creates a platform for addressing topics like eco-efficiency. As an outcome a reflection of the current situation and a plan of action moving forward are desirable results.
Thesis 7/2019 11
The research problem is finding way to: how BIM could benefit from knowledge management? Especially when it is applied to the infrastructure industry. As the main research question offers a wide variety of options. Sub-questions to the main research question were introduced at the beginning of the study. However, some questions and topics emerged during the research process, thus changing the original sub-questions and guiding the research work. The final sub-questions are as follows:
How is knowledge transfer measured in the BIM process? What steps should be taken to increase the level of knowledge transfer
in the BIM process? How can knowledge transfer be supported?
1.3 Key Concepts
The key concepts of the research are knowledge management [KM], Building Information Modelling [BIM] and knowledge transfer. The key concepts are presented in Table 1.
Table 1 Key concepts of the research.
Concept Explanation Knowledge management
Knowledge management organizes codified and tacit knowledge.
BIM Building Information Modelling [BIM] is a process focused on the transfer, use and development of digital information of a building construct. BIM takes into account the full lifecycle from conception to demolition.
Knowledge transfer
Transfer of tacit or codified knowledge. Following a pattern of personalisation (tacit to tacit), codification (tacit to explicit), combination (explicit to explicit) and internalisation (explicit to tacit).
1.4 Delimitations
The scope of the thesis includes only one case organization, which operates in Finland. The gathered data is limited to employees of the case organization and employees working in organizations directly under the guidance of the case organization. The research is limited to consider three key concepts within this domain; knowledge management, knowledge transfer and BIM utilization. BIM is an information intensive technological tool, thus information systems strategy was included as part of the theoretical scope to explain how could such tool be managed and embedded to an organization. BIM as a research area is wide, thus this thesis is only examining the knowledge transfer process and excluding the more technical aspects of BIM. The knowledge transfer process is a less researched topic, therefore making it an interesting study subject.
Another delimitation comes from the case organization's industry. The scope is limited to infrastructure BIM processes in Finland. However, the Nordic countries share similar properties, thus results can be used as guidance but cannot be generalized due to small sample size and context specific factors.
Thesis 7/2019 12
2 Theoretical Framework
The theoretical framework focuses on four key dimensions of the literature review; knowledge management [KM], knowledge transfer in organizations, utilization of BIM in organization and information systems strategy [ISS]. Knowledge management is explained through knowledge management strategies, project knowledge management and the connection between KM and digitalization. How BIM is utilized in organizations is explained to create a theoretical base for the measurements of the BIM process. To understand the link between KM and BIM information systems strategy is explained to deepen the relationship of the two, and how they could fit to the same domain.
2.1 Knowledge Management
Knowledge management [KM] is an area of study of organization and management research. It has reached growing attention with businesses starting from the 1990s. Knowledge management refers to the process of creating, sharing, using and managing the knowledge and information of an organization. The shift from natural resources being the competitive advantage has moved towards businesses’ intellectual property. (Hansen, Nohria & Tierney 1999; Zack 1999, 125; Lam 2000, 487) Knowledge management organizes codified and tacit knowledge, thus helps organizations to find unique organizational knowledge (Ambrosini & Venkitachala 2017, 195; Zack 1999, 125; Lam 2000, 487). Therefore, to understand the organization of knowledge, it is important to clarify what is meant by knowledge and how it can be categorized. Further it is good to make a distinction between knowledge and information, as they are often used as synonyms (Nonaka 1994, 15). According to Nonaka (1994, 15) information can be described as a flow of messages and signals, thus could add to, change or restructure knowledge. Hence knowledge is something that is shaped by information, and how it is perceived based on previous experiences, commitment and beliefs of the recipient (Nonaka 1994, 15). Thus, knowledge management in organizations is organizing knowledge in a systematic way, while attempting to create value from intangible assets within the organization (Kuswaha & Rao 2015, 378).
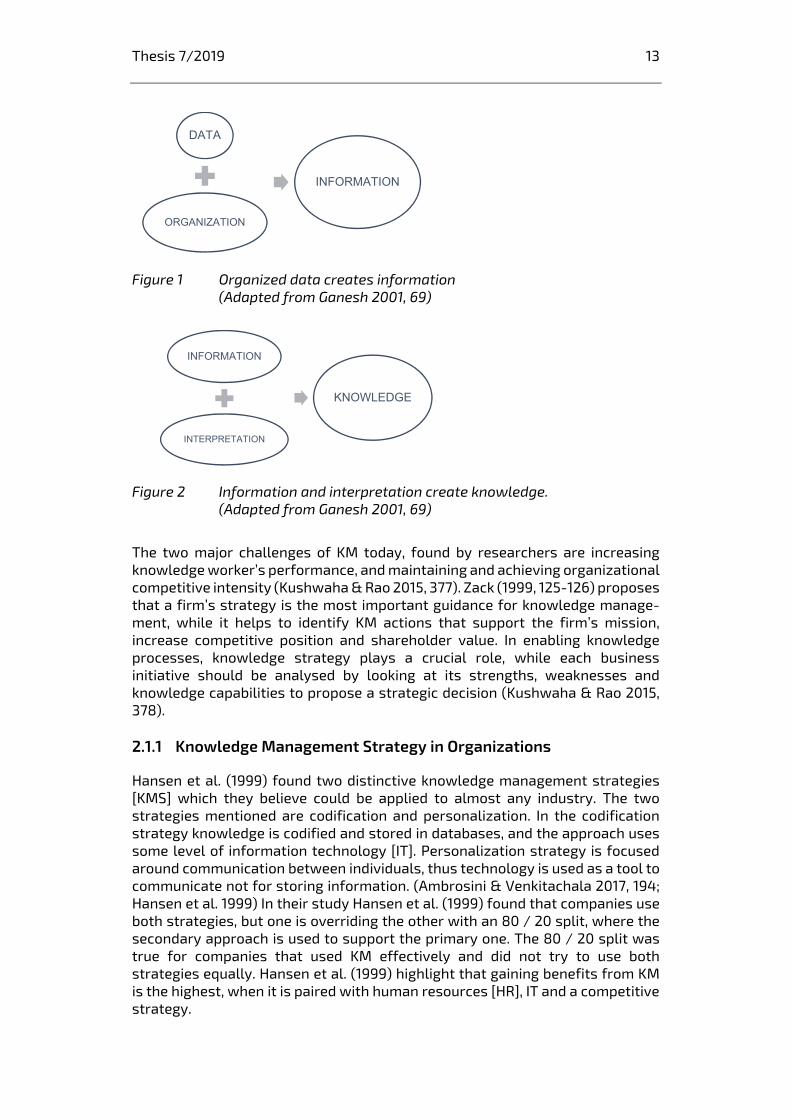
Knowledge can be split into two types: tacit and explicit knowledge. Tacit knowledge refers to knowledge that is hard to communicate or formalize. Tacit knowledge entails both a cognitive and a technical element. The cognitive elements are mental models, schemas and beliefs, which provide a viewpoint or a perspective. These aspects define how the world around is perceived. The technical part of tacit knowledge refers to concrete skills and know-how in a specific context. (Nonaka 1994, 16-17) Explicit knowledge, also known as codified knowledge, is knowledge that can be conveyed in formal and systematic language. This means that explicit knowledge can be stored and accessed systematically. (Nonaka 1994, 16-17) Both information and knowledge derive from data, where data is considered as raw facts, without any interpretation or organization of that data (Ganesh 2001, 69). As proposed by Ganesh (2001, 69) data and information are distinguished from each other by organization, and information and knowledge by interpretation. Thus, organized data creates information and interpreted information generates knowledge as shown in Figures 1 and 2.
Thesis 7/2019 13
Figure 1 Organized data creates information (Adapted from Ganesh 2001, 69)
Figure 2 Information and interpretation create knowledge. (Adapted from Ganesh 2001, 69)
The two major challenges of KM today, found by researchers are increasing knowledge worker’s performance, and maintaining and achieving organizational competitive intensity (Kushwaha & Rao 2015, 377). Zack (1999, 125-126) proposes that a firm’s strategy is the most important guidance for knowledge manage-ment, while it helps to identify KM actions that support the firm’s mission, increase competitive position and shareholder value. In enabling knowledge processes, knowledge strategy plays a crucial role, while each business initiative should be analysed by looking at its strengths, weaknesses and knowledge capabilities to propose a strategic decision (Kushwaha & Rao 2015, 378). 2.1.1 Knowledge Management Strategy in Organizations
Hansen et al. (1999) found two distinctive knowledge management strategies [KMS] which they believe could be applied to almost any industry. The two strategies mentioned are codification and personalization. In the codification strategy knowledge is codified and stored in databases, and the approach uses some level of information technology [IT]. Personalization strategy is focused around communication between individuals, thus technology is used as a tool to communicate not for storing information. (Ambrosini & Venkitachala 2017, 194; Hansen et al. 1999) In their study Hansen et al. (1999) found that companies use both strategies, but one is overriding the other with an 80 / 20 split, where the secondary approach is used to support the primary one. The 80 / 20 split was true for companies that used KM effectively and did not try to use both strategies equally. Hansen et al. (1999) highlight that gaining benefits from KM is the highest, when it is paired with human resources [HR], IT and a competitive strategy.
DATA
ORGANIZATION
INFORMATION
INFORMATION
INTERPRETATION
KNOWLEDGE
Thesis 7/2019 14
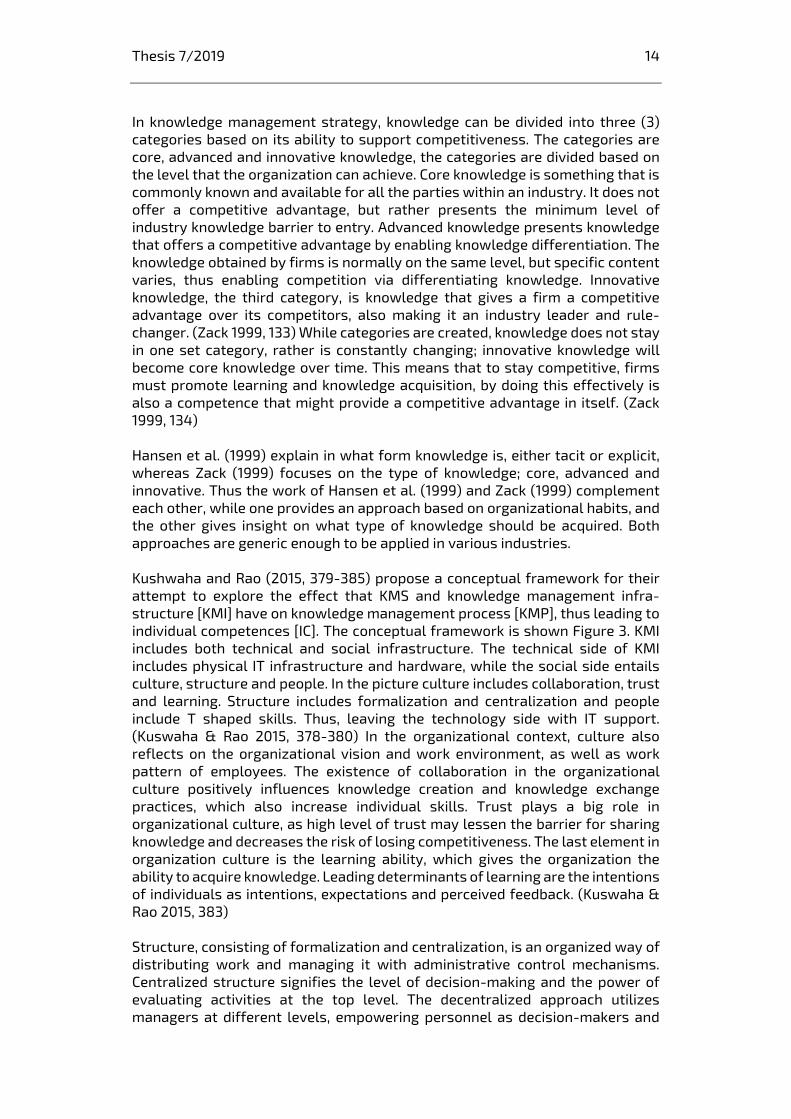
In knowledge management strategy, knowledge can be divided into three (3) categories based on its ability to support competitiveness. The categories are core, advanced and innovative knowledge, the categories are divided based on the level that the organization can achieve. Core knowledge is something that is commonly known and available for all the parties within an industry. It does not offer a competitive advantage, but rather presents the minimum level of industry knowledge barrier to entry. Advanced knowledge presents knowledge that offers a competitive advantage by enabling knowledge differentiation. The knowledge obtained by firms is normally on the same level, but specific content varies, thus enabling competition via differentiating knowledge. Innovative knowledge, the third category, is knowledge that gives a firm a competitive advantage over its competitors, also making it an industry leader and rule-changer. (Zack 1999, 133) While categories are created, knowledge does not stay in one set category, rather is constantly changing; innovative knowledge will become core knowledge over time. This means that to stay competitive, firms must promote learning and knowledge acquisition, by doing this effectively is also a competence that might provide a competitive advantage in itself. (Zack 1999, 134) Hansen et al. (1999) explain in what form knowledge is, either tacit or explicit, whereas Zack (1999) focuses on the type of knowledge; core, advanced and innovative. Thus the work of Hansen et al. (1999) and Zack (1999) complement each other, while one provides an approach based on organizational habits, and the other gives insight on what type of knowledge should be acquired. Both approaches are generic enough to be applied in various industries. Kushwaha and Rao (2015, 379-385) propose a conceptual framework for their attempt to explore the effect that KMS and knowledge management infra-structure [KMI] have on knowledge management process [KMP], thus leading to individual competences [IC]. The conceptual framework is shown Figure 3. KMI includes both technical and social infrastructure. The technical side of KMI includes physical IT infrastructure and hardware, while the social side entails culture, structure and people. In the picture culture includes collaboration, trust and learning. Structure includes formalization and centralization and people include T shaped skills. Thus, leaving the technology side with IT support. (Kuswaha & Rao 2015, 378-380) In the organizational context, culture also reflects on the organizational vision and work environment, as well as work pattern of employees. The existence of collaboration in the organizational culture positively influences knowledge creation and knowledge exchange practices, which also increase individual skills. Trust plays a big role in organizational culture, as high level of trust may lessen the barrier for sharing knowledge and decreases the risk of losing competitiveness. The last element in organization culture is the learning ability, which gives the organization the ability to acquire knowledge. Leading determinants of learning are the intentions of individuals as intentions, expectations and perceived feedback. (Kuswaha & Rao 2015, 383) Structure, consisting of formalization and centralization, is an organized way of distributing work and managing it with administrative control mechanisms. Centralized structure signifies the level of decision-making and the power of evaluating activities at the top level. The decentralized approach utilizes managers at different levels, empowering personnel as decision-makers and
Thesis 7/2019 15
implementers. Formalization also indicates rules and policies for working, which govern organizational activities and manage work relations. (Kuswaha & Rao 2015, 383) T-shaped skills, under people or human capital, enable individuals to enhance their competence and support knowledge creation, transfer, application and storage. Human capital is a mixture of individual competence, wisdom, leadership, experience and motivation. The way people contribute to the organization is through incorporation of knowledge and innovation in everyday activities. (Kuswaha & Rao 2015, 383-384) Technology, seen in the picture as IT support, drives KM practices and enables knowledge acquisition, sharing, transfer and application. IT support is necessary for initiating and implementing KM, as well as in knowledge acquisition and knowledge application process. (Kuswaha & Rao 2015, 383)
Figure 3 Conceptual framework (of KMS and KMI and their effect on knowledge management processes, which lead to individual competences). Kushwaha & Rao 2015, 379.
The model by Kushwaha and Rao (2015) is building on the expectations of Hansen et al. (1999), where the suggestion was that benefits of KM will be the best, when paired with HR, IT and organization’s strategy. Combining IT and HR, creates a KM infrastructure, as presented by Kushwaha and Rao (2015), and the two identified KM strategies, codification and personalization, were following Hansen et al. (1999) division to personalization and codification strategies. Kushwaha and Rao (2015) included also the KM process, following the pattern of knowledge acquisition, similar to for example Nonaka’s SECI model, which would lead to individual competence.
Thesis 7/2019 16
Kushwaha and Rao (2015) expand on the theories of Hansen et al. successfully, linking strategy, infrastructure and process into one domain. While Zack (1999) is focusing on organizational knowledge types, we can assume that similar knowledge is also acquired by individuals before it becomes an organizational resource, thus the process phase can also draw from Zack’s (1999) model. 2.1.2 Project Knowledge Management
Newell, Bresnen, Edelman, Scarbrough, Swan (2006) point out that knowledge can be both explicit and implicit, making knowledge transfer between projects possible through ICT up to a certain level, while acknowledging that some knowledge is embedded in practice, thus cannot be transferred via ICT but through social networks. They investigated what kind of knowledge is possible to transfer through ICT and what should be shared in networks. The research considered projects from different industries, like automotive and construction, and altogether 137 interviews were carried out in two years. Newell et al. (2006) identified two factors that prevent efficient cross-project knowledge transfer; focus of learning and the type of learning. The findings they identified include, among other, the following points:
Stored knowledge was not used by project groups. “Lessons learned” were not captured at the project level, the focus was
on “product” knowledge rather than on “process” knowledge. Focusing on “how we do things” rather than “what we do” would be more
useful. Focus is on project objectives, not in potential benefits to the
organization. Projects were sometimes seen as too unique to pass on relevant learning
points. IT-systems are appropriate to collect product knowledge but not
process learning. “Lessons learned” were collected at the end of the project.
They found that generally soft process related knowledge was better to be shared in networks and directly with people involved. However, this seemed to be due to the fact that the softer process issues were not captured, no lessons learned were documented, thus there were no learning points to give out. This hadn’t been done even when projects encountered problems, no logs were kept on how the issue was solved or what could have been done differently. (Newell et al. 2006) Bushuyev, Mihić, Obradović, Petrović & Todorović (2014) identified challenges linked to project knowledge management, which were very similar to findings of Newell et al. (2006) explaining why cross-project knowledge transfer is insufficient. And since organizational tasks can be completed in a project environment, problems with project knowledge management should be considered as well (Bushuyev et al. 2014, 773). Bushuyev et al. (2014, 773) have identified challenges linked to project knowledge management as: 1) Lack of routines and other mechanisms for learning, 2) Poor availability of previous reports and lessons learnt from earlier projects, 3) Organizational processes and project documentation rarely reflect the reality, 4) Insufficient communication and information exchange, previous experience is not used
Thesis 7/2019 17
adequately, 5) Project duration and uniqueness, 6) Lessons learnt can come after a long time, 7) A project intensive organizational structure, 8) Employees gain knowledge during projects, but there is no motivation to share it within the organization, and 9) Contradiction between short-term project goals and long-term organizational learning goals. Bushuyev et al. (2015, 781) propose a project success analysis framework, which includes defining critical success factors (CSFs), key performance indicators (KPIs), measuring and documenting project success according to the KPIs. Critical success factors (CSF) are factors that measure specific areas, and if the result is satisfactory it provides successful competitive performances for the organization. (Bushyev et al. 2015, 774) Ika (2009, 9) has divided CFSs to three project phases as: project planning phase, project execution and project closing phase. In the project planning phase the CSFs are project mission, client acceptance, top management support and urgency. In the project execution phase the CSFs are project mission, project team leader characteristics, troubleshooting, project schedules and plan, technical task, and client dialogue. At the project closing phase the CSFs are as follows: technical tasks, project mission and client dialogue. It should be mentioned that project success is different from project management success, which measures the time, cost and quality -triangle (Ika, 2009, 8). In other words, the process can be managed successfully, but the results might not be satisfactory, and vice versa. But it can be said that when the quality of project management in large infrastructure projects is high, the greater the chance that the project is also successful (Staal-Ong, Kremers, Karlsson & Baker 2016, 93). 2.1.3 Knowledge Management and Digitalization
The main drivers behind organizations’ desire to digitalize their processes is making information more accessible and transparent. When digitalization has made information available for all personnel, it allows employees at lower levels of the organization to make better informed decisions. This in turn could break down knowledge silos in knowledge intensive organizations, which tend to form knowledge silos. A knowledge silo is an organizational unit that is very good at something but cannot pass on the information or perform tasks outside of their core function. Digitalization is said to change organizations in a way that breaks down knowledge silos. (Kuusisto 2017, 347-348) Ambrosini and Venkitachala (2017, 192) highlight the importance of technology in knowledge management; realizing that technology and knowledge management are interlinked yields to better results, if not realized the effect will be the opposite. Negative consequences include inadequate capturing and codification of knowledge, lack of management for codified knowledge in terms of how it is saved, how it can be used and stored. Other problems include duplication of knowledge, which leads to unnecessary work and poor knowledge transfer between functions. (Ambrosini & Venkitachala 2017, 192) Organization’s knowledge creation contributes the organization’s level of organizational learning (OL) (Kuusisto 2017, 348). Organizational learning occurs when individuals within an organization face a problem and investigate it on behalf of the organization (Argyris & Schön 1996, 16). Intermediate outcomes of such investigations are considered to be products of organizational learning, when they are paired with changes in behavior, which indicates changes in the
Thesis 7/2019 18
organizational theory-in-use. Such outcomes are interpretations of past success or failure, assumptions of causal connections between actions and outcomes, the implications of causal connections for the future, explanations of changing organizational environment, critical consideration of organizational theories-in-use, submitting ideas for restructuring organizational theories-in-use, and looking for experiences from other organizations (Argyris & Schön 1996, 17). Kuusisto (2017, 348) states that organizational learning can be divided to sub-categories as: internal learning and external learning. Internal learning refers to knowledge, which is created within the organization. Thus external learning is knowledge that comes from outside of the organization. (Kuusisto 2017, 384) Internal learning can be affected by digitalization, as it enables codification (Kuusisto 2017, 348). Kuusisto (2017, 349) reminds that attention should be paid to tacit knowledge, when implementing digital assets, such as databases or business intelligence programs, because tacit knowledge is not easily transferred to digital form. In addition, the interaction of tacit and explicit knowledge over time can lead to superior performance, thus enhancing such synergy between the two is beneficial, and critical for organizational learning and innovative capability (Lam 2000, 490-491). BIM revolves around digital information, which can be used throughout the life-cycle of the construct. While product model and BIM are used as synonyms, BIM has gained a status as a general term representing product models. The infrastructure industry has been using also the term infraBIM, Infra Built Environment Information Model, when referring to a certain infrastructure project. (buildingSMART Finland) Both theory and practice have provided evidence of how BIM adds value to collaborative processes. BIM provides higher efficiency and effectiveness, it reduces time and errors, and improves quality. (Sebastian, van Berlo 2010, 254) Roughly half of the respondents, from AECO industry, in McGraw-Hill’s (2009, 36) SmartMarket Report claimed to be using BIM or BIM-based tools in 2009, meaning a 75% growth from 2007 (Chen, Dib, Cox 2014, 187; Smits et al. 2017, 336).
2.2 Measuring Knowledge Transfer in Organizations
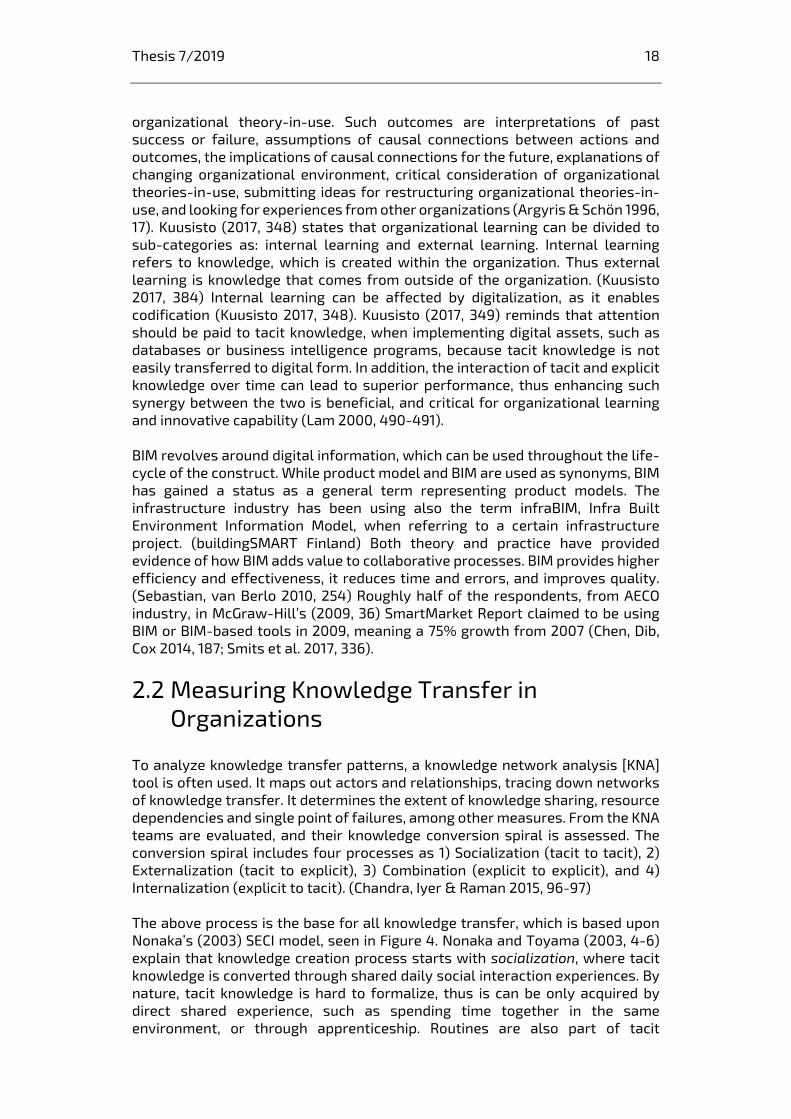
To analyze knowledge transfer patterns, a knowledge network analysis [KNA] tool is often used. It maps out actors and relationships, tracing down networks of knowledge transfer. It determines the extent of knowledge sharing, resource dependencies and single point of failures, among other measures. From the KNA teams are evaluated, and their knowledge conversion spiral is assessed. The conversion spiral includes four processes as 1) Socialization (tacit to tacit), 2) Externalization (tacit to explicit), 3) Combination (explicit to explicit), and 4) Internalization (explicit to tacit). (Chandra, Iyer & Raman 2015, 96-97) The above process is the base for all knowledge transfer, which is based upon Nonaka’s (2003) SECI model, seen in Figure 4. Nonaka and Toyama (2003, 4-6) explain that knowledge creation process starts with socialization, where tacit knowledge is converted through shared daily social interaction experiences. By nature, tacit knowledge is hard to formalize, thus is can be only acquired by direct shared experience, such as spending time together in the same environment, or through apprenticeship. Routines are also part of tacit
Thesis 7/2019 19
knowledge, because they develop through interaction and over time. Living in the same environment enables to see how things are, and the members of the socialization process accumulate and share tacit knowledge of the environment through their practical experience. (Nonaka & Toyama 2003, 4-6) The process of how, the previously introduced tacit knowledge, is then transferred into explicit form is called externalization. In externalization tacit knowledge is made explicit, for it to be shared and to become the basis for new knowledge, e.g. written documents. In the externalization phase individuals try to articulate and explain the world surrounding them, this can be done for example through dialogue. In making obscure concepts explicit and creating linkages between the surface and deeper domains of social reality, abduction and retroduction are effective methods. (Nonaka & Toyama 2003, 4-6) When explicit knowledge is obtained from external or internal sources and combined, edited or processed to combine a more complex and systematic form of explicit knowledge, it is called the combination process. The combination process can be facilitated with technology driven communication networks and large-scale databases. Here contradictions can be solved with logic, thus rationalism is a suitable method for combining, editing and breaking down explicit knowledge. (Nonaka & Toyama 2003, 4-6) The last phase is the internalization process, where explicit knowledge is converted into tacit knowledge by individuals. The explicit knowledge in the organizations is being applied by individuals in practical situations, thus becoming a base for routines. For knowledge to become one’s own it must be actualized, for example learning-by-doing or training programs. (Nonaka & Toyama 2003).
Figure 4 SECI model of knowledge creation. Nonaka & Toyama 2003, 5.
2.2.1 Measuring Knowledge Retention
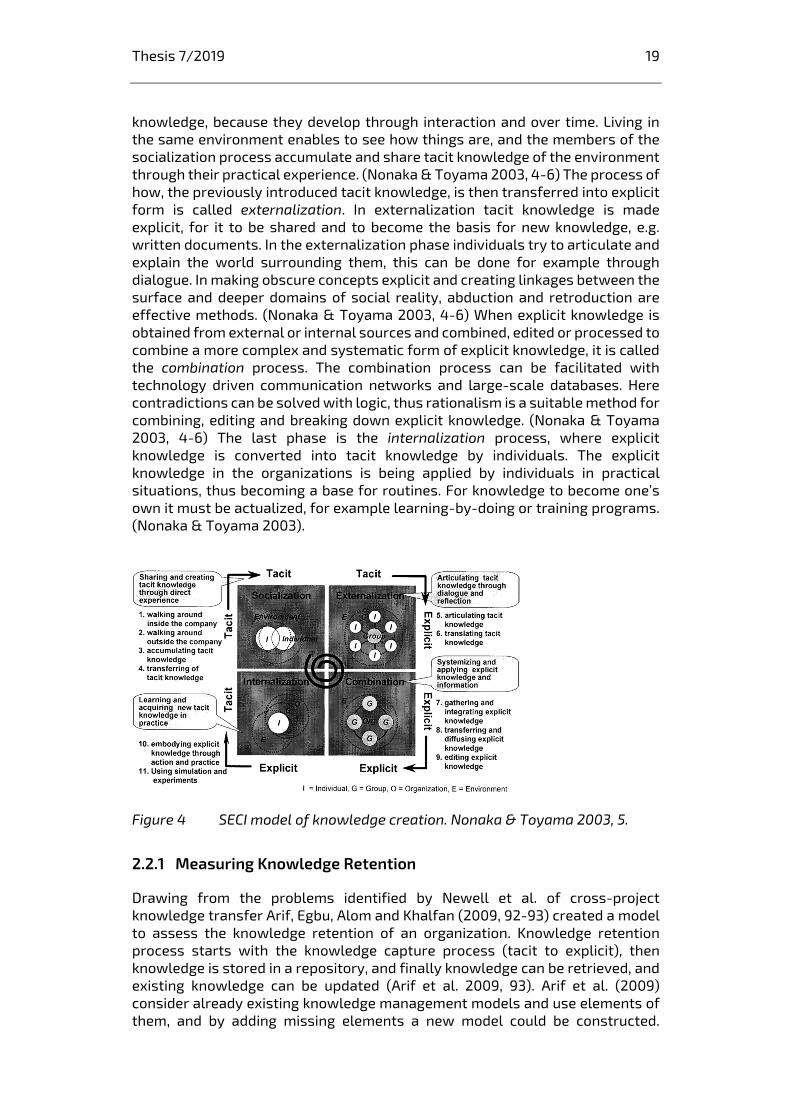
Drawing from the problems identified by Newell et al. of cross-project knowledge transfer Arif, Egbu, Alom and Khalfan (2009, 92-93) created a model to assess the knowledge retention of an organization. Knowledge retention process starts with the knowledge capture process (tacit to explicit), then knowledge is stored in a repository, and finally knowledge can be retrieved, and existing knowledge can be updated (Arif et al. 2009, 93). Arif et al. (2009) consider already existing knowledge management models and use elements of them, and by adding missing elements a new model could be constructed.
Thesis 7/2019 20
Knowledge retention is an ongoing process, nevertheless four (4) steps are suggested and presented in Figure 5:
1) Personalization/ socialization. Individual-to-individual / tacit-to-tacit Knowledge retention relies heavily on how willing people are to
socialize and how it is facilitated by the organization (Arif et al. 2009, 99)
2) Codification/ externalization. Tacit-to-explicit Should present the best practice, and be understood outside of
the linguistic, organizational and cultural context (Arif et al. 2009, 100)
3) Combination/ renewation Knowledge construction and organizational memory IT should be seen as a necessary tool for knowledge management,
but not as knowledge management or knowledge transfer (Arif et al. 2009, 100)
4) Internalization. Knowledge retrieval: identification of knowledge (search) and
receiver’s individual de-codification of the accessed knowledge What kind of events lead to information searching
(Arif et al. 2009, 100)
Figure 5 Model of knowledge retention process. Arif et al. 2009, 101.
The suggested steps of the knowledge retention process follow Nonaka’s SECI model of knowledge creation (Nonaka & Toyama, 2003).
Thesis 7/2019 21
Arif et al. (2009, 101-102) also state that organizations operate on different maturity levels concerning their knowledge retrieval process, thus they suggest four (4) different levels of knowledge retention as:
1) “Level-1: The knowledge is shared amongst the organisation employee. 2) Level-2: The shared knowledge is documented (transferred from tacit to
explicit) 3) Level-3: The documented knowledge is stored. 4) Level-4: The stored knowledge is accessible, can be retrieved and used
easily.” (Arif et al. 2009, 102) Arif et al. (2009, 102-103) also present a comprehensive list of requirements for each level, which can be used to assess an organization through surveys, interviews or observations. A newer version of the assessment was published in 2012 (59) by Arif, Khalfan, Barnard and Heller, this version is shown in Appendix 2. And as the approach is quite generic, it can be applied to any sector. This list of requirements was used to assess FTIA’s current knowledge retention capability as it is linked to knowledge transfer capability.
2.3 Utilization of BIM in Organizations
Bryde, Broquetas and Volm (2013) are addressing a research gap in their research by analysing 35 case studies relating to the use of BIM. The aim of the analysis is to answer to the question of whether BIM has brought any benefits to construction projects. The general findings are that BIM is an appropriate tool for project managers in managing construction projects. In project management BIM can, according to the data, decrease the project duration and have a positive effect on the schedule and quality. Quality effects include better processes, improved documentation and enhanced designs. While the negative effects, according to the data, included things such as re-training, computer upgrades and time increases related to remodelling or converting drawings into a model. Thus it is clear that the negative effects would diminish over time and could be minimized if the project was BIM-based from the beginning. (Bryde et al. 2013) Demian and Walters (2014, 1153-1154) researched construction projects, of different sizes, to compare the information flow between BIM models for communicating versus other media. The media that was compared consisted of e-mail, Asite (storage and transfer of design, commercial and planning information), SAP (transfer and storage of commercial information, internal use only) and PPManager (new BIM-based information management and coordination tool, management and transfer of design and planning information). The aim of the research was to measure the benefits and challenges of BIM-based models in the construction information management. The results of the semi-structured interviews and quantitative data emerged under four themes: Information transfer (especially using e-mail), information storage, accessibility of information and information redundancy. The conclusions were that e-mail as a communication tool is irreplaceable for the time being, information storage in a document form is harder to use and be revised than data that is directly linked to the BIM model. BIM enabled more accurate, on-time and appropriate information exchange between project participants. If the BIM tool became unavailable the back-up systems for it were not clear. The use of the PPManager, the BIM tool, decreased the use of Asite.
Thesis 7/2019 22
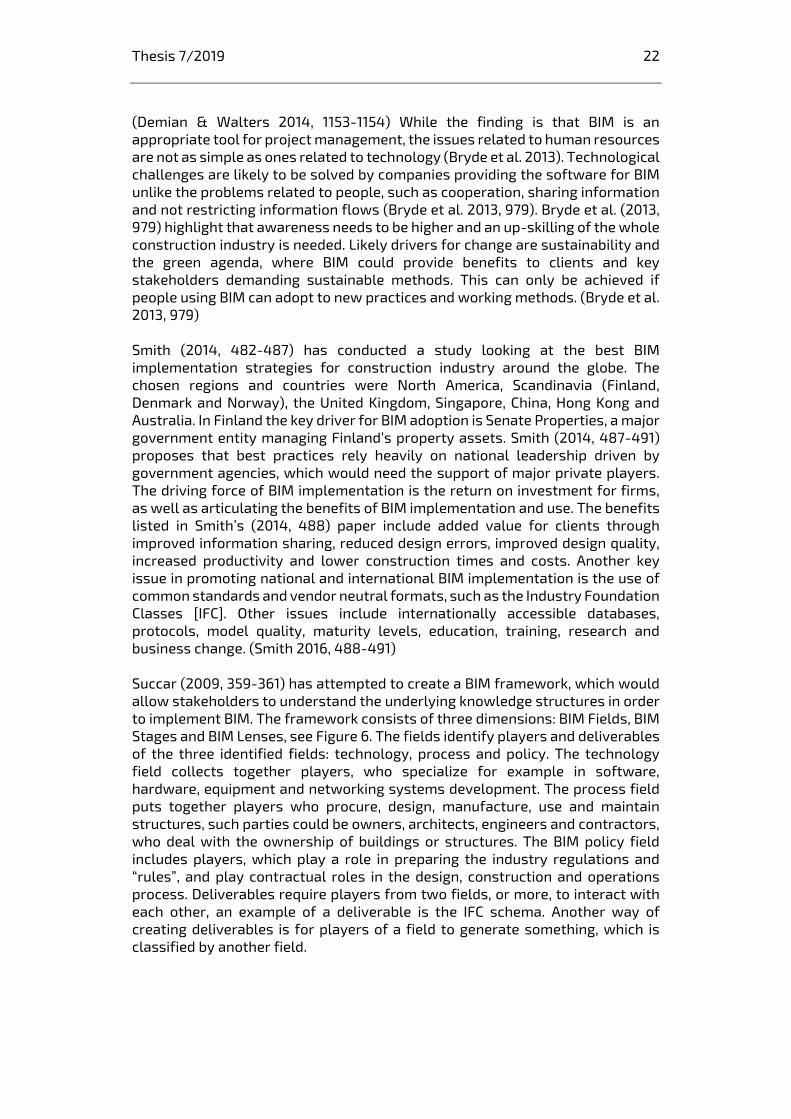
(Demian & Walters 2014, 1153-1154) While the finding is that BIM is an appropriate tool for project management, the issues related to human resources are not as simple as ones related to technology (Bryde et al. 2013). Technological challenges are likely to be solved by companies providing the software for BIM unlike the problems related to people, such as cooperation, sharing information and not restricting information flows (Bryde et al. 2013, 979). Bryde et al. (2013, 979) highlight that awareness needs to be higher and an up-skilling of the whole construction industry is needed. Likely drivers for change are sustainability and the green agenda, where BIM could provide benefits to clients and key stakeholders demanding sustainable methods. This can only be achieved if people using BIM can adopt to new practices and working methods. (Bryde et al. 2013, 979) Smith (2014, 482-487) has conducted a study looking at the best BIM implementation strategies for construction industry around the globe. The chosen regions and countries were North America, Scandinavia (Finland, Denmark and Norway), the United Kingdom, Singapore, China, Hong Kong and Australia. In Finland the key driver for BIM adoption is Senate Properties, a major government entity managing Finland’s property assets. Smith (2014, 487-491) proposes that best practices rely heavily on national leadership driven by government agencies, which would need the support of major private players. The driving force of BIM implementation is the return on investment for firms, as well as articulating the benefits of BIM implementation and use. The benefits listed in Smith’s (2014, 488) paper include added value for clients through improved information sharing, reduced design errors, improved design quality, increased productivity and lower construction times and costs. Another key issue in promoting national and international BIM implementation is the use of common standards and vendor neutral formats, such as the Industry Foundation Classes [IFC]. Other issues include internationally accessible databases, protocols, model quality, maturity levels, education, training, research and business change. (Smith 2016, 488-491) Succar (2009, 359-361) has attempted to create a BIM framework, which would allow stakeholders to understand the underlying knowledge structures in order to implement BIM. The framework consists of three dimensions: BIM Fields, BIM Stages and BIM Lenses, see Figure 6. The fields identify players and deliverables of the three identified fields: technology, process and policy. The technology field collects together players, who specialize for example in software, hardware, equipment and networking systems development. The process field puts together players who procure, design, manufacture, use and maintain structures, such parties could be owners, architects, engineers and contractors, who deal with the ownership of buildings or structures. The BIM policy field includes players, which play a role in preparing the industry regulations and “rules”, and play contractual roles in the design, construction and operations process. Deliverables require players from two fields, or more, to interact with each other, an example of a deliverable is the IFC schema. Another way of creating deliverables is for players of a field to generate something, which is classified by another field.
Thesis 7/2019 23
Figure 6 Three interlocking Fields of BIM activity — venn diagram. Succar 2009, 361.
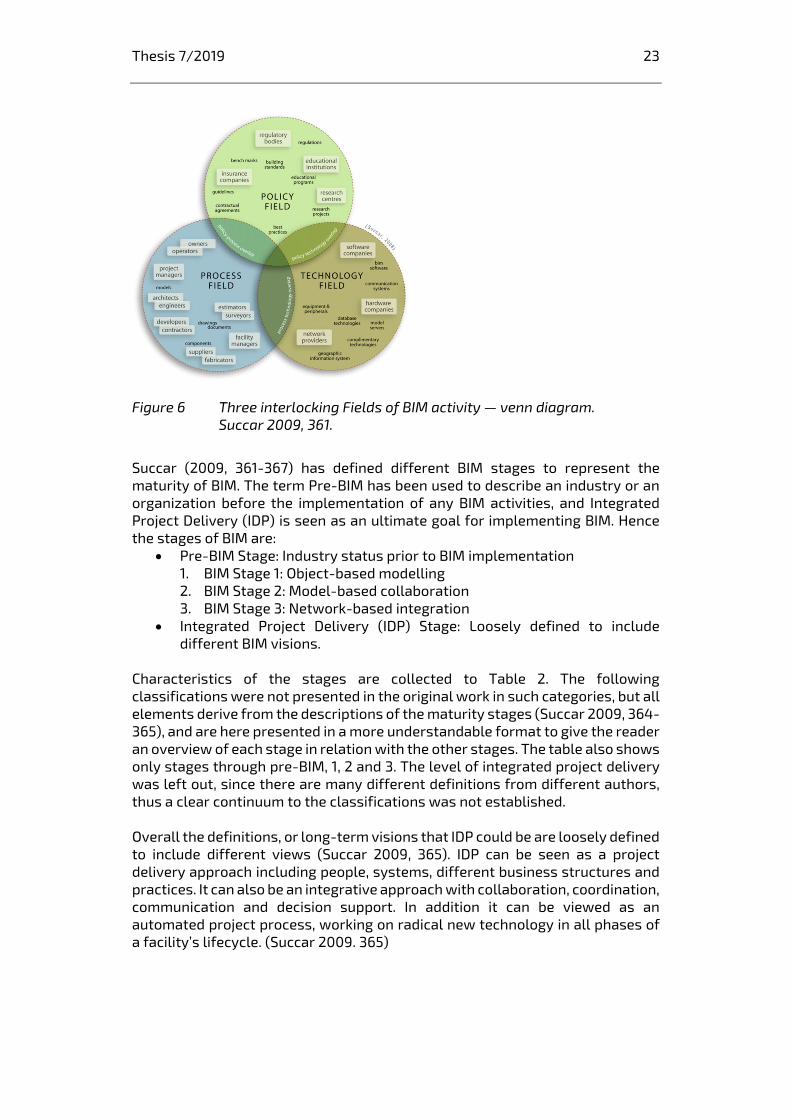
Succar (2009, 361-367) has defined different BIM stages to represent the maturity of BIM. The term Pre-BIM has been used to describe an industry or an organization before the implementation of any BIM activities, and Integrated Project Delivery (IDP) is seen as an ultimate goal for implementing BIM. Hence the stages of BIM are:
Pre-BIM Stage: Industry status prior to BIM implementation 1. BIM Stage 1: Object-based modelling 2. BIM Stage 2: Model-based collaboration 3. BIM Stage 3: Network-based integration
Integrated Project Delivery (IDP) Stage: Loosely defined to include different BIM visions.
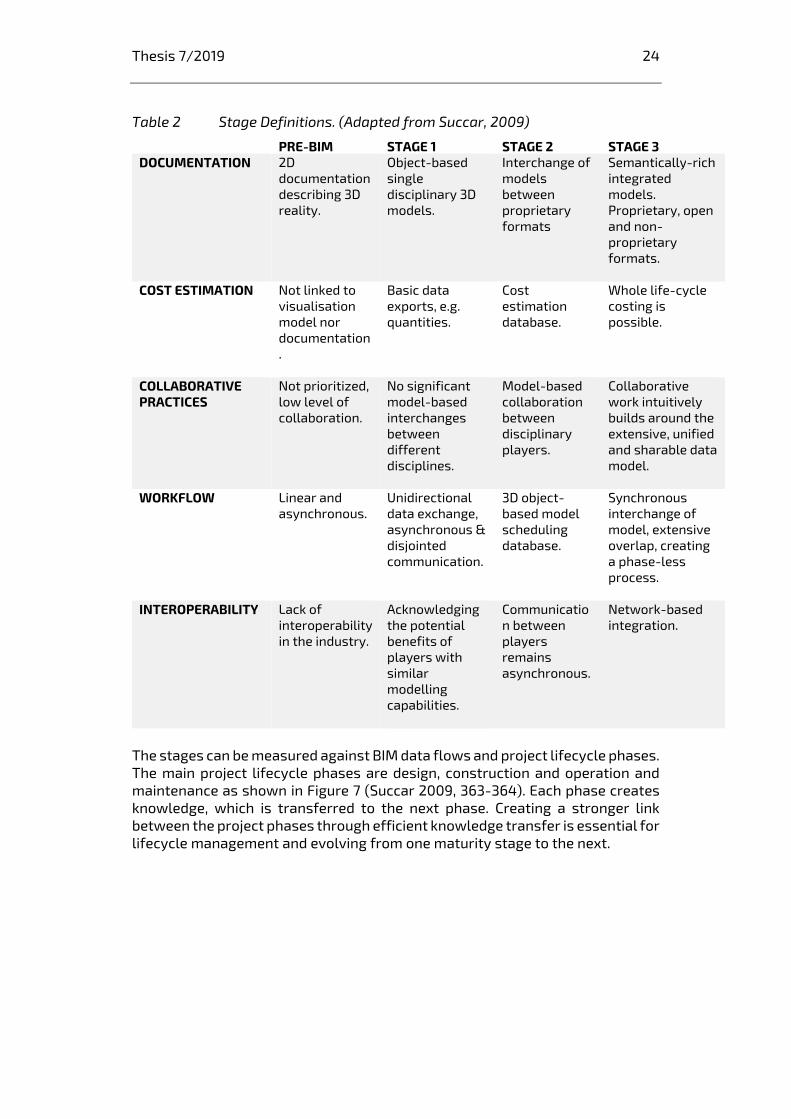
Characteristics of the stages are collected to Table 2. The following classifications were not presented in the original work in such categories, but all elements derive from the descriptions of the maturity stages (Succar 2009, 364-365), and are here presented in a more understandable format to give the reader an overview of each stage in relation with the other stages. The table also shows only stages through pre-BIM, 1, 2 and 3. The level of integrated project delivery was left out, since there are many different definitions from different authors, thus a clear continuum to the classifications was not established. Overall the definitions, or long-term visions that IDP could be are loosely defined to include different views (Succar 2009, 365). IDP can be seen as a project delivery approach including people, systems, different business structures and practices. It can also be an integrative approach with collaboration, coordination, communication and decision support. In addition it can be viewed as an automated project process, working on radical new technology in all phases of a facility’s lifecycle. (Succar 2009. 365)
Thesis 7/2019 24
Table 2 Stage Definitions. (Adapted from Succar, 2009)
PRE-BIM STAGE 1 STAGE 2 STAGE 3 DOCUMENTATION 2D
documentation describing 3D reality.
Object-based single disciplinary 3D models.
Interchange of models between proprietary formats
Semantically-rich integrated models. Proprietary, open and non-proprietary formats.
COST ESTIMATION Not linked to visualisation model nor documentation.
Basic data exports, e.g. quantities.
Cost estimation database.
Whole life-cycle costing is possible.
COLLABORATIVE PRACTICES
Not prioritized, low level of collaboration.
No significant model-based interchanges between different disciplines.
Model-based collaboration between disciplinary players.
Collaborative work intuitively builds around the extensive, unified and sharable data model.
WORKFLOW Linear and asynchronous.
Unidirectional data exchange, asynchronous & disjointed communication.
3D object-based model scheduling database.
Synchronous interchange of model, extensive overlap, creating a phase-less process.
INTEROPERABILITY Lack of interoperability in the industry.
Acknowledging the potential benefits of players with similar modelling capabilities.
Communication between players remains asynchronous.
Network-based integration.
The stages can be measured against BIM data flows and project lifecycle phases. The main project lifecycle phases are design, construction and operation and maintenance as shown in Figure 7 (Succar 2009, 363-364). Each phase creates knowledge, which is transferred to the next phase. Creating a stronger link between the project phases through efficient knowledge transfer is essential for lifecycle management and evolving from one maturity stage to the next.
Thesis 7/2019 25
Figure 7 Main project lifecycle phases. (Adapted from Succar 2009)
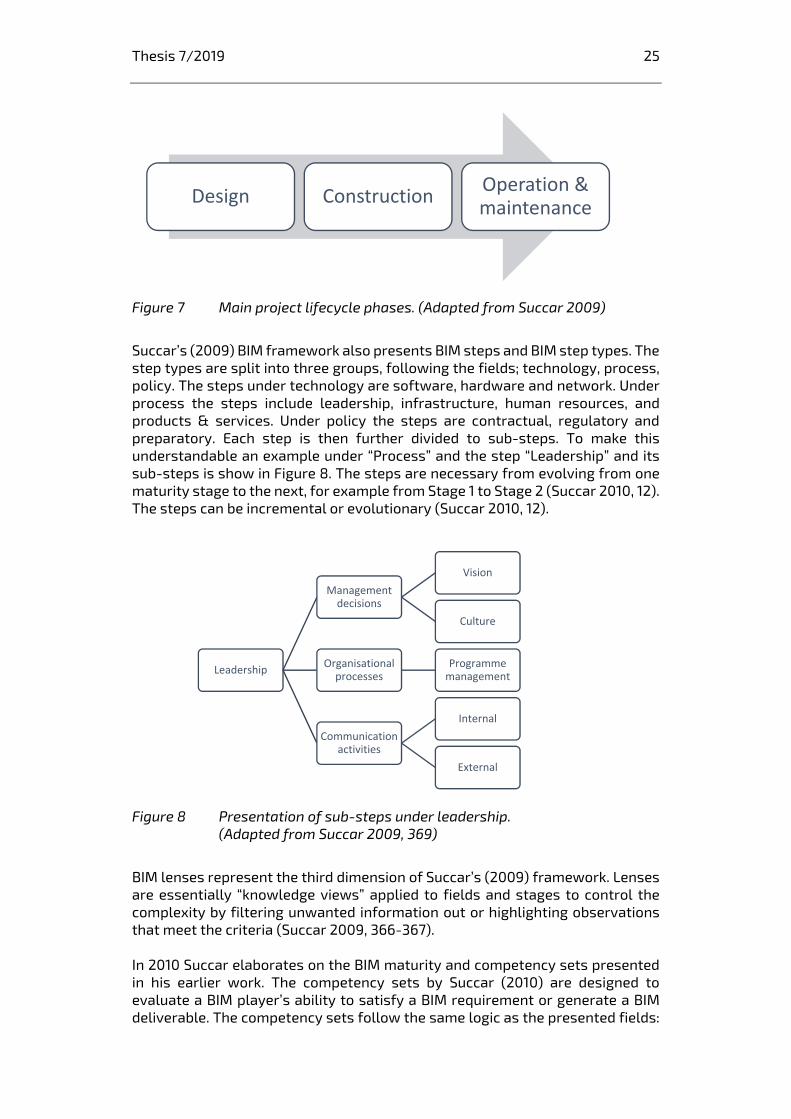
Succar’s (2009) BIM framework also presents BIM steps and BIM step types. The step types are split into three groups, following the fields; technology, process, policy. The steps under technology are software, hardware and network. Under process the steps include leadership, infrastructure, human resources, and products & services. Under policy the steps are contractual, regulatory and preparatory. Each step is then further divided to sub-steps. To make this understandable an example under “Process” and the step “Leadership” and its sub-steps is show in Figure 8. The steps are necessary from evolving from one maturity stage to the next, for example from Stage 1 to Stage 2 (Succar 2010, 12). The steps can be incremental or evolutionary (Succar 2010, 12).
Figure 8 Presentation of sub-steps under leadership. (Adapted from Succar 2009, 369)
BIM lenses represent the third dimension of Succar’s (2009) framework. Lenses are essentially “knowledge views” applied to fields and stages to control the complexity by filtering unwanted information out or highlighting observations that meet the criteria (Succar 2009, 366-367). In 2010 Succar elaborates on the BIM maturity and competency sets presented in his earlier work. The competency sets by Succar (2010) are designed to evaluate a BIM player’s ability to satisfy a BIM requirement or generate a BIM deliverable. The competency sets follow the same logic as the presented fields:
Design ConstructionOperation & maintenance
Leadership
Management decisions
Vision
Culture
Organisational processes
Programme management
Communication activities
Internal
External
Thesis 7/2019 26
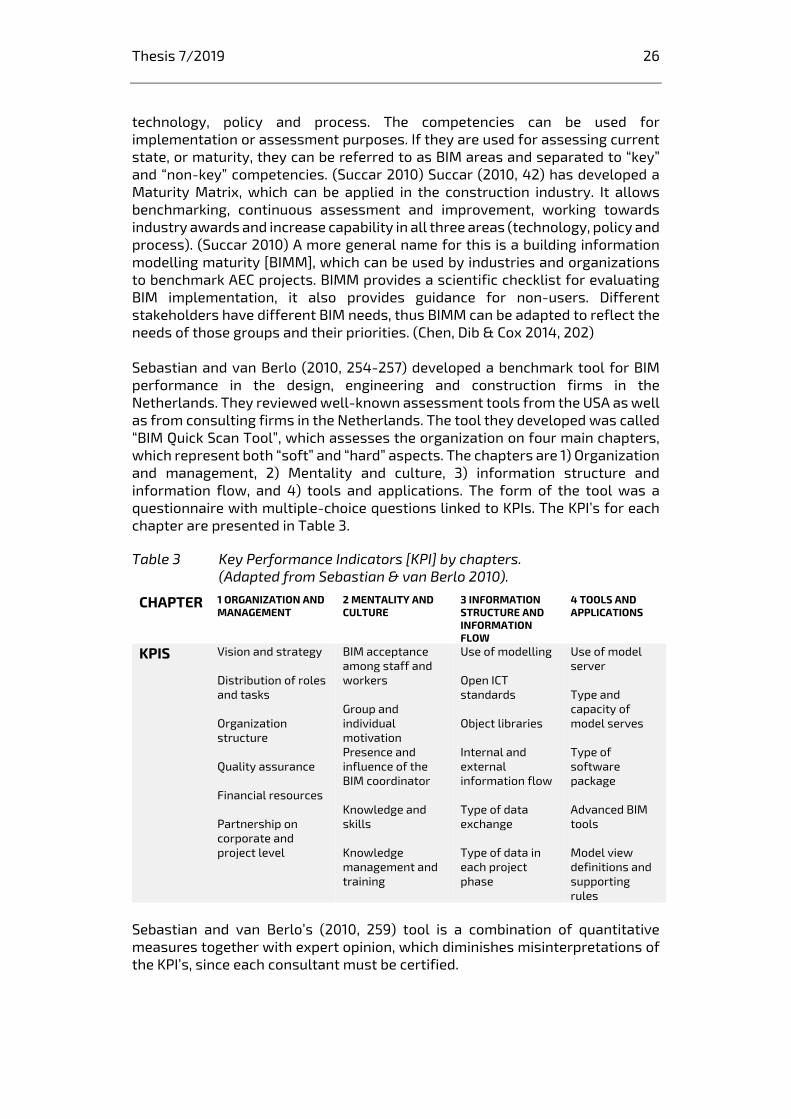
technology, policy and process. The competencies can be used for implementation or assessment purposes. If they are used for assessing current state, or maturity, they can be referred to as BIM areas and separated to “key” and “non-key” competencies. (Succar 2010) Succar (2010, 42) has developed a Maturity Matrix, which can be applied in the construction industry. It allows benchmarking, continuous assessment and improvement, working towards industry awards and increase capability in all three areas (technology, policy and process). (Succar 2010) A more general name for this is a building information modelling maturity [BIMM], which can be used by industries and organizations to benchmark AEC projects. BIMM provides a scientific checklist for evaluating BIM implementation, it also provides guidance for non-users. Different stakeholders have different BIM needs, thus BIMM can be adapted to reflect the needs of those groups and their priorities. (Chen, Dib & Cox 2014, 202) Sebastian and van Berlo (2010, 254-257) developed a benchmark tool for BIM performance in the design, engineering and construction firms in the Netherlands. They reviewed well-known assessment tools from the USA as well as from consulting firms in the Netherlands. The tool they developed was called “BIM Quick Scan Tool”, which assesses the organization on four main chapters, which represent both “soft” and “hard” aspects. The chapters are 1) Organization and management, 2) Mentality and culture, 3) information structure and information flow, and 4) tools and applications. The form of the tool was a questionnaire with multiple-choice questions linked to KPIs. The KPI’s for each chapter are presented in Table 3.
Table 3 Key Performance Indicators [KPI] by chapters. (Adapted from Sebastian & van Berlo 2010).
CHAPTER 1 ORGANIZATION AND MANAGEMENT
2 MENTALITY AND CULTURE
3 INFORMATION STRUCTURE AND INFORMATION FLOW
4 TOOLS AND APPLICATIONS
KPIS Vision and strategy Distribution of roles and tasks Organization structure Quality assurance Financial resources Partnership on corporate and project level
BIM acceptance among staff and workers Group and individual motivation Presence and influence of the BIM coordinator Knowledge and skills Knowledge management and training
Use of modelling Open ICT standards Object libraries Internal and external information flow Type of data exchange Type of data in each project phase
Use of model server Type and capacity of model serves Type of software package Advanced BIM tools Model view definitions and supporting rules
Sebastian and van Berlo’s (2010, 259) tool is a combination of quantitative measures together with expert opinion, which diminishes misinterpretations of the KPI’s, since each consultant must be certified.
Thesis 7/2019 27
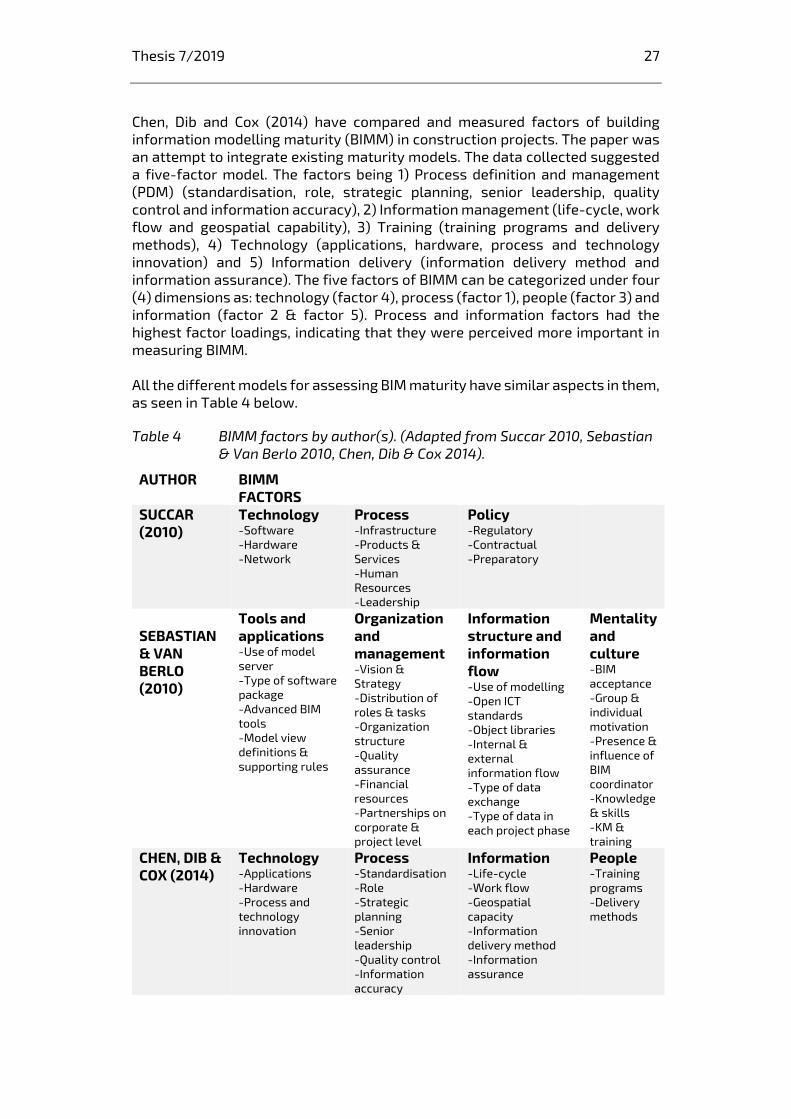
Chen, Dib and Cox (2014) have compared and measured factors of building information modelling maturity (BIMM) in construction projects. The paper was an attempt to integrate existing maturity models. The data collected suggested a five-factor model. The factors being 1) Process definition and management (PDM) (standardisation, role, strategic planning, senior leadership, quality control and information accuracy), 2) Information management (life-cycle, work flow and geospatial capability), 3) Training (training programs and delivery methods), 4) Technology (applications, hardware, process and technology innovation) and 5) Information delivery (information delivery method and information assurance). The five factors of BIMM can be categorized under four (4) dimensions as: technology (factor 4), process (factor 1), people (factor 3) and information (factor 2 & factor 5). Process and information factors had the highest factor loadings, indicating that they were perceived more important in measuring BIMM. All the different models for assessing BIM maturity have similar aspects in them, as seen in Table 4 below.
Table 4 BIMM factors by author(s). (Adapted from Succar 2010, Sebastian & Van Berlo 2010, Chen, Dib & Cox 2014).
AUTHOR BIMM FACTORS
SUCCAR (2010)
Technology -Software -Hardware -Network
Process -Infrastructure -Products & Services -Human Resources -Leadership
Policy -Regulatory -Contractual -Preparatory
SEBASTIAN & VAN BERLO (2010)
Tools and applications -Use of model server -Type of software package -Advanced BIM tools -Model view definitions & supporting rules
Organization and management -Vision & Strategy -Distribution of roles & tasks -Organization structure -Quality assurance -Financial resources -Partnerships on corporate & project level
Information structure and information flow -Use of modelling -Open ICT standards -Object libraries -Internal & external information flow -Type of data exchange -Type of data in each project phase
Mentality and culture -BIM acceptance -Group & individual motivation -Presence & influence of BIM coordinator -Knowledge & skills -KM & training
CHEN, DIB & COX (2014)
Technology -Applications -Hardware -Process and technology innovation
Process -Standardisation -Role -Strategic planning -Senior leadership -Quality control -Information accuracy
Information -Life-cycle -Work flow -Geospatial capacity -Information delivery method -Information assurance
People -Training programs -Delivery methods
Thesis 7/2019 28
Technology was something that was assessed in all three models rather similarly. Succar’s model presents the factors on a broad level, due to the model’s structure of fields, steps and sub-steps. The elements seen on Sebastian and van Berlo’s, as well Chen, Dib and Cox’s models are also found from Succar’s model, but only after the main steps. In that sense, Succar’s model is more precise after the “first layer”, since there are multiple sub-steps for each, making it a very comprehensive list of things to evaluate. Sebastian and van Berlo have emphasized the role of information and mentality and culture in the organization, which add to the aspect of soft elements in organizations, which should be evaluated as well. They also stress that combining both quantitative and qualitative elements increases objectivity and consistency. Their tool could be used for both benchmarking and comparison between organizations. Chen, Dib and Cox model seems to be a combination of both of the above mentioned models. Under information they have stressed factors such as life-cycle and information delivery method, which are interesting. All the models are good for assessing BIM maturity, but maybe lack some characteristics for benchmarking and are quite heavy for organizations to use without an outside consultant, which of course is a cost. While BIM implementation and use are on-going processes, a light tool that could be used for continuous benchmarking is be needed. The maturity stages of an organization’s BIM were tested against project performance KPI’s (time, cost, quality) to see if the elements of maturity actually play a role. The survey followed a Pennsylvania State University’s Organizational BIM Assessment Model, which was modified to with the Dutch AECO (architectural, engineering, construction and operation) industry. The established organizational BIM elements included strategy, BIM uses, process, information, infrastructure and personnel. The results show that the maturity level of BIM has very little impact on project performance. The only element that had a small, but not significant, positive effect in time and cost performance, is investments in improving BIM strategy maturity (i.e. mission, vision, goals, management support, BIM champions and BIM planning committee). Thus, the widely accepted view that investments in BIM maturity would yield to positive project performance has been challenged. (Smits, van Buiten & Hartmann 2017, 336-344)
2.4 Information Systems Strategy
Information systems [IS] strategy research traces back to the 1970’s and has been a popular subject in academia since (Teubner 2013; Ward 2012). In the beginning, in 1960s, the focus was more on data processing but has since shifted to management and strategic information systems [ISS] (Teubner 2013, 244-245). Most ISS definitions include long-term planning for IT and how information systems are aligned with other business activities (Ward 2012, 166). Chen, Mocker, Preston and Teubner (2010, 235) define IS strategy as “an organizational perspective on the investment in, deployment, use, and management of information systems.”
Thesis 7/2019 29
There is a certain level of variation both in content and terms of IS strategy; synonyms and often used names are IT strategy, IT/IS strategy and information strategy (Teubner 2013, 246). Chen et al. (2010, 238) reviewed IS strategy publications, and found three conceptions of IS strategy: 1) IS strategy as the use of IS to support business strategy, 2) IS strategy as the master plan of the IS function, and 3) IS strategy as the shared view of the IS role within the organization. In 2013 Teubner added a fourth conception, which in his article, and here, is number two: 1) IS strategy as basic (managerial) disposition towards IT, 2) IS strategy as departmental plan, 3) IS strategy as extended arm of business strategy, and 4) IS strategy as a master plan. The first one is directed from a managerial level such as mission statements, which steer the direction of IS/IT. The decisions vary based on how IT/IS perceived in the company, e.g. as a competitive advantage or a supportive function. (Chen et al. 2010, 238-241; Teubner 2013, 246-247) The second one is a more concrete departmental plan for IS strategy, often carried out by an IT department using existing IT resources (Teubner 2013, 246-247). The third one considers IS strategy as an extension to the business strategy, which means that same goals and measures apply to both strategies. IS strategy is built so that it provides the technical infrastructure needed to execute the business strategy. (Teubner 2013, 246-247) The fourth type of IS strategy is the “master plan”, where the strategy serves as a blueprint for company wide information processing infrastructure development. (Chen et al. 2010, 240-241; Teubner 2013, 246-247) Galliers (2004) attempted to create a more comprehensive framework for strategizing information systems, building on the earlier works on information systems. The created framework takes into account four questions: Why? What? Who? and How? (Galliers 2004, 241). The framework is seen in Figure 9. It considers emergent features of strategic decisions and their unintended consequences, like reactions of stakeholders. Hence, ongoing assessment and review, and change management or implementation strategy were added to the model. The framework can be used as an assessment tool by examining, which elements are fulfilled and to which level. The assessment can be used for future development, but also to question the current strategy in relation to the changing business environment.
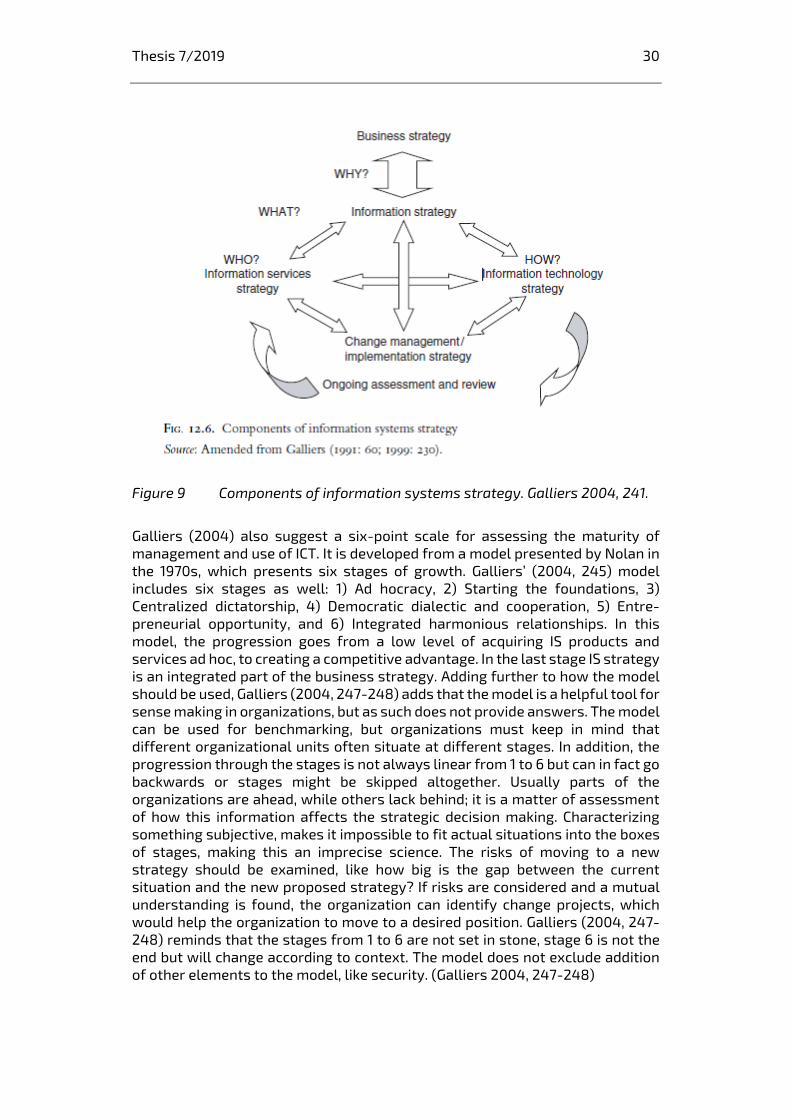
Thesis 7/2019 30
Figure 9 Components of information systems strategy. Galliers 2004, 241.
Galliers (2004) also suggest a six-point scale for assessing the maturity of management and use of ICT. It is developed from a model presented by Nolan in the 1970s, which presents six stages of growth. Galliers’ (2004, 245) model includes six stages as well: 1) Ad hocracy, 2) Starting the foundations, 3) Centralized dictatorship, 4) Democratic dialectic and cooperation, 5) Entre-preneurial opportunity, and 6) Integrated harmonious relationships. In this model, the progression goes from a low level of acquiring IS products and services ad hoc, to creating a competitive advantage. In the last stage IS strategy is an integrated part of the business strategy. Adding further to how the model should be used, Galliers (2004, 247-248) adds that the model is a helpful tool for sense making in organizations, but as such does not provide answers. The model can be used for benchmarking, but organizations must keep in mind that different organizational units often situate at different stages. In addition, the progression through the stages is not always linear from 1 to 6 but can in fact go backwards or stages might be skipped altogether. Usually parts of the organizations are ahead, while others lack behind; it is a matter of assessment of how this information affects the strategic decision making. Characterizing something subjective, makes it impossible to fit actual situations into the boxes of stages, making this an imprecise science. The risks of moving to a new strategy should be examined, like how big is the gap between the current situation and the new proposed strategy? If risks are considered and a mutual understanding is found, the organization can identify change projects, which would help the organization to move to a desired position. Galliers (2004, 247-248) reminds that the stages from 1 to 6 are not set in stone, stage 6 is not the end but will change according to context. The model does not exclude addition of other elements to the model, like security. (Galliers 2004, 247-248)
Thesis 7/2019 31
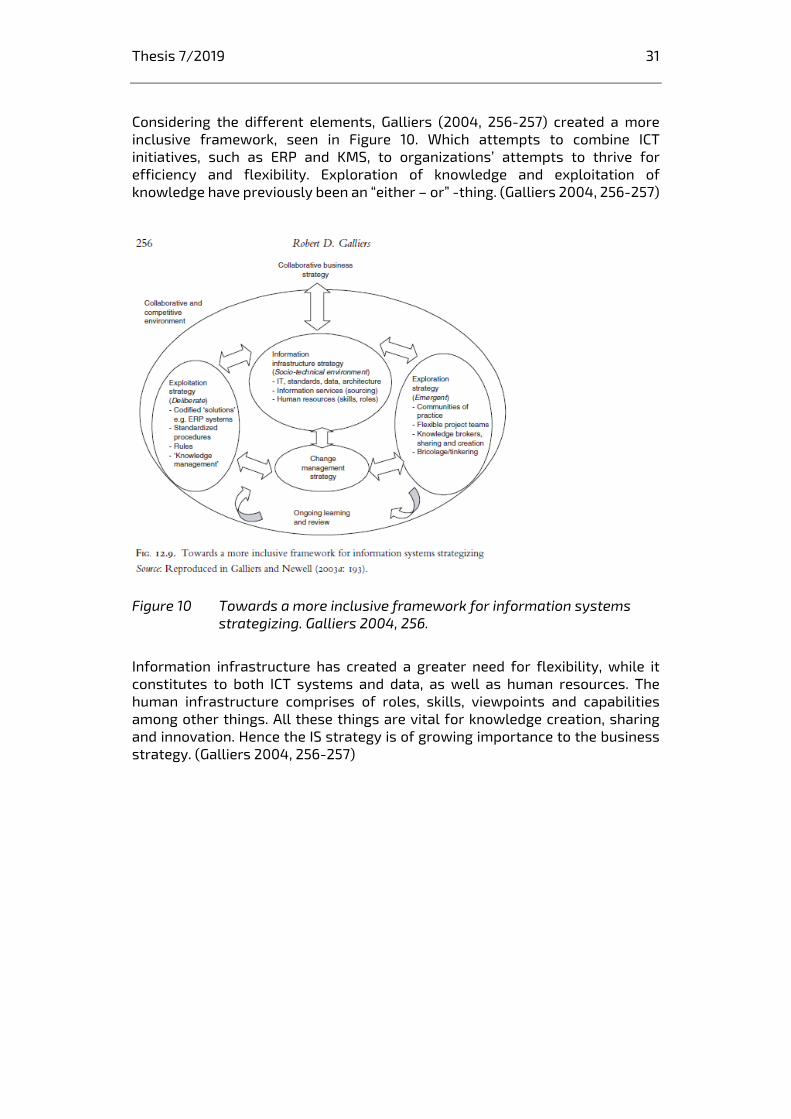
Considering the different elements, Galliers (2004, 256-257) created a more inclusive framework, seen in Figure 10. Which attempts to combine ICT initiatives, such as ERP and KMS, to organizations’ attempts to thrive for efficiency and flexibility. Exploration of knowledge and exploitation of knowledge have previously been an “either – or” -thing. (Galliers 2004, 256-257)
Figure 10 Towards a more inclusive framework for information systems strategizing. Galliers 2004, 256.
Information infrastructure has created a greater need for flexibility, while it constitutes to both ICT systems and data, as well as human resources. The human infrastructure comprises of roles, skills, viewpoints and capabilities among other things. All these things are vital for knowledge creation, sharing and innovation. Hence the IS strategy is of growing importance to the business strategy. (Galliers 2004, 256-257)
Thesis 7/2019 32
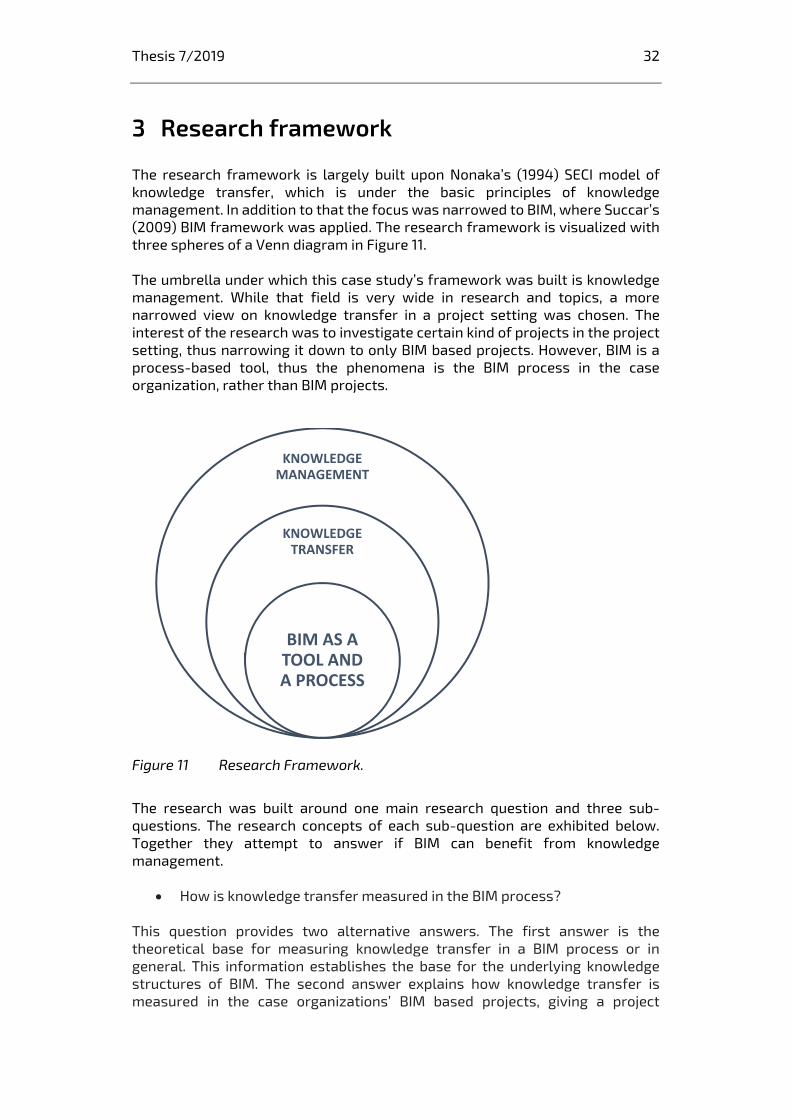
3 Research framework
The research framework is largely built upon Nonaka’s (1994) SECI model of knowledge transfer, which is under the basic principles of knowledge management. In addition to that the focus was narrowed to BIM, where Succar’s (2009) BIM framework was applied. The research framework is visualized with three spheres of a Venn diagram in Figure 11. The umbrella under which this case study’s framework was built is knowledge management. While that field is very wide in research and topics, a more narrowed view on knowledge transfer in a project setting was chosen. The interest of the research was to investigate certain kind of projects in the project setting, thus narrowing it down to only BIM based projects. However, BIM is a process-based tool, thus the phenomena is the BIM process in the case organization, rather than BIM projects.
Figure 11 Research Framework.
The research was built around one main research question and three sub-questions. The research concepts of each sub-question are exhibited below. Together they attempt to answer if BIM can benefit from knowledge management.
How is knowledge transfer measured in the BIM process? This question provides two alternative answers. The first answer is the theoretical base for measuring knowledge transfer in a BIM process or in general. This information establishes the base for the underlying knowledge structures of BIM. The second answer explains how knowledge transfer is measured in the case organizations’ BIM based projects, giving a project
KNOWLEDGE MANAGEMENT
KNOWLEDGE TRANSFER
BIM AS A TOOL AND A PROCESS
Thesis 7/2019 33
perspective and knowledge of current processes. Both answers are of interest, the first one is giving tools to understand the second. To answer the question of how knowledge transfer is measured in the BIM process, it is crucial to understand what knowledge transfer is and how it relates to BIM. The linking factors are “information”, which is found in both Building Information Modelling and Knowledge Management, as well as technology. In short, BIM is a technology enabled tool for information and knowledge sharing.
What steps should be taken to increase the level of knowledge transfer in the BIM process?
Organizations and firms invest in BIM development in hopes of benefits, like better return on investment and cost savings. It is believed that to access these benefits, BIM needs to executed at a certain level. To reach a level, where BIM is benefitting the company, instead of being a cost, something usually needs to change. The underlying assumption is that, since BIM is an information-based tool, the process of transferring that information could be the answer to accessing the benefits of BIM. The first task would be to assess, how BIM process was currently handled in the case organization. The placement of FTIA as a public client organization is somewhat unique, which lead to the decision to use a simpler model for assessment at this stage. The organization is complex; thus an expectation of noticeable knowledge silos and lack of interoperability were expected. For assessment a matrix was created. Through the matrix and other findings, steps for increasing knowledge transfer would hopefully emerge.
How can knowledge transfer be supported? This question is hoped to sprung answers, which would be beneficial for the organization in practice. One part is cross-checking between what problems project intensive organizations usually face in knowledge transfer and seeing if they are also present in the case organization. This way good methods, which have improved knowledge transfer elsewhere, could be implemented at the case organization. However, small adjustments may be necessary to fit the organization culture and industry.
Thesis 7/2019 34
4 Research Methodology
The chosen research method was case study, which used qualitative research traditions; interpretation and understanding a process in the selected context. Qualitative research is often used, when there is a lack of previous knowledge of a phenomenon. This implies that qualitative research can be more flexible and exploratory because of the complexity of the problems (Eriksson & Kovalainen 2008, 6) This research will be conducted as a case study. The scope of a case study, according to Yin (1994, 13) “A case study is an empirical inquiry that
investigates contemporary phenomenon within its real-life context, especially when
the boundaries between phenomenon and context are not clearly evident.”
Defining the scope is only half of the technical definition for a case study. The second part consists of a case study inquiry. “The case study inquiry
copes with the technically distinctive situation in which there will be many more variables of interest than data points, and as one result
relies on multiple sources of evidence, with data needing to converge in a triangulating fashion, and as another result
benefits from the prior development of theoretical propositions to guide data collection and analysis.” Yin (1994, 13)
The phenomenon presents a single case study view, which is justified on the grounds that it is revelatory case (Yin 1994, 40). Knowledge management and its connection to possible BIM benefits have not been studied in the Finnish Transport Infrastructure Agency, nor in any similar organizations.
4.1 Research context and brief case description
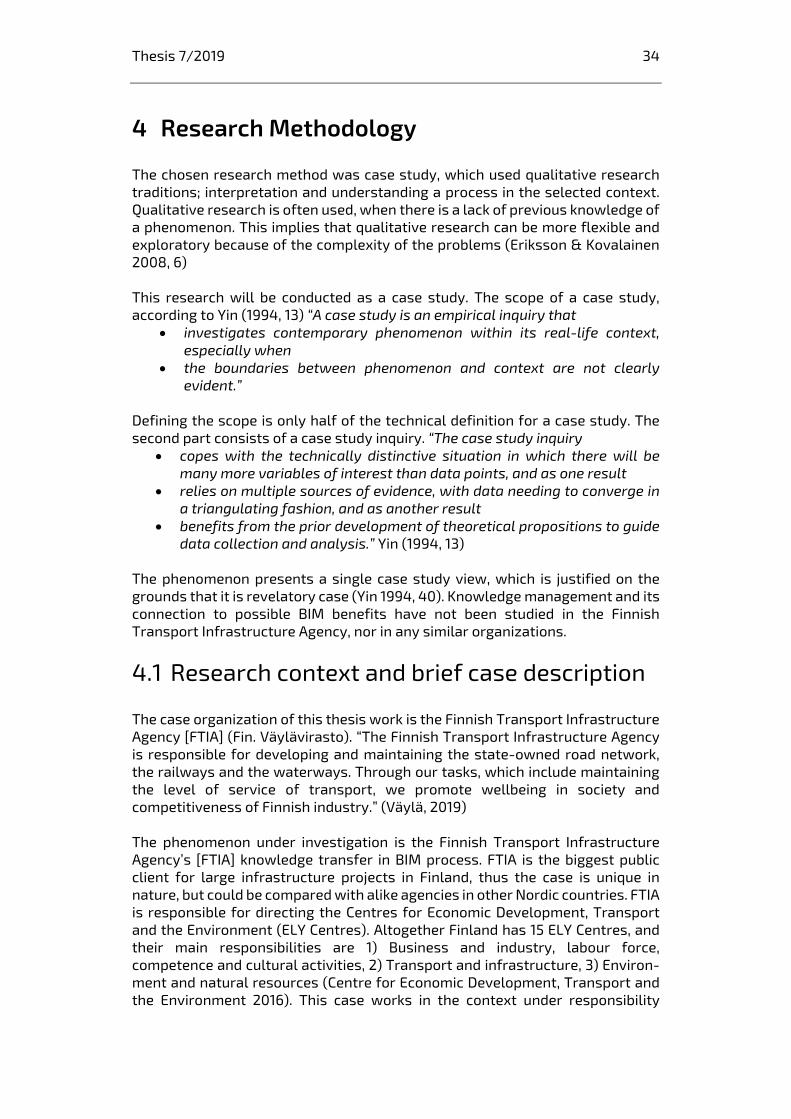
The case organization of this thesis work is the Finnish Transport Infrastructure Agency [FTIA] (Fin. Väylävirasto). “The Finnish Transport Infrastructure Agency is responsible for developing and maintaining the state-owned road network, the railways and the waterways. Through our tasks, which include maintaining the level of service of transport, we promote wellbeing in society and competitiveness of Finnish industry.” (Väylä, 2019) The phenomenon under investigation is the Finnish Transport Infrastructure Agency’s [FTIA] knowledge transfer in BIM process. FTIA is the biggest public client for large infrastructure projects in Finland, thus the case is unique in nature, but could be compared with alike agencies in other Nordic countries. FTIA is responsible for directing the Centres for Economic Development, Transport and the Environment (ELY Centres). Altogether Finland has 15 ELY Centres, and their main responsibilities are 1) Business and industry, labour force, competence and cultural activities, 2) Transport and infrastructure, 3) Environ-ment and natural resources (Centre for Economic Development, Transport and the Environment 2016). This case works in the context under responsibility
Thesis 7/2019 35
number two; transport and infrastructure. To understand the working environ-ment of FTIA and how ELY Centres are involved with this process, from the BIM point of view the following is presented in Figure 12.
Figure 12 The Finnish Transport Infrastructure Agency’s Field of Operation.
To further expand the context of infrastructure, it falls under civil infrastructure, where transportation infrastructure is one sub-group. Civil infrastructures are facilities, structures or utilities needed to support human civilization and activities. The domain of transportation infrastructure has eight (8) categories under it: bridges, roads and highways, railways, mass transit, tunnels, aviation and airports, ports, dock and harbours, and non-motorized vehicle and pedestrian pathways. (Costin, Adibfar, Hu & Chen 2018, 258-259) The internal research at FTIA about BIM has grown, between 2016 and 2018 eight (8) out of 30 theses had BIM or the Finnish equivalent “tietomalli” in their title. In 2016 the amount was two (2) out of 16, in 2017 two (2) out of four (4), in 2018 four (4) out of 10. (Väylä 2019) The analysed titles are collected in Table 5 below. Six of these theses investigate a small part of the BIM process, which is relevant for one discipline or process phase. Only two theses grasp a more general level, thus this information could be applied on a larger scale. These two are the publications focusing on risk assessment and the initial and design data of model-based projects.
Finnish Government
Ministry of Transport and Communications
Finnish Transport Infrastructure Agency
ELY CentresMunicipalities
Thesis 7/2019 36
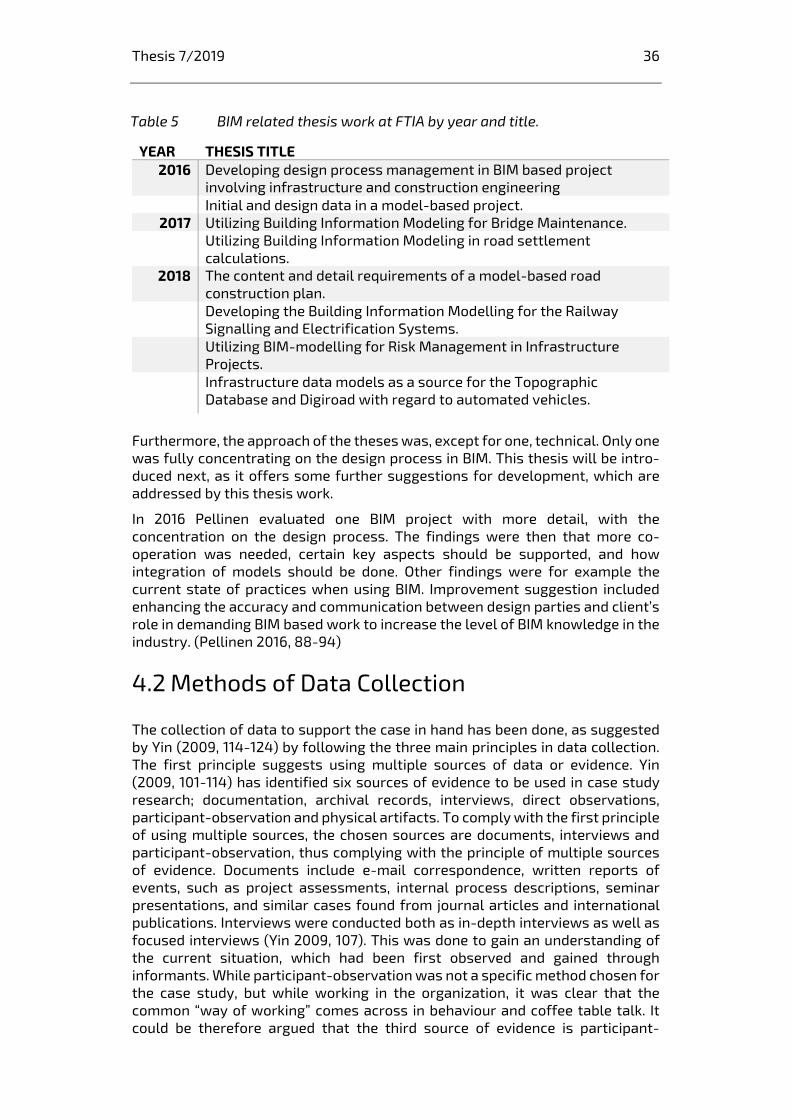
Furthermore, the approach of the theses was, except for one, technical. Only one was fully concentrating on the design process in BIM. This thesis will be intro-duced next, as it offers some further suggestions for development, which are addressed by this thesis work.
In 2016 Pellinen evaluated one BIM project with more detail, with the concentration on the design process. The findings were then that more co-operation was needed, certain key aspects should be supported, and how integration of models should be done. Other findings were for example the current state of practices when using BIM. Improvement suggestion included enhancing the accuracy and communication between design parties and client’s role in demanding BIM based work to increase the level of BIM knowledge in the industry. (Pellinen 2016, 88-94)
4.2 Methods of Data Collection
The collection of data to support the case in hand has been done, as suggested by Yin (2009, 114-124) by following the three main principles in data collection. The first principle suggests using multiple sources of data or evidence. Yin (2009, 101-114) has identified six sources of evidence to be used in case study research; documentation, archival records, interviews, direct observations, participant-observation and physical artifacts. To comply with the first principle of using multiple sources, the chosen sources are documents, interviews and participant-observation, thus complying with the principle of multiple sources of evidence. Documents include e-mail correspondence, written reports of events, such as project assessments, internal process descriptions, seminar presentations, and similar cases found from journal articles and international publications. Interviews were conducted both as in-depth interviews as well as focused interviews (Yin 2009, 107). This was done to gain an understanding of the current situation, which had been first observed and gained through informants. While participant-observation was not a specific method chosen for the case study, but while working in the organization, it was clear that the common “way of working” comes across in behaviour and coffee table talk. It could be therefore argued that the third source of evidence is participant-
Table 5 BIM related thesis work at FTIA by year and title.
YEAR THESIS TITLE 2016 Developing design process management in BIM based project
involving infrastructure and construction engineering Initial and design data in a model-based project.
2017 Utilizing Building Information Modeling for Bridge Maintenance. Utilizing Building Information Modeling in road settlement calculations.
2018 The content and detail requirements of a model-based road construction plan. Developing the Building Information Modelling for the Railway Signalling and Electrification Systems. Utilizing BIM-modelling for Risk Management in Infrastructure Projects. Infrastructure data models as a source for the Topographic Database and Digiroad with regard to automated vehicles.
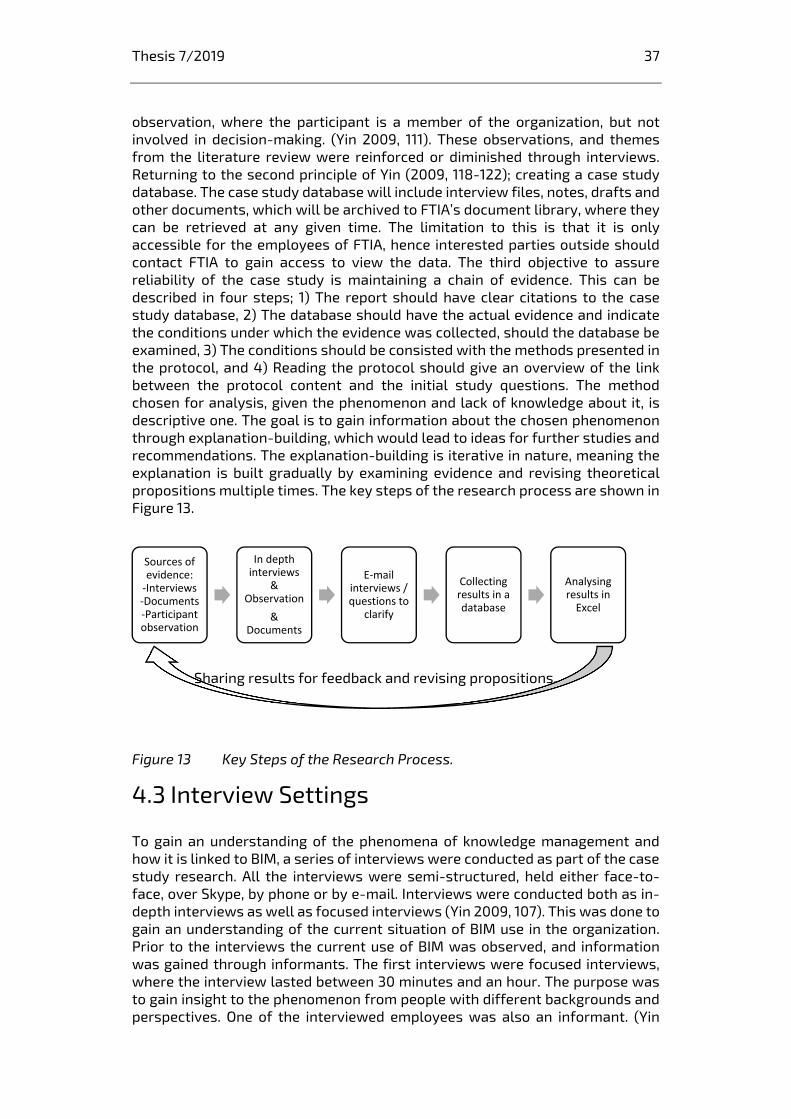
Thesis 7/2019 37
observation, where the participant is a member of the organization, but not involved in decision-making. (Yin 2009, 111). These observations, and themes from the literature review were reinforced or diminished through interviews. Returning to the second principle of Yin (2009, 118-122); creating a case study database. The case study database will include interview files, notes, drafts and other documents, which will be archived to FTIA’s document library, where they can be retrieved at any given time. The limitation to this is that it is only accessible for the employees of FTIA, hence interested parties outside should contact FTIA to gain access to view the data. The third objective to assure reliability of the case study is maintaining a chain of evidence. This can be described in four steps; 1) The report should have clear citations to the case study database, 2) The database should have the actual evidence and indicate the conditions under which the evidence was collected, should the database be examined, 3) The conditions should be consisted with the methods presented in the protocol, and 4) Reading the protocol should give an overview of the link between the protocol content and the initial study questions. The method chosen for analysis, given the phenomenon and lack of knowledge about it, is descriptive one. The goal is to gain information about the chosen phenomenon through explanation-building, which would lead to ideas for further studies and recommendations. The explanation-building is iterative in nature, meaning the explanation is built gradually by examining evidence and revising theoretical propositions multiple times. The key steps of the research process are shown in Figure 13.
4.3 Interview Settings
To gain an understanding of the phenomena of knowledge management and how it is linked to BIM, a series of interviews were conducted as part of the case study research. All the interviews were semi-structured, held either face-to-face, over Skype, by phone or by e-mail. Interviews were conducted both as in-depth interviews as well as focused interviews (Yin 2009, 107). This was done to gain an understanding of the current situation of BIM use in the organization. Prior to the interviews the current use of BIM was observed, and information was gained through informants. The first interviews were focused interviews, where the interview lasted between 30 minutes and an hour. The purpose was to gain insight to the phenomenon from people with different backgrounds and perspectives. One of the interviewed employees was also an informant. (Yin
Sources of evidence:‐Interviews‐Documents‐Participant observation
In depth interviews
& Observation
&Documents
E‐mail interviews / questions to
clarify
Collecting results in a database
Analysing results in Excel
Sharing results for feedback and revising propositions.
Figure 13 Key Steps of the Research Process.
Thesis 7/2019 38
1994, 84-85). This informant gave information on who to interview and where to look for information and provided access to platforms discussing the topic of BIM nationally and internationally. The interview structure was the same for all interviews conducted during the first phase of focused interviews. Altogether seven (7) interviews were held at the first phase. The structure of the interview was set up by themes as: background information, knowledge management in projects, BIM use, future of building information modelling in the infrastructure sector, BIM related assessment, IT-systems and lifecycle thinking. While the questions were under a certain theme, the interviews were informal, and the conversation steered itself naturally to different themes and sometimes to topics outside of the scope. This kind of interview protocol is also suggested by Yin (2011, 139). The choice of not steering the conversation unnaturally was premeditated. In addition, it is hard to talk about BIM tools without simultaneously addressing IT –systems and knowledge management. This was also beneficial for the inter-viewer to see that the chosen themes were in fact interlinked and all relevant to the study. The questions were open-ended, provoking longer answers and explanations than simple yes’ and nos. In cases where answers were unclear, probing was used for elaboration and clarification. One interview took place as an e-mail interview, where additional questions were sent only after the first round of questions and answers had been received back. Two e-mail enquiries were conducted, which were informal in nature and were focused on a certain small topic, which needed elaboration. The enquiries were more for context building than actual primary data collection. In addition to the first round of interviews group interviews were held in the form of expert panels, where the preliminary findings were presented. One topic was the assessment matrix under development. These expert panels also included some of the same people, who were interviewed during the first phase, thus giving them an opportunity to comment on the early findings. The panels were not in the form of a traditional interviews, but rather feedback forums and free discussion platforms, where the interviewer was a facilitator.
4.4 Methods of Data Analysis
The analytical phases of the qualitative data, in this case interviews and secondary sources, is following a five phased cycle (Yin 2011, 177). The five phases are: compiling, disassembling, reassembling, interpreting and concluding (Yin 2011, 177-179). The collected data was analysed through the method of coding. Coding is attaching keywords to segment of text (Kvale 2011, 104). In practice this meant that the interview transcripts and notes were examined in the purpose of finding concepts. The concepts found were initial codes or open codes, at this point the data was disassembled. The open codes were words, sentences or longer paragraphs of text. All these were collected to an Excel table, and given explanatory key words, such as “information sharing” or longer explanatory key phrases like “Formats and guidance enabling the movement of models”. Each open code was assigned either one or two explanatory key words or phrases to ensure that all information was documented and captured. After that the open
Thesis 7/2019 39
codes were then grouped and reorganized to form a higher level of conceptualization, thus reassembled as suggested by Yin 2011 (187-188). When the key words and phrases were written down, common categories emerged. A breakdown of the emerged categories and what kind of themes they have are interpreted as findings and finally the results are concluded as discussion. The findings about knowledge transfer were compared against the model by Arif et al. (2010) to determine the level of knowledge retention. The table from Appendix 1 was in Excel, where each row was assigned a level based on the inter-views. This way the knowledge retention was measured and given a numerical value. The secondary data sources were analysed using the five steps as suggested by Yin (2011, 177-179) compiling, disassembling, reassembling, interpreting and concluding. Publications and websites from credible authors and organizations were collected to an Excel table. The table had keywords for each source to keep track what was the relevant information from that source. The secondary data was used to find sources, which would give viable ideas for creating solutions for future applications. Relevant information was classified as something filling a gap from the primary findings.
4.5 Reliability and Validity
The reliability and validity of the research were ensured by following the principles of case study research by Yin (2009). To increase the reliability of the case study, maintaining a chain of evidence was made. The chain of evidence can be described in four steps; 1) The report should have clear citations to the case study database, 2) The database should have the actual evidence and indicate the conditions under which the evidence was collected, should the database be examined, 3) The conditions should be consisted with the methods presented in the protocol, and 4) Reading the protocol should give an overview of the link between the protocol content and the initial study questions. (Yin 2009) To comply, a database was established, which include original interview narratives, with information of time, place and who was present. This report aims to citate sources accurately to increase the reliability of the work. Some interview results are also citated in this work to create a link between the report and the results. However, some questions during the interviews had bad wording. For example, questions about linking information search and time consumption was difficult to answer, due to the ambiguity of what is meant by information search. The concept of BIM maturity was not familiar to most, and because of that the assessment of how the organization was perceived was difficult to estimate. However, answers were given on the how they see it in their own work and substance work. This question was later changed in the interviews, and a maturity level was not asked but rather how the usage and on what level skills regarding it are. The small sample size of primary data is also an issue, which makes the result less generalizable. Since this was a recognized risk, ensuring the reliability of the results was very important. Hence, the initial findings were distributed openly and were open for comments and feedback multiple times. This iterative work was seen to increase the reliability of the results.
Thesis 7/2019 40
5 Findings
This chapter will describe the findings of the data analysis, which is described in more detail under Research Methodology and Methods of Data Analysis. The general status and application of BIM was established during the interviews and confirmed later using a matrix for presenting and assessment. The major topic under knowledge management in BIM was the knowledge transfer. The focus of the study swiftly switched to that direction of knowledge management. Instead of measuring knowledge management as a whole a model for measuring knowledge retention was adopted, which was found fitting for assessing knowledge transfer.
5.1 Primary Data Findings
Primary data findings were around five themes: information, BIM use, process development, BIM Maturity, infrastructure and IT-systems. 5.1.1 Information
One of the big and a more general topic was information. Interviewees answered questions about how they share and search information. The answers were in many cases by-products of other questions, thus very interesting, while the responses were not filtered or premeditated. The category under information is roughly divided to three groups: sharing, searching and other. Findings for each group are presented next and compilation of the results are shown Figure 14. Sharing information was done mainly through direct informal communication, usually face-to-face, by phone/Skype or e-mail. This was found to be a dominant way for sharing information by all interviewees. This view was also enhanced by participant-observation, and reinforced by addressing the topic in a meeting, where participants agreed that information in the organization is mostly shared informally between colleagues. Where and how information was shared during projects, was very project specific. Projects were highly independent, and project knowledge was organized by the project manager as seen fit. There was no clear structure or policy for information sharing. Project portals were generally seen as good options for information sharing during projects. However, when projects end, and the information ought to go forward the problem of information management was recognized. ”The official place for storing documents and information are the project portals under each project. So in practice that’s where they stay. But a “design dump” or a database extract is handed over, which contains all that information. But they also have to be separate at BIM in these general formats, e.g. XML, GT, DWG, so that other design programs can use the same material.” – Project Manager Especially BIM information was difficult to pass on, while it cannot be trans-ferred to paper and/or archived, and there is no electronic database for the models. Currently models are transferred on flash drives or CDs, which are then physically scattered around, thus the information was more or less lost, and not
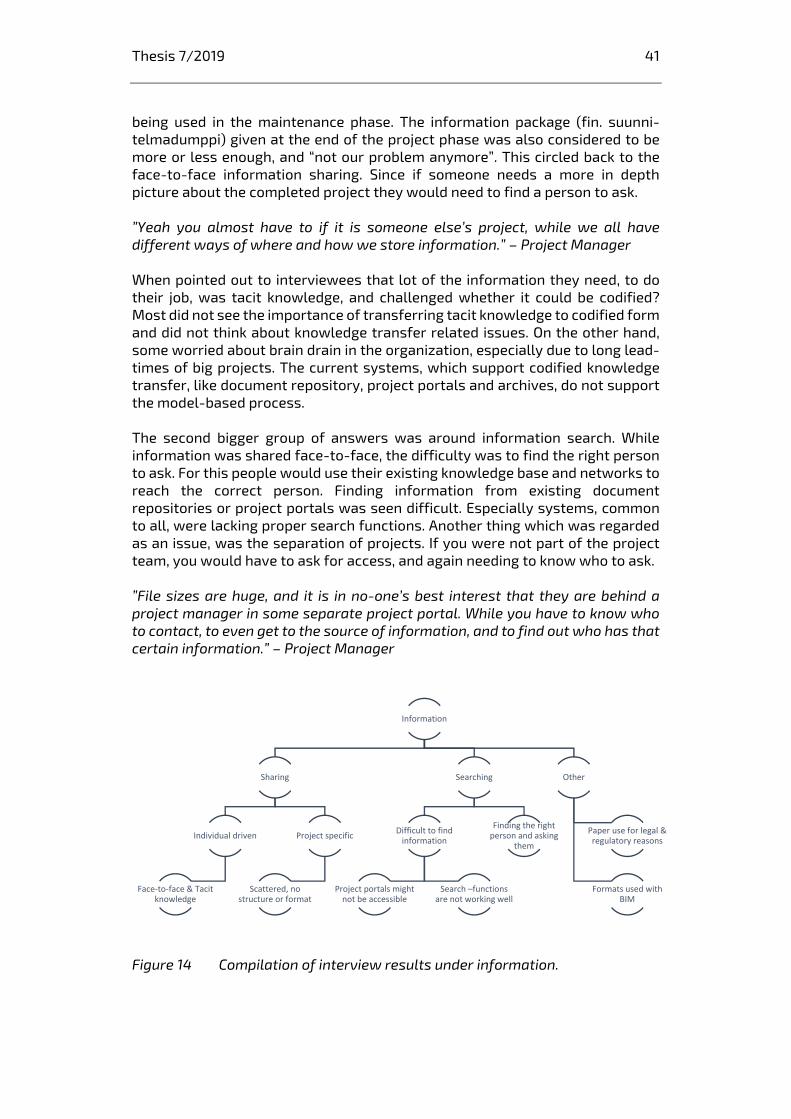
Thesis 7/2019 41
being used in the maintenance phase. The information package (fin. suunni-telmadumppi) given at the end of the project phase was also considered to be more or less enough, and “not our problem anymore”. This circled back to the face-to-face information sharing. Since if someone needs a more in depth picture about the completed project they would need to find a person to ask. ”Yeah you almost have to if it is someone else’s project, while we all have different ways of where and how we store information.” – Project Manager When pointed out to interviewees that lot of the information they need, to do their job, was tacit knowledge, and challenged whether it could be codified? Most did not see the importance of transferring tacit knowledge to codified form and did not think about knowledge transfer related issues. On the other hand, some worried about brain drain in the organization, especially due to long lead-times of big projects. The current systems, which support codified knowledge transfer, like document repository, project portals and archives, do not support the model-based process. The second bigger group of answers was around information search. While information was shared face-to-face, the difficulty was to find the right person to ask. For this people would use their existing knowledge base and networks to reach the correct person. Finding information from existing document repositories or project portals was seen difficult. Especially systems, common to all, were lacking proper search functions. Another thing which was regarded as an issue, was the separation of projects. If you were not part of the project team, you would have to ask for access, and again needing to know who to ask. ”File sizes are huge, and it is in no-one’s best interest that they are behind a project manager in some separate project portal. While you have to know who to contact, to even get to the source of information, and to find out who has that certain information.” – Project Manager
Figure 14 Compilation of interview results under information.
Information
Sharing
Individual driven
Face‐to‐face & Tacit knowledge
Project specific
Scattered, no structure or format
Searching
Difficult to find information
Project portals might not be accessible
Search –functions are not working well
Finding the right person and asking
them
Other
Paper use for legal & regulatory reasons
Formats used with BIM
Thesis 7/2019 42
The most common issue related to searching information from databases, was the lack of a functioning database for modeling information. Currently the organization does not have a place for saving models in either open formats or native formats. Digital material is archived to two separate systems, one is for the continuous follow up of project documentation (offers, orders and the like), which need to be monitored and updated continuously. The other is the archive, where digital material is handed over after the project. This archived material consist of the as-built documents (e.g. drawings) and quality documentation. The archived material has to be in a format that can be considered “forever”, thus the only acceptable formats now are PDF/A (1b and 1a), TIFF (rev5 and rev6), XML and CSV. PDF/A is currently the electronic document file format, which has an ISO standardization 19005, for long-term preservation. TIFF file format is for raster graphic images and it a lossless file format. Meaning that for example JPGE images, which are lossy, can be compressed to a TIFF file, thus becoming lossless and may be edited and re-saved without losing the image quality. XML is a markup language, which is readable by both machines and humans, it defines rules for encoding documents. CSV files store tabular data: numbers and text. (Wikipedia, 2019) Currently BIM models are archived as TIFF or PDF/A files, which cannot be opened again in modelling tools, thus making them simply image printouts of the model. Information is lost during this transfer process, and original models are not stored anywhere. The archive process needs the formats to be something that can be said to last forever, which is why these formats have been chosen for the electronic transfer. The legal and regulatory processes, during the planning phase, still require actual paper printouts to be handed over and archived. This kind of a requirement is seen as a big obstacle for BIM during the planning phase. It is one reason why the infrastructure planning side sees that BIM is only suitable for certain processes and phases, but certainly not for all. While other institutions are not ready to even accept PDF material it is hard to imagine a BIM based process becoming reality in the near future. To make matters more complex, the organization has separate systems for rail, road and waterway asset management. And in addition to those a skill structure registry, which as a department, is advanced in handling BIM information and has constructed a functioning database for information. The full extent of the separation of departments and further projects is not fully known. Each area has their own on-going development projects, all aiming for better asset management, while choosing a different path. 5.1.2 BIM Use
The interviewees were asked to evaluate, how much they thought that projects use BIM. The common theme in answers was that the guidelines require the use of BIM, but in reality the level of usage varies. Answers interviewees gave to the question of “how many projects use BIM?” varied between “a very high percentage” and “around 50 percentage”. It is also noteworthy that many said that modelling is used at some level, which leaves room for speculating the quality of modelling. Gladly, some answers shed light not only to the amount of modelling done, but also the quality of it. This again, presented numerous views
Thesis 7/2019 43
to the quality. Overall, it was seen good or average, but cases of “poor” or “unacceptable” models were also not an anomaly. One thing that was also highlighted by multiple interviewees was the lack of knowledge about the opportunities that BIM offers. The interviewees knew the idea of managing the lifecycle of built infrastructure but were mainly focused on what they did with modelling and did not spend time thinking about the “bigger picture”. The use cases of BIM where different in different project phases. Planning phase can use modelling well, on the other hand for legal and regulatory purposes it is not that useful during planning. The consensus in answers was the of construction phase being the one that benefits the most out of BIM. Asset management and maintenance have not been benefitting from BIM. One common nominator for all good BIM use was an active employee. The cases, where BIM was used well were usually up to a single person, who saw potential and opportunities using BIM. Interviewees felt that a single person as the driving force can only take things to a certain point, after which the progress will end. Collaboration between in-house groups was generally found poor, and most respondents only belonged to one cross-border team. Despite of this, many named that working together with an outside party, usually a construction company, was fruitful and sharing continued after projects. Internal mechanisms for sharing information or knowledge between projects seemed to be lacking. 5.1.3 Process Development
Another rather broad topic was process development. A big theme within that was “way of working” in various forms. From management and leadership side things that were found critical were the amount of resources allocated to BIM work, ownership of the matter, support from upper management, setting up a vision, taking care of the big picture and creating a roadmap for the future. The lack of a clear strategic alignment was evident from all responses. The general direction of development was not clear in the organization for people working with BIM. The wish is that FTIA as an organization would take a stance and interest to BIM development work, which is currently done by champions of each field or asset class. It was also suggested that linking development projects could be beneficial. When asked about long-term or short-term visions for BIM, each interviewee had a different answer or wish. Proving that a common vision had not been articulated by the organization. ”Probably exactly what you are doing, it feels like we should have a big picture towards which we would go. I feel like a lot of small development is going on, but to have a common goal.” – Planning Guidance Specialist, Project Planning “The big picture needs to come from within the FTIA.” – Senior Bridge Engineer A unified process description, which everyone would endorse, has not been created in the FTIA. Some interviewees, working in the FTIA, had developed their own processes, which were working out nicely and had written them down for others to see. Also instructions supporting infra modeling were seen valuable, such as YIV 2015 and newer editions coming up. It was clear that employees of
Thesis 7/2019 44
FTIA thought that it was their responsibility to require and demand certain way of working, but also execute it effectively. ”This is its own process and we have a group of people [doing it]. But modelling has not been implemented at our department at the level that me and a few others, couple of project managers, use it and work with it.”– Project Manager The message from outside was that the lack of unified processes is making it hard to work with FTIA, because each case is unique in its process and documentation. “If ELY –centres start to think about these themselves, it will lead to great differentiation in operational modes, additionally we do not have the knowhow to draw up contract documents.” – Head of Unit From the FTIA perspective a big problem is the lack of resources allocated to development work, which is accompanied by change resistance, which is seen as a barrier for better processes to be implemented. The final level of the pyramid, employee education, presents what interviewees said that could be done to improve the current situation. On-going training tours for ELY personnel have been seen beneficial. The lack of proper information about how to use BIM and how to start using it in, was identified. ”How would this unravel, when and if people would get interested in this? And when they would be interested, it would be clear that it [BIM] isn’t a monster and you don’t have to learn a ton of things. But rather to know where to get help, what you should know and what are the benefits, and something like that.” – Project Manager Ideas for the future for also presented, such as; employees want to know how to get help, what they should know and what would be the benefits of working with BIM. It was also a common belief that employees are somewhat scared of using BIM, because it is not understood and information is hard to come by. The contrast between employees who actively use it and employees, who want nothing to do with it, is getting bigger. Pioneers and individual projects use BIM successfully, but process descriptions are lacking, thus best practices cannot be transferred to other projects. 5.1.4 BIM Maturity
The individual point of view is easier to explain and demonstrate, however as the process of using BIM is an organization wide interest, the interviewees were asked to estimate the maturity level of modelling in the organization. It was clear that the concept of BIM maturity was not very familiar. But since the interviewees could explain what they meant with their grade, it did not play a role that they were not familiar with the actual definitions or different stages. Many reflected back to, when BIM was first introduced in 2012, and how far they have come from that. “First BIM development manager started in 2012. Their first job was to explain ”what is BIM and what is modelling?”.” – Senior Bridge Engineer
Thesis 7/2019 45
Bridges and skill structures in general, represent an anomaly in the BIM maturity level within FTIA. They have a high level of knowhow and skills, and their process is very BIM led already. They are the pioneers of BIM at FTIA, according to themselves and by others. Other departments said that they use BIM at different levels, some use it in all their work, and it is the main tool, but know that others use it at very low levels. Construction was considered the area that benefits the most from BIM, both in construction planning and actual construction work based on the model (e.g. machine control). It was evident that no metrics were used to measure BIM performance in projects or overall in the organization. However, overall project performance was measured with a scale from 0-5 (0= failure, 1= poor, 2= passable, 3= satisfactory, 4= good, 5= excellent). The areas assessed are 1. Project’s performance level, 2. Project organization’s operations, 3. Project execution and 4. Reporting and communication. Each area is divided into smaller sections, which are rated from 0 to 5, and also explained with short sentences. Positive notes and comments are marked with a + -sign. At the end, there is a possibility to synthesize and highlight findings of the assessment. As of now the use of BIM is not highlighted in the assessment form. Reader cannot say if the project was BIM based by reading the assessment form. The use of BIM in projects it not supervised nor assessed along with other criterion, while it is a required for projects’ to use. The quality control guidance for construction was published in 2009, explaining why it does not take into account the quality methods for BIM. (Posio 2019). “In some projects we are on the top and in some the bottom [level]. So in that sense, I think on average we are on a good level. Good level, but there is still room for improvement. Average level.” - Development manager, InfraBIM These kind of statements from employees, give an idea of how the level of maturity is perceived. No other measurement tools for it were in place at the time of the interviews. This was asked from interviewees, whether or not the projects were assessed from the BIM point of view. The BIM process was not evaluated, except in few cases, one of which was an international paid evaluation, IPAT. IPAT is an Infrastructure Project Assessment Tool, which lists its main goals to be “assessing the maturity of a transport infrastructure project” and “improving project organization in order for them to accomplish their objectives” (Netlipse 2019). The IPAT report of one FTIA project concluded that BIM was used very well, and that the used methods could be transferred to other projects. This information was also received from the project manager of that project. However, it was not documented what these methods were. The IPAT assessment sprung the project team to write down process descriptions of what they had done, even providing a checklist of things that should be done during a project. One tool that has been used to measure solely the use of BIM is Infrakit, but it does not measure the quality of the models, rather technical information about them like headings and if certain tags are in place, but they can contain whatever. The Infrakit software does use open formats, plus can connect surveying equipment and machine control to each other (Infrakit 2019).
Thesis 7/2019 46
5.1.5 Infrastructure and IT-systems
Each respondent named issues related to IT-systems, software and hardware. Main problem with hardware was that it is assigned by a department that does not know what the job entails. Modelling requires certain level of capacity to function properly, thus the equipment should reflect that. Working on poor hardware was a barrier for efficient work and development work. Especially the Centres for Economic Development, Transport and the Environment said to be lacking resources. FTIA’s principles on open data sharing and open formats were enablers for software development. However, the lack of proper software was an issue for the industry in general. Many software developers offer visualisation tools, which do not serve modelling. Software providers are not keen on using open formats if they have their own, which binds customers to their products. The role of FTIA as a big client, was seen to be something that could make a stance in the industry and influence software developers in the future. New IT-systems, such as the Velho -project and IHKU, were seen as a good direction of development within the FTIA. Velho is a database for storing project data, such as models. Velho offers a place for saving models during the project and also after it in different formats. IHKU is a cost estimation tool, which would use model-based data. The possible problems new IT tools could face, whether hardware of software, were the lack of proper instructions, resistance to change and implementation problems. As for Velho one possible concern could be the big file size especially models. Respondents felt that a new system alone would not fix the problems that currently occur in the process of knowledge transfer but would support it.
5.2 Secondary Data Findings
The primary data findings were accompanied by secondary data. The secondary data was used to fill gaps from the primary findings. Such things were for example infrastructure industry projects, which aim to guide the development of BIM nationally and internationally. The development of BIM was seen important, thus the following were enhanced by using them as secondary data. How the secondary data was analysed is described under Methods of Data Analysis. 5.2.1 Standardisation of Built Environment: RASTI-project
Rasti-project attempted to create a road map for digitizing the built environment in Finland. The built environment took all areas of build environments into consideration: buildings, infrastructure and data. (Heiskanen, Henttinen, Hyvärinen, Manninen, Liukas, Perttula, Saarentaus & Savisalo 2019, 7). The need for a nationwide strategy was evident; the Finnish way of doing BIM has been a bottom-up approach, which has led to a widespread usage but on a low-level regarding skills. International comparison showed that a top-down approach has increased the industry capability, after a short transition phase. In the top-down approach public sector is a major player especially in standardisation. (Heiskanen et al. 2019, 8) The reports also states that the potential cost savings are significant. The global saving potential is estimated to be between 15–25%,
Thesis 7/2019 47
in the European market a 10% yearly saving would mean 1.3 billion euros. (Heiskanen et al. 2019, 12) The main findings of the report are that the Finnish standardization work needs to be based on international standards, national adaptation is possible, Finnish sector of built environment must participate in international development work and open standards foster the benefits of digitalization. (Heiskanen et al. 2019, 18) The vision the report sets for 2030 is one where information flows through the lifecycle of the built environment. Information flow is supported by technology and processes, and information sharing is based on open international standards. (Heiskanen et al. 2019, 22) 5.2.2 International Guideline: Handbook for the introduction of Building
Information Modelling by the European Public Sector
The most recent and relevant international guideline is the “Handbook for the introduction of Building Information Modelling by the European Public Sector”, of which there is also a Finnish guide available. The handbook provides a strategic framework for public sector BIM programmes. It includes four different areas; growing industry capacity, building a common collaborative framework, foundation of public leadership, and communicating vision and fostering communities. (EU BIM Taskgroup 2019) Growing industry capacity includes running pilot projects, training, promoting success stories, increasing the amount of public procurement as the driver for industry capacity development, measuring progress, increasing awareness and support in the industry. Building a collaborative framework means assessing the barriers for sharing data and collaborative work. The barriers include legal, regulatory, policy and procurement barriers, which all facilitate the collaborative working environment. In the process of working towards a collaborative working environment and breaking the barriers the use of inter-national standards is highly encouraged. Providing guidance and tools for supporting the industry and academia are also of importance. (EU BIM Task-group 2019) Communication and community activities include engaging with industry stakeholders, participating and encouraging regional development, finding out best practices through communities, using mass communication tools to reach bigger audiences. Public leadership actions start by defining compelling drivers, vision and goals. In addition, description of the value of BIM to public and private sector, as well as documentation of the general approach moving the industry to the desired direction. A public sector champion should be identified, which would sponsor the initiative and establish an implementation team to drive change. This would help to secure funding and resources. (EU BIM Taskgroup 2019) The strategic initiatives are divided to actions, which were divided to three different levels based on level of execution as “encouraged”, “recommended” and “highly recommended”. As part of the benchmarking all of these were collected to a table to see what actions were currently done at the FTIA, thus also giving future action plans and implementation needs. (EU BIM Taskgroup 2019, 24-25)
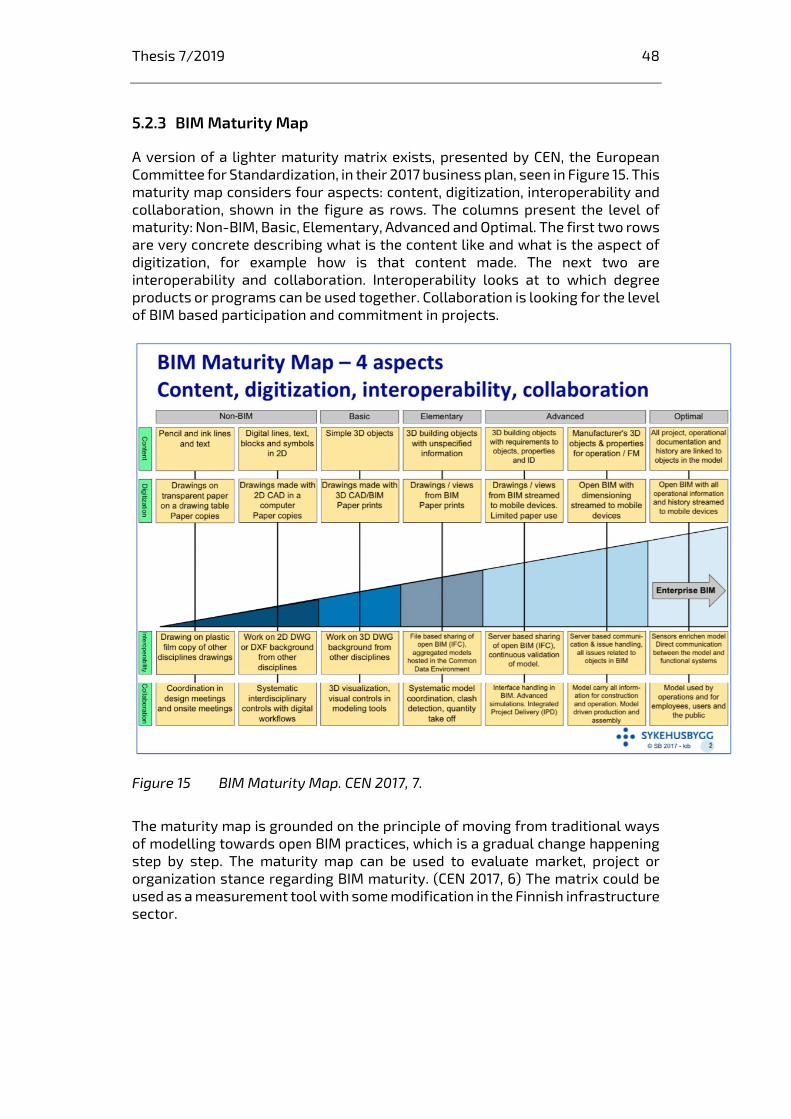
Thesis 7/2019 48
5.2.3 BIM Maturity Map
A version of a lighter maturity matrix exists, presented by CEN, the European Committee for Standardization, in their 2017 business plan, seen in Figure 15. This maturity map considers four aspects: content, digitization, interoperability and collaboration, shown in the figure as rows. The columns present the level of maturity: Non-BIM, Basic, Elementary, Advanced and Optimal. The first two rows are very concrete describing what is the content like and what is the aspect of digitization, for example how is that content made. The next two are interoperability and collaboration. Interoperability looks at to which degree products or programs can be used together. Collaboration is looking for the level of BIM based participation and commitment in projects.
Figure 15 BIM Maturity Map. CEN 2017, 7.
The maturity map is grounded on the principle of moving from traditional ways of modelling towards open BIM practices, which is a gradual change happening step by step. The maturity map can be used to evaluate market, project or organization stance regarding BIM maturity. (CEN 2017, 6) The matrix could be used as a measurement tool with some modification in the Finnish infrastructure sector.
Thesis 7/2019 49
6 Discussion
The research question and sub questions explore the link between knowledge management and BIM use, thus relevant and appropriate theories from both fields were examined. Knowledge management offers a good theoretical basis for any process, which includes knowledge transfer, such as the BIM process, where information and knowledge are transferred through technology. The findings show that the lack of an intended knowledge management strategy had led to a situation, where knowledge was not managed systematically. Simultaneously the organization had implemented new BIM tools to digitalize their processes. The implementation and use of BIM was not on a high level, and had not been measured during the implementation or after it was in use. Creating a knowledge management strategy was not a possibility, hence an information systems strategy for the BIM process was proposed, which would work as a departmental plan as proposed by Teubner (2013). The development of the BIM process could then follow the principles of Succar's BIM Framework through stages and steps, as well as Kuswaha's and Rao's model of increasing individual competence through improved KM infrastructure and KM process. These knowledge management actions could solve problems in project know-ledge management found by Newell et al. and Bushuyev et al., which were found in the case organization as well. The KM process consists of the acquisition, sharing, transfer and application of knowledge, which can also be referred to as knowledge transfer. The phenomena of knowledge transfer was chosen to be the object of the study under knowledge management. Based on the theory it is a common nominator combining knowledge management and BIM, thus could be used as a measurement and development tool. The process of finding potential solutions to the knowledge transfer process of BIM is shown in Figure 16. It depicts the internal and external factors, which were sources of evidence. Internal factors were mainly determined with interviews, and possible gaps were filled with external sources. The current status of the BIM process was determined through interviews, from which current challenges and opportunities were pointed out. Based on this information, accompanied by theoretical support and external sources, potential solutions were created. These solutions are presented in the following chapters.
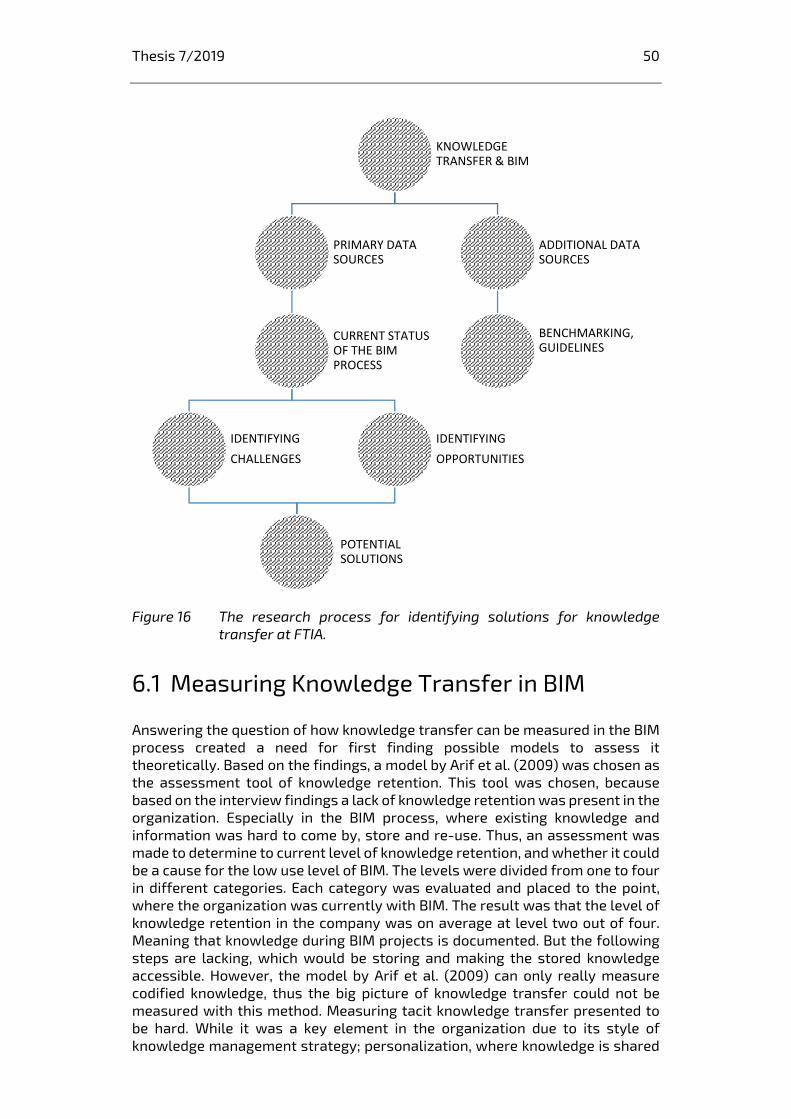
Thesis 7/2019 50
Figure 16 The research process for identifying solutions for knowledge transfer at FTIA.
6.1 Measuring Knowledge Transfer in BIM
Answering the question of how knowledge transfer can be measured in the BIM process created a need for first finding possible models to assess it theoretically. Based on the findings, a model by Arif et al. (2009) was chosen as the assessment tool of knowledge retention. This tool was chosen, because based on the interview findings a lack of knowledge retention was present in the organization. Especially in the BIM process, where existing knowledge and information was hard to come by, store and re-use. Thus, an assessment was made to determine to current level of knowledge retention, and whether it could be a cause for the low use level of BIM. The levels were divided from one to four in different categories. Each category was evaluated and placed to the point, where the organization was currently with BIM. The result was that the level of knowledge retention in the company was on average at level two out of four. Meaning that knowledge during BIM projects is documented. But the following steps are lacking, which would be storing and making the stored knowledge accessible. However, the model by Arif et al. (2009) can only really measure codified knowledge, thus the big picture of knowledge transfer could not be measured with this method. Measuring tacit knowledge transfer presented to be hard. While it was a key element in the organization due to its style of knowledge management strategy; personalization, where knowledge is shared
KNOWLEDGE TRANSFER & BIM
PRIMARY DATA SOURCES
CURRENT STATUS OF THE BIM PROCESS
IDENTIFYING
CHALLENGES
POTENTIAL SOLUTIONS & PROCESSES
IDENTIFYING
OPPORTUNITIES
POTENTIAL SOLUTIONS
ADDITIONAL DATA SOURCES
BENCHMARKING, GUIDELINES
Thesis 7/2019 51
from person to person with little codification in between. The strategy could be argued as being something from the past and an emergent one. The organization has long standing roots as an expert organization, thus the need for codification has been very little. The split between a dominant knowledge management strategy and a supporting one seems to follow the 80/20 logic. However, with new tools enabling new ways of working, the current knowledge strategy is incompatible with them. Changing the knowledge management strategy of a large organization is not likely to happen very quickly and might not serve a purpose if it is only concerning a small segment of processes. Thus, the suggestion is not change the organization’s KM strategy, but rather enable active knowledge transfer through support mechanisms. The codification of core knowledge is not done in a way that it would turn into organizational knowledge or individual competence. For this to happen, the mechanisms for acquiring, sharing, transferring and applying knowledge ought to be in place. For now, there is no infrastructure to do this properly. Thus, the suggestion is that this kind of core knowledge should be documented, which would work as a support tool for BIM use. This derives from the interview findings: knowledge is lost because people leave but documentation is “forever”. The models need to include information, but as a support function the “why and how was something done” might even more important. Sharing process knowledge rather than product knowledge is more beneficial for active know-ledge transfer. These are the kind of questions the organization is dealing with. The implementation of modelling has been done before seeing how it fits in to the organization’s knowledge management behaviour, which is now found to be the opposite of BIM’s working principle. The models should include as much information as possible and cumulate information over time. The previous research by Bushuyev et al. (2015) and Ika (2009) show that assessments should be based on project phases, as planning, execution and closing. However, in the case organization the assessment is often done at the end of the project. Dividing the project assessment to three phases might seem heavy but should prove beneficial if they are measuring success factors, which are key to that phase. This might provide insights to why next phases were not successful, if it was already documented that the planning phase did not score high on critical success factors. At the project closing phase it might be hard to reflect back to the beginning, especially due to the long lead times. However, assessing the BIM process as one is a good starting point. Introducing more in-depth assessment tools later on might prove easier if some tools are already in place. Problems in project knowledge transfer identified by Newell et al. (2006) and Bushuyev et al. (2014) are also found at FTIA. Projects are seen to be too unique to share experiences. The divide to rail, road and waterways is also one element that is preventing knowledge sharing. The project management habits are different, thus a unified approach to management in general is lacking. The interviewees also clearly stated that there are very little places to share this knowledge, since the general development of BIM processes has not gained support from management. From a theoretical point of view the
Thesis 7/2019 52
6.2 Creating an Assessment Matrix for BIM Maturity
Since it was evident that the knowledge retention of the organization was not on a high level due to organization's KM strategy not supporting the behaviour, another assessment tool for the BIM process was required. The theoretical framework and secondary data feature three different BIM maturity assessment tools, and one Maturity Map. The elements in all of the BIMM tools were similar, thus an understanding of which things should be measured and developed further was formed. These were for example soft aspects of “people, mentality and culture”, which could be further developed by training, efficient knowledge management and skill transfer. However, the BIM tools were seen heavy and hard to use as assessment tools. Thus, elements that reflect real life and can be grounded to the practice were seen important for benchmarking. The softer areas are something that are within, but are as such hard to evaluate. The presented assessment frameworks attempt to highlight the client’s point of view, especially public clients, which seek not to make money but estimate costs accurately with BIM. The angle of public clients was seen as a missing element in the existing assessments, apart from the Maturity Map by CEN (2017). Thus, the maturity map was used to further develop a maturity assessment matrix for the need of the case organization. The matrix created was used for assessing the current situation of BIM use in the organization. But as suggested by CEN (2017) the matrix can also be used with a step-by-step approach, thus allowing goal setting. The created assessment matrix is presented in Appendix 3 and explained here. The first four rows are identical to the original Maturity Map by CEN, with only slight adaptations to fit the Finnish schema. These include for example the open formats used in infrastructure industry, such as Inframodel, which is currently being used parallel to IFC. The original model also included some form of description of the digitization, as in “paper copies”. This kind of information was moved to form its own row, marked “delivery method”. Also the current situation was not described to the detail needed and it was not clear what was actually meant with “paper prints”. Thus this information was modified. The levels also follow the same logic as the original matrix, and have not been changed. It was reviewed against Succar’s maturity stages. Thus Level 0 is the industry status pre-BIM. Level 1 corresponds to BIM Stage 1: Object-based modelling, Level 2 corresponds with Stage 2: Model-based collaboration and Level 3 to Stage 3: Network-based integration. Level 4 corresponds with IDP. It is also noteworthy that even though here are attributes for Level 4, they are estimates and best guesses of what could be. In this matrix they present the future and provide context for benchmarking. While Succar’s maturity stage definitions (Table 2) were fitting to the maturity matrix, it was seen that elements found from the descriptions could be added to the matrix. A concrete measurable thing is the level of cost estimation and how it is done. Another one is Chen, Dib and Cox’s idea of information delivery method. However, here it would measure how is BIM based information transferred and in which form.
Thesis 7/2019 53
This was also mentioned by Sebastian and Van Berlo in their BIMM model. Hence, these elements were added as part of the model. Each of the rows entails lot of actions and functions embedded in them, thus moving from one level to the next requires many different development projects. There is usually a reason why things have been done in a way, so finding out the root causes and deciding on a plan of action are costly and long processes. However, this is what has been done for the case organization with the help of the matrix. The current situation has been assessed using the introduced maturity matrix. A current level of BIM activities was estimated to be between levels 1 and 2. This estimation was based on collected data. The maturity matrix and the estimation were also showed to people, who are involved with BIM activities in the organization. The estimated level was approved by the participants of that meeting. Thus, a certain validation for the matrix and its use as an assessment tool was made within this case study. For further development, the matrix could be used to assess organizational units separately. This would provide good knowledge of the differences between units. This kind of information could be used to target development work to units, which need it more than others. A common understanding of ways of working would be beneficial. This is where the aspect of knowledge management came through. The technical use of the tool is one thing, but the extensive amount of knowledge that is required to use BIM better needs to be managed and harnessed. The need for a usable and light assessment matrix is clear. The maturity of BIM is a hot topic in the infrastructure industry, and the lack of an understandable format to measure it is evident. As an example of this, the Public Nordic Client organizations working with BIM in the infrastructure sector were assessing their ways of working, but a common schema was missing. This matrix, in Appendix 3, is the first attempt to create such an assessment framework that could be applied in such and like organizations. This model presents concrete things that can be evaluated and measured. As such the model is applicable for quick analysis of current level of BIM process, while it does not require special expertise, but still includes elements that are important for BIM.
6.3 Concrete Steps for Further Development in the Organization
The two remaining sub-questions provide similar answers, thus they are collected under this chapter and sub-chapters. The steps to increase knowledge transfer are presented as development guidelines. The guidelines are supported by findings, which provide a strategic framework for public sector BIM programmes. The strategic framework includes four different areas; growing industry capacity, building a common collaborative framework, foundation of public leadership, and communicating vision and fostering communities (EU BIM Taskgroup 2019).
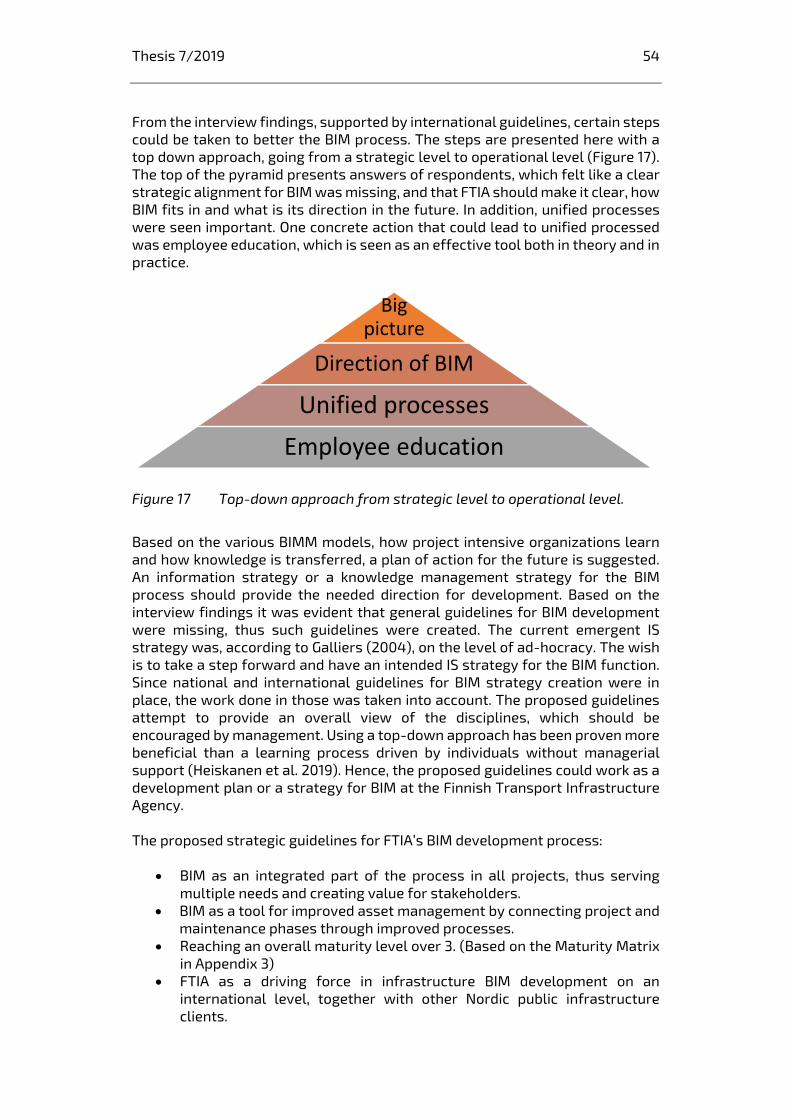
Thesis 7/2019 54
From the interview findings, supported by international guidelines, certain steps could be taken to better the BIM process. The steps are presented here with a top down approach, going from a strategic level to operational level (Figure 17). The top of the pyramid presents answers of respondents, which felt like a clear strategic alignment for BIM was missing, and that FTIA should make it clear, how BIM fits in and what is its direction in the future. In addition, unified processes were seen important. One concrete action that could lead to unified processed was employee education, which is seen as an effective tool both in theory and in practice.
Figure 17 Top-down approach from strategic level to operational level.
Based on the various BIMM models, how project intensive organizations learn and how knowledge is transferred, a plan of action for the future is suggested. An information strategy or a knowledge management strategy for the BIM process should provide the needed direction for development. Based on the interview findings it was evident that general guidelines for BIM development were missing, thus such guidelines were created. The current emergent IS strategy was, according to Galliers (2004), on the level of ad-hocracy. The wish is to take a step forward and have an intended IS strategy for the BIM function. Since national and international guidelines for BIM strategy creation were in place, the work done in those was taken into account. The proposed guidelines attempt to provide an overall view of the disciplines, which should be encouraged by management. Using a top-down approach has been proven more beneficial than a learning process driven by individuals without managerial support (Heiskanen et al. 2019). Hence, the proposed guidelines could work as a development plan or a strategy for BIM at the Finnish Transport Infrastructure Agency. The proposed strategic guidelines for FTIA’s BIM development process:
BIM as an integrated part of the process in all projects, thus serving multiple needs and creating value for stakeholders.
BIM as a tool for improved asset management by connecting project and maintenance phases through improved processes.
Reaching an overall maturity level over 3. (Based on the Maturity Matrix in Appendix 3)
FTIA as a driving force in infrastructure BIM development on an international level, together with other Nordic public infrastructure clients.
Big picture
Direction of BIM
Unified processes
Employee education
Thesis 7/2019 55
A breakdown of each statement is presented next. The first one derives from the interviews, indicating that BIM is seen as a separate process and something extra to do. Thus, making it a priority that BIM activities are the process, and can replace and modify old processes for the better, should be enforced. While doing this it should provide value for multiple different stakeholders like consultants, ELY Centres, citizens and software developers for example. The value creation is linked to the information that is available through models. From the internal process point of view the value is reliable materials, a unified process in all projects, building on earlier phases, no repetition in work and transparency. The second point is linked to the actual function of the BIM tool as an asset management tool through a facility’s lifecycle. This is one of the most important things that BIM can effectively offer to public clients, thus it should be one of the starting points for future actions. Different project phases (planning, construction, and maintenance) need to be connected better, to ensure that all relevant information travels through the process. The goal is to get accurate information for asset management. The big picture is looking after the owned assets, this should be always kept in mind, meaning that all process improvements should aim to do this. In that sense, this is a large and vague guiding principle, but the “why should we use BIM?” should be answered with this. Technology offers possibilities of improving the most important task of the organization; thus, it needs to be enforced to get the maximum value. The real benefits of BIM can only be attained if it used throughout the lifecycle. The value of the third statement is linked to the matrix used for assessment of the current situation, while simultaneously providing the opportunity to use it for goal setting. This is a more concrete action for the future, and there is an assessment tool in place, which can be used to measure how this goal is being achieved. In addition, this principle is focused on the point of continuous development. The actual number or level is not the most important thing, but what it represents is the thrive for a better use of BIM, thus giving access to new possibilities. The matrix provides a variation of aspects to be measured and developed. It is one way of measuring the performance, along with other assessments already in place, like the project assessments. It is rather a supporting function, working as an assessment and benchmarking tool. The last guideline is putting emphasis to the role of FTIA in the industry both nationally and internationally. The international aspect was seen very important in the way that the industry should go forward. Each Nordic country is quite similar, thus doing work together makes sense. The bargaining power of the Nordic countries grows internationally if there is a common understanding amongst them. Sharing best practices not only with national players but including other countries is smart, while for example industry standards are made by international working groups. National and international work also makes it possible to unify standards and formats. These guidelines presented as a strategy for BIM development alone are very broad. However, a common unified statement is crucial. The guidelines presented are one outcome of the research.
Thesis 7/2019 56
6.4 Supporting Knowledge Transfer
Based on Succar’s BIM framework the steps are divided to process, policy and technology steps. The steps are designed to move to another stage of maturity. In this case, the short-term goal is set for 2021 and the goal is to be on a level between 2 and 3, according to the assessment matrix. The goal is to perform at a higher level than before, but because different functions mature at different times the goal cannot be the exact same for each. That is why a strict “everyone will be on level 2” was not desired. It is known that some functions will lack behind for a longer time, so this is again an average of the organization, same way as the assessment of current level was done. The focus of the steps is on organizational benefits and capturing the knowledge of “how we do things”. Previously the product knowledge has been documented well, but process knowledge is somewhat lacking, thus we have only had project benefits but lack organizational benefits. The process and policy steps include the biggest development opportunities regarding knowledge transfer. The most important steps identified were improving competencies and creating support functions. Competency improvement should be done in two levels: project level and individual level, which would hopefully lead to widespread organizational knowledge. Projects should document how they use BIM in projects, both successes and failures, and these should be communicated forward. Implementing new practices based on previous experience should be encouraged, but for this accurate descriptions are necessary. This kind of process of transferring best practices and bad experience, needs support systems. In FTIA commonly used support systems are instructions. For instructions to be a support function, and not something that is out of date most of the time, new ways of distributing need to be present. A good way is a platform, which can be updated quicker, it can be interactive (e.g. users can leave comments) and most of all have good search functions. Current platforms, where instruction documents are saved, do not serve the purpose of being easy and quick to use. As Succar’s framework suggest, the three fields are working together, supporting and complementing each other in order to work. In the case of FTIA modelling is already a way of working that has been implemented, thus the work needs to be done to transfer knowledge about how to do it better. Each field is gone through in more detail to explain what possible steps could be taken. 6.4.1 Instructions
Instructions is clearly a supportive function for mainly new IT-systems. One of its biggest efforts is to create instructions on how to use the new Velho system. This requires going through old instructions, combining them and discontinuing some. The new Velho instruction will be a guidance for information and knowledge handling in the FTIA after the system is implemented. Another thing that came up in the interviews was that BIM information is not easily available. Finding out how to use BIM or understand it better, was not a foregone conclusion. To solve this, the suggestion is an open online course [OOC] or a massive open online course [MOOC]. It would essentially be training material for employees or other interested parties. The course could consist of different modules ranging from basic understanding to more detailed content. Examples
Thesis 7/2019 57
of modules or possible content for general understanding could be “BIM and infraBIM terms and how to use them”, “how does the process flow work, or “the basics about BIM and infraBIM”. Then going deeper into specifically infraBIM use. Perhaps presenting each asset class separately and explaining various tasks. The output would be organization wide education, which can be used time and time again, and can be modified with ease. Important thing is lowering the barrier for entering the course, which is why an online platform would work well. Some of the possible positive things speaking on behalf of an online course are:
No need to sign up. Not limited to place or time. Own pace in completion. Material is always available. Possibility to download interesting material. Low costs compared to traditional face-to-face training. Possible to educate and engage big masses.
It would also be beneficial to enhance the users’ learning experience by making the course somehow interactive, which requires more from the learner than just reading a presentation. There could also be a test or a mock test, where one could answer simple questions to see how much they learned. Something that could be combined to the online platform of the course is a function, where employees or stakeholders could add their “tricks of the trade” with each other. Again a low barrier for entry, easy and accessible place for sharing information with likewise people would be needed. The current cross-border groups do not actually tackle issues on an operational level. But these kind of groups could work as facilitators of such a platform, promoting its use in their own organizations and networks. In short, some best practices could be shared through the platform, but this would be of lower priority than then actual online course, which should be implemented first. The issues that come with online course is the amount resources, especially money and workforce that can be put in. Planning and implementing takes time. But since this information needs to be gathered somehow and more importantly shared in the organization, it would only make sense to make it in a form that is accessible for a big group of people and can scale up if need be. This approach would enhance the top down approach, when training material would come from one source. This way it could be monitored and updated according to the needs of the organization. 6.4.2 Competencies
The competencies focus on improving existing knowledge of BIM in the organization. It is directed more towards the executing divisions and people working there. On project level one big thing was the lack of measurements for BIM use. Individual project assessment tools for BIM use are available, but due to lack of resources these have been too heavy to be implemented in the organization. Therefore, adding measurements to the existing assessment process would be the best solution. The measurements that are used, could be something that can be used in a similar manner than other areas assessed. However, a manner of simple scale from 0 to 5, does not provide an in-depth view. The interesting learning points would be the process descriptions. Collecting this information is laborious. In the meantime, before a process-centric assessment is possible, measurements that could be added to measure
Thesis 7/2019 58
the BIM level in a project could derive from the matrix. Combining the assessments might also be a mistake in the beginning, thus the suggestion is to use the assessment matrix on its own. Creating an assessment system for it, preferably simple scale compliant with the project assessment scale, would be the smartest solution. This way the matrix could be tested out and see if it has a business case. Piloting the assessment matrix in projects is highly recommended to collect feedback on the usability. This way collecting the project specific information on the level would be obtained. These results could be used to see how the organization is progressing over time. To make this possible there is a Finnish version (Appendix IV) available of the matrix, which could be applied. The systematic development of competencies should derive from an information systems strategy, which hopefully in time would cover the entire organization. The current proposition is however an information systems strategy for only one function, BIM. Organization wide combination of official activities and emergent practices could be done through ISS. It takes into account individual competencies, standards and information services. 6.4.3 IT-Systems and Infra
The big development work that is being done is a common database for collecting models, which has been currently missing. This is called Velho, and other part of the same system will be Projektivelho (eng. Project Velho). Projektivelho will collect the models used for planning and execution, during the projects and after the project. This is done for all project types; railways, roads, and water ways, alike. This is one the requirements for enabling lifecycle management of owned assets. The models provide a picture of what has been done in a certain project during its planning and construction phase. Relevant information can then be passed on to maintenance. This type of information transfer lays the foundation for an infrastructure, which can facilitate the BIM process, and especially the asset management. This database, or a place, to save the models is a big step forward for the knowledge management and knowledge retention in FTIA. Previously it was close to impossible to look at models others had done, because you simply did not have access. This creates new possibilities for sharing best practices through simple applications like going through a model that scored high on an assessment (like the international IPAT), and how the process was managed and what were the actions. This could be something like model-based learning. The other databases mentioned there are for skill structures (taitorakenne-rekisteri) and railways (Raid-E), which are essentially digitizing the asset information. The Raid-E is not built with a model-based view in mind, thus will require a linking software to combine it with Velho systems. The cost estimation tool, called Ihku, is a little different from the others. It has a specific function to work as a cost estimation tool and it is designed to be model based. Meaning that estimations it gives would be based on the information in the models. The development of this kind of tool also correlates with the assessment matrix. Since clients, who order work, need to be able to efficiently and accurately estimate the costs linked to projects.
Thesis 7/2019 59
7 Conclusions
The last part of this thesis is trying to answer the main research question of how could BIM benefit from knowledge management? Through the sub-questions on knowledge transfer the research went quite deep into the theory of how can BIM maturity be measured in general, and found that there are many applications, none of which fit the case organization and the scope of the research. Another work could be done just to research the maturity level of BIM in detail, using different models and assessing both an overall level and project level use. Within this research the scope was to determine, whether the current BIM process could use elements of knowledge management to enhance the overall process. The interviews were a starting point for determining the current level of BIM use in the company. Through the finding of where are we now as an organization made future needs and actions clearer. The actions are designed to enhance the information and knowledge distribution in the organization. The way of working needs to change gradually, which can happen through under-standing, which in turn would change attitudes. One big requirement is having better infrastructure to do the required tasks, not forgetting management support. BIM has already created challenges for current systems, which have been recognized and partially tackled. However, the big picture of why these projects are on-going is unclear to most in the organization. Thus, one of the actions was to create some sort of general guideline for development. Every development project could then reflect back on those principles and see, whether they are actually doing the right thing or should the course be steered. In a nutshell the outcome of the research was determining current BIM status, creating guidelines for future development and suggesting steps that could help improve the use of BIM through knowledge transfer. All the suggested actions are based on the finding that the BIM process does benefit from knowledge management. The BIM process benefits from knowledge management, as it enhances the
7.1 Theoretical contributions
The theoretical contribution of this research was filling a gap in the Finnish research schema considering the public clients’ position in the BIM network, focused on infrastructure BIM. The reasons why project and knowledge intensive organizations often fail in knowledge transfer was described by Newell et al. (2006), Bushuyev et al. (2014) and Kuusisto (2017). However, the solution to some of these knowledge management problems could be digitalization as suggested by Ambrosini and Venkitachala (2017). BIM theory by Succar (2009; 2010) was explaining the environment of BIM, and providing possible solutions, but it was not focused on the aspect of knowledge transfer. Thus, an information systems strategy by Teubner (2013) and Gallers (2004) was seen fit to complement the BIM theory, as it offers a framework for developing a strategy for an information system. Since knowledge management is a complex issue the model by Kuswaha and Rao (2015) of individual competence through KMI and KMS was needed to explain the connections. The theoretical contribution is attempting to combine elements of knowledge
Thesis 7/2019 60
management and BIM to create something that would make sense both in theory and in practice. Thus, the elements here could be organized and developed further to create a model working on its own. There is great potential and benefits combining knowledge management with BIM. Research suggestions for the future include seeing if the assessment matrix brings value over time, considering lifecycle assessments as part of BIM process, linking organizational strategy closer to BIM strategy, sustainability policies and their effect on strategic decision-making.
7.2 Practical implications
The client, Finnish Transport Infrastructure Agency, was in need of a roadmap for their BIM process. Creating a roadmap required extensive understanding of the working climate, understanding the underlying knowledge structures of BIM and knowledge about project and process management as well as development. Combining all this information to readable and usable form was one the main objectives of the study. Through the maturity matrix, which can be used for assessment and goal setting, the information was combined effectively. The matrix alone is something that other organizations can use to benchmark their level of BIM use nationally and internationally. The supporting functions should be considered as well, here the main contributions for support were guidelines for development work of BIM and future actions supporting knowledge transfer.
Thesis 7/2019 61
References
Ambrosini, V. & Venkitachalam, K. 2017. A triadic link between knowledge management, information technology and business strategies. Knowledge Management Research & Practice, vol. 15, pp. 192-200. Argyris, C. & Schön, A. D. 1996. Organizational Learning II. Theory, Method, and Practice. Addison-Wesley Publishing Company. Reading, Massachusetts. Arif, M., Egbu, C., Alom, O. & Khalfan, M. 2009. Measuring knowledge retention: a case study of a construction consultancy in the UAE. Engineering, Construction and Architectural Management, 16, 1, 92-108. Arif, M., Khalfan, M., Barnard, J. & Heller, N. 2012. Assessing knowledge retention in construction consultancies: Cases from the UAE. Australasian Journal of Construction Economics and Building, 12 (2) 55-71. Barney, J. 1991. Firm Resources and Sustained Competitive Advantage. Journal of Management, vol 17 (1), 99-120. Bassi, A. & Handzic, M. (2017). Knowledge and project management: A shared approach to improve performance. Vol 5. Cham: Springer. Bhatt, G. D. 2001. Knowledge management in organizations: examining the interaction between technologies, techniques, and people. Journal of Knowledge Management, vol. 5 (1), 68-75. Bryde, D., Broquetas, M. & Volm J. M. 2013. The project benefits of Building Information Modelling (BIM). International Journal of Project Management, 31, 971–980. buildingSMART. 2018. Technical Vision. [Www document]. [Accessed 28.11.2018]. Available https://www.buildingsmart.org/standards/technical-vision/ buildingSMART Finland. InfraBIM -sanasto. [Www document]. [Accessed 28.11.2018]. Available https://buildingsmart.fi/infrabim/infrabim-sanasto/ Bushuyev, S. D., Mihić, M. M., Obradović, V. Lj., Petrović, D. Č. & Todorović, M. Lj. 2014. Project success analysis framework: A knowledge-based approach in project management. International Journal of Project Management, 33, 772–783. CEN, the European Committee for Standardization. 2017. BUSINESS PLAN. [Www document]. [Accessed 11.6.2019]. Available https://standards.cen.eu/BP/1991542.pdf Centre for Economic Development, Transport and the Environment. 2016. [www document]. [Accessed 19.12.2018]. Available https://www.ely-keskus.fi/en/web/ely-en/ Chandra, R., Iyer, R.S. & Raman, R. 2015. Enabling organizations to implement smarter, customized social computing platforms by leveraging knowledge flow patterns. Journal of Knowledge Management, 19, 1, 95-107.
Thesis 7/2019 62
Chen, D. Q., Mocker, M., Preston D. S. & Teubner, A. 2010. Information Systems Strategy: Reconceptualization, Measurement, and Implications. MIS Quarterly, 34, 2, 233-259. Chen, Y., Dib, H. & Cox, R. 2014. A measurement model of building information modelling maturity. Construction Innovation, 14, 2, 186-209. Computer Integrated Construction Research Program. 2010. BIM Project Execution Planning Guide – Version 2.0. [Www document]. [Accessed 28.11.2018]. Available https://vdcscorecard.stanford.edu/sites/g/files/sbiybj8856/f/BIM_Project%20Execution%20Planning%20Guide-v2.0.pdf Costin, A., Adibfar, A., Hu, H. & Chen, S. S. 2018. Building Information Modeling (BIM) for transportation infrastructure – Literature review, applications, challenges, and recommendations. Automation in Construction, 94, 257–281. Demian, P. & Walters, D. 2014. The advantages of information management through building information modelling. Construction Management and Economics, 32, 12, 1153-1165. Eriksson P. & Kovalainen, A. 2008. Qualitative Methods in Business Research. Introducing Qualitative Methods. [Www document]. [Accessed 17.6.2019]. Available https://dx-doi-org.ezproxy.cc.lut.fi/10.4135/9780857028044 Galliers, R. 2004. Reflections on information systems strategizing. The Social Study of Information and Communication Technology: Innovation, Actors, and Contexts, 231-262. Hallituksen strategiasihteeristö. 2018. Ratkaisujen Suomi: Hallituksen toimintasuunnitelma vuosille 2018–2019. Valtioneuvoston julkaisusarja, 27, 7-65. Hansen, M. T., Nohria, N., & Tierney, T. J. 1999. What’s Your Strategy for Managing Knowledge? Harvard Business Review. [www document]. [Accessed 17.10.2018]. Available https://hbr.org/1999/03/whats-your-strategy-for-managing-knowledge Heiskanen, A., Henttinen, T., Hyvärinen, J., Manninen, P., Liukas, J., Perttula, T., Saarentaus, J. & Savisalo, A. 2019. Rakennetun ympäristön tiedonhallinnan standardisointi - Nykytilan kartoitus ja ehdotus toimenpiteistä. Versio 1.0. [Www document]. [Accessed 15.6.2019]. Available https://rastiprojekti.com/wp-content/uploads/2019/02/RASTI-strategia-v1.pdf Ika, L. A. 2009. Project Success as a Topic in Project Management Journals. Project Management Journal, 40, 4, 6-19. Infrakit. 2019. [Www document]. [Accessed 22.3.2019]. Available https://infrakit.com/en/ Kushwaha, P. & Rao, M.K. 2015. Integrative role of KM infrastructure and KM strategy to enhance individual competence - Conceptualizing knowledge process enablement. Vine Journal of Information and Knowledge Management Systems, 45, 3, 376-396.
Thesis 7/2019 63
Kuusisto, M. 2017. Organizational Effects of Digitalization: A Literature Review. International Journal of Organization Theory and Behavior, 20 (3), 341-362. Kvale, S. 2007. Analyzing Interviews. SAGE Publications, Ltd. London. McGraw-Hill. 2009. The business value of BIM. Getting building information modeling to the bottom line. SmartMarket Report. Bedford, UK: McGraw-Hill Construction. Ministry of Transport and Communications. 2019. [Www document]. [Accessed 14.2.2019]. Available https://www.lvm.fi/en/administrative-sector Netlipse. 2019. [Www document]. [Accessed 22.3.2019]. Available http://netlipse.eu/project-assessments/ipat#.XJSPr5gzY2w Newell, S., Bresnen, M., Edelman, L., Scarbrough, H. & Swan, J. 2006. Sharing Knowledge Across Projects: Limits to ICT-led Project Review Practices. Management Learning, 37, 2, 167-185. Sage Publications, London, Thousand Oaks, and New Delhi. Niskanen, J. 2015. Common InfraBIM requirements YIV2015. Vol 1.0. Managing Model Based Project. [Www document.] [Accessed 14.2.2019]. Available https://buildingsmart.fi/en/infrabim-en/common-infrabim-requirements-yiv-2015/ Nonaka, I. 1994. A dynamic theory of organizational knowledge creation. Organization Science, 5 (1), 14 -37. Nonaka, I. & Toyama, R. 2003. The knowledge-creating theory revisited: knowledge creation as a synthesizing process. Knowledge Management Research & Practice, 1, 2–10 Pellinen, P. 2016. Developing design process management in BIM based project involving infrastructure and construction engineering. Finnish Transport Agency. [Www document.] [Accessed 4.4.2019] Available https://julkaisut.vayla.fi/pdf8/opin_2016-04_developing_design_web.pdf Sebastian, R. & van Berlo, L. 2010. Tool for Benchmarking BIM Performance of Design, Engineering and Construction Firms in The Netherlands. Architectural Engineering and Design Management, 6, 254–263. Smith, P. 2014. BIM implementation – global strategies. Creative Construction Conference, CC2014. Procedia Engineering, 85, 482-492. Smits, W., van Buiten, M. & Hartmann, T. 2017. Yield-to-BIM: impacts of BIM maturity on project performance. Building Research & Information, 45, 3, 336–346. Staal-Ong, P. L., Kremers, T., Karlsson, P. & Baker, S. 2016. 10 Years of Managing Large Infrastructure Projects in Europe. Netlipse. [www document]. [Accessed 13.11.2018]. Available http://netlipse.eu/media/89413/netlipse-ten-years-of-managing-large-infrastucture-projects-2016.pdf
Thesis 7/2019 64
Succar, B. 2009. Building information modelling framework: A research and delivery foundation for industry stakeholders. Automation in Construction, 18, 357–375. Succar, B. 2010. Building Information Modelling Maturity Matrix. Handbook of Research on Building Information Modeling and Construction Informatics: Concepts and Technologies. Succar, B. & Kassem, M. 2016. Building Information Modelling: Point of Adoption. CIB World Congress, Tampere Finland, May 30 - June 3, 2016. [Conference paper] Teubner, R. 2013. Information Systems Strategy. Theory, Practice, and Challenges for Future Research. Business & Information Systems Engineering, 4, 244-257. Väylä. 2019. [www document] [Accessed 10.5.2019]. Available https://vayla.fi/web/en Ward, J. M. 2012. Information systems strategy: Quo vadis? Journal of Strategic Information Systems, 21, 165-171. Yin, R. 1994. Case Study Research. Design and Methods. 2nd edition. Volume 5. SAGE Publications. Thousand Oaks, London, New Delhi. Yin, R. 2009. Case Study Research. Design and Methods. 4th edition. Volume 5. SAGE Publications, Inc. Thousand Oaks, London, New Delhi. Yin, R. 2011. Qualitative Research from Start to Finish. The Guilford Press. New York. London. Zack, M. 1999. Developing a Knowledge Strategy. California Management Review, 41, 3, 125-145.
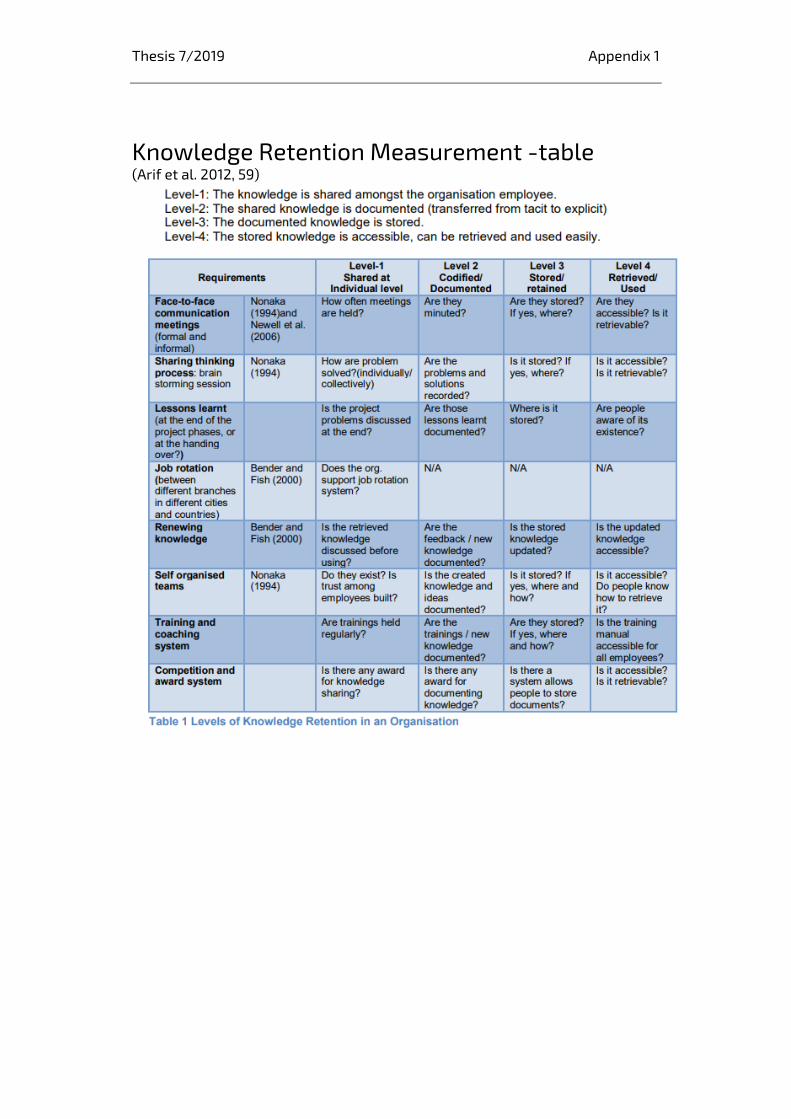
Thesis 7/2019 Appendix 1
Knowledge Retention Measurement -table (Arif et al. 2012, 59)
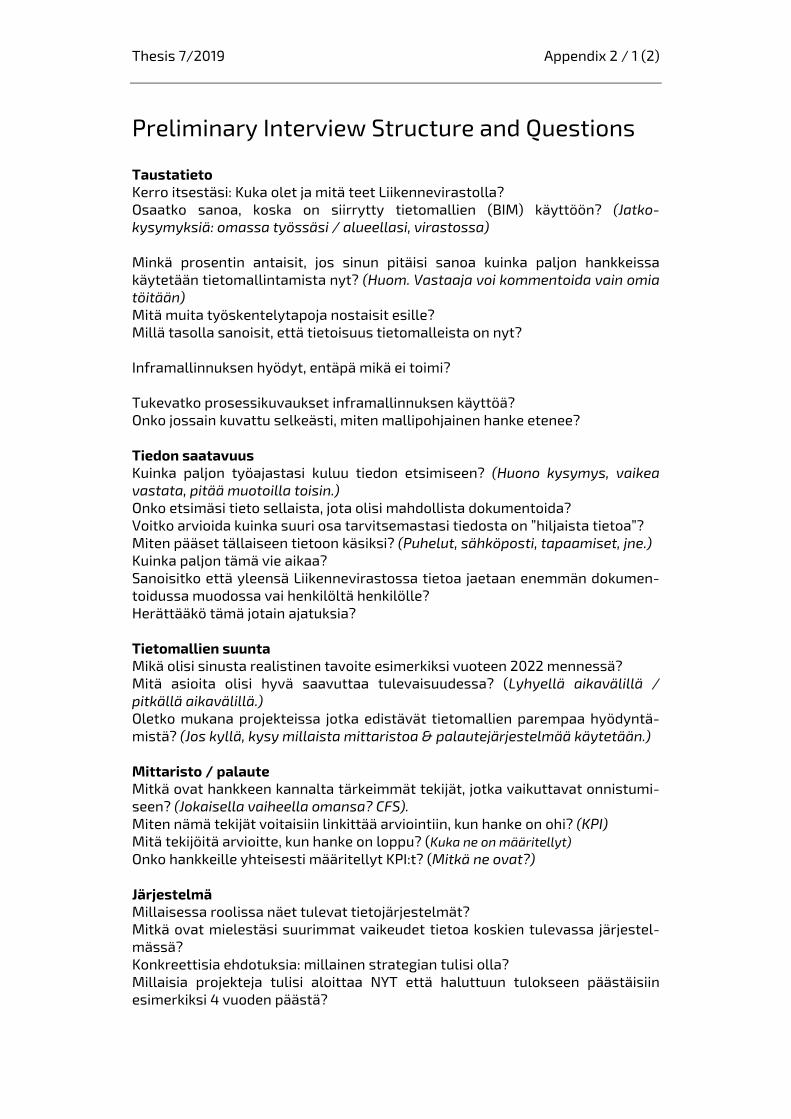
Thesis 7/2019 Appendix 2 / 1 (2)
Preliminary Interview Structure and Questions
Taustatieto Kerro itsestäsi: Kuka olet ja mitä teet Liikennevirastolla? Osaatko sanoa, koska on siirrytty tietomallien (BIM) käyttöön? (Jatko-kysymyksiä: omassa työssäsi / alueellasi, virastossa) Minkä prosentin antaisit, jos sinun pitäisi sanoa kuinka paljon hankkeissa käytetään tietomallintamista nyt? (Huom. Vastaaja voi kommentoida vain omia töitään) Mitä muita työskentelytapoja nostaisit esille? Millä tasolla sanoisit, että tietoisuus tietomalleista on nyt? Inframallinnuksen hyödyt, entäpä mikä ei toimi? Tukevatko prosessikuvaukset inframallinnuksen käyttöä? Onko jossain kuvattu selkeästi, miten mallipohjainen hanke etenee? Tiedon saatavuus Kuinka paljon työajastasi kuluu tiedon etsimiseen? (Huono kysymys, vaikea vastata, pitää muotoilla toisin.) Onko etsimäsi tieto sellaista, jota olisi mahdollista dokumentoida? Voitko arvioida kuinka suuri osa tarvitsemastasi tiedosta on ”hiljaista tietoa”? Miten pääset tällaiseen tietoon käsiksi? (Puhelut, sähköposti, tapaamiset, jne.) Kuinka paljon tämä vie aikaa? Sanoisitko että yleensä Liikennevirastossa tietoa jaetaan enemmän dokumen-toidussa muodossa vai henkilöltä henkilölle? Herättääkö tämä jotain ajatuksia? Tietomallien suunta Mikä olisi sinusta realistinen tavoite esimerkiksi vuoteen 2022 mennessä? Mitä asioita olisi hyvä saavuttaa tulevaisuudessa? (Lyhyellä aikavälillä / pitkällä aikavälillä.) Oletko mukana projekteissa jotka edistävät tietomallien parempaa hyödyntä-mistä? (Jos kyllä, kysy millaista mittaristoa & palautejärjestelmää käytetään.) Mittaristo / palaute Mitkä ovat hankkeen kannalta tärkeimmät tekijät, jotka vaikuttavat onnistumi-seen? (Jokaisella vaiheella omansa? CFS). Miten nämä tekijät voitaisiin linkittää arviointiin, kun hanke on ohi? (KPI) Mitä tekijöitä arvioitte, kun hanke on loppu? (Kuka ne on määritellyt) Onko hankkeille yhteisesti määritellyt KPI:t? (Mitkä ne ovat?) Järjestelmä Millaisessa roolissa näet tulevat tietojärjestelmät? Mitkä ovat mielestäsi suurimmat vaikeudet tietoa koskien tulevassa järjestel-mässä? Konkreettisia ehdotuksia: millainen strategian tulisi olla? Millaisia projekteja tulisi aloittaa NYT että haluttuun tulokseen päästäisiin esimerkiksi 4 vuoden päästä?

Thesis 7/2019 Appendix 2 / 2 (2)
Elinkaari Miten näkisit tietomallien roolin elinkaariajattelussa? Miten näet prosessin sujuvuuden vaiheesta toiseen? (Hankehallinnan prosessi ja sen sisällä olevat hankintaprosessit > ylläpito > mahdollinen uusi isompi perusparannushanke tms.)
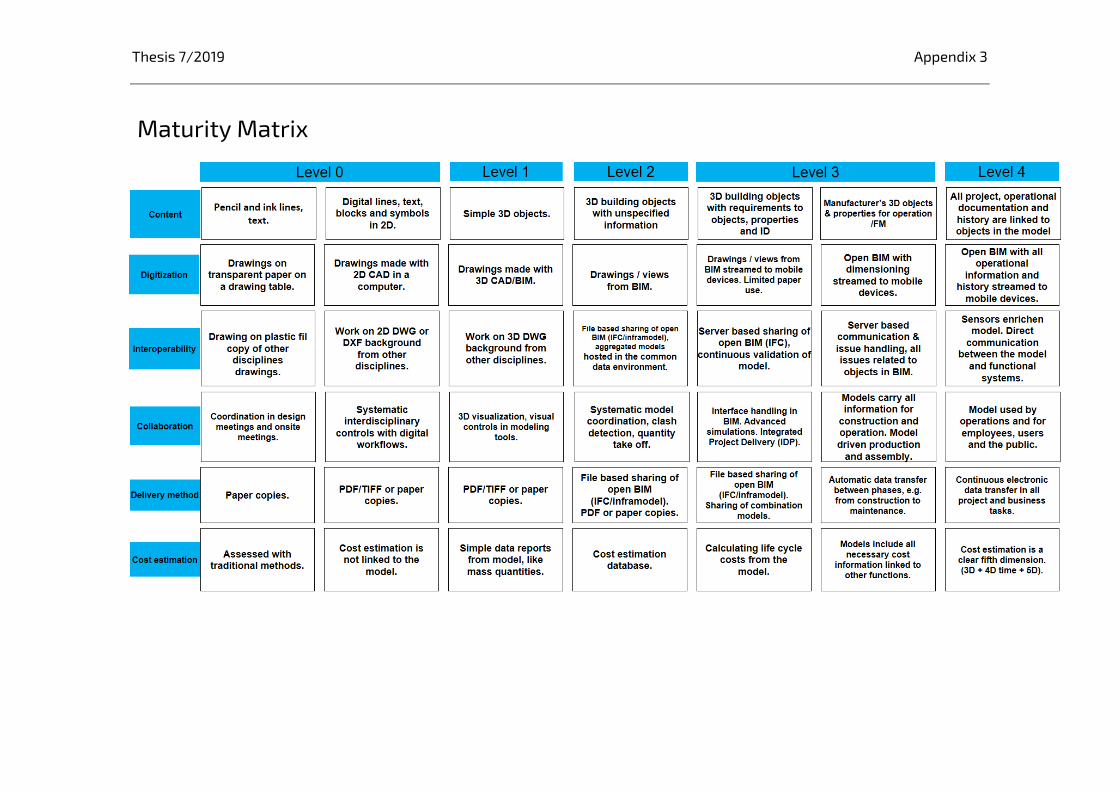
Thesis 7/2019 Appendix 3
Maturity Matrix
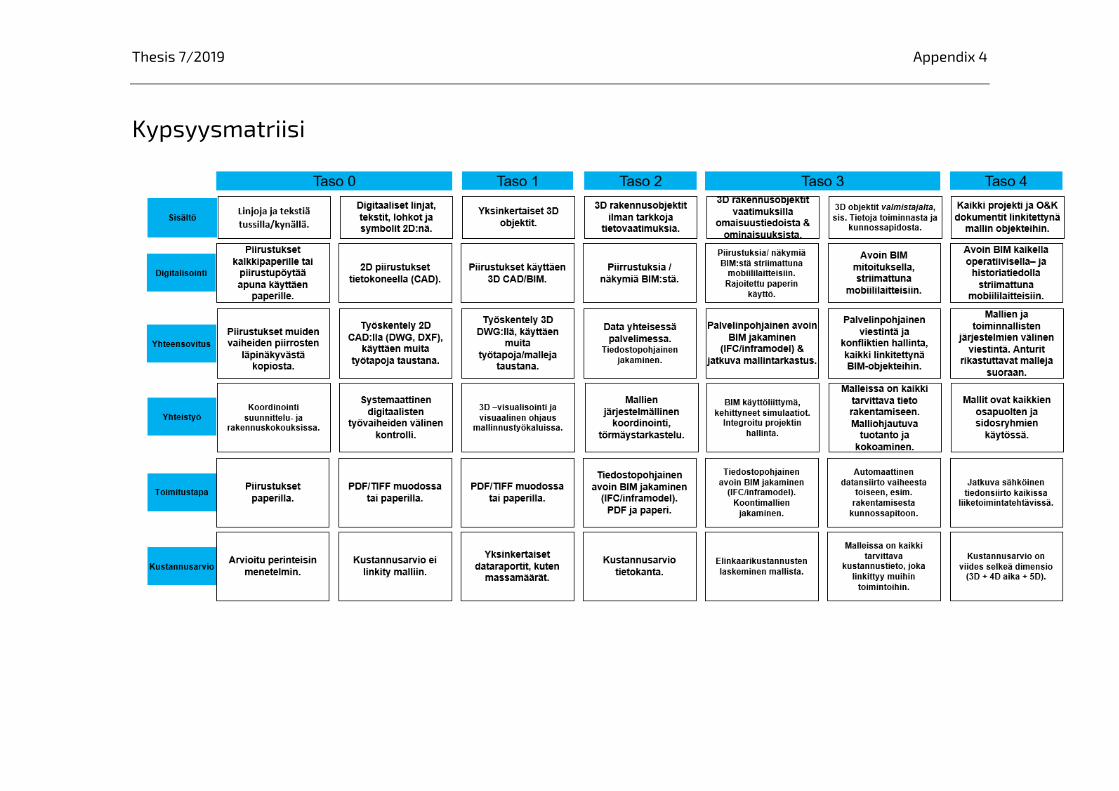
Thesis 7/2019 Appendix 4
Kypsyysmatriisi
ISSN 2490-1202ISBN 978-952-317-713-0 www.vayla.fi