Embed Size (px)
DESCRIPTION
Â
Citation preview
Effect of Microstructure and Alloying Elements on the Resistance of
Fastener Grade Steels to Hydrogen Assisted Cracking
By
Nicholas E. Nanninga
A THESIS
Submitted in partial fulfillment of the requirements
For the degree of
MASTER OF SCIENCE IN MATERIALS SCIENCE & ENGINEERING
Michigan Technological University
2005
Copyright @ Nicholas E. Nanninga 2005
This thesis, “Effect of Microstructure and Alloying Elements on the Resistance of
Fastener Grade Steels to Hydrogen Assisted Cracking,” is hereby approved in partial
fulfillment of the requirements for the Degree of MASTER OF SCIENCE IN
MATERIALS SCIENCE & ENGINEERING
DEPARTMENT:
MATERIALS SCIENCE & ENGINEERING
Signatures:
Thesis Advisor _______________________________________
Typewritten Name _______________________
Thesis Advisor _______________________________________
Typewritten Name _______________________
Department Chair _______________________________________
Typewritten Name _______________________
Date __________________________________
II
Abstract
Fastener grade steels with varying alloy contents and heat treatments were
employed to measure changes in resistance to hydrogen assisted cracking. The testing
procedure compared notched tension specimens fractured in air to threshold stress values
obtained during hydrogen charging, utilizing a rising step load procedure. Bainitic
structures improved resistance by 10-20% compared to tempered martensite structures.
Dual phase steels with a tempered martensite matrix and 20% ferrite were more
susceptible and notch sensitive. High strength, fully pearlitic structures showed an
improvement in resistance. Carbon content, per se, had no effect on the resistance of
steel to hydrogen assisted cracking. Chromium caused a deleterious effect but all other
alloying elements studied did not cause much change in hydrogen assisted cracking
susceptibility.
III
Table of Contents
Signatures…………………………………………………………… II Abstract……………………………………………………………... III List of Figures………………………………………………………. VII List of Tables……………………………………………………….. IX Chapter 1: Introduction…………………………………………….. 1 Chapter 2: Background…………………………………………….. 4 2.1: Threaded Fasteners and Notched Fracture Mechanics......... 4 2.2: Hydrogen Induced Cracking (HIC)……………………….. 8
2.2.1: Mechanisms and Theories…………………………… 8
2.2.1.A: Troiano’s Decohesion Theory………………... 9
2.2.2.B: Petch’s Surface Energy Reduction Theory…... 11
2.2.3.C: Beachem’s Model for Hydrogen-Assisted Cracking……………………………………… 12 2.2.2: Test methods for Hydrogen Induced Cracking Resistance……………………………………………. 14
2.3: Steel Microstructures and Effects of Microstructures on HIC…………………………………………………….. 17
2.3.1: Dual Phase Structure………………………………… 17
2.3.2: Martensite Versus Bainite…………………………… 22
IV
2.3.3: Alloying Element and Carbon Content Effects on HIC.......................................................................... 27
2.4: Fractography………………………………………………. 29
2.5: Ferrite Crystallite Size…………………………………...... 30
Chapter 3: Experimental Procedure……………………………….. 32
3.1: Notched Tension Sample Preparation and Heat Treatment.. 32 3.1.1: Sample Preparation…………………………………… 32
3.1.2: 10B21 Heat Treatment……………………………….. 33 3.1.3: 1541 Heat Treatment…………………………………. 34 3.1.4: 1038 Heat Treatment…………………………………. 35
3.1.5: 4140, 1095 and 1065 Heat Treatment………………... 37
3.1.5.A: Austempering………………………………… 37
3.1.5.B: Quenching and Tempering…………………… 38
3.1.6: 4037 Dual Phase Heat Treatment……………………. 39
3.2: Tension Testing……………………………………………. 39
3.2.1: Rising Step Load (RSL) Procedure…………………... 39
3.3: Characterization……………………………………………. 41
3.3.1: Hardness, Metallography and Fractography…………. 41
3.3.2: X-ray Diffraction…………………………………….. 42
Chapter 4: Results…………………………………………………. 44
4.1: Rising Step Load (RSL) Threshold Stress Results………… 44
V
4.1.1: Dual Phase……………………………………………. 48 4.1.2: Effects of Alloying elements and Carbide Content on HIC……………………………………………….. 52 4.1.3: Austempered Vs. Quenched and Tempered…………. 62
4.2: Ferrite Crystallite Size Analysis…………………………... 69
Chapter 5: Conclusions……………………………………………. 72
Chapter 6: References……………………………………………... 73
Appendices…………………………………………………………. 76
VI
List of Figures
2.1: Schematic illustration of a bolt showing stress concentration points where failure often occurs………………………………………………………… 5 2.2: Geometry of a round bar with grooved notch typically used in stress concentration calculations………………………………………………………….. 6 2.3: Schmatic representation of the fracture modes possible in steel when hydrogen cracking is involved………………………………………. 13 2.4: Schematic representation of the rising step load protocol used in finding the threshold load of the sample………………………………. . 17 2.5: Schematic iron-carbon phase diagram showing the intercritical ferrite+austenite region used in dual phase heat treatments……………….. 18 2.6: Various heat treatment schedules used to produce a dual phased steel microstructure………………………………………………………… 20 2.7: Schematic representation of the formation of upper and lower bainite……. 24 2.8: Bainite and martensite start temperatures as a function of carbon concentration……………………………………………………….. 25 2.9: Illustration of fracture modes……………………………………………… 30 3.1: Drawing and dimensions of the notched tensile sample…………………… 33 3.2: Tempering curve for 10B21 alloy used in experiments……………………. 34 3.3: Tempering curve for alloy 1541 used in experiments…………………….. 35 3.4: Images showing the heterogeneous microstructures of the 1038 samples heat treated through Jantom Precision……………………………. 36 3.5: Rack and samples used in the austempering of the 4140, 1095 and 1065 steel tensile samples………………………………………………………. . 38 4.1: Hydrogen charged and uncharged data for all alloys, heat treatments and strength levels…………………………………………………………. 48 4.2: SEM images of CA and SA dual phase microstructures…………………... 49 4.3: Bar charts displaying behavior of dual phase structures compared to quenched and tempered…………………………………………………. 51
VII
4.4: Fractographs of 4037 step annealed dual phase steel……………………… 52 4.5: Plot showing the difference in uncharged fracture strength of the quenched and tempered carbon steels versus the alloyed steels…………… 54 4.6: SEM fracture surface of the 1038 uncharged specimens and optical image of 1095 specimen……………………………………………. 55 4.7: Data indicating no change in threshold stress as carbon content is increased…………………………………………………………………. 57 4.8: Plot showing the effects of the alloying content on HIC susceptibility……. 60 4.9: Fracture surfaces of quenched and tempered 4140 steel of hardness 466 HVN…………………………………………………………. 61 4.10: Optical images of 4140 microstructures………………………………….. 63 4.11: Hydrogen-induced cracking susceptibility of 4140 austempered and quenched and tempered steels………………………………………… 64 4.12: Hydrogen-induced cracking sucseptability of 1065 and 1095 austempered and quenched and tempered steel…………………………... 65 4.13: SEM images of 1095 isothermally treated steels………………………… 66 4.14: SEM images of 1065 microstructures……………………………………. 67 4.15: 1095 pearlitic steel fracture surfaces……………………………………... 69 4.16: Differences in hardness as a function of particle size measurements……. 70 4.17: Hydrogen-induced cracking susceptibility as a function of the ferrite crystallite size……………………………………………….. 71
VIII
List of Tables
3.1: Chemistry of fastener grade steel alloys used in testing…………………… 32 3.2: Loading profiles used in RSL testing of notched tensile specimens………. 41 4.1: Hardness value of all alloys tested………………………………………… 45 4.2: Notch sensitivity calculations for austempered 1095 specimens………….. 45
IX
- 1 -
Chapter 1: Introduction
Steel fasteners, such as screws, bolts and clamps, are utilized for a broad range of
applications in the automotive industry. These steel fasteners are often exposed to
environments where hydrogen can be absorbed, and the threads or notches on fasteners
act to intensify the effects of hydrogen. Hydrogen that enters the steel is often picked up
in the steel processing operations of acid cleaning and pickling or through electroplating
of the fastener. The generation and absorption of hydrogen can also occur in service
environments when a galvanic potential difference between the steel fastener and a
damaged coating or another metal creates an electrochemical cell. The detrimental
effects on steel that hydrogen can have are well known and have been studied extensively
since the 1950’s. Hydrogen may act to reduce the failure stress of the steel, act to limit
the ductility within the steel or result in a combination of both. The failure of steel
fasteners due to hydrogen attack may occur instantaneously upon loading or after a
delayed period of time. This behavior makes it exceptionally difficult to predict and to
design for resistance to hydrogen induced failures, and is extremely costly from the stand
point of liability and repairs.
There are several mechanisms that have been proposed to explain the effect that
hydrogen has on iron and steel. Some of the mechanisms that are reviewed are the
surface energy reduction theory proposed by Petch [1], the decohesion theory proposed
by Troiano [2] and a theory by Beachem [3] that hydrogen enhances each of the several
normal fracture modes. Many different nomenclatures have been defined to label effects
of hydrogen in steel due to different variables. These typically include stress corrosion
cracking (SCC) and hydrogen embrittlement (HE). Hydrogen embrittlement is often used
- 2 -
to describe failures due to hydrogen introduced into the steel during processing, or
anytime before service. Fracture caused by hydrogen introduced into the steel during the
corrosion reaction of iron is typically termed stress corrosion cracking. Other terms for
hydrogen damage in steel are hydrogen induced cracking (HIC) or hydrogen assisted
cracking (HAC). All these terms describe the process of atomic hydrogen being absorbed
into steel and acting to reduce the strength of the material. Throughout this paper all
mentioned terms are used interchangeably.
There has been a significant amount of research directed at the role that
microstructures of steel play in resisting the harmful effects of hydrogen.
Microstructures examined have included: pearlitic, martensitic and tempered martensite,
bainitic, dual phase, austenitic and spheroidized. It is often accepted that martensite is
most susceptible to hydrogen damage, but tempered martensite is least susceptible.
Alloying elements, including carbon, may also change the behavior of steels charged with
hydrogen.
Previous research conducted at Michigan Technological University studied the
behavior of 4037 steel with tempered martensite and a dual phase martensite plus ferrite
microstructure [4]. The results of this work supplement the present work, which deals
with investigating the effects of isothermal, dual phase and conventional quench and
tempering heat treatments in hydrogen assisted cracking. The goal of this research is to
study the effects that a microstructure and alloying elements have on hydrogen induced
cracking behavior. This was performed by measuring the hydrogen charged threshold
fracture stress of notched steel specimens under a rising step load (RSL) tensile testing
procedure. Typical fastener grade alloys with tempered martensite microstructures
- 3 -
containing varying elements including: boron, carbon, manganese, molybdenum and
chromium were to be compared. Also, common alloys were heat treated to compare
quenched and tempered microstructures to dual phase or bainitic structures.
- 4 -
Chapter 2: Background
2.1: Threaded Fasteners and Notched Fracture Mechanics The significance of fasteners, such as screws, bolts and nuts, is often overlooked,
but fasteners are vital mechanical latching systems for many applications, including
power plant equipment, buildings and bridges, the aerospace industry, and of course the
automotive industry. Stress corrosion cracking or hydrogen embrittlement susceptibility
can often play a role in the design of steel fasteners, because in many applications
fasteners are exposed to environments that could potentially degrade their properties.
Before analyzing the effects the environment or hydrogen have on steel fasteners, it is
important to understand some of the basic properties of a threaded fastener.
A threaded fastener can essentially be compared to a round bar, typically stressed
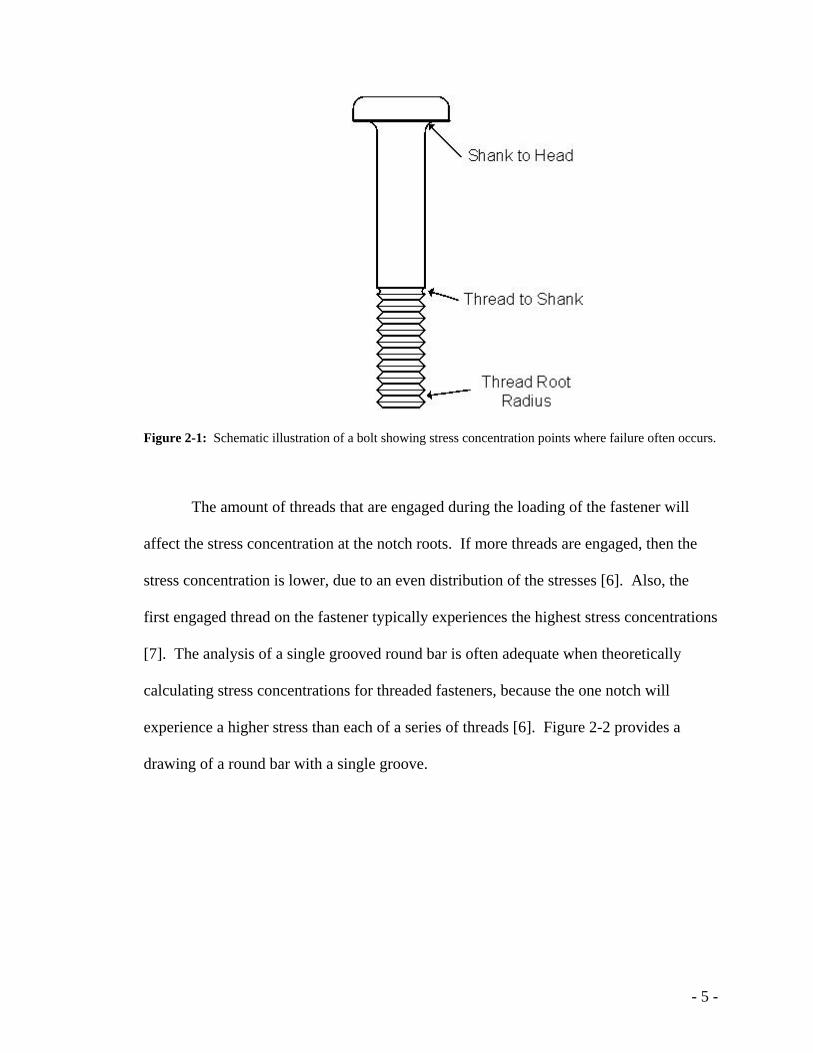
in uniaxial tension, with several notches that act as stress risers [5]. A fastener usually
fails at one of three locations: a thread root radius, the thread to shank radius, or the head
to shank fillet [6]. Figure 2-1 shows a longitudinal view of a threaded fastener,
highlighting the stress concentrations. The failure in these locations is due to stress
concentrations that are localized where the radius is decreased. Notches and grooves
create triaxial stress states that resist local plastic flow during loading and result in
increased yield strengths and brittle fracture; whereas a non-grooved steel rod would
exhibit ductile fracture [7]. For this reason, it is important to design steel fasteners that
have adequate toughness and ductility [5].
- 5 -
Figure 2-1: Schematic illustration of a bolt showing stress concentration points where failure often occurs.
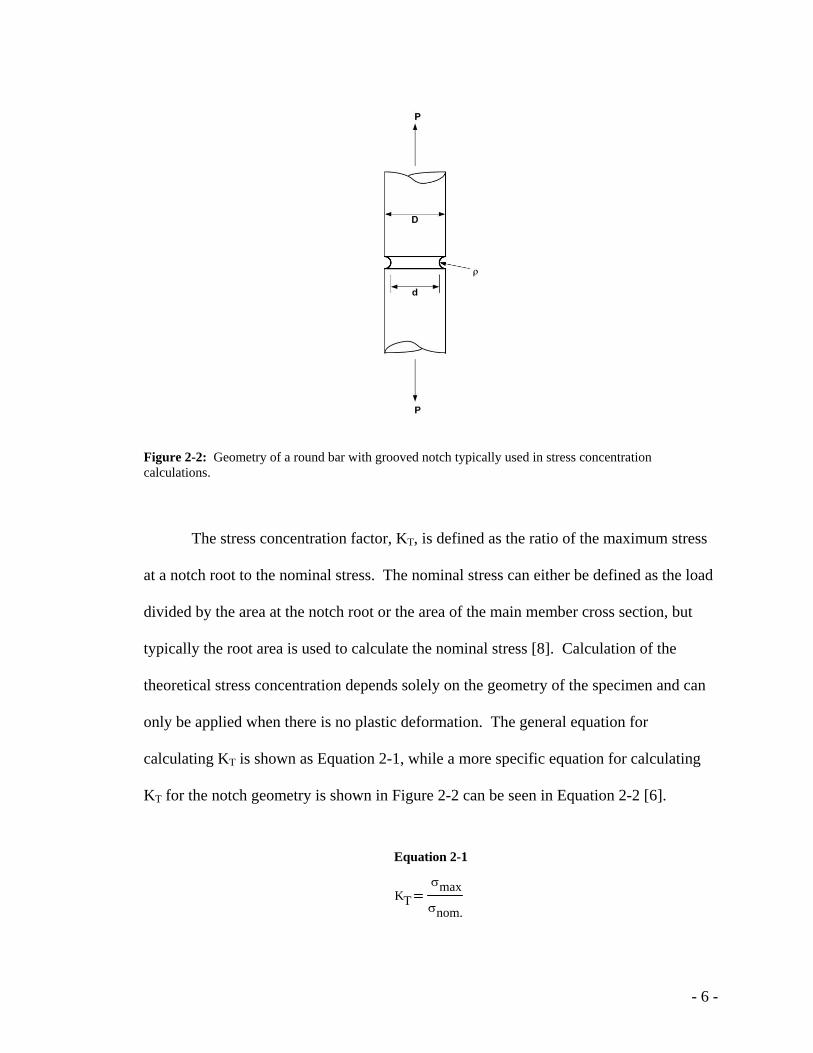
The amount of threads that are engaged during the loading of the fastener will
affect the stress concentration at the notch roots. If more threads are engaged, then the
stress concentration is lower, due to an even distribution of the stresses [6]. Also, the
first engaged thread on the fastener typically experiences the highest stress concentrations
[7]. The analysis of a single grooved round bar is often adequate when theoretically
calculating stress concentrations for threaded fasteners, because the one notch will
experience a higher stress than each of a series of threads [6]. Figure 2-2 provides a
drawing of a round bar with a single groove.
- 6 -
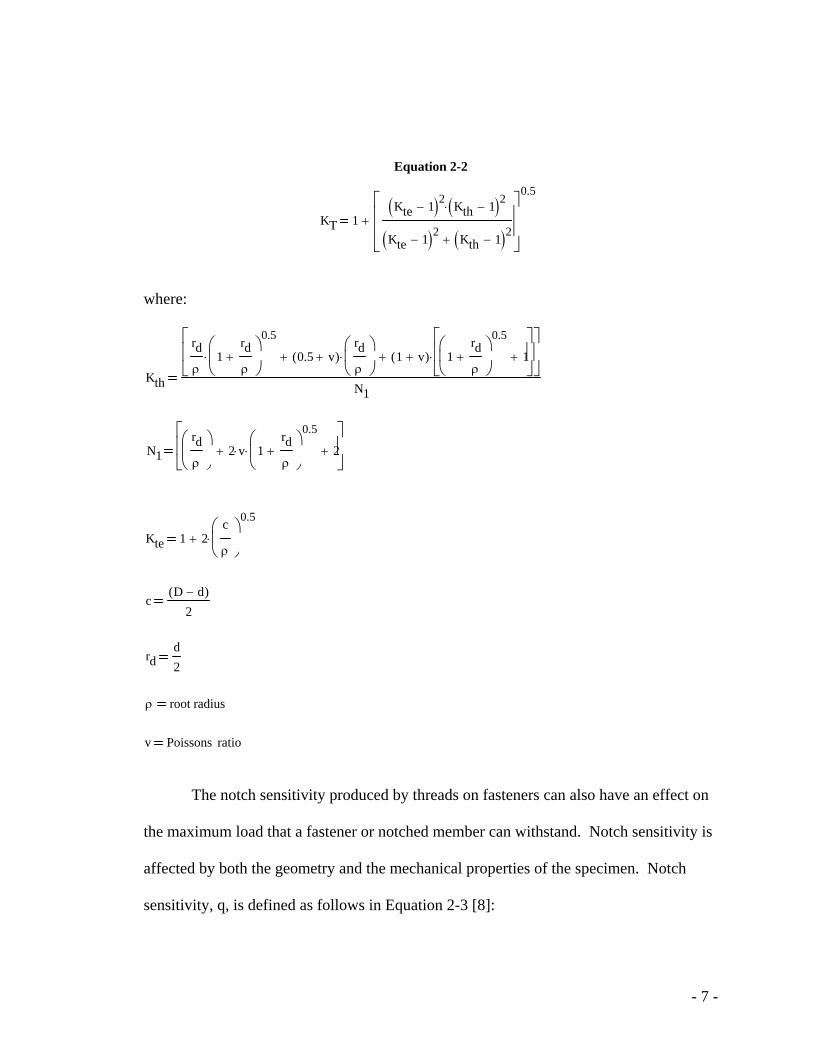
Figure 2-2: Geometry of a round bar with grooved notch typically used in stress concentration calculations.
The stress concentration factor, KT, is defined as the ratio of the maximum stress
at a notch root to the nominal stress. The nominal stress can either be defined as the load
divided by the area at the notch root or the area of the main member cross section, but
typically the root area is used to calculate the nominal stress [8]. Calculation of the
theoretical stress concentration depends solely on the geometry of the specimen and can
only be applied when there is no plastic deformation. The general equation for
calculating KT is shown as Equation 2-1, while a more specific equation for calculating
KT for the notch geometry is shown in Figure 2-2 can be seen in Equation 2-2 [6].
Equation 2-1
KTσmaxσnom.
- 7 -
Equation 2-2
KT 1Kte 1−( )2 Kth 1−( )2
⋅
Kte 1−( )2 Kth 1−( )2+
⎡⎢⎢⎣
⎤⎥⎥⎦
0.5
+
where:
Kth
rdρ
1rdρ
+⎛⎜⎝
⎞⎟⎠
0.5
⋅ 0.5 v+( )rdρ
⎛⎜⎝
⎞⎟⎠
⋅+ 1 v+( ) 1rdρ
+⎛⎜⎝
⎞⎟⎠
0.5
1+⎡⎢⎢⎣
⎤⎥⎥⎦
⋅+⎡⎢⎢⎣
⎤⎥⎥⎦
N1
N1rdρ
⎛⎜⎝
⎞⎟⎠
2 v⋅ 1rdρ
+⎛⎜⎝
⎞⎟⎠
0.5
⋅+ 2+⎡⎢⎢⎣
⎤⎥⎥⎦
Kte 1 2c
ρ
⎛⎜⎝
⎞⎟⎠
0.5
⋅+
c
D d−( )2
rd
d2
ρ root radius v Poissons ratio The notch sensitivity produced by threads on fasteners can also have an effect on
the maximum load that a fastener or notched member can withstand. Notch sensitivity is
affected by both the geometry and the mechanical properties of the specimen. Notch
sensitivity, q, is defined as follows in Equation 2-3 [8]:
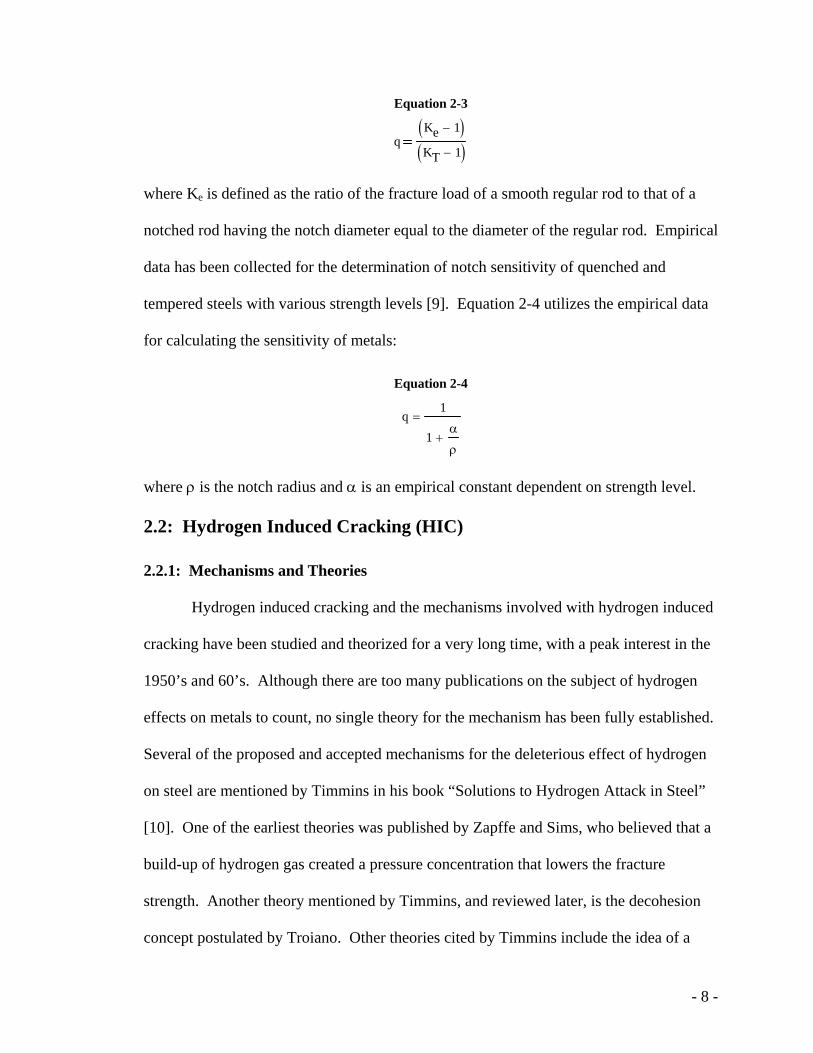
- 8 -
Equation 2-3
qKe 1−( )KT 1−( )
where Ke is defined as the ratio of the fracture load of a smooth regular rod to that of a
notched rod having the notch diameter equal to the diameter of the regular rod. Empirical
data has been collected for the determination of notch sensitivity of quenched and
tempered steels with various strength levels [9]. Equation 2-4 utilizes the empirical data
for calculating the sensitivity of metals:
Equation 2-4
q1
1α
ρ+
=
where ρ is the notch radius and α is an empirical constant dependent on strength level.
2.2: Hydrogen Induced Cracking (HIC) 2.2.1: Mechanisms and Theories Hydrogen induced cracking and the mechanisms involved with hydrogen induced
cracking have been studied and theorized for a very long time, with a peak interest in the
1950’s and 60’s. Although there are too many publications on the subject of hydrogen
effects on metals to count, no single theory for the mechanism has been fully established.
Several of the proposed and accepted mechanisms for the deleterious effect of hydrogen
on steel are mentioned by Timmins in his book “Solutions to Hydrogen Attack in Steel”
[10]. One of the earliest theories was published by Zapffe and Sims, who believed that a
build-up of hydrogen gas created a pressure concentration that lowers the fracture
strength. Another theory mentioned by Timmins, and reviewed later, is the decohesion
concept postulated by Troiano. Other theories cited by Timmins include the idea of a
- 9 -
lowered surface energy required to propagate a crack (Petch), the possibility of formation
of hydrides or other hydrogen phases, that lower the fracture strength of the steel
(Westlake), and finally a theory first postulated by Beachem who found evidence that
hydrogen made dislocation movement easier, so that extreme localized plasticity causes
HE. The theories postulated by Troiano, Beachem and Petch will be reviewed here, since
they are most applicable to the work performed throughout this project.
2.2.1.A: Troiano’s Decohesion Theory
Around 1960 Troiano [2] and Steigerwald, collaborating with Troiano [11],
presented their theory for the mechanism of hydrogen induced cracking in steel and other
body centered cubic metals. They were also able to relate and test experimentally some
of their ideas to other elements such as carbon, nitrogen and oxygen that reside at
interstitial sites in metals. The main criterion for HIC is a localized hydrogen
concentration at dislocation arrays just below a notch root, which was proven to be the
site of maximum triaxial stress. The position of the maximum stress moves inward
toward the center of the specimen as the notch severity, or stress concentration, is
lowered. The hydrogen then acts to weaken the cohesive bonds between the lattice
planes, resulting in a crack or void. Kitajima [12] also showed through modeling that
decohesion is indeed an adaquate mechanism for the propagation of a sharp crack.
It was shown that the delayed failure of metals by HIC can be described in terms
of four stages or levels. First there exists an upper critical stress, which is the failure
strength of the material without the existence of hydrogen. There also exists a lower
critical stress, where hydrogen essentially has no effect on lowering the strength of the
metal, since the hydrogen cannot sufficiently segregate to the stress gradient area. This
- 10 -
stress is often termed the threshold stress. The other stages of HIC are the incubation or
nucleation of the cracks and the propagation of the crack to failure. The fracture rate of
the delayed failure, related to both nucleation and propagation of the crack, is a function
of the stress concentration, which acts as the chemical potential gradient for the diffusion
of hydrogen atoms. The temperature and strain rate also affect the fracture times, again
due to the ability of the hydrogen to accumulate significantly at the notch root area. High
strain rates and low temperatures do not allow for adequate diffusion, therefore fracture is
delayed for longer periods.
Troiano also proved that increases in the hydrogen content, notch severity and
strength level were critical in controlling the susceptibility of metals to HIC by lowering
the threshold stress, nucleation rate of cracks and, eventually, failure times. There
appears to be a minimum gross hydrogen concentration of around 5 ppm for adequate
hydrogen to be supplied to the maximum triaxial stress location, and if more hydrogen is
present it is easier for the hydrogen to accumulate. Critical hydrogen concentration is a
function of the interaction energy between the interstitial hydrogen atoms and the stress
field about the fracture nucleus. As the notch severity increases, the interaction energy
remains the same, but the notch allows for the critical stresses to be reached at lower
applied loads. Effects of the strength level of the steel on HE are also not related to the
interaction energy unless the critical hydrogen content must be changed, yet the threshold
stress will be lowered at higher strength levels. This can be explained by the lower yield
strength in lower strength steels, which initiates plastic flow and decreases the maximum
value of stress that can be attained. This means that the lower critical stress must be
higher to obtain the critical hydrogen concentration. The lower yield strength also
- 11 -
decreases the stress concentration so a higher load is required to generate enough
hydrogen at the maximum triaxiality.
On the atomistic level, Troiano suggested that the filling of the metal d-bands
with excess electrons from hydrogen may be responsible for the loss of cohesive strength
between the atoms. The filling of the d-band may result in increased repulsive forces. It
was believed that by alloying with elements that lowered d-band electron concentrations,
HE could be reduced. This was substantiated through an experiment showing that nickel
alloyed with chromium or iron, which lowers the d-band electron concentration, did
indeed show a decrease in HE susceptibility.
2.2.2.B: Petch’s Surface Energy Reduction Theory
Petch [1] used the Griffth and dislocation theories to explain the loss of strength
in iron based materials due to hydrogen by a lowering of the surface energy required to
propagate a crack. Iron fracture surfaces can act as excellent chemisorbers of hydrogen
and the hydrogen can diffuse to crack tips, where stress concentrations are high, very
quickly at temperatures near room temperature. Through calculations, Petch showed that
the surface energy of iron is reduced drastically even when very small amounts of
hydrogen are present. This reduction in surface energy was related to a reduction in
fracture strength for hydrogen charged samples. It was also observed that the charged
and uncharged samples both followed a Hall-Petch relationship with respect to grain size,
but the trend for the charged samples showed a decrease in slope and intercept. The
decrease in slope is attributed to the lowering of the surface energy when hydrogen is
present, while the change in intercept is related to the loss in ductility due to the lowering
of the slope value.
- 12 -
2.2.3.C: Beachem’s Model for Hydrogen-Assisted Cracking
Beachem [3], in the 70’s, proposed a model that hydrogen actually can act to
promote local plastic deformation, which is essentially opposite to a theory of
embrittlement. Overall, it was believed that hydrogen served to enhance whichever
fracture mode, intergranular (IG), microvoid coalescence (MVC), cleavage, and/or
quasicleavage (QC) is normally activated. The theory was supported by the observation
of microvoid coalescence fracture in continuously hydrogen charged steels. This
suggested that the hydrogen made dislocation multiplication and motion easier at lower
stresses, and thus acts to create localized plastic deformation at these lower stresses.
Hydrogen induced cracking is typically associated with a lack of ductility and not
increased plasticity. This was explained by Beachem by the fact that local plasticity due
to hydrogen charging was constrained by the uncharged non-ductile material surrounding
the plastic zone. This is similar to the phenomenon for notched tension specimens. The
expansion of the local plastic zone is limited by the diffusion of the hydrogen, and
therefore the crack will propagate by means of a brittle fracture through the uncharged
area. The result of this behavior is a decreased reduction in area of smooth specimens
when hydrogen is present.
The effect of hydrogen on steels was stated to depend upon chemistry of the steel,
heat treatment of the steel, the stress intensity at the crack root and the amount of
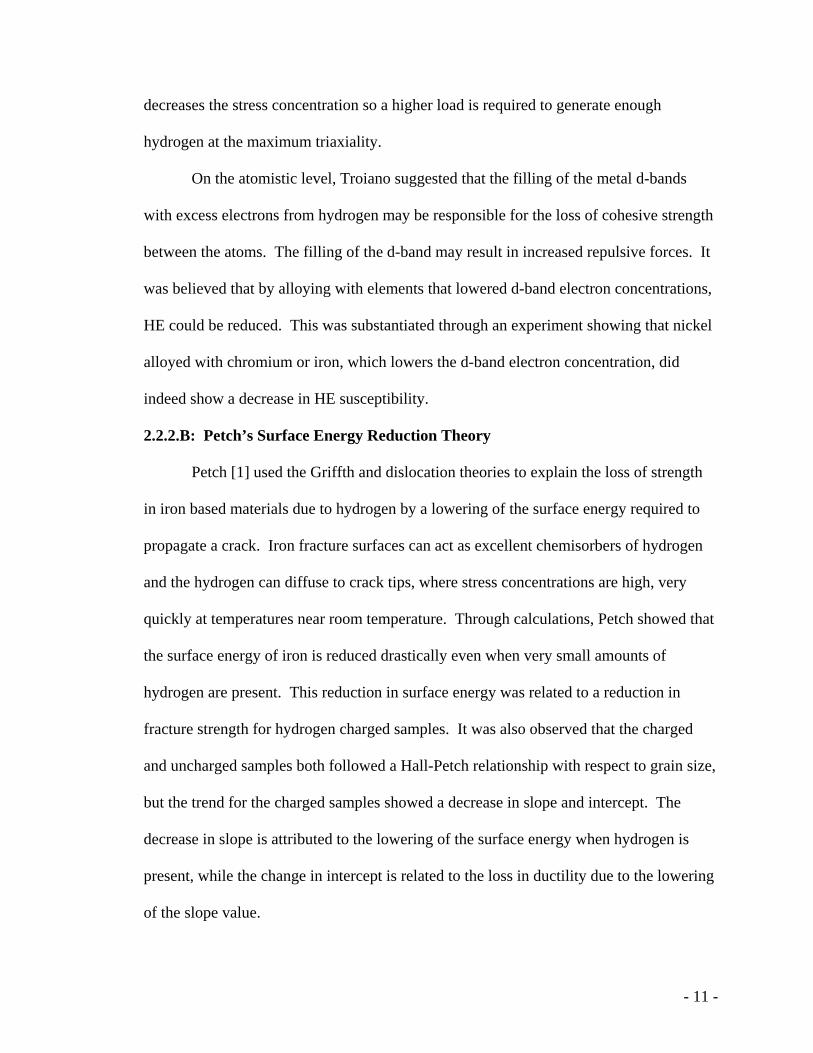
hydrogen present. A plot of stress intensity as a function of hydrogen content was
created to visualize the theory given a steel and heat treatment, showing the differences in
the fracture modes that would be present. A schematic of this plot is shown in Figure 2-
3.
- 13 -
Figure 2-3. Schmatic representation of the fracture modes possible in steel when hydrogen cracking is
involved [3].
Support of the localized plasticity theory due to hydrogen in steel was observed
by Nagumo [13] and Kinaev et al. [14]. Experiments by Kinaev were conducted by
measuring crack tip opening displacement and strain fields in fatigue pre-cracked fracture
mechanics specimens that were tested in a vacuum, hydrogen gas atmosphere or water
vapor atmosphere. The strain gradient in the samples tested in the hydrogen atmospheres
and water vapor showed a significant increase in plasticity compared to that of the
samples tested in vacuum. The crack tip opening displacement of the specimens tested in
a low hydrogen pressure was similar to that of the specimens in air, even though the
plastic zone and local strains were higher. At higher hydrogen gas pressure and in water
- 14 -
vapor the plastic zone and crack tip opening displacement were significantly larger than
in vacuum. At longer time intervals the opening of the crack tip increased for the
specimen at the high hydrogen pressure, indicating plasticity through creep. Kinaev et
al.’s work can be used to verify that hydrogen does induce localized plasticity at crack
openings and there may be either a critical hydrogen concentration required to initiate the
plasticity or a time dependence to activate the plasticity.
2.2.2: Test methods for Hydrogen Induced Cracking Resistance
Several test methods have been devised for quantifying the effects that hydrogen
has on materials when they are stressed. Testing methods have also been specifically
developed to test the strengths of fasteners with and without hydrogen present. ASTM
standard F 606 gives a detailed description of the proper testing of the mechanical
properties of threaded fasteners, which includes: hardness measurements, standard
tension testing, wedge tension testing, and wedge testing for embrittlement [15]. The
embrittlement wedge testing is designed to test coated fasteners that may have residual
hydrogen trapped within the fastener due to the coating. During the wedge test a fastener
is loaded in tension to a minimum of 75% the ultimate strength with a wedge of a specific
angle placed underneath the head of the bolt for a minimum of 48 hours. Following the
testing period, the fastener will pass if it shows no sign of failure due to embrittlement.
Other test methods for hydrogen embrittlement include a DaimlerChrysler (DCX) torque
test similar to ASTM F 606, a GM bend test, the slow strain rate tension test (SSRT) and
the rising step load test (RSL). The RSL testing can be performed in either tension or
bending.
- 15 -
McCarthy et. al. [16] performed a study to compare three HE testing methods;
the DCX torque test, GM bend test and RSL bend test. This comparison was performed
specifically to test for the effect of residual hydrogen on steel fasteners. The study
showed that the RSL bend test produced the most definitive and reproducible results, but
the application of the bend was not appropriate and the test should be carried out in
tension. The torque down test was found to be the least accurate in predicting the HE
behavior of the fasteners. The draw backs of the RSL test are that only one sample can
be tested at a time, whereas the other tests can be set up to run several samples, and the
RSL equipment is more expensive. The authors deemed that the RSL tension test would
be a good test to identify the threshold stress that a fastener could withstand.
Raymond [17], the designer of the RSL testing procedure, also has compared RSL
testing to other methods. Raymond has identified problems with the wedge
embrittlement test defined in ASTM F 606. These problems are: lack of reproducibility,
typically due to machining tolerances, often inadequate testing times, and a possible
danger of projectiles during failures. The article also points out problems with the SSRT,
such as the lack of correlation between testing and service behaviors and the lack of
addressing the notch sensitive behavior of fasteners during testing. The benefits of the
RSL testing that were not mentioned previously are its ability to easily test in tension or
bending and the fact that a wide spectrum of samples, including actual bolts and pre-
cracked samples, can be tested. It should be noted that the SSRT and the RSL tension
tests are similar in that the load is increased by displacement over an extended time
period in order for the kinetics of HE to take effect, but due to the recent advent of the
- 16 -
RSL most of the research on quantifying HE threshold stresses has been performed using
other methods.
RSL testing can be used to quantify the HE resistance of steels with different heat
treatments or compositions. The test can also be utilized to measure the effect that
residual hydrogen absorbed during processing has on the strength of a given steel, or the
effect the hydrogen has when it is absorbed from a specific environment. The testing
during this project was performed under the same conditions for all samples, but the
chemistry and heat treatments of the steels were varied to see the effect on the threshold
stress.
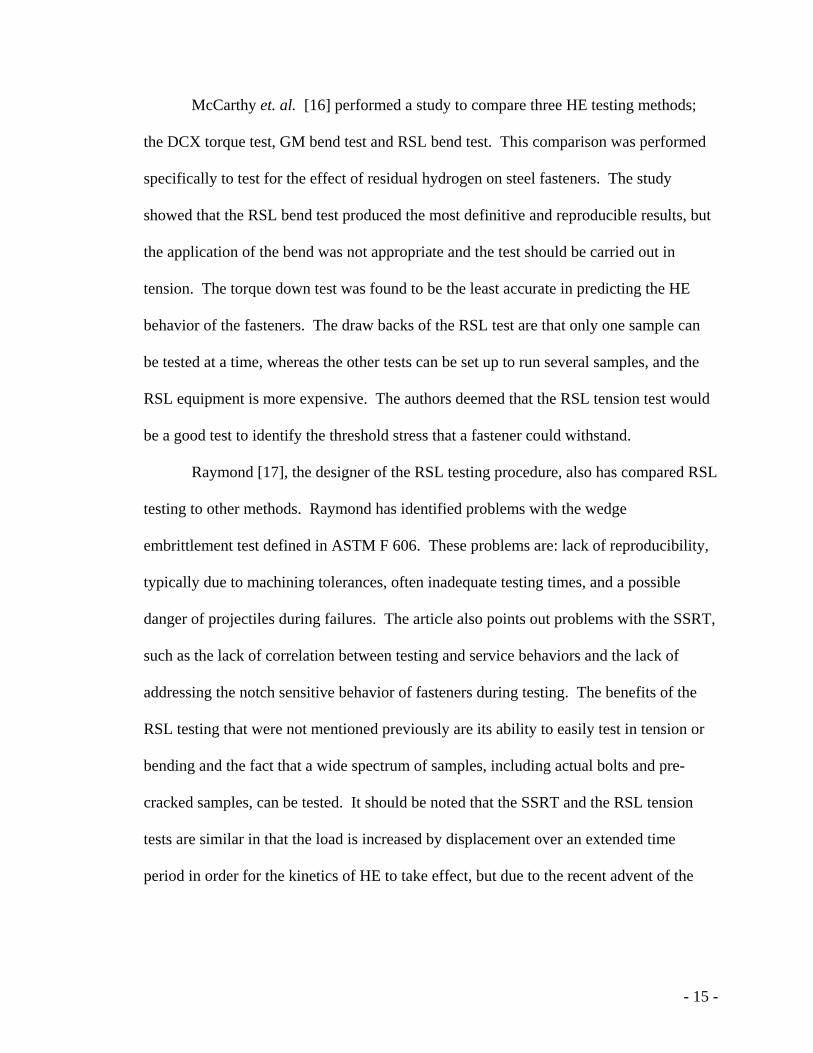
ASTM F 1624 defines the procedure for testing HE susceptibility utilizing a rising
step load. Initially a continuously increasing load is applied at a relatively rapid rate to
the sample, in ambient air, until the specimen fails. This test is performed on two or three
samples and the failure load of the samples is averaged to obtain the critical load required
to rupture the specimen, Pc [18]. The threshold load, Pth, is then measured by loading a
hydrogen charged sample at selected fractions of Pc for a given time until failure occurs.
The time at each increment is extended for each protocol until the time delayed effect is
not noticeable and the fracture load for a given protocol, Pi, does not change when the
holding time is increased, indicating that diffusion rates of hydrogen are not controlling.
This value is defined as the threshold load, Pth. Figure 2.4 shows schematically the
testing protocol used in RSL testing to determine the threshold load of a sample of given
geometry, heat treatment and composition.
- 17 -
Load Vs Time
0
1000
2000
3000
4000
5000
6000
7000
0 10 20 30 40 50 60
Time (hrs)
Load
(lbs
)
P c
P i1
P i2
P i3 ~ P i2 = P th
Figure 2-4. Schematic representation of the rising step load protocol used in finding the threshold load of
the sample.
2.3: Steel Microstructures and Effects of Microstructures on HIC
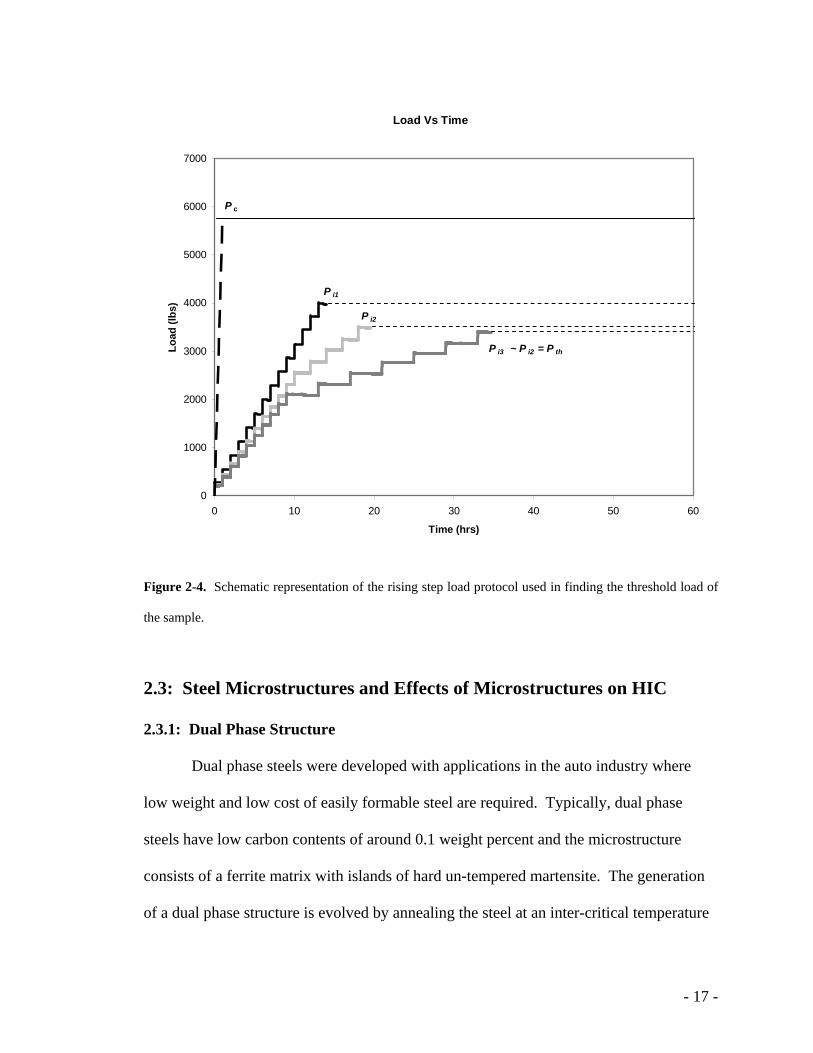
2.3.1: Dual Phase Structure
Dual phase steels were developed with applications in the auto industry where
low weight and low cost of easily formable steel are required. Typically, dual phase
steels have low carbon contents of around 0.1 weight percent and the microstructure
consists of a ferrite matrix with islands of hard un-tempered martensite. The generation
of a dual phase structure is evolved by annealing the steel at an inter-critical temperature
- 18 -
within the ferrite plus austenite phase region, then quenching so that the austenite
transforms to martensite. A phase diagram of steel, showing the intercritical region, can
be observed in Figure 2-5. It has been shown that the strength of the dual phase steels
can be increased by modifying the heat treatment to produce more martensite or by
changing the morphology of the martensite [19, 20].
Figure 2-5: Schematic iron-carbon phase diagram showing the intercritical ferrite+austenite region used in
dual phase heat treatments.
- 19 -
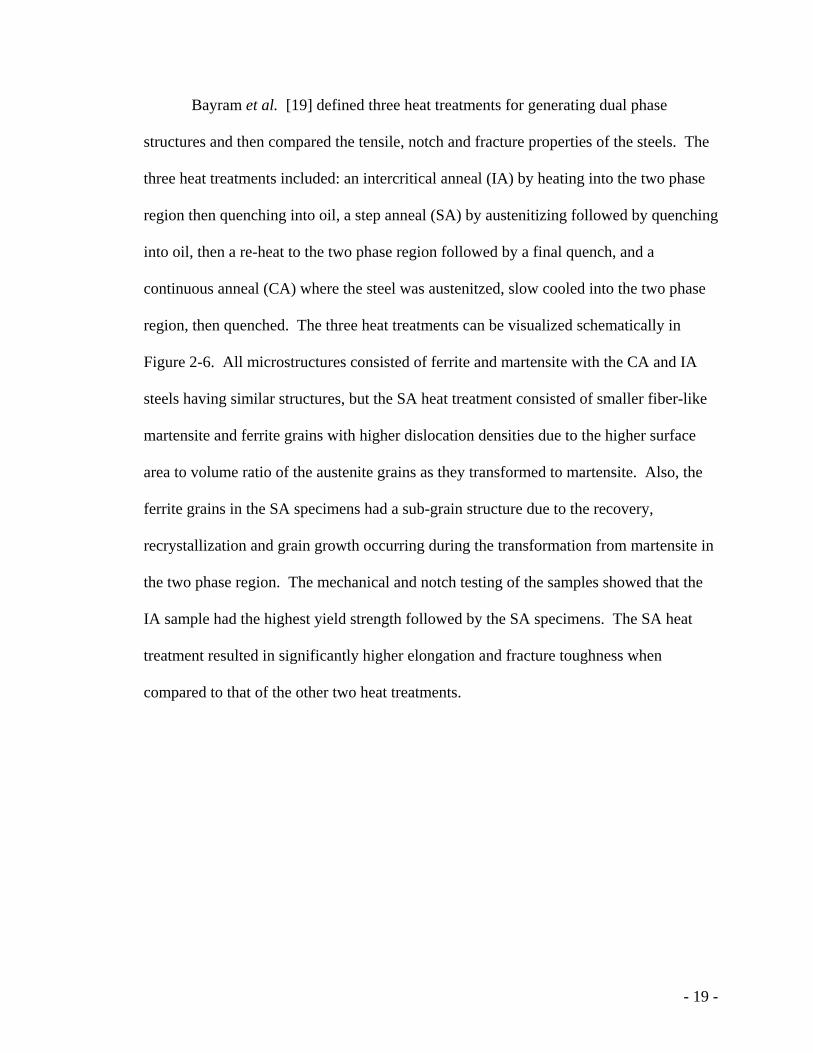
Bayram et al. [19] defined three heat treatments for generating dual phase
structures and then compared the tensile, notch and fracture properties of the steels. The
three heat treatments included: an intercritical anneal (IA) by heating into the two phase
region then quenching into oil, a step anneal (SA) by austenitizing followed by quenching
into oil, then a re-heat to the two phase region followed by a final quench, and a
continuous anneal (CA) where the steel was austenitzed, slow cooled into the two phase
region, then quenched. The three heat treatments can be visualized schematically in
Figure 2-6. All microstructures consisted of ferrite and martensite with the CA and IA
steels having similar structures, but the SA heat treatment consisted of smaller fiber-like
martensite and ferrite grains with higher dislocation densities due to the higher surface
area to volume ratio of the austenite grains as they transformed to martensite. Also, the
ferrite grains in the SA specimens had a sub-grain structure due to the recovery,
recrystallization and grain growth occurring during the transformation from martensite in
the two phase region. The mechanical and notch testing of the samples showed that the
IA sample had the highest yield strength followed by the SA specimens. The SA heat
treatment resulted in significantly higher elongation and fracture toughness when
compared to that of the other two heat treatments.
- 20 -
Figure 2-6: Various heat treatment schedules used to produce a dual phase steel microstructure.
γ
Temperature
Time
Step Anneal
α + γ
α + γ
Temperature
Time
Continuous Anneal
γ
α + γ
Temperature
Time
Intercritical anneal
- 21 -
Ahmad et al. [20] performed an intercritical anneal on a medium carbon steel at
various temperatures ranging from the eutectoid temperature to a temperature just above
the two phase region, in the gamma region. This produced a dual phase structure with
martensite volume fractions ranging from about 30% to 100 %. The strength of the steel
increased as the martensite content increased, but the elongation decreased. The fracture
process in the steels was observed to be a micro-void process with nucleation at the
ferrite-martensite interface when there was a lower percentage of martensite present, but
changed to a micro-cracking brittle mechanism when the martensite content was
increased.
Grochowski [4], in the previous work related to this research project, performed
RSL testing on AISI 4037, heat treated by the continuous annealing method to produce a
dual phase structure. The high carbon content and high annealing temperature produced
a structure with a martensite matrix and around 12% ferrite. The samples were then
heated and held at various temperatures to temper the martensite and obtain a range of
hardness values. During the RSL testing the samples showed notch sensitivity when
tested in air, due possibly to a micro-cracking behavior at the ferrite-martensite
interfaces. The RSL samples tested in a salt water solution showed a drop off in
threshold stress as the hardness of the samples increased, as observed in most other steels.
In another study by Kerr et al. [21], it was observed that the critical stress intensity for
stress corrosion cracking of a dual phase, ferrite matrix with martensite islands, was
higher than that of a fully martensitic structure.
The morphology changes due to a step anneal process may change the notch
sensitivity and resistance to HIC of dual phase ferrite plus martensite steels. Specimens
- 22 -
of 4037 steel were heat treated by the step anneal and temper process to generate samples
with varying hardness. These samples were subsequently tested for resistance to HIC
using the RSL testing method.
2.3.2: Martensite Versus Bainite
The martensite reaction involves heating steel into the face centered cubic (fcc)
austenite phase field followed by quenching into an aggressive cooling medium so that
diffusion does not take place during the transformation. The martensite transformation is
a shear transformation, wherein the carbon atoms in the fcc phase are trapped at the
interstitial sites when the material attempts to transform to the low temperature body
centered cubic (bcc) structure. The resulting crystal structure is body centered tetragonal
(bct), with carbon atoms trapped at interstitial sites. The strengthening mechanism of the
martensite is due to the solid solution hardening as well as the dislocation strain
hardening from the transformation. Quenched martensite has a very high hardness;
therefore the material is typically tempered at a moderate temperature. The initial stage
of tempering involves relieving of the residual stresses accumulated during quenching.
Then the carbon diffuses out of the body centered structure and forms carbides. With the
diffusion of the carbon to form carbides, the matrix microstructure returns to that of bcc
ferrite.
The bainitic reaction produces a structure that is similar to that of martensite, but
the transformation is a diffusional transformation that typically occurs isothermally at
temperatures below the pearlite temperatures and above the martensite start temperature.
The isothermal treatment following austenitizing is often referred to as austempering.
Improved toughness and ductility of bainitic structures at a given hardness, when
- 23 -
compared to martensitic, make bainitic steels more attractive in certain applications. The
reduction in area of a tensile sample for bainitic steels may be nearly double that for
tempered martensite steels [22]. There is also less distortion when performing an
isothermal heat treatment due to the differences in transformation behavior and less
thermal distortion. Typical applications for bainitic steels are fasteners, clips, springs and
lawn mower blades.
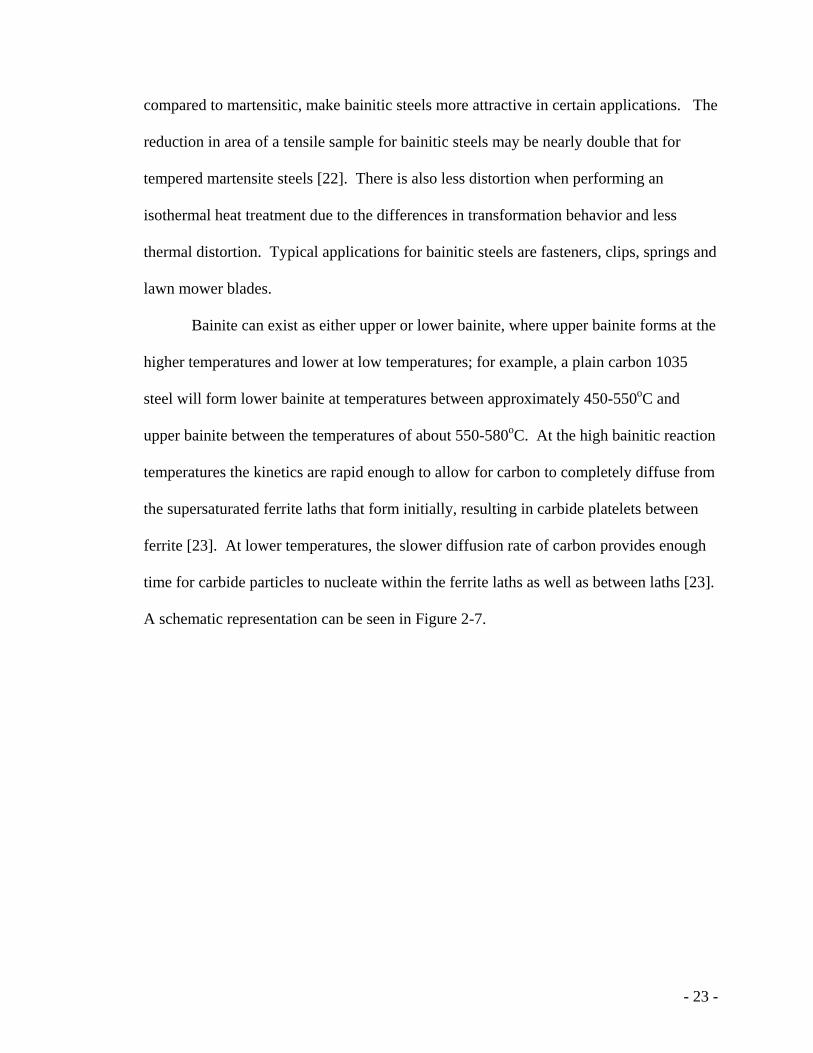
Bainite can exist as either upper or lower bainite, where upper bainite forms at the
higher temperatures and lower at low temperatures; for example, a plain carbon 1035
steel will form lower bainite at temperatures between approximately 450-550oC and
upper bainite between the temperatures of about 550-580oC. At the high bainitic reaction
temperatures the kinetics are rapid enough to allow for carbon to completely diffuse from
the supersaturated ferrite laths that form initially, resulting in carbide platelets between
ferrite [23]. At lower temperatures, the slower diffusion rate of carbon provides enough
time for carbide particles to nucleate within the ferrite laths as well as between laths [23].
A schematic representation can be seen in Figure 2-7.
- 24 -
Figure 2-7: Schematic representation of the formation of upper and lower bainite [23].
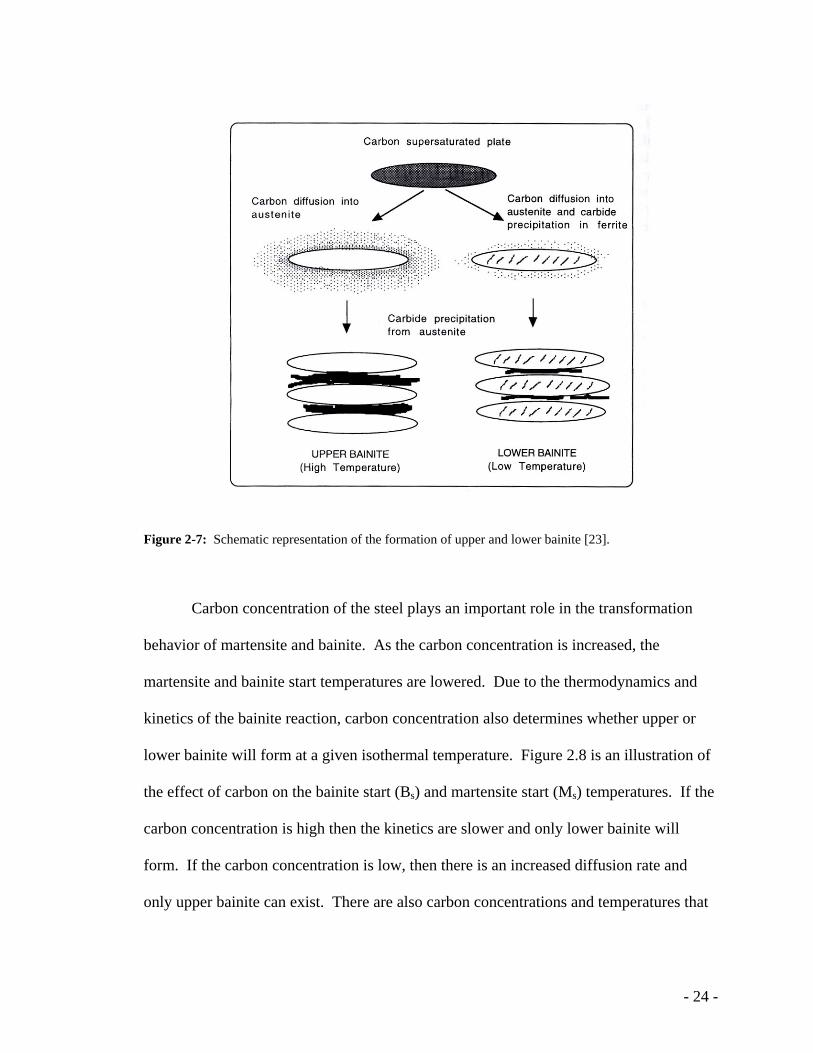
Carbon concentration of the steel plays an important role in the transformation
behavior of martensite and bainite. As the carbon concentration is increased, the
martensite and bainite start temperatures are lowered. Due to the thermodynamics and
kinetics of the bainite reaction, carbon concentration also determines whether upper or
lower bainite will form at a given isothermal temperature. Figure 2.8 is an illustration of
the effect of carbon on the bainite start (Bs) and martensite start (Ms) temperatures. If the
carbon concentration is high then the kinetics are slower and only lower bainite will
form. If the carbon concentration is low, then there is an increased diffusion rate and
only upper bainite can exist. There are also carbon concentrations and temperatures that
- 25 -
may produce a mixed upper and lower bainite structure or mixed lower bainite and
martensite structure [23].
Figure 2-8: Bainite and martensite start temperatures as a function of carbon concentration [23]
The HIC behavior of steels containing fully tempered martensite structures has
been studied extensively, and the resistance to HIC is often related to the hardness of the
tempered steel [24, 25, 26, 27]. As the hardness, or yield strength, is increased the
resistance to HIC decreases. Many investigators believe that the strength level is not the
determining factor in hydrogen embrittlement and that microstructural features may be
more important in assessing the resistance to HIC [24, 28].
McCarthy et al. [24] performed RSL studies on 1022 and 10B21 steels that were
hardened through quench and temper treatments. It was discovered that small changes in
- 26 -
tempering temperature resulted in drastic changes in the microstructure, which, in turn,
changed the susceptibility to hydrogen assisted cracking. A decreased susceptibility was
attributed to a morphology change of the carbide particles from long plates to small
spheres. It was determined that tempering temperature is a better indicator of resistance
to HIC than hardness. Quadrini [27] hypothesized that more thermodynamically stable
microstructures, i.e. higher tempering temperatures, are less susceptible to hydrogen
induced cracking. Also, it was mentioned that larger carbides, again associated with
higher tempering temperatures, require higher threshold stresses to nucleate cracks or
micro-voids, resulting in increased resistance to HIC.
Thompson et. al. [28] presented work on 4140 steel, comparing the susceptibility
of hydrogen charged bend specimens having both quenched and tempered and bainitic
structures. The crack initiation loads dropped significantly more for the quenched and
tempered samples that were hydrogen charged when compared to the bainitic specimens.
It should be noted though that the initiation load was lower in air for the bainitic sample.
The fracture mode was the same for both martensitic and bainitic samples, consisting of
an intergranular mode at the notch root and micro-void coalescence deeper into the
sample. The percentage of area consisting of intergranular fracture was much higher for
the quenched and tempered than the bainite specimens.
Kerr et al. [21] studied the critical stress intensity for stress corrosion cracking of
specimens containing either a martensitic, bainitic or dual phase ferrite/martensite
structure. It was found that the highly tempered martensitic structure produced the most
resistance, followed by the bainitic and dual phase structures, with the most susceptible
structure being that of untempered quenched martensite. Two studies on hydrogen
- 27 -
induced fatigue crack growth showed contradictory results on the effect of bainitic
structures compared to tempered martensite structures at similar yield strengths [29,30].
In one study there was no pronounced difference in the crack growth rate as a function of
stress intensity for samples of varying microstructure [29]. In the other study, highly
tempered martensite showed the slowest crack growth, followed by the bainitic
structures, with the low temperature tempered martensite structures having the quickest
growth rates [30]. Bainitic structures of either lower or upper bainite showed a similar
growth rate, which was attributed to cracking along inter-lath carbide particles.
The morphology of the carbides and ferrite in bainite may reduce the
susceptibility of steel to hydrogen assisted cracking when compared to tempered
martensite. In this work several different alloys were heat treated to produce specimens
of the two different microstructures (bainite and tempered martensite) at similar hardness
levels. These specimens were then tested using the RSL method to determine the
threshold fracture stresses and to determine if variations in the microstructure do indeed
affect the resistance to HIC.
2.3.3: Alloying Element and Carbon Content Effects on HIC
Fastener grade steels are typically alloyed to increase the hardenability of the
steel, ensuring the material is through hardened upon quenching. Carbon may be added
to obtain a steel if high strength is required, since increases in carbon content increase the
strength attainable through quenching and tempering. Alloying elements present in steel
may play a role in several different interactions with hydrogen, such as local hydrogen
concentrations, trapping and diffusion, changes in matrix or interface cohesion,
dislocation mobility and resistance to crack nucleation, propagation or crack arrest [31].
- 28 -
Typical fastener grade steels are 1022, 10B21, 1038, 1065, 1095, 1541, 4037 and 4140,
and contain alloying elements such as carbon, boron, manganese, molybdenum and
chromium.
The amount of carbon in a given alloy controls not only the attainable hardness of
a given steel but also the amount and type of carbides that are present following heat
treatment. The weight fraction of carbide in plain carbon steel can be estimated using the
lever rule. Carbide content and morphology may adjust the trapping behavior, which can
contribute to hydrogen assisted cracking. Although effects of alloying elements on HIC
behavior are typically not studied systematically, some data for various elements exist.
Bernstein et. al. [31] has summarized studies of alloying effects on hydrogen assisted
cracking. Manganese is one element that is believed to cause increased susceptibility to
hydrogen cracking. Elements that may be beneficial are silicon, vanadium, niobium,
palladium and boron. Two studies have shown that boron has little effect on the
susceptibility of steel to HIC but results may be more reproducible [24, 32]. Typical
hardening agents, chromium, nickel and molybdenum, show mixed results [31].
The trapping behavior of steels can cause pronounced changes in the diffusion of
hydrogen through the steel. Traps are usually classified into two categories, reversible
and irreversible. Reversible traps are low energy traps, where hydrogen is capable of
being released at room temperature. High energy trap locations, from which hydrogen
cannot be removed, are classified as irreversible traps. Typical reversible traps are
dislocations, grain boundaries and precipitate interfaces, while irreversible traps are
usually carbides or oxide and sulfide inclusions. The hydrogen diffusion rate in bcc iron
is around 7.0 x 10⁻⁹ m2s-1, but is reduced to about 2.0 x 10⁻¹¹ m2s-1 when the structure is
- 29 -
quenched martensite [26]. The lower effective diffusion rate for quenched martensite is
due to the dislocations that act as reversible traps. During tempering the density of
dislocations is reduced and the diffusion rate of hydrogen initially increases, then
decreases again as irreversible trapping carbides are precipitated [26, 30].
Several different alloys were quenched and tempered to produce tempered
martensite at similar hardness levels and were then tested in tension to measure the
threshold stress of each alloy at a given hardness. Also, three plain carbon steels were
quenched and temper heat treated to similar hardness levels, in an effort to determine the
effect of carbon content on resistance to HIC.
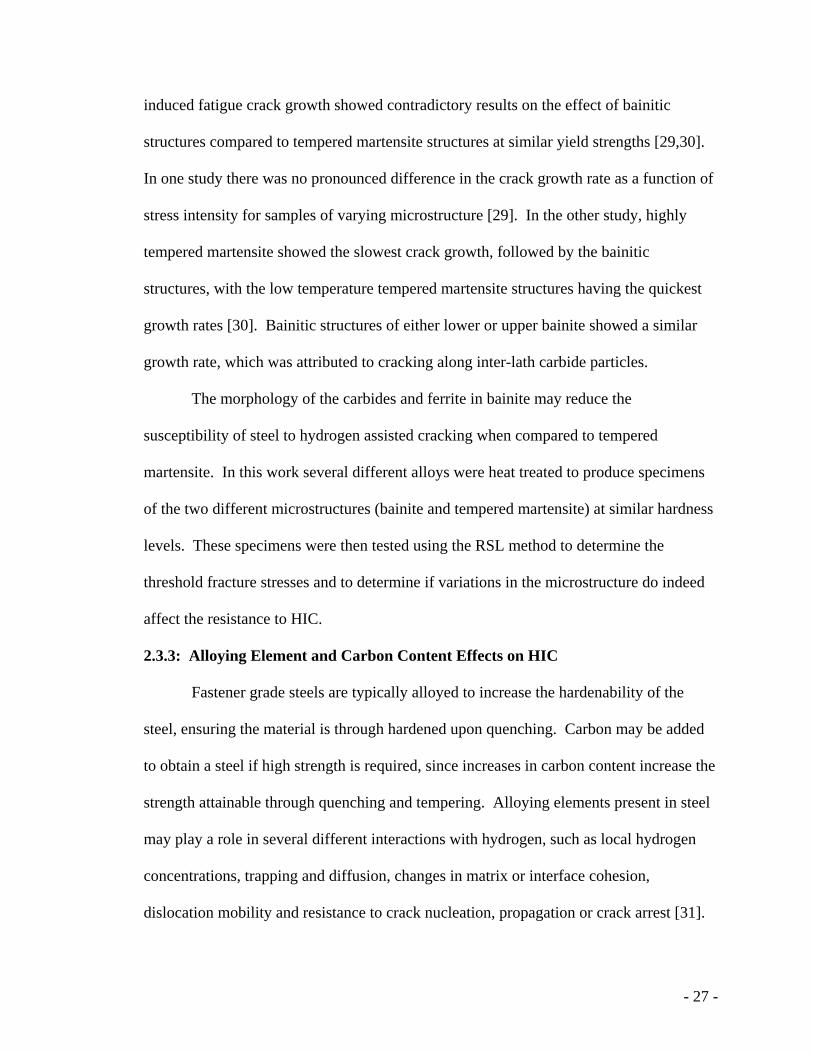
2.4: Fractography
Fracture surfaces can often provide investigators with a map of the possible
failure mechanisms. There are typically four fracture modes: micro-void coalescence
(MVC), cleavage (C), quasi-cleavage (QC) and intergranular (IG). It is possible and even
likely that two or more of the fracture modes occur during failure. Micro-void
coalescence failure is usually associated with a plastic failure mechanism, while the
others are typically more of a brittle mechanism. Properties associated with fracture
surfaces, such as dimple size of voids in MVC or facet size of cleavage plates can be
helpful in identifying possible fracture-microstructure relationships. Figure 2-9 displays
schematically four modes of fracture. Fracture surfaces of all batches of specimens tested
under RSL conditions were observed to help identify possible fracture modes in hydrogen
charged and uncharged specimens.
- 30 -
Figure 2-9: Illustration of fracture modes. (a) micro-void coalescence, (b) quasi-cleavage, (c) low stress
intensity intergranular, (d) high stress intensity intergranular [3].
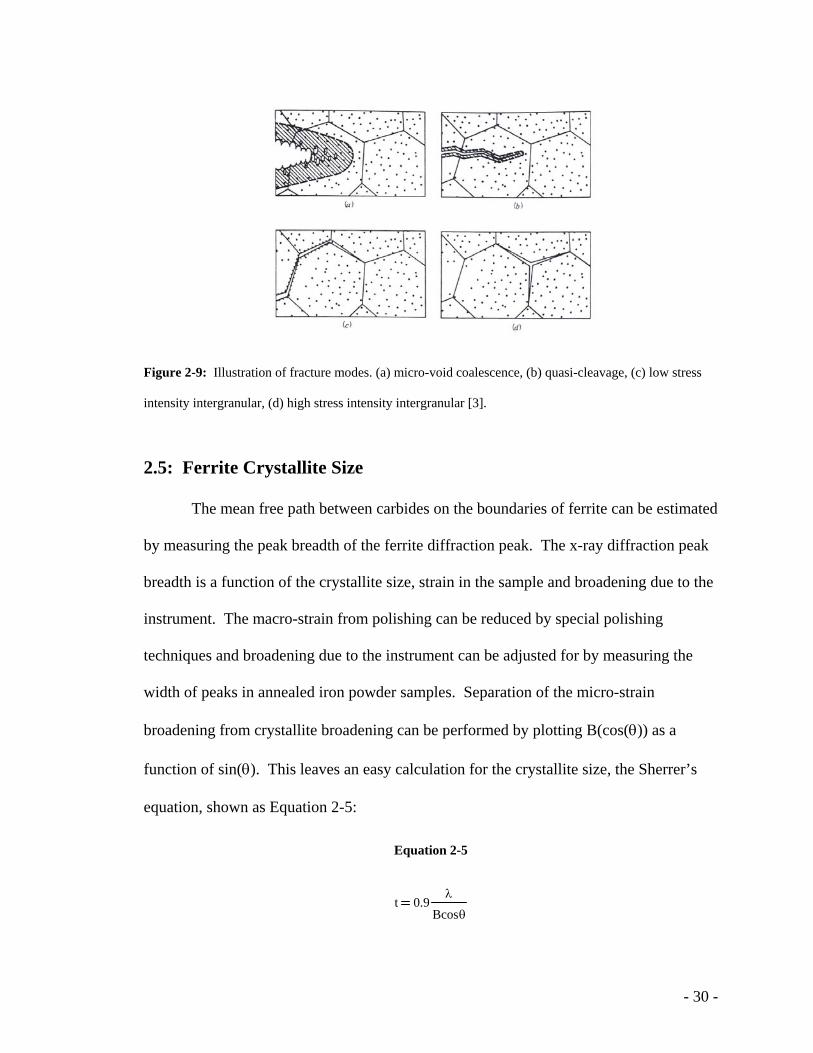
2.5: Ferrite Crystallite Size
The mean free path between carbides on the boundaries of ferrite can be estimated
by measuring the peak breadth of the ferrite diffraction peak. The x-ray diffraction peak
breadth is a function of the crystallite size, strain in the sample and broadening due to the
instrument. The macro-strain from polishing can be reduced by special polishing
techniques and broadening due to the instrument can be adjusted for by measuring the
width of peaks in annealed iron powder samples. Separation of the micro-strain
broadening from crystallite broadening can be performed by plotting B(cos(θ)) as a
function of sin(θ). This leaves an easy calculation for the crystallite size, the Sherrer’s
equation, shown as Equation 2-5:
Equation 2-5
t 0.9λ
Bcosθ
- 31 -
where t is the crystallite size, λ is the wavelength of the x-rays, θ is the peak position angle and B is the full width at half maximum (FWHM) of the peak [33]. This equation
can be applied to the FWHM after instrument broadening, Gaussian and Lorentz
corrections are taken into account.
Knowing the ferrite crystallite size can help to identify the spacing between
carbides in steel and can be used to relate the strength of the steel to microstructural
features that may change the resistance of a given steel to HAC. The crystallite size was
estimated for all 4140, 1065 and 1095 specimens by x-ray diffraction.
- 32 -
Chapter 3: Experimental Procedure 3.1: Notched Tension Sample Preparation and Heat Treatment 3.1.1: Sample Preparation
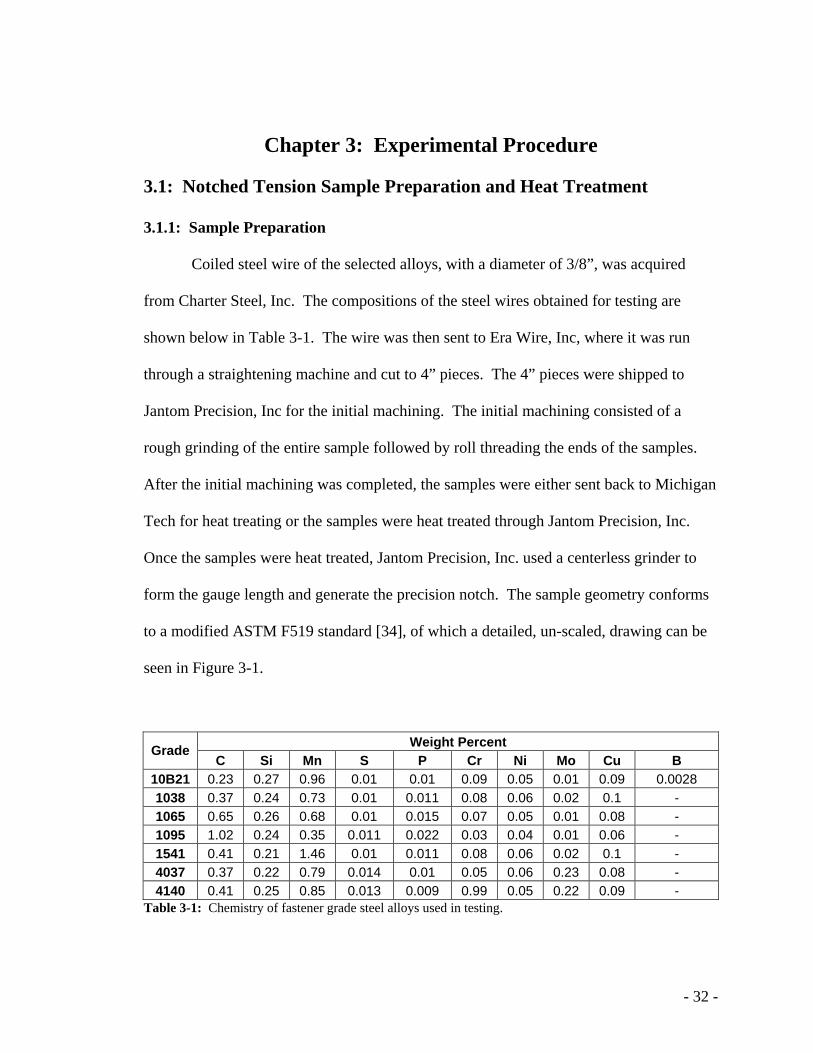
Coiled steel wire of the selected alloys, with a diameter of 3/8”, was acquired
from Charter Steel, Inc. The compositions of the steel wires obtained for testing are
shown below in Table 3-1. The wire was then sent to Era Wire, Inc, where it was run
through a straightening machine and cut to 4” pieces. The 4” pieces were shipped to
Jantom Precision, Inc for the initial machining. The initial machining consisted of a
rough grinding of the entire sample followed by roll threading the ends of the samples.
After the initial machining was completed, the samples were either sent back to Michigan
Tech for heat treating or the samples were heat treated through Jantom Precision, Inc.
Once the samples were heat treated, Jantom Precision, Inc. used a centerless grinder to
form the gauge length and generate the precision notch. The sample geometry conforms
to a modified ASTM F519 standard [34], of which a detailed, un-scaled, drawing can be
seen in Figure 3-1.
Weight Percent Grade C Si Mn S P Cr Ni Mo Cu B
10B21 0.23 0.27 0.96 0.01 0.01 0.09 0.05 0.01 0.09 0.0028 1038 0.37 0.24 0.73 0.01 0.011 0.08 0.06 0.02 0.1 - 1065 0.65 0.26 0.68 0.01 0.015 0.07 0.05 0.01 0.08 - 1095 1.02 0.24 0.35 0.011 0.022 0.03 0.04 0.01 0.06 - 1541 0.41 0.21 1.46 0.01 0.011 0.08 0.06 0.02 0.1 - 4037 0.37 0.22 0.79 0.014 0.01 0.05 0.06 0.23 0.08 - 4140 0.41 0.25 0.85 0.013 0.009 0.99 0.05 0.22 0.09 -
Table 3-1: Chemistry of fastener grade steel alloys used in testing.
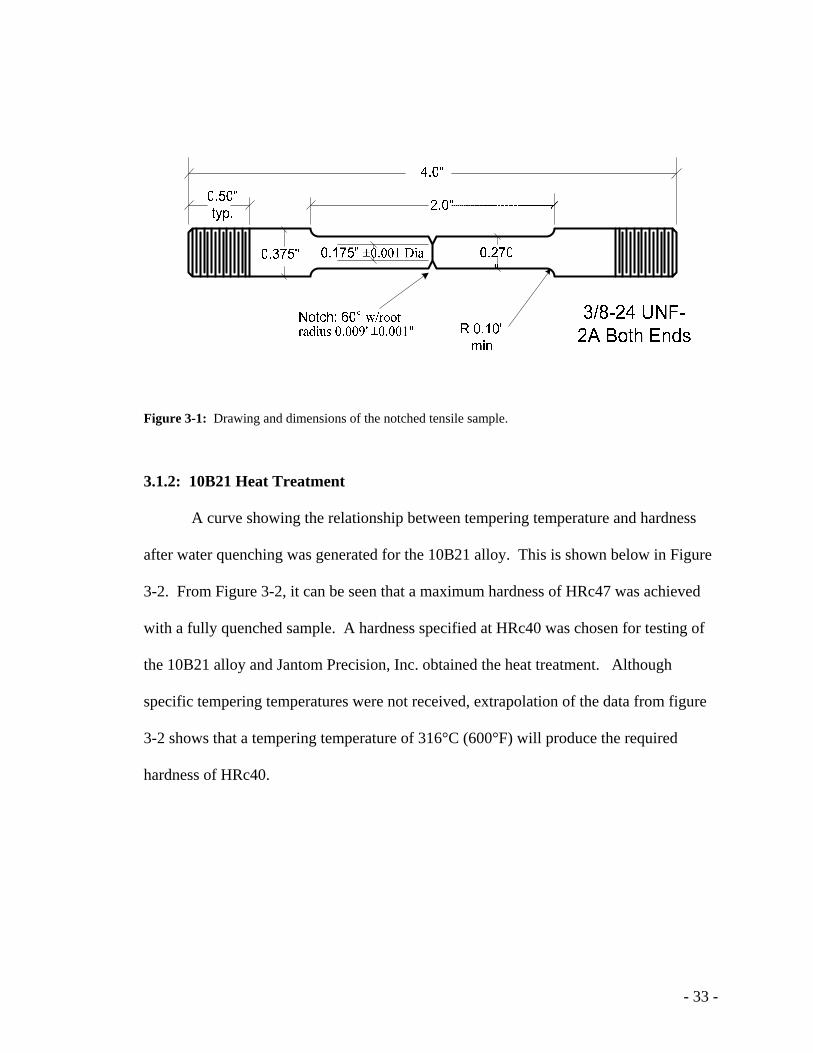
- 33 -
Figure 3-1: Drawing and dimensions of the notched tensile sample.
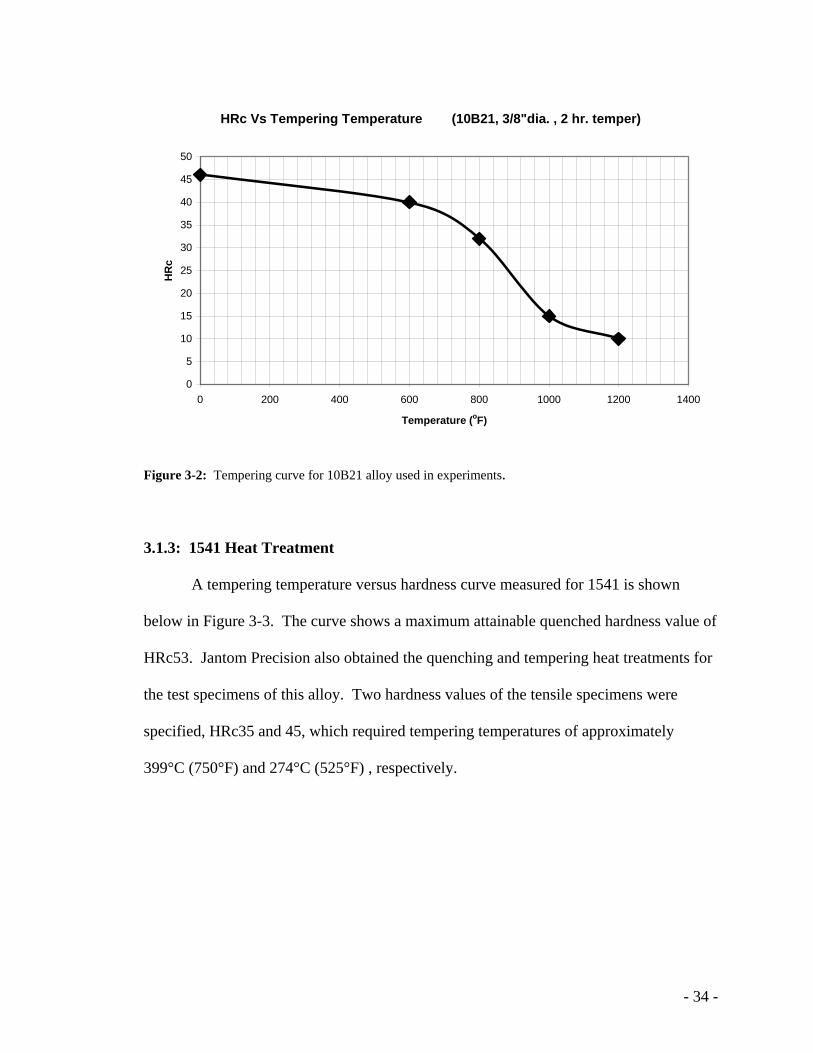
3.1.2: 10B21 Heat Treatment
A curve showing the relationship between tempering temperature and hardness
after water quenching was generated for the 10B21 alloy. This is shown below in Figure
3-2. From Figure 3-2, it can be seen that a maximum hardness of HRc47 was achieved
with a fully quenched sample. A hardness specified at HRc40 was chosen for testing of
the 10B21 alloy and Jantom Precision, Inc. obtained the heat treatment. Although
specific tempering temperatures were not received, extrapolation of the data from figure
3-2 shows that a tempering temperature of 316°C (600°F) will produce the required
hardness of HRc40.
- 34 -
HRc Vs Tempering Temperature (10B21, 3/8"dia. , 2 hr. temper)
0
5
10
15
20
25
30
35
40
45
50
0 200 400 600 800 1000 1200 1400
Temperature (oF)
HR
c
Figure 3-2: Tempering curve for 10B21 alloy used in experiments.
3.1.3: 1541 Heat Treatment
A tempering temperature versus hardness curve measured for 1541 is shown
below in Figure 3-3. The curve shows a maximum attainable quenched hardness value of
HRc53. Jantom Precision also obtained the quenching and tempering heat treatments for
the test specimens of this alloy. Two hardness values of the tensile specimens were
specified, HRc35 and 45, which required tempering temperatures of approximately
399°C (750°F) and 274°C (525°F) , respectively.
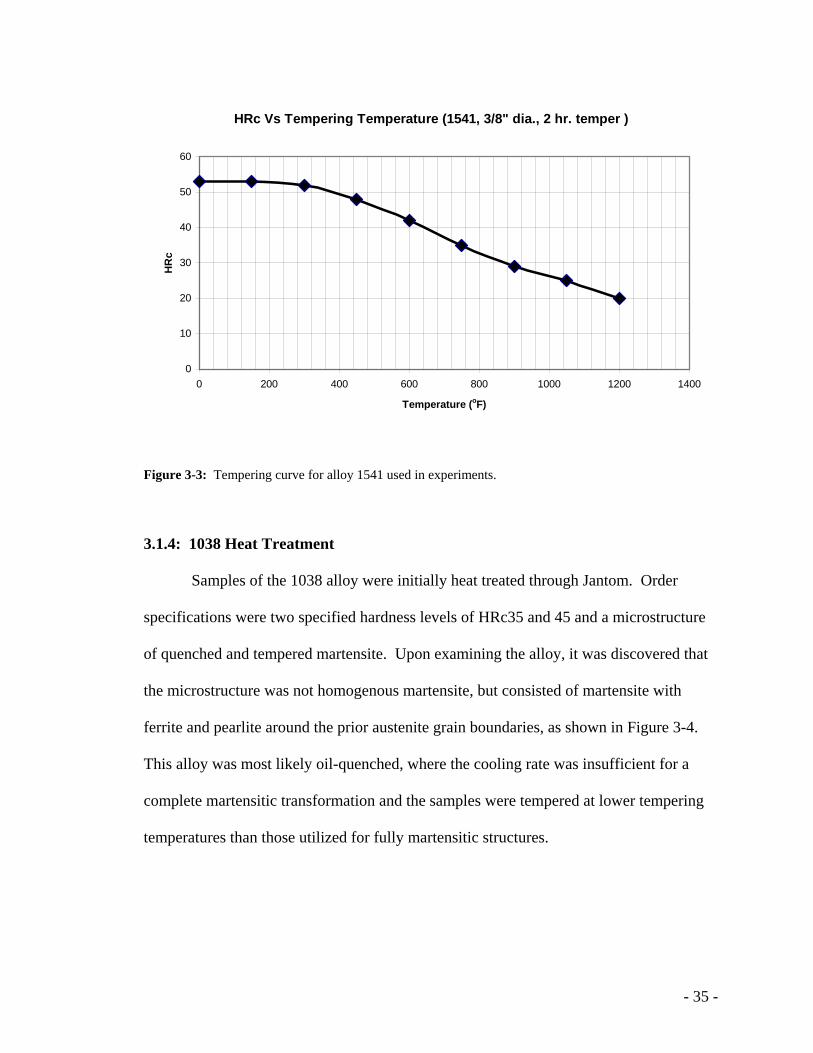
- 35 -
HRc Vs Tempering Temperature (1541, 3/8" dia., 2 hr. temper )
0
10
20
30
40
50
60
0 200 400 600 800 1000 1200 1400
Temperature (oF)
HR
c
Figure 3-3: Tempering curve for alloy 1541 used in experiments.
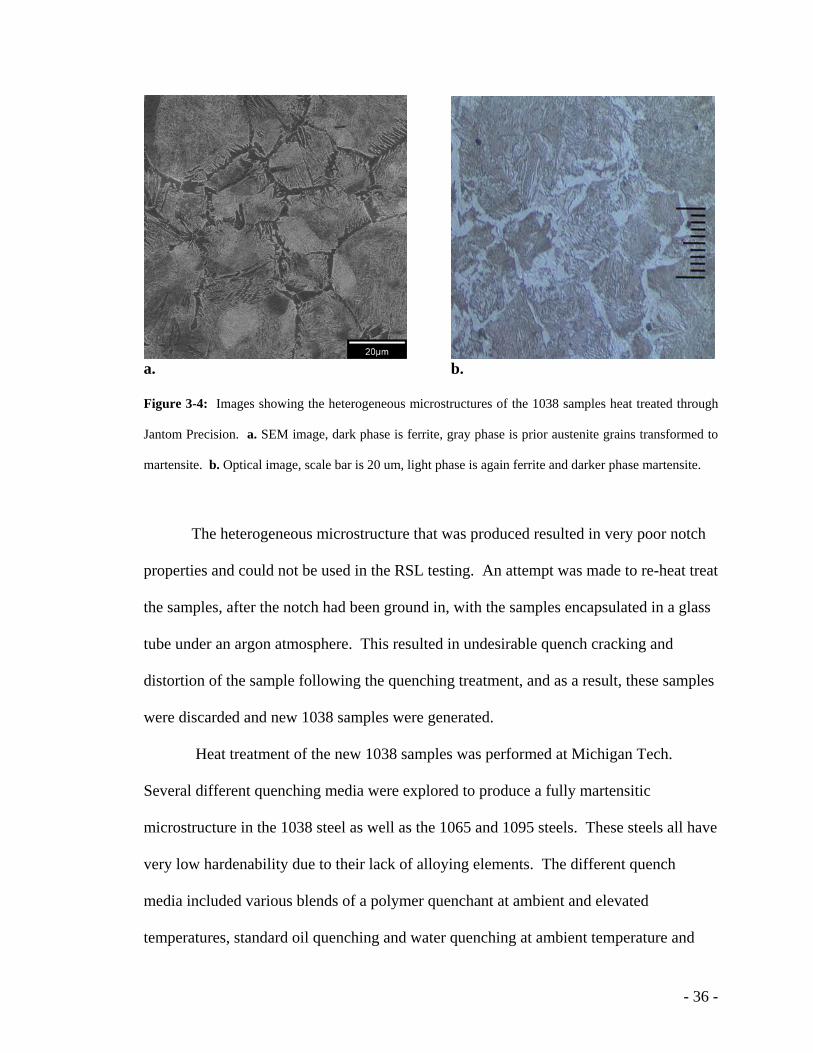
3.1.4: 1038 Heat Treatment
Samples of the 1038 alloy were initially heat treated through Jantom. Order
specifications were two specified hardness levels of HRc35 and 45 and a microstructure
of quenched and tempered martensite. Upon examining the alloy, it was discovered that
the microstructure was not homogenous martensite, but consisted of martensite with
ferrite and pearlite around the prior austenite grain boundaries, as shown in Figure 3-4.
This alloy was most likely oil-quenched, where the cooling rate was insufficient for a
complete martensitic transformation and the samples were tempered at lower tempering
temperatures than those utilized for fully martensitic structures.
- 36 -
a. b. Figure 3-4: Images showing the heterogeneous microstructures of the 1038 samples heat treated through
Jantom Precision. a. SEM image, dark phase is ferrite, gray phase is prior austenite grains transformed to
martensite. b. Optical image, scale bar is 20 um, light phase is again ferrite and darker phase martensite.
The heterogeneous microstructure that was produced resulted in very poor notch
properties and could not be used in the RSL testing. An attempt was made to re-heat treat
the samples, after the notch had been ground in, with the samples encapsulated in a glass
tube under an argon atmosphere. This resulted in undesirable quench cracking and
distortion of the sample following the quenching treatment, and as a result, these samples
were discarded and new 1038 samples were generated.
Heat treatment of the new 1038 samples was performed at Michigan Tech.
Several different quenching media were explored to produce a fully martensitic
microstructure in the 1038 steel as well as the 1065 and 1095 steels. These steels all have
very low hardenability due to their lack of alloying elements. The different quench
media included various blends of a polymer quenchant at ambient and elevated
temperatures, standard oil quenching and water quenching at ambient temperature and
- 37 -
elevated temperatures. The oil quench was not severe enough to produce fully
martensitic structures, but on the other hand the ambient water quench was too severe and
quench cracking resulted longitudinally along the samples. The polymer-water quench
was too unpredictable; therefore a quench into water at temperature of 43ºC was utilized.
This heat treatment produce a fully martensitic structure with only one sample lost to
quench cracking.
The rough machined and threaded 1038 samples were placed in iron filings to
prevent oxidation and de-carburization, then austenitized at 858ºC for two hours,
followed by the 43ºC water quench. Samples were then placed in iron filings and
tempered at two different tempering temperatures, 300ºC or 400ºC, with target hardness
values of 45 and 35 HRc, respectively.
3.1.5: 4140, 1095 and 1065 Heat Treatment
3.1.5.A: Austempering
Both austempering and quench and tempering heat treatments were performed on
the 1065, 1095 and 4140 steels. The austempering treatment was initially attempted at
Michigan Tech, but due to the difficulty in producing a homogenous bainitic structure, it
was decided that a professional heat treatment facility should perform the austempering.
Applied Process, Inc volunteered to perform these heat treatments. An austenitizing
temperature of 871ºC was selected for the 1095 and 1065 steel and a hold time of 36
minutes was utilized. Salt bath temperatures and hold times for the 1095 steel were
204ºC for 142 minutes, 325ºC for 86 minutes and 384ºC for 53 minutes, while bath
temperatures for the 1065 were 325ºC for 86 minutes and 362ºC for 41 minutes. The
- 38 -
desired hardnesses of the 1095 samples were 40, 50 and 60 HRc, and for the 1065, 40 and
50 HRc. The austenitizing of the 4140 took place in a furnace at 880ºC for 36 minutes,
followed by salt bath quenching at 298ºC for 52 min., 327ºC for 46 min. and 357ºC for
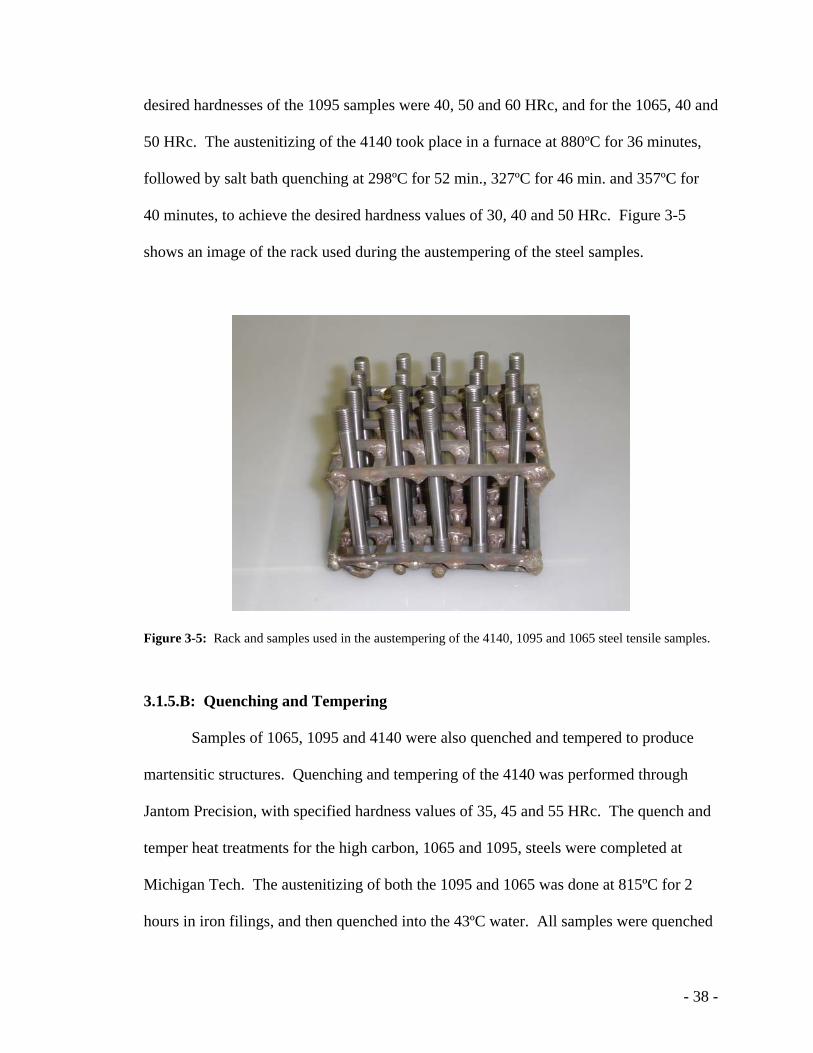
40 minutes, to achieve the desired hardness values of 30, 40 and 50 HRc. Figure 3-5
shows an image of the rack used during the austempering of the steel samples.
Figure 3-5: Rack and samples used in the austempering of the 4140, 1095 and 1065 steel tensile samples.
3.1.5.B: Quenching and Tempering
Samples of 1065, 1095 and 4140 were also quenched and tempered to produce
martensitic structures. Quenching and tempering of the 4140 was performed through
Jantom Precision, with specified hardness values of 35, 45 and 55 HRc. The quench and
temper heat treatments for the high carbon, 1065 and 1095, steels were completed at
Michigan Tech. The austenitizing of both the 1095 and 1065 was done at 815ºC for 2
hours in iron filings, and then quenched into the 43ºC water. All samples were quenched
- 39 -
into liquid nitrogen for 10-15 minutes, to ensure that any retained austenite present would
be transformed to martensite. An increase in hardness value of 1-2 HRc was observed
after the nitrogen quench, signifying the transformation of small amounts of retained
austenite to martensite. The tempering temperatures used for the 1065 were 260ºC and
510ºC, and 260ºC, 410ºC and 550ºC for the 1095. The low tempering temperature of
260ºC for the 1065 was too low and resulted in notch sensitivity. These 1065 samples
were re-tempered at 400ºC for 1 hour.
3.1.6: 4037 Dual Phase Heat Treatment
A dual phase heat treatment was completed on the 4037 to produce a
microstructure of ferrite in a martensite matrix at two different hardness levels. The
treatment started with austenitizing at 855ºC for 2 hrs, followed by oil quenching, to
produce a fully martensitic structure. The 4037 samples were then re-heated to 760ºC (in
the two phase alpha plus gamma region) and held for 2 hours, before the samples were
again quenched into water. All samples were packed into iron chips to prevent oxidation
at the elevated temperatures. Following the final quench the specimens had a hardness
close to 47 HRc. Tempering temperatures of 150ºC and 350ºC and holding times of 2
hours were used to temper the martensite.
3.2: Tension Testing
3.2.1: Rising Step Load (RSL) Procedure
The ASTM F 1624 – 95 testing method, (“Standard Test Method for
Measurement of Hydrogen Embitterment in Steel by the Incremental Loading
Technique,”) was utilized in the testing for hydrogen assisted cracking susceptibility. The
notched samples previously mentioned and shown in Figure 3-1 were used in the testing.
- 40 -
A Fracture Diagnostics, Inc., Rising Step Load tensile machine, capable of a 10,000 lbs
capacity was used for all of the SCC testing.
Initially a continuous load is applied to the sample, in ambient air, until the
specimen fails. This test was performed on two to three samples and the failure load of
the samples was averaged to obtain the critical load required to rupture the specimen, Pc
[28]. Once Pc is established, a rising step load test is executed on a sample in air, using
Pc as the maximum load and increasing in increments of 5% of Pc for one hour intervals
until the specimen fails.
Specimens are then tested in a salt water solution to measure their resistance to
SCC. The tensile samples are first coated with epoxy on all of the gauge length, with the
exception of the notch. This assists in localizing hydrogen adsorption at the notch.
Specimens are then mounted within Styrofoam cups, filled with a 3.5% NaCl-water
solution, and loaded into the RSL. A cathodic potential is supplied between a platinum
electrode and the sample and is monitored and fixed at -1.2 Volts vs. a Standard Calomel
Electrode (S.C.E). Three samples are tested using Pc as the initial fracture load for the Pi1
loading profile, which is shown in Table 3-2, and the fracture loads obtained from those
three samples are averaged and used as the fracture load for the Pi2 testing. This process
is repeated for the Pi2 and Pi3 testing protocols.
- 41 -
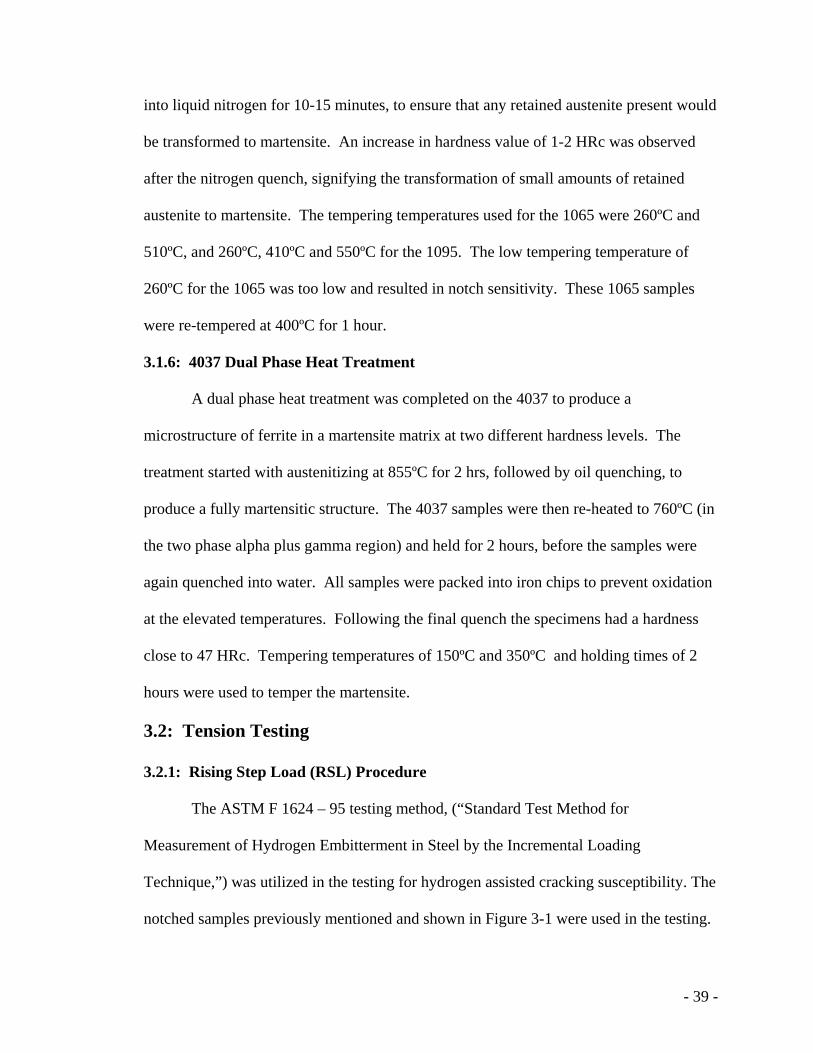
Step Time (hours) Load increment
(%P) # 1 # 2 # 3 5 1 1 1
10 1 1 1 15 1 1 1 20 1 1 1 25 1 1 1 30 1 1 1 35 1 1 1 40 1 1 1 45 1 1 1 50 1 1 1 55 1 2 4 60 1 2 4 65 1 2 4 70 1 2 4 75 1 2 4 80 1 2 4 85 1 2 4 90 1 2 4 95 1 2 4 100 1 2 4
Total Hours 20 30 50 Table 3-2: Loading profiles used in RSL testing of notched tensile specimens.
Differences in Pi2 and Pi3 failure loads were fairly minimal in the initial testing, therefore
the Pi3 protocol was not employed for some of the subsequent tests.
3.3: Characterization
3.3.1: Hardness, Metallography and Fractography
Following RSL testing, four specimens from each lot were cut transverse through
the sample, mounted in bakelite, and then polished with silicon carbide to 600 grit.
Vickers hardness measurements were taken through the cross section of each sample.
Vickers hardness values from the four samples were averaged and used as the hardness of
each lot tested. One of the mounted samples from each lot was polished to a 0.05 micron
- 42 -
alumina finish and etched with 2% Nital for optical and SEM examination of the
microstructure. A Hitachi S-4700 FE-SEM was used to obtain a fine detailed image of
the microstructure of some selected samples that could not be easily resolved with the
optical microscope.
The fracture surface, resulting at the notch of each tensile specimen, of selected
specimens was cut from the sample and examined using the JOEL-6400 scanning
electron Microscope. The entire fracture surface was analyzed and images were typically
captured at a magnification of 20x, to show the macroscopic features, and 1500x to show
microscopic features.
3.3.2: X-ray Diffraction
X-ray diffraction data was collected for the 4140, 1065 and 1095 steels using a
Sintag XDS-2000 machine. One specimen per lot of each of the three alloys previously
listed was cut and mounted in bakelite, polished to 0.05 micron then etched with 2%
Nital. Three times the samples were polished using the 0.05 micron alumina and etched,
a common procedure for assuring minimal strain effects on the metal surface. All scans
were collected using the scan parameters as follows; tube divergence slit of 1 mm and
scatter slit of 2 mm, detector receiving slit of 0.3 mm and scatter slit of 0.5 mm, step size
of 0.3º, and a scan time per step of 20 seconds. The 4140 scans were collected over the
scanning ranges of 61º to 68º and 78º to 87º. This range produces two peaks, the ferrite
200 and 211 peaks, which were used to calculate the particle size. The scan range for the
1065 and 1095 was 35º to 105º, a large scan that included carbide, ferrite and possible
austenite peaks.
- 43 -
Each peak observed in the scans was identified and curve fit with a Pearson 7
algorithm using the Sintag program, dmsnt. If there was a Kα2 peak visible (typically
highly tempered specimens), then both peaks were fit with the Pearson 7 algorithm. Once
each peak was fit with a curve, the area under the peak, FWHM, peak position, and
intensity were automatically calculated by the program. Once these properties were
known, the ferrite crystallite size for all samples was calculated and volume fraction of
austenite and carbon content in the austenite were calculated if austenite was present.
- 44 -
Chapter 4: Results and Discussion
4.1: Rising Step Load (RSL) Threshold Stress Results The alloys and hardness of all alloys tested under the RSL protocols specified in the previous section are shown below in Table 4-1, where QT signifies a quench and temper treatment, AT represents austempering treatments and DP notes the dual phase
heat treated samples. All fracture loads and calculated air and hydrogen threshold
fracture stresses are listed in the appendices. The quenched and tempered 1038, 1541,
4140 specimens at a given hardness are compared to the 4037 quenched and tempered
samples, obtained in previous work [4], to see variations in threshold stress levels with
differences in compositions. Quenched and tempered samples of the alloys 1038, 1065
and 1095 are utilized to see how an increase in carbon content of the steel affects the
behavior of the steel when hydrogen charged. The results from the 10B21 specimen can
be used to see changes in threshold stress with both alloying content and carbon content,
since the alloy is a plain carbon steel with a small amount of boron. Quenched and
tempered data are compared to austempered data collected with the 4140, 1065 and 1095
alloys. Finally, the 4037 dual phase treatment using a step anneal processing is compared
to 4037 dual phase steel treated with a continuous cooling process obtained in earlier
work [4].
- 45 -
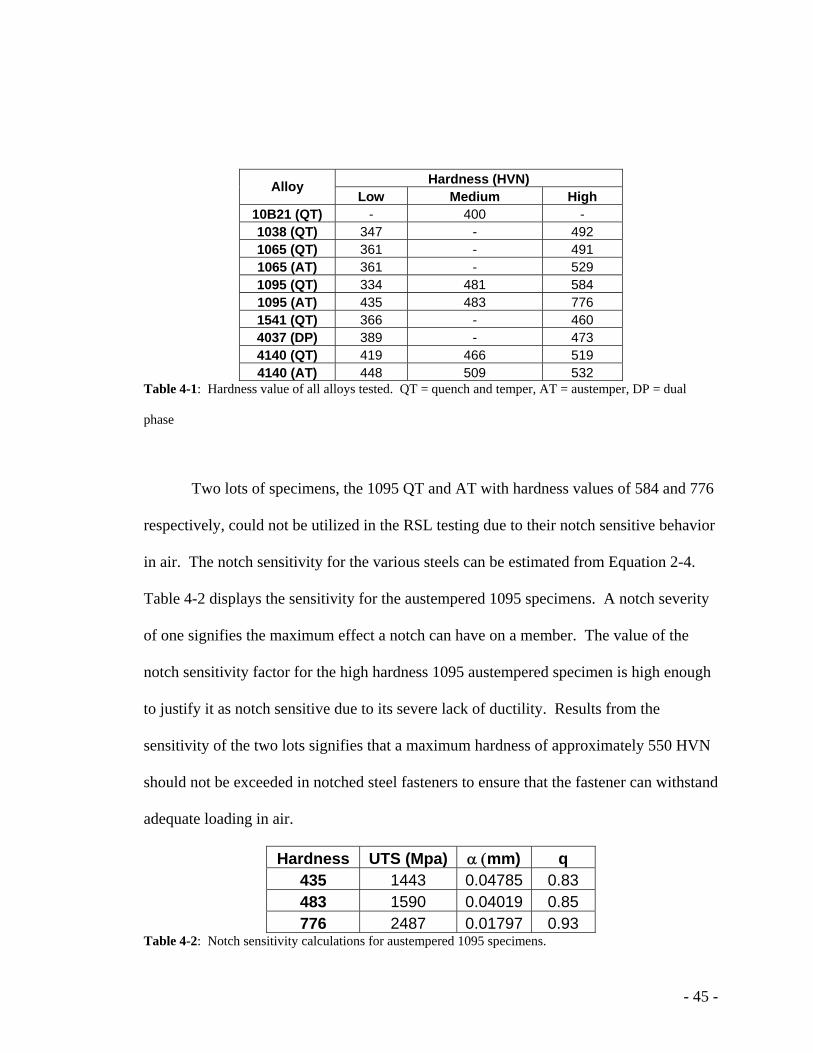
Hardness (HVN) Alloy Low Medium High
10B21 (QT) - 400 - 1038 (QT) 347 - 492 1065 (QT) 361 - 491 1065 (AT) 361 - 529 1095 (QT) 334 481 584 1095 (AT) 435 483 776 1541 (QT) 366 - 460 4037 (DP) 389 - 473 4140 (QT) 419 466 519 4140 (AT) 448 509 532
Table 4-1: Hardness value of all alloys tested. QT = quench and temper, AT = austemper, DP = dual
phase
Two lots of specimens, the 1095 QT and AT with hardness values of 584 and 776
respectively, could not be utilized in the RSL testing due to their notch sensitive behavior
in air. The notch sensitivity for the various steels can be estimated from Equation 2-4.
Table 4-2 displays the sensitivity for the austempered 1095 specimens. A notch severity
of one signifies the maximum effect a notch can have on a member. The value of the
notch sensitivity factor for the high hardness 1095 austempered specimen is high enough
to justify it as notch sensitive due to its severe lack of ductility. Results from the
sensitivity of the two lots signifies that a maximum hardness of approximately 550 HVN
should not be exceeded in notched steel fasteners to ensure that the fastener can withstand
adequate loading in air.
Hardness UTS (Mpa) α (mm) q 435 1443 0.04785 0.83 483 1590 0.04019 0.85 776 2487 0.01797 0.93
Table 4-2: Notch sensitivity calculations for austempered 1095 specimens.
- 46 -
The data for 4037 was extrapolated from previous work [4]. There was a slight
difference in the gauge diameter for the 4037 and the 4140 austempered specimens
utilized in RSL testing. The diameter for these samples was 0.25” while all other
diameters were 0.27”. This slight discrepancy resulted in a lower stress concentration at
the notch root for the smaller diameter samples. Equations 2-1 and 2-2 were used to
calculate the difference in stress concentrations for the different gauge diameters. The
values of the calculated stress concentration factor were 3.046 and 3.100 for the 0.25”
and 0.27” gauge diameters, respectively. This calculated difference is about 2%. The
stress concentration factor listed in the ASTM standard F519 is 3.1 [34], which
corresponds to a v-notch with a gauge diameter of 0.25”. An increase in stress
concentration should increase the fracture load in air but decrease the threshold stress in
the salt solution. To verify this, remaining specimens of 4140 quenched and tempered to
519 HVN, were machined from the 0.27” to 0.25” gauge. Two samples were tested in air
and three in salt water under the Pi1 protocol. The average fracture load of the air
specimens was 371 lbs higher for the 0.27” diameter and 316 lbs lower for the salt
specimens. Samples were tested with a lower hardness value that verified these results.
All quenched and tempered 4037 and austempered 4140 data were corrected to account
for the difference in the gauge diameter, utilizing the data collected for the 4140.
An overall relationship between the fracture strength in air and the nominal
threshold stress obtained during hydrogen charging as a function of hardness can be seen
in Figure 4-1. The general trend for the strength in air shows a linear trend of increasing
fracture strength with increasing hardness, as would be expected for steels with
increasing yield strengths. There appears to be significant scatter in the air for some
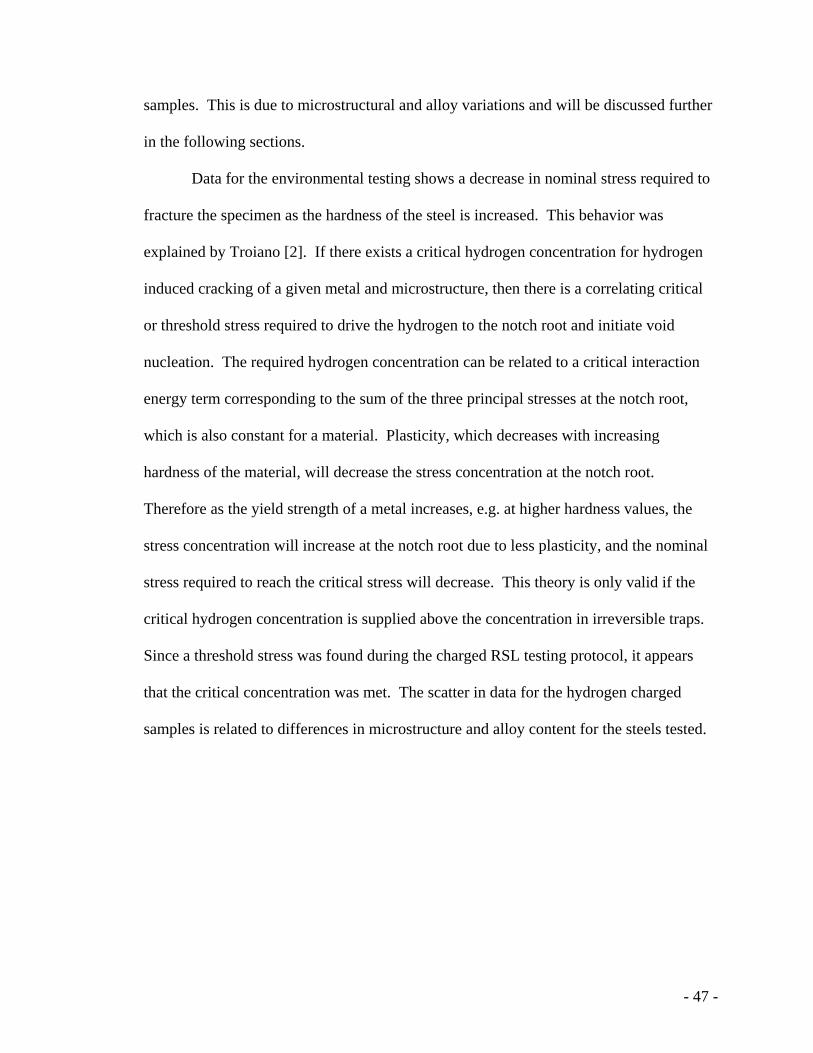
- 47 -
samples. This is due to microstructural and alloy variations and will be discussed further
in the following sections.
Data for the environmental testing shows a decrease in nominal stress required to
fracture the specimen as the hardness of the steel is increased. This behavior was
explained by Troiano [2]. If there exists a critical hydrogen concentration for hydrogen
induced cracking of a given metal and microstructure, then there is a correlating critical
or threshold stress required to drive the hydrogen to the notch root and initiate void
nucleation. The required hydrogen concentration can be related to a critical interaction
energy term corresponding to the sum of the three principal stresses at the notch root,
which is also constant for a material. Plasticity, which decreases with increasing
hardness of the material, will decrease the stress concentration at the notch root.
Therefore as the yield strength of a metal increases, e.g. at higher hardness values, the
stress concentration will increase at the notch root due to less plasticity, and the nominal
stress required to reach the critical stress will decrease. This theory is only valid if the
critical hydrogen concentration is supplied above the concentration in irreversible traps.
Since a threshold stress was found during the charged RSL testing protocol, it appears
that the critical concentration was met. The scatter in data for the hydrogen charged
samples is related to differences in microstructure and alloy content for the steels tested.
- 48 -
Notched Threshold Stress Vs Hardness
0
50
100
150
200
250
300
350
400
300 350 400 450 500 550
Hardness (HVN)
Nom
inal
Str
ess
(ksi
)
Air TestHydrogen Charged
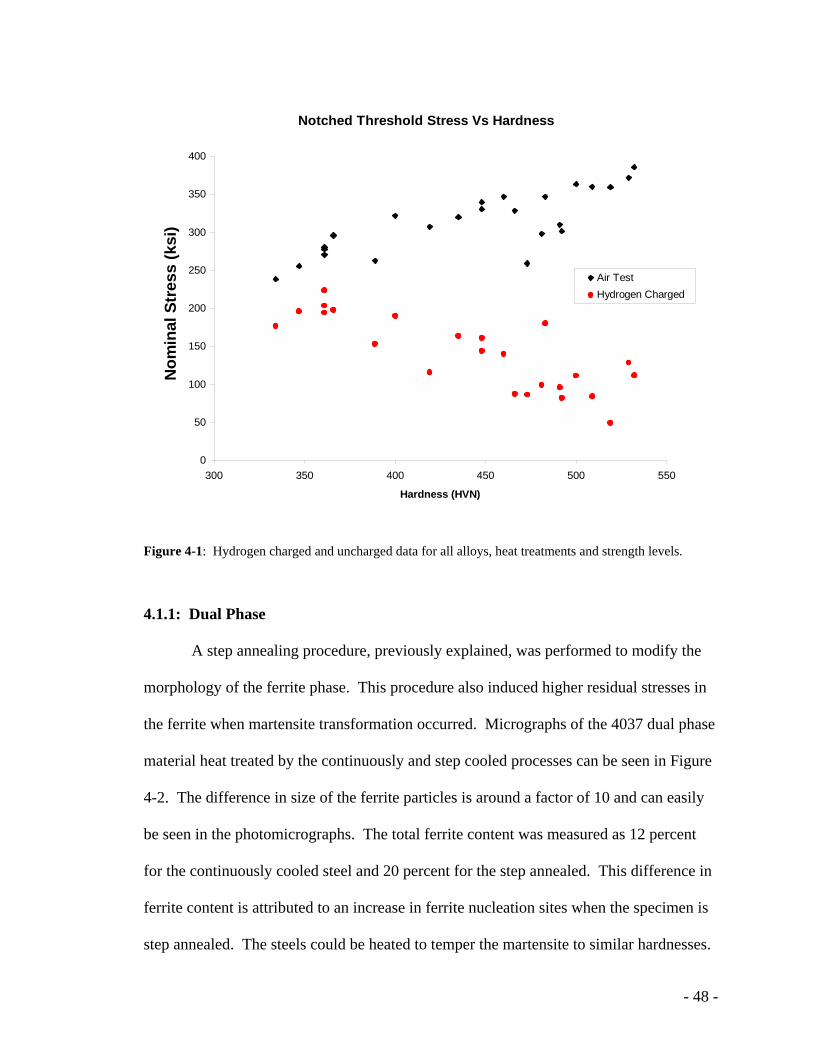
Figure 4-1: Hydrogen charged and uncharged data for all alloys, heat treatments and strength levels. 4.1.1: Dual Phase A step annealing procedure, previously explained, was performed to modify the
morphology of the ferrite phase. This procedure also induced higher residual stresses in
the ferrite when martensite transformation occurred. Micrographs of the 4037 dual phase
material heat treated by the continuously and step cooled processes can be seen in Figure
4-2. The difference in size of the ferrite particles is around a factor of 10 and can easily
be seen in the photomicrographs. The total ferrite content was measured as 12 percent
for the continuously cooled steel and 20 percent for the step annealed. This difference in
ferrite content is attributed to an increase in ferrite nucleation sites when the specimen is
step annealed. The steels could be heated to temper the martensite to similar hardnesses.
- 49 -
The hardness of the martensite phase in the two step annealed dual phase steels was
estimated using the rule of mixtures and a ferrite hardness of 150 HVN. The values were
determined to be about 450 and 550 HVN for the macrohardness values of 389 and 473,
respectively.
Figure 4-2: SEM images of a. continuously cooled 4037 dual phase steel, b. step annealed 4037 dual
phase steel. Dark phase is ferrite and light phase martensite.
Comparisons of the threshold stress values of the 4037 quenched and tempered,
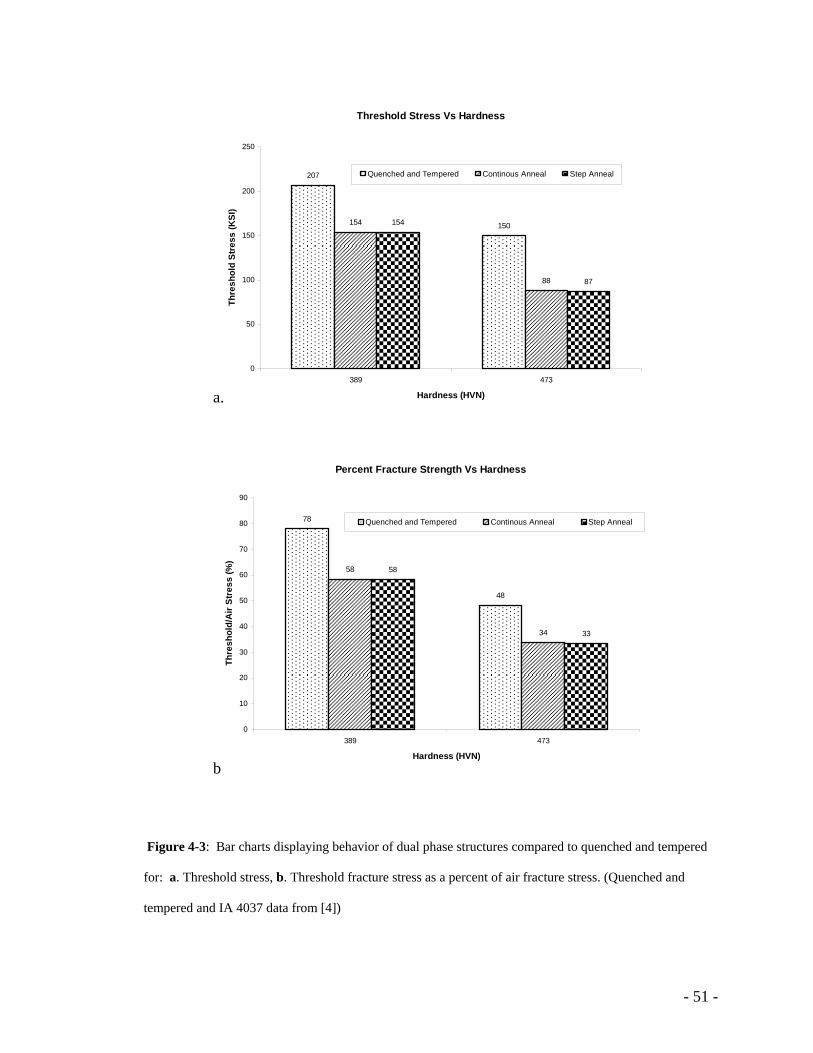
continuously annealed and step annealed specimens are shown in Figure 4-3. It is
apparent that there is virtually no change in hydrogen induced cracking susceptibility
between the two dual phase steels. Both dual phase steels are also significantly more
susceptible than a 4037 quenched and tempered steel structure.
Typically an increase in hardness resulted in an increased notched air fracture
strength as can be seen in Figure 4-1. This trend was not observed for either of the dual
phase treatments, which produced air fracture values of near 260 Ksi for all hardnesses.
a. b.
- 50 -
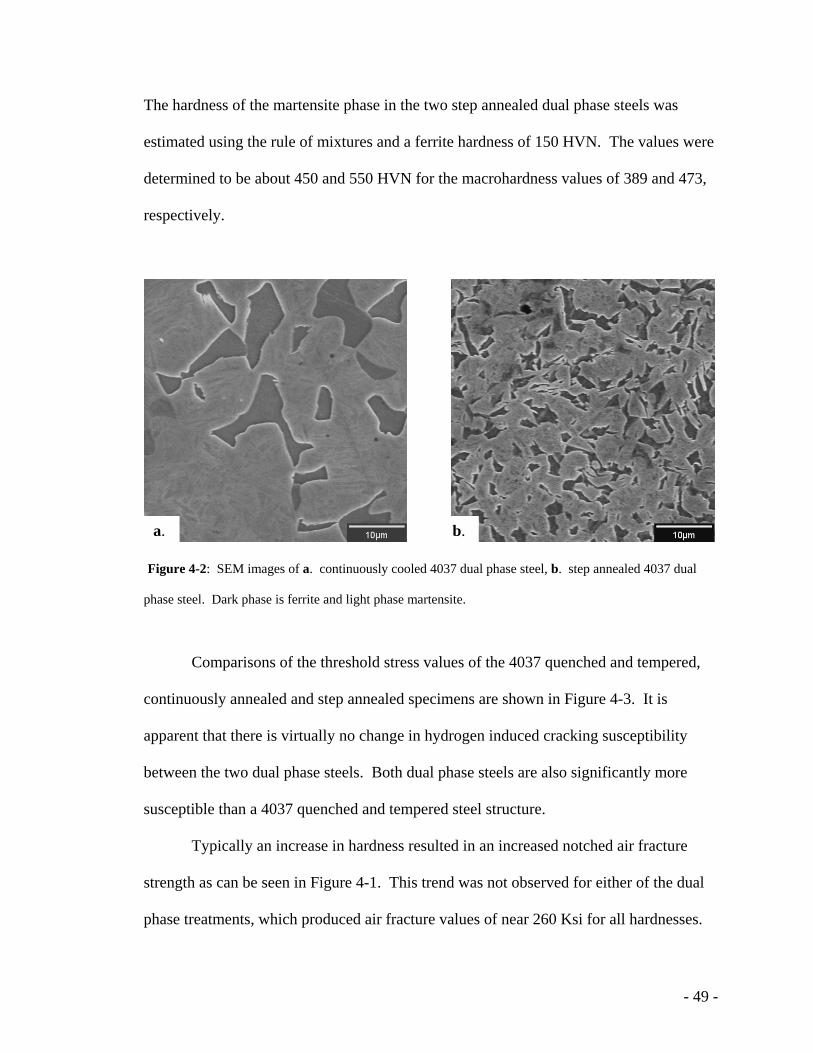
This signifies a notch sensitivity effect for these two dual phase steels, which is typically
correlated to a lack of ductility or plasticity. The limited ductility of this material is most
likely due to micro-void fracture along ferrite and martensite phase interfaces. This was
observed optically by Grochowski [4]. The lack of ductility in the material also limited
the critical threshold stress of the dual phase steels by intensifying the stress
concentration at the notch root. Images of the fracture surface verify that a mostly brittle
fracture mode occurred when testing the step annealed samples in air and in salt water at
both hardness values. The fracture surfaces can be viewed in Figure 4-4. Both the low
and high hardness samples showed a primarily cleavage fracture behavior in air with
some dimple fracture. Micro-cracking can be observed in the higher hardness air sample,
but not the lower. The fracture mode of the hydrogen charged low hardness material was
a cleavage mode similar to that tested in air. The higher hardness hydrogen charged
specimen produced a failure mode of both brittle cleavage and intergranular, and again
micro-cracking can be seen.
The RSL data and brittle fracture behavior implies that this particular grade and
heat treatment of steel is not suitable to fastener applications where thread roots and
radius create stress concentrations similar to the ones observed during these experiments.
It would be interesting to study the notch and SCC behavior of classical dual phase steel
consisting of a ferrite matrix with small martensite islands.
- 51 -
Threshold Stress Vs Hardness
207
150154
88
154
87
0
50
100
150
200
250
389 473
Hardness (HVN)
Thre
shol
d St
ress
(KSI
)
Quenched and Tempered Continous Anneal Step Anneal
Percent Fracture Strength Vs Hardness
78
48
58
34
58
33
0
10
20
30
40
50
60
70
80
90
389 473
Hardness (HVN)
Thre
shol
d/A
ir St
ress
(%)
Quenched and Tempered Continous Anneal Step Anneal
Figure 4-3: Bar charts displaying behavior of dual phase structures compared to quenched and tempered
for: a. Threshold stress, b. Threshold fracture stress as a percent of air fracture stress. (Quenched and
tempered and IA 4037 data from [4])
a.
b
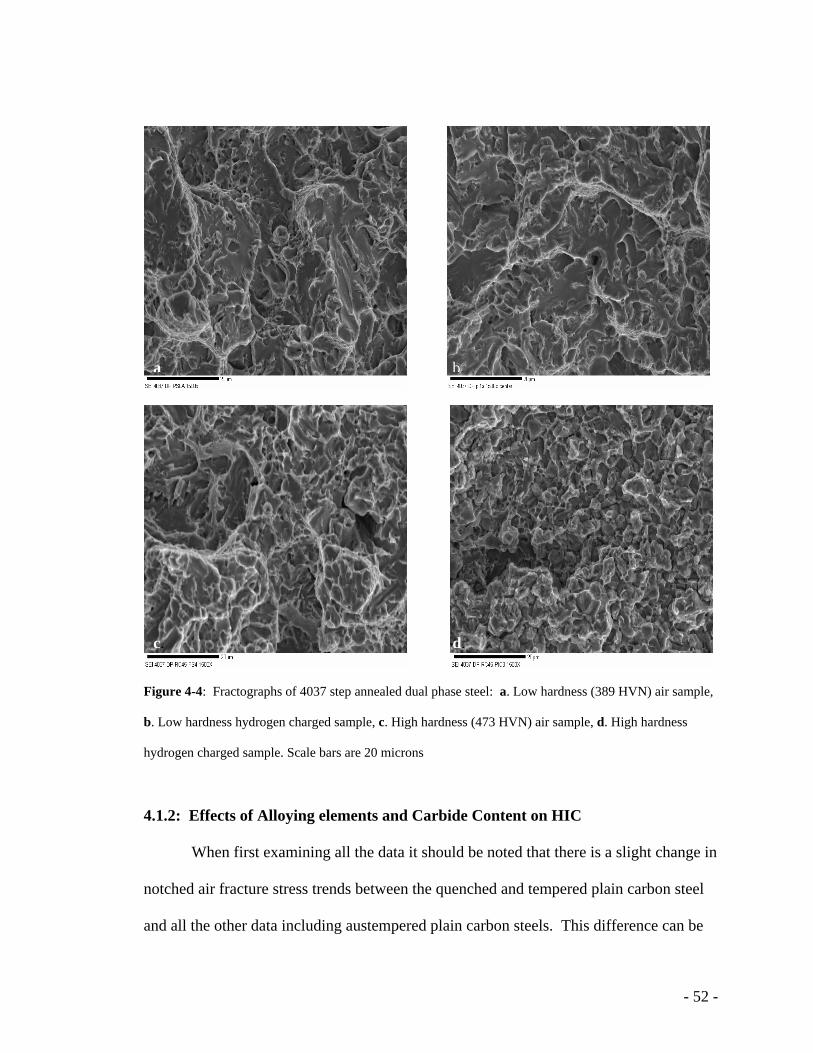
- 52 -
Figure 4-4: Fractographs of 4037 step annealed dual phase steel: a. Low hardness (389 HVN) air sample,
b. Low hardness hydrogen charged sample, c. High hardness (473 HVN) air sample, d. High hardness
hydrogen charged sample. Scale bars are 20 microns
4.1.2: Effects of Alloying elements and Carbide Content on HIC
When first examining all the data it should be noted that there is a slight change in
notched air fracture stress trends between the quenched and tempered plain carbon steel
and all the other data including austempered plain carbon steels. This difference can be
a. b.
c. d.
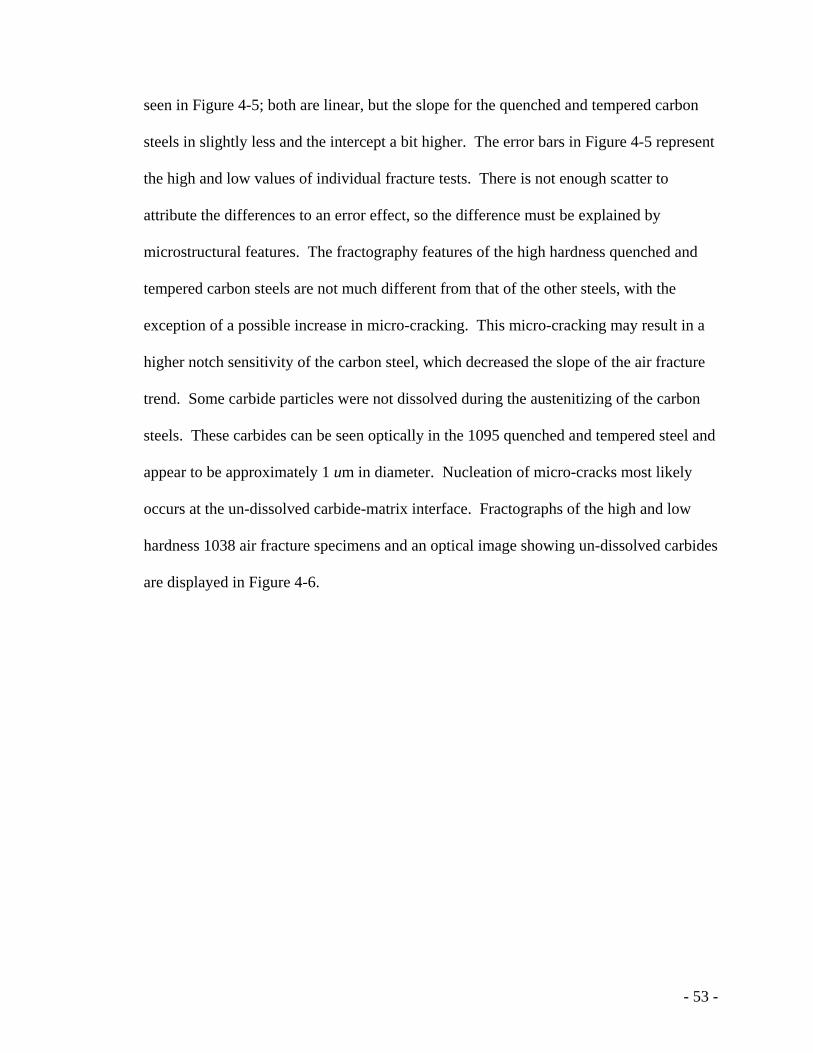
- 53 -
seen in Figure 4-5; both are linear, but the slope for the quenched and tempered carbon
steels in slightly less and the intercept a bit higher. The error bars in Figure 4-5 represent
the high and low values of individual fracture tests. There is not enough scatter to
attribute the differences to an error effect, so the difference must be explained by
microstructural features. The fractography features of the high hardness quenched and
tempered carbon steels are not much different from that of the other steels, with the
exception of a possible increase in micro-cracking. This micro-cracking may result in a
higher notch sensitivity of the carbon steel, which decreased the slope of the air fracture
trend. Some carbide particles were not dissolved during the austenitizing of the carbon
steels. These carbides can be seen optically in the 1095 quenched and tempered steel and
appear to be approximately 1 um in diameter. Nucleation of micro-cracks most likely
occurs at the un-dissolved carbide-matrix interface. Fractographs of the high and low
hardness 1038 air fracture specimens and an optical image showing un-dissolved carbides
are displayed in Figure 4-6.
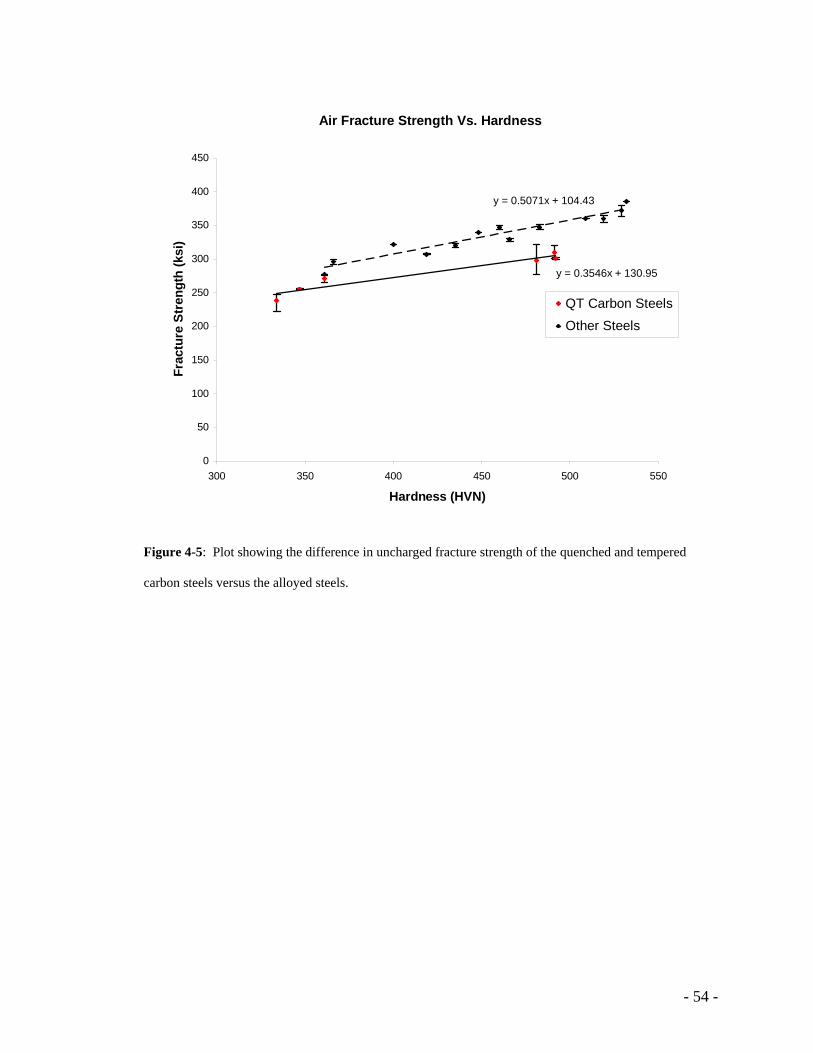
- 54 -
Air Fracture Strength Vs. Hardness
y = 0.5071x + 104.43
y = 0.3546x + 130.95
0
50
100
150
200
250
300
350
400
450
300 350 400 450 500 550
Hardness (HVN)
Frac
ture
Str
engt
h (k
si)
QT Carbon SteelsOther Steels
Figure 4-5: Plot showing the difference in uncharged fracture strength of the quenched and tempered carbon steels versus the alloyed steels.
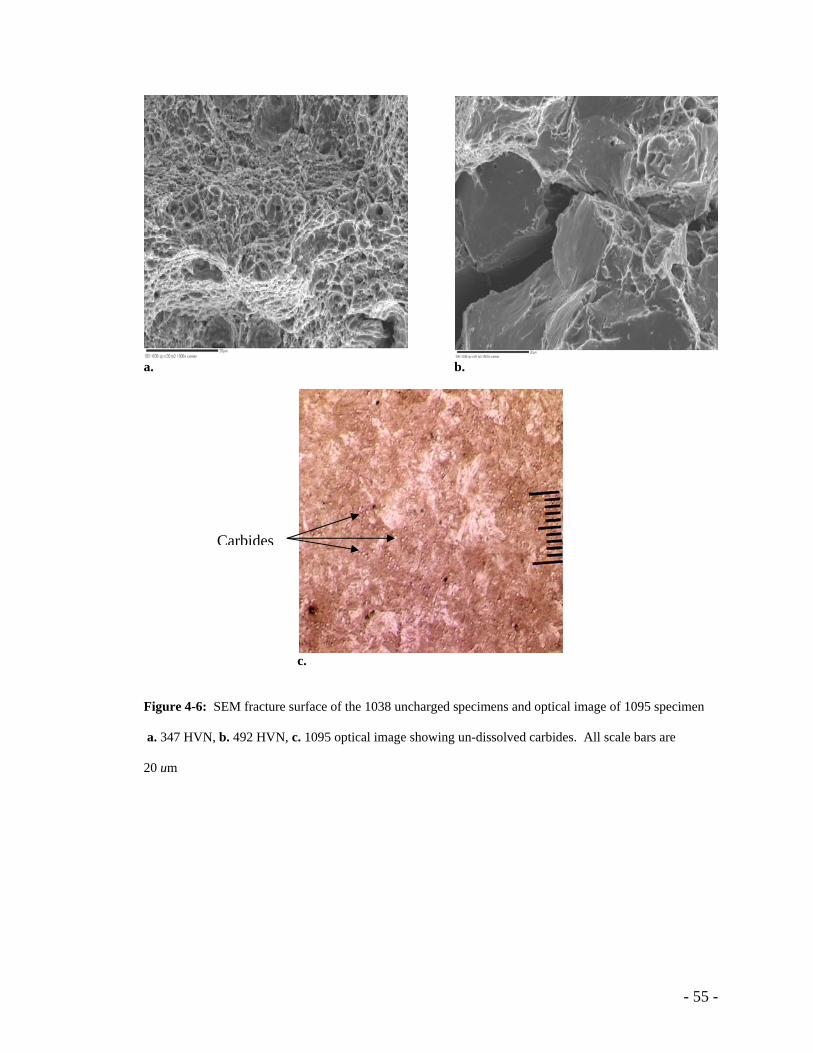
- 55 -
a. b.
c. Figure 4-6: SEM fracture surface of the 1038 uncharged specimens and optical image of 1095 specimen a. 347 HVN, b. 492 HVN, c. 1095 optical image showing un-dissolved carbides. All scale bars are 20 um
Carbides
- 56 -
The effect that carbon content has on threshold stress levels can be seen in Figure
4-7, which shows the threshold stress as a percent of the air fracture stress. The trend of a
decreasing threshold as hardness increases was explained previously in terms of the
plasticity of the steel at higher hardness values. There appears to be no effect of carbon,
i.e. carbide content, on the steels at a given hardness level. This is due to the continuous
saturation of the sample with hydrogen during RSL testing. Since carbides act as
irreversible traps, once they are filled with hydrogen, they have no effect on limiting the
amount of hydrogen that can diffuse to the maximum triaxial stress and only reversible
traps can act to limit the threshold stress. If there is a limited hydrogen supply, it is likely
that the steels with elevated carbon contents will have an amplified critical hydrogen
concentration required for hydrogen induced cracking.
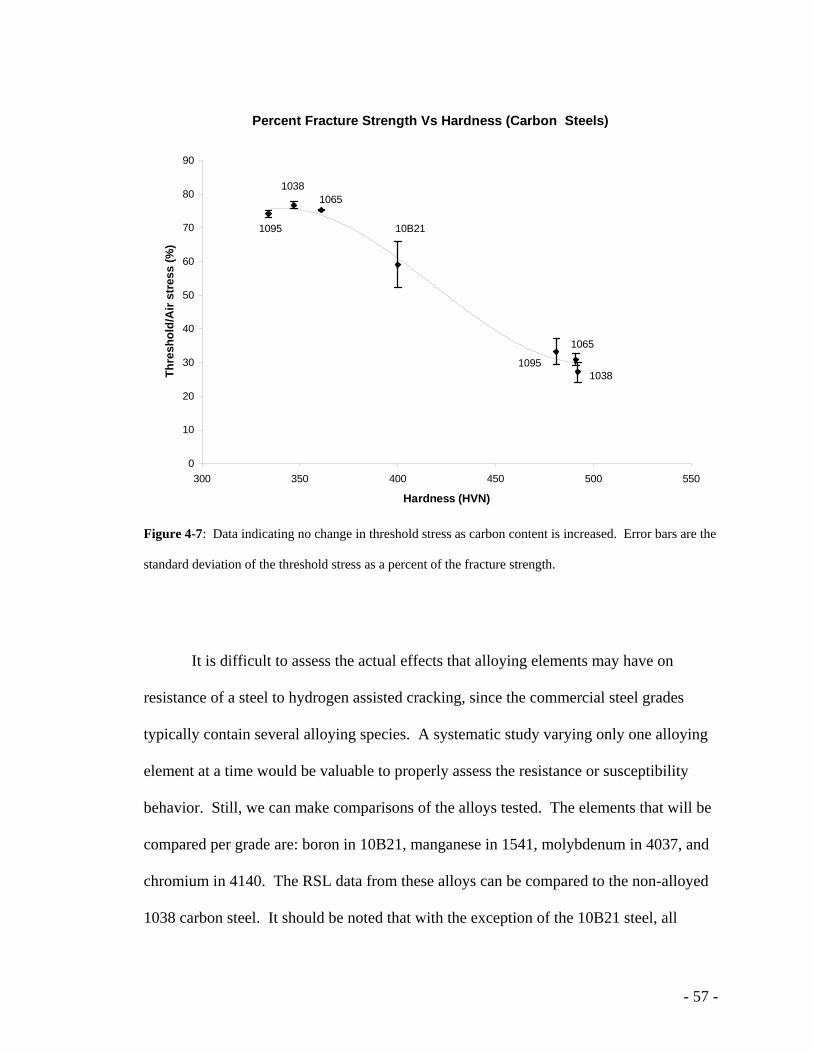
- 57 -
Percent Fracture Strength Vs Hardness (Carbon Steels)
0
10
20
30
40
50
60
70
80
90
300 350 400 450 500 550
Hardness (HVN)
Thre
shol
d/A
ir st
ress
(%)
1038
1095
1065
1065
1095
1038
10B21
Figure 4-7: Data indicating no change in threshold stress as carbon content is increased. Error bars are the
standard deviation of the threshold stress as a percent of the fracture strength.
It is difficult to assess the actual effects that alloying elements may have on
resistance of a steel to hydrogen assisted cracking, since the commercial steel grades
typically contain several alloying species. A systematic study varying only one alloying
element at a time would be valuable to properly assess the resistance or susceptibility
behavior. Still, we can make comparisons of the alloys tested. The elements that will be
compared per grade are: boron in 10B21, manganese in 1541, molybdenum in 4037, and
chromium in 4140. The RSL data from these alloys can be compared to the non-alloyed
1038 carbon steel. It should be noted that with the exception of the 10B21 steel, all
- 58 -
grades have similar carbon contents. This was done purposely to separately study the
effects of hardening alloy elements and carbon. The actual chemistry of each steel grade
can be viewed in Table 3-1.
Rising step load data for the steels mentioned are shown in Figure 4-8 as a plot of
the ratio of threshold stress to air fracture stress at the various hardness values. It is
apparent that generally all the grades maintain a similar trend, with the exception of the
4140. This fact would lead one to the deduction that chromium is deleterious in
hydrogen assisted cracking susceptibility. It is thought, however, that this increased
susceptibility of the 4140 may be a result of temper embrittlement. Temper
embrittlement is a result of impurity atom segregation at the grain boundaries that
decreases the surface interfacial energy of the boundaries. Alloying elements like
chromium, manganese and nickel are known to be a requirement to activate
embrittlement by elements such as phosphorous, tin or arsenic [35]. Temper
embrittlement occurs when steels are tempered at specified temperatures then slowly
cooled. It is possible that some impurity segregation occurred in the 4140 during
tempering and the fracture mode was intensified by the atomic hydrogen presented during
RSL testing. This would explain the MVC fracture mode for the quenched and tempered
4140 in the air tests, but an intergranular path during hydrogen charging. Only the 4140
and 1038 hydrogen charged specimens produced an intergranular fracture path along
prior austenite grains. Fractographs of the 4140 quenched and tempered steel are
displayed as Figure 4-9. The fracture of the hydrogen charged samples were initially
intergranular at the outer surface and micro-void fracture at the inner surface.
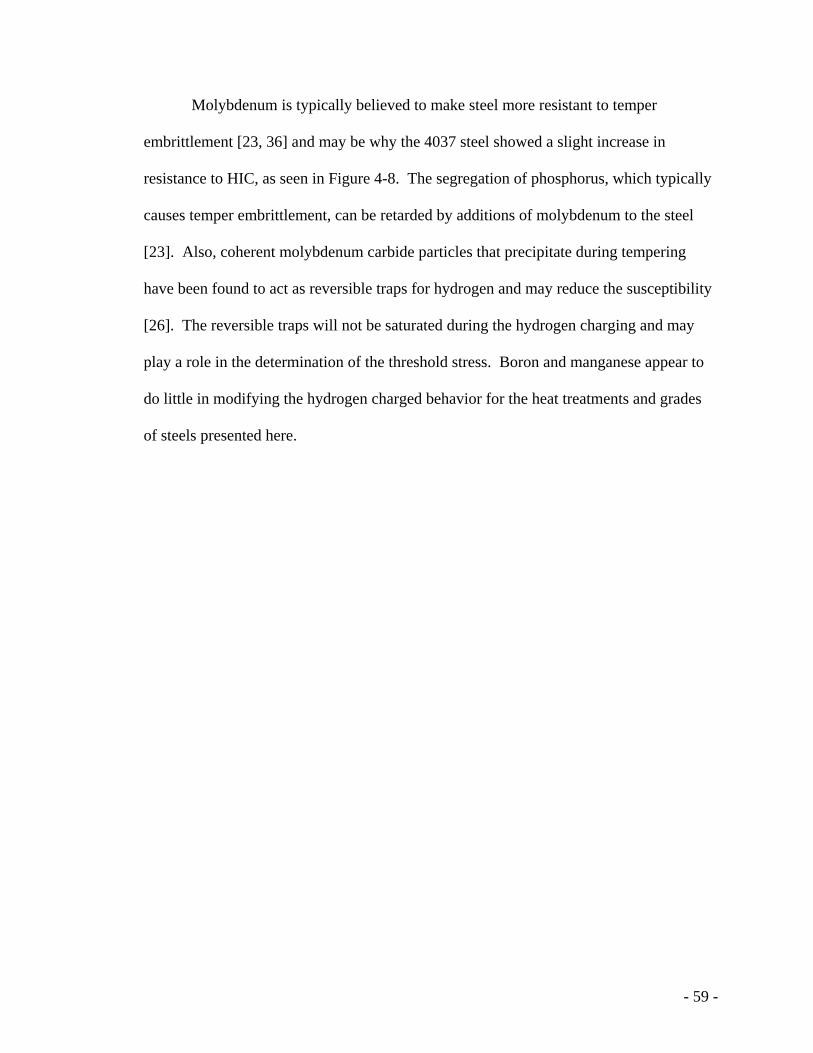
- 59 -
Molybdenum is typically believed to make steel more resistant to temper
embrittlement [23, 36] and may be why the 4037 steel showed a slight increase in
resistance to HIC, as seen in Figure 4-8. The segregation of phosphorus, which typically
causes temper embrittlement, can be retarded by additions of molybdenum to the steel
[23]. Also, coherent molybdenum carbide particles that precipitate during tempering
have been found to act as reversible traps for hydrogen and may reduce the susceptibility
[26]. The reversible traps will not be saturated during the hydrogen charging and may
play a role in the determination of the threshold stress. Boron and manganese appear to
do little in modifying the hydrogen charged behavior for the heat treatments and grades
of steels presented here.
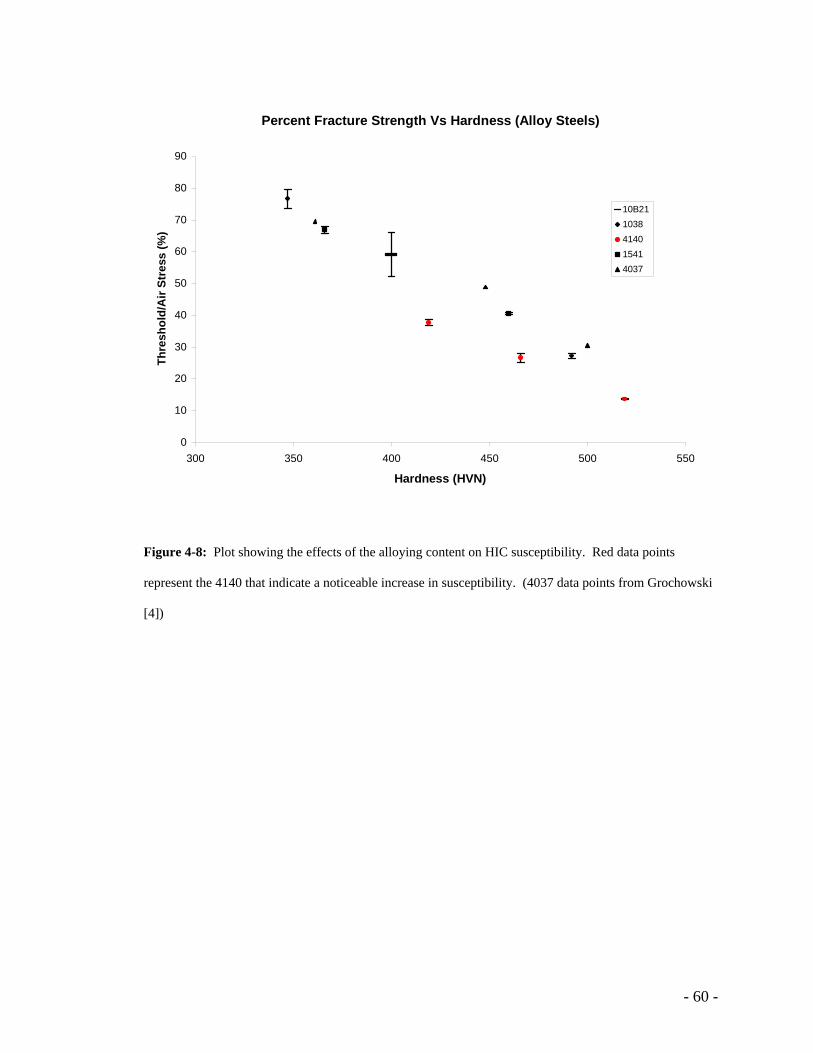
- 60 -
Percent Fracture Strength Vs Hardness (Alloy Steels)
0
10
20
30
40
50
60
70
80
90
300 350 400 450 500 550
Hardness (HVN)
Thre
shol
d/A
ir St
ress
(%)
10B211038414015414037
Figure 4-8: Plot showing the effects of the alloying content on HIC susceptibility. Red data points
represent the 4140 that indicate a noticeable increase in susceptibility. (4037 data points from Grochowski
[4])
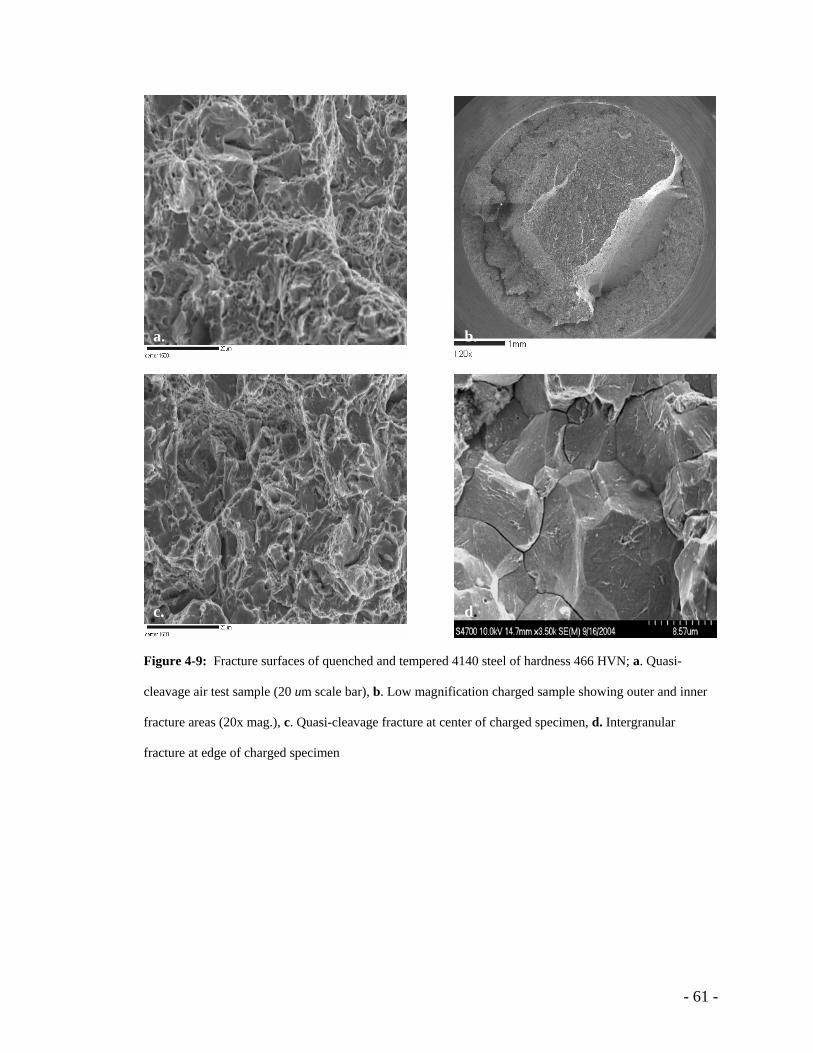
- 61 -
Figure 4-9: Fracture surfaces of quenched and tempered 4140 steel of hardness 466 HVN; a. Quasi-
cleavage air test sample (20 um scale bar), b. Low magnification charged sample showing outer and inner
fracture areas (20x mag.), c. Quasi-cleavage fracture at center of charged specimen, d. Intergranular
fracture at edge of charged specimen
a.
c.
b.
d.
- 62 -
4.1.3: Austempered Vs. Quenched and Tempered
Three alloys were used for the comparison of a tempered martensitic structure to
that of a bainitic structure with respect to their resistances to hydrogen induced cracking.
The alloys were 4140, 1065 and 1095. Optical micrographs of martensitic and bainitic
microstructures are shown in Figure 4-10. The hydrogen assisted cracking susceptibility
of these grades is depicted in Figures 4-11 and 4-12. Both figures demonstrate an
increased resistance to hydrogen attack for the bainitic steel structures of approximately
10-15%. Although this difference is not great, it may be high enough to allow an
increase in hardness of fasteners of 3-4 Rockwell C points. The difference is most
prominent on the low hardness 1065 batch of samples, which showed only a 19% drop in
strength when charged with hydrogen. Also, the 1065 higher hardness austempered
sample shows a slight increase in resistance to HIC, even though the hardness is about 40
HVN points higher than the martensitic specimen. The 4140 bainitic specimens
displayed a continuous increase over the martensitic structure at all hardness levels. The
fracture mechanisms, identified by the fractographs, were similar for quenched and
tempered and austempered steels. The softer materials showed a quasi-cleavage fracture
in air and a more ductile MVC in salt water, while the harder steels resulted in cleavage
fracture in salt water and air. Representative SEM fracture images for all alloys can be
viewed in the appendices.
Several reasons for the decreased susceptibility of the austempered structure could
exist, but it is believed that the superior toughness of bainitic structures may contribute
most to the decrease. The improved toughness of bainite may be attributed to the
existence of small amounts of retained austenite that may also inhibit hydrogen diffusion
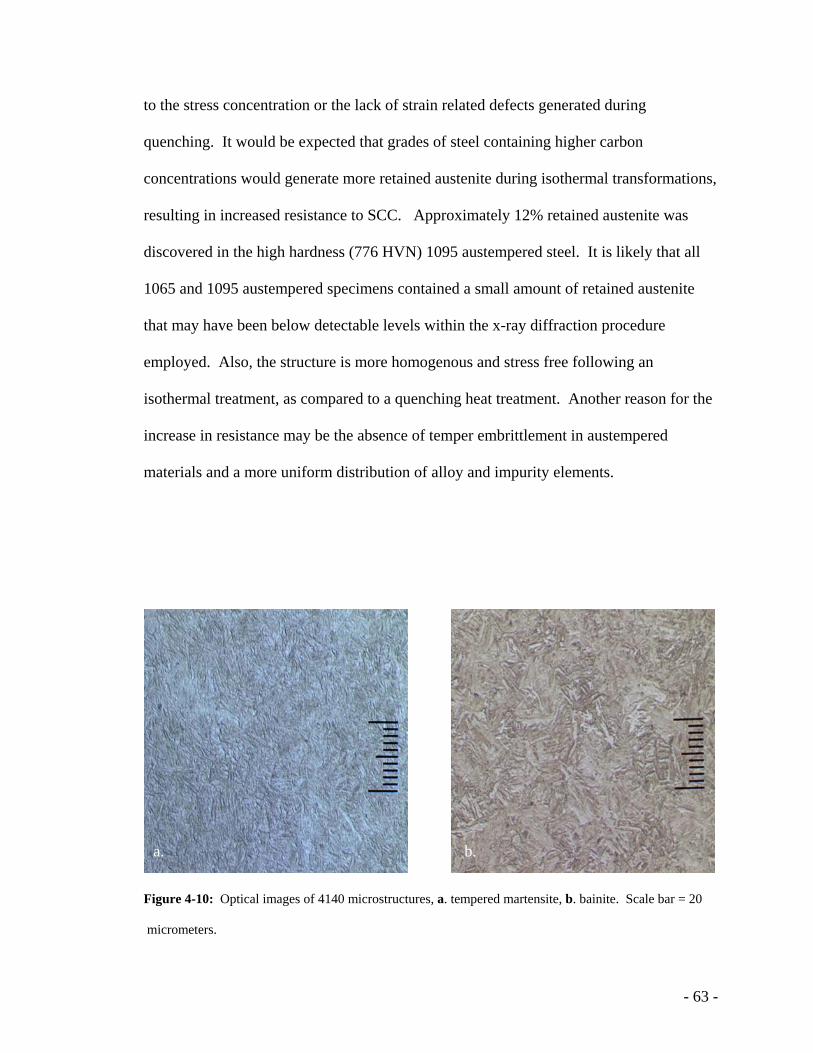
- 63 -
to the stress concentration or the lack of strain related defects generated during
quenching. It would be expected that grades of steel containing higher carbon
concentrations would generate more retained austenite during isothermal transformations,
resulting in increased resistance to SCC. Approximately 12% retained austenite was
discovered in the high hardness (776 HVN) 1095 austempered steel. It is likely that all
1065 and 1095 austempered specimens contained a small amount of retained austenite
that may have been below detectable levels within the x-ray diffraction procedure
employed. Also, the structure is more homogenous and stress free following an
isothermal treatment, as compared to a quenching heat treatment. Another reason for the
increase in resistance may be the absence of temper embrittlement in austempered
materials and a more uniform distribution of alloy and impurity elements.
Figure 4-10: Optical images of 4140 microstructures, a. tempered martensite, b. bainite. Scale bar = 20 micrometers.
a. b.
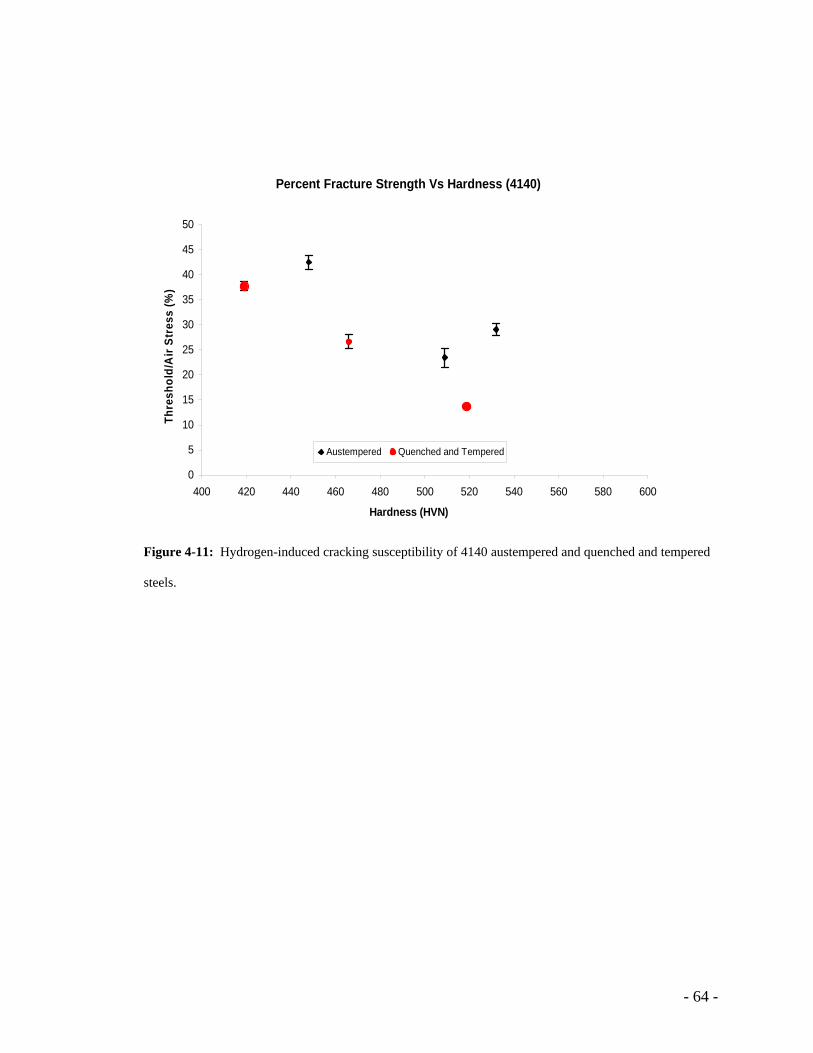
- 64 -
Percent Fracture Strength Vs Hardness (4140)
0
5
10
15
20
25
30
35
40
45
50
400 420 440 460 480 500 520 540 560 580 600
Hardness (HVN)
Thre
shol
d/A
ir St
ress
(%)
Austempered Quenched and Tempered
Figure 4-11: Hydrogen-induced cracking susceptibility of 4140 austempered and quenched and tempered
steels.
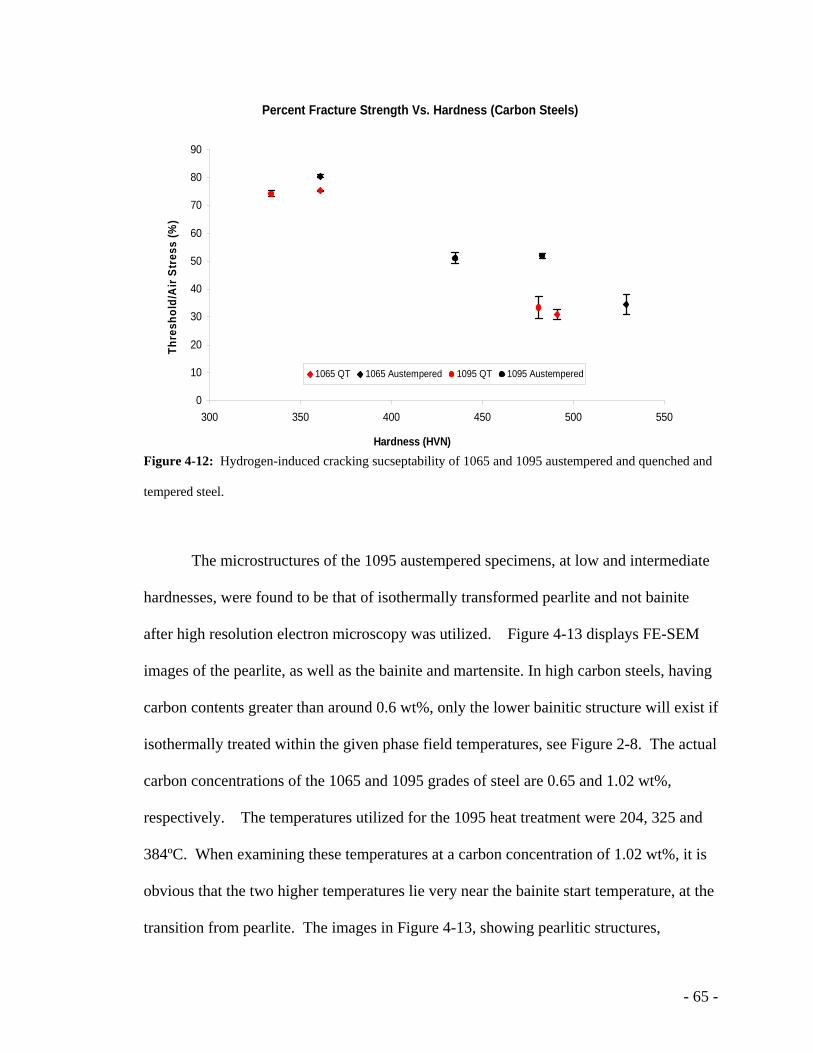
- 65 -
Percent Fracture Strength Vs. Hardness (Carbon Steels)
0
10
20
30
40
50
60
70
80
90
300 350 400 450 500 550
Hardness (HVN)
Thre
shol
d/A
ir St
ress
(%)
1065 QT 1065 Austempered 1095 QT 1095 Austempered
Figure 4-12: Hydrogen-induced cracking sucseptability of 1065 and 1095 austempered and quenched and
tempered steel.
The microstructures of the 1095 austempered specimens, at low and intermediate
hardnesses, were found to be that of isothermally transformed pearlite and not bainite
after high resolution electron microscopy was utilized. Figure 4-13 displays FE-SEM
images of the pearlite, as well as the bainite and martensite. In high carbon steels, having
carbon contents greater than around 0.6 wt%, only the lower bainitic structure will exist if
isothermally treated within the given phase field temperatures, see Figure 2-8. The actual
carbon concentrations of the 1065 and 1095 grades of steel are 0.65 and 1.02 wt%,
respectively. The temperatures utilized for the 1095 heat treatment were 204, 325 and
384ºC. When examining these temperatures at a carbon concentration of 1.02 wt%, it is
obvious that the two higher temperatures lie very near the bainite start temperature, at the
transition from pearlite. The images in Figure 4-13, showing pearlitic structures,
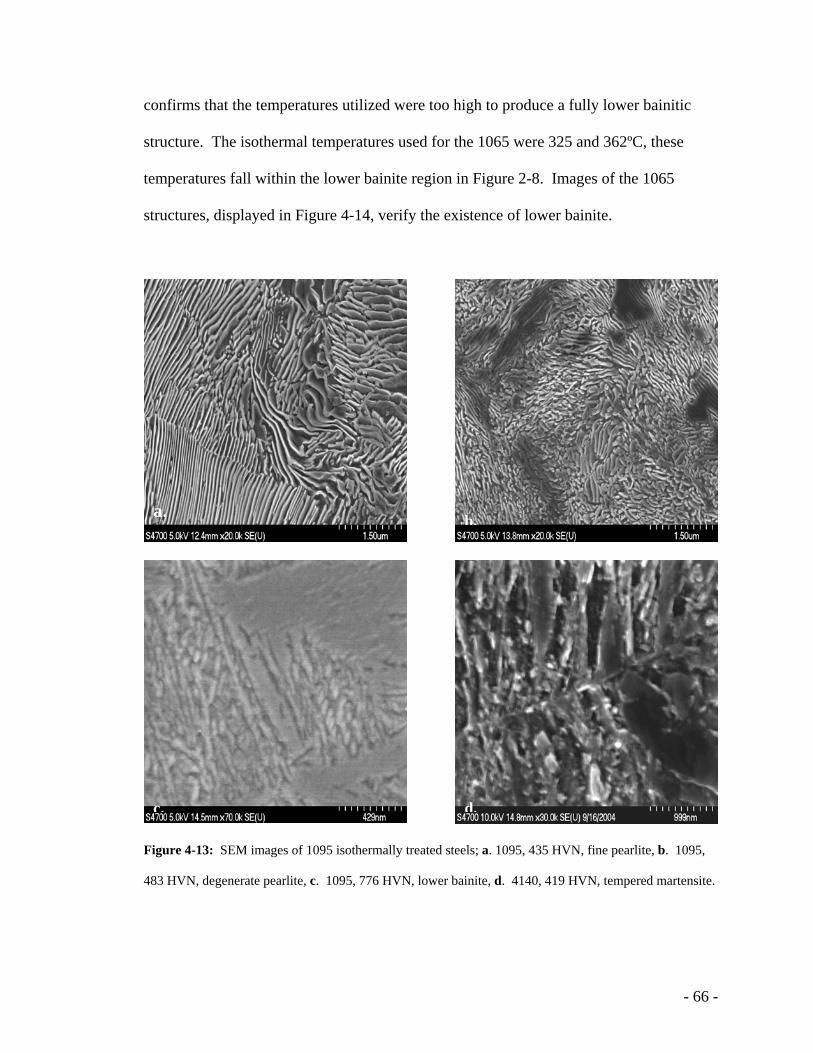
- 66 -
confirms that the temperatures utilized were too high to produce a fully lower bainitic
structure. The isothermal temperatures used for the 1065 were 325 and 362ºC, these
temperatures fall within the lower bainite region in Figure 2-8. Images of the 1065
structures, displayed in Figure 4-14, verify the existence of lower bainite.
Figure 4-13: SEM images of 1095 isothermally treated steels; a. 1095, 435 HVN, fine pearlite, b. 1095,
483 HVN, degenerate pearlite, c. 1095, 776 HVN, lower bainite, d. 4140, 419 HVN, tempered martensite.
a.
c. d.
b.
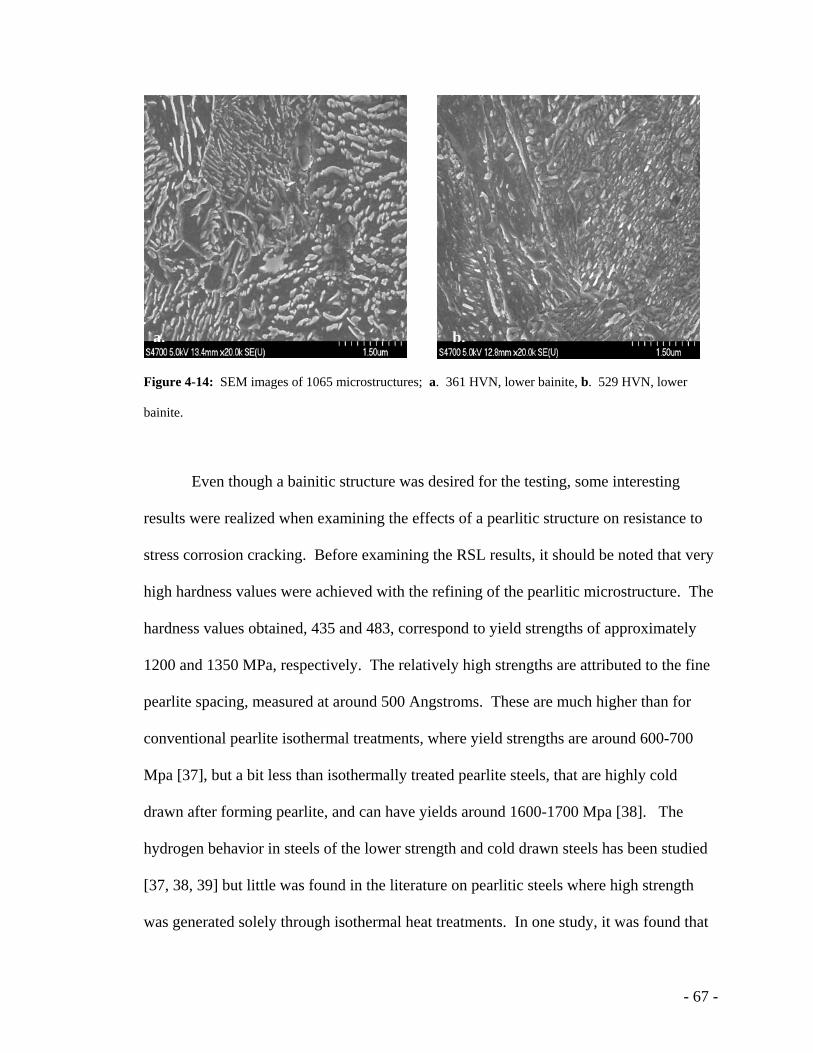
- 67 -
Figure 4-14: SEM images of 1065 microstructures; a. 361 HVN, lower bainite, b. 529 HVN, lower
bainite.
Even though a bainitic structure was desired for the testing, some interesting
results were realized when examining the effects of a pearlitic structure on resistance to
stress corrosion cracking. Before examining the RSL results, it should be noted that very
high hardness values were achieved with the refining of the pearlitic microstructure. The
hardness values obtained, 435 and 483, correspond to yield strengths of approximately
1200 and 1350 MPa, respectively. The relatively high strengths are attributed to the fine
pearlite spacing, measured at around 500 Angstroms. These are much higher than for
conventional pearlite isothermal treatments, where yield strengths are around 600-700
Mpa [37], but a bit less than isothermally treated pearlite steels, that are highly cold
drawn after forming pearlite, and can have yields around 1600-1700 Mpa [38]. The
hydrogen behavior in steels of the lower strength and cold drawn steels has been studied
[37, 38, 39] but little was found in the literature on pearlitic steels where high strength
was generated solely through isothermal heat treatments. In one study, it was found that
b.a.
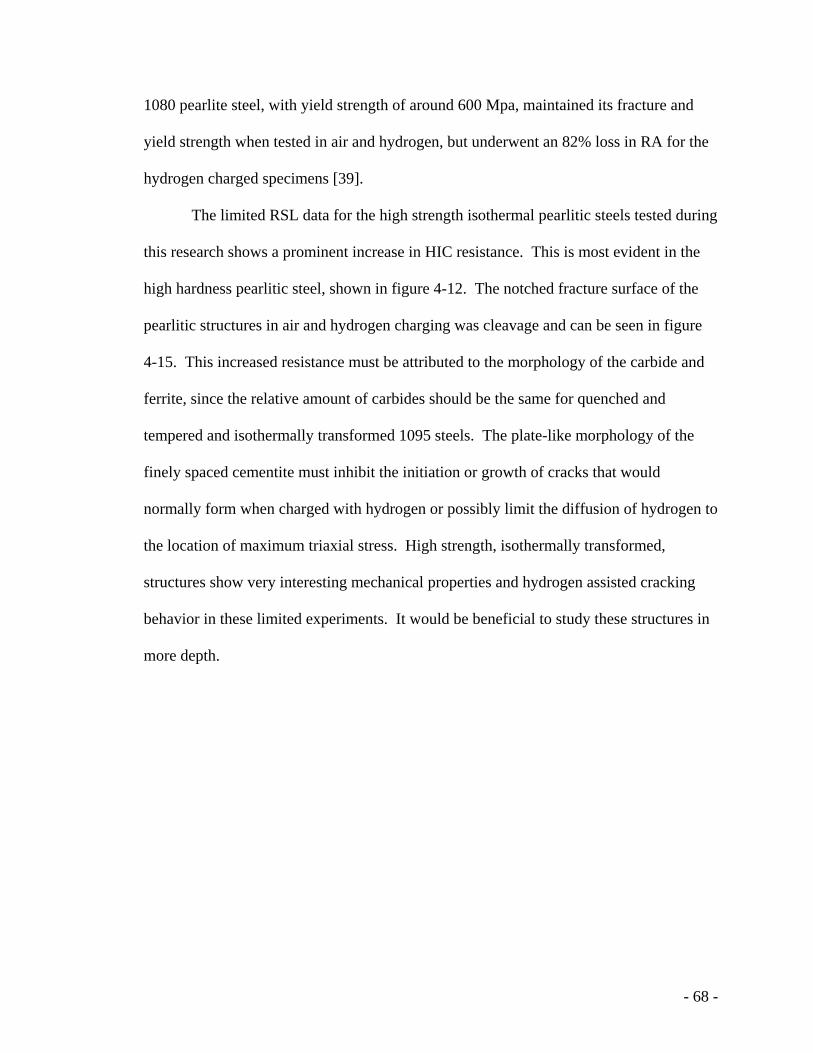
- 68 -
1080 pearlite steel, with yield strength of around 600 Mpa, maintained its fracture and
yield strength when tested in air and hydrogen, but underwent an 82% loss in RA for the
hydrogen charged specimens [39].
The limited RSL data for the high strength isothermal pearlitic steels tested during
this research shows a prominent increase in HIC resistance. This is most evident in the
high hardness pearlitic steel, shown in figure 4-12. The notched fracture surface of the
pearlitic structures in air and hydrogen charging was cleavage and can be seen in figure
4-15. This increased resistance must be attributed to the morphology of the carbide and
ferrite, since the relative amount of carbides should be the same for quenched and
tempered and isothermally transformed 1095 steels. The plate-like morphology of the
finely spaced cementite must inhibit the initiation or growth of cracks that would
normally form when charged with hydrogen or possibly limit the diffusion of hydrogen to
the location of maximum triaxial stress. High strength, isothermally transformed,
structures show very interesting mechanical properties and hydrogen assisted cracking
behavior in these limited experiments. It would be beneficial to study these structures in
more depth.
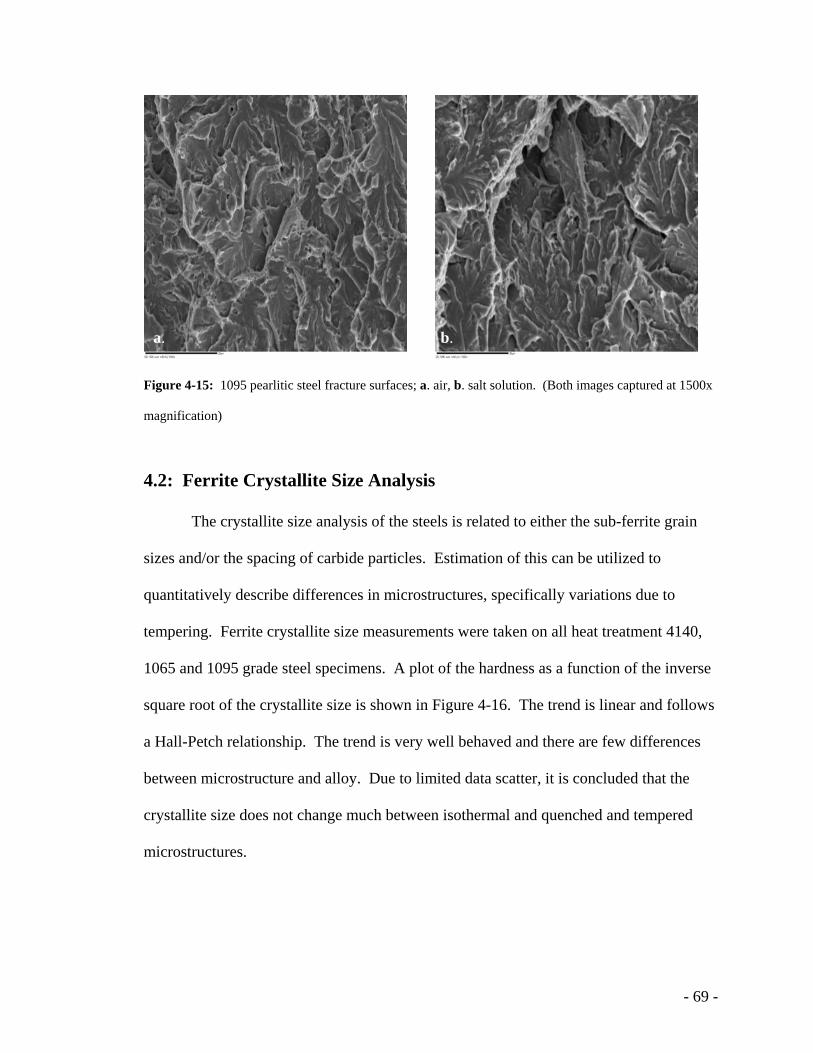
- 69 -
Figure 4-15: 1095 pearlitic steel fracture surfaces; a. air, b. salt solution. (Both images captured at 1500x
magnification)
4.2: Ferrite Crystallite Size Analysis
The crystallite size analysis of the steels is related to either the sub-ferrite grain
sizes and/or the spacing of carbide particles. Estimation of this can be utilized to
quantitatively describe differences in microstructures, specifically variations due to
tempering. Ferrite crystallite size measurements were taken on all heat treatment 4140,
1065 and 1095 grade steel specimens. A plot of the hardness as a function of the inverse
square root of the crystallite size is shown in Figure 4-16. The trend is linear and follows
a Hall-Petch relationship. The trend is very well behaved and there are few differences
between microstructure and alloy. Due to limited data scatter, it is concluded that the
crystallite size does not change much between isothermal and quenched and tempered
microstructures.
a. b.
- 70 -
Hardness as a Function of Ferrite Crystallite Size
0
100
200
300
400
500
600
700
800
900
0.03 0.04 0.05 0.06 0.07 0.08 0.09 0.1 0.11
Crystallite Size (Angstom-1/2)
Har
dnes
s (H
VN)
4140 QT
4140 Aust.
1095 QT
1095 Aust.
1065 QT
1065 Aust.
Figure 4-16: Differences in hardness as a function of particle size measurements.
The variation of threshold stress as a percent air fracture strength with the inverse
square root of the ferrite crystallite size also produces a linear trend, but the slope is
negative. This plot can be viewed in Figure 4-17. As the crystallite size is reduced, the
strength of the specimen increases, and the resistance to hydrogen induced cracking
decreases. The difference in trends between the isothermal and quenched heat treatments
becomes obvious from Figure 4-17. At a given crystallite size, the percentage of
threshold stress to air fracture stress is higher for the austempered steels by as much as
20%. This data supplements previous data in verifying an improved resistance of
isothermally treated steels.
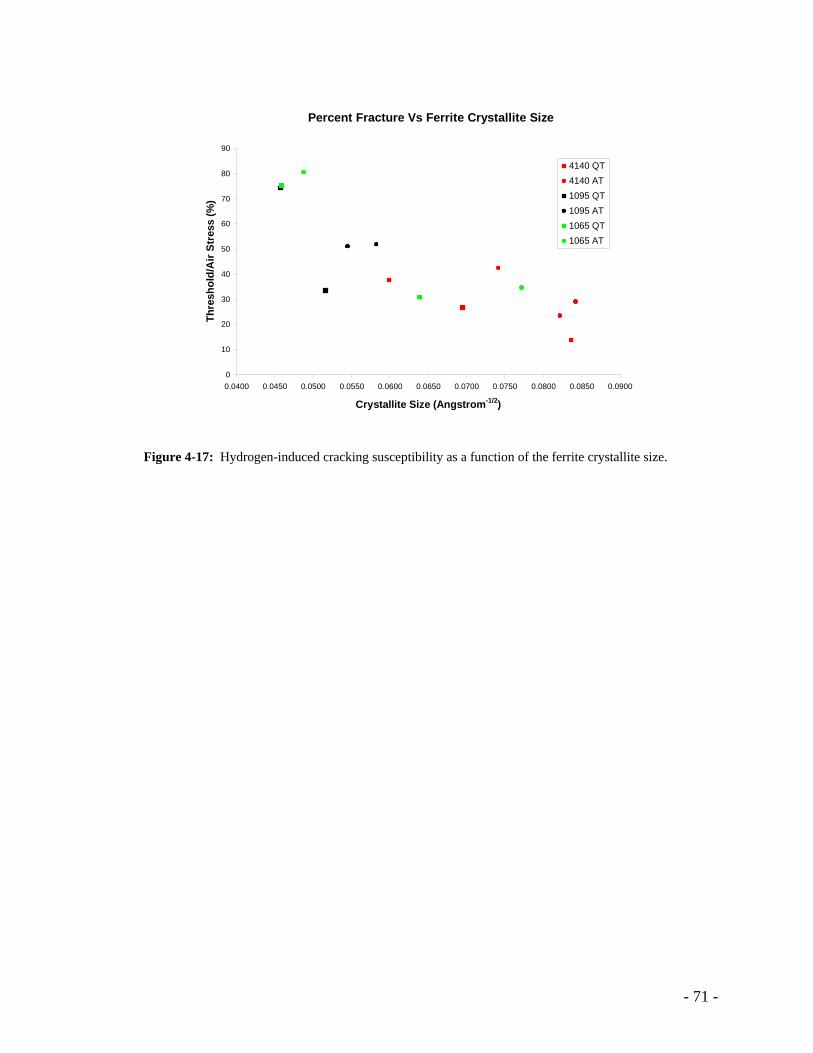
- 71 -
Percent Fracture Vs Ferrite Crystallite Size
0
10
20
30
40
50
60
70
80
90
0.0400 0.0450 0.0500 0.0550 0.0600 0.0650 0.0700 0.0750 0.0800 0.0850 0.0900
Crystallite Size (Angstrom-1/2)
Thre
shol
d/A
ir St
ress
(%)
4140 QT4140 AT1095 QT1095 AT1065 QT1065 AT
Figure 4-17: Hydrogen-induced cracking susceptibility as a function of the ferrite crystallite size.
- 72 -
Chapter 5: Conclusions
1. Dual phase steels consisting of a tempered martensite matrix with islands of 10-
20% by volume ferrite are notch sensitive and less resistant to hydrogen assisted
cracking susceptibility than fully tempered martensitic steels, independent of the
morphology of the phases resulting from step or continuous annealing treatments.
2. Carbon content does not have an influence on the hydrogen assisted cracking
susceptibility when the steel is exposed to a nearly unlimited supply of hydrogen.
This is because carbides act as irreversible traps and therefore do not limit
hydrogen diffusion when the specimen is hydrogen saturated.
3. Chromium may be detrimental in resistance to hydrogen assisted cracking. All
other elements explored; boron, molybdenum and manganese, have little or no
effect.
4. Bainitic structures show a 10-20% increase in resistance to hydrogen assisted
cracking susceptibility when compared to tempered martensite. This improved
resistance may be attributed to the carbide and ferrite morphology, retained
austenite or homogenous strain free structure.
5. High strength, isothermally transformed, pearlite can be produced with hardness
values nearing 500 HVN. This high strength is due to the fine lamella spacing of
approximately 500 angstroms. These steels show improvement in resistance to
hydrogen assisted cracking in preliminary results. The pearlitic structure may
require a higher local hydrogen concentration for crack nucleation. This
improved resistance must be explained by the morphology of the ferrite and
carbide platelets.
- 73 -
Chapter 6: References
1. N. N. Petch, “The Lowering of Fracture-Stress due to Surface Adsorption”, Philos. Mag., Ser. 8, Vol 1 (No. 4), 1956, p 331-335
2. A. R. Troiano, “The Role of Hydrogen and Other Interstitials in the Mechanical
Behavior of Metals, Trans. ASM, Vol 52, 1960, p 54-80 3. C. D. Beachem, “A New Model for Hydrogen Assisted Cracking (“Hydrogen
“Embrittlement”)”, Metall. Trans., Vol 3 (No. 2), 1972, p 437-451 4. J.E. Grochowski, MS Thesis – Michigan Technological University, 2005 5. L. Raymond, “The Susceptibility of Fasteners to Hydrogen Embrittlement and Stress
Corrosion Cracking”, Chapter 39 from The Handbook of Bolts and Bolted Joints, by J.H. Bickford & S. Nassar, Editors, Marcel Dekker, Inc., Publisher
6. R. C. Cippolla, “Stress Intensity Factor Approximations for Cracks Located at the
Thread Root Region of Fasteners”, Structural Integrity of Fasteners, edited by P. M. Toor, ASTM, 1995, p 109-125
7. P. M. Toor, “An Overview of Structural Integrity of Fasteners”, Structural Integrity of
Fasteners, edited by P. M. Toor, ASTM, 1995, p ix – xxii 8. Peterson’s Stress Concentration Factors, edited by W.D. Pilkey, John Wiley & Sons,
Inc., 1997 9. N. E. Dowling, Mechanical Behavior of Materials, Prentice-Hall, 1993 10. P.F. Timmins, Solutions to Hydrogen Attack in Steels, ASM International, 1997 11. E. A. Steigerwald, F. W. Schaller, A.R. Troiano, “The Role of Stress in Hydrogen
Induced Delayed Failure”, Trans. AIME, Vol 218, 1960, p 832 – 841 12. K. Kitajima, “Modelling of Hydrogen-induced fracture in iron”, Materials Science
and Engineering A, Vol 176, 1994, 249-253 13. M. Nagumo, “Function of Hydrogen in Embrittlement of High-strength Steels”, ISIJ
International, Vol 41 (No. 6), 2001, p 590-598 14. N. N. Kinaev, D. R. Cousens, A. Atrens, “Crack Tip Strain Field of AISI 4340”, J.
Mater. Sci., Vol 34, 1999, p 4909-4936 15. “F 606 Test Methods for Determining The Mechanical Properties of Externally and
Internally Threaded Fasteners, Washers, and Rivets”, Annual Book of ASTM Standards, Vol 01.08, 2000, p 211-222
- 74 -
16. E. D. McCarty, D. Wetzel, B. S. Kloberdanz, “Hydrogen Embrittlement in
Automotive Fastener Applications”, SAE International, Technical Paper Series, No. 960312, 1996
17. L. Raymond, “Evaluation of Hydrogen Embrittlement”, ASM Handbook 9th edition,
Corrosion Vol 13, 1987, p 283-290 18. “F 1624 Standard Test Method for Measurement of Hydrogen Embrittlement in Steel
by the Incremental Loading Technique”, Annual Book of ASTM Standards, Vol 15.03, 2000
19. A. Bayram, A. Uguz, M, Ula, “Effects of Microstructure and Notches on the
Mechanical Properties of Dual-Phase Steels”, Materials Characterization (USA). Vol 43 (No. 4), 1999, p 259-269
20. E. Ahmad, T. Manzoor, K. Liaqat, J. I. Akhter, “Effect of Microvoid Formation on
the Tensile Properties of Dual-Phase Steel”, Journal of Materials Engineering and Performance, Vol 9 (No. 3), 2000, p 306-310
21. R. Kerr, F. Solana, I. M. Bernstein, A. W. Thompson, “Microstructural Effects on the
Stress Corrosion Cracking Behavior of Medium and High Strength Steels”, Met. Trans. A., Vol 18A, 1987, p 1011-1022
22. “Austempering of Steel”, ASM Handbook 9th edition, Vol 4 Heat Treating, 1987, p
104-116 23. H. K. D. H. Bhadesia, Bainite in Steels 2nd edition, IOM Communications Ltd, 2001 24. E. D. McCarthy, G. A. Shulke, “The Effects of Heat Treatment on the Hydrogen
Assisted Cracking Susceptibility of Case Hardened Fasteners”, 20th ASM Heat Treating Society Conference Proceedings, Oct. 2000, ASM International, 2000
25. G. Echaniz, T. E. Perez, C. Pampillo, R. C. Newman, R. P. M. Procter, G. W.
Lorimer, “The Effect of Microstructure on Hydrogen-Induced Stress Corrosion Cracking of Quenched and Tempered Steels”, Hydrogen Effects in Materials, The Minerals, Metals & Materials Society, 1996, p 669-677
26. R. Valentini, A. Solina, “Influence of Microstructure on Hydrogen Embrittlement
Behaviour of 2-25Cr-1Mo steel”, Mater. Sci. and Tech., Vol 10, 1994, 908-914 27. E. Quadrini, “Study of the Effect of Heat Treatment on Hydrogen Embrittlement of
AISI 4340 steel”, J. Mater. Sci., Vol 24 (No. 3), 1989, p 915-920 28. A. W. Thompson, I. M. Bernstein, “Microstructure and Hydrogen Embrittlement”, in
Hydrogen Effects in Metals, AIME, 1981, p 291-308
- 75 -
29. R. Krishnamurthy, C. N. Marzinsky, R. P. Gangloff, “Microstructure and Yield
Strength Effects on Hydrogen Environment Fatigue of Steels”, Hydrogen Effects on Material Behavior, The Minerals, Metals & Materials Society, 1990, p 891-908
30. L. Tau, S. L. I. Chan, C. S. Shin, “Hydrogen Enhanced Fatigue Crack Propagation of
Bainitic and Tempered Martensitic Steels”, Corrosion Science (USA), Vol 38 (No. 11), 1996, p 2049-2060
31. I. M. Bernstein, G. M. Pressouyre, “The Role of Traps in the Microstructural Control
of Hydrogen Embrittlement of Steels”, Hydrogen Degradation of Ferrous Alloys, Noyes Publications, 1985, p 641-681
32. P. Bruzzoni, G. Domizzi, M. I. Luppo, D. Zalcman, J. Ovejero-Garcia, “Effect of
Boron as a Micro-Alloying Element on the Behaviour of a 1038 Steel in a Hydrogen Environment”, Hydrogen Effects in Materials, The Minerals, Metals & Materials Society, 1996, p 1,001-1,009
33. B. D. Cullity, S. R. Stock, Elements of X-ray Diffraction 3rd edition, Prentice-Hall,
Inc., 2001 34. “F 519 Standard Test Method for Mechanical Hydrogen Embrittlement Evaluation of
Plating Processes and Service Environments”, Annual Book of ASTM Standards, Vol 15.03, 2000, p 843-854
35. J. M. Capus, “The Mechanism of Temper Brittleness”, Temper Embrittlement in
Steel, ASTM, 1968, p 3-19 36. ASM Handbook 9th edition, Vol 4, Heat Treating, 1987, p 84 37. J. Toribio, E. Vasseur, “Hydrogen-Assisted Micro-Damage Evolution in Pearlitic
Steel”, J. of Mater. Sci. letters, Vol 16, 1997, p 1345-1348 38. D. G. Enos, J. R. Scully, “A Critical-Strain Criterion for Hydrogen Embrittlement of
Cold-Drawn, Ultrafine Pearlitic Steel”, Met. and Mater. Trans. A, Vol 33A, 2002, p 1151-1166
39. J. E. Costa, A. W. Thompson, “Hydrogen Cracking in Nominally Pearlitic 1045
Steel”, Met. Trans. A, Vol 13A, 1982, p 1315-1318
- 76 -
Appendices
I. RSL Load Data II. RSL Stress Calculations III. X-Ray Diffraction Data IV. Compilation of Fractographs
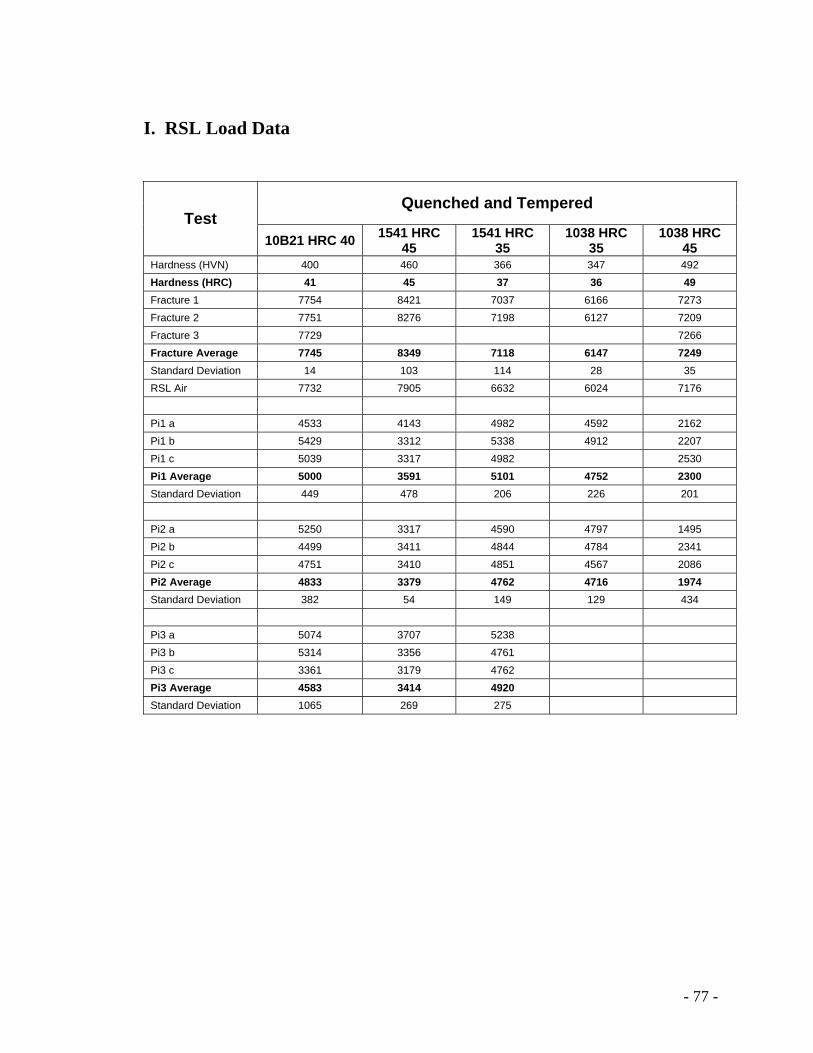
- 77 -
I. RSL Load Data
Quenched and Tempered Test
10B21 HRC 40 1541 HRC 45
1541 HRC 35
1038 HRC 35
1038 HRC 45
Hardness (HVN) 400 460 366 347 492 Hardness (HRC) 41 45 37 36 49 Fracture 1 7754 8421 7037 6166 7273 Fracture 2 7751 8276 7198 6127 7209 Fracture 3 7729 7266 Fracture Average 7745 8349 7118 6147 7249 Standard Deviation 14 103 114 28 35 RSL Air 7732 7905 6632 6024 7176 Pi1 a 4533 4143 4982 4592 2162 Pi1 b 5429 3312 5338 4912 2207 Pi1 c 5039 3317 4982 2530 Pi1 Average 5000 3591 5101 4752 2300 Standard Deviation 449 478 206 226 201 Pi2 a 5250 3317 4590 4797 1495 Pi2 b 4499 3411 4844 4784 2341 Pi2 c 4751 3410 4851 4567 2086 Pi2 Average 4833 3379 4762 4716 1974 Standard Deviation 382 54 149 129 434 Pi3 a 5074 3707 5238 Pi3 b 5314 3356 4761 Pi3 c 3361 3179 4762 Pi3 Average 4583 3414 4920 Standard Deviation 1065 269 275
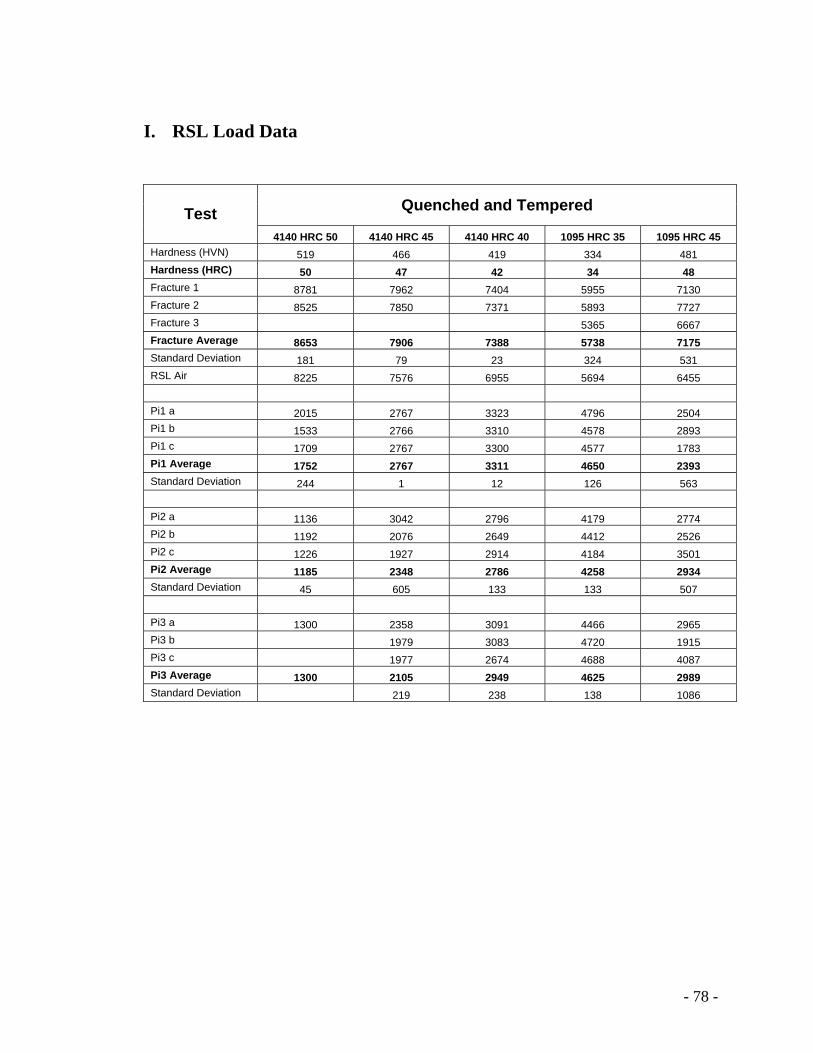
- 78 -
I. RSL Load Data
Quenched and Tempered Test 4140 HRC 50 4140 HRC 45 4140 HRC 40 1095 HRC 35 1095 HRC 45
Hardness (HVN) 519 466 419 334 481 Hardness (HRC) 50 47 42 34 48 Fracture 1 8781 7962 7404 5955 7130 Fracture 2 8525 7850 7371 5893 7727 Fracture 3 5365 6667 Fracture Average 8653 7906 7388 5738 7175 Standard Deviation 181 79 23 324 531 RSL Air 8225 7576 6955 5694 6455 Pi1 a 2015 2767 3323 4796 2504 Pi1 b 1533 2766 3310 4578 2893 Pi1 c 1709 2767 3300 4577 1783 Pi1 Average 1752 2767 3311 4650 2393 Standard Deviation 244 1 12 126 563 Pi2 a 1136 3042 2796 4179 2774 Pi2 b 1192 2076 2649 4412 2526 Pi2 c 1226 1927 2914 4184 3501 Pi2 Average 1185 2348 2786 4258 2934 Standard Deviation 45 605 133 133 507 Pi3 a 1300 2358 3091 4466 2965 Pi3 b 1979 3083 4720 1915 Pi3 c 1977 2674 4688 4087 Pi3 Average 1300 2105 2949 4625 2989 Standard Deviation 219 238 138 1086
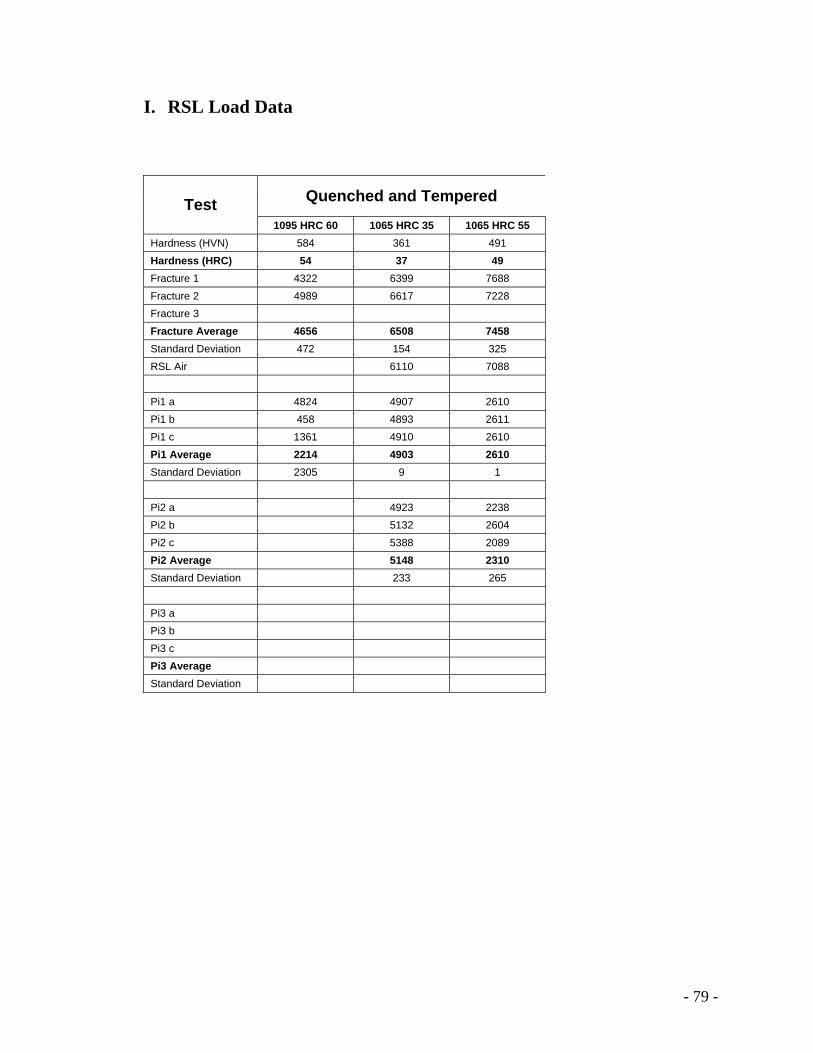
- 79 -
I. RSL Load Data
Quenched and Tempered Test 1095 HRC 60 1065 HRC 35 1065 HRC 55
Hardness (HVN) 584 361 491 Hardness (HRC) 54 37 49 Fracture 1 4322 6399 7688 Fracture 2 4989 6617 7228 Fracture 3 Fracture Average 4656 6508 7458 Standard Deviation 472 154 325 RSL Air 6110 7088 Pi1 a 4824 4907 2610 Pi1 b 458 4893 2611 Pi1 c 1361 4910 2610 Pi1 Average 2214 4903 2610 Standard Deviation 2305 9 1 Pi2 a 4923 2238 Pi2 b 5132 2604 Pi2 c 5388 2089 Pi2 Average 5148 2310 Standard Deviation 233 265 Pi3 a Pi3 b Pi3 c Pi3 Average Standard Deviation
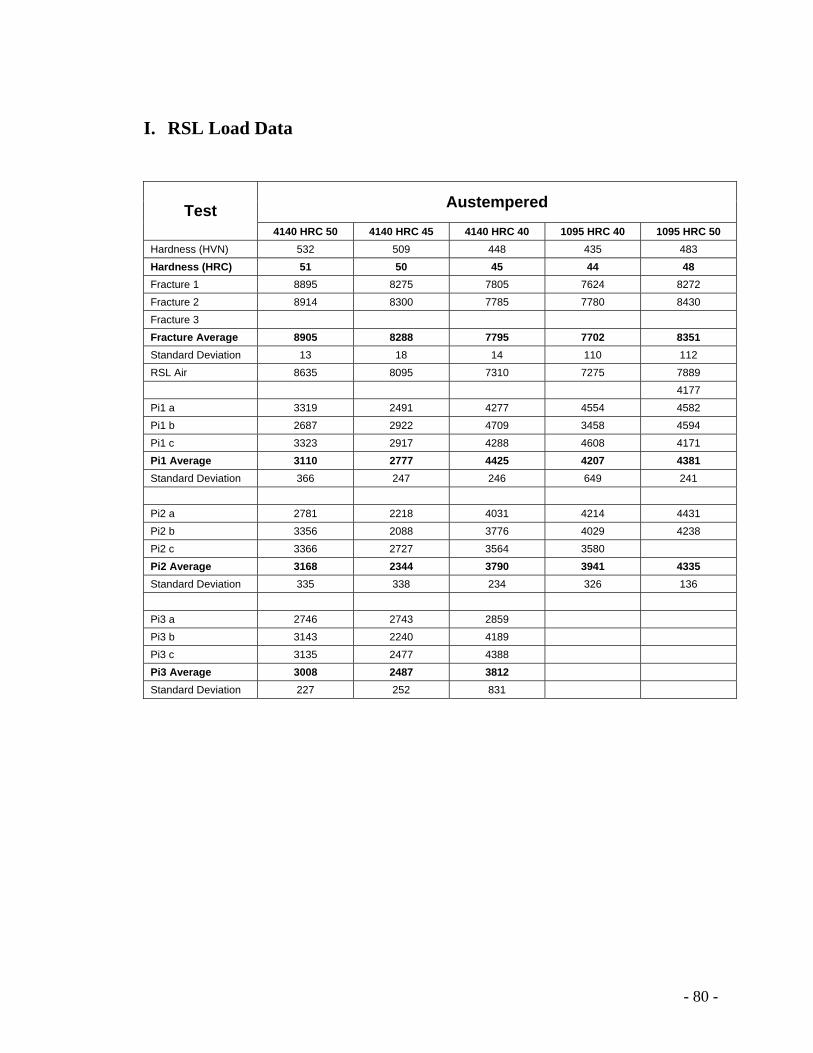
- 80 -
I. RSL Load Data
Austempered Test 4140 HRC 50 4140 HRC 45 4140 HRC 40 1095 HRC 40 1095 HRC 50
Hardness (HVN) 532 509 448 435 483 Hardness (HRC) 51 50 45 44 48 Fracture 1 8895 8275 7805 7624 8272 Fracture 2 8914 8300 7785 7780 8430 Fracture 3 Fracture Average 8905 8288 7795 7702 8351 Standard Deviation 13 18 14 110 112 RSL Air 8635 8095 7310 7275 7889 4177 Pi1 a 3319 2491 4277 4554 4582 Pi1 b 2687 2922 4709 3458 4594 Pi1 c 3323 2917 4288 4608 4171 Pi1 Average 3110 2777 4425 4207 4381 Standard Deviation 366 247 246 649 241 Pi2 a 2781 2218 4031 4214 4431 Pi2 b 3356 2088 3776 4029 4238 Pi2 c 3366 2727 3564 3580 Pi2 Average 3168 2344 3790 3941 4335 Standard Deviation 335 338 234 326 136 Pi3 a 2746 2743 2859 Pi3 b 3143 2240 4189 Pi3 c 3135 2477 4388 Pi3 Average 3008 2487 3812 Standard Deviation 227 252 831
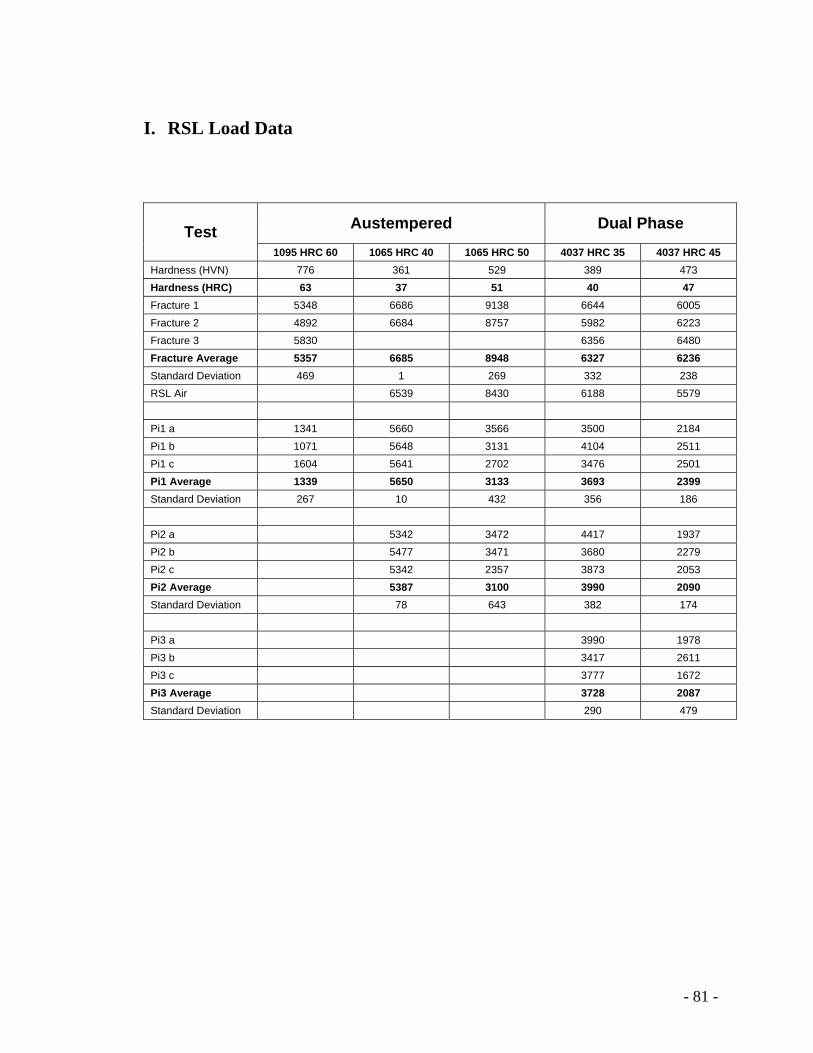
- 81 -
I. RSL Load Data
Austempered Dual Phase Test 1095 HRC 60 1065 HRC 40 1065 HRC 50 4037 HRC 35 4037 HRC 45
Hardness (HVN) 776 361 529 389 473 Hardness (HRC) 63 37 51 40 47 Fracture 1 5348 6686 9138 6644 6005 Fracture 2 4892 6684 8757 5982 6223 Fracture 3 5830 6356 6480 Fracture Average 5357 6685 8948 6327 6236 Standard Deviation 469 1 269 332 238 RSL Air 6539 8430 6188 5579 Pi1 a 1341 5660 3566 3500 2184 Pi1 b 1071 5648 3131 4104 2511 Pi1 c 1604 5641 2702 3476 2501 Pi1 Average 1339 5650 3133 3693 2399 Standard Deviation 267 10 432 356 186 Pi2 a 5342 3472 4417 1937 Pi2 b 5477 3471 3680 2279 Pi2 c 5342 2357 3873 2053 Pi2 Average 5387 3100 3990 2090 Standard Deviation 78 643 382 174 Pi3 a 3990 1978 Pi3 b 3417 2611 Pi3 c 3777 1672 Pi3 Average 3728 2087 Standard Deviation 290 479

- 82 -
II. RSL Stress Calculations
Quenched and Tempered Test 10B21 HRC 40 1541 HRC 35 1541 HRC 45 1038 HRC 35 1038 HRC 45
Vickers Hardness 400 366 460 347 492 Air Testing Air Load (lbs) 7745 7118 8349 6147 7249 Air Stress (ksi) 322 296 347 256 301 Max Air Load (lbs) 7754 7198 8421 6166 7273 Maximum Air (ksi) 322 299 350 256 302 Dev. 0 3 3 1 1 Min Air Load (lbs) 7729 7037 8276 6127 7209 Minimum Air (ksi) 321 293 344 255 300 Dev. 1 3 3 1 2 Deviation in Air (lbs) 14 114 103 28 35 Std. Dev. (ksi) 1 5 4 1 1 Salt Testing/Protocol 3 2 2 2 2 Threshold Load (lbs) 4583 4762 3379 4716 1974 Threshold Stress (ksi) 191 198 140 196 82 Max Load (lbs) 5314 4851 3411 4797 2341 Maximum (ksi) 221 202 142 199 97 Min Load (lbs) 3361 4590 3317 4567 1495 Minimum (ksi) 140 191 138 190 62 Deviation of Load (lbs) 1065 149 54 129 434 Standard Deviation (ksi) 44 6 2 5 18
Percent FS (%) 59 67 40 77 27
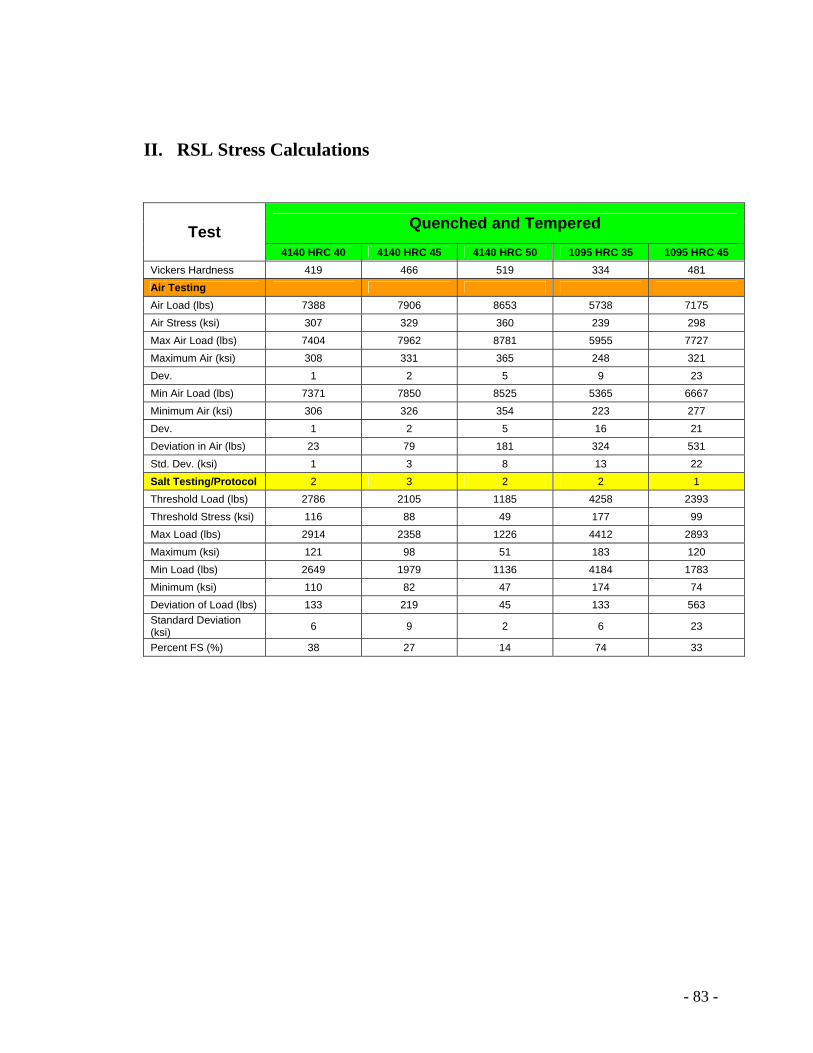
- 83 -
II. RSL Stress Calculations
Quenched and Tempered Test 4140 HRC 40 4140 HRC 45 4140 HRC 50 1095 HRC 35 1095 HRC 45
Vickers Hardness 419 466 519 334 481 Air Testing Air Load (lbs) 7388 7906 8653 5738 7175 Air Stress (ksi) 307 329 360 239 298 Max Air Load (lbs) 7404 7962 8781 5955 7727 Maximum Air (ksi) 308 331 365 248 321 Dev. 1 2 5 9 23 Min Air Load (lbs) 7371 7850 8525 5365 6667 Minimum Air (ksi) 306 326 354 223 277 Dev. 1 2 5 16 21 Deviation in Air (lbs) 23 79 181 324 531 Std. Dev. (ksi) 1 3 8 13 22 Salt Testing/Protocol 2 3 2 2 1 Threshold Load (lbs) 2786 2105 1185 4258 2393 Threshold Stress (ksi) 116 88 49 177 99 Max Load (lbs) 2914 2358 1226 4412 2893 Maximum (ksi) 121 98 51 183 120 Min Load (lbs) 2649 1979 1136 4184 1783 Minimum (ksi) 110 82 47 174 74 Deviation of Load (lbs) 133 219 45 133 563 Standard Deviation (ksi) 6 9 2 6 23
Percent FS (%) 38 27 14 74 33
- 84 -
II. RSL Stress Calculations
Quenched and Tempered Dual Phase Test
1065 HRC 35 1065 HRC 55 4037 HRC 35 4037 HRC 45 Vickers Hardness 361 491 389 473 Air Testing Air Load (lbs) 6508 7458 6327 6236 Air Stress (ksi) 271 310 263 259 Max Air Load (lbs) 6617 7688 6644 6480 Maximum Air (ksi) 275 320 276 269 Dev. 5 10 Min Air Load (lbs) 6399 7228 5982 6005 Minimum Air (ksi) 266 301 249 250 Dev. 5 10 Deviation in Air (lbs) 154 325 332 238 Std. Dev. (ksi) 6 14 14 10 Salt Testing/Protocol 1 2 1 3 Threshold Load (lbs) 4903 2310 3693 2087 Threshold Stress (ksi) 204 96 154 87 Max Load (lbs) 4910 2604 4104 2611 Maximum (ksi) 204 108 171 109 Min Load (lbs) 4893 2089 3476 1672 Minimum (ksi) 203 87 145 70 Deviation of Load (lbs) 9 265 356 479 Standard Deviation (ksi) 0 11 15 20
Percent FS (%) 75 31 58 33
- 85 -
II. RSL Stress Calculations
Austempered Test 4140 HRC 40 4140 HRC 45 4140 HRC 50 1095 HRC 40 1095 HRC 50
Vickers Hardness 448 509 532 435 483 Air Testing Air Load (lbs) 8166 8659 9276 7702 8351 Air Stress (ksi) 340 360 386 320 347 Max Air Load (lbs) 8176 8671 9285 7780 8430 Maximum Air (ksi) 340 360 386 323 350 Dev. 0 0 0 3 3 Min Air Load (lbs) 8156 8646 9266 7624 8272 Minimum Air (ksi) 339 359 385 317 344 Dev. 0 1 0 3 3 Deviation in Air (lbs) 14 18 13 110 112 Std. Dev. (ksi) 1 1 1 5 5 Salt Testing/Protocol 2 2 3 2 2 Threshold Load (lbs) 3474 2028 2692 3941 4335 Threshold Stress (ksi) 144 84 112 164 180 Max Load (lbs) 3715 2411 2827 4214 4431 Maximum (ksi) 154 100 118 175 184 Min Load (lbs) 3247 1771 2429 3580 4238 Minimum (ksi) 135 74 101 149 176 Deviation of Load (lbs) 234 338 227 326 136 Standard Deviation (ksi) 10 14 9 14 6
Percent FS (%) 43 23 29 51 52
- 86 -
II. RSL Stress Calculations
Austempered Test 1065 HRC 40 1065 HRC 50
Vickers Hardness 361 529 Air Testing Air Load (lbs) 6685 8948 Air Stress (ksi) 278 372 Max Air Load (lbs) 6686 9138 Maximum Air (ksi) 278 380 Dev. 0 8 Min Air Load (lbs) 6684 8757 Minimum Air (ksi) 278 364 Dev. 0 8 Deviation in Air (lbs) 1 269 Std. Dev. (ksi) 0 11 Salt Testing/Protocol 2 2 Threshold Load (lbs) 5387 3100 Threshold Stress (ksi) 224 129 Max Load (lbs) 5477 3472 Maximum (ksi) 228 144 Min Load (lbs) 5342 2357 Minimum (ksi) 222 98 Deviation of Load (lbs) 78 643 Standard Deviation (ksi) 3 27
Percent FS (%) 81 35
- 87 -
III. X-Ray Diffraction Data
211 Peak Ferrite Peak
Steel Grade Sample ID Hardness (HVN)
Peak Position
(deg.) FWHM (deg.)
Crystallite Size (Angstroms)
d-1/2 (A-1/2)
Rc50 531 82.20 0.7826 144 0.0834 Rc45 462 82.21 0.5588 207 0.0694 Q&T 4140 Rc40 396 82.20 0.4299 279 0.0599
Rc40 361 82.23 0.3059 420 0.0488 Q&T 1065 Rc50 529 82.19 0.6760 168 0.0771
Rc35 334 82.27 0.2771 477 0.0458 Rc45 481 82.16 0.3350 375 0.0516 Q&T 1095 Rc60 584 82.06 0.9943 111 0.0948
Rc51 538 82.20 0.7951 141 0.0841 Rc50 506 82.20 0.7600 148 0.0821 AT 4140 Rc45 450 82.19 0.6278 182 0.0740
Rc40 361 82.23 0.3059 420 0.0488 AT 1065 Rc50 529 82.19 0.6760 168 0.0771
Rc40 435 82.23 0.3666 337 0.0545 Rc50 483 82.25 0.4099 295 0.0582 AT 1095 Rc60 776 82.11 1.1187 98 0.1008
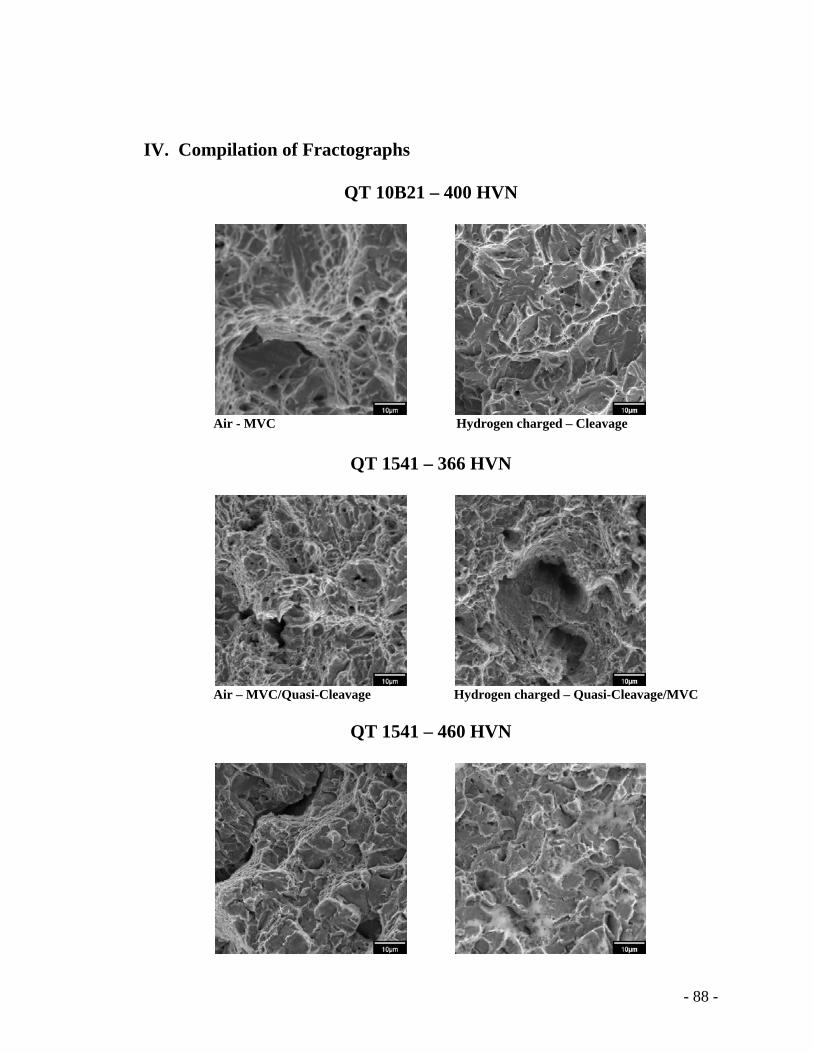
- 88 -
IV. Compilation of Fractographs
QT 10B21 – 400 HVN
Air - MVC Hydrogen charged – Cleavage
QT 1541 – 366 HVN
Air – MVC/Quasi-Cleavage Hydrogen charged – Quasi-Cleavage/MVC
QT 1541 – 460 HVN
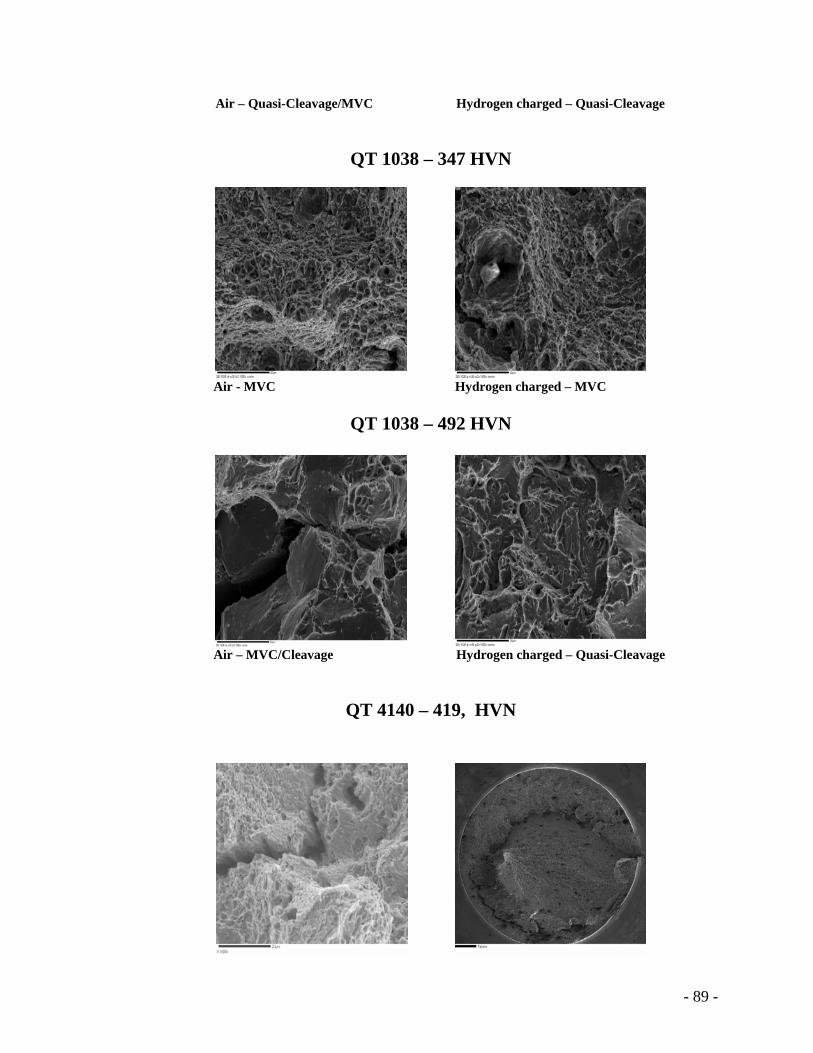
- 89 -
Air – Quasi-Cleavage/MVC Hydrogen charged – Quasi-Cleavage
QT 1038 – 347 HVN
Air - MVC Hydrogen charged – MVC
QT 1038 – 492 HVN
Air – MVC/Cleavage Hydrogen charged – Quasi-Cleavage
QT 4140 – 419, HVN
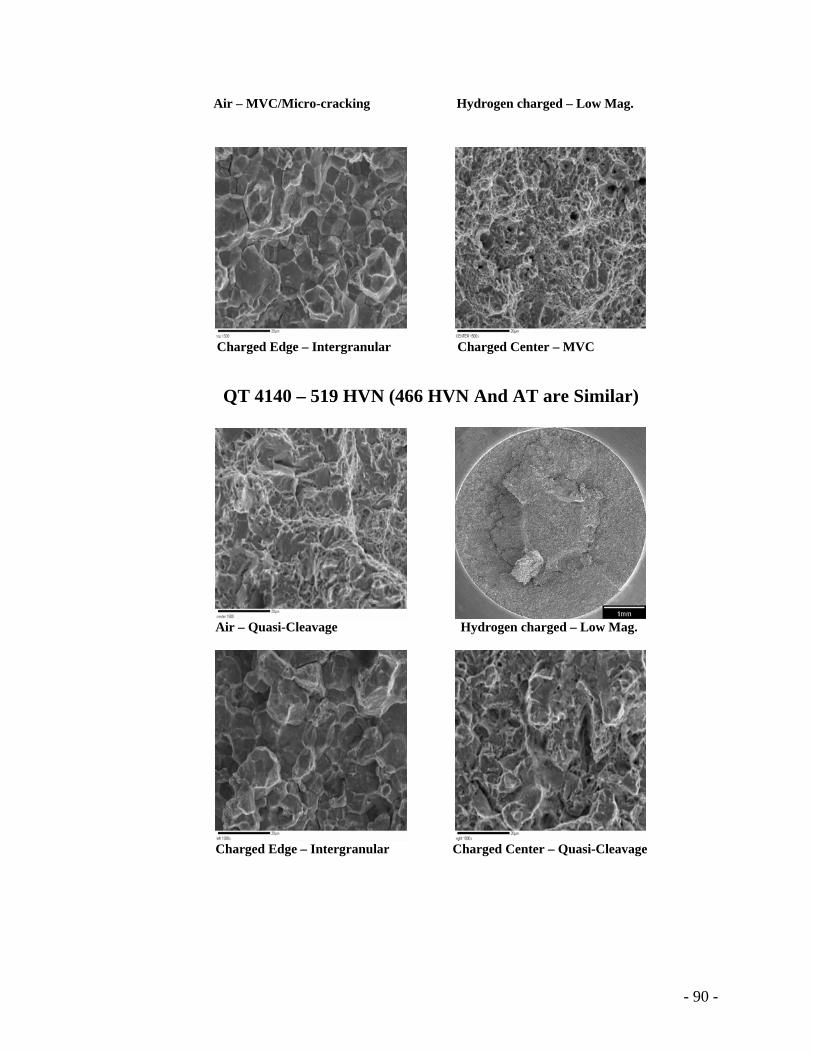
- 90 -
Air – MVC/Micro-cracking Hydrogen charged – Low Mag.
Charged Edge – Intergranular Charged Center – MVC
QT 4140 – 519 HVN (466 HVN And AT are Similar)
Air – Quasi-Cleavage Hydrogen charged – Low Mag.
Charged Edge – Intergranular Charged Center – Quasi-Cleavage
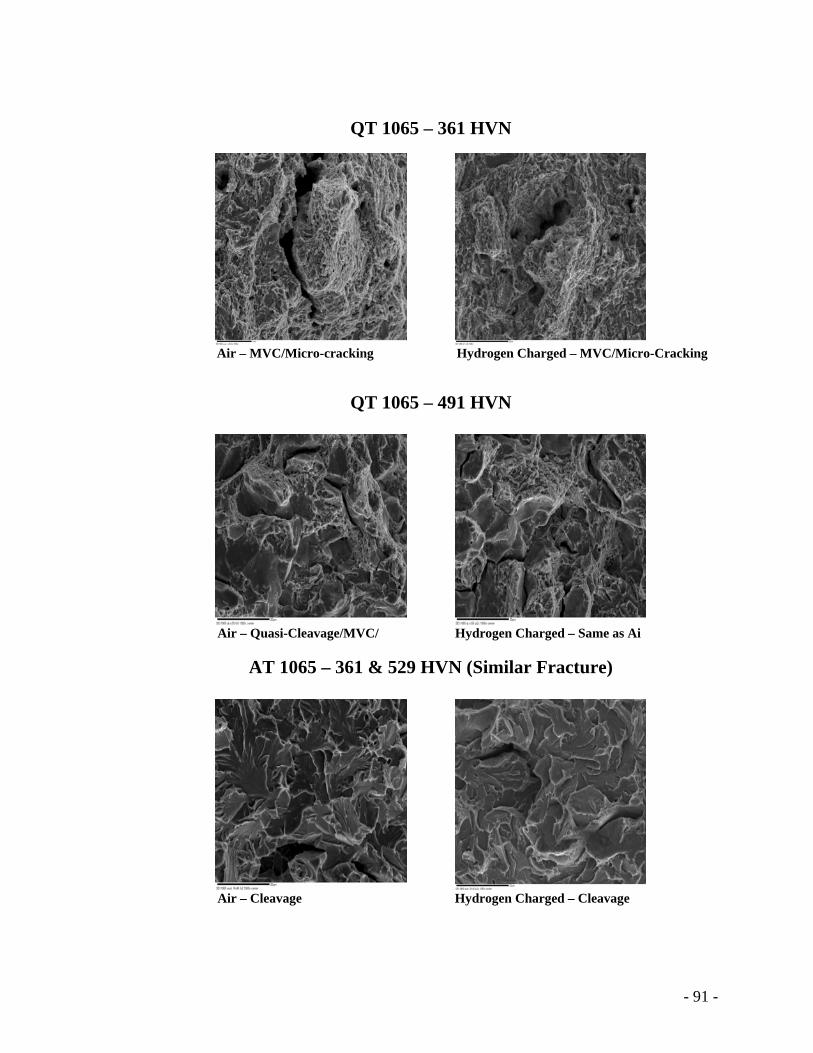
- 91 -
QT 1065 – 361 HVN
Air – MVC/Micro-cracking Hydrogen Charged – MVC/Micro-Cracking
QT 1065 – 491 HVN
Air – Quasi-Cleavage/MVC/ Hydrogen Charged – Same as Ai
AT 1065 – 361 & 529 HVN (Similar Fracture)
Air – Cleavage Hydrogen Charged – Cleavage
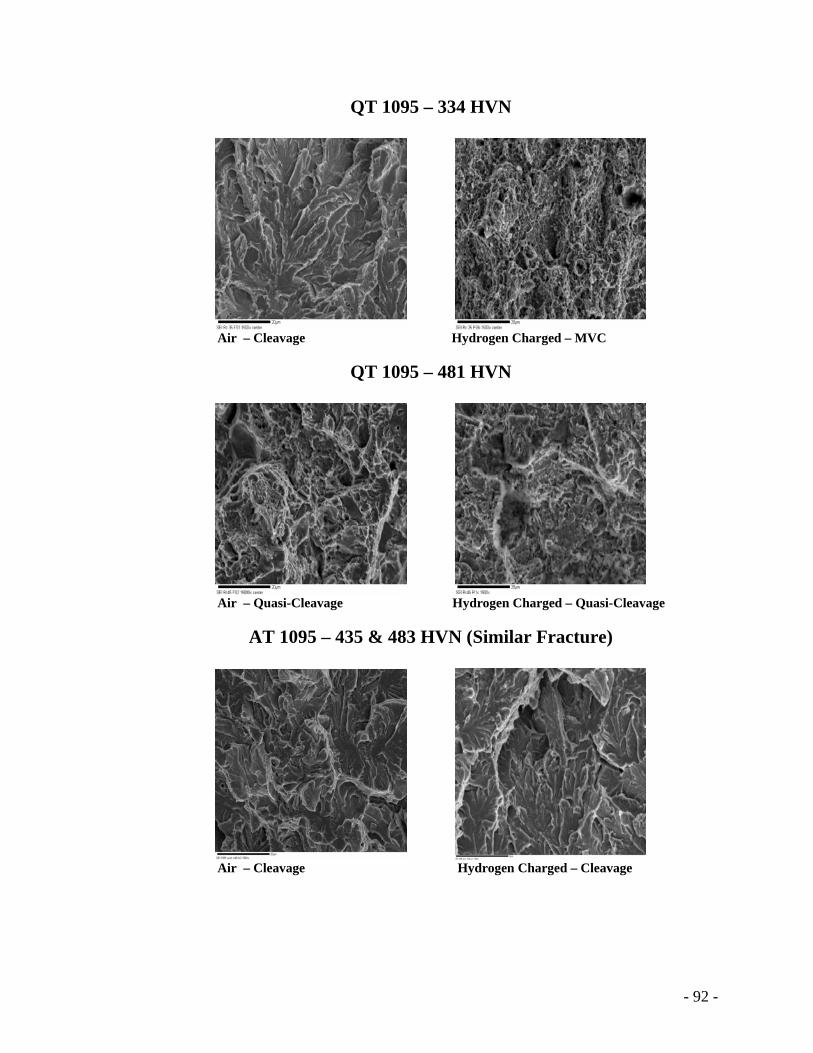
- 92 -
QT 1095 – 334 HVN
Air – Cleavage Hydrogen Charged – MVC
QT 1095 – 481 HVN
Air – Quasi-Cleavage Hydrogen Charged – Quasi-Cleavage
AT 1095 – 435 & 483 HVN (Similar Fracture)
Air – Cleavage Hydrogen Charged – Cleavage
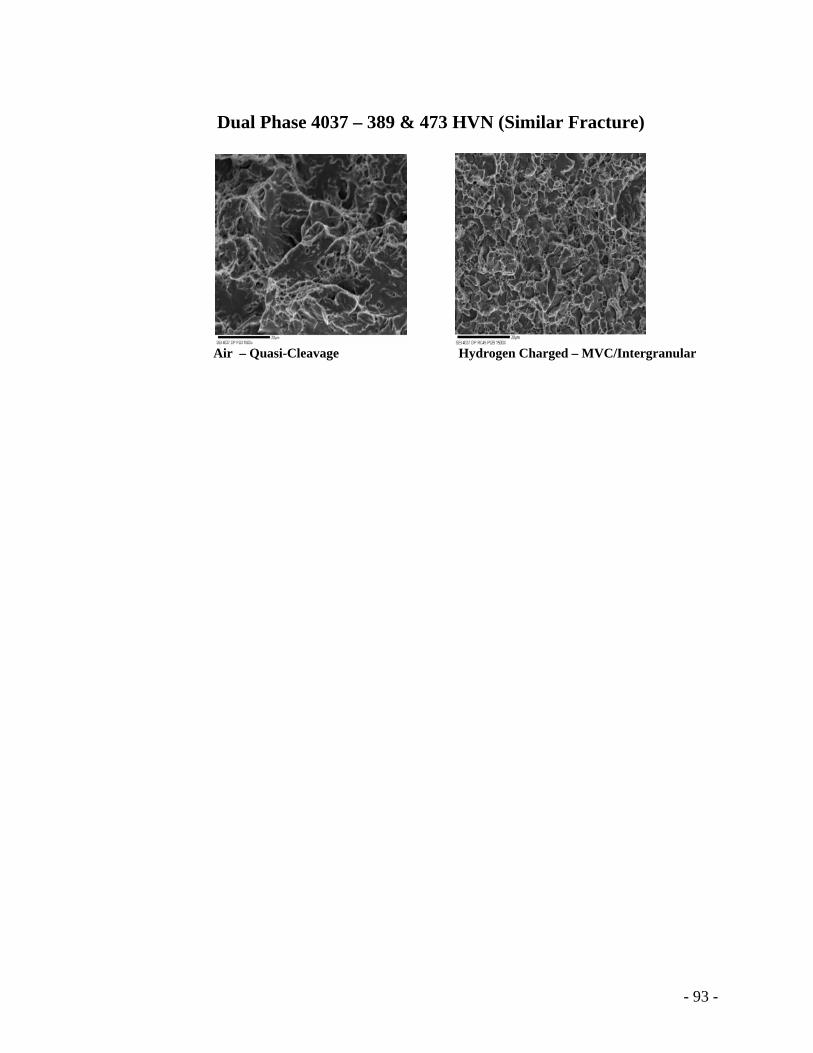
- 93 -
Dual Phase 4037 – 389 & 473 HVN (Similar Fracture)
Air – Quasi-Cleavage Hydrogen Charged – MVC/Intergranular


![THESIS TITLE A THESIS SUBMITTED TO THE MIDDLE EAST ...ii.metu.edu.tr/system/files/documents/thesis... · [SAMPLE 1] Approval of the thesis: THESIS TITLE Submitted by STUDENT NAME](https://img.pdfslide.us/doc/110x75/6019035f39977162fc4f0b03/thesis-title-a-thesis-submitted-to-the-middle-east-iimetuedutrsystemfilesdocumentsthesis.jpg)