Embed Size (px)
Citation preview
Calhoun: The NPS Institutional Archive
Theses and Dissertations Thesis Collection
1985
Design and testing of hardware improvements of an
acoustic sounder.
Richards, William L.
http://hdl.handle.net/10945/21260


DUDLEY KNOX LIBRARYNAVAL POSTGRADUATE SCHOOLMONTEREY, CALIFORNIA 93943-6008


NAVAL POSTGRADUATE SCHOOL
Monterey, California
THESISDESIGN AND TESTING OF HARDWARE
IMPROVEMENTS OF AN ACOUSTIC SOUNDER
^
William L. Richards
June 1985
Thesis Advisor: D.L. Walters
Approved for public release; distribution unlimited
T226808
SECURITY CLASSIFICATION OF THIS PAGE (Whan Data Ente red)
REPORT DOCUMENTATION PAGE READ INSTRUCTIONSBEFORE COMPLETING FORM
1. REPORT NUMBER 2. GOVT ACCESSION NO 3. RECIPIENT'S CATALOG NUMBER
4. TITLE (and Subtitle) 5. TYPE OF REPORT & PERIOD COVERED
DESIGN AND TESTING OF HARDWAREIMPROVEMENTS OF AN ACOUSTIC SOUNDER $
e?9§5
Thesis
6. PERFORMING ORG. REPORT NUMBER
7. AUTHORS
William L. Richards8. CONTRACT OR GRANT NUMBERf..)
9. PERFORMING ORGANIZATION NAME AND ADDRESS
Naval Postgraduate SchoolMonterey, California 939^3-5100
10. PROGRAM ELEMENT. PROJECT, TASKAREA 4 WORK UNIT NUMBERS
11. CONTROLLING OFFICE NAME AND ADDRESS
Naval Postgraduate SchoolMonterey, California 939^3-5100
12. REPORT DATEJune 1985
13. NUMBER OF PAGES
51U. MONITORING AGENCY NAME 4 ADDRESSf// diIterant from Controlling Ofllca) 15. SECURITY CLASS, (ot this report)
Unclassified
15«. DECLASSIFICATION/ DOWNGRADINGSCHEDULE
16. DISTRIBUTION STATEMENT (ot this Report)
Approved for public release; distribution unlimited
17. DISTRIBUTION STATEMENT (ol the abstract entered In Block 20, II different from Report)
18. SUPPLEMENTARY NOTES
19. KEY WOROS (Continue on reverse alje It necessary and Identity by block number)
LaserAcoustic SonuderHorn
20. ABSTRACT (Continue on reverse aide It necessary and Identity by block number) _.,,_ — 1 1 Av% +• j. i
Acoustic sounders have proven to T5e 'excellent tools inprobing the fine dynamic structure of the atmosphere.Commercial instruments, such as the Aeroviroment model #300acoustic sounder, are qualitative devices and do not operatewell at ranges beyond 500 meters. This project centered ontwo hardware improvements designed to help increase the rangeof the acoustic sounder to over one thousand meters. The de-velopments include the design and testing of an improved
DD | jan 73 1473 EDITION OF I NOV 65 IS OBSOLETE
S N 0102- LF- 014- 6601 \ SECURITY CLASSIFICATION OF THIS PAGE (When Data Entered)
SECURITY CLASSIFICATION OF THIS PAGE (Whmt Dmtm Entfd)
transmission horn for the transducer.
S-N 0102- LF- 014- 660)
2 SECURITY CLASSIFICATION OF THIS PAGErWTi.n Dalm BnCrmd)
Approved for public release; distribution unlimited
Design and Testing of Hardware Improvementsof an Acoustic Sounder
by
William L. RichardsLieutenant, United States Navy
B.S., United States Naval Academy, 1977
Submitted in partial fulfillment of therequirements for the degree of
MASTER OF SCIENCE IN PHYSICS
from the
NAVAL POSTGRADUATE SCHOOLJune 1985
ABSTRACT
Acoustic sounders have proven to be excellent tools In
probing the fine dynamic structure of the atmosphere.
Commercial instruments, such as the Aerovironment model #300
acoustic sounder, are qualitative devices and do not operate
well at ranges beyond five hundred meters. This project
centered on two hardware improvements designed to help
increase the range of the acoustic sounder to over one
thousand meters. The developments include the design and
testing of an improved transmission horn for the transducer.
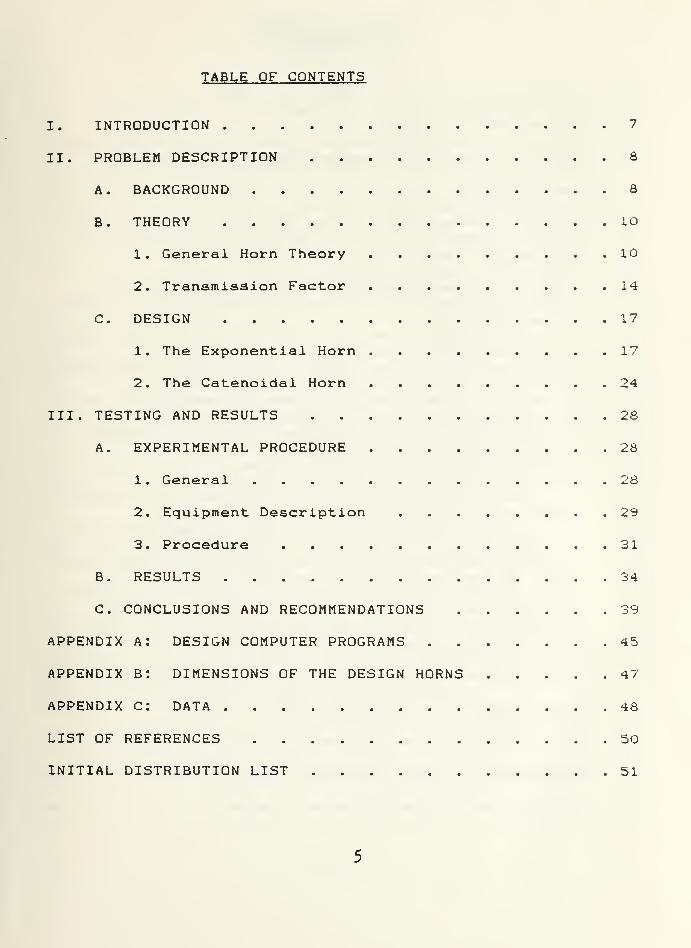
TABLE QF CONTENTS
I. INTRODUCTION 7
II. PROBLEM DESCRIPTION 8
A. BACKGROUND 8
B. THEORY 10
1. General Horn Theory 10
2. Transmission Factor 14
C. DESIGN 17
1. The Exponential Horn 17
2. The Catenoidal Horn 24
III. TESTING AND RESULTS 28
A. EXPERIMENTAL PROCEDURE 28
1
.
General 28
2. Equipment Description 2S
3. Procedure 31
B. RESULTS 34
C. CONCLUSIONS AND RECOMMENDATIONS 39
APPENDIX A: DESIGN COMPUTER PROGRAMS 45
APPENDIX B: DIMENSIONS OF THE DESIGN HORNS 47
APPENDIX C: DATA 48
LIST OF REFERENCES 50
INITIAL DISTRIBUTION LIST 51
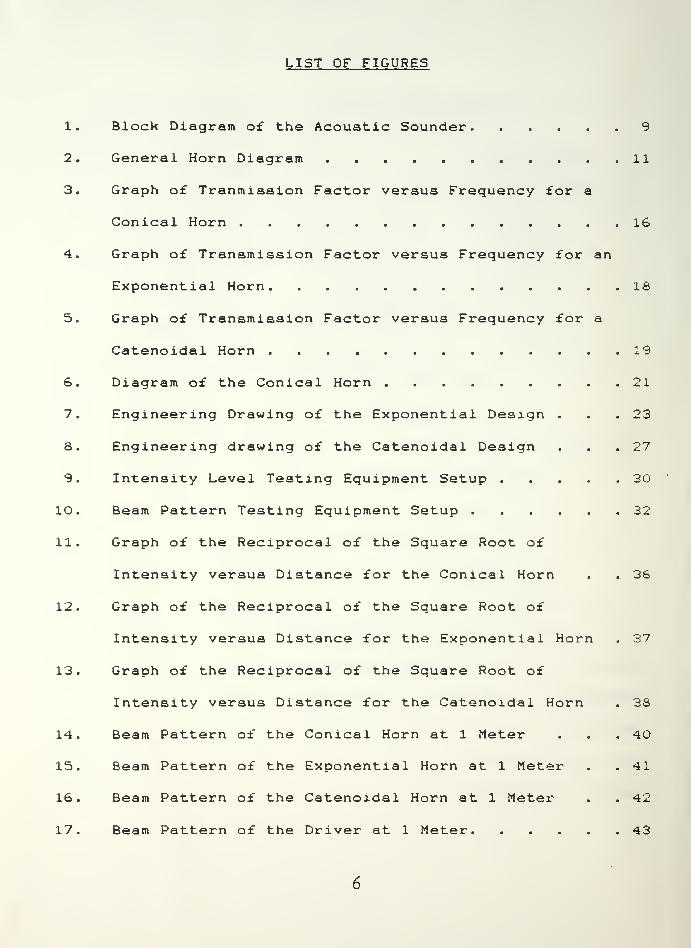
LIST OF FIGURES
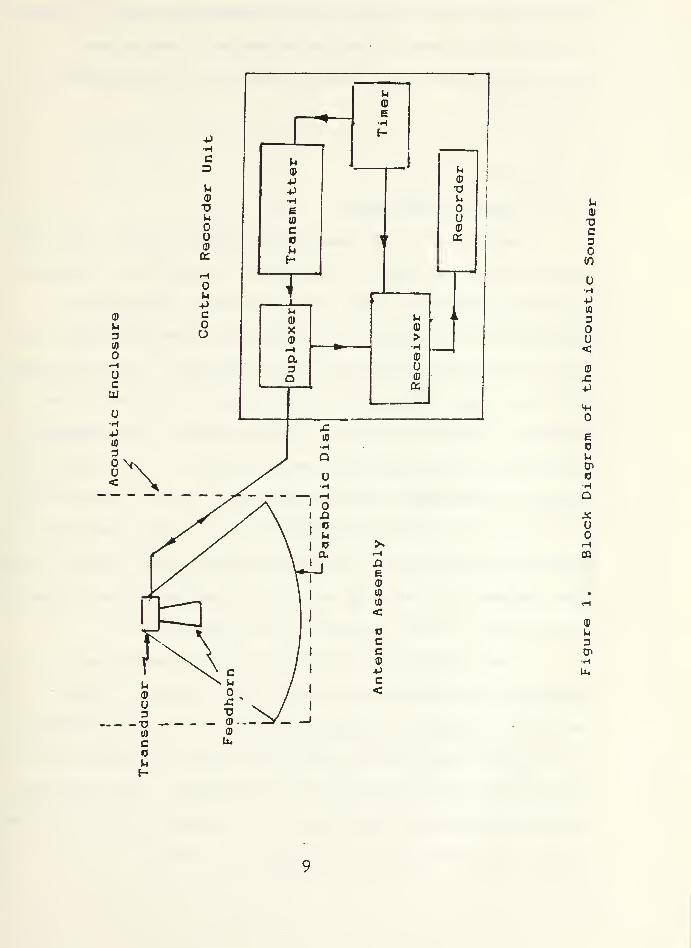
1. Block Diagram of the Acoustic Sounder 9
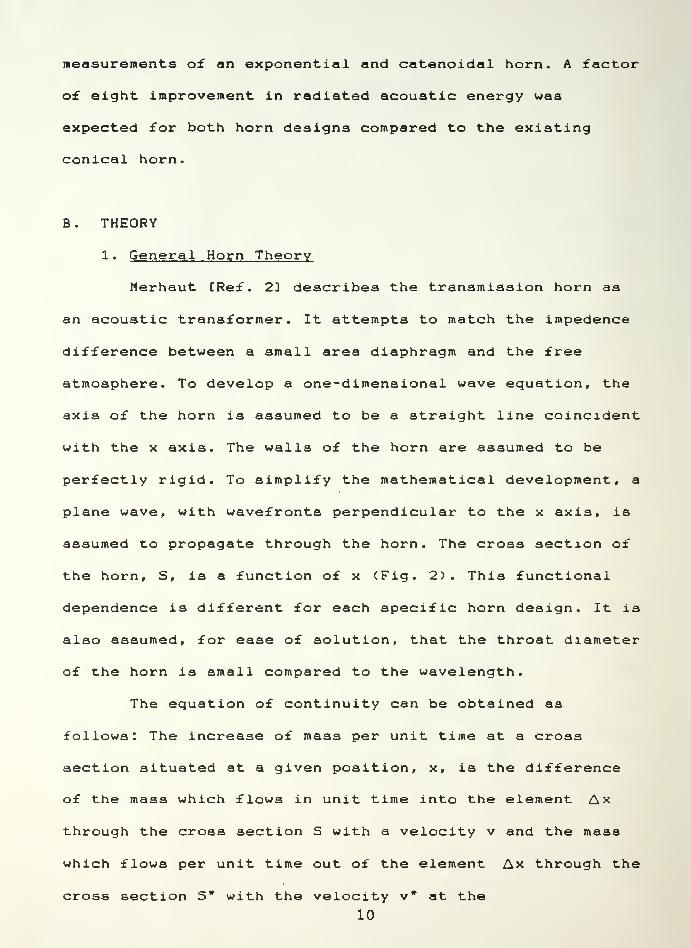
2. General Horn Diagram 11
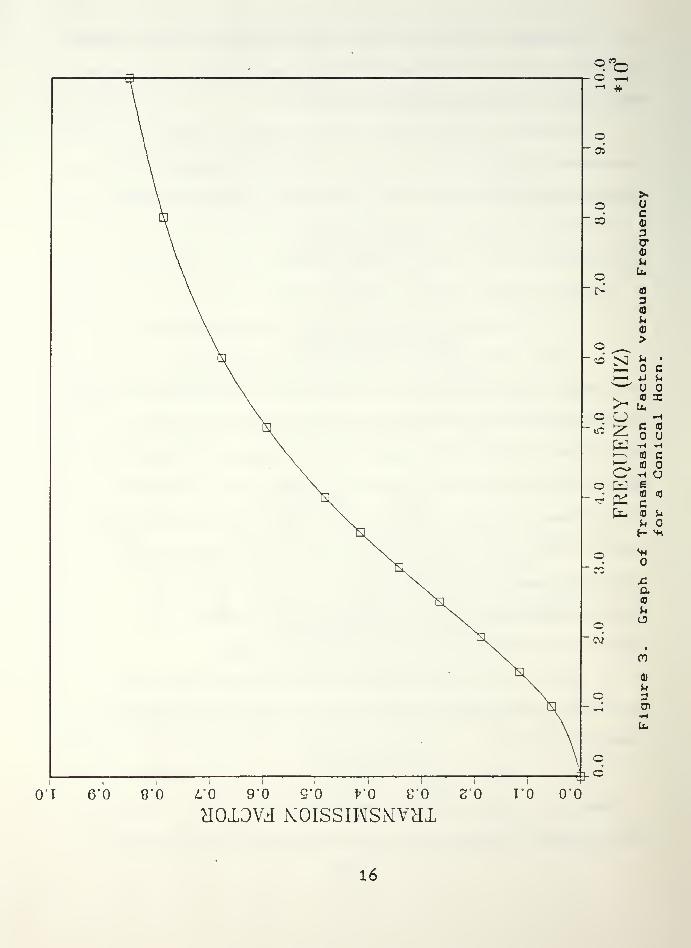
3. Graph of Tranmiaaion Factor versus Frequency for a
Conical Horn 16
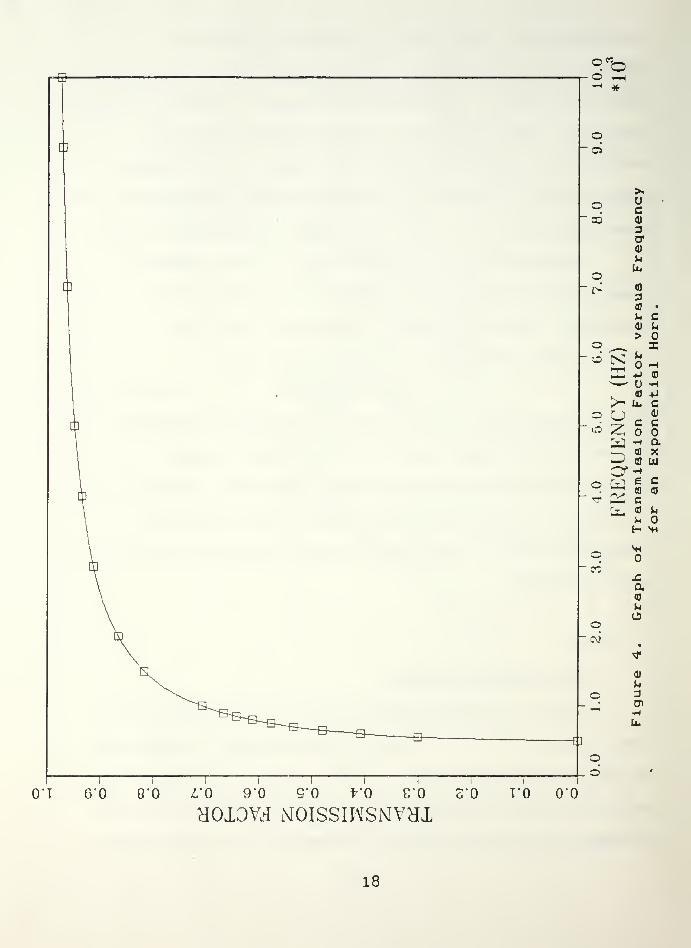
4. Graph of Transmission Factor versus Frequency for an
Exponential Horn 18
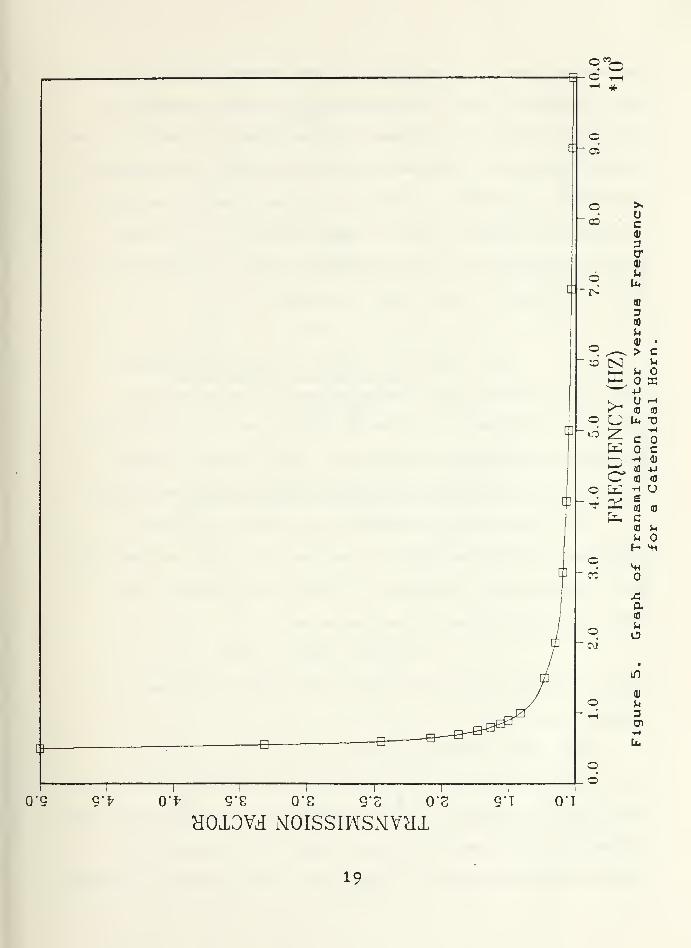
5. Graph of Transmission Factor versus Frequency for a
Catenoidal Horn 19
6. Diagram of the Conical Horn 21
7. Engineering Drawing of the Exponential Design . .23
S. Engineering drawing of the Catenoidal Design ... 27
9. Intensity Level Testing Equipment Setup 30
10. Beam Pattern Testing Equipment Setup 32
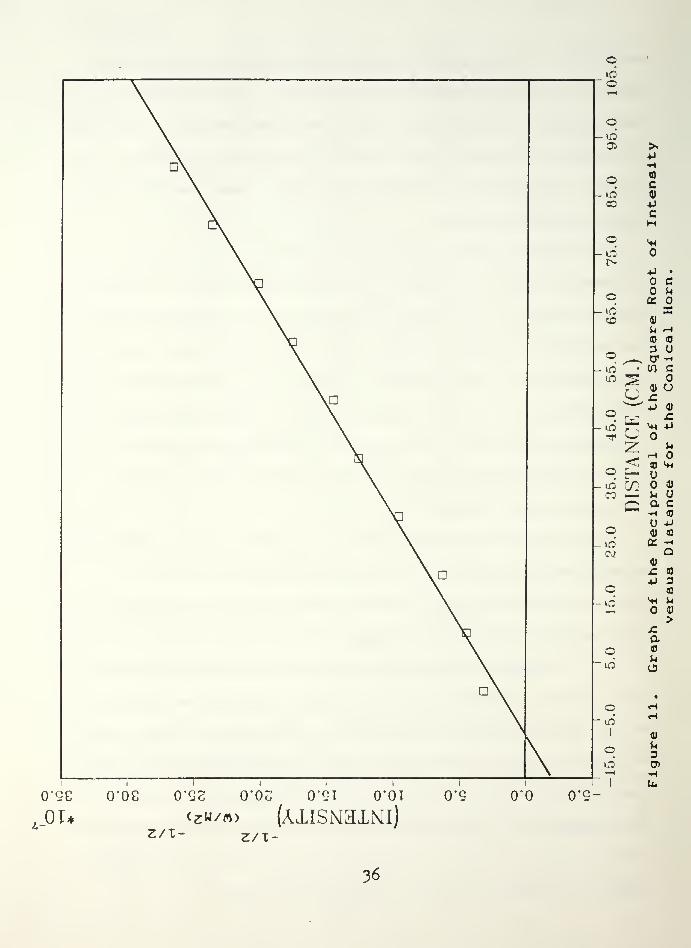
11. Graph of the Reciprocal of the Square Root of
Intensity versus Distance for the Conical Horn . . 36
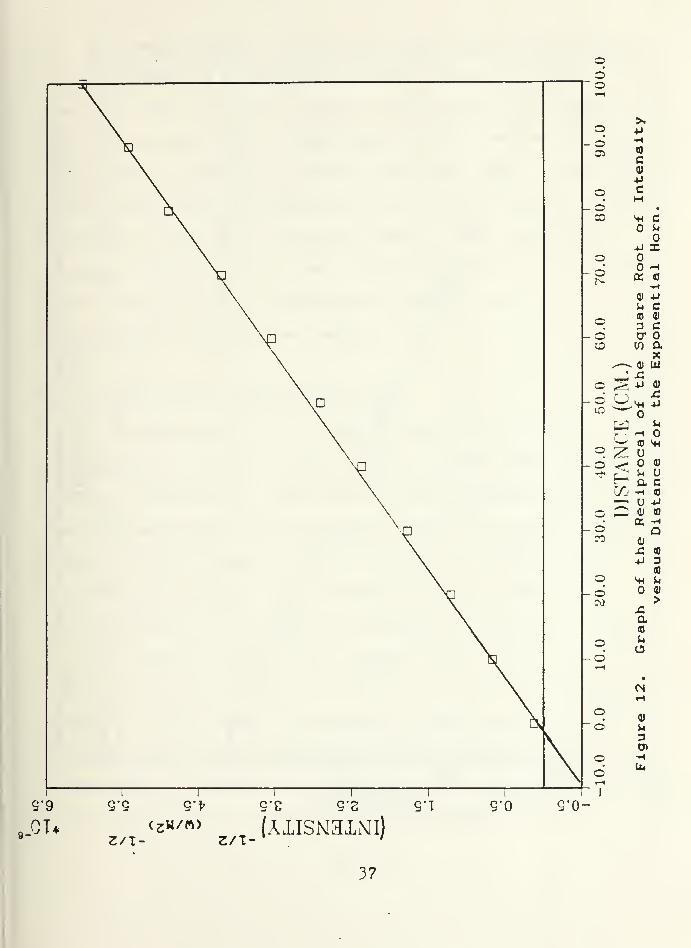
12. Graph of the Reciprocal of the Square Root of
Intensity versus Distance for the Exponential Horn . 37
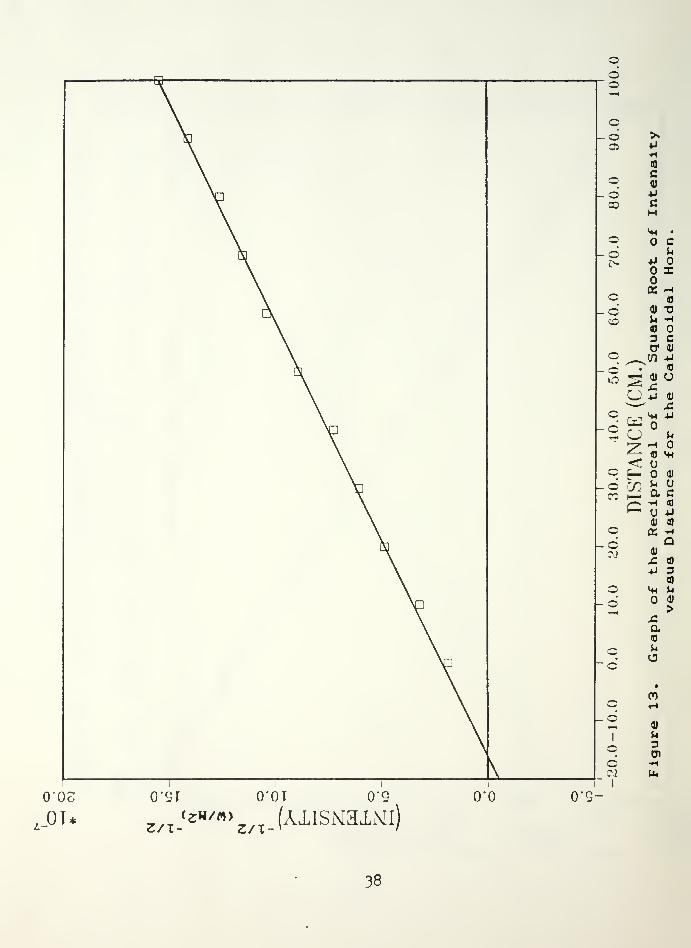
13. Graph of the Reciprocal of the Square Root of
Intensity versus Distance for the Catenoidal Horn . 33
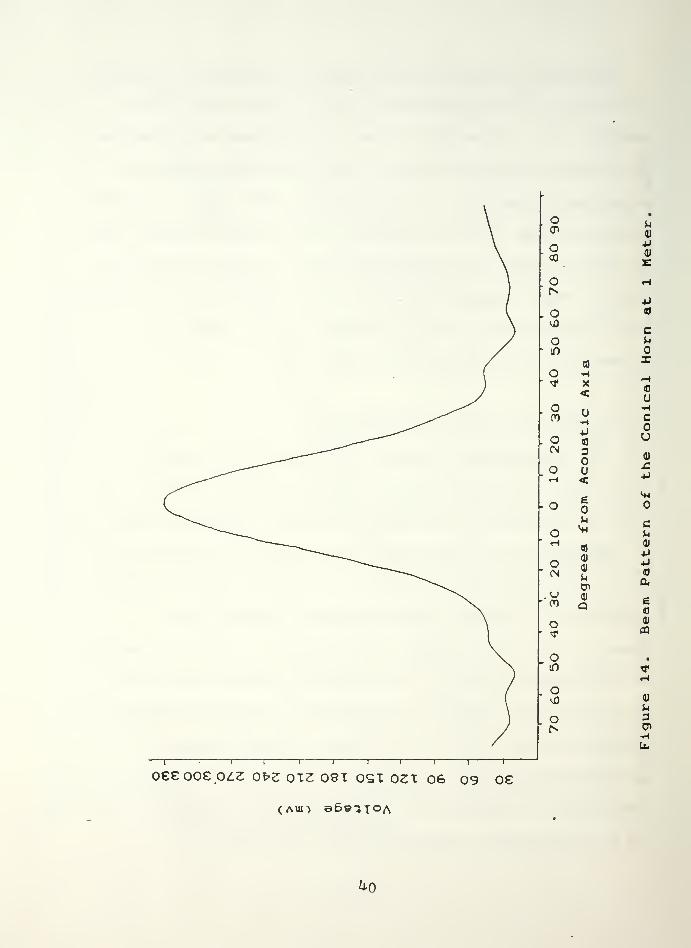
14. Beam Pattern of the Conical Horn at 1 Meter . . . 40
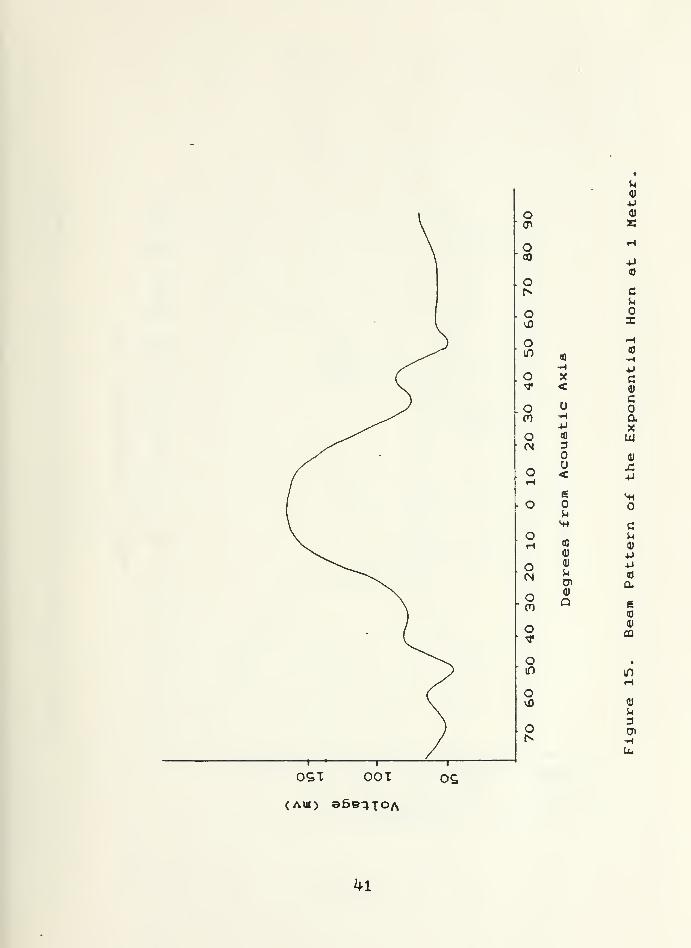
15. Beam Pattern of the Exponential Horn at 1 Meter . . 41
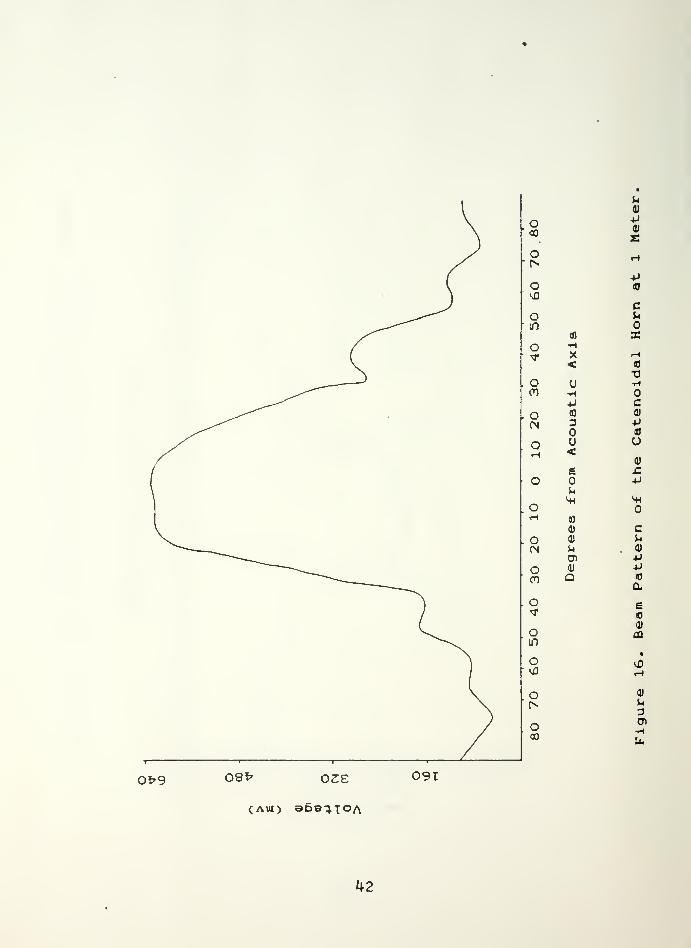
16. Beam Pattern of the Catenoidal Horn at 1 Meter . . 42
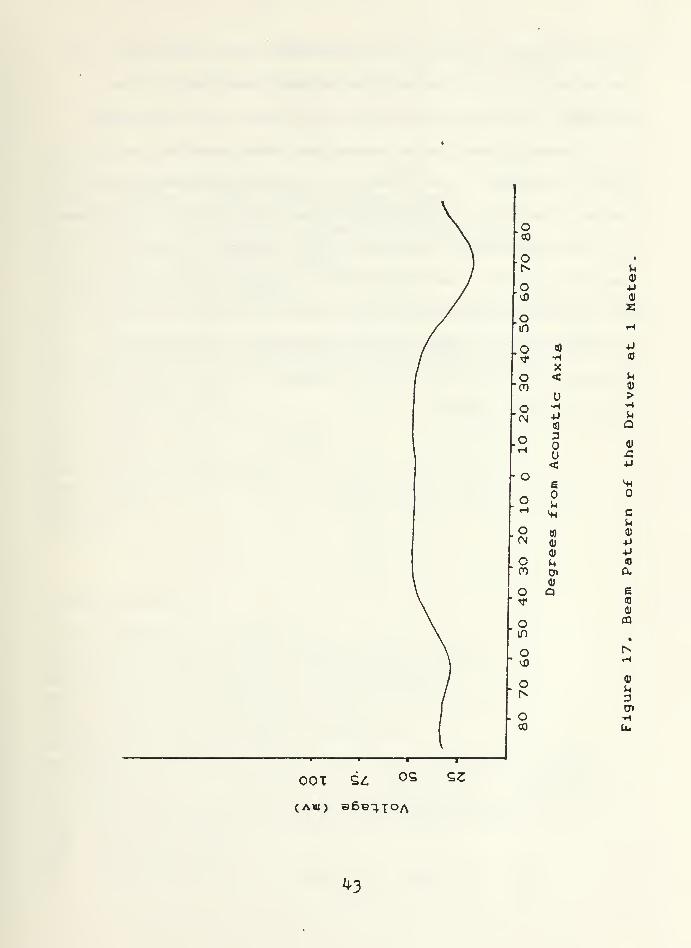
17. Beam Pattern of the Driver at 1 Meter 43
6
I. INTRODUCTION
The application o£ lasers in military communications and
weapons systems accentuate the need for instruments capable
of measuring the fine dynamic structure of the atmosphere.
One of the most useful tools available for the probing of
the atmosphere is the acoustic sounder. Commercial grade
acoustic sounders, such as the Aeroviroment model #300
cannot collect atmospheric data with the quality needed for
laser propagation research. The usable range of the
Aerovironment model #300 acoustic sounder is less than 500
meters. Many laser systems need atmospheric information at
altitudes of 1 to 2 kilometers and higher. The objective of
this thesis was to upgrade an existing acoustic sounder to
increase the range and improve the quality of the
receiver-processor. A serious deficiency of tha
Aerovironment model #300 is the poor coupling of the
acoustic transducer to the feedhorn . This thesis involved a
complete redesign and experimental test of the transducer
feedhorn using two different horn styles as well as making
the horn removable and easily changeable.
II. PROBLEM DESCRIPTION
A. BACKGROUND
The Aerovironment model #300, described in Reference 1,
is an acoustic sounder or acoustic radar. Figure 1 shows the
monostatic device which is used for analyzing the structure
of the atmosphere from a minimum of twenty meters to a
maximum of about five hundred meters above ground level. The
echo returns of interest, produced by turbulent atmospheric
density fluctuations, are recorded on chart paper that
provides a continuous record of the intensity of the echo
returns as a function of height and time. The sounder as
presently configured, can operate over a twenty eight day
period thereby recording long-term atmospheric structure.
The active element in the antenna assembly is the 1.6
kilohertz transducer, which functions as a loudspeaker and
receive antenna. This transducer signal is coupled through a
conical horn to a one meter parabolic dish positioned by
braces so the horn is at the focal point of the dish. It was
suspected that this conical horn could be replaced by a more
efficient design in order to increase the performance of the
system and extend the maximum range to about 1 kilometer.
This thesis research involved the design, fabrication, and
8
h01
TJC3
CO
H*i
(0
3
u<
-P
eo
cr>
c•H
Djs:
u
CD
3
•H
9
measurements of an exponential and catenoidal horn. A factor
of eight improvement in radiated acoustic energy was
expected for both horn designs compared to the existing
conical horn.
B. THEORY
1 . General Horn Theory
Merhaut CRef . 23 describes the transmission horn as
an acoustic transformer. It attempts to match the impedence
difference between a small area diaphragm and the free
atmosphere. To develop a one-dimensional wave equation, the
axis of the horn is assumed to be a straight line coincident
with the x axis. The walls of the horn are assumed to be
perfectly rigid. To simplify the mathematical development, a
plane wave, with wavefronts perpendicular to the x axis, is
assumed to propagate through the horn. The cross section of
the horn, S, is a function of x (Fig. 2). This functional
dependence is different for each specific horn design. It is
also assumed, for ease of solution, that the throat diameter
of the horn is small compared to the wavelength.
The equation of continuity can be obtained aa
follows: The increase of mass per unit time at a cross
section situated at a given position, x, is the difference
of the mass which flows in unit time into the element Ax
through the cross section S with a velocity v and the mass
which flows per unit time out of the element Ax through the
cross section 5* with the velocity v* at the10
E<D
Uen
cu
a:
U
c
a
(N
u301
11
position x Ax. The mass difference is
where Q is the density. In the limit, as Ax approaches zero
lim (Svp a<Svp)OX
. (2)
This mass will cause an increase per unit time of the
density in an element, the volume of which is S dx . Thus
S dx = - 3(Svp) dx0* . (3)
Neglecting the changes of O along x, since they are small
compared with the average value, the equation of continuity
is obtained.
s 3? p B (Sv) «
Ox *" Sx. (4)
This is the equation of continuity for a horn of cross
section that varies as S ~ f(x).
The velocity potential, defined as a scaler that has
its gradient equal to the particle velocity, (grad (T) = v)
can be substituted into Equation 4 above to yield
Ju 3. <s ^0 > - l c)p
s dx dx P, §tOx
Carrying out the partial differentiation of the product in
brackets in Equation 5 gives
Q2 (j> Mds 'd& = - 1 Op0* 2 5 dx Ox P St (6)
Substituting Poisson's equation as the general solution for
12
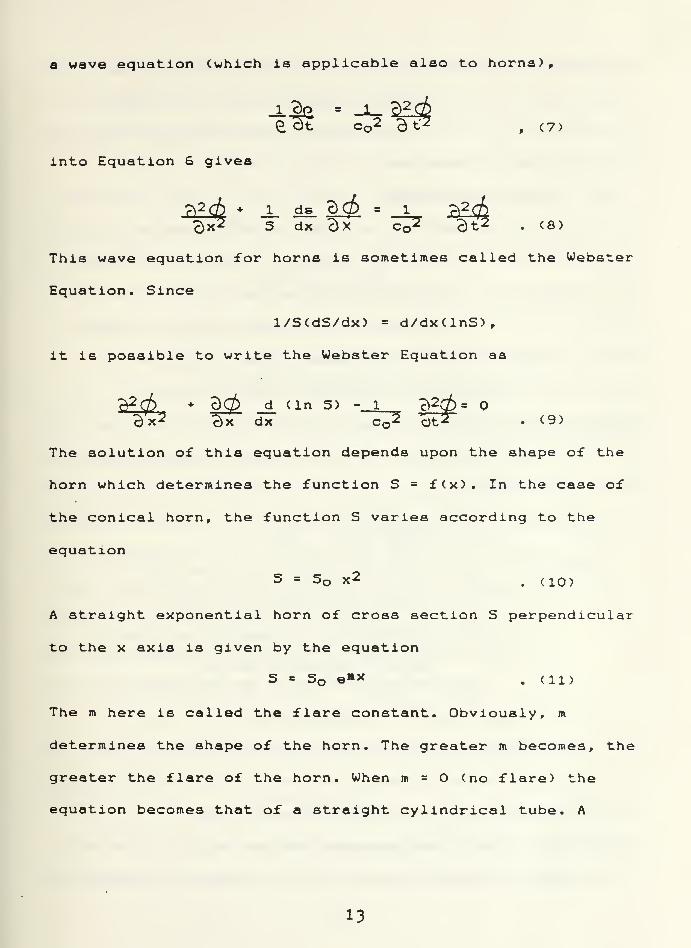
a wave equation Cwhich is applicable also to horns)
,
e at c 2 3 t'2 , (7>
into Equation 6 gives
7)2 <b * _1_ ds o(f> = l 32^Bx2 5 dx c)X c 2 Ot2 . <8>
This wave equation for horns is sometimes called the Webster
Equation. Since
l/S(dS/dx) = d/dx(lnS),
it is possible to write the Webster Equation as
^0 O0 d (In S) - 1 ?2 s
Ox2 c)x dx c 2 dt*=
. <9>'O"
The solution of this equation depends upon the shape of the
horn which determines the function S = f(x). In the case of
the conical horn, the function S varies according to the
equation
5 = 5 x2 . (io)
A straight exponential horn of cross section S perpendicular
to the x axis is given by the equation
S * S e»x . <li)
The m here is called the flare constant. Obviously, m
determines the shape of the horn. The greater m becomes, the
greater the flare of the horn. When m = (no flare) the
equation becomes that of a straight cylindrical tube. A
13
hyperbolic or catenoidal horn is given by the equation
S = S cosh2 <x/h) • < 12)
In Equation 12, h is a scale factor measuring how slowly the
catenoidal horn flares out.
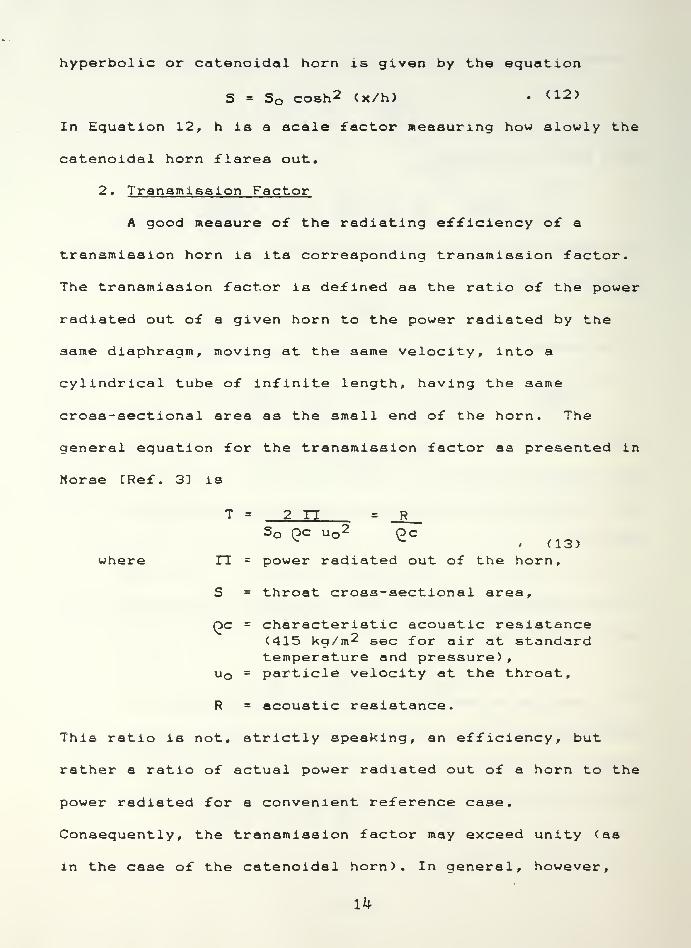
2. Transmission Factor
A good measure of the radiating efficiency of a
transmission horn is its corresponding transmission factor.
The transmission factor is defined as the ratio of the power
radiated out of a given horn to the power radiated by the
same diaphragm, moving at the same velocity, into a
cylindrical tube of infinite length, having the same
cross-sectional area as the small end of the horn. The
general equation for the transmission factor as presented in
Morse CRef. 3] is
T = 2 IT = RS pc u 2 Pcv ^
/ (13)where n = power radiated out of the horn,
S = throat cross-sectional area,
Oc = characteristic acoustic resistance(415 kg/m2 sec for air at standardtemperature and pressure),
u = particle velocity at the throat,
R = acoustic resistance.
This ratio is not, strictly speaking, an efficiency, but
rather a ratio of actual power radiated out of a horn to the
power radiated for a convenient reference case.
Consequently, the transmission factor may exceed unity (as
in the case of the catenoidal horn). In general, however.
the transmission factor varies between zero and one. When it
is small the the diaphragm will have to vibrate with large
amplitude to radiate significant power.
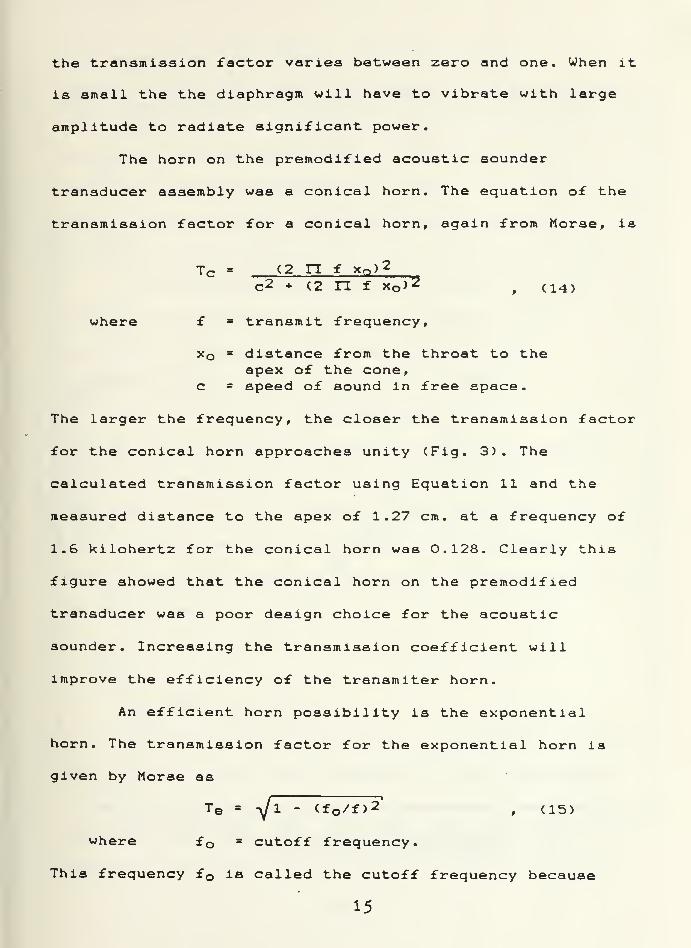
The horn on the premodified acoustic sounder
transducer assembly was a conical horn. The equation of the
transmission factor for a conical horn, again from Morse, is
Tc = (2 n f x ) 2
C2 (2 n f x > 2, (14)
where f = transmit frequency,
xQ = distance from the throat to theapex of the cone,
c = speed of sound in free space.
The larger the frequency, the closer the transmission factor
for the conical horn approaches unity (Fig. 3). The
calculated transmission factor using Equation 11 and the
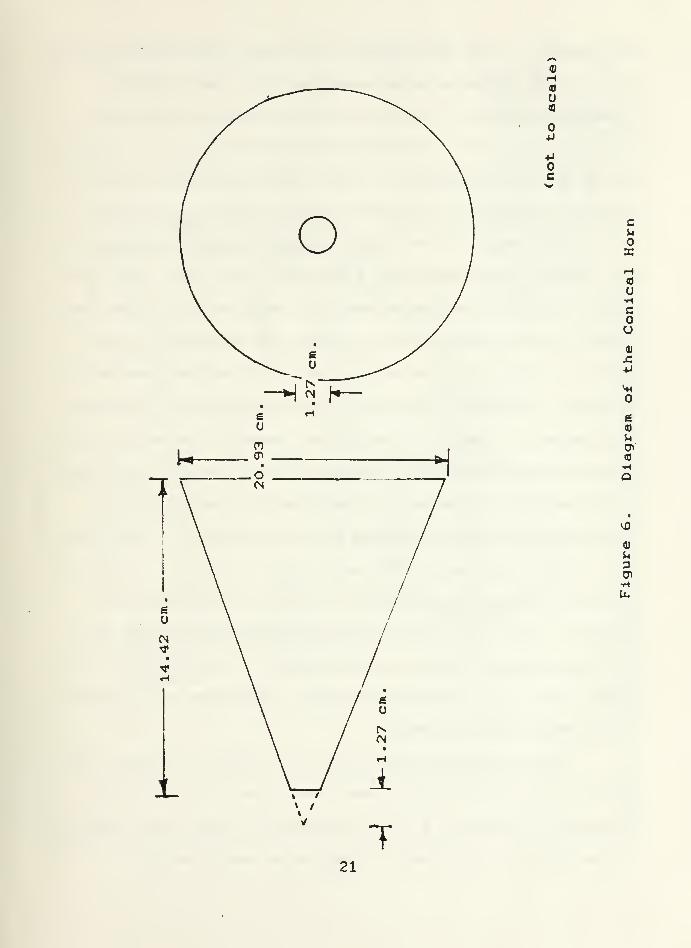
measured distance to the apex of 1.27 cm. at a frequency of
1.6 kilohertz for the conical horn was 0.128. Clearly this
figure showed that the conical horn on the premodified
transducer was a poor design choice for the acoustic
sounder. Increasing the transmission coefficient will
Improve the efficiency of the transmiter horn.
An efficient horn possibility is the exponential
horn. The transmission factor for the exponential horn is
given by Morse as
T© = -^1 - <f /f)2' f (i5>
where f = cutoff frequency.
This frequency f is called the cutoff frequency because
15
O'l 6*0 80 L'Q 90 9*0 t0 COHOIOVJ NOISSIMSMYHI
16
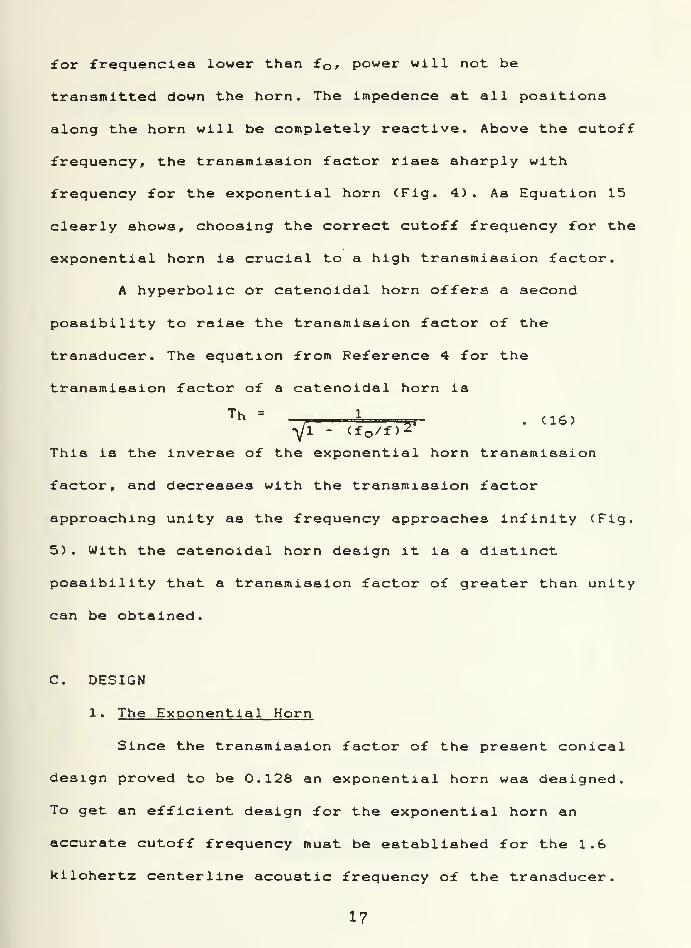
for frequencies lower than fQ » power will not be
transmitted down the horn. The impedence at all positions
along the horn will be completely reactive. Above the cutoff
frequency, the transmission factor rises sharply with
frequency for the exponential horn (Fig. 4). As Equation 15
clearly shows, choosing the correct cutoff frequency for the
exponential horn is crucial to a high transmission factor.
A hyperbolic or catenoidal horn offers a second
possibility to raise the transmission factor of the
transducer. The equation from Reference 4 for the
transmission factor of a catenoidal horn is
Th = 1m (16)
yi - (f /f)2-
This is the inverse of the exponential horn transmission
factor, and decreases with the transmission factor
approaching unity as the frequency approaches infinity (Fig.
5) . With the catenoidal horn design it is a distinct
possibility that a transmission factor of greater than unity
can be obtained.
C. DESIGN
1 . The Exponential Horn
Since the transmission factor of the present conical
design proved to be 0.12S an exponential horn was designed.
To get an efficient design for the exponential horn an
accurate cutoff frequency must be established for the 1.6
kilohertz centerline acoustic frequency of the transducer.
17
O'T L'O 90 S'O tO COHOIOVi NOISSMSNVHI
18
O'f 9'8 O'G 9*g 02H013VJ MOISSMSNVtfl
9'T
19
The easiest way to determine a crude approximation for the
cutoff frequency was to determine the cutoff frequency of
the present conical horn mouth circumference and apply it as
the starting point for the exponential design. The equation
for cutoff frequency is directly derived from the solution
to Webster's equation (Eq. 9) using Equation 11 as the
standard function for the exponential horn. In terms of the
mouth diameter Dm , the cutoff frequency is
f = c /viDm ) (17)
where c = speed of sound in air at standardtemperature and pressure.
Using the conical horn mouth diameter of 20.93 cm, as
detailed in Figure 6, yielded a cutoff frequency of 500 Hz.
The cutoff frequency of 500 Hz was used for all future
calculations including the design of the catenoidal horns.
Once the cutoff frequency was chosen, the next
parameter to be determined in the design of the exponential
horn was the flare constant, m. The flare constant for
exponential horns can be expressed as
m = 4 rr v / cQ . ( IS)
Using the cutoff frequency calculated above the flare
constant is 18.98 m~l.
Now that the design constants were determined the
actual calculation of the dimensions of the exponential horn
could begin. Equation 11 is the determining equation for the
exponential horn family and was used as the basis for a
computer design program for the horn. This program is listed
20
£
<0
(0
M+J
c
cu
X•H(0
uHc
o1)
£
u
41
U3
21
as Appendix A. For good design, the mouth of the horn should
have a circumference large enough so that the radiation
impedence is nearly resistive over the desired frequency
range. In this case, the anticipated doppler due to vertical
motion in the atmosphere is small, plus or minus 20 Hz at
1600 Hz. According to Beranek CRef . 5] , this is true when
the circumference of the mouth divided by the wavelength of
the lowest transmitted wave is greater than one. Using this
rule, the length of the exponential horn can be determined.
Using the wavelength of the transmitted frequency, namely
20.69 cm. as a limiting value, the corresponding length (x)
is 18 cm. Therefore, the horn must be greater than eighteen
centimeters in length to match the impedence correctly. For
ease of manufacture, the exponential horn length was chosen
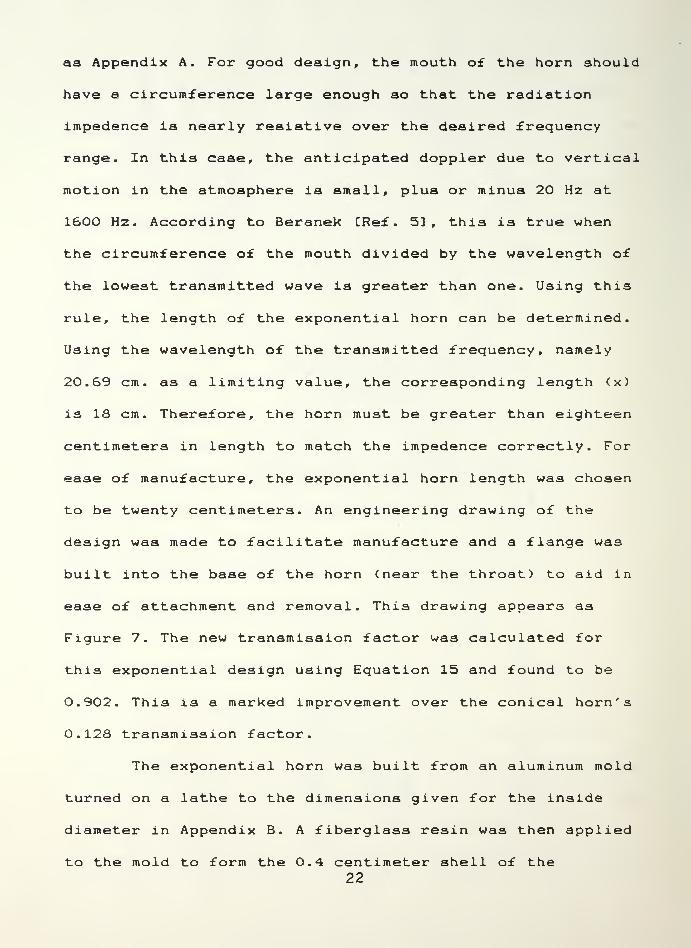
to be twenty centimeters. An engineering drawing of the
design was made to facilitate manufacture and a flange was
built into the base of the horn (near the throat) to aid in
ease of attachment and removal. This drawing appears as
Figure 7. The new transmission factor was calculated for
this exponential design using Equation 15 and found to be
0.902. This is a marked improvement over the conical horn's
0.128 transmission factor.
The exponential horn was built from an aluminum mold
turned on a lathe to the dimensions given for the inside
diameter in Appendix B. A fiberglass resin was then applied
to the mold to form the 0.4 centimeter shell of the22
23
exponential horn. The material from which the horn is
constructed is very important. If the side walls of the horn
resonate mechanically at one or more frequencies in the
range of operation a "dip" in the power curve (and hence a
loss in the transmission factor) will occur. Undamped thin
metal, such as aluminum, is the least desirable material
because the horn will resonate at moderate frequencies such
as the 1.6 kilohertz frequency of this transducer. .Heavy
metals, covered on the outside with a thick mastic material
so that the mechanical resonances are damped, are much
better, but are difficult to manufacture. Fiberglass was
chosen as the most acceptable compromise to the problem of
ease of manufacture versus horn mechanical resonance.
2. The Catenoidal Horn
Another design choice in the attempt to raise the
transmission factor of the transducer feedhorn is the
catenoidal or hyperbolic design. There are two definite
advantages to the catenoidal horn design. First, the
transmission factor can be raised to a level greater than
one (as it was in this design) , and second the catenoid
design approaches a perfect cylindrical tube at the throat.
This allows one to tune the resonate frequency of the horn
if it is significant by adjusting the length of this
cylidrical section.
2h
Again, as in the exponential design, the catenoidal
horn requires a careful choice of the cutoff frequency. The
solution to Webster's equation (Eq. 9) using Equation 12 as
the standard function for a hyperbolic horn yields a cutoff
frequency remarkably close to 500 Hz. While the cutoff
frequency of the catenoidal family is usually slightly
higher than the corresponding exponential design, 500 Hz was
kept as the baseline cutoff frequency.
The next parameter to be chosen in the design is the
hyperbolic flare constant, h. The hyperbolic flare constant
can be expressed as
h = c / (2 irf > . (19)
Using the cutoff frequency of 500 Hz and the speed of sound
at standard temperature and pressure as 331.6 m/s, the
hyperbolic flare constant is 0.1054 m~l.
With the design components chosen, the calculation of
the dimensions of the catenoidal horn could now be made.
Again, as in the exponential design, a computer design
program, introduced as Appendix A, was written to aid in the
calculation of the inner wall dimensions of the horn.
Equation 12 was used as the basis of this computer program
with the hyperbolic function converted to its exponential
analog for programming ease. The differences between the
hyperbolic and exponential functions are so small that the
0.01 centimeter machining accuracy of the milling lathe
producing the horn mold was the primary uncertainty. To
25
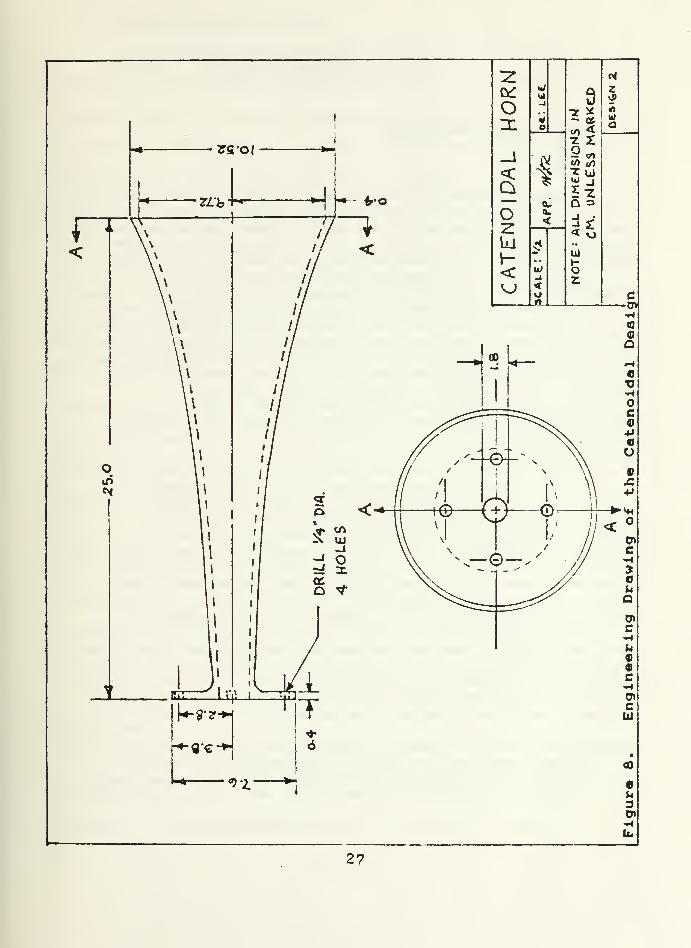
maximize the horn resonance an odd quarter wavelength
multiple was chosen. Since the wavelength of the 1.6
kilohertz frequency is 20.69 centimeters, a length of 5/4 of
a wavelength was chosen. This distance (x> from the throat
is 25.86 centimeters which was rounded to 25 centimeters for
ease in manufacture of the mold. As in the case of the
exponential horn, an engineering drawing was made of the
design and appears as Figure 8. To aid in the attachment and
removal of the horn, a flange was designed into the throat
of the horn. The transmission factor for this catenoidal
horn using Equation 16 was found to be a design 1.052. The
design efficiency is a full eight times greater than the
0.128 transmission factor of the existing conical horn.
The catenoidal horn was constructed in a manner
similar to the exponential horn. An aluminum mold was
crafted on a machining lathe from the dimensions in Appendix
B. Next a layer of gel coat was applied over a silicon mold
release onto which the fiberglass resin was formed. The
resulting 0.4 centimeter thick fiberglass horn was found to
be rigid and quite non-resonating.
26
III. TESTING AND RESULTS
A. EXPERIMENTAL PROCEDURE
1 . General
After completion of the design and manufacture of the
two test horns, the next step was to test the acoustic
output to see if the designs achieved their theoretical
expectations. To utilize the horns with a parabolic antenna
it was necessary to find the acoustic focal point of each,
test their power output, determine the corresponding beam
patterns, and finally, compare the new design
characteristics with the original conical horn output
characteristics
.
Since there is active and continuing research on
various acoustic propagation projects at the Naval
Postgraduate School, much of the testing equipment for this
experiment was readily available. Each experiment was
conducted in the anechoic chamber in the basement of
Spanagel Hall to reduce the ambient background noise. The
exponential, catenoidal, and conical horns as well as the
driver itself were tested. The same driver for each horn
design was used. The bare driver, with no horn attached, was
also tested to be used as the control for the experiment.
28
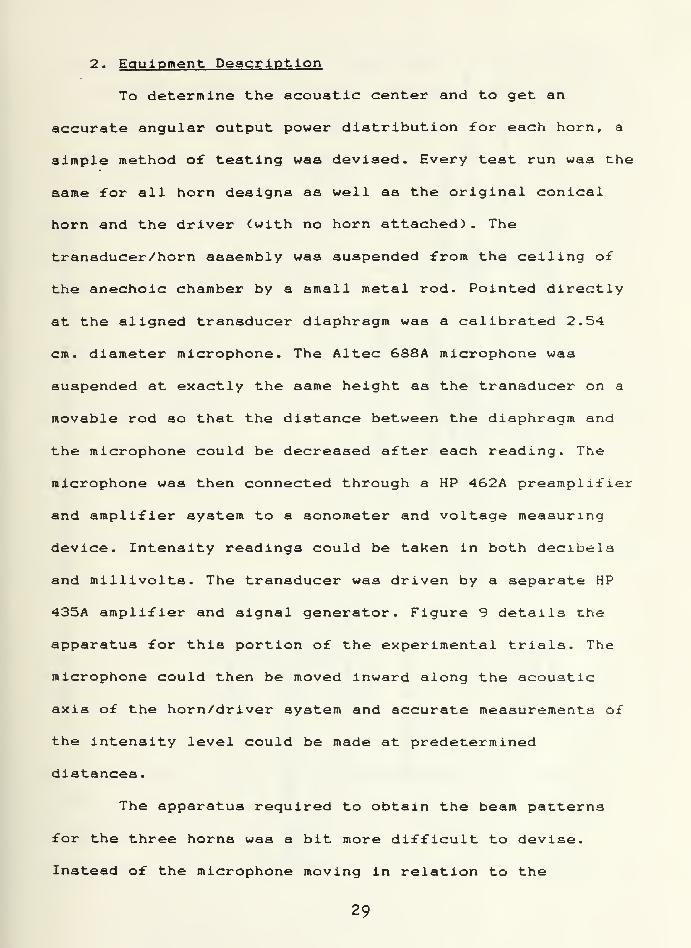
2. Equipment Description
To determine the acoustic center and to get an
accurate angular output power distribution for each horn, a
simple method of testing was devised. Every test run was the
same for all horn designs as well as the original conical
horn and the driver (with no horn attached) . The
transducer/horn assembly was suspended from the ceiling of
the anechoic chamber by a small metal rod. Pointed directly
at the aligned transducer diaphragm was a calibrated 2.54
cm. diameter microphone. The Altec 688A microphone was
suspended at exactly the same height as the transducer on a
movable rod so that the distance between the diaphragm and
the microphone could be decreased after each reading. The
microphone was then connected through a HP 462A preamplifier
and amplifier system to a sonometer and voltage measuring
device. Intensity readings could be taken in both decibels
and millivolts. The transducer was driven by a separate HP
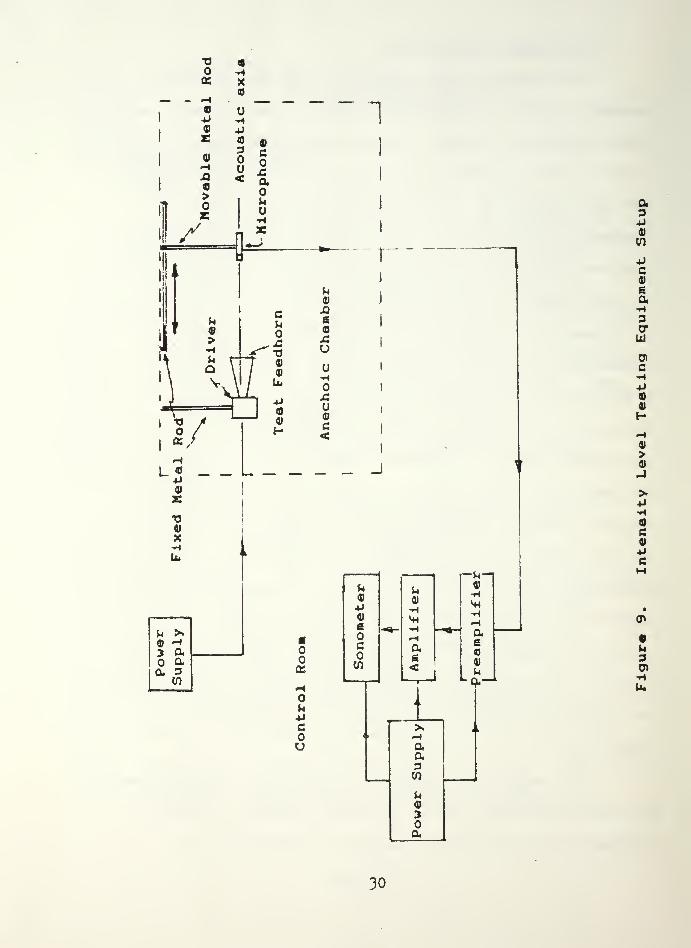
435A amplifier and signal generator. Figure 9 details the
apparatus for this portion of the experimental trials. The
microphone could then be moved inward along the acoustic
axis of the horn/driver system and accurate measurements of
the intensity level could be made at predetermined
distances.
The apparatus required to obtain the beam patterns
for the three horns was a bit more difficult to devise.
Instead of the microphone moving in relation to the
29
r
>
1
3
<
/
c
ao><
u
§
1
av
VOS/I
L«
c
•o
Lb
4J
a>
(4
JQ
£
o
u
c<
J*•
£TJai
X•Hu.
fc >.
<D ~4y cu
o o.
a 3in
a:
ou*i
c
u9+l
e
QH
^Ha6
4)
U
c
en
a
.
^ ,
>. - k
i ,
aa3cn
h
3
a
0,3U<n
C
6a3cru01
c
H
>
>
c
*i
cM
u30»
30
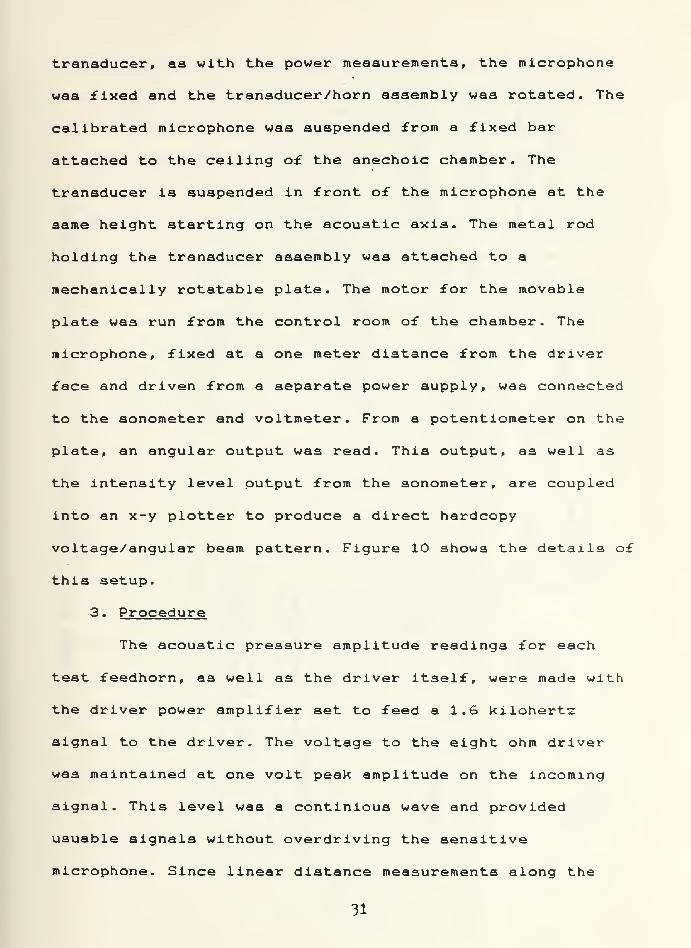
transducer, as with the power measurements, the microphone
waa fixed and the transducer/horn assembly was rotated. The
calibrated microphone was suspended from a fixed bar
attached to the ceiling of the anechoic chamber. The
transducer is suspended in front of the microphone at the
same height starting on the acoustic axis. The metal rod
holding the transducer assembly was attached to a
mechanically rotatable plate. The motor for the movable
plate was run from the control room of the chamber. The
microphone, fixed at a one meter distance from the driver
face and driven from a separate power supply, was connected
to the sonometer and voltmeter. From a potentiometer on the
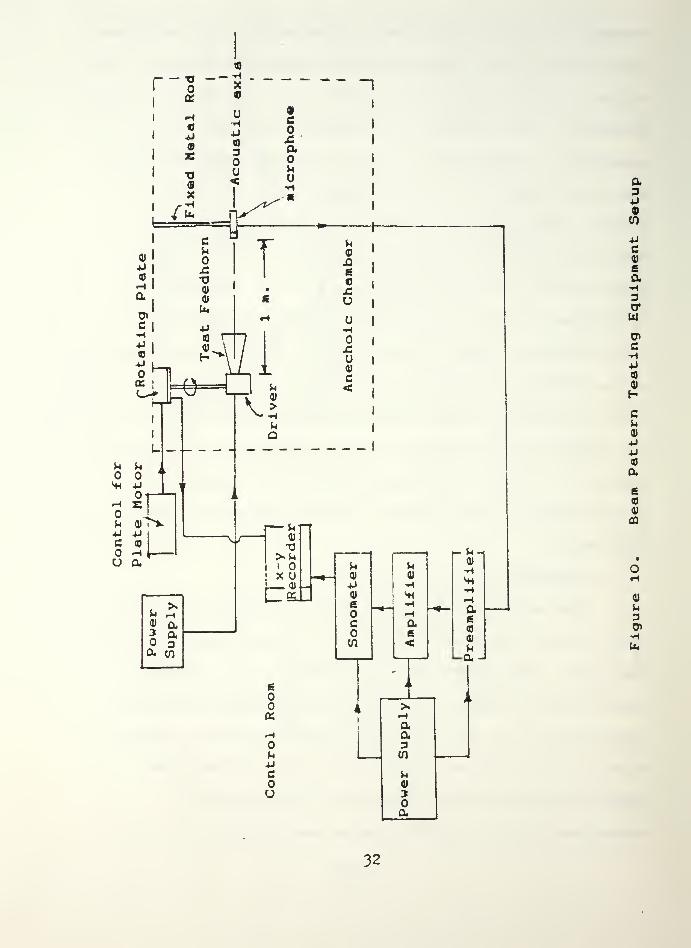
plate, an angular output was read. This output, as well as
the intensity level output from the sonometer, are coupled
into an x-y plotter to produce a direct hardcopy
voltage/angular beam pattern. Figure 10 shows the details of
this setup.
3. Procedure
The acoustic pressure amplitude readings for each
test feedhorn, as well as the driver itself, were made with
the driver power amplifier set to feed a 1.6 kilohertz
signal to the driver. The voltage to the eight ohm driver
was maintained at one volt peak amplitude on the incoming
signal. This level was a continious wave and provided
usuable signals without overdriving the sensitive
microphone. Since linear distance measurements along the
31
u
u4-1
c
o
a34J
CO
4J
c01
£a3eruu
u>c
«0)
HCu01
aj
£
01
CQ
Power
Supply
01
u3<7>
32
acoustic axis were difficult, if not impossible, to measure
from the diaphragm itself it was determined that the easiest
way to derive an accurate measurement was to make all
distance readings from a plane incident to the mouth of each
horn. The sonometer and amplifiers were run from 110 vac
current. The reference intensity level for all readings was
the standard atmospheric 10~12 watt/meter^.
Measurements were taken starting at one meter from the mouth
of each test horn decreasing at ten centimeter increments
until a plane incident with the horn was reached.
To get an accurate antenna beam pattern for each horn
the driver was fed the same 1.6 kilohertz, 1 volt peak
amplitude signal. The microphone was positioned at a fixed
one meter distance from the driver face. Each horn was
attached to the driver mounted on the movable plate. The
sweep rate of the plate was set to coincide with 10 degrees
of arc for every one half inch on the x axis of the graph
and fed to the x input of the x-y recorder. The
sonometer/amplifier system provided the y axis imput to the
x-y recorder. The acoustic axis of the horn was determined
by sweeping the driver through several degrees of arc and
watching for the maximum intensity level reading on the
sonometer. Once centerline was determined the horn driver
systems were rotated through 360 degrees and a beam pattern
was obtained for each horn.
33
B. RESULTS
From the data obtained during the intensity
measurements, it was clear the new designs were not as
efficient as the theory predicted, but that the catenoidal
design was a clear improvement over the conical horn. The
peak intensity of the conical horn at the one meter point
was -8.0 dB while the peak intensity of the exponential horn
was a disappointing -13.8 dB . A partial explanation for the
low efficiency may lie in the fact that the throat size of
the exponential horn was designed to match the throat size
of the conical horn. This throat size, 1.27 centimeters,
does not take full advantage of the driver's 1.8 centimeter
available aperture. The coupling of the horn to the driver
may have been another souce of low efficiency. Unless exact
rigid mating of horn to driver face occurs, the overpressure
caused by the sound wave propagation will leak through the
irregularities of the interface. This problem was corrected
in the catenoidal horn by placement of a rubber interface or
gasket between the flange and driver face and securely
anchoring it to the driver casing. The exponential horn
fabrication process however provided some valuable
information in the preparation of the catenoidal horn.
Working with the exponential aluminum mold and getting the
fiberglass to release from it was a difficult problem that
was eventually solved only by the cutting of the shell and
remating after the mold was removed. Of course, the seam
3^
where the cut was made had to be delicately repaired. Any
deviations in the inner face of the horn could cause
reflections or interfering sound waves and reduce
efficiency. The need for a gasket interface to prevent
leakage was probably the most important lesson gained from
the exponential design.
The catenoidal design proved much better, raising the
intensity level to -1.1 dB at the one meter point. This is
about a five fold increase in intensity for the catenoidal
design over the conical horn. The catenoidal design takes
full advantage of the larger opening in the driver and was
designed with a 1.8 cm. throat diameter rather than the 1.27
cm. throat diameter of the conical and exponential designs.
It also contains the rubber gasket that prevents a leak at
the driver-horn interface.
To obtain the acoustic center for each horn, a graph was
constructed plotting the inverse square root of the
intensity against the distance. Since intensity is known to
decrease with the inverse square root of the distance in the
far field CRef.63, these graphs can predict the point where
the intensity approaches zero. This x intercept on the graph
is the acoustic center of the horn. The graphs, which appear
as Figures 11 through 13, show that the acoustic center of
the conical design is S centimeters from the driver face.
The exponential horn has an acoustic center 18.5 centimeters
from the driver face and the catenoidal horn has an acoustic
center 9.5 centimeters from the acoustic face.35
\ao*~*
©lO05
O ciO 4)
00 4-1
CM
o Vl
iOi>
cUo
CClO XCO 0)
3 Uo, „ cr -h
iO • en ctO
4J HI
a •* 4J
Tf u<
u-i
a) ^o —
«
UiO rr <D
CO k U
Q a cH <8
U 4Jo 0) a]
iO a: -»
C\2 a
+J 3— 03
irt ^ fc
OJ
>
ao <0
id a
o•
r-t
r-i10
l
o (4
3id 0)
(T9£ 0'0S 0'92 0"0o 091 (TOT
01* <3«/ft) (AXISNaiNl)
0*9 O'O 0*9-
L- 3/1- 3/1-
36
9-
S901.
oooH
>*o +>
o •h
05 8)
c
O cHt
d •
CO
t
ofHorn
od
re
Ro
ntial
o <0 <D
3 Co cr
CD co aUJ
C s 4J 0)
£Oo
a (4
Ho ID ^o a^ Uo ^-* <U
^ H u ua. c
C/J -h 03«—
<
U 4J
o <«~>UJ 0}
a. -hd aCO
j= eo
+J 3COo ^ U
o QJ
C\2 >
a
o u
- o
od
(N
41
u3
od
I
g-g
3
9*0-
<sH/tt > (AIISMaiMl)/T- Z/T- '
37
cII
c
*i
u<0
3O*
W
<—
oc01
+1
OJ u4J fl)
H
U
ua
u4!
a:
ai
r.*i
£.a<o
a
en
4)
301
O'Oo
L-OT:
o*sr
^
(TOT Q'9 0*0
<£«/*>/T _(AlISi\I3INl)
0*9-
38
The beam patterns, which appear as Figures 14 through
17, provide some interesting results. The conical beam
pattern (Fig. 14) shows two small side lobes at 40 degrees
on either side of the central peak. These sidelobes peak at
less than 15 percent of the mainlobe amplitude. In contrast
the side lobes on the exponential and conical designs (Figs.
15 and 16) show more pronounced peaks in the same angular
region. These sidelobes peak at 25 to 40 percent of the main
lobe. Clearly this is undesirable CRef. 73, but is a
trade-off of the improved designs.
C. CONCLUSIONS AND RECOMMENDATIONS
The replacement of the conical horn with a high
efficiency catenoidal design was the ultimate goal of this
thesis. Theoretical transmission factors suggested that both
an exponential and catenoidal horn should have about eight
times the efficiency of the conical horn. A thirty percent
decrease in intensity was observed in testing the
exponential horn. This was attributable to the side leakage
of the pressure wave by the improper mating of the horn to
the driver face. Another explanation is that the exponential
design did not take full advantage of the available 1.8 cm.
driver aperture. The catenoidal horn had an intensity
increase of 5 compared to the conical horn although a factor
of 8 was expected. Considering the difficulty of
39
o u<n
0)
oCO
01
o «HCN
+J
o Q•n
co um
(0X
oX<
CJ
o -w
en
o
c
u
O3
u<
01
+1
o £
oSi c
u1-1
ou
01
4J
<N
01
ao 0)
O •
m
oVJD 01
Uo 3IN 01
oeeooe oz.z o*2 013 osx ost ozt 06 09 oe
^0
o<r>
oCO
or>
oV0
o10 «
•H
o Xv <
oen -H
+J
o <0
(N 3
uo <1-i
aO
hm
o1-1 03
01
o (U
N u
OCO
0)
a
OtT
om
o<D
oN
u
-IJ
01
+J
c
X
(0
•H+J
cai
c
axtu
4)
JS
Vi
c
0)
+J+J
a6(0
mCQ
in
0)
3
u.
OST OOT-i—OS
M
o00
o
o'XI
oin
o
oen
o(N
O
o
o<N
Oen
o*r
oin
o"XI
o
oCO
<
<n
3
u<£
^1
0)
m<u
u
a)
a
(0
c
X
a
c<D
u
o
c
a
Ca)
tf
0)
3
0^9 09* 0Z£ 09T
(Aui) b6bt.x°A
k2
o"00
.O •
tN01
P'JD 01
Om 1-1
0) -U
*X
a)
< U00 01
u >•H H
(N -IJ ^(0 a3
u11
< +j
O£ "+i
OtH * c
uO 0} o>CM
01 +j
ai +j
O b (0
00 01 a
O a £rr to
4)
03
m•
Is-
vfl«-i
01
3
•h00 u.
OOT S£ os s^
*3
manufacturing a smooth catenoidal horn from fiberglass, and
the simplicity of the one dimensional horn theory, the
measured improvement is in good agreement with the theory.
Even with the larger sidelobes discovered by beam
pattern analysis, the catenoidal horn is recommended to
replace the existing conical design. The five fold increase
in output intensity is surely reason enough to use the
upgraded design. The significant increase of intensity
should extend the useable range of the sounder if the
sidelobes can be adequately suppressed by the acoustic
enclosure and will provide a important step in improving the
range of the sounder.
44
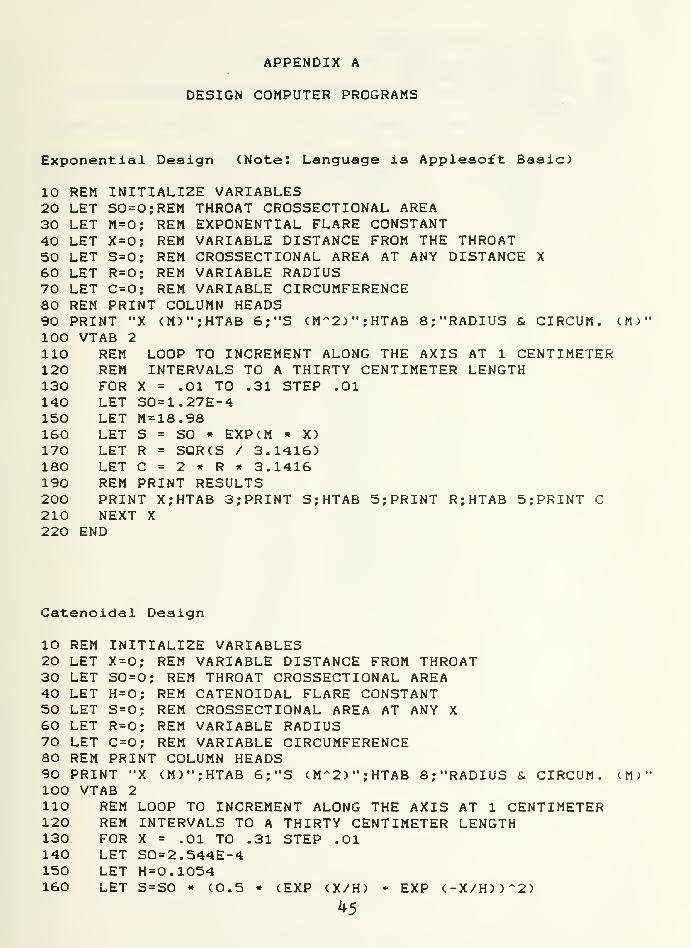
APPENDIX A
DESIGN COMPUTER PROGRAMS
Exponential Design (Note: Language is Applesoft Basic)
10 REM INITIALIZE VARIABLES20 LET S0=0;REM THROAT CROSSECTIONAL AREA30 LET M=0; REM EXPONENTIAL FLARE CONSTANT40 LET X=0; REM VARIABLE DISTANCE FROM THE THROAT50 LET S=0; REM CROSSECTIONAL AREA AT ANY DISTANCE X
60 LET R = 0; REM VARIABLE RADIUS70 LET C=0; REM VARIABLE CIRCUMFERENCE80 REM PRINT COLUMN HEADS90 PRINT "X <M)";HTAB 6;"S (M~2)";HTAB 8;"RADIUS & CIRCUM. CM)"100 VTAB 2
110 REM LOOP TO INCREMENT ALONG THE AXIS AT 1 CENTIMETER120 REM INTERVALS TO A THIRTY CENTIMETER LENGTH130 FOR X = .01 TO .31 STEP .01140 LET S0=1.27E-4150 LET M=18.98160 LET S = SO * EXP(M * X)170 LET R = SQR(S / 3.1416)ISO LET C = 2 * R » 3.1416190 REM PRINT RESULTS200 PRINT X;HTAB 3;PRINT S;HTAB 5;PRINT R;HTAB 5;PRINT C210 NEXT X
220 END
Catenoidal Design
10 REM INITIALIZE VARIABLES20 LET X=0; REM VARIABLE DISTANCE FROM THROAT30 LET S0=0; REM THROAT CROSSECTIONAL AREA40 LET H=0; REM CATENOIDAL FLARE CONSTANT50 LET S=0; REM CROSSECTIONAL AREA AT ANY X60 LET R=0; REM VARIABLE RADIUS70 LET C=0; REM VARIABLE CIRCUMFERENCE80 REM PRINT COLUMN HEADS90 PRINT "X (M)";HTAB 6;"S (M~2)";HTAB 8;"RADIUS & CIRCUM. (Mr 1
100 VTAB 2
110 REM LOOP TO INCREMENT ALONG THE AXIS AT 1 CENTIMETER120 REM INTERVALS TO A THIRTY CENTIMETER LENGTH130 FOR X = .01 TO .31 STEP .01140 LET S0=2.544E-4150 LET H=0.1054160 LET S=SO « (0.5 » (EXP (X/H) + EXP (-X/H))~2)
^5
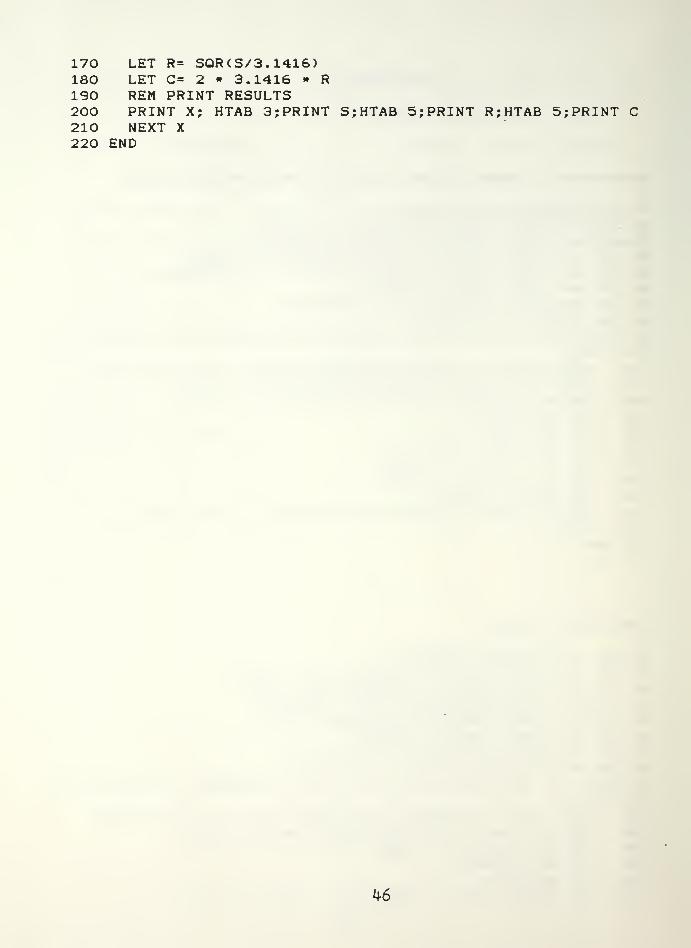
170 LET R = SQR(S/3.1416)180 LET C= 2 » 3.1416 * R190 REM PRINT RESULTS200 PRINT X; HTAB 3;PRINT S;HTAB 5;PRINT R;HTAB 5;PRINT C210 NEXT X220 END
Ur6
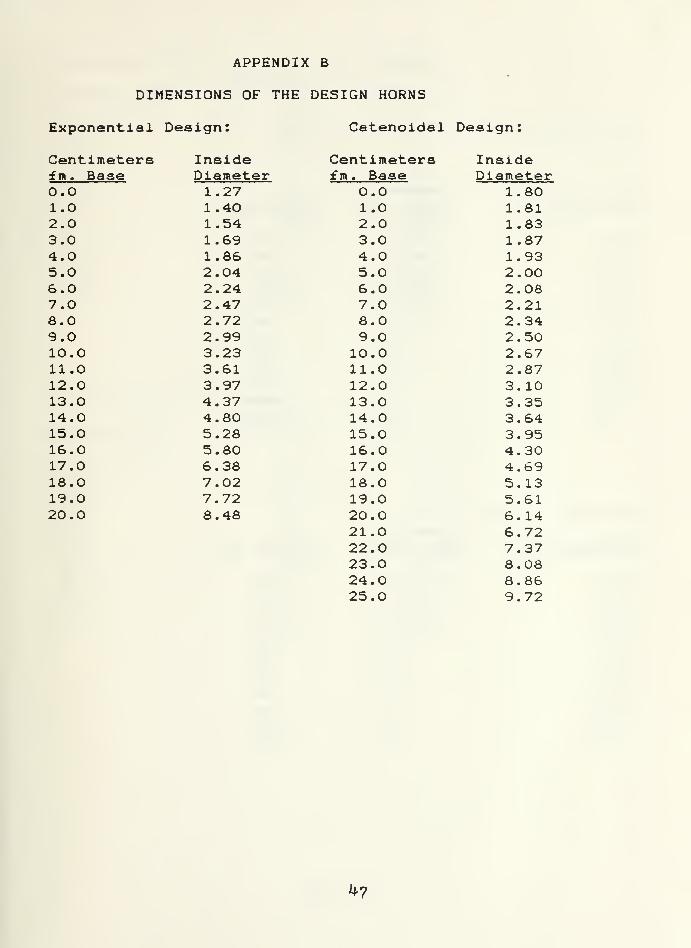
APPENDIX B
DIMENSIONS OF THE DESIGN HORNS
Exponential Design: Catenoidal Design:
Centimeters Inside Centimeters Insidefra. Base Diameter fm . Base Diameter0.0 1.27 0.0 1.801.0 1.40 1.0 1.812.0 1.54 2.0 1.833.0 1.69 3.0 1.874.0 1.86 4.0 1.935.0 2.04 5.0 2.006.0 2.24 6.0 2.087.0 2.47 7.0 2.218.0 2.72 8.0 2.349.0 2.99 9.0 2.5010.0 3.23 10.0 2.6711.0 3.61 11.0 2.8712.0 3.97 12.0 3.1013.0 4.37 13.0 3.3514.0 4.80 14.0 3.6415.0 5.28 15.0 3.9516.0 5.80 16.0 4.3017.0 6.38 17.0 4.6918.0 7.02 18.0 5.1319.0 7.72 19.0 5.6120.0 8.48 20.0 6. 14
21.0 6.7222.0 7.3723.0 8.0824.0 8.8625.0 9.72
^7
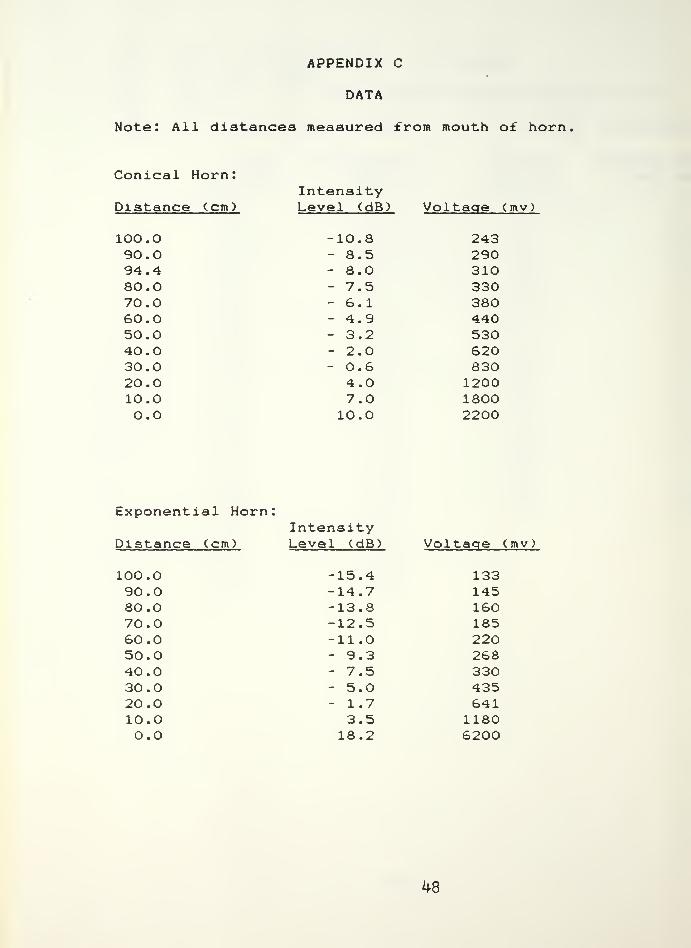
APPENDIX C
DATA
Note: All distances measured from mouth of horn
Conical Horn:Intensity
Distance (cm) Level (dB) Voltaqe (mv)
100.0 -10.8 24390.0 - 8.5 29094.4 - 8.0 31080.0 - 7.5 33070.0 - 6.1 38060.0 - 4.9 44050.0 - 3.2 53040.0 - 2.0 62030.0 - 0.6 83020.0 4.0 120010.0 7.0 18000.0 10.0 2200
Exponential Horn:Intensity
Distance (cm) Level (dB) Voltaqe (mv)
100.0 -15.4 13390.0 -14.7 14580.0 -13.8 16070.0 -12.5 18560.0 -11.0 22050.0 - 9.3 26840.0 - 7.5 33030.0 - 5.0 43520.0 - 1.7 64110.0 3.5 11800.0 18.2 6200
48
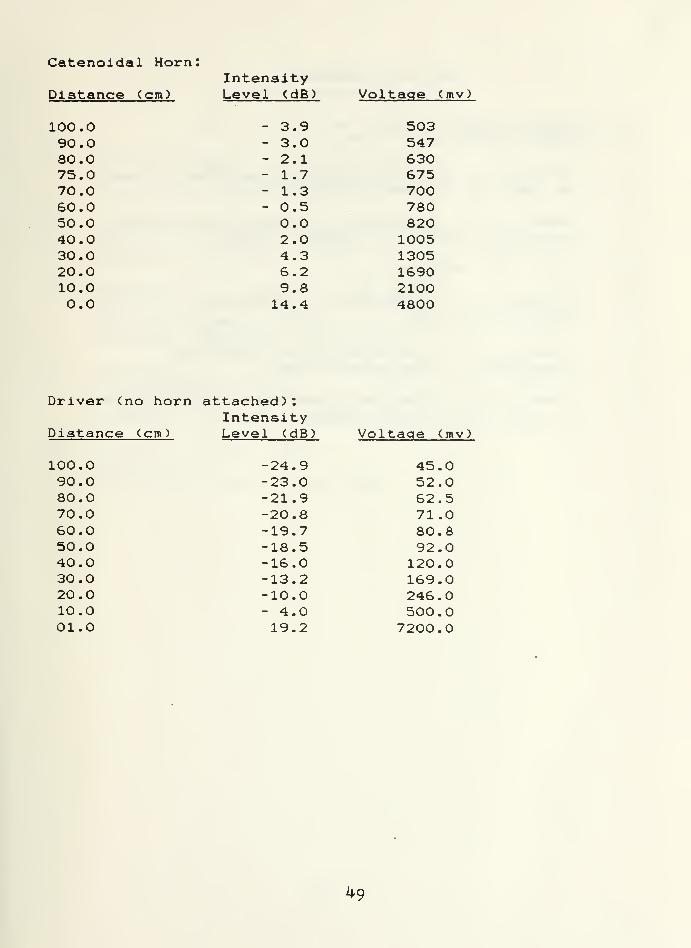
Catenoidal Horn:Intensity
Distance (cm) Level (dB) Voltage (mv)
100.0 - 3.9 50390.0 - 3.0 54780. - 2.1 63075.0 - 1.7 67570.0 - 1.3 70060.0 - 0.5 78050.0 0.0 82040.0 2.0 100530.0 4.3 130520.0 6.2 169010.0 9.8 21000.0 14.4 4800
Driver (no horn attached)
:
IntensityDistance (cm) Level (dB) Voltage (mv)
100.0 -24.9 45.090.0 -23.0 52.080.0 -21.9 62.570.0 -20.8 71.060.0 -19.7 80.850.0 -18.5 92.040.0 -16.0 120.030.0 -13.2 169.020.0 -10.0 246.010.0 - 4.0 500.001.0 19.2 7200.0
^9
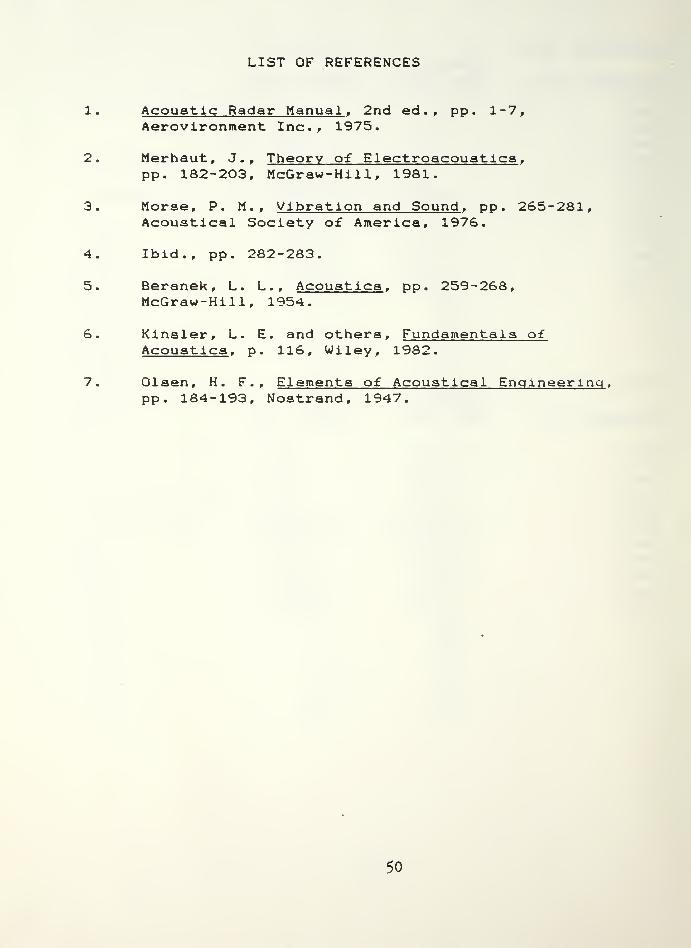
LIST OF REFERENCES
1. Acoustic Radar Manual . 2nd ed., pp. 1-7,Aerovironment Inc., 1975.
2. Merhaut, J., Theory of Electroacouatlca ,
pp. 182-203, McGraw-Hill, 1981.
3. Morse, P. M., Vibration and Sound , pp. 265-281,Acoustical Society of America, 1976.
4. Ibid., pp. 282-283.
5. Beranek , L. L., Acoustics . pp. 259-268,McGraw-Hill, 1954.
6. Kinsler, L. E. and others. Fundamentals ofAcoustics , p. 116, Wiley, 1982.
7. Olsen, H. F., Elements of Acoustical Engineering ,
pp. 184-193, Nostrand, 1947.
50
INITIAL DISTRIBUTION LIST
No. Copies
1. Defense Technical Information Center 2Cameron StationAlexandria, Virginia 22304-6145
2. Library, Code 0142 2Naval Postgraduate SchoolMonterey, California 93943-5100
3. Professor D. L. Walters, Code 61 We 4
Department of PhysicsNaval Postgraduate SchoolMonterey, California 93943-5100
4. Professor E. A. Milne, Code 61 Mn 2Department of PhysicsNaval Postgraduate SchoolMonterey, California 93943-5100
5. LT W. L. Richards, USN 229 Iroquois Dr.Pittsburgh, Pennsylvania 15205
51
uo^m


ThesR385c.l
is2.y 5] ^7
RichardsDesign and testing
of hardware improve-ments of an acousticsounder.
ThesisR385
c.l
2 151 1* 7
RichardsDesign and testing
of hardware improve-ments of an acousticsounder.