Embed Size (px)
Citation preview

No d’ordre : 227-2013 Anne 2013
THESE DE L’UNIVERSITE DE LYON
Dlivre par
L’UNIVERSITE CLAUDE BERNARD - LYON 1
Ecole Doctorale Informatique et Mathmatiques
DIPLOME DE DOCTORAT
P H D T H E S I S
Detection des emotions a partir de videos dans unenvironnement non controle
Detection of emotions from video in non-controlled environment
Soutenue publiquement (Public defense) le 14/11/2013
par Rizwan Ahmed KHAN
Composition du jury (Dissertation committee):
Rapporteurs
Mr. Renaud SEGUIER Professor, Supelec, CNRS UMR 6164, Rennes, FranceMr. Jean-Claude MARTIN Professor, LIMSI-CNRS, Universite Paris-Sud, France
ExaminateursMr. Thomas MOESLUND Professor, Department of Architecture, Design and Media Technology,
Aalborg University, DenmarkMr. Patrick LAMBERT Professor, LISTIC - Polytech Annecy-Chambery, FranceMr. Samir GARBAYA Associate Professor, Le2i, ENSAM, Chalon sur Saone, France
DirecteurMme. Saida BOUAKAZ Professor, LIRIS-CNRS, Universite Claude Bernard Lyon 1, France
Co-encadrantMr. Alexandre MEYER Associate Professor, LIRIS, Universite Claude Bernard Lyon 1, FranceMr. Hubert KONIK Associate Professor, LaHC, Universite Jean Monnet, Saint-Etienne, France


To my parents, my wife, my kids, my siblings and all of my teachers!
A mes parents, ma femme, mes enfants, mes freres et sœurs et tous
mes enseignants!
and to all who are trying to make this world a better place to live !


Acknowledgements
I would like to take this opportunity to thank my thesis supervisors,
Prof. Saida Bouakaz, Prof. Alexandre Meyer and Prof. Hubert Konik
for their skillful guidance and assistance during the course of thesis. I
appreciate their dedication and interest which made possible for me
to access the required literature and eventually deliver results of
appreciable quality and standard.
Secondly, I would like to thank reporter’s of dissertation committee,
Prof. Renaud Seguier and Prof. Jean-Claude Martin for their detailed
report and their insightful comments and suggestions that certainly
have improved the quality of thesis manuscript. I am also thankful to
other members of dissertation committee which include Prof. Thomas
Moeslund, Prof. Patrick Lambert and Prof. Samir Garbaya for their
valuable suggestions while evaluating my research work.
Special thanks to all my friends, colleagues and research staff of Lab.
Hubert Curien who spared their valuable time and participated in
psycho-visual experiment.
I would also like to thank Region Rhone-Alpes France, for financially
supporting this research work. Special thanks to administrative staff
of LIRIS for helping me out to complete various administrative tasks.
Last but not the least I would like to extend thanks to all my family
members (my parents, my sister, my brothers) specially my ever
supporting wife (Sharmeen) and kids (Abdullah and Bilal) without
them I wouldn’t be able to put all my efforts required to produce the
results which can stand in this competitive world.
Rizwan Ahmed Khan


Abstract
Communication in any form i.e. verbal or non-verbal is vital to
complete various daily routine tasks and plays a significant role in
life. Facial expression is the most effective form of non-verbal
communication and it provides a clue about emotional state, mindset
and intention.
Generally automatic facial expression recognition framework consists
of three step: face tracking, feature extraction and expression
classification. In order to built robust facial expression recognition
framework that is capable of producing reliable results, it is necessary
to extract features (from the appropriate facial regions) that have
strong discriminative abilities. Recently different methods for
automatic facial expression recognition have been proposed, but
invariably they all are computationally expensive and spend
computational time on whole face image or divides the facial image
based on some mathematical or geometrical heuristic for features
extraction. None of them take inspiration from the human visual
system in completing the same task. In this research thesis we took
inspiration from the human visual system in order to find from where
(facial region) to extract features. We argue that the task of
expression analysis and recognition could be done in more conducive
manner, if only some regions are selected for further processing (i.e.
salient regions) as it happens in human visual system.
In this research thesis we have proposed different frameworks for
automatic recognition of expressions, all getting inspiration from the
human vision. Every subsequently proposed addresses the
shortcomings of the previously proposed framework. Our proposed

frameworks in general, achieve results that exceeds state-of-the-art
methods for expression recognition. Secondly, they are
computationally efficient and simple as they process only perceptually
salient region(s) of face for feature extraction. By processing only
perceptually salient region(s) of the face, reduction in feature vector
dimensionality and reduction in computational time for feature
extraction is achieved. Thus making them suitable for real-time
applications.
Keywords: expression recognition, human visual system, eye-tracker,
saliency detection, gaze maps, pyramid histogram of oriented gradients
(PHOG), pyramid of local binary pattern (PLBP), supervised learning,
SVM, decision tree.

Resume
Dans notre communication quotidienne avec les autres, nous avons
autant de consideration pour l’interlocuteur lui-meme que pour
l’information transmise. En permanence coexistent en effet deux
modes de transmission : le verbal et le non-verbal. Sur ce dernier
theme intervient principalement l’expression faciale avec laquelle
l’interlocuteur peut reveler d’autres emotions et intentions.
Habituellement, un processus de reconnaissance d’emotions faciales
repose sur 3 etapes : le suivi du visage, l’extraction de
caracteristiques puis la classification de l’expression faciale. Pour
obtenir un processus robuste apte a fournir des resultats fiables et
exploitables, il est primordial d’extraire des caracteristiques avec de
forts pouvoirs discriminants (selon les zones du visage concernees).
Les avancees recentes de l’etat de l’art ont conduit aujourd’hui a
diverses approches souvent bridees par des temps de traitement trop
couteux compte-tenu de l’extraction de descripteurs sur le visage
complet ou sur des heuristiques mathematiques et/ou geometriques.
En fait, aucune reponse bio-inspiree n’exploite la perception humaine
dans cette tache qu’elle opere pourtant regulierement. Au cours de
ses travaux de these, la base de notre approche fut ainsi de singer le
modele visuel pour focaliser le calcul de nos descripteurs sur les seules
regions du visage essentielles pour la reconnaissance d’emotions.
Cette approche nous a permis de concevoir un processus plus naturel
base sur ces seules regions emergentes au regard de la perception
humaine. Ce manuscrit presente les differentes methodologies
bio-inspirees mises en place pour aboutir a des resultats qui
ameliorent generalement l’etat de l’art sur les bases de reference.

Ensuite, compte-tenu du fait qu’elles se focalisent sur les seules
parties emergentes du visage, elles ameliorent les temps de calcul et la
complexite des algorithmes mis en jeu conduisant a une utilisation
possible pour des applications temps reel.
Mots cle : reconnaissance d’emotions, systeme visuel humain, suivi
du regard, oculometrie, emergence, suivi du regard, PHOG, PLBP,
apprentissage supervise, SVM, arbre de decision.


Contents
Contents xi
List of Figures xvii
1 Introduction 1
1.1 Motivation . . . . . . . . . . . . . . . . . . . . . . . . . . . . . . . . 1
1.2 Current approaches . . . . . . . . . . . . . . . . . . . . . . . . . . . 3
1.2.1 Challenges . . . . . . . . . . . . . . . . . . . . . . . . . . . . 4
1.3 Our approach and contributions . . . . . . . . . . . . . . . . . . . . 5
1.3.1 Visual attention and saliency . . . . . . . . . . . . . . . . . 5
1.3.2 Computational efficiency . . . . . . . . . . . . . . . . . . . . 7
1.3.3 Expression recognition on low resolution stimuli . . . . . . . 7
1.3.4 Recognition of “pain” expression . . . . . . . . . . . . . . . 7
1.3.5 Database . . . . . . . . . . . . . . . . . . . . . . . . . . . . 8
1.4 Application areas . . . . . . . . . . . . . . . . . . . . . . . . . . . . 8
1.5 Publications . . . . . . . . . . . . . . . . . . . . . . . . . . . . . . . 10
1.6 Structure of the report . . . . . . . . . . . . . . . . . . . . . . . . . 11
2 Literature survey 13
2.1 Psychology and cognitive science on facial affect theory . . . . . . . 14
2.1.1 Ekman’s six basic emotions . . . . . . . . . . . . . . . . . . 15
2.1.2 Facial Action Coding System (FACS) . . . . . . . . . . . . . 17
2.1.2.1 FACS AU combinations and intensity . . . . . . . . 17
2.1.2.2 Drawbacks of Facial Action Coding System (FACS) 19
2.1.3 Plutchik’s emotion wheel . . . . . . . . . . . . . . . . . . . . 19
xi

2.1.4 Russell’s circumplex model . . . . . . . . . . . . . . . . . . . 21
2.2 Databases for facial expression recognition . . . . . . . . . . . . . . 22
2.3 Automatic recognition of facial expressions . . . . . . . . . . . . . . 25
2.3.1 Face detection and tracking . . . . . . . . . . . . . . . . . . 25
2.3.1.1 Knowledge-based methods . . . . . . . . . . . . . . 26
2.3.1.2 Feature invariant approaches . . . . . . . . . . . . 27
2.3.1.3 Template matching methods . . . . . . . . . . . . . 28
2.3.1.4 Appearance-based methods . . . . . . . . . . . . . 30
2.3.2 Feature extraction . . . . . . . . . . . . . . . . . . . . . . . 33
2.3.2.1 Appearance based methods . . . . . . . . . . . . . 34
2.3.2.2 Geometric feature based methods . . . . . . . . . . 38
2.3.3 Expression classification / recognition . . . . . . . . . . . . . 40
2.3.3.1 Template based methods . . . . . . . . . . . . . . . 40
2.3.3.2 Support Vector Machines based methods . . . . . . 41
2.3.3.3 Boosting based methods . . . . . . . . . . . . . . . 42
2.3.3.4 Classification trees . . . . . . . . . . . . . . . . . . 44
2.3.3.5 Instance based learning . . . . . . . . . . . . . . . 44
2.3.3.6 Naıve Bayes classifiers . . . . . . . . . . . . . . . . 44
2.4 Drawbacks of the current methods and contributions . . . . . . . . 46
2.4.1 Exploiting visual saliency . . . . . . . . . . . . . . . . . . . 46
2.4.1.1 Computational simplicity . . . . . . . . . . . . . . 47
2.4.1.2 Adequacy for low resolution stimuli . . . . . . . . . 47
2.4.2 Expressions different from six prototypical facial expression . 47
3 Psycho-Visual experiment 49
3.1 Methods . . . . . . . . . . . . . . . . . . . . . . . . . . . . . . . . . 50
3.1.1 Participants . . . . . . . . . . . . . . . . . . . . . . . . . . . 51
3.1.2 Eye-tracker . . . . . . . . . . . . . . . . . . . . . . . . . . . 52
3.1.2.1 Tracker application . . . . . . . . . . . . . . . . . . 54
3.1.3 Experiment builder . . . . . . . . . . . . . . . . . . . . . . . 56
3.1.3.1 Features . . . . . . . . . . . . . . . . . . . . . . . . 56
3.1.3.2 Organization of events in an experiment . . . . . . 56
3.2 Procedure . . . . . . . . . . . . . . . . . . . . . . . . . . . . . . . . 57

3.2.1 Eye movement recording . . . . . . . . . . . . . . . . . . . . 60
3.2.2 Stimuli . . . . . . . . . . . . . . . . . . . . . . . . . . . . . . 60
3.3 Psycho-Visual experiment: results and discussion . . . . . . . . . . 61
3.3.1 Gaze map construction . . . . . . . . . . . . . . . . . . . . . 61
3.3.2 Observations from the gaze maps . . . . . . . . . . . . . . . 62
3.3.3 Substantiating observations through statistical analysis . . . 63
3.4 Conclusion . . . . . . . . . . . . . . . . . . . . . . . . . . . . . . . . 68
4 Facial expression recognition based on brightness and entropy
features 71
4.1 Salient region detection . . . . . . . . . . . . . . . . . . . . . . . . . 73
4.1.1 Biologically based . . . . . . . . . . . . . . . . . . . . . . . . 74
4.1.2 Computational models . . . . . . . . . . . . . . . . . . . . . 75
4.1.2.1 Frequency-tuned salient region detection (FT) . . . 75
4.1.2.2 Graph Based Visual Saliency (GBVS) method . . . 76
4.1.2.3 Spectral Residual(SR) approach . . . . . . . . . . . 77
4.1.3 Conclusion . . . . . . . . . . . . . . . . . . . . . . . . . . . . 79
4.2 Feature extraction . . . . . . . . . . . . . . . . . . . . . . . . . . . 79
4.2.1 Brightness calculation . . . . . . . . . . . . . . . . . . . . . 81
4.2.2 Entropy calculation . . . . . . . . . . . . . . . . . . . . . . . 83
4.3 Experiments . . . . . . . . . . . . . . . . . . . . . . . . . . . . . . . 84
4.3.1 Experiment on the extended Cohn-Kanade (CK+) database 85
4.3.1.1 Comparison with state-of-the-art methods . . . . . 85
4.3.2 Experiment on the FG-NET FEED database . . . . . . . . . 86
4.4 Drawbacks of the proposed algorithm . . . . . . . . . . . . . . . . . 87
5 Facial region shape analysis for recognition of expressions 89
5.1 Proposed framework . . . . . . . . . . . . . . . . . . . . . . . . . . 90
5.2 Feature extraction using PHOG . . . . . . . . . . . . . . . . . . . . 92
5.3 Discriminative strength of PHOG features . . . . . . . . . . . . . . 94
5.4 Expression recognition experiments . . . . . . . . . . . . . . . . . . 94
5.4.1 First experiment: CK+ database . . . . . . . . . . . . . . . 96
5.4.1.1 Behavior of the classifiers . . . . . . . . . . . . . . 97

5.4.1.2 Comparison with the state-of-the-art methods . . . 98
5.4.2 Second experiment: generalization on the new dataset . . . . 99
5.4.3 Third experiment: low resolution image sequences . . . . . . 101
5.5 Conclusion . . . . . . . . . . . . . . . . . . . . . . . . . . . . . . . . 102
6 Recognizing expressions by analyzing texture 105
6.1 PLBP based framework . . . . . . . . . . . . . . . . . . . . . . . . 106
6.1.1 Novelty of the proposed descriptor . . . . . . . . . . . . . . 109
6.2 Expression recognition framework . . . . . . . . . . . . . . . . . . . 110
6.3 Results on universal expressions . . . . . . . . . . . . . . . . . . . . 112
6.3.1 First experiment: posed expressions . . . . . . . . . . . . . . 113
6.3.1.1 Results . . . . . . . . . . . . . . . . . . . . . . . . 114
6.3.1.2 Comparisons . . . . . . . . . . . . . . . . . . . . . 115
6.3.2 Second experiment: low resolution image sequences . . . . . 118
6.3.3 Third experiment: generalization on the new dataset . . . . 121
6.3.4 Fourth experiment: spontaneous expressions . . . . . . . . . 122
6.4 Pain recognition . . . . . . . . . . . . . . . . . . . . . . . . . . . . . 124
6.4.1 Novelty of proposed approach . . . . . . . . . . . . . . . . . 125
6.4.2 Pain expression database . . . . . . . . . . . . . . . . . . . . 126
6.4.3 Framework . . . . . . . . . . . . . . . . . . . . . . . . . . . 126
6.4.4 Experiment . . . . . . . . . . . . . . . . . . . . . . . . . . . 128
6.5 Conclusion . . . . . . . . . . . . . . . . . . . . . . . . . . . . . . . . 132
7 Conclusion and perspectives 133
7.1 Contributions . . . . . . . . . . . . . . . . . . . . . . . . . . . . . . 133
7.1.1 Exploring human visual system . . . . . . . . . . . . . . . . 134
7.1.2 Descriptor for low resolution stimuli . . . . . . . . . . . . . . 136
7.1.3 Novel framework for pain recognition . . . . . . . . . . . . . 137
7.2 Perspectives . . . . . . . . . . . . . . . . . . . . . . . . . . . . . . . 137
A Facial expression databases 141
A.1 Cohn-Kanade facial expression database . . . . . . . . . . . . . . . 142
A.2 MMI facial expression database . . . . . . . . . . . . . . . . . . . . 143
A.3 FG-NET Facial Expressions and Emotion Database . . . . . . . . . 147

A.4 Japanese Female Facial Expression Database . . . . . . . . . . . . . 147
A.5 AR database . . . . . . . . . . . . . . . . . . . . . . . . . . . . . . . 149
A.6 CAS-PEAL Database . . . . . . . . . . . . . . . . . . . . . . . . . . 150
A.7 Radboud Faces Databases (RaFD) . . . . . . . . . . . . . . . . . . 152
A.8 Pain Expression Database . . . . . . . . . . . . . . . . . . . . . . . 153
A.9 Drawbacks of the current databases . . . . . . . . . . . . . . . . . . 155
B Gaze Maps 157
C Color space conversion 165
References 167


List of Figures
1.1 Generic pipeline for facial expression recognition algorithms. . . . . 3
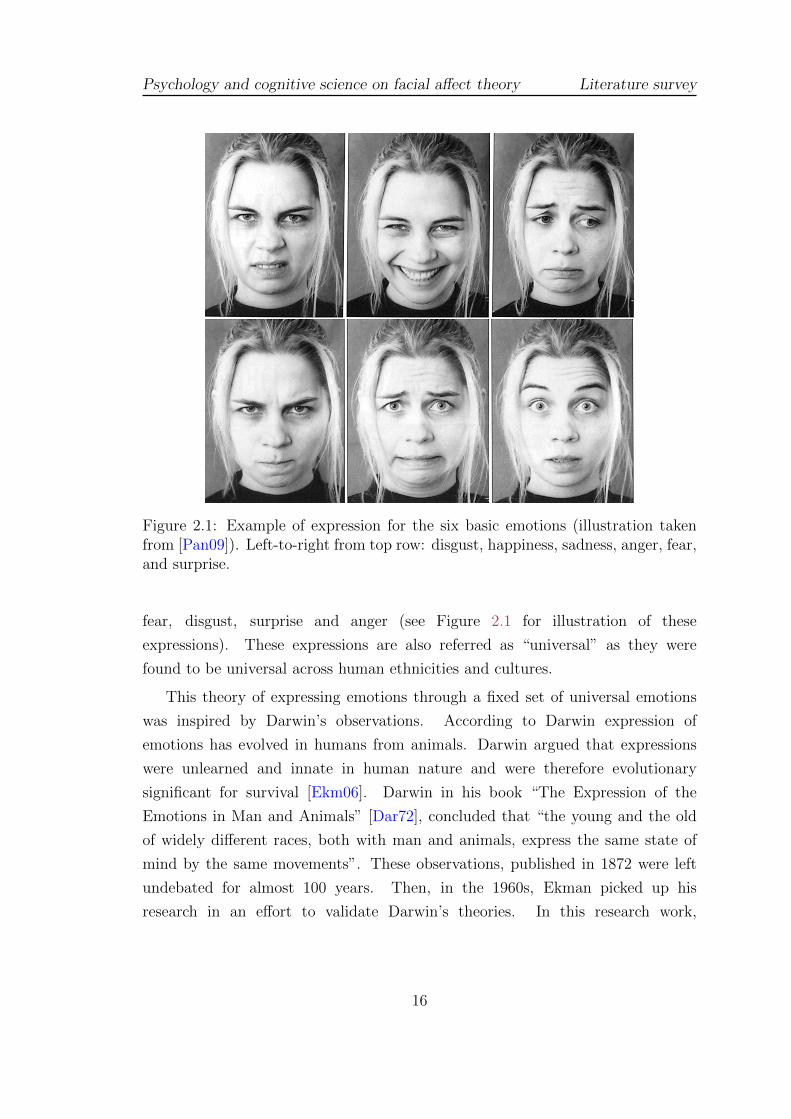
2.1 Example of expression for the six basic emotions (illustration
taken from [Pan09]). Left-to-right from top row: disgust,
happiness, sadness, anger, fear, and surprise. . . . . . . . . . . . . 16
2.2 Some examples of Action Units. Action Units are atomic facial
muscle actions described in FACS (Illustration from [Val08]). . . . 17
2.3 Upper facial Action Units (Illustration taken from [Val08]). . . . . . 18
2.4 Lower facial Action Units (Illustration from [Val08]). . . . . . . . . 18
2.5 Action Units belonging to neither the upper nor the lower facial
area (Illustration from [Val08]). . . . . . . . . . . . . . . . . . . . . 18
2.6 Plutchik’s emotion wheel (left) and the accompanying emotion cone
(right). . . . . . . . . . . . . . . . . . . . . . . . . . . . . . . . . . . 20
2.7 Russells circumplex model of emotions. . . . . . . . . . . . . . . . . 22
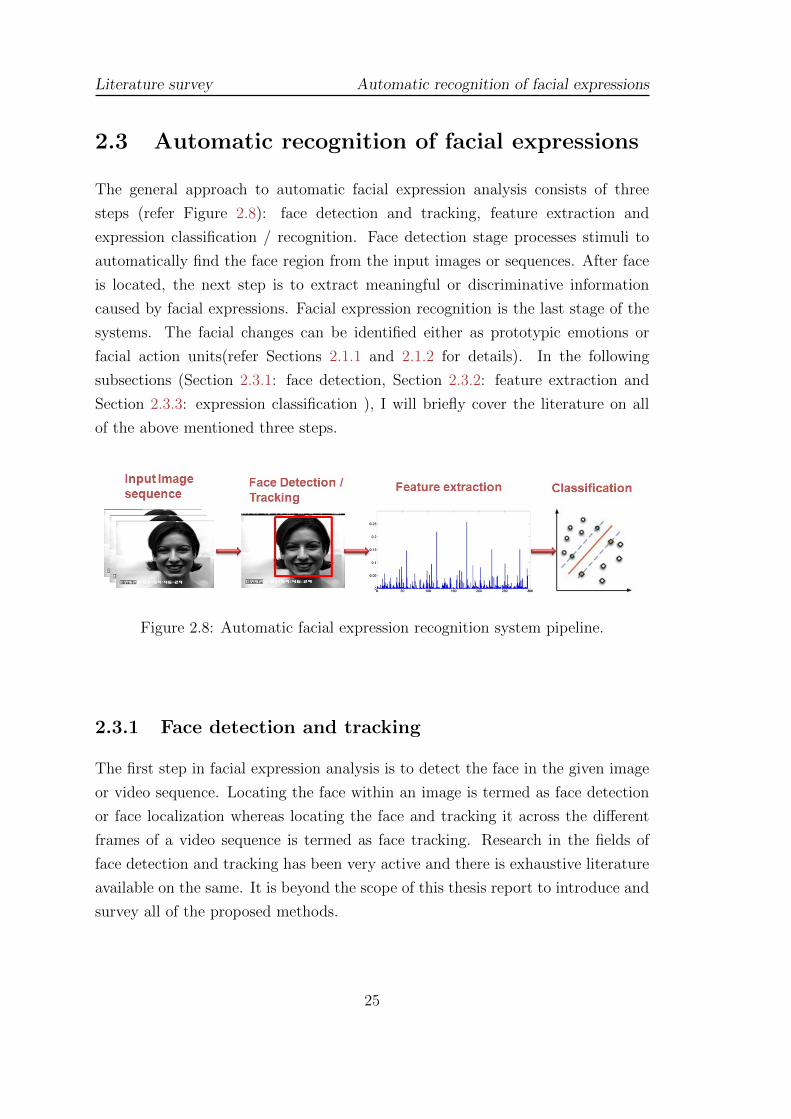
2.8 Automatic facial expression recognition system pipeline. . . . . . . 25
2.9 The image on the left is the Ratio Template (14 pixels by 16 pixels).
The template is composed of 16 regions (gray boxes) and 23 relations
(arrows). The image on the right is the Spatial Ratio Template. It
is a modified version of the Ratio Template by incorporating the
Golden Ratio. . . . . . . . . . . . . . . . . . . . . . . . . . . . . . . 29
xvii

2.10 The sum of the pixels within rectangle D can be computed with four
array references. The value of the integral image at location 1 is the
sum of the pixels in rectangle A. The value at location 2 is A+B,
at location 3 is A+C, and at location 4 is A+B+C+D. The sum
within D can be computed as 4+1-(2+3). Illustration taken from
[VJ01]. . . . . . . . . . . . . . . . . . . . . . . . . . . . . . . . . . 32
2.11 Schematic depiction of a the detection cascade. A series of
classifiers are applied to every sub-window. The initial classifier
eliminates a large number of negative examples with very little
processing. Subsequent layers eliminate additional negatives but
require additional computation. After several stages of processing
the number of sub-windows have been reduced radically. Further
processing can take any form such as additional stages of the
cascade or an alternative detection system. Illustration taken from
[VJ01]. . . . . . . . . . . . . . . . . . . . . . . . . . . . . . . . . . 33
2.12 The left, middle, and right graphics above show the absolute value,
and the real and imaginary components of a sample Gabor filter. . . 35
2.13 The basic haar-like feature template. . . . . . . . . . . . . . . . . . 36
2.14 Haar-like features extracted from different position and different
scale on the face image. . . . . . . . . . . . . . . . . . . . . . . . . . 37
2.15 Demonstration Landmarks on the face. . . . . . . . . . . . . . . . . 39
2.16 Hyperplane through two linearly separable classes. . . . . . . . . . . 42
2.17 k -Nearest Neighbor in a two-dimensional space and where target
function is boolean valued. A set of +ve and -ve training examples
is shown on the left, along with a query instance xq to be
classified. The 1 -Nearest Neighbor algorithm classifies xq +ve
whereas 5 -Nearest Neighbor algorithm classifies it as -ve. On the
right is the decision surface induced by the 1 -Nearest Neighbor
algorithm. The convex polygon surrounding each training example
indicates the region of instance space closest to that point (i.e. the
instance for which 1 -Nearest Neighbor algorithm will assign the
classification belonging to that training example). . . . . . . . . . 45

3.1 Observer’s classification on the basis of age group. . . . . . . . . . . 51
3.2 Observer’s classification on the basis of their ethnicity. . . . . . . . 52
3.3 Observer’s classification on the basis of their sex. . . . . . . . . . . 52
3.4 Eyelink II, Eye-tracker used in our experiment. . . . . . . . . . . . 53
3.5 EyeLink II Camera Setup Screen. . . . . . . . . . . . . . . . . . . 55
3.6 EyeLink II Calibration Screen. . . . . . . . . . . . . . . . . . . . . 55
3.7 Block diagram of the experiment. . . . . . . . . . . . . . . . . . . 57
3.8 Hierarchical Organization of the experiment . . . . . . . . . . . . . 58
3.9 Experiment / eye-tracker setup. First row: tracker being adjusted
on the head of an observer. Second row: stimulus display PC (on
the left) and the PC connected to the eye-tracker / host PC on the
right. Last row: after finalizing the setup stage of the experiment. 59
3.10 Examples of gaze maps for six universal expressions. Each video
sequence is divided in three mutually exclusive time periods. First,
second and third columns show average gaze maps for the first,
second and third time periods of a particular stimuli respectively. . 61
3.11 Time period wise average percentage of trial time observers have
spent on gazing different facial regions. The error bars represent
the standard error (SE) of the mean. First time period: initial
frames of video sequence. Third time period: apex frames. Second
time period: frames which has a transition from neutral face to
particular expression. . . . . . . . . . . . . . . . . . . . . . . . . . . 63
3.12 Gaze maps for the facial expression of happiness. First, second and
third columns show average gaze maps for the first, second and
third time periods of stimuli respectively. Each row corresponds to
different stimuli/video sequence for “sadness”. . . . . . . . . . . . . 64
3.13 Gaze maps for the facial expression of surprise. First, second and
third columns show average gaze maps for the first, second and
third time periods of stimuli respectively. Each row corresponds to
different stimuli/video sequence for “sadness”. . . . . . . . . . . . . 65

3.14 Gaze maps for the facial expression of sadness. First, second and
third columns show average gaze maps for the first, second and
third time periods of stimuli respectively. Each row corresponds to
different stimuli/video sequence for “sadness”. . . . . . . . . . . . . 66
3.15 Gaze maps for the facial expression of disgust. First, second and
third columns shows average gaze maps for the first, second and
third time periods of stimuli respectively. Each row corresponds to
different stimuli/video sequence for “disgust”. . . . . . . . . . . . . 66
3.16 Gaze maps for the facial expression of fear. First, second and third
columns show average gaze maps for the first, second and third time
periods of stimuli respectively. Each row corresponds to different
stimuli/video sequence for “fear”. . . . . . . . . . . . . . . . . . . . 67
3.17 Gaze maps for the facial expression of anger. First, second and third
columns show average gaze maps for the first, second and third time
periods of stimuli respectively. Each row corresponds to different
stimuli/video sequence for “anger”. . . . . . . . . . . . . . . . . . . 68
3.18 Summary of the facial regions that emerged as salient for six
universal expressions. Salient regions are mentioned according to
their importance (for example facial expression of “fear” has two
salient regions but mouth is the most important region according
to HVS). . . . . . . . . . . . . . . . . . . . . . . . . . . . . . . . . . 69
4.1 Brightness and entropy values from three different facial regions. . 73
4.2 Itti’s model architecture [IKN98]. . . . . . . . . . . . . . . . . . . . 75
4.3 Frequency-tuned salient region detection algorithm [AHES09]. . . . 76
4.4 Graph Based Visual Saliency (GBVS) method’s architecture
(adopted from poster presentation [JHP06]). . . . . . . . . . . . . . 77

4.5 Comparison of automatic detected salient regions with gaze map
obtained from psycho-Visual experiment (see Chapter 3 for
reference). First row: original image and average gaze map of
fifteen observers. Second row: saliency maps obtained from GBVS
[JHP06] and Itti methods [IKN98] (shown as heat maps.). Third
row: saliency maps obtained from FT [AHES09] and SR methods
[HZ07]. . . . . . . . . . . . . . . . . . . . . . . . . . . . . . . . . . 78
4.6 Salient region detection for different expressions using FT
[AHES09]. Each row shows detected salient regions in a complete
frame along with the zoom of three facial regions i.e. eyes, nose
and mouth. Brightness of the salient regions is proportional to its
saliency. First row shows expression of happiness, second row:
surprise, third row: sadness, fourth row: anger, fifth row: fear and
sixth row: disgust . . . . . . . . . . . . . . . . . . . . . . . . . . . . 80
4.7 Average entropy value for different facial regions. First time period:
initial frames of video sequence. Third time period: apex frames.
Second time period: frames which has a transition from neutral face
to particular expression. . . . . . . . . . . . . . . . . . . . . . . . . 81
4.8 Color Coordinate Systems DEF and BCH [BB06]. . . . . . . . . . 82
5.1 Schematic overview of the proposed framework . . . . . . . . . . . 91
5.2 HOG feature extraction. First row: input stimuli, second row: edge
contours at three different pyramid levels, third row: histograms of
gradients (HOG) at three respective levels. . . . . . . . . . . . . . 93
5.3 HOG features for different expressions. First row: sadness, second
row: surprise, third row: happiness, fourth row: anger and fifth
row: disgust. First column shows stimuli and second column shows
respective HOG (only mouth facial region) at three levels. . . . . . 95
5.4 Evolution of the achieved average recognition accuracy for the six
universal facial expressions with the increasing number of folds for
the k -fold cross validation technique. . . . . . . . . . . . . . . . . . 98

5.5 Example of stimuli with decreasing image resolution. First column
shows stimuli in original resolution. Second to fifth column show
stimuli in spatial resolution of: 144 x 192, 72 x 96, 36 x 48 and 18
x 24 respectively. . . . . . . . . . . . . . . . . . . . . . . . . . . . . 101
5.6 Robustness of different classifiers for facial expression recognition
with decreasing image resolution. . . . . . . . . . . . . . . . . . . . 102
6.1 Pyramid of Local Binary Pattern. First row: stimuli at two different
pyramid levels, second row: histograms of LBP at two respective
levels, third row: final descriptor. . . . . . . . . . . . . . . . . . . . 107
6.2 Examples of the extended LBP [OPM02]. The pixel values are
bilinearly interpolated whenever the sampling point is not in the
center of a pixel . . . . . . . . . . . . . . . . . . . . . . . . . . . . 108
6.3 Schematic overview of the framework. . . . . . . . . . . . . . . . . . 111
6.4 Evolution of the achieved average recognition accuracy for the six
universal facial expressions with the increasing number of folds for
the k -fold cross validation technique. . . . . . . . . . . . . . . . . . 116
6.5 Robustness of different methods for facial expression recognition
with decreasing image resolution (CK database). PHOG[ICIP]
corresponds to framework proposed by Khan et. al [KMKB12b]
(framework explained in Chapter 5 and specifically Section 5.4.3),
Gabor [CVPRW] corresponds to Tian’s work [Tia04], LBP[JIVC]
and Gabor[JIVC] corresponds to results reported by Shan et. al
[SGM09] . . . . . . . . . . . . . . . . . . . . . . . . . . . . . . . . . 120
6.6 Example of lowest tested facial resolution . . . . . . . . . . . . . . . 121
6.7 Examples frames from MMI-Facial Expression Database. The first
row is taken from Part V of the database and shows expressions
of happiness and disgust. The second row shows expressions of
happiness and disgust taken from Part IV of the database. The third
row shows four frames of a single sequence in which the participant
showed an expression of disgust [VP10]. . . . . . . . . . . . . . . . . 123
6.8 Overview of the framework. . . . . . . . . . . . . . . . . . . . . . . 127

6.9 Results obtained with the proposed framework. Results are
presented for four different classifiers, with the first row showing
results for “SVM” and “2 NN” while the second row showing
results for “decision tree” and “random forest”. . . . . . . . . . . . 129
6.10 Evolution of the achieved average recognition accuracy for the
expression of pain with the increasing number of folds for the
k -fold cross validation technique. . . . . . . . . . . . . . . . . . . . 130
7.1 The valence-arousal (V-A) space for emotion analysis. Illustration
from [HTKW13]. . . . . . . . . . . . . . . . . . . . . . . . . . . . . 138
A.1 Example of Cohn- Kanade Facial Expression Database. . . . . . . . 143
A.2 Example of MMI Facial Expression Database. . . . . . . . . . . . . 144
A.3 Examples of static frontal-view images of facial expressions in the
MMI Facial Expression Database. . . . . . . . . . . . . . . . . . . . 144
A.4 Examples of apex frames of dual-view image sequences in MMI
Facial Expression Database. . . . . . . . . . . . . . . . . . . . . . . 145
A.5 Image captures from the video sequences of the six universal
expressions from the FG-NET FEED. . . . . . . . . . . . . . . . . . 148
A.6 Example images from the Japanese Female Facial
Expression(JAFFE) database. . . . . . . . . . . . . . . . . . . . . . 149
A.7 AR database. The conditions are (1) neutral, (2) smile, (3) anger,
(4) scream, (5) left light on, (6) right light on, (7) both lights on,
(8) sun glasses, (9) sun glasses/left light (10) sun glasses/right light,
(11) scarf, (12) scarf/left light, (13) scarf/right light. . . . . . . . . 150
A.8 Pose variation in the CAS-PEAL database. The images were
recorded using separate cameras triggered in close succession. The
cameras are each about 22.50 apart. Subjects were asked to look
up, to look straight ahead, and to look down. Shown here are
seven of the nine poses currently being distributed. . . . . . . . . . 151
A.9 Illumination variation in the CAS-PEAL database. The images
were recorded with constant ambient illumination and manually
triggered fluorescent lamps. . . . . . . . . . . . . . . . . . . . . . . 152

A.10 (a) Eight emotional expressions from top left: sad, neutral, anger,
contemptuous, disgust, surprise, fear and happiness, (b) Three gaze
directions: left, straight and right, (c) Five camera angles at 1800,
1350, 900, 450 and 00. . . . . . . . . . . . . . . . . . . . . . . . . . . 153
A.11 Examples of some of the sequences from the UNBC-McMaster Pain
Shoulder Archive . . . . . . . . . . . . . . . . . . . . . . . . . . . . 154
B.1 Gaze maps for the expression of happiness. . . . . . . . . . . . . 158
B.2 Gaze maps for the expression of surprise. . . . . . . . . . . . . . 159
B.3 Gaze maps for the expression of sadness. . . . . . . . . . . . . . . 160
B.4 Gaze maps for the expression of disgust. . . . . . . . . . . . . . . 161
B.5 Gaze maps for the expression of fear. . . . . . . . . . . . . . . . . 162
B.6 Gaze maps for the expression of anger. . . . . . . . . . . . . . . . 163

Chapter 1
Introduction
Contents
1.1 Motivation . . . . . . . . . . . . . . . . . . . . . . . . . . 1
1.2 Current approaches . . . . . . . . . . . . . . . . . . . . . 3
1.2.1 Challenges . . . . . . . . . . . . . . . . . . . . . . . . . 4
1.3 Our approach and contributions . . . . . . . . . . . . . 5
1.3.1 Visual attention and saliency . . . . . . . . . . . . . . . 5
1.3.2 Computational efficiency . . . . . . . . . . . . . . . . . . 7
1.3.3 Expression recognition on low resolution stimuli . . . . 7
1.3.4 Recognition of “pain” expression . . . . . . . . . . . . . 7
1.3.5 Database . . . . . . . . . . . . . . . . . . . . . . . . . . 8
1.4 Application areas . . . . . . . . . . . . . . . . . . . . . . 8
1.5 Publications . . . . . . . . . . . . . . . . . . . . . . . . . . 10
1.6 Structure of the report . . . . . . . . . . . . . . . . . . . 11
1.1 Motivation
Communication in any form i.e. verbal or non-verbal is vital to complete various
daily routine tasks and plays a significant role in life. Facial expression is the
most effective form of non-verbal communication and it provides a clue about
1

Motivation Introduction
emotional state, mindset and intention [EFE72, EF75, Ekm01, Ekm93]. Facial
expressions not only can change the flow of conversation [Bul01] but also provides
the listeners a way to communicate a wealth of information to the speaker without
even uttering a single word [Yng70]. According to [CLFD94, FDWS91] when
the facial expression does not coincide with the other communication i.e. spoken
words, then the information conveyed by the face gets more weight in decoding
information.
The computing environment is moving towards human-centered designs
instead of computer centered designs [PPNH06], and human’s tend to
communicate wealth of information through affective states or expressions.
Traditional Human Computer Interaction (HCI) based systems ignores bulk of
information communicated through those affective states and just caters for
user’s intentional input. As mentioned that paradigm is shifting towards
human-centered designs, thus analysis of user affective states becomes inevitable.
In near future humans will not interact with machines only through intentional
inputs but also through their behavior i.e. affective states [ZPRH09, SBR10].
Therefore, computer vision research community has shown a lot of interest in
analyzing and automatically recognizing facial expressions. There are lots of
application areas that can benefit from a system that can recognize facial
expressions i.e. human-computer interaction, entertainment, medical applications
e.g. pain detection, social robots, deceit detection, interactive video and behavior
monitoring (see Section 1.4 for the description).
Facial expressions are studied since ancient times, as it is one of the most
important channel of non-verbal communication [AR92]. Initially facial
expressions were studied by great philosophers and thinkers like Aristotle and
Stewart. With Darwin, the study of facial expressions became an empirical
study. In the computer vision community, the term “facial expression
recognition” often refers to the classification of facial features in one of the six so
called basic or universal emotions: happiness, sadness, fear, disgust, surprise and
anger, as introduced by Ekman in 1971 [Ekm71]. We, the humans, understand
various facial expressions everyday without any extra effort. But for computer
based systems on the other side, it is still hard to recognize them automatically
2

Introduction Current approaches
due to face appearance changes caused by pose variations, illumination variations
and camera quality and angle changes.
1.2 Current approaches
There exist two main methodologies to analyze expressions in computer science:
a) vision based methods b) audio based methods. Some researchers have found
out that the combination of audio and visual signals gives better results [ZHF+06].
However, due to the fact that expressions can be emitted by a face without any
sound, vision based methods are still the hottest research area in human affection.
Thus, our research work has focused only the Vision based methods. Vision
based methods for expression analysis operate on images or images sequences.
Generally, Vision based facial expression recognition system consists of three steps:
1. Face detection and tracking
2. Feature extraction
3. Expression classification / recognition
Figure 1.1: Generic pipeline for facial expression recognition algorithms.
The first step in facial expression analysis is to detect the face in the given
image or video sequence. Locating the face within an image is termed as face
detection or face localization whereas locating the face and tracking it across the
different frames of a video sequence is termed as face tracking.
Extraction of selected features is the second and the most important step to
successfully analyze and recognize facial expressions automatically. The optimal
3

Current approaches Introduction
features should minimize within-class variations of expressions while maximize
between class variations. Usually, there are two ways to extract facial features:
the geometric features and the appearance features. Normally geometric features
come from the shapes of the facial components and the location of facial salient
points (corners of the eyes, mouth, etc.). Appearance features are extracted by
recording appearance changes of the face. This research work has mainly focused
on the second step.
Third and the last step of automatic expression analysis system is
classification. Some systems directly classify expressions while others classify
expressions by first recognizing particular action units “AU” [EF78] (see Section
2.1.2 for the description of FACS (facial action coding system) and AU).
1.2.1 Challenges
Although different proposed methods for facial expression recognition have
achieved good results, there still remains different problems that need to be
addressed by the research community.
1. Generally, we have found that all the reviewed methods for automatic facial
expression recognition are computationally expensive and usually require
dimensionally large feature vector to complete the task. This explains their
inability for real-time applications, although they produce good results on
different datasets.
2. Smart meeting, video conferencing and visual surveillance are some of the
real world applications that require facial expression recognition system that
works adequately on low resolution images. There exist lots of methods for
facial expression recognition but very few of those methods provide results
or work adequately on low resolution images.
3. More research effort is required to be put forth for recognizing more complex
facial expressions than the six classical, such as fatigue, pain, and mental
states such as agreeing, disagreeing, lie, frustration, thinking as they have
numerous application areas.
4

Introduction Our approach and contributions
4. Other problems include expression intensity estimation, spontaneous
expression recognition, micro expression recognition (brief, involuntary
facial expression, lasts only 1/25 to 1/15 of a second), mis-alignment
problem, illumination, and face pose variation.
1.3 Our approach and contributions
Recently different methods for automatic facial expression recognition have been
proposed [LBF+06, ZP07, KZP08, YLM10, VPP05, GL13, ZLY+12, WWJ13] but
none of them try to mimic or understand human visual system in recognizing
them. Rather all of the methods, spend computational time on whole face image
or divides the facial image based on some mathematical or geometrical heuristic for
features extraction. We argue that the task of expression analysis and recognition
could be done in more conducive manner, if only some regions are selected for
further processing (i.e. salient regions) as it happens in human visual system
[Zha06].
1.3.1 Visual attention and saliency
Humans have the amazing ability to decode facial expressions across different
cultures, in diverse conditions and in a very short time. Human visual system
(HVS) has limited neural resources but still it can analyze complex scenes in real-
time. As an explanation for such performance, it has been proposed that only
some visual inputs are selected by considering “salient regions” [Zha06], where
“salient” means most noticeable or most important.
Visual attention is the ability of a vision system, biological or artificial, to
rapidly detect potentially relevant parts of a visual scene, on which higher level
vision tasks, such as object recognition, can focus. It is generally agreed today
that under normal circumstances human eye movements are tightly coupled to
visual attention [JOW+05]. William James [Jam90] described Visual attention
as the process in which mind takes possession of one out of what seems several
simultaneously possible objects. “Focalization, concentration, of consciousness are
of its essence. It implies withdrawal from some things in order to deal effectively
5
Our approach and contributions Introduction
with others, and is a condition which has a real opposite in the confused, dazed,
scatterbrained state which in French is called distraction, and Zerstreutheit in
German”.
Eye fixations describe the way in which visual attention is directed towards
salient regions in a given stimuli [RCB02]. In computer vision the notion of
saliency was mainly popularized by Tsotsos et al. [TSW+95] and Olshausen et
al. [OAVE93] with their work on visual attention, and by Itti et al. [IKN98] with
their work on rapid scene analysis. Recently, computer vision research
community has shown lot of interest in understanding human visual attention
phenomenon as it has been shown that such an approach could drastically reduce
the need for computational resources without altering the quality of results
[Har06].
To determine which facial region(s) is salient according to human vision, we
have conducted psycho-visual experiment (see Chapter 3 for details). The
experiment has been conducted with the help of an eye-tracking system which
records the fixations and saccades. It is known that eye gathers most of the
information during the fixations [RCB02] as eye fixations describe the way in
which visual attention is directed towards salient regions in a given stimuli.
Results of the visual experiment provided the evidence that human visual system
either gives importance to one i.e. mouth or to two facial regions i.e. eyes and
mouth, while decoding six universal facial expressions (for reference see Section
3.3). In the same manner, we argue that the task of expression analysis and
recognition could be done in more conducive manner, if same regions are selected
for further processing.
To test and prove our argument we have proposed different algorithms for
facial expression recognition, where first part of dividing the face into salient
regions is inspired by human vision (refer Chapter 3). Every subsequently
proposed addresses the shortcomings of the previously proposed framework (see
Chapters 4, 5 and 6). Our proposed frameworks in general, achieve results that
exceeds state-of-the-art methods for expression recognition. Secondly, they are
computationally efficient and simple as they process only perceptually salient
region(s) of face for feature extraction.
6

Introduction Our approach and contributions
1.3.2 Computational efficiency
During the course of this research work we have proposed algorithms for facial
expression recognition which are based on psycho-visual experimental study
(exploiting saliency of different facial regions). Psycho-visual experimental study
points to the fact that human visual system is attracted towards only few facial
regions while decoding six universal facial expressions (for reference see Section
3.3). The proposed framework(s) extracts features only from the perceptually
salient region, thus reducing the length of features vector. This reduction in
feature vector length makes the proposed framework suitable for real-time
applications due to minimized computational complexity.
1.3.3 Expression recognition on low resolution stimuli
We have proposed a novel descriptor for facial features analysis, Pyramid of
Local Binary Pattern (PLBP) (refer Chapter 6) that can recognize facial
expressions very efficiently and with high accuracy for very low resolution facial
images. Proposed framework exceeds state-of-the-art methods for expression
recognition on low resolution images, which were derived from Cohn-Kanade
(CK+) posed facial expression database. The proposed framework is memory
and time efficient as it extracts texture features in a pyramidal fashion only from
the perceptual salient regions of the face.
1.3.4 Recognition of “pain” expression
In this research work, we are also proposing a novel computer vision system that
can recognize expression of pain in videos by analyzing facial features. Usually
pain is reported and recorded manually and thus carry lot of subjectivity.
Manual monitoring of pain makes difficult for the medical practitioners to
respond quickly in critical situations. Thus, it is desirable to design such a
system that can automate this task. With our proposed model pain monitoring
can be done is real-time without any human intervention. We tested our
proposed model on UNBCMcMaster Shoulder Pain Expression Archive Database
7

Application areas Introduction
[LCP+11] (refer Appendix Section A.8) and recorded results that exceeds
state-of-the-art.
1.3.5 Database
We have tested our proposed frameworks on different databases, which includes
Cohn-Kanade (CK+) posed facial expression database (refer Appendix Section
A.1), spontaneous expressions of MMI facial expression database (refer Appendix
Section A.2) and FG-NET facial expressions and emotions database (FEED) (refer
Appendix Section A.3) and obtained very good results.
1.4 Application areas
A system that could enable fast and robust facial expression recognition would
have many uses in both research and application areas as diverse as behavioural
science, education, entertainment, medicine, and security. Following is a list of
applications that can benefit from automatic recognition of facial expressions.
1. Avatars with expressions. Virtual environments and characters have become
tremendously popular in the 21st century. Gaming industry would benefit
tremendously if the avatars were able to mimic their user’s facial expressions
recorded by a webcam and analysed by a facial expression recognition system
as the level of immersion and reality in the virtual world would increase.
This immersion into virtual world could have many implications i.e. the
game could adapt its difficulty level based on information from the facial
expressions of the user.
2. EmotiChat. Another interesting application has been demonstrated by
Anderson and McOwen, called the “EmotiChat” [AM06]. It consists of a
chat-room application where users can log in and start chatting. The face
expression recognition system is connected to this chat application and it
automatically inserts emoticons based on the user’s facial expressions.
3. Smart homes. As mentioned earlier, computing environment is moving
towards human-centered designs instead of computer centered designs
8

Introduction Application areas
[PPNH06] and this paradigm shift will have far reaching consequences, one
of them being smart homes. The houses could be equipped with systems
that will record different readings i.e. lighting conditions, type of music
playing, room temperatures etc and associate them with the facial
expressions of the inhabitants over time. Thus, such system can later
control different recorded environment parameters automatically.
4. Affective/social robots. For social robots it is also important that they can
recognize different expressions and act accordingly in order to have effective
interactions [SBR10]. The Social Robots Project at Carnegie Mellon
University states its mission as “wanting robots to behave more like people,
so that people do not have to behave like robots when they interact with
them”. To attain such human-robot interaction, it is of paramount
importance for the robot to understand the humans facial expressions.
5. Detection and treatment of depression and anxiety. Research based on the
FACS has shown that facial expressions can predict the onset and remission
of depression, schizophrenia, and other psychopathological afflictions [ER05].
FACS [EF78] has also been able to identify patterns of facial activity involved
in alcohol intoxication that observers not trained in FACS failed to note
[SSBW92]. This suggests there are many applications for an automatic facial
expression recognition system based on FACS.
6. Pain monitoring of patients. Pain monitoring of patients is a very
complicated but very important task. Currently, this is done manually but
it is desirable to design such a system that can automate this task.
Manually monitoring of pain has some problems: first, pain cannot be
recorded continuously. Secondly, some patients can under report the pain
while other can do just oppposite. Lastly, the person recording the pain has
to make judgment of pain level, which could vary from person to person
(subjectivity problem). An automatic facial expression recognition system
could solve above mentioned problems. It has been shown that it is
possible to derive a measure of pain and to distinguish between different
types of pain from a patient’s facial expressions [dCW02]. In this research
9

Publications Introduction
work, we have proposed a novel computer vision system that can recognize
expression of pain in videos by analyzing facial features (refer Section 6.4
for the details).
1.5 Publications
1. Peer-reviewed journal articles
(a) Framework for reliable, real-time facial expression recognition for low
resolution images. R.A. Khan, A. Meyer, H. Konik, S. Bouakaz. In
Pattern Recognition Letters. Volume 34, Issue 10, Pages 1159-1168.
Doi: http://dx.doi.org/10.1016/j.patrec.2013.03.022 (impact
factor: 1.266)
2. Peer-reviewed international conferences
(a) Pain detection through shape and appearance features. R.A. Khan, A.
Meyer, H. Konik, S. Bouakaz. In IEEE International Conference on
Multimedia and Expo (ICME), San Jose, California, USA 2013. Pages
1-6. Doi: http://dx.doi.org/10.1109/ICME.2013.6607608
(acceptance rate 30 %).
(b) Human vision inspired framework for facial expressions recognition.
R.A. Khan, A. Meyer, H. Konik, S. Bouakaz. In International
Conference on Image Processing (ICIP), Orlando, USA 2012. Pages
2593-2596. Doi: http://dx.doi.org/10.1109/ICIP.2012.6467429
(acceptance rate 33 %).
(c) Exploring human visual system: study to aid the development of
automatic facial expression recognition framework. R.A. Khan, A.
Meyer, H. Konik, S. Bouakaz. In Computer Vision and Pattern
Recognition Workshop (CVPRW), Rhode Island, USA 2012. Pages
49-54. Doi: http://dx.doi.org/10.1109/CVPRW.2012.6239186
(d) Facial Expression Recognition using Entropy and Brightness Features.
R.A. Khan, A. Meyer, H. Konik, S. Bouakaz. In 11th International
10

Introduction Structure of the report
Conference on Intelligent Systems Design and Applications, Cordoba,
Spain 2011. Pages 737-742. Doi: http://dx.doi.org/10.1109/ISDA.
2011.6121744
3. French national conferences
(a) Une methode de reconnaissance des expressions du visage basee sur la
perception. R.A. Khan, A. Meyer, H. Konik, S. Bouakaz. In Atelier
VISAGES (Video-surveillance Intelligente : Systemes et AlGorithmES),
Reconnaissance des Formes et l’Intelligence Artificielle (RFIA), Lyon,
France. 2012.
4. Miscellaneous
(a) Separating superfluous from essential: which facial region(s) holds the
key for expression recognition?. R.A. Khan, H. Konik, . Dinet, A.
Meyer, S. Bouakaz. In 16th European Conferences on Eye Movements
(ECEM’2011), Marseille, France. 2011. Abstract published in the
Journal of Eye Movement Research, Vol.4, Issue 3 2011. URL:
http://www.jemr.org/online/4/3/1
5. Under review: Peer-reviewed journal
(a) Saliency based framework for facial expression recognition. R.A. Khan,
A. Meyer, H. Konik, S. Bouakaz. In Journal of Imaging Science and
Technology.
1.6 Structure of the report
As mentioned before, generally facial expression recognition framework consists
of three step: 1. face detection and tracking 2. feature extraction 3. expression
classification / recognition. Chapter 2 presents review of different state-of-the-art
methods for all of these three steps and, also provides insight to some of the
theories related to facial expressions from the fields of psychology and cognitive
science. Chapter 3 presents all the details related to our psycho-visual
11

Structure of the report Introduction
experimental study through which we determined which facial region(s) is
perceptually salient for a particular expression. Chapter 4 describes detail
related to our first proposed descriptor for facial expression recognition. To
rectify the drawbacks of this descriptor, we proposed in Chapter 5 second
descriptor, that analyzes shape for recognizing expressions. Finally, we proposed
in Chapter 6 another descriptor called pyramid of local binary pattern (PLBP)
to overcome shortcomings of the previously proposed descriptor/framework for
expression recognition. PLBP extends novel texture descriptor local binary
pattern (LBP), by creating pyramidal-based spatial representation of LBP
descriptor. PLBP works well for both high and low spatial resolution stimuli and
also is a part of framework that recognizes expression of “pain”. Chapter 7
describes conclusions of this research work along with the perspectives.
Supplementary details essential to understand this research work is presented
in the following appendices:
1. Appendix A (Facial expression databases): presents information related to
some of the most famous image/video databases used by the research
community to prove effectivness of their proposed methods for facial
expression recognition.
2. Appendix B (Gaze Maps): presents gaze maps recorded during psycho-visual
experimental study. It presents five video sequences / expression.
3. Appendix C (Color space conversion): illustrates equations to convert XY Z
color space coordinates to L∗a∗b∗ color space coordinates.
12

Chapter 2
Literature survey
Contents
2.1 Psychology and cognitive science on facial affect theory 14
2.1.1 Ekman’s six basic emotions . . . . . . . . . . . . . . . . 15
2.1.2 Facial Action Coding System (FACS) . . . . . . . . . . 17
2.1.3 Plutchik’s emotion wheel . . . . . . . . . . . . . . . . . 19
2.1.4 Russell’s circumplex model . . . . . . . . . . . . . . . . 21
2.2 Databases for facial expression recognition . . . . . . . 22
2.3 Automatic recognition of facial expressions . . . . . . . 25
2.3.1 Face detection and tracking . . . . . . . . . . . . . . . . 25
2.3.2 Feature extraction . . . . . . . . . . . . . . . . . . . . . 33
2.3.3 Expression classification / recognition . . . . . . . . . . 40
2.4 Drawbacks of the current methods and contributions . 46
2.4.1 Exploiting visual saliency . . . . . . . . . . . . . . . . . 46
2.4.2 Expressions different from six prototypical facial
expression . . . . . . . . . . . . . . . . . . . . . . . . . . 47
For the last forty years (specifically since 1974 [Par74]), computer vision
research community has shown a lot of interest in analyzing and automatically
recognizing facial expressions. Initially inspired by the findings of the cognitive
13

Psychology and cognitive science on facial affect theory Literature survey
scientists, the computer vision/science research community envisioned to develop
such frameworks that can do the job of expression recognition in videos or still
images.
Facial expressions are studied simultaneously by different scientists from
different domains i.e. cognitive scientists, psychologists, neuroscientists and
computer scientists etc. Although the algorithms proposed in this research work
fall in the category of “computer vision” but they are based on the psycho-visual
study (see Chapter 3). As the psycho-visual study is based on the principles of
cognitive science, Section 2.1 provides the overview of facial expression studies
from the cognition science literature. Section 2.2 briefly describes characteristics
of different databases used for evaluating and benchmarking different facial
expression analysis algorithms. Section 2.3 briefly covers core components of a
system that recognizes facial expressions automatically. Section 2.4 describes
limitations of current algorithms for expression recognition and associated
research contributions of this research work.
2.1 Psychology and cognitive science on facial
affect theory
Different channels contribute to complete the task of conversation, face being the
most important channel. Expressions displayed on the face not only shows clue
about emotional state but also intentions and mindset [EFE72, EF75, Ekm01,
Ekm93]. So, they can not only change the flow of conversation [Bul01] but also
provides the listeners a wealth of information without even uttering a single word
[Yng70]. According to [CLFD94, FDWS91] when the facial expression does not
coincide with the other communication i.e. spoken words, then the information
conveyed by the face gets more weight in decoding information. We are used to see
face with different expressions every day, but still sometimes we fail to understand
them. It is this paradox of the obvious and the mysterious that intrigues people
to study the face and facial expressions.
Facial expressions are studied since ancient times, one of the reason is that it
is one of the most important channel of non-verbal communication [AR92].
14

Literature survey Psychology and cognitive science on facial affect theory
Initially facial expressions were studied by great philosophers and thinkers like
Aristotle and Stewart. With Darwin, the study of facial expressions became an
empirical study. Darwin’s studies created large interest among psychologists and
cognitive scientists. The 20th century saw many studies relating facial expression
to emotion and inter-human communication. Most notably, Paul Ekman
reinvestigated Darwin’s work and claimed that there are six universal emotions
(see Figure 2.1), which are produced and recognised independently of cultural
background [Ekm71].
Facial expressions can either be interpreted in terms of shown affective states
(emotions) or in terms of activated facial muscles underlying the displayed facial
expression. These two approaches originate directly from the two major
approaches to facial expression measurement in psychological research: message
and sign judgement [CE05]. Message based approaches infer to what underlies a
displayed facial expression, such as affect. Cross-cultural studies by Ekman
[Ekm71, Ekm93] and the work by Izard [Iza09] demonstrated the universality
and discreteness of subset of facial expressions, which are referred as basic or
universal expressions. Generally, physical changes in face shape make the
descriptor for sign based approach. The most widely-used approach is that of
Ekman and colleagues, known as Facial Action Coding System (FACS) [EF78]
(See Subsection 2.1.2 for reference).
Following subsections describe different coding schemes for facial affect theory.
Specifically Subsection 2.1.1 describes Ekman’s six basic/universal expressions.
Subsection 2.1.2 describes Facial Action Coding System (FACS), while Subsection
2.1.3 describes psychologist Robert Plutchik’s insight to emotions. Subsection
2.1.4 describes theory of James A. Russell defining emotions in a two-dimensional
circular space, containing arousal and valence dimensions.
2.1.1 Ekman’s six basic emotions
The most commonly used facial expression coding system in the message
judgement approach relates to the six basic emotions / expressions proposed by
Ekman [Ekm71]. Each of those expressions possess a distinctive content together
with a unique facial expression. These six basic emotions are happiness, sadness,
15
Psychology and cognitive science on facial affect theory Literature survey
Figure 2.1: Example of expression for the six basic emotions (illustration takenfrom [Pan09]). Left-to-right from top row: disgust, happiness, sadness, anger, fear,and surprise.
fear, disgust, surprise and anger (see Figure 2.1 for illustration of these
expressions). These expressions are also referred as “universal” as they were
found to be universal across human ethnicities and cultures.
This theory of expressing emotions through a fixed set of universal emotions
was inspired by Darwin’s observations. According to Darwin expression of
emotions has evolved in humans from animals. Darwin argued that expressions
were unlearned and innate in human nature and were therefore evolutionary
significant for survival [Ekm06]. Darwin in his book “The Expression of the
Emotions in Man and Animals” [Dar72], concluded that “the young and the old
of widely different races, both with man and animals, express the same state of
mind by the same movements”. These observations, published in 1872 were left
undebated for almost 100 years. Then, in the 1960s, Ekman picked up his
research in an effort to validate Darwin’s theories. In this research work,
16

Literature survey Psychology and cognitive science on facial affect theory
Ekman’s six basic emotions are used extensively to test various proposed
frameworks for automatic recognition of the same.
2.1.2 Facial Action Coding System (FACS)
Facial Action Coding System (FACS) [EF78] is the most widely used sign
judgement system and it describes the facial expressions in terms of 46
component movements (facial anatomical movements) or action units (AUs)(see
Figure 2.2 for examples of AUs), which roughly corresponds to a distinct muscle
or muscle group. Figures 2.3, 2.4 and 2.5 shows action units (AUs) in the upper
face, in the lower face, and AUs that cannot be classified as belonging to either
the upper or the lower face.
Figure 2.2: Some examples of Action Units. Action Units are atomic facial muscleactions described in FACS (Illustration from [Val08]).
AUs are considered to be the smallest visually discernable facial movements.
They are atomic, meaning that no AU can be split into two or more smaller
components. Any facial expression can be uniquely described by a combination of
AUs.
2.1.2.1 FACS AU combinations and intensity
As AUs represent the “atoms” of facial expressions, multiple AUs often occur
simultaneously. Out of 46 AUs 30 AUs are anatomically related to the contractions
of specific facial muscles: 12 are for upper face, and 18 are for lower face. When
AUs occur in combination they may be additive, in which the combination does
not change the appearance of the constituent AUs, or non-additive, in which the
17

Psychology and cognitive science on facial affect theory Literature survey
Figure 2.3: Upper facial Action Units (Illustration taken from [Val08]).
Figure 2.4: Lower facial Action Units (Illustration from [Val08]).
Figure 2.5: Action Units belonging to neither the upper nor the lower facial area(Illustration from [Val08]).
18

Literature survey Psychology and cognitive science on facial affect theory
appearance of the constituents does change [TKC01]. So far, about 7000 valid AU
combinations have been identified within the FACS framework.
Further relationships among multiple AUs exist as well. For instance, in certain
AU combinations, the dominant AU may completely mask the presence of another,
subordinate action unit. For certain such combinations, special rules have been
added to FACS so that the subordinate AU is not scored at all [Val08].
In addition to determining which AUs are contained within the face, the
intensity of each AU present must also be ascertained. Intensity is rated on a
scale from A (least intense) through E (most intense). Criteria for each intensity
level are given in the FACS Manual for each AU.
2.1.2.2 Drawbacks of Facial Action Coding System (FACS)
1. FACS codes often reveal unnecessary details that can hamper facial
expression recognition approaches. The sheer number of combinations
(7000 AU combinations) can lead to a bad generalization performance as it
is virtually impossible to have access to a training database that covers all
possible AU combinations while featuring a sufficient number of instances
of specific facial expressions [FMGP04].
2. Secondly, the problem with using FACS is the time required to code every
frame of the video. FACS was envisioned for manual coding by FACS human
experts. It takes over 100 hours of training to become proficient in FACS,
and it takes approximately two hours for human experts to code each minute
of video [LBL07].
Above mentioned drawbacks of FACS make it impractical for real life scenarios.
2.1.3 Plutchik’s emotion wheel
While Ekman proposed that there are six basic emotions, psychologist Robert
Plutchik on the other hand, proposed a model of human emotions with eight
primary emotions. The emotions are organized in pairs of opposites: joy versus
sadness; trust versus disgust; fear versus anger and anticipation versus surprise
[Plu80]. Every other emotion can be produced by mixing the primary ones. The
19

Psychology and cognitive science on facial affect theory Literature survey
model resulted in a circumplex where emotions and variations are represented
by different colors and hues (see Figure 2.6). The three dimensional circumplex
model describes the relationships between concepts of emotion with each emotion
smoothly flowing into another when we traverse a path on the surface of the 3-
dimensional cone.
Figure 2.6: Plutchik’s emotion wheel (left) and the accompanying emotion cone(right).
The cone’s vertical dimension represents the intensity of the emotion and the
position on the circle defines in what basic emotion sector we are. The eight sectors
are designed to indicate that there are eight primary emotion dimensions, formed
by four pairs of opposites. Secondary emotions are produced by combinations of
primary emotions that are adjacent on the emotion wheel. For instances, Plutchik
characterises love as a combination of joy and acceptance, whereas submission is
a combination of acceptance and fear.
The reason for inclusion of the eight primary emotions is that they all have
a direct relation to adaptive biological processes. For instance, when we gain a
valued object, the cognitive process is that we possess and thus we feel joy. The
20

Literature survey Psychology and cognitive science on facial affect theory
associated action would be to retain this state or repeat the process, gaining more
valued objects and thereby feeling joy again. The theory is very much based on
our inner state, i.e. on the way we actually feel.
On the contrary, it is often inadequate to describe emotions of every-day life by
mixtures of basic emotions as these are assumed to be full-blown, and in everyday
life, full-blown emotions occur very rarely i.e. love = joy + acceptance. So, the
description secondary emotions is dubious. Secondly, Plutchik’s system does not
explain how emotions can be systematized so categorically without taking into
account all of the overlaps and crossovers from one to the other. These problems
contributes to non utilization of this model in computer vision research community.
2.1.4 Russell’s circumplex model
Many cognitive scientists oppose the theory of a set of discrete, basic emotions
[Man84, Rus95]. Some of these opponents instead take a dimensional view of the
problem [SBR10]. In their view, affective states are not discrete and independent
of each other, instead they are systematically related to one another [CB94, MR73].
Perhaps the most influential of the scientists who proposed this systematic
view is James A. Russell. He proposed a system of two bipolar continui, namely
valence and arousal [Rus80]. Valence roughly ranges from sadness to happiness
while arousal ranges from boredom or sleepiness to frantic excitement. According
to Russell, emotions lie on a circle in this two dimensional space (see Figure 2.7),
and are characterized by fuzzy categories clustered on axes such as valence, arousal,
or dominance.
While a continuous space could possibly represent all possible facial expressions,
this is not guaranteed by Russell’s theory and indeed has not been shown. It is
unclear how a facial expression should be mapped to the space or, vice versa,
how to define regions in the valence/arousal space that correspond to a certain
facial expression. Being a judgement system that is based on feeling, it is again
problematic to use this system to describe non-emotional communicative signals.
All this leads to the conclusion that this system is not suitable for computer vision
community [Val08].
21

Databases for facial expression recognition Literature survey
Figure 2.7: Russells circumplex model of emotions.
In this research work, Ekman’s six basic emotions are used extensively to test
various proposed frameworks for automatic recognition of expression. This is due
to the fact that Ekman’s six basic emotions are well suited for the computer vision
application (classifying in discrete classes) and most of the state-of-the-art methods
show their results on it.
Recently affect analysis research is moving from recognizing discrete classes of
emotion to continuum emotion recognition. The rationale behind this shift is that
the full spectrum of human emotion cannot be expressed by a few discrete classes.
Emotion is better represented by continuous values on multiple attribute axes such
as valence, activation or dominance [MKH+07]. This point is discussed in detail
in Section 7.2.
2.2 Databases for facial expression recognition
Generally, for evaluating and benchmarking different facial expression analysis
algorithms, standardised databases are needed to enable a meaningful
22

Literature survey Databases for facial expression recognition
comparison. In the absence of comparative tests on such standardised databases
it is difficult to find relative strengths and weaknesses of different facial
expression recognition algorithms. Cohn-Kanade(CK) database, which is also
known as the CMU-Pittsburg AU coded database [KCT00] has some how
emerged as that standardised databases. This is a fairly extensive database and
has been widely used by the face expression recognition community. Refer to
Appendix Section A.1 for more information on CK database.
For explanation of different databases refer to Appendix A. Some of the
databases that are described in the appendix are used during the course of this
thesis. Few of the characteristics that create difference between databases are
[TKCis].
1. Individuality of subjects. Face shape, skin texture, facial hairs, wether
subjects wear eye glasses/sun glasses, sex, ethnicity and age group of subjects
are some of the factors that differentiate databases. Some databases use
only females as a subject, for example Japanese Female Facial Expression
Database (JAFFE) contains images of only Japanese females.
2. Deliberate versus spontaneous expression. Most face expression
databases have been collected by asking subjects to perform a series of
expressions i.e. CK, JAFFE, AR etc (for discussion on different database
refer to Appendix A). These directed facial action tasks may differ in their
characteristics, temporal dynamics and timings from spontaneously
occurring behavior [ER05]. The same has been proved by Bartlett et al.
[BLB+02].
Recently efforts are growing towards automatic analysis of spontaneous
expressions but research needs to be done to recognize wide array of
spontaneous expressions. For example MMI Facial Expression Database
contain spontaneous emotive content (see Appendix Section A.2 for more
information). Another database that is recently used for spontaneous
expression analysis is RU-FACS database [BLF+06] but this database is
not available publically.
23

Databases for facial expression recognition Literature survey
3. Image sequence resolution. Most of the existing state-of-the-art systems
for expressions recognition report their results on high resolution images
without reporting results on low resolution images. But there are many
real world applications that require expression recognition system to work
amicably on low resolution images. Smart meeting, video conferencing and
visual surveillance are some examples of such applications. In this thesis I
have worked on the problem of low resolution input image sequences but
those low resolution input image sequences were created by subsampling the
original high resolution images from CK database. There is a need of a
standard database which contains stimuli in low resolution so that different
methods can be compared in more systematic way.
4. Head/face Orientation. Face orientation with respect to camera
influences the performance of different algorithms for expression
recognition. In literature, not much effort is done on developing algorithms
for facial expression recognition that are invariant to camera angle. There
exist some databases that contain emotive content having different camera
angles i.e. MMI facial expression database [PVRM05] and FERET [MP98].
5. Background clutter. Image sequence recorded in a complex background
makes the task of automatic facial expression recognition even more difficult
as the complex background influences accuracy of automatic face detection,
feature tracking, and expression recognition. Most of the available database
have a neutral or very persistent background.
6. Varrying illumination. It is desired that algorithms for automatic
expression recognition should be invariant to lighting conditions. Very few
publically available databases record stimuli in varrying illumination. One
of such database is CAS-PEAL [GCS+04]. The CAS-PEAL (pose,
expression, accessory, lighting) Chinese face database was collected at the
Chinese Academy of Sciences (CAS) between August 2002 and April 2003.
For more information on this database, refer to Appendix Section A.6.
24
Literature survey Automatic recognition of facial expressions
2.3 Automatic recognition of facial expressions
The general approach to automatic facial expression analysis consists of three
steps (refer Figure 2.8): face detection and tracking, feature extraction and
expression classification / recognition. Face detection stage processes stimuli to
automatically find the face region from the input images or sequences. After face
is located, the next step is to extract meaningful or discriminative information
caused by facial expressions. Facial expression recognition is the last stage of the
systems. The facial changes can be identified either as prototypic emotions or
facial action units(refer Sections 2.1.1 and 2.1.2 for details). In the following
subsections (Section 2.3.1: face detection, Section 2.3.2: feature extraction and
Section 2.3.3: expression classification ), I will briefly cover the literature on all
of the above mentioned three steps.
Figure 2.8: Automatic facial expression recognition system pipeline.
2.3.1 Face detection and tracking
The first step in facial expression analysis is to detect the face in the given image
or video sequence. Locating the face within an image is termed as face detection
or face localization whereas locating the face and tracking it across the different
frames of a video sequence is termed as face tracking. Research in the fields of
face detection and tracking has been very active and there is exhaustive literature
available on the same. It is beyond the scope of this thesis report to introduce and
survey all of the proposed methods.
25

Automatic recognition of facial expressions Literature survey
Methods for face detection can be grouped into four categories [YKA02]:
knowledge-based methods, feature invariant approaches, template matching
methods, and appearance-based methods.
2.3.1.1 Knowledge-based methods
Knowledge-based methods use pre-defined rules to determine a face based on
human knowledge. Usually, the rules capture the relationships between facial
features. It is trivial to find simple rules to describe the features of a face and
their relationships. For example, face appears in an image with two eyes
(usually), a nose and a mouth. To describe relationship between features,
distance and relative position are good metric.
Yang and Huang used a hierarchical knowledge-based method to detect faces
[YH94]. They proposed three level system, where at first level all possible face
candidates are found. The rules at a higher level are general descriptions of what
a face looks like while the rules at lower levels rely on details of facial features.
Motivated by the simplicity of the approach proposed by Yang and Huang
[YH94], Kotropoulos and Pitas [KP97] proposed face detection algorithm which
extends their method. Kotropoulos’s method [KP97] makes computationally
complex algorithm of Yang’s [YH94] much simpler. Mekami and
Benabderrahmane proposed [MB10] algorithm that not only detects face but also
its inclination. They used Adaboost learner for face detection. For the
calculation inclination, they used an eyes detector. Then the line passing through
the two eyes is identified, and the angle to horizon is calculated.
Problem with this approach is the difficulty in translating human knowledge
into rules. If the rules are detailed (i.e., strict), they may fail to detect faces that
do not pass all the rules. If the rules are too general, they may give many false
positives. Moreover, it is difficult to extend this approach to detect faces in
different poses since it is challenging to enumerate all the possible cases. On the
other hand, heuristics about faces work well in detecting frontal faces in
uncluttered scenes.
26

Literature survey Automatic recognition of facial expressions
2.3.1.2 Feature invariant approaches
Feature invariant approaches aim to find face structure features that are robust
to pose and lighting variations. These methods use primitives physical properties
of the face and rely on numerous heuristics for the proper choice of the data
patterns extracted from the image. Usually these methods perform low level
analysis (or early vision) on stimuli to find and extract discriminative features.
Based on the extracted features, a statistical model is built to describe their
relationships and to verify the existence of face. Different extracted features are
often specific to the context at hand, and are constructed empirically on colour,
edge or texture cues.
Facial features: Sirohey proposed method to detect face from a cluttered
background [Sir93]. The method uses an edge map (Canny detector) and
heuristics to remove and group edges so that only the ones on the face contour
are preserved. Leung et al. developed a probabilistic method to locate a face in a
cluttered scene based on local feature detectors and random graph matching
[LBP95]. Han et al. developed a morphology-based technique to extract
“eye-analogue segments” for face detection [HMHY+97]. They argue that eyes
and eyebrows are the most salient and stable features of human face and, thus,
useful for detection. They define eye-analogue segments as edges on the contours
of eyes.
Skin color: human skin color has been used and proven to be an effective
feature in many applications from face detection to hand tracking. Saxe and
Foulds proposed an iterative skin identification method that uses histogram
intersection in HSV color space [SF96]. First an initial patch of skin color is
selected by the user and then iteratively algorithms find similar patch. Similarity
is measured by histogram intersection of two color patches. Huang et al.
[HAL09] proposed system to detect face based on skin tone filter. Zhang et al.
[ZZH09] proposed system to detect multiple faces in a video using centroids of
image in RGB color space. Khandait and Thool [KT09] has also proposed an
algorithm to detect faces using color information. They have proposed a hybrid
27
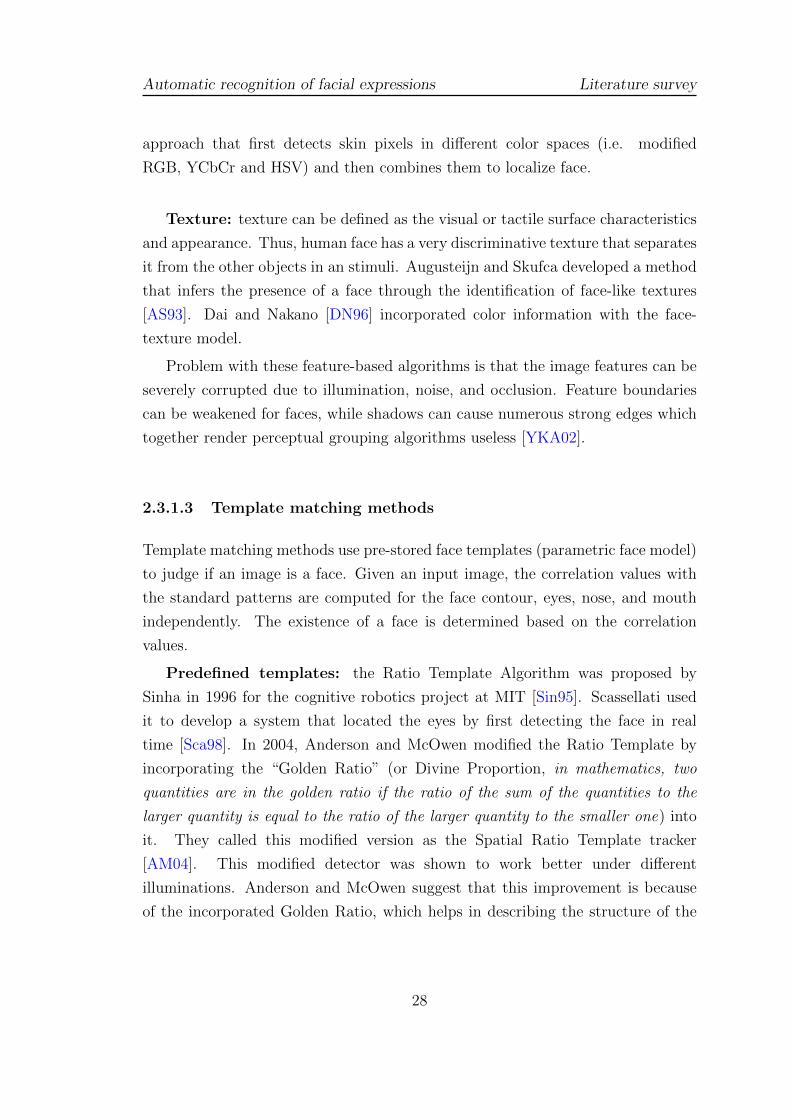
Automatic recognition of facial expressions Literature survey
approach that first detects skin pixels in different color spaces (i.e. modified
RGB, YCbCr and HSV) and then combines them to localize face.
Texture: texture can be defined as the visual or tactile surface characteristics
and appearance. Thus, human face has a very discriminative texture that separates
it from the other objects in an stimuli. Augusteijn and Skufca developed a method
that infers the presence of a face through the identification of face-like textures
[AS93]. Dai and Nakano [DN96] incorporated color information with the face-
texture model.
Problem with these feature-based algorithms is that the image features can be
severely corrupted due to illumination, noise, and occlusion. Feature boundaries
can be weakened for faces, while shadows can cause numerous strong edges which
together render perceptual grouping algorithms useless [YKA02].
2.3.1.3 Template matching methods
Template matching methods use pre-stored face templates (parametric face model)
to judge if an image is a face. Given an input image, the correlation values with
the standard patterns are computed for the face contour, eyes, nose, and mouth
independently. The existence of a face is determined based on the correlation
values.
Predefined templates: the Ratio Template Algorithm was proposed by
Sinha in 1996 for the cognitive robotics project at MIT [Sin95]. Scassellati used
it to develop a system that located the eyes by first detecting the face in real
time [Sca98]. In 2004, Anderson and McOwen modified the Ratio Template by
incorporating the “Golden Ratio” (or Divine Proportion, in mathematics, two
quantities are in the golden ratio if the ratio of the sum of the quantities to the
larger quantity is equal to the ratio of the larger quantity to the smaller one) into
it. They called this modified version as the Spatial Ratio Template tracker
[AM04]. This modified detector was shown to work better under different
illuminations. Anderson and McOwen suggest that this improvement is because
of the incorporated Golden Ratio, which helps in describing the structure of the
28

Literature survey Automatic recognition of facial expressions
human face more accurately. The Ratio Template and the Spatial Ratio
Template are shown in Figure 2.9.
Figure 2.9: The image on the left is the Ratio Template (14 pixels by 16 pixels).The template is composed of 16 regions (gray boxes) and 23 relations (arrows).The image on the right is the Spatial Ratio Template. It is a modified version ofthe Ratio Template by incorporating the Golden Ratio.
Deformable templates: the technique of deformable template has gained a
lot of interest for face detection and tracking. Generally deformable model based
methods work in two phases. The first phase is the creation of model/template,
which can be used to generate a set of plausible representations in terms of shape
and/or texture of the face. The second phase (segmentation phase) is to find the
optimal parameters of variation of the model, in order to match the shape and/or
the texture of the face in an unknown stimuli.
The active shapemodels (ASM), introduced by Cootes and Taylor [CHTH94],
are deformable models which depict the highest level of appearance of the face
features. Once initialized near a facial component, the model modifies its local
characteristics (outline, contrast) and evolves gradually in order to take the shape
of the target feature i.e. face. One disadvantage of ASM is that it only uses shape
constraints(together with some information about the image structure near the
landmarks), and does not take advantage of all the available information. The
active appearance models (AAM) are an extension of the ASM by Cootes et al.
[CET98]. The use of third dimension, namely the temporal one, can lead to a real-
29

Automatic recognition of facial expressions Literature survey
time 3D deformable face model varying according to morphological parameters
during a video sequence.
Generally, the drawback of predefined and deformable template methods for
face detection are their inadequacy for dealing with variation in scale, pose, and
shape. Secondly, the problem of AAM is that it fails to register face when either
the initial shape estimate of face is too far off and / or the appearance model
fails to direct search toward a good match. Another limitation of AAM is the
computational complexity associated with the training phase of it [LBHW07].
2.3.1.4 Appearance-based methods
Unlike template-matching method which rely on a predefined template or model,
appearance-based methods use large numbers of examples (images of faces and or
facial features) depicting different variations (face shape, skin color, eye color,
open closed mouth, etc). Face detection in this case can be viewed as a pattern
recognition problem with two classes: face and nonface [MB10]. In general,
appearance-based methods rely on techniques from statistical analysis and
machine learning to find the relevant characteristics of face and nonface images
[YKA02]. Seminal work in appearance-based methods for face detection are
based on eigenfaces [TP91], neural networks [RBK96], support vector machines
[OFG97] and hidden Markov models [NH98].
Adaboost (proposed by Freund and Schapire [FS95]) has also been used by
several researchers to create robust system for detection of objects in real time
[KT04a]. Papageorgiou et al. in [POP98] have used this algorithm to detect
pedestrians using the Haar wavelet to extract discriminating features. Inspired
by the algorithm proposed by Papageorgiou et al. in [POP98], Paul Viola and
Michael Jones [VJ01] proposed algorithm for face detection.
In this research work, we have used Viola-Jones object detection algorithm for
detecting face / salient facial regions as it is the most cited and considered the
fastest and most accurate pattern recognition method for face detection [KT04b].
Viola-Jones object detection algorithm is explained below.
Viola and Jones algorithm. Viola and Jones method combines incorporate
following four key concepts:
30

Literature survey Automatic recognition of facial expressions
1. Haar-like features : The first contribution of Viola and Jones algorithm is
computational simplicity for feature extraction. The features used by their
method are called Haar-like features. Haar-like features are explained in
Section 2.3.2.1.
2. Integral image: To rapidly compute Haar-like features Viola and Jones
proposed intermediate representation for the image, called integral image.
The integral value for each pixel location (x, y) is the sum of all the pixels
above it and to the left of (x, y) inclusive (refer Equation 2.1):
ii(x, y) =∑
x′≤x,y′≤y
i(x′, y′) (2.1)
where ii(x, y) is the integral image and i(x, y) is the original image.
Using the integral image any rectangular sum can be computed in four array
references (see Figure 2.10). Clearly the difference between two rectangular
sums can be computed in eight references. Since the two-rectangle features
defined above involve adjacent rectangular sums they can be computed in six
array references, eight in the case of the three-rectangle features, and nine
for four-rectangle features [VJ01].
3. AdaBoost machine-learning method : Viola and Jones have chosen a variant
of training algorithm called AdaBoost, first proposed by Freund and Schapire
[FS95]. This training algorithm is used to determine the presence Haar-like
feature by setting threshold levels. Threshold value is used to determine
the presence of a Haar-like feature (the sum of pixels values in the shaded
rectangle is subtracted from the white rectangle). If the difference is above
a threshold, that feature is said to be present.
Secondly, within any image subwindow the total number of Haar-like
features is very large, far larger than the number of pixels. In order to
ensure fast classification, the learning process must exclude a large
majority of the available features, and focus on a small set of critical
features. To achieve this goal, the weak learning algorithm is proposed by
Viola Jones which selects the single rectangle feature which best separates
31

Automatic recognition of facial expressions Literature survey
Figure 2.10: The sum of the pixels within rectangle D can be computed with fourarray references. The value of the integral image at location 1 is the sum of thepixels in rectangle A. The value at location 2 is A+B, at location 3 is A+C, andat location 4 is A+B+C+D. The sum within D can be computed as 4+1-(2+3).Illustration taken from [VJ01].
the positive and negative examples. For each feature, the weak learner
determines the optimal threshold classification function, such that the
minimum number of examples are misclassified [VJ01].
Learning algorithm combines many weak classifiers to create one strong
classifier. Weak here means the classifier only gets the right answer a little
more often than random guessing would. Then, this learning algorithm
selects a set of weak classifiers to combine and assigns a weight to each.
This weighted combination is the strong classifier.
4. Cascades of classifiers : Viola and Jones introduced a method for combining
successively more complex classifiers in a cascade structure for increased
detection performance while radically reducing computation time. The
rational behind this is to construct boosted classifiers which reject many of
the negative sub-windows while detecting almost all positive instances.
Simpler classifiers are used to reject the majority of subwindows before
more complex classifiers are called upon to achieve low false positive rates
[VJ01]. Each stage is only required to eliminate slightly more than 50% of
32

Literature survey Automatic recognition of facial expressions
false detection as long as it kept the positive hit rate close to 100%. An
illustration of such cascaded structure is shown in Figure 2.11.
Figure 2.11: Schematic depiction of a the detection cascade. A series of classifiersare applied to every sub-window. The initial classifier eliminates a large numberof negative examples with very little processing. Subsequent layers eliminateadditional negatives but require additional computation. After several stagesof processing the number of sub-windows have been reduced radically. Furtherprocessing can take any form such as additional stages of the cascade or analternative detection system. Illustration taken from [VJ01].
2.3.2 Feature extraction
After detecting face in input stimuli, feature selection is one of the most
important step to successfully analyze and recognize facial expressions
automatically. The optimal features should minimize within-class variations of
expressions while maximize between class variations. If inadequate features are
used, even the best classifier could fail to achieve accurate recognition [SGM09].
In literature, various methods are employed to extract facial features and these
methods can be categorized either as appearance based methods or geometric
feature based methods. Geometric features present the shape and locations of
facial components (including mouth, eyes, brows, nose), while the appearance
features present the appearance (skin texture) changes of the face, such as
wrinkles and furrows [TKCis].
33

Automatic recognition of facial expressions Literature survey
2.3.2.1 Appearance based methods
Different methods that are usually employed to extract appearance information
are:
1. Gabor Features
2. Haar-like features
3. Local Binary Pattern (LBP) features
Brief overview of the above mentioned features are given below.
Gabor Features: the Gabor decomposition of an image is computed by
filtering the input image with a Gabor filter, which can be tuned to a particular
frequency k0 = (u, v), where k = ‖k0‖ is the scalar frequency and ϕ=arctan(uv
)is the orientation. Gabor filters accentuate the frequency components of the
input image which lie close to k and ϕ in spatial frequency and orientation,
respectively. A Gabor filter can be represented in the space domain using
complex exponential notation as:
Fk0 =k0
2
σ2exp
(−k0
2x2
2σ2
)(exp(ik0.x)− exp
(−σ
2
2
))(2.2)
where x = (x, y) is the image location and k0 is the peak response frequency
[LVB+93]. An example of a Gabor filter is given in Figure 2.12, which shows the
absolute value (left), real component (middle), and imaginary component (right)
of the filter in the space domain.
For expression analysis, often a filter bank of multiple Gabor filters tuned to
different characteristic frequencies and orientations is used for feature extraction.
The combined response is called a jet. Filter banks typically span at least 6
different orientations and have frequencies spaced at half-octaves. Prior to
classification, the extracted features are usually converted into real numbers by
calculating the magnitude of the complex filter response.
Examples of different methods that uses Gabor features are
[LBF+06, Tia04, DBH+99]. Littlewort et al. [LBF+06] has shown a high
recognition accuracy (93.3% for Cohn-Kanade facial expression database
34

Literature survey Automatic recognition of facial expressions
Figure 2.12: The left, middle, and right graphics above show the absolute value,and the real and imaginary components of a sample Gabor filter.
[KCT00]) using Gabor features. They proposed to extract Gabor features from
the whole face and then selected the subset of those features using AdaBoost
method. Tian [Tia04] has used Gabor wavelets of multi-scale and
multi-orientation at the “difference” images. The difference images were obtained
by subtracting a neutral expression frame from the rest of the frames of the
sequence. Donato et al. [DBH+99] has employed the technique of dividing the
facial image into two: upper and lower face to extract finer Gabor representation
for classification. Generally, the drawback of using Gabor filters is that it
produces extremely large number of features and it is both time and memory
intensive to convolve face images with a bank of Gabor filters to extract
multi-scale and multi-orientational coefficients [SGM09].
Haar-like features: Viola and Jones face detector [VJ01] introduced
Haar-like features due to their computational simplicity for feature extraction.
Haar-like features owe their name to their intuitive similarity with Haar wavelets.
Haar wavelets are single wavelength square waves (one high interval and one low
interval). In two dimensions, a square wave is a pair of adjacent rectangles - one
light and one dark. The actual rectangle combinations used for visual object
detection are not true Haar wavlets. Instead, they contain rectangle
combinations better suited to visual recognition tasks. Because of that difference,
these features are called Haar-like features, rather than Haar wavelets.
35

Automatic recognition of facial expressions Literature survey
Figure 2.13: The basic haar-like feature template.
In the Figure 2.13, the basic Haar-like feature templates are displayed. And
the process of Haar-like feature extraction on a face image is shown in the Figure
2.14. The key advantage of a Haar-like feature over most other features is its
calculation speed [PS10]. Due to the use of integral images (see Section 2.3.1 for
details), a Haar-like feature of any size can be calculated in constant time [VJ01].
Because of this advantages of Haar-like feature, researchers also applied it on
facial expression analysis [YLM10, WO06] and got promising performance. Yang
et al. [YLM10] extracted Haar-like features from the facial image patches (49
sub-windows). Compositional features based on minimum error based
optimization strategy were build within the Boosting learning framework. The
proposed method was tested on Cohn-Kanade facial expression database[KCT00]
and it achieved average recognition accuracy of 92.3% on the apex data (last
three frames of the sequence) and 80% on the extended data (frames from onset
to apex of the expression).
Local Binary Pattern (LBP) features: LBP features were initially
proposed for texture analysis [OPH96], but recently they have been successfully
used for facial expression analysis [ZP07, SGM09]. The most important property
of LBP features are their tolerance against illumination changes and their
computational simplicity [OP99, OPH96, OPM02]. The operator labels the
pixels of an image by thresholding the 3 x 3 neighbourhood of each pixel with
the center value and considering the result as a binary number. Then the
histogram of the labels can be used as a texture descriptor. Formally, LBP
operator takes the form:
36

Literature survey Automatic recognition of facial expressions
Figure 2.14: Haar-like features extracted from different position and different scaleon the face image.
LBP (xc, yc) =7∑
n=0
s(in − ic)2n (2.3)
where in this case n runs over the 8 neighbours of the central pixel c, ic and in
are the grey level values at c and n and s(u) is 1 if u ≥ 0 or 0 otherwise.
Shan et al. [SGM09] applied the LBP features on facial expression
recognition and also got promising performance. Zhao et al. [ZP07] proposed to
model texture using volume local binary patterns (VLBP) an extension to LBP,
for expression recognition. Average FER accuracy of 96.26% was achieved for six
universal expression with their proposed model on Cohn-Kanade facial
expression database [KCT00]. Due to both spacial and temporal information is
considered in VLBP, it got better result comparing with the traditional LBP.
Inspired by Shan’s and Zhao’s work we also used LBP features in a novel
fashion (See Chapter 6 for details). We extended LBP descriptor to Pyramid
LBP (PLBP). PLBP is a pyramidal-based spatial representation of local binary
pattern (LBP) descriptor. PLBP represents stimuli by their local texture (LBP)
and the spatial layout of the texture. The spatial layout is acquired by tiling the
37

Automatic recognition of facial expressions Literature survey
image into regions at multiple resolutions. We obtained very good results using
our novel approach on different databases and the proposed descriptor performed
much better than other state-of-the-art descriptors on low resolution images.
2.3.2.2 Geometric feature based methods
As mentioned earlier, geometric features present the shape and locations of facial
components (including mouth, eyes, brows, nose). Thus, the motivation for
employing a geometry-based method is that facial expressions affect the relative
position and size of various facial features, and that, by measuring the movement
of certain facial points, the underlying facial expression can be determined
[ZJ05, PP06, VPP05, BGJH09, PPNH06, VP06]. In order for geometric methods
to be effective, the locations of these fiducial points must be determined
precisely; in real-time systems, they must also be found quickly. The exact type
of feature vector that is extracted in a geometry-based facial expression
recognition systems depends on
1. which points on the face are to be tracked,
2. whether 2-D or 3-D locations are used,
3. the method of converting a set of feature positions into the final feature
vector.
Active shape models (ASMs) [CHTH94] are statistical models of the shape
of objects which iteratively deform to fit to an example of the object in a new
image. One disadvantage of ASM is that it only uses shape constraints (together
with some information about the image structure near the landmarks), and does
not take advantage of all the available information: the texture across the target.
Therefore, active appearance model (AAM) [CET98] which is related to ASM
is proposed for matching a statistical model of object based on both shape and
appearance to a new image. Like the ASM, AAM is also built during a training
phase: on a set of images, together with coordinates of landmarks that appear in
all of the images, is provided to the training supervisor. AAM could be looked as
the hybrid methods based on both geometric and appearance features.
38

Literature survey Automatic recognition of facial expressions
The typical examples of geometric-feature-based methods are those of Pantic
and her colleagues [PPNH06, VP06], who used a set of facial characteristic points
around the mouth, eyes, eyebrows, nose, and chin. Figure 2.15 shows the
landmarks in Pantic’s work, and through tracking these landmarks, the motion
information is obtained to do expression recognition.
Figure 2.15: Demonstration Landmarks on the face.
Zhang et al. [ZJ05] measured and tracked the facial motion using Kalman
Filters. To achieve the expression recognition task they have also modeled the
temporal behaviors of the facial expressions using Dynamic Bayesian networks
(DBNs). In [VPP05] authors have presented Facial Action Coding System’s
(FACS) [EF78] Action Unit (AU) detection scheme by using features calculated
from the “Particle Filter” tracked fiducial facial points. They trained the system
on the MMI-Facial expression database [PVRM05] and tested on the
Cohn-Kanade database [KCT00] and achieved recognition rate of 84%. Bai et al.
[BGJH09] extracted only shape information using Pyramid Histogram of
Orientation Gradients (PHOG) and showed the “smile” detection accuracy as
high as 96.7% on Cohn-Kanade database [KCT00]. PHOG is a spatial shape
descriptor and it describes object appearance and shape by the distribution of
39

Automatic recognition of facial expressions Literature survey
intensity gradients or edge directions. More information on PHOG is given in
Chapter 5.
Research has been done with success in recent times to combine features
extracted using appearance-based methods and geometric feature-based methods
[KZP08, DAGG11]. The key problem with geometric methods is to precisely
locate the landmark and track it. In the real applications, due to the pose and
illumination variations, small resolution input images, and the noise from the
background, it is still very hard to precisely locate the landmarks.
2.3.3 Expression classification / recognition
Last step of automatic expression analysis system is classification. Some system
directly classify expressions while others classify expressions by first recognizing
particular action units “AU” [EF78] (see Section 2.1.2 for description of FACS
(facial action coding system) and AU). According to [Mit97] classification deals
with labelling new sample/data on the basis of a training data containing
observations (or instances) whose category membership is known (supervised
learning).
Some of the most frequently used classification techniques are:
1. Template based methods
2. Support Vector Machines based methods
3. Boosting based methods
4. Classification Trees
5. Instance Based Learning
6. Naive Bayes Classifiers
2.3.3.1 Template based methods
The template-based techniques are simple face representation and classification
methods. They just compare the new images with the learned template which
normally is the average of the images in the same category. These methods have
40

Literature survey Automatic recognition of facial expressions
limited recognition capabilities, because the averaging process always causes
smoothing of some important individual facial details, and misalignment of the
faces also impacts the template. Another problem is the inability of this
technique to cope with large inter-personal expression differences [Yan11]. Due to
all of these problems template based classification methods are not used much in
facial expression analysis now. Examples of facial feature analysis systems that
reported their recognition accuracy using this technique are
[EP95, AHP04, SGM09].
2.3.3.2 Support Vector Machines based methods
Support Vector Machines (SVMs) are state-of-the-art large margin classifiers which
have recently gained popularity within visual pattern recognition. In this section,
a brief review of the theory behind this algorithm is presented, for more details we
refer reader to [Vap98].
We have L training points, where each input Xi has D attributes (i.e. is of
dimensionality D) and is in one of two classes yi = −1 or +1, i.e our training data
is of the form:
{xi, yi} where i = 1 . . .L, yi ∈ {-1, 1}, x ∈ <D
Here we assume the data is linearly separable, meaning that we can draw a line
on a graph of x1 vs x2 separating the two classes when D = 2 and a hyperplane
on graphs of x1, x2 . . . xD for when D >2.
This hyperplane can be described by w.x+ b = 0 where:
1. w is normal to the hyperplane.
2. b‖w‖ is the perpendicular distance from the hyperplane to the origin.
Support Vectors are the examples closest to the separating hyperplane and the
aim of Support Vector Machines (SVM) is to orientate this hyperplane in such a
way as to be as far as possible from the closest members of both classes.
Referring to Figure 2.16, implementing a SVM boils down to selecting the
variables w and b so that our training data can be described by:
w.x+ b ≥ +1 for yi = +1 (2.4)
41
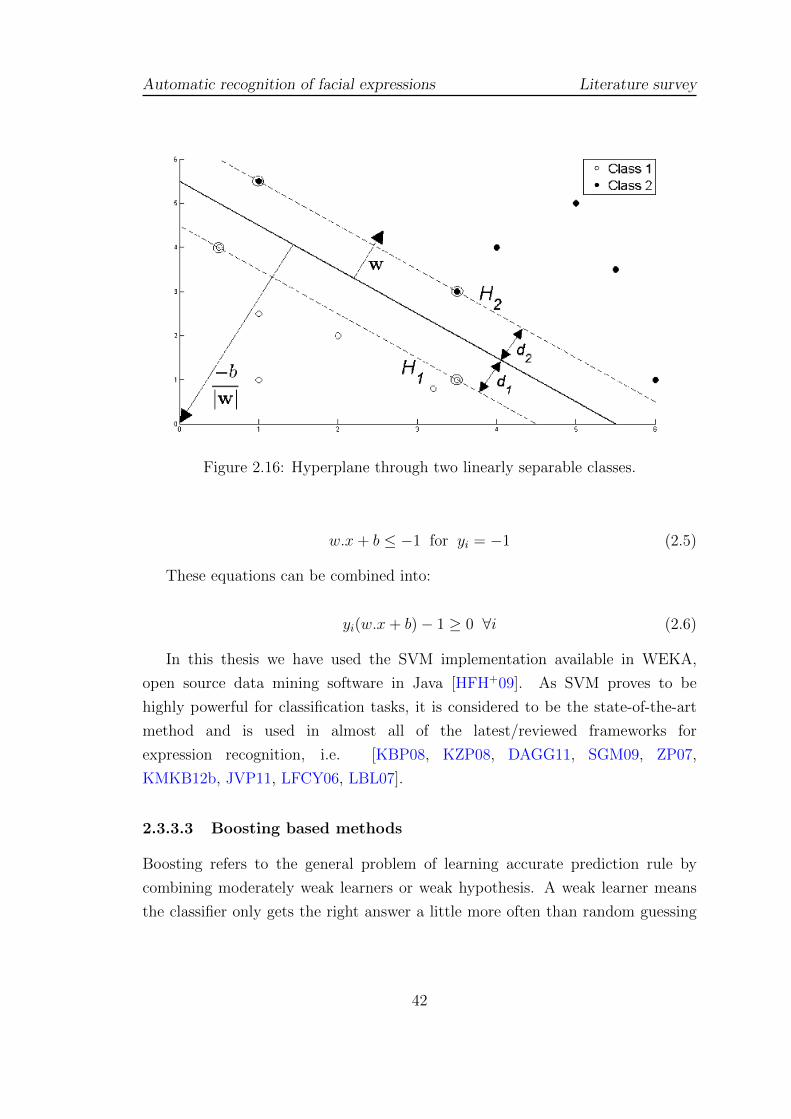
Automatic recognition of facial expressions Literature survey
Figure 2.16: Hyperplane through two linearly separable classes.
w.x+ b ≤ −1 for yi = −1 (2.5)
These equations can be combined into:
yi(w.x+ b)− 1 ≥ 0 ∀i (2.6)
In this thesis we have used the SVM implementation available in WEKA,
open source data mining software in Java [HFH+09]. As SVM proves to be
highly powerful for classification tasks, it is considered to be the state-of-the-art
method and is used in almost all of the latest/reviewed frameworks for
expression recognition, i.e. [KBP08, KZP08, DAGG11, SGM09, ZP07,
KMKB12b, JVP11, LFCY06, LBL07].
2.3.3.3 Boosting based methods
Boosting refers to the general problem of learning accurate prediction rule by
combining moderately weak learners or weak hypothesis. A weak learner means
the classifier only gets the right answer a little more often than random guessing
42

Literature survey Automatic recognition of facial expressions
would. Then, Boosting based learning algorithm linearly combines weak classifiers
to obtain a strong classifier that generalizes well over the target domain (reduced
cumulative error). Research has shown improved generalization performance of
ensemble of classifiers (linear combination of classifiers) in many machine learning
problem over single classifier [Leo96].
In the domain of facial expression recognition very often, the dimension of
features extracted from face image is very high, and it is almost impossible to
directly use the high dimension features to train classifier, as in Gabor features
(see Section 2.3.2.1). Therefore, feature selection and dimension reduction must
be done as preprocessing. These problems have been addressed by boosting based
classification methods as during the building of strong classifier it can do feature
selection at the same time because the weak classifier is directly relative to the
corresponding feature [Yan11].
AdaBoost (Adaptive Boosting) [FS95], as proposed in the seminal work of
Freund et al., is probably the most popular boosting algorithm. AdaBoost adjusts
adaptively to the errors of the weak hypotheses and subsequent classifiers built
are tweaked in favor of those instances misclassified by previous classifiers. Due to
this advantage AdaBoost has also been employed for facial expression recognition
tasks.
Littlewort et al. [LBF+06] has used the power of AdaBoost method to select
the subset of most discriminant features. They extract Gabor features from the
whole face and then selected the subset of those features. Their proposed system
achieved recognition accuracy of 93.3% for Cohn-Kanade facial expression
database [KCT00]. Yang et al. [YLM10] also used the power of boosting
classifier to extract compositional features. They extracted Haar-like features
(see section 2.3.2.1 for reference) from the facial image patches (49 sub-windows).
Compositional features based on minimum error based optimization strategy
were built within Boosting learning framework. The proposed method was tested
on Cohn-Kanade facial expression database [KCT00] and it achieved average
recognition accuracy of 92.38% on the apex data (last three frames of the
sequence) and 80% on the extended data (frames from onset to apex of the
expression).
43

Automatic recognition of facial expressions Literature survey
2.3.3.4 Classification trees
A Classification Tree is a classifier composed by nodes and branches which break
the set of samples into a set of covering decision rules. In each node, a single test
is made to obtain the partition. The starting node is called the root of the tree.
In the final nodes or leaves, a decision about the classification of the case is made.
In this research work, we have used C4.5 paradigm [Qui93]. Random Forest (RFs)
are collections of Decision Trees (DTs) that have been constructed randomly. RFs
generally performs better than DT on unseen data.
2.3.3.5 Instance based learning
k -NN classifiers are instance-based algorithms taking a conceptually
straightforward approach to approximate real or discrete valued target functions.
The learning process consists in simply storing the presented data. All instances
correspond to points in an n-dimensional space and the nearest neighbors of a
given query are defined in terms of the standard Euclidean distance. The
probability of a query q belonging to a class c can be calculated as follows:
p(c | q) =
∑k∈K
Wk.1(kc=c)∑k∈K
Wk
(2.7)
Wk =1
d(k, q)(2.8)
K is the set of nearest neighbors, kc the class of k and d(k, q) the Euclidean
distance of k from q.
Figure 2.17 illustrates the operation of the k -Nearest Neighbor algorithm for
the case where the instances are points in a two-dimensional space and where the
target function is boolean valued.
2.3.3.6 Naıve Bayes classifiers
Bayesian classifiers are statistical classifiers and are based on Bayes theorem. They
can predict class membership probabilities, such as the probability that a given
sample belongs to a particular class. Naıve Bayesian (NB) classifiers assume that
44

Literature survey Automatic recognition of facial expressions
Figure 2.17: k -Nearest Neighbor in a two-dimensional space and where targetfunction is boolean valued. A set of +ve and -ve training examples is shown onthe left, along with a query instance xq to be classified. The 1 -Nearest Neighboralgorithm classifies xq +ve whereas 5 -Nearest Neighbor algorithm classifies it as-ve. On the right is the decision surface induced by the 1 -Nearest Neighboralgorithm. The convex polygon surrounding each training example indicates theregion of instance space closest to that point (i.e. the instance for which 1 -Nearest Neighbor algorithm will assign the classification belonging to that trainingexample).
the effect of an attribute value on a given class is independent of the values of
the other attributes. This assumption is called class conditional independence.
It is made to simplify the computation involved and, in this sense, is considered
“naıve”.
To classify a new sample characterized by d genes X = (X1, X2, . . . Xd), the
NB classifier applies the following rule:
CN −B = arg maxcj∈C p(cj)d∏
i=1
p(xi | cj) (2.9)
where CN − B denotes the class label predicted by the Naive-Bayes classifier
and the possible classes of the problem are grouped in C = {c1, . . . cl}.In this section we presented a survey of different state-of-the-art methods that
exist for three sub-components (face detection and tracking, feature extraction
and expression classification) of facial expression recognition systems. Frameworks
that are proposed (for reference see Chapters 4, 5 and 6) during the course of this
research have used some of these methods. Next section (Section 2.4) describes
45

Drawbacks of the current methods and contributions Literature survey
the drawbacks of current methods for expression analysis and our contributions in
this regard.
2.4 Drawbacks of the current methods and
contributions
2.4.1 Exploiting visual saliency
We have found one main shortcoming in all of the reviewed methods for automatic
facial expression recognition that none of them tries to mimic the human visual
system in recognizing them. Rather all of the methods, spend computational time
on whole face image or divides the facial image based on some mathematical or
geometrical heuristic for features extraction. We argue that the task of expression
analysis and recognition could be done in more conducive manner, if only some
regions are selected for further processing (i.e. salient regions) as it happens in
human visual system. Thus, our contributions in this regard are twofold:
1. We have statistically determined which facial region(s) is salient according
to human vision for six basic expressions by conducting psycho-visual
experiment. The experiment has been carried out using eye-tracker which
records the fixations and saccades of human observers as they watch the
collection of videos showing facial expressions. Salient facial regions for
specific expressions have been determined through the analysis of the
fixation data (for reference see Chapter 3).
2. We have illustrated that human visual system inspired frameworks can
achieve high facial expression recognition (FER) accuracy (results that
exceeds state-of-the-art methods). Highly discriminative feature space is
created by extracting features only from the perceptually salient facial
regions. For reference read Chapters 5 and 6.
As a consequence of studying the human visual system and using this knowledge
in proposed frameworks, we achieved the following two objectives.
46

Literature survey Drawbacks of the current methods and contributions
2.4.1.1 Computational simplicity
Generally, we have found that all the reviewed methods for automatic facial
expression recognition are computationally expensive and usually require a
dimensionally large feature vector to complete the task. This explains their
inadequacy for real-time applications, although they produce good results on
different datasets. Our proposed algorithms are based on the phenomenon of
visual saliency, thus reduction in feature vector dimensionality is inherited. This
reduction in computational complexity makes our proposed algorithms suitable
for real-time applications.
2.4.1.2 Adequacy for low resolution stimuli
There exist lots of methods for facial expression recognition but very few of those
methods provide results or work adequately on low resolution images. In this
research thesis, we have proposed a facial expression recognition system that caters
for illumination changes and works equally well for low resolution as well as for
good quality / high resolution images. For reference see Section 6.3.
2.4.2 Expressions different from six prototypical facial
expression
More research effort is required to be put forth for recognizing facial expressions
such as fatigue, pain, and mental states such as agreeing, disagreeing, lie,
frustration, thinking as they have numerous application areas. In this work, we
are proposing a novel computer vision system that can recognize expression of
pain in videos by analyzing facial features. For reference see Section 6.4.
47


Chapter 3
Psycho-Visual experiment
Contents
3.1 Methods . . . . . . . . . . . . . . . . . . . . . . . . . . . . 50
3.1.1 Participants . . . . . . . . . . . . . . . . . . . . . . . . . 51
3.1.2 Eye-tracker . . . . . . . . . . . . . . . . . . . . . . . . . 52
3.1.3 Experiment builder . . . . . . . . . . . . . . . . . . . . . 56
3.2 Procedure . . . . . . . . . . . . . . . . . . . . . . . . . . . 57
3.2.1 Eye movement recording . . . . . . . . . . . . . . . . . . 60
3.2.2 Stimuli . . . . . . . . . . . . . . . . . . . . . . . . . . . 60
3.3 Psycho-Visual experiment: results and discussion . . . 61
3.3.1 Gaze map construction . . . . . . . . . . . . . . . . . . 61
3.3.2 Observations from the gaze maps . . . . . . . . . . . . . 62
3.3.3 Substantiating observations through statistical analysis 63
3.4 Conclusion . . . . . . . . . . . . . . . . . . . . . . . . . . 68
There has long been interest in the nature of eye movements and fixation
behavior following early study by Buswell [Bus35]. Eye fixations describe the way
in which visual attention is directed towards salient regions in a given stimuli
[RCB02], where “salient” means most noticeable or most important. In computer
vision the notion of saliency was mainly popularized by Tsotsos et al. [TSW+95]
49

Methods Psycho-Visual experiment
and Olshausen et al. [OAVE93] with their work on visual attention, and by Itti et
al. [IKN98] with their work on rapid scene analysis.
Recently, computer vision research community has shown lot of interest in
understanding human visual attention phenomenon as it has been shown that
such an approach could drastically reduce the need for computational resources
without altering the quality of results [Har06]. Various computer vision
applications have benefited by understanding human visual attention
phenomenon. Such applications are adaptive content delivery, smart resizing,
adaptive region-of-interest based compression and image quality analysis
[MZ03, STR+05, AS07, LQI11, GMK02, Itt04, KKD10, QL08, IKN98]. This
motivates to understand underlying mechanisms of human visual attention when
decoding facial expressions.
This chapter presents all the details related to psycho-visual experimental
study, which we have conducted in order to study human visual attention
mechanisms when it decodes facial expressions. The experiment was conducted
with the help of an eye-tracking system which records fixations and saccades. We
segmented eye fixation data as it is known that eye gathers most of the
information during the fixations [RCB02]. Results deduced from the experiment
serves as the basis to determine salient facial regions which are algorithmically
processed to extract features for automatic analysis of expressions. Sections 3.1
and 3.2 presents details related to hardware equipment, observers, stimuli,
software while the results of the study are presented in Section 3.3.
3.1 Methods
Eye movements of human observers were recorded as subjects watched a collection
of 54 videos selected from the extended Cohn-Kanade (CK+) database (Refer
Appendix Section A.1), showing one of the six universal facial expressions [Ekm71].
Then saccades, blinks and fixations were segmented from each subject’s recording.
Each video showed a neutral face at the beginning and then gradually developed
into one of the six facial expression.
50

Psycho-Visual experiment Methods
3.1.1 Participants
Fifteen observers volunteered for experiment. They include both male and female
aging from 20 to 45 years with normal or corrected to normal vision. Most of the
participants / observers are graduate students while some are faculty members.
All observers were naive to the purpose of the experiment. They were given
only a short briefing about the apparatus and about the expected time required
to complete the whole experiment.
Figure 3.1 shows observers classification on the basis of age groups.
Subjects/observers were classified in five age groups i.e. 20-25, 25-30,30-35, 35-40
and 40-45. Figure 3.2 shows classification of observers on the basis of their
ethnicity, while Figure 3.3 shows classification of observers on the basis of their
sex.
Figure 3.1: Observer’s classification on the basis of age group.
Figure 3.1 shows that observers presented a good mix of different age groups
while Figures 3.2 and 3.3 show that the observers came from different ethnic
backgrounds with no gender bias. These figures emphasize the fact that
experimental study is not biased to one ethnic background, sex or one age group,
as these biases are proved to impact on the judgment of expressions
[EA02, HBK00].
51

Methods Psycho-Visual experiment
Figure 3.2: Observer’s classification on the basis of their ethnicity.
Figure 3.3: Observer’s classification on the basis of their sex.
3.1.2 Eye-tracker
A video based eye-tracker (Eyelink II system from SR Research, Canada) was
used to record eye movements (see Figure 3.4 for reference). The system consists
of three miniature infrared cameras.
52

Psycho-Visual experiment Methods
Figure 3.4: Eyelink II, Eye-tracker used in our experiment.
The EyeLink II headband has two eye cameras for binocular tracking or instant
selection of eye to be tracked as well as an optical head tracking camera with
exceptionally low angular noise. The headband also contains these key features:
1. Off-axis illumination and high-contrast cameras for maximum compatibility
with eyeglasses and contact lenses.
2. Lightweight headband (∼ 420g) has a low center of mass for stability, is well
balanced and has low rotational inertia. This reduces neck muscle tremor
and permits long periods of use without fatigue.
53

Methods Psycho-Visual experiment
3. Leather-padded headband provides excellent grip on skin with low pressure,
and is not affected by skin oils.
4. No mirrors used for lightweight and robustness.
5. All mechanical adjustments and sliding parts have been wear-tested to ensure
long lifetime with no maintenance.
The Eyelink II system allows determination and tracking of subject’s dominant
eye without any mechanical configuration. Each camera has a built-in infrared
illuminator (925 nm IR, IEC-825 Class 1, <1.2 mW/cm2) . As the eye-tracker
system used for experiment was head mounted, the observers were allowed to
move their heads normally during experiment.
3.1.2.1 Tracker application
EyeLink II Tracker Application was used during the experiment for camera set-up,
calibration, validation, and drift correction, as explained below:
1. Camera set-up. The first step for the experiment execution is to set-up
eye and head tracking cameras. Eye(s) to be tracked, tracking mode and
options are to be set. Then calibration, validation, and drift correction are
performed. Figure 3.5 shows the screen shot of the set-up screen.
2. Calibration. Calibration is used to collect fixations on target points, in
order to map raw eye data to gaze position. Targets are presented for the
observers to fixate on the Display PC while feedback graphics are presented
to the experimenter on this display. The calibration is then checked, and
diagnostics are provided. Calibration was performed after camera setup and
before validation. Figure 3.6 shows the calibration screen.
3. Validation. The validation of the calibration was achieved by measuring the
difference between the computed fixation positions and the locations of the
target points. Such a difference reflects the accuracy of the eye movement
recording. A threshold error of 10 has been selected as the greatest divergence
that could be accepted.
54

Psycho-Visual experiment Methods
Figure 3.5: EyeLink II Camera Setup Screen.
Figure 3.6: EyeLink II Calibration Screen.
55

Methods Psycho-Visual experiment
4. Drift correction. The drift correction process displays a single target to the
participant and then measures the difference between the computed
fixation position during calibration / validation and the target. This error
reflects headband slippage or other factors, which are then corrected for by
the measured error.
3.1.3 Experiment builder
The SR Research Experiment Builder (SREB) is a visual experiment creation
tool. When used in combination with the SR Research EyeLink eye tracking
system, the SREB provides seamless integration into the EyeLink hardware and
software platform. As a convenient tool for creating eye-tracking experiments, the
Experiment Builder is fully integrated with the EyeLink eye tracker.
3.1.3.1 Features
We created experiments in the Experiment Builder by dragging and dropping
experiment components into a workspace and configuring the properties of the
added components. There are two main classes of experiment components in
the Experiment Builder: Actions and Triggers. Actions tell the computer to do
something, like displaying a set of graphics on the screen or playing a sound.
Triggers define the conditions that must be met before an action can be performed.
Examples of Triggers are keyboard events and eye (Fixation, Saccade, and Invisible
Boundary) events. Our experiment is categorized in the first category i.e actions.
Figure 3.7 shows the graphical/block diagram of our experiment.
3.1.3.2 Organization of events in an experiment
Our experiment can be dissected into several levels along a hierarchy of
Experiment, Blocks, Trials, Trial Runtime / Recording. All of the events within
each level of this hierarchy are conveniently wrapped in a loop (called sequence
or sub-graph in Experiment Builder). This allows the whole sequence to be
connected to other objects as a unit and be repeated several times in a row.
Figure 3.8 illustrates our experiment architecture.
56

Psycho-Visual experiment Procedure
Figure 3.7: Block diagram of the experiment.
The top-most level of the experiment (Experiment Sequence) contains a
greeting message/instruction screen followed by a sub-sequence representing
blocks of trials (Block Sequence), and then a goodbye or debriefing message at
the end of the experiment. Within each repetition of the Block Sequence, the
user/observer first performs a camera adjustment, calibration and validation, and
then runs several trials (Trial Sequence containing different videos). Every
iteration of the Trial Sequence starts with pre-recording preparations (e.g. video
resources, sending some simple drawing graphics to the tracker screen, flushing
log file) and drift correction followed by the trial recording (Recording Sequence).
The Recording Sequence is responsible for collecting the eye data and is where
visual and auditory stimuli are presented.
3.2 Procedure
The experiment was performed in a dark room with no visible object in observer’s
field of view except stimulus. The participants were seated on an adjustable height
chair. The height of the chair was adjusted in order that the eyes of all subjects
57

Procedure Psycho-Visual experiment
Figure 3.8: Hierarchical Organization of the experiment
would align with the center of the screen. Stimuli (videos) were presented on a
19 inch CRT monitor with a resolution of 1024 x 768, 32 bit color depth, and a
refresh rate of 85 Hz. A viewing distance of 70 cm was maintained resulting in a
290 x 220 usable field of view as done by Jost et al [JOW+05]. Refer Figure 3.9
for the setup of the experiment.
Every participant has completed two sessions of experiment with at least one
day of gap between them. Both sessions were identical and same stimuli were
presented in random order. The aim of repeating the same experiment at different
times for every participant was to check the cross-correlation and the repeatability
of the recorded data.
The experiment has been designed carefully so that it should not exceed 25
minutes including calibration stage, in order to prevent observer’s lose of interest
or disengagement from experiment over time.
58

Psycho-Visual experiment Procedure
Figure 3.9: Experiment / eye-tracker setup. First row: tracker being adjusted onthe head of an observer. Second row: stimulus display PC (on the left) and thePC connected to the eye-tracker / host PC on the right. Last row: after finalizingthe setup stage of the experiment.
59

Procedure Psycho-Visual experiment
3.2.1 Eye movement recording
Eye position was tracked at 500 Hz with an average noise (RMS value) <0.010.
Fixations were estimated from a comparison between the center of the pupil and
the reflection of the IR illuminator on the cornea. Before starting a session of
experiment, the eye-tracker was calibrated with a set of random points on 3 x
3 matrix (see Figure 3.6 for reference). For the observer, the calibration stage
simply consisted of fixating the gaze at the nine points displayed sequentially and
randomly at different locations on the screen. The validation of the calibration
was achieved by measuring the difference between the computed fixation positions
and the locations of the target points. Such a difference reflects the accuracy of the
eye movement recording. A threshold error of 10 has been selected as the greatest
divergence that could be accepted.
Head mounted eye-tracker allows flexibility to perform experiment in free
viewing conditions as the system is designed to compensate for small head
movements. Then the recorded data is not affected by head motions and allows
observers to view stimuli normally with no restrictions on the head movements.
Severe restrictions in head movements has been shown to alter eye movements
and can lead to noisy data acquisition and corrupted results [CSE+92].
3.2.2 Stimuli
For the experiment, we used the videos from the extended Cohn-Kanade (CK+)
database [LCK+10]. CK+ database contains 593 sequences across 123 subjects
which are FACS [EF78] coded at the peak frame. Out of 593 sequences only 327
sequences have emotion labels. This is because these are the only ones that fit
the prototypic definition. Database consists of subjects aged from 18 to 50 years
old, of which 69% were female, 81% Euro-American, 13% Afro-American and 6%
others. Each video (without sound) showed a neutral face at the beginning and
then gradually developed into one of the six facial expressions. We selected 54
videos for the Psycho-Visual experiment (see section A.1 for more details about
the database). Videos were selected with the criteria that videos should show both
male and female subjects, experiment session should complete within 20 minutes
and posed facial expression should not look unnatural. Another consideration
60

Psycho-Visual experiment Psycho-Visual experiment: results and discussion
while selecting the videos was to avoid such sequences where the date/time stamp
is not recorded over the chin of the subject [PVRM05].
3.3 Psycho-Visual experiment: results and
discussion
3.3.1 Gaze map construction
Figure 3.10: Examples of gaze maps for six universal expressions. Each videosequence is divided in three mutually exclusive time periods. First, second andthird columns show average gaze maps for the first, second and third time periodsof a particular stimuli respectively.
The most intuitively revealing output that can be obtained from the recorded
fixations data is to obtain gaze maps. For every frame of the video and each
subject i, the eye movement recordings yielded an eye trajectory T i composed
of the coordinates of the successive fixations fk, expressed as image coordinates
(xk, yk):
T i = (f i1, f
i2, f
i3, ....) (3.1)
As a representation of the set of all fixations f ik, a human gaze map H(x) was
computed, under the assumption that this map is an integral of weighted point
61

Psycho-Visual experiment: results and discussion Psycho-Visual experiment
spread functions h(x) located at the positions of the successive fixations. It is
assumed that each fixation gives rise to a normally (gaussian) distributed activity.
The width σ of the activity patch was chosen to approximate the size of the fovea.
Formally, H(x) is computed according to Equation 3.2:
H(x) = H(x, y) =
Nsubj∑i=1
∑fk∈T i
exp((xk − x)2 + (yk − y)2
σ2) (3.2)
where (xk, yk) are the spatial coordinates of fixation fk, in image coordinates.
In Figure 3.10 gaze maps are presented as the heat maps where the colored blobs
/ human fixations are superimposed on the frame of a video to show the areas
where observers gazed. The longer the gazing time, the warmer the color is.
As the stimuli used for the experiment is dynamic i.e. video sequences, it
would have been incorrect to average all the fixations recorded during trial time
(run length of video) to construct gaze maps as this could lead to biased analysis
of the data. To meaningfully observe and analyze the gaze trend across one video
sequence we have divided each video sequence in three mutually exclusive time
periods. The first time period correspond to initial frames of the video sequence
where the actor’s face has no expression i.e. neutral face. The last time period
encapsulates the frames where the actor is showing expression with full intensity
(apex frames). The second time period is a encapsulation of the frames which has a
transition of facial expression i.e. transition from the neutral face to the beginning
of the desired expression (i.e neutral to onset of the expression). Then, the fixations
recorded for a particular time period are averaged across 15 observers. Refer to
Appendix B where gaze maps of five video sequences / expression are presented.
3.3.2 Observations from the gaze maps
Figure 3.10 gives the first intuition that gazes across all the observers are mostly
attracted towards three facial regions i.e. eyes, nose and mouth for all the six
universal facial expressions.
Secondly, gaze maps presented in the Figure 3.10 suggest the saliency of mouth
region for the expressions of happiness and surprise. It can be observed from the
figure that as the two said expressions become prominent (second and third time
62

Psycho-Visual experiment Psycho-Visual experiment: results and discussion
periods) most of the gazes are attracted towards only one facial region and that is
the mouth region. The same observation can be made for the facial expressions of
sadness and fear but with some doubts. For the expressions of anger and disgust
it seems from the gaze maps that no single facial region emerged as salient, as the
gazes are attracted towards two to three facial regions even when the expression
was shown at its peak.
3.3.3 Substantiating observations through statistical
analysis
Figure 3.11: Time period wise average percentage of trial time observers havespent on gazing different facial regions. The error bars represent the standarderror (SE) of the mean. First time period: initial frames of video sequence. Thirdtime period: apex frames. Second time period: frames which has a transition fromneutral face to particular expression.
In order to statistically confirm the intuition gained from the gaze maps about
the saliency of different facial region(s) for the six universal facial expressions we
63

Psycho-Visual experiment: results and discussion Psycho-Visual experiment
have calculated the average percentage of trial time observers have fixated their
gazes at specific region(s) in a particular time period (definition of time period is
same as described previously). The resulting data is plotted in Figure 3.11.
Figure 3.11 confirms the intuition that the region of mouth is the salient region
for the facial expressions of happiness and surprise. Third time period in the figure
corresponds to the time in the video when the expression was shown at its peak.
It can be easily observed from the figure that as the expression of happiness and
surprise becomes more prominent, the humans tend to fixate their gazes mostly
on the facial region of mouth. The same can be observed from the Figure 3.12 and
3.13. This result is consistent with the results by Cunningham et al. [CKWB05],
Nusseck et al. [NCWB08] and Boucher et al. [BE75].
Figure 3.12: Gaze maps for the facial expression of happiness. First, second andthird columns show average gaze maps for the first, second and third time periodsof stimuli respectively. Each row corresponds to different stimuli/video sequencefor “sadness”.
Cunningham et al. [CKWB05] and Nusseck et al. [NCWB08] have reported
that the recognition of facial expression of sadness requires a complicated
interaction of mouth and eye region along with rigid head motion, but the data
we have recorded from experiment and plotted in Figure 3.11 show that human
visual system tends to divert its attention towards the region of mouth as the
expression becomes prominent. The fact can be observed in the second and third
64

Psycho-Visual experiment Psycho-Visual experiment: results and discussion
Figure 3.13: Gaze maps for the facial expression of surprise. First, second andthird columns show average gaze maps for the first, second and third time periodsof stimuli respectively. Each row corresponds to different stimuli/video sequencefor “sadness”.
time periods. Nevertheless, the contribution of eye and nose regions cannot be
considered negligible as in terms of percentage for the third time period observers
have gazed around 40 percent of the trial time at the mouth region and around
25 percent each at the eye and nose regions. Figure 3.14 shows the average gaze
maps from the 15 observers for the expression of sadness and it confirms the fact
that the facial region of mouth get more attention than the facial regions of eye
and nose.
Facial expression of disgust shows quite random behavior. Even when the
stimuli was shown at its peak, observers have gazed all the three regions in
approximately equal proportions. The only thing that can be point out from the
Figure 3.11 is that there is more attraction towards the nose region and that
could be due the fact that, wrinkles on the nose region becomes prominent and
attracts more attention when the stimuli shows maximum disgust expression.
Ironically, Cunningham et al.[CKWB05] and Nusseck et al.[NCWB08] while
discussing the results for the expression of disgust have not considered the
contribution of the nose region which has came out to be little bit more
prominent than the other two facial regions in terms of saliency from the results
65

Psycho-Visual experiment: results and discussion Psycho-Visual experiment
Figure 3.14: Gaze maps for the facial expression of sadness. First, second andthird columns show average gaze maps for the first, second and third time periodsof stimuli respectively. Each row corresponds to different stimuli/video sequencefor “sadness”.
Figure 3.15: Gaze maps for the facial expression of disgust. First, second and thirdcolumns shows average gaze maps for the first, second and third time periods ofstimuli respectively. Each row corresponds to different stimuli/video sequence for“disgust”.
of the current study. Figure 3.15 presents the average gaze maps from the 15
observers for the facial expression of disgust. From the gaze maps of two
66

Psycho-Visual experiment Psycho-Visual experiment: results and discussion
presented video sequences it is evident that the wrinkles in the nose region gets
bit more attention than the other two facial regions.
For the expression of fear, facial regions of the mouth and eyes attract most
of the gazes. From Figure 3.11 it can be seen that in the second trial time period
(period correspond to the time when observer experiences the change in face
presented in stimuli toward the maximum expression) observers mostly gazed at
the mouth region and in the final trial period eye and mouth regions attracts
most of the attention. Hanawalt [Han44] reported that the expression of fear is
mostly specified by the eye region but our study shows the interaction of facial
regions of mouth and eyes for the fear. Figure 3.16 shows the average gaze maps
for the expression of fear and these gaze maps confirm the argument that “fear”
is accompanied with the interaction of mouth and eye regions.
Figure 3.16: Gaze maps for the facial expression of fear. First, second and thirdcolumns show average gaze maps for the first, second and third time periods ofstimuli respectively. Each row corresponds to different stimuli/video sequence for“fear”.
Boucher et al. [BE75] in 1975 wrote that “Anger differs from the other five
facial expressions of emotion in being ambiguous” and this observation holds for
the current study as well. “Anger” shows complex interaction of eye, mouth and
nose regions without any specific trend. This fact is evident from the Figure 3.17
as observers have gazed at different regions of the face for the two stimuli showing
“anger”. But one thing is common for all the stimuli in Figure 3.17 that for
67

Conclusion Psycho-Visual experiment
Figure 3.17: Gaze maps for the facial expression of anger. First, second and thirdcolumns show average gaze maps for the first, second and third time periods ofstimuli respectively. Each row corresponds to different stimuli/video sequence for“anger”.
“anger” no facial region emerges as the salient but all the three regions are gazed
interchangeably even when the expression was shown at its peak/apex. Figure
3.18 tabulates results from our psycho-visual experimental study.
3.4 Conclusion
The presented experimental study provides the insight into which facial region(s)
emerges as the salient according to human visual attention for the six universal
facial expressions. Eye movements of fifteen human observers were recorded using
eye-tracker as they watch the stimuli which was taken from the widely used Cohn-
Kanade facial expression database. Conclusions drawn from the experimental
study are summarized in the Figure 3.18.
The study provided a evidence that the visual system is mostly attracted
towards the mouth region for the expressions of happiness and surprise and it
also shows almost the same trend for the expression of sadness. Expressions of
disgust, fear and anger shows the interaction of two to three facial regions.
Expression of fear shows the attractiveness of the eyes and the mouth regions.
Expression of anger can be considered as complex expressions as it is
68

Psycho-Visual experiment Conclusion
Figure 3.18: Summary of the facial regions that emerged as salient for six universalexpressions. Salient regions are mentioned according to their importance (forexample facial expression of “fear” has two salient regions but mouth is the mostimportant region according to HVS).
accompanied with the interaction of three facial regions i.e. eye, nose and mouth
and so does the expression of disgust.
Presented results can be used as the background knowledge by the computer
vision community for deriving robust descriptor for the facial expression
recognition (FER) as for FER, feature selection along with the regions from
where these features are to be extracted is one of the most important step.
Secondly, processing only salient regions could help in reducing computational
complexity of the FER algorithms.
Work presented in this chapter is published in “IEEE International Conference
on Computer Vision and Pattern Recognition Workshop” [KMKB12a].
69


Chapter 4
Facial expression recognition
based on brightness and entropy
features
Contents
4.1 Salient region detection . . . . . . . . . . . . . . . . . . . 73
4.1.1 Biologically based . . . . . . . . . . . . . . . . . . . . . 74
4.1.2 Computational models . . . . . . . . . . . . . . . . . . . 75
4.1.3 Conclusion . . . . . . . . . . . . . . . . . . . . . . . . . 79
4.2 Feature extraction . . . . . . . . . . . . . . . . . . . . . . 79
4.2.1 Brightness calculation . . . . . . . . . . . . . . . . . . . 81
4.2.2 Entropy calculation . . . . . . . . . . . . . . . . . . . . 83
4.3 Experiments . . . . . . . . . . . . . . . . . . . . . . . . . 84
4.3.1 Experiment on the extended Cohn-Kanade (CK+)
database . . . . . . . . . . . . . . . . . . . . . . . . . . . 85
4.3.2 Experiment on the FG-NET FEED database . . . . . . 86
4.4 Drawbacks of the proposed algorithm . . . . . . . . . . 87
Results of the visual experiment provided the evidence that human visual
system gives importance mainly to two facial regions i.e. eye and mouth, while
71

FER based on Brightness and Entropy
decoding six universal facial expressions (for reference see Chapter 3). In the
same manner, we argue that the task of expression analysis and recognition could
be done in more conducive manner, if same regions are selected for further
processing. We propose to extract two sets of features only from the salient
regions of face. These two features are entropy and brightness.
Entropy is a statistical measure of uncertainty, randomness or absence of the
information associated with the data [SW63, LFT10] while brightness as described
by Wyszecki and Stiles [WS00] is an “attribute of a visual sensation according to
which a given visual stimulus appears to be more or less intense”. Currently, there
is no standard or reference formula for brightness calculation. We propose to use
BCH (Brightness, Chroma, Hue) model [BB06] for brightness calculation.
Working of the proposed framework is summarized in algorithm 1 and the
details related to each step is presented in subsequent subsections.
Algorithm 1: Proposed framework for facial expression recognition
input : video frameoutput: expression label
1 for i← 1 to numFrames do2 automatically localize salient facial regions using viola-jones
algorithm [VJ01]3 calculate saliency map using “frequency-tuned salient region
detection” algorithm [AHES09]4 calculate entropy [SW63] from salient facial regions using:
E = −n∑
i=1
p(xi) log2 p(xi)
5 calculate brightness features from salient facial regions using BCHmodel [BB06]:B =
√D2 + E2 + F 2
6 concatenate entropy and brightness feature to make feature vector,i.e. f = { E,B }
7 classify input stimuli to one of six universal expression using featurevector f
The rationale behind extracting entropy and brightness features is that, as a
second step framework calculates saliency map which show salient regions by
highlighting them. By extracting brightness feature, framework calculates local
72

FER based on Brightness and Entropy Salient region detection
saliency value (brightness is proportional to saliency). While entropy values
explains how well particular facial region is mapped as salient. Figure 4.1 show
extracted values of entropy and brightness features from three facial regions.
Figure illustrates discriminative abilites of these two features.
Figure 4.1: Brightness and entropy values from three different facial regions.
4.1 Salient region detection
First problem that is addressed, is to find salient region detection algorithm that
produces saliency maps which detects similar salient facial regions as concluded
by the psycho-visual experiment (see Chapter 3 for details). The idea is to use
saliency map information to find appropriate weights (or value for brightness and
entropy) for extracted features. In order to find appropriate saliency detection
algorithm we examined four state-of-the-art methods.
Models of automatic saliency determination can be classified as either
biologically based, purely computational, or a combination. We examined four
state-of-the-art methods of automatic extraction of salient regions in order to
73

Salient region detection FER based on Brightness and Entropy
determine their suitability for our application. Four state-of-the-art methods for
extracting salient regions are “Itti’s model” by Itti et al. [IKN98], “frequency
tuned salient region detection” by Achanta et al. [AHES09], “graph-based visual
saliency” by Harel et al. [JHP06] and “spectral residual approach for saliency
detection” by Hou and Zhang [HZ07] referred here as IT, FT, GBVS and SR
respectively. The choice of these algorithms is motivated by the following
reasons:
1. Citation in literature. The classic approach of IT is widely cited.
2. Recency. GBVS, SR and FT are recent.
3. Variety. IT is biologically motivated,GBVS is a hybrid approach, FT and
SR estimates saliency in the frequency domain, and FT outputs
full-resolution saliency maps.
These models are briefly described below.
4.1.1 Biologically based
Biological architecture developed by Koch and Ullman [KU85] is a basis of very
famous model developed by Itti et al. [IKN98]. In this biologically-inspired
system, an input image is decomposed into a nine spatial scales using dyadic
Gaussian pyramid (successive Gaussian blurring and down sampling by 2 in each
dimension). Each feature is computed by a set of linear
“center-surround”operations on spatial discontinuities in the modalities of color,
intensity and orientation. All feature maps are then combined into a unique
scalar “saliency map” which encodes for the salience of a location in the scene
irrespectively of the particular feature which detected this location as
conspicuous. A winner-take-all neural network then detects the point of highest
salience in the map at any given time, and draws the focus of attention towards
this location. Figure 4.2 presents general architecture of the model under
discussion.
74
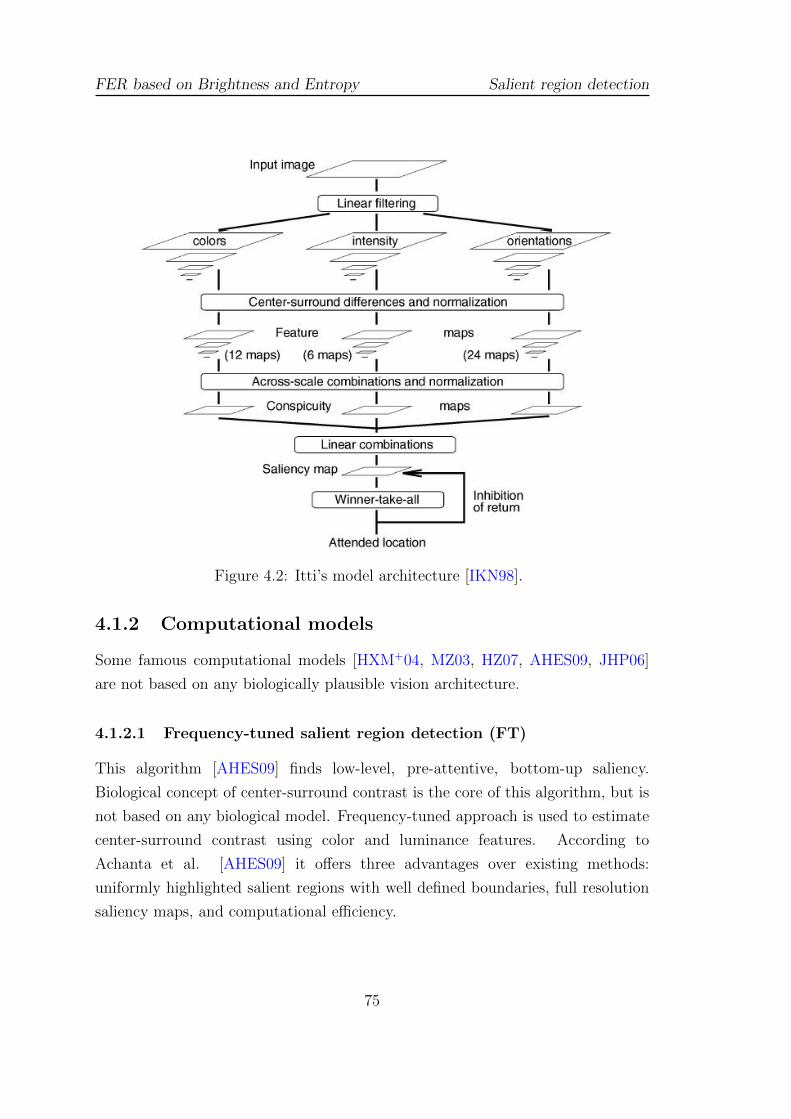
FER based on Brightness and Entropy Salient region detection
Figure 4.2: Itti’s model architecture [IKN98].
4.1.2 Computational models
Some famous computational models [HXM+04, MZ03, HZ07, AHES09, JHP06]
are not based on any biologically plausible vision architecture.
4.1.2.1 Frequency-tuned salient region detection (FT)
This algorithm [AHES09] finds low-level, pre-attentive, bottom-up saliency.
Biological concept of center-surround contrast is the core of this algorithm, but is
not based on any biological model. Frequency-tuned approach is used to estimate
center-surround contrast using color and luminance features. According to
Achanta et al. [AHES09] it offers three advantages over existing methods:
uniformly highlighted salient regions with well defined boundaries, full resolution
saliency maps, and computational efficiency.
75

Salient region detection FER based on Brightness and Entropy
This algorithms find the Euclidean distance between the CIELAB (L∗a∗b∗ color
space) [WS00] pixel vector in a Gaussian filtered image with the average CIELAB
vector for the input image, this is illustrated in the Figure 4.3. See Appendix C
for color space conversion formulas.
Figure 4.3: Frequency-tuned salient region detection algorithm [AHES09].
4.1.2.2 Graph Based Visual Saliency (GBVS) method
Graph Based Visual Saliency (GBVS) method [JHP06] create feature maps using
Itti’s method but perform their normalization using a graph based approach. It
consists of two steps: first forming activation maps on feature channels, and then
normalizing them in a way which highlights conspicuity and admits combination
with other maps. The activation maps are normalized using another Markovian
algorithm which acts as a mass concentration algorithm, prior to additive
combination of the activation maps. This algorithm exploits the computational
power, topographical structure, and parallel nature of graph algorithms to
achieve natural and efficient saliency computations. For both activation and
normalization, this method constructs a directional graph with edge weights
given from the input map, treat it as a Markov chain, and compute the
equilibrium distribution. Figure 4.4 shows the architecture of the GBVS
algorithm.
76

FER based on Brightness and Entropy Salient region detection
Figure 4.4: Graph Based Visual Saliency (GBVS) method’s architecture (adoptedfrom poster presentation [JHP06]).
4.1.2.3 Spectral Residual(SR) approach
Spectral residual approach [HZ07] for detecting saliency in a given stimuli is a
purely computational approach and is not based on any biological principle. The
power of log spectrum is exploited by this approach in order to explore the
properties of the background of a given stimuli. Similar trends are observed in
log spectra of different images, though each containing statistical singularities.
The similarities imply redundancies. If the similarity (trend of local linearity of
natural images) is removed, the remaining singularity (spectral residual) should
be the innovation of an image corresponding to its visual saliency. The main idea
of Spectral Residual is to remove the redundant part of image’s spectrum. It
only needs Fourier Transformation of an image, so this algorithm is
computationally efficient. This method outputs saliency map in 64 x 64 sized
image regardless of the size of input stimuli and highlight the salient object
77

Salient region detection FER based on Brightness and Entropy
boundaries, but fail to uniformly map the entire salient region. These
shortcomings result from the limited range of spatial frequencies retained from
the original image in computing the final saliency map.
Figure 4.5: Comparison of automatic detected salient regions with gaze mapobtained from psycho-Visual experiment (see Chapter 3 for reference). First row:original image and average gaze map of fifteen observers. Second row: saliencymaps obtained from GBVS [JHP06] and Itti methods [IKN98] (shown as heatmaps.). Third row: saliency maps obtained from FT [AHES09] and SR methods[HZ07].
78

FER based on Brightness and Entropy Feature extraction
4.1.3 Conclusion
We propose to use frequency-tuned salient region detection algorithm developed by
Achanta et al. [AHES09] for detection of salient facial regions. We have chosen this
model over other existing state-of-the-art models [IKN98, HZ07, JHP06] because
it performs better in predicting human fixations (see Figure 4.6 and Figure 4.5).
Figure 4.5 shows that except FT model [AHES09], none of the other examined
model correctly predicts human gazes. Itti method [IKN98] and GBVS method
[JHP06] outputs quite similar saliency maps with wrong predictions, while SR
method [HZ07] outputs saliency map that is only 64 x 64 pixels in size with no
significant correct prediction.
Figure 4.6 shows salient regions for six expressions as detected by FT. It can
be observed from the figure that most of the time it predicts three regions as
salient facial region i.e. nose, mouth and eyes which is in accordance with visual
experiment result (see Section 3.4 for reference). Secondly, a distinctive trend in
detected salient regions and associated brightness can also be observed for different
expressions. Another advantage of the FT model is its computational efficiency,
which is very important for the system to run in real time. Lastly, this model
outputs saliency maps in full resolution, which is not the case for SR model. Due
to all of these benefits we concluded to use frequency-tuned salient region detection
algorithm developed by Achanta et al. [AHES09] for detection of salient facial
regions in our framework.
4.2 Feature extraction
We have chosen to extract the features of brightness and entropy for automatic
recognition of expressions as these features have shown a discriminative trend,
which can be observed from Figure 4.6 and 4.7. Figure 4.7 shows the average
entropy values for the facial regions. Each video is divided in three equal time
periods for the reasons discussed earlier. The entropy values for the facial regions
corresponding to specific time periods (definition of time periods is same as
discussed earlier) are averaged and plotted in Figure 4.7.
79

Feature extraction FER based on Brightness and Entropy
Figure 4.6: Salient region detection for different expressions using FT [AHES09].Each row shows detected salient regions in a complete frame along with the zoomof three facial regions i.e. eyes, nose and mouth. Brightness of the salient regionsis proportional to its saliency. First row shows expression of happiness, secondrow: surprise, third row: sadness, fourth row: anger, fifth row: fear and sixth row:disgust .
By using FT saliency model, we extracted salient regions and obtained saliency
maps for every frame of the video. Then obtained saliency maps are further
80

FER based on Brightness and Entropy Feature extraction
Figure 4.7: Average entropy value for different facial regions. First time period:initial frames of video sequence. Third time period: apex frames. Second timeperiod: frames which has a transition from neutral face to particular expression.
processed for the calculation of brightness and entropy value for the three facial
regions (eyes, nose and mouth).
4.2.1 Brightness calculation
Brightness is one of the most significant pixel characteristics but currently, there is
no standard formula for brightness calculation. The brightness values, as explained
earlier, are calculated using BCH (Brightness, Chroma, Hue) model [BB06]. For
B (Brightness) C (Chroma) H (Hue) color coordinate system (CCS), the following
definitions for Brightness, Chroma and Hue are used:
1. B: a norm of a color vector S.
2. C: an angle between the color vector S and an axis D - color vector
representing Day Light (for example D65, D55, EE etc.).
81

Feature extraction FER based on Brightness and Entropy
3. H: is the angle between the orthogonal projection of the color vector S on
the plane orthogonal to the axis D and an axis E - the orthogonal
projection of a color vector, corresponding to some fixed stimulus (for
example, a monochromatic light with wavelength 700 nm), on the same
plane.
Figure 4.8: Color Coordinate Systems DEF and BCH [BB06].
Figure 4.8 illustrates the relationship between values D, E, and F (E = F = 0
for grey color in DEF color coordinate system), coordinates of the vector S in an
orthogonal coordinate system DEF, and parameters B, C, and H, which might be
considered as spherical coordinates of the vector S in BCH coordinate system.
Use of stimulus length as a measure of Brightness introduced in BCH
(Brightness, Chroma, Hue) model provides Brightness definition effective for
different situations. Length is calculated according to Cohen metrics [Coh00].
B =√D2 + E2 + F 2 (4.1)
82

FER based on Brightness and Entropy Feature extraction
DEF
=
0.2053 0.7125 0.4670
1.8537 −1.2797 −0.4429
−0.3655 1.0120 −0.6104
.
XYZ
(4.2)
where X, Y, and Z are tristimulus values [CIE31].
The main advantage of BCH model is that it performs only intended operation
without unwilling concurrent modification/processing of other image parameters.
4.2.2 Entropy calculation
The entropy for different facial regions are calculated using equation 4.3:
E = −n∑
i=1
p(xi) log2 p(xi) (4.3)
where n is the total number of grey levels, and p = {p(x1), ....., p(xn)} is the
probability of occurrence of each level.
In the context of this work, we have used entropy as a measure to
quantitatively determine whether a particular facial region is fully mapped as
salient or not. Higher value of entropy for a particular facial region corresponds
to higher uncertainty or points out the fact that the facial region is not fully
mapped as salient.
From Figure 4.7 it can be observed that the average entropy values for the
region of mouth, for the expressions of happiness and surprise are very low as
compared to entropy values for the other regions. This finding shows that the
region of mouth was fully mapped (can also be seen in Figure 4.6) as salient by
saliency model, and the same we concluded from our visual experiment. It is also
observable from the figure that the values of entropy for the region of mouth for
these two expressions is lower than any other entropy values for the rest of facial
expressions in the second and third time periods. This result shows that there is
a discriminative trend in entropy values which will help in automatic recognition
of facial expressions.
83

Experiments FER based on Brightness and Entropy
Entropy values for the expression of sadness show discriminative trend and
suggests that nose and mouth regions are salient with more biasness towards mouth
region. This results conforms very well with the results from visual experiment.
For the expression of disgust, entropy value for the facial region of nose is quite
low pointing out the fact that the region of nose is mapped fully as salient which
again is in accordance with our visual experiment result. This conclusion can also
be exploited for the automatic facial expression recognition of disgust.
We obtained low entropy value for the facial region of eyes for the expression
of anger. This points to the fact that according to the saliency model the region of
eyes emerges as salient. But the results from the visual experiment show complex
interaction of all three regions. Entropy values for the expression of fear also show
different result from the visual experiment. The discrepancies found in the entropy
values for the expressions of anger and fear are neither negligible nor significant
and will be studied and addressed in future work.
4.3 Experiments
To measure the performance of proposed framework for facial expression
recognition we conducted experiments on two databases: (a) extended
Cohn-Kanade (CK+) database [LCK+10] (posed expressions) and (b) FG-NET
FEED [Wal06] database (natural expressions) . FG-NET FEED contains 399
video sequences across 18 different individuals showing seven facial expressions
i.e. six universal expression [Ekm71] plus one neutral. In this database
individuals were not asked to act rather expressions were captured while showing
them video clips or still images to wake real expressions. CK+ database contains
593 sequences (posed / acted expressions) across 123 subjects which are FACS
[EF78] coded at the peak frame. Details of CK+ and FG-NET FEED database
are presented in Appendix Sections A.1 and A.3 respectively.
For both the experiments, the performance of the framework was evaluated
using classical classifier i.e. “Support vector machine (SVM)” with χ2 kernel and
γ=1 (for discussion on different classifiers refer Section 2.3.3). Average recognition
accuracy / rate is calculated using 10 -fold cross validation technique. In k -fold
cross validation, features vector set is divided into k equal subsets. k -1 subsets are
84

FER based on Brightness and Entropy Experiments
used for the training while a single set is retained for the testing. The process is
repeated k times (k -folds), with each of the k subsets used exactly once for testing.
Then, the k estimations from k -folds are averaged to produce final estimated value.
The framework calculates brightness and entropy features explicitly from three
facial regions i.e. eyes, nose and mouth. This is done to enhance discriminative
ability of feature vector.
4.3.1 Experiment on the extended Cohn-Kanade (CK+)
database
For the experiment we used all 309 sequences from the CK+ database which have
FACS coded expression label [EF78]. The experiment was carried out on the frames
which covers the status of onset to apex of the expression, as done by Yang et al.
[YLM10]. Region of interest was obtained automatically by using Viola-Jones
object detection algorithm [VJ01] and processed to obtain feature vector. The
proposed framework achieved average recognition rate of 71.2% for six universal
facial expressions using 10 -fold cross validation.
4.3.1.1 Comparison with state-of-the-art methods
Table 4.1 shows the comparison of the achieved average recognition rate of the
proposed framework with the state-of-the-art methods using same database (i.e
Cohn-Kanade database). Results from [YLM10] are presented for the two
configurations. “[YLM10]a” shows the result when the method was evaluated for
the last three frames from the sequence while “[YLM10]b” presents the reported
result for the frames which encompasses the status from onset to apex of the
expression. The method discussed in “[YLM10]b” is directly comparable to our
method (frames which covers the status of onset to apex of the expression).
Generally our framework achieved average recognition rate less than other
state-of-the-art methods but this framework could be considered as the pioneer
in the genre of frameworks that are based on human visual system. Secondly,
framework can be improved by extracting and concatenating more features (from
the salient facial regions) which have strong discriminative abilities. Lastly,
feature vector dimensionality of the proposed framework is very low and even by
85

Experiments FER based on Brightness and Entropy
concatenating more features to it will not affect its appropriateness for real-time
applications.
Sequence Class Performance Recog.Num Num Measure Rate (%)
[LBF+06] 313 7 leave-one-out 93.3[ZP07] 374 6 ten-fold 96.26[KZP08] 374 6 five-fold 94.5[Tia04] 375 6 - 93.8[YLM10]a 352 6 66% split 92.3[YLM10]b 352 6 66% split 80Ours 309 6 ten-fold 71.2
Table 4.1: Comparison with the state-of-the-art methods
4.3.2 Experiment on the FG-NET FEED database
Second experiment was performed on the 288 videos of FG-NET FEED [Wal06]
database. The expressions in this database are considered as realistic / natural as
possible. All the experimental parameters were same as described in the Section
4.3.1. The proposed framework achieved average recognition rate of 65.7% for six
universal facial expressions using 10 -fold cross validation. Table 4.2 shows
confusion matrix. Diagonal and off-diagonal entries of confusion matrix shows
the percentages of correctly classified and misclassified samples respectively.
Framework recognized expression of happiness better recognized than any other
expression while expression of fear was most misclassified. Generally, proposed
framework’s recognition rate is lower for expressions of anger, fear and disgust as
compared to expressions of sadness, happiness and surprise.
As said previously, performance of the framework can be improved by
extracting and concatenating more features (from the salient facial regions)
which have strong discriminative abilities. We have not compared our results on
FEED database with other state-of-the-art methods. The reason is that
generally state-of-the-art methods do not show results for this database.
86

FER based on Brightness and Entropy Drawbacks of the proposed algorithm
Sadness Happiness Surprise Anger Disgust FearSadness 68.1 8.8 6.3 4.3 3.5 9Happiness 10.8 70.8 16.4 0 2 0Surprise 9 10.8 70.1 4 1.7 4.4Anger 0 10.5 0 62.1 15.1 12.3Disgust 10.3 15.5 8.4 0 63.3 2.5Fear 3 2.6 3.3 10.1 20.7 60.3
Table 4.2: Confusion matrix for FG-NET FEED database.
4.4 Drawbacks of the proposed algorithm
Novel framework that is proposed in this chapter extracts features only from the
perceptually salient facial regions as done in human visual system (HVS). The
framework operates on the saliency maps obtained by the “frequency tuned
salient region detection” (FT) to extract features. This model directly defines
pixel saliency using the color differences from the average image color. We
selected this method over other state-of-the art methods for saliency detection as
it performs better (see Section 4.1), but it has some weaknesses that are also
inherited in our proposed framework for expression recognition.
Secondly, Frequency tuned salient region detection algorithm only considers first
order average color, which can be insufficient to analyze complicated variations in
a given stimuli. Also this method ignore spatial relationships across image parts,
which can be critical for reliable and coherent saliency detection [CZM+11]. All of
these drawbacks of saliency detection algorithm contributes to the below average
performance of the proposed framework.
Novel framework presented in this chapter is published in “IEEE International
Conference on Intelligent Systems Design and Applications” [KMKB11].
87


Chapter 5
Facial region shape analysis for
recognition of expressions
Contents
5.1 Proposed framework . . . . . . . . . . . . . . . . . . . . 90
5.2 Feature extraction using PHOG . . . . . . . . . . . . . 92
5.3 Discriminative strength of PHOG features . . . . . . . 94
5.4 Expression recognition experiments . . . . . . . . . . . 94
5.4.1 First experiment: CK+ database . . . . . . . . . . . . . 96
5.4.2 Second experiment: generalization on the new dataset . 99
5.4.3 Third experiment: low resolution image sequences . . . 101
5.5 Conclusion . . . . . . . . . . . . . . . . . . . . . . . . . . 102
To overcome the drawbacks of proposed descriptor based on “Brightness” and
“Entropy” Features (discussed in Section 4.4) we examined the “shape features”
of facial region(s) for their descriptive abilities. By studying shape features
directly from the stimuli, we overcome the dependency of our subsequently
proposed framework for facial expression on saliency detection algorithm, which
caused previously proposed framework to produce results below average (Chapter
4).
89

Proposed framework shape analysis
We hypothesized that shape features of different facial regions can have
strong discriminative abilities, as from the different stimuli (see Figures 3.18 and
2.1 for example) it can be observed that different facial regions forms very
discriminative and distinctive shapes when showing different expressions. To
extract shape information from the stimuli we introduce Pyramid Histogram of
Oriented Gradients (PHOG) descriptor. PHOG is an extension of Histogram of
Gradient Orientation (HOG) by Dalal and Triggs [DT05] and it was initially
proposed for human detection. As the proposed novel framework is based on
Psycho-Visual experimental study (see Chapter 3), it extracts PHOG features
only from the perceptual salient facial regions region(s). By processing only
salient regions, proposed framework reduces computational complexity of feature
extraction and thus, can be used for real-time applications. At the same time it
overcomes the drawbacks of the previously proposed framework (refer Chapter 4)
i.e. low discrimination ability of extracted features.
5.1 Proposed framework
Feature selection along with the region(s) from where these features are going to
be extracted is one of the most important step to successfully analyze and
recognize facial expressions automatically. As the proposed framework for
automatic expression recognition draws its inspiration from the human visual
system, it processes only perceptual salient facial region(s) for the feature
extraction. The proposed framework creates a novel feature space by extracting
Pyramid Histogram of Orientation Gradients (PHOG) [BZM07] features from
the perceptually salient facial regions (See Figure 3.18 ). Schematic overview of
the proposed framework is illustrated in Figure 5.1.
The steps of the proposed framework are as follows.
1. The framework first localizes salient facial regions using Viola-Jones object
detection algorithm [VJ01] as it was done in the former proposed framework
(refer Chapter 4). We selected this algorithm as it is the most cited and
considered the fastest and most accurate pattern recognition method for
face and facial region detection [KT04b].
90
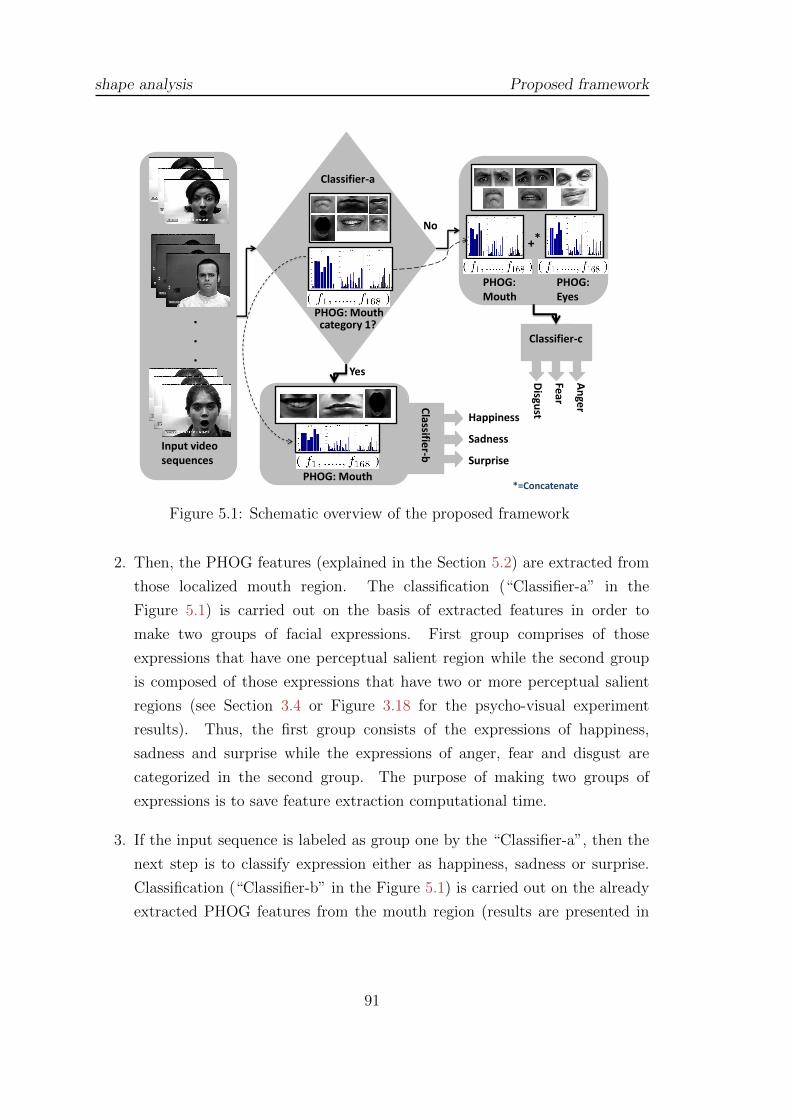
shape analysis Proposed framework
category 1?
.
.
.
+*
Yes
No
Classifie
r-b
Classifier-c
Happiness
Sadness
Surprise
An
ger
Fear
Disgu
st
Classifier-a
Input video sequences
PHOG: Mouth
PHOG: Eyes
PHOG: Mouth
*=Concatenate PHOG: Mouth
Figure 5.1: Schematic overview of the proposed framework
2. Then, the PHOG features (explained in the Section 5.2) are extracted from
those localized mouth region. The classification (“Classifier-a” in the
Figure 5.1) is carried out on the basis of extracted features in order to
make two groups of facial expressions. First group comprises of those
expressions that have one perceptual salient region while the second group
is composed of those expressions that have two or more perceptual salient
regions (see Section 3.4 or Figure 3.18 for the psycho-visual experiment
results). Thus, the first group consists of the expressions of happiness,
sadness and surprise while the expressions of anger, fear and disgust are
categorized in the second group. The purpose of making two groups of
expressions is to save feature extraction computational time.
3. If the input sequence is labeled as group one by the “Classifier-a”, then the
next step is to classify expression either as happiness, sadness or surprise.
Classification (“Classifier-b” in the Figure 5.1) is carried out on the already
extracted PHOG features from the mouth region (results are presented in
91

Feature extraction using PHOG shape analysis
the Section 5.4) as for these expressions it has been found that the facial
region of “mouth” is the salient region (see Figure 3.18).
4. If the input sequence is classified in the second group, then the framework
extracts PHOG features from the eyes region and concatenates them with
the already extracted PHOG features from the mouth region. Features
from the facial region of eyes are extracted as the results from the
psycho-visual experiment suggests that the region of eye is also the salient
region along with the region of mouth for the expressions of anger, fear or
disgust (see Figure 3.18). Then, the concatenated features vector is fed to
the classifier (“Classifier-c” in the Figure 5.1) for the final classification of
the input sequence (see Section 5.4 for the classification results). It is
worth mentioning here that for the expression of “disgust” nose region
emerged as one of the salient regions but the framework do not explicitly
extracts features from this region. This is due to the fact that, the region of
nose that emerged as salient is the upper nose (wrinkles) area which is
connected and already included in the localization of the eyes region.
5.2 Feature extraction using PHOG
PHOG is a spatial shape descriptor and got its inspiration from the works of Dalal
et al. [DT05] on histograms of oriented gradients and Lazebnik et al. [LSP06]
on spatial pyramid matching. It represents an image by its local shape and the
spatial layout of the shape. Steps for the PHOG feature extraction are as follows:
1. Canny edge operator is applied to extract contours from the given stimuli.
As illustrated in Figure 5.2 second row, edge contours represents the shape
information.
2. Then, the image is divided into finer spatial grids by iteratively doubling the
number of divisions in each dimension. It can be observed from Figure 5.2
that the grid at level l has 2l cells along each dimension.
3. Afterwards, a histogram of orientation gradients (HOG) are calculated on
each edge point using 3 x 3 Sobel mask without Gaussian smoothing and
92

shape analysis Feature extraction using PHOG
Figure 5.2: HOG feature extraction. First row: input stimuli, second row: edgecontours at three different pyramid levels, third row: histograms of gradients(HOG) at three respective levels.
the contribution of each edge is weighted according to its magnitude.
Within each cell, histogram is quantized into N bins. Each bin represents
the accumulation of number of edge orientations within a certain angular
range.
4. To obtain the final PHOG descriptor, histograms of gradients (HOG) at the
same levels are concatenated. The final PHOG descriptor is a concatenation
of HOG at different pyramid levels. Generally, the dimensionality of the
PHOG descriptor can be calculated by: N∑
l 4l. In our experiment we
93

Discriminative strength of PHOG features shape analysis
obtained 168 dimensional feature vector ( f1, ....., f168 ) from one facial region,
as we created two pyramid levels with 8 bins with the range of [0-360]. The
same is shown in the Figure 5.2.
5.3 Discriminative strength of PHOG features
Figure 5.3 presents PHOG features (from the mouth region) which are extracted
from the two categories of the expressions. It can be observed in the referred
figure that PHOG features have a discriminative trend, specially at the level 2
histograms have quite different shape. This discriminative ability is used in the
proposed framework, initially to categorize expressions into two (“Classifier-a” in
the Figure 5.1) and later for the final classification.
5.4 Expression recognition experiments
We conducted facial expression recognition experiments on two databases, the
extended Cohn-Kanade (CK+) database [LCK+10] and the FG-NET facial
expressions and emotion database(FEED) [Wal06]. Details related to CK+
database and FG-NET FEED are presented in the Appendix Sections A.1 and
A.3 respectively.
The performance of the framework was evaluated using following four classical
classifiers:
1. Support vector machine (SVM) with χ2 kernel and γ=1
2. C4.5 Decision Tree (DT) with reduced-error pruning
3. Random Forest (RF) of 10 trees
4. 2 Nearest Neighbor (2NN) based on Euclidean distance
The parameters of the classifiers were determined empirically. For discussion
on different classifiers refer Section 2.3.3.
94

shape analysis Expression recognition experiments
Figure 5.3: HOG features for different expressions. First row: sadness, secondrow: surprise, third row: happiness, fourth row: anger and fifth row: disgust.First column shows stimuli and second column shows respective HOG (only mouthfacial region) at three levels.
95

Expression recognition experiments shape analysis
5.4.1 First experiment: CK+ database
For the first study, we used all 309 sequences from the CK+ database which have
FACS coded expression label. The experiment was carried out on the frames
which covers the status of onset to apex, as done by Yang et al. [YLM10].
Region of interest was obtained automatically by using Viola-Jones object
detection algorithm [VJ01] and processed to obtain PHOG feature vector 1.
The proposed framework achieved average recognition rate of 95.3%, 95.1%,
96.5% and 96.7% for SVM, C4.5 decision tree, random forest and 2NN respectively.
These values were calculated using 10 -fold cross validation. One of the most
interesting aspects of our approach is that it gives excellent results for a simple
2NN classifier which is a non-parametric method. This points to the fact that
framework do not need computationally expensive methods such as SVM, Random
forests or decision trees to obtain good results. In general, the proposed framework
achieved high expression recognition accuracies irrespective of the classifiers, proves
the descriptive strength of the features.
Sa Ha Su Fe An DiSa 95.5 0 0.5 0 4.0 0Ha 0 95.1 0 4.1 0 0.8Su 3.4 0 96.6 0 0 0Fe 0 3.2 0 94.6 2.2 0An 4.8 0 0 0 95.2 0Di 0.8 0.9 0 0 3.4 94.9
Table 5.1: Confusion Matrix: SVM
For comparison and reporting results, we have used the classification results
obtained by the SVM as it is the most cited method for classification in the
literature. Table 5.1 shows the confusion matrix for SVM. Confusion matrices for
the C4.5 decision tree, random forest and 2NN classifiers are not presented as the
results are very similar. In the presented table expression of Happiness is referred
by “Ha”, Sadness by “Sa”, Surprise by “Su”, Fear by “Fe”, Anger by “An” and
1video showing the result of the proposed framework on CK+ database is available at: http:
//www.youtube.com/watch?v=wnF7Id9G6rM
96

shape analysis Expression recognition experiments
Disgust by “Di”. Diagonal and off-diagonal entries of confusion matrix shows the
percentages of correctly classified and misclassified samples respectively.
We tested the proposed framework upto three pyramid levels (level 0 to level
2) (refer Figure 5.2). The framework was not tested for more pyramid levels as it
produced results in the range of 95% which is better or equal than state-of-the-
art methods (for reference see Table 5.2). By increasing pyramid levels it would
increase the size of feature vector and thus increase the feature extraction time
and likely would add few percents in the accuracy of framework which will be
insignificant for a framework holistically.
Pyramid LevelLevel 0 Level 1 level 2
SVM 73.2 83.6 95.32NN 83.5 91 96.7Decision tree 77.1 86.9 95.1Random Forest 81.3 87.2 96.5
Table 5.2: Proposed framework recognition rate (%) for three pyramid levels.
5.4.1.1 Behavior of the classifiers
Figure 5.4 shows the behavior of the four classifiers used in the experiment. For all
the classifiers we have computed the average recognition accuracy using different
number of folds (k ’s) for the k -fold cross validation technique. In k -fold cross
validation, features vector set is divided into k equal subsets. k -1 subsets are
used for the training while a single set is retained for the testing. The process is
repeated k times (k -folds), with each of the k subsets used exactly once for testing.
Then, the k estimations from k -folds are averaged to produce final estimated value.
Generally, Figure 5.4 graphically presents the influence of the size of the training
set on the performance of the classifiers. C4.5 decision tree classifier was influenced
the most with less training data while 2NN classifier achieved highest recognition
rate among the four classifiers with relatively small training set (i.e. 2-folds). This
indicates how well our novel feature space was clustered.
97

Expression recognition experiments shape analysis
Figure 5.4: Evolution of the achieved average recognition accuracy for the sixuniversal facial expressions with the increasing number of folds for the k -fold crossvalidation technique.
5.4.1.2 Comparison with the state-of-the-art methods
Table 5.3 shows the comparison of the achieved average recognition rate of the
proposed framework with the state-of-the-art
methods[LBF+06, ZP07, KZP08, Tia04, YLM10, TTUP13, GL13] using the
same database (i.e Cohn-Kanade database). The methode proposed in [TTUP13]
states results on 1632 images, which roughly corresponds to 55 video sequences
as Cohn-Kanade database has average of 30 images per video sequence. Results
from [YLM10] are presented for the two configurations. “[YLM10]a” shows the
reported result when the method was evaluated for the last three frames (apex
frames) from the sequence while “[YLM10]b” presents the reported result for the
frames which encompasses the status from onset to apex of the expression. For
comparison, we have used classification results obtained by SVM as it is the most
cited method for classification in the literature.
98

shape analysis Expression recognition experiments
Sequence Class Performance Recog.Num Num Measure Rate (%)
[LBF+06] 313 7 leave-one-out 93.3[ZP07] 374 6 ten-fold 96.26[KZP08] 374 6 five-fold 94.5[Tia04] 375 6 - 93.8[YLM10]a 352 6 66% split 92.3[YLM10]b 352 6 66% split 80[TTUP13] 55 7 seven-fold 96.9[GL13] 315 6 five-fold 97.3Ours 309 6 ten-fold 95.3
Table 5.3: Comparison with the state-of-the-art methods
Although it is difficult to compare results directly from the different methods
due to the variability in testing protocols or preprocessing, Table 5.3 still gives
an indication of the discriminative ability of the different approaches. First
observation that can be made from Table 5.3 is that the proposed framework is
comparable to any other state-of-the-art method in terms of expression
recognition accuracy. The method discussed in “[YLM10]b” where authors has
used frames which encompasses the status from onset to apex of the expression is
directly comparable to our method, as we also employed the same approach. In
this configuration, our framework is better in terms of average recognition
accuracy. It is also very interesting to mention that, in [YLM10] authors have
shown facial regions of the top five compositional features (Haar-like features)
which were selected after boosting learning. Facial regions of those features
corresponds very well to the salient regions that we have determined for a
particular expression after the psycho-visual experiment (see Figure 3.18).
5.4.2 Second experiment: generalization on the new
dataset
The aim of the second experiment was to study how well the proposed
framework generalizes on the new dataset. According to our knowledge only
Valstar et al. [VPP05] have reported such data earlier. Thus, this experiment
99

Expression recognition experiments shape analysis
helps to understand how the framework will behave when it will be used to
classify expressions in real life videos.
Experiment was performed in two different scenarios, with the same classifier
parameters as the first experiment:
a. In the first scenario samples from the CK+ database were used for the
training of different classifiers and samples from FG-NET FEED [Wal06]
were used for the testing. Obtained results are presented in Table 5.4.
b. In the second scenario we used samples from the FG-NET FEED for the
training and testing was carried out with the CK+ database samples. Results
obtained are presented in Table 5.5.
Average recognition accuracies for training phase mentioned in Table 5.4 and
5.5 were calculated using 10 -fold cross validation method.
SVM C4.5 DT RF 2NNTraining samples 95.3% 95.1% 96.5% 96.7%Test samples 80.5% 72.1% 71.1% 80%
Table 5.4: Average recognition accuracy: training classifier on CK+ database andtesting it with FG-NET FEED
SVM C4.5 DT RF 2NNTraining samples 90.3% 91.2% 89.5% 92.2%Test samples 74.4% 72.2% 75.4% 81.9%
Table 5.5: Average recognition accuracy: training classifier on FG-NET FEEDand testing it with CK+ database
Second experiment provided a good indication of how accurate the framework
will perform in a challenging real life scenario. Results obtained from the second
experiment shows that the performance of the framework does not deteriorate
significantly even if it is used to classify samples which are different from training
samples in terms of lighting conditions, resolution of the video and camera zoom.
100

shape analysis Expression recognition experiments
5.4.3 Third experiment: low resolution image sequences
There exist many real world applications that require expression recognition
system to work amicably on low resolution images. Smart meeting, video
conferencing and visual surveillance are some examples of such applications.
Ironically most of the existing state-of-the-art methods for expressions
recognition report their results only on high resolution images without reporting
results on low resolution images.
Figure 5.5: Example of stimuli with decreasing image resolution. First columnshows stimuli in original resolution. Second to fifth column show stimuli in spatialresolution of: 144 x 192, 72 x 96, 36 x 48 and 18 x 24 respectively.
We have tested our proposed framework on low resolution images of four
different facial resolutions (144 x 192, 72 x 96, 36 x 48, 18 x 24 ) based on
Cohn-Kanade database as done by Tian [Tia04]. Example of the stimuli with
different low resolutions are presented in Figure 5.5. Tian’s work can be
considered as the pioneering work for low resolution image facial expression
recognition. Low resolution image sequences were obtained by down sampling
the original sequences. All the other experimental parameters are same as first
two experiments.
Five different image resolutions (original + four down sampled) were used to
evaluate the performance of the proposed framework. For all the classiffiers we
have computed the average recognition accuracy using 10 -fold cross validation
technique. The results are presented in Figure 5.6.
It can be observed from Figure 5.6 that the decrease in image spatial
resolution is accompanied by a significant decrease in the performance of the
proposed framework. Out of all the four tested classifiers, SVM’s performance is
101

Conclusion shape analysis
Figure 5.6: Robustness of different classifiers for facial expression recognition withdecreasing image resolution.
deteriorated the most. The main resason for the drop of performance of the
proposed framework is its reliance on the edge/contour based descriptor i.e.
PHOG. The first step of the PHOG descriptor is to extract contour information
from the given stimuli (for reference see Section 5.2) but as the stimuli spatial
resolution gets decreased so does the sharpness of contours. The same can be
observed in the Figure 5.5. Thus, PHOG fails to extract meaningful information
from the low resolution images which explains the cause of bad performance of
the framework on low resolution images.
5.5 Conclusion
It can be deduced from the presented results that the proposed framework is
capable of producing results at par with the other state-of-the-art methods for the
102

shape analysis Conclusion
stimuli recorded in controlled environment i.e. CK+ database (refer Table 5.3).
The framework creates novel feature space by extracting features only from the
perceptual salient facial regions. The novel feature space is conducive for facial
expression recognition task as it achieved best result with “naıve” 2 NN classifier
(see Section 5.4.1.1). This indicates how well our novel feature space was clustered.
By processing only salient regions, proposed framework reduces computational
complexity of feature extraction and thus, can be used for real-time applications.
Its current unoptimized Matlab implementation runs at 6 frames / second (on
windows 7 machine, with i7-2760QM processor and 6 GB RAM) which is enough
as facial expressions do not change abruptly.
The proposed framework showed its weakness on low resolution images (refer
Section 5.4.3). The proposed framework is unable to cope with stimuli of low
resolution or stimuli not having sharp contours. The reason for this weakness is
its reliance on the edge/contour based descriptor i.e. PHOG.
Novel framework presented in this chapter is published in “IEEE International
Conference on Image Processing” [KMKB12b].
103


Chapter 6
Recognizing expressions by
analyzing texture
Contents
6.1 PLBP based framework . . . . . . . . . . . . . . . . . . . 106
6.1.1 Novelty of the proposed descriptor . . . . . . . . . . . . 109
6.2 Expression recognition framework . . . . . . . . . . . . 110
6.3 Results on universal expressions . . . . . . . . . . . . . 112
6.3.1 First experiment: posed expressions . . . . . . . . . . . 113
6.3.2 Second experiment: low resolution image sequences . . . 118
6.3.3 Third experiment: generalization on the new dataset . . 121
6.3.4 Fourth experiment: spontaneous expressions . . . . . . . 122
6.4 Pain recognition . . . . . . . . . . . . . . . . . . . . . . . 124
6.4.1 Novelty of proposed approach . . . . . . . . . . . . . . . 125
6.4.2 Pain expression database . . . . . . . . . . . . . . . . . 126
6.4.3 Framework . . . . . . . . . . . . . . . . . . . . . . . . . 126
6.4.4 Experiment . . . . . . . . . . . . . . . . . . . . . . . . . 128
6.5 Conclusion . . . . . . . . . . . . . . . . . . . . . . . . . . 132
105

PLBP based framework Recognizing expressions by analyzing texture
To rectify the problems of the proposed framework based on edge / contour
information (refer Chapter 5), we studied appearance features to recognize
various facial expressions. We propose a novel descriptor for facial features
analysis, “Pyramid of Local Binary Pattern (PLBP)”. PLBP is a spatial
representation of local binary pattern (LBP) [OPH96] and it represents stimuli
by its local texture (LBP) and the spatial layout of the texture. We chose to
extend LBP descriptor as it is not based on edges (drawback of former
descriptor) and has been proved to be effective for facial images analysis task
[ZP07, SGM09, AHP04]. We combined pyramidal approach with LBP descriptor
for facial feature analysis as this approach has already been proved to be very
effective in a variety of image processing tasks [HGN04]. Thus, the proposed
descriptor is a computationally efficient novel extension of LBP image
representation, and it shows significantly improved performance for facial
expression recognition tasks for low resolution images.
6.1 PLBP based framework
The proposed framework creates a novel feature space by extracting proposed
PLBP (pyramid of local binary pattern) features only from the visually salient
facial region (see Chapter 3 for details of psycho-visual experiment). PLBP is a
pyramidal-based spatial representation of local binary pattern (LBP) descriptor.
PLBP represents stimuli by their local texture (LBP) and the spatial layout of
the texture. The spatial layout is acquired by tiling the image into regions at
multiple resolutions. The idea is illustrated in Figure 6.1. If only the coarsest
level is used, then the descriptor reduces to a global LBP histogram. Comparing
to the multi-resolution LBP of Ojala et al.[OPM02] which is illustrated in Figure
6.2, our descriptor selects samples in a more uniformaly distributed manner,
whereas Ojala’s LBP takes samples centered around a point leading to missing
some information in the case of face (which is different than a repetitive texture).
LBP features were initially proposed for texture analysis [OPH96], but recently
they have been successfully used for facial expression analysis [ZP07, SGM09]. The
most important property of LBP features is their tolerance against illumination
106

Recognizing expressions by analyzing texture PLBP based framework
Figure 6.1: Pyramid of Local Binary Pattern. First row: stimuli at two differentpyramid levels, second row: histograms of LBP at two respective levels, third row:final descriptor.
changes and their computational simplicity [OP99, OPH96, OPM02]. The operator
labels the pixels of an image by thresholding the 3 x 3 neighbourhood of each pixel
with the center value and considering the result as a binary number. Then the
histogram of the labels can be used as a texture descriptor. Formally, LBP operator
takes the form:
LBP (xc, yc) =7∑
n=0
s(in − ic)2n (6.1)
where in this case n runs over the 8 neighbours of the central pixel c, ic and in
are the grey level values at c and n and s(u) is 1 if u ≥ 0 or 0 otherwise.
The limitation of the basic LBP operator is its small 3 x 3 neighborhood which
can not capture dominant features with large scale structures. Hence the operator
later was extended to use neighborhood of different sizes [OPM02]. Using circular
neighborhoods and bilinearly interpolating the pixel values allow any radius and
107

PLBP based framework Recognizing expressions by analyzing texture
Figure 6.2: Examples of the extended LBP [OPM02]. The pixel values arebilinearly interpolated whenever the sampling point is not in the center of a pixel
number of pixels in the neighborhood. See Figure 6.2 for examples of the extended
LBP operator, where the notation (P,R) denotes a neighborhood of P equally
spaced sampling points on a circle of radius of R that form a circularly symmetric
neighbor set.
The LBP operator with P sampling points on a circular neighborhood of radius
R is given by:
LBPP,R =P−1∑p=0
s(gp − gc)2p (6.2)
where, gc is the gray value of the central pixel, gp is the value of its neighbors, P
is the total number of involved neighbors and R is the radius of the neighborhood.
Another extension to the original operator is the definition of uniform patterns,
which can be used to reduce the length of the feature vector and implement a
simple rotation-invariant descriptor. This extension was inspired by the fact that
some binary patterns occur more commonly in texture images than others. A
local binary pattern is called uniform if the binary pattern contains at most two
bitwise transitions from 0 to 1 or vice versa when the bit pattern is traversed
circularly. For example, 00000000, 00011110 and 10000011 are uniform patterns.
Accumulating the patterns which have more than 2 transitions into a single bin
yields an LBP operator, denoted LBP u2P,R patterns. These binary patterns can be
used to represent texture primitives such as spot, flat area, edge and corner.
We extend LBP operator so that the stimuli can be represented by its local
texture and the spatial layout of the texture. We call this extended LBP operator
108
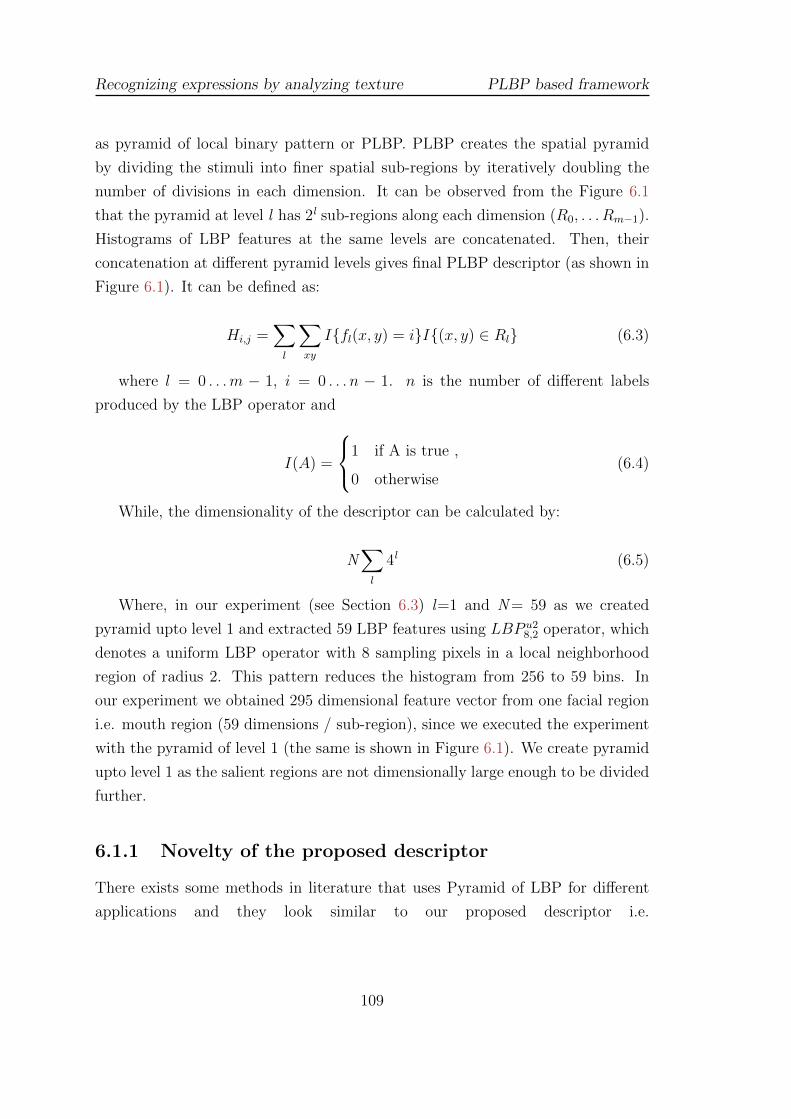
Recognizing expressions by analyzing texture PLBP based framework
as pyramid of local binary pattern or PLBP. PLBP creates the spatial pyramid
by dividing the stimuli into finer spatial sub-regions by iteratively doubling the
number of divisions in each dimension. It can be observed from the Figure 6.1
that the pyramid at level l has 2l sub-regions along each dimension (R0, . . . Rm−1).
Histograms of LBP features at the same levels are concatenated. Then, their
concatenation at different pyramid levels gives final PLBP descriptor (as shown in
Figure 6.1). It can be defined as:
Hi,j =∑l
∑xy
I{fl(x, y) = i}I{(x, y) ∈ Rl} (6.3)
where l = 0 . . .m − 1, i = 0 . . . n − 1. n is the number of different labels
produced by the LBP operator and
I(A) =
1 if A is true ,
0 otherwise(6.4)
While, the dimensionality of the descriptor can be calculated by:
N∑l
4l (6.5)
Where, in our experiment (see Section 6.3) l=1 and N = 59 as we created
pyramid upto level 1 and extracted 59 LBP features using LBP u28,2 operator, which
denotes a uniform LBP operator with 8 sampling pixels in a local neighborhood
region of radius 2. This pattern reduces the histogram from 256 to 59 bins. In
our experiment we obtained 295 dimensional feature vector from one facial region
i.e. mouth region (59 dimensions / sub-region), since we executed the experiment
with the pyramid of level 1 (the same is shown in Figure 6.1). We create pyramid
upto level 1 as the salient regions are not dimensionally large enough to be divided
further.
6.1.1 Novelty of the proposed descriptor
There exists some methods in literature that uses Pyramid of LBP for different
applications and they look similar to our proposed descriptor i.e.
109

Expression recognition framework Recognizing expressions by analyzing texture
[WCX11, GZZM10, MB11]. Our proposition is novel and there exist differences
in the methodology that creates differences in the extracted information. Method
for face recognition proposed in [WCX11] creates pyramids before applying LBP
operator by down sampling original image i.e. scale-space representation,
whereas we propose to create the spatial pyramid by dividing the stimuli into
finer spatial sub-regions by iteratively doubling the number of divisions in each
dimension. Thus, theoretically both the methods are extracting different data
before applying LBP operator. Secondly, our approach reduces memory
consumption (does not require to store same image in different resolutions) and
is computationally more efficient. Guo et al. [GZZM10] proposed an approach
for face and palmprint recognition based on multiscale LBP. Their proposed
method seems similar to our method for expression recognition but how
multiscale analysis is achieved deviates our approach. The approach proposed in
[GZZM10] achieves multiscale analysis using different values of P and R, where
LBP (P,R) denotes a neighborhood of P equally spaced sampling points on a
circle of radius R (discussed earlier). Same approach has been applied by Moore
et al. [MB11] for facial features analysis. Generally the drawback of using such
approach is that it increases the size of the feature histogram and increases the
computational cost. [MB11] reports dimensionality of feature vector as high as
30,208 for multiscale face expression analysis as compared to our proposition
which creates 590 dimensional feature vector (see Section 6.2) for the same task.
We achieve the task of multiscale analysis much more efficiently than any other
earlier proposed methods. By the virtue of efficient multiscale analysis our
framework can be used for real time applications (see Table 6.5 for the time and
memory consumption comparison) which is not the case for other methods.
6.2 Expression recognition framework
Feature selection along with the region(s) from where these features are going to
be extracted is one of the most important step to recognize expressions. As the
proposed framework draws its inspiration from the human visual system (HVS),
it extracts proposed features i.e. PLBP, only from the perceptual salient facial
region(s) which were determined through Psycho-Visual experiment. Schematic
110

Recognizing expressions by analyzing texture Expression recognition framework
overview of the framework is presented in Figure 6.3. Steps of the proposed
framework are as follows.
Figure 6.3: Schematic overview of the framework.
1. The framework first localizes salient facial regions using Viola-Jones object
detection algorithm [VJ01] as it was done in the former proposed frameworks
(Chapters 4 and 5).
2. Then, the framework extracts PLBP features from the mouth region,
feature vector of 295 dimensions ( f1, ....., f295 ). The classification
(“Classifier-a” in the Figure 6.3) is carried out on the basis of extracted
features in order to make two groups of facial expressions. First group
comprises expressions that have one perceptual salient region i.e.
happiness, sadness and surprise. The second group is composed of
expressions that have two or more perceptual salient regions i.e. anger, fear
and disgust (see Section 3.4). The purpose of making two groups of
expressions is to reduce feature extraction computational time.
111

Results on universal expressions Recognizing expressions by analyzing texture
3. If the stimuli is classified in the first group, then it is classified either as
happiness, sadness or surprise by the “Classifier-b” using already extracted
PLBP features from the mouth region.
4. If the stimuli is classified in the second group, then the framework extracts
PLBP features from the eyes region and concatenates them with the
already extracted PLBP features from the mouth region, feature vector of
590 dimensions ( f1, ....., f295 + f1, ....., f295 ). Then, the concatenated
feature vector is fed to the classifier (“Classifier-c”) for the final
classification. It is worth mentioning here that for the expression of
“disgust”, the nose region emerged as one of the salient regions but the
framework does not explicitly extracts features from this region. This is
due to the fact that, the region of nose that emerged as salient is the upper
nose (wrinkles) area which is connected and already included in the
localization of the eyes region.
6.3 Results on universal expressions
We performed person-independent facial expression recognition using proposed
PLBP features 1. We have evaluated the performance of proposed novel
framework on low resolution image sequences. There are many real world
applications that require robust expression recognition system for low resolution
images i.e. smart meeting, video conferencing and visual surveillance etc. Most
of existing frameworks for expression recognition are not evaluted for the same.
Thus, it is very important to develop such a system that works appropriately for
both low and high resolution input stimuli. In total we have performed four
experiments to evaluate proposed framework in different scenarios.
1. First experiment was performed on the extended Cohn-Kanade (CK+)
database [LCK+10]. This database contains 593 sequences of posed
universal expressions. Sequences were digitized into 640 x 490 pixel array
1video showing the result of the proposed framework on good quality image sequences is availableat: http://www.youtube.com/watch?v=RPeXBdS_pd8
112

Recognizing expressions by analyzing texture Results on universal expressions
with 8-bit precision for gray scale values, producing sequences with high
resolution faces (see Appendix Section A.1 for reference).
2. Second experiment was performed to test the performance of the proposed
framework on the low resolution image sequences. For this experiment low
resolution sequences were created from the extended Cohn-Kanade (CK+)
database by down sampling original sequences.
3. Third experiment tests the robustness of the proposed framework when
generalizing on the new dataset.
4. Fourth experiment was performed on the MMI facial expression database
(Part IV and V of the database) [VP10] which contains spontaneous/natural
expressions (see Appendix Section A.2 for reference).
For the first two experiments we used all the 309 sequences from the CK+
database which have FACS coded expression label [EF78]. The experiment was
carried out on the frames which covers the status of onset to apex of the expression,
as done by Yang et al. [YLM10]. Region of interest was obtained automatically
by using Viola-Jones object detection algorithm [VJ01] and processed to obtain
PLBP feature vector. We extracted LBP features only from the salient region(s)
using LBP u28,2 operator which denotes a uniform LBP operator with 8 sampling
pixels in a local neighborhood region of radius 2 1. In our framework we created
image pyramid up to level 1, so in turn got five sub-regions from one facial region
i.e. mouth region (see Figure. 6.1). In total we obtained 295 dimensional feature
vector (59 dimensions / sub-region).
6.3.1 First experiment: posed expressions
This experiment measures the performance of the proposed framework on the
classical database i.e. extended Cohn-Kanade (CK+) database [LCK+10]. Most
of the methods in literature report their performance on this database, so this
1In the second experiment we adopted LBPu24,1 operator when the face resolution gets smaller
than 36 x 48
113

Results on universal expressions Recognizing expressions by analyzing texture
experiment could be considered as the benchmark experiment for facial expression
recognition framework.
The performance of the framework was evaluated for four different classifiers:
1. Support vector machine (SVM)” with χ2 kernel and γ=1
2. C4.5 decision tree with reduced-error pruning
3. Random forest of 10 trees
4. 2 nearest neighbor (2NN) based on Euclidean distance.
6.3.1.1 Results
The framework achieved average recognition rate of 96.7%, 97.9%, 96.2% and
94.7 % for SVM, 2-nearest neighbor, Random forest and C4.5 decision tree
respectively using 10 -fold cross validation technique (refer Table 6.1). One of the
most interesting aspects of our approach is that it gives excellent results for a
simple 2NN classifier which is a non-parametric method. This points to the fact
that our framework does not need computationally expensive methods such as
SVM, random forests or decision trees to obtain good results. In general, the
proposed framework achieved high expression recognition accuracies irrespective
of the classifiers. This proves the descriptive strength of the extracted features
(which minimizes within-class variations of expressions, while maximizes between
class variation).
Two-fold Ten-foldSVM 95.2 96.72-nearest neighbor 97.4 97.9Random forest 92.4 96.2C4.5 decision tree 90.5 94.7
Table 6.1: Average recognition performance(%)
For comparison and reporting results, we have used the classification results
obtained by the SVM as it is the most cited method for classification in the
literature. Table 6.2 shows the confusion matrix for SVM. In the presented table
114

Recognizing expressions by analyzing texture Results on universal expressions
Sa Ha Su Fe An DiSa 96.5 0 0.5 0 3.0 0Ha 0 97.1 0 2.1 0 0.8Su 2.9 0 97.1 0 0 0Fe 0 3.3 0 94.5 2.2 0An 3.5 0 0 0 96.5 0Di 0.8 0.7 0 0 3.1 96.4
Table 6.2: Confusion Matrix: SVM
expression of Happiness is referred by “Ha”, Sadness by “Sa”, Surprise by “Su”,
Fear by “Fe”, Anger by “An” and Disgust by “Di”. Diagonal and off-diagonal
entries of confusion matrix shows the percentages of correctly classified and
misclassified samples respectively.
Figure 6.4 shows the influence of the size of the training set on the
performance of the four classifiers used in the experiment. For all the classifiers
we have computed the average recognition accuracy using different number of
folds (k ’s) for the k -fold cross validation technique and plotted them in the
Figure 6.4. It can be observed that C4.5 decision tree classifier was influenced
the most with less training data while 2NN classifier achieved highest recognition
rate among the four classifiers with relatively small training set (i.e. 2-folds).
This indicates how well our novel feature space was clustered.
We recorded correct classification accuracy in the range of 95% for image
pyramid level 1. We decided not to test the framework with further image
pyramid levels as firstly, salient regions are not dimensionally large enough to be
divided further. Secondly, creating more pyramid level would double the size of
feature vector and thus increase the feature extraction time and likely would add
few percents in the accuracy of framework which will be insignificant for a
framework holistically. For reference see Tables 6.1 and 6.3.
6.3.1.2 Comparisons
We chose to compare average recognition performance of our framework with the
framework proposed by Shan et.al [SGM09] with different SVM kernels. Our
choice was based on the fact that both have common underlying descriptor i.e.
115

Results on universal expressions Recognizing expressions by analyzing texture
Figure 6.4: Evolution of the achieved average recognition accuracy for the sixuniversal facial expressions with the increasing number of folds for the k -fold crossvalidation technique.
Pyramid LevelLevel 0 Level 1
SVM 86.3 96.72NN 91.6 97.9Decision tree 89.1 94.7Random Forest 90.3 96.2
Table 6.3: Proposed framework recognition rate (%) for two pyramid levels.
local binary pattern (LBP), secondly framework proposed by Shan et.al [SGM09]
is highly cited in the literature. Table 6.4 shows the results and proves that the
proposed framework works better than the compared framework for any SVM
kernel. In terms of time and memory costs of feature extraction process, we have
measured and compared our descriptor with the LBP and Gabor-wavelet features
in Table 6.5. Table 6.5 shows the effectiveness of the proposed descriptor for facial
feature analysis i.e. PLBP, for real-time applications as it is memory efficient
116

Recognizing expressions by analyzing texture Results on universal expressions
LBP[SGM09] PLBPSVM(linear) 91.5 93.5SVM(polynomial) 91.5 94.7SVM(RBF) 92.6 94.9
Table 6.4: Average recognition percentages with different SVM kernels:comparison with [SGM09].
LBP Gabor Gabor PLBP[SGM09] [SGM09] [BL+03]
Memory 2,478 42,650 92,160 590(feature dimension)
Time 0.03s 30s - 0.01s(feature extraction time)
Table 6.5: Comparison of time and memory consumption.
and its extraction time is much lower than other compared descriptor (see Section
6.2 for the dimensionality calculation). The proposed framework is compared with
other state-of the-art frameworks using same database (i.e Cohn-Kanade database)
and the results are presented in Table 6.6.
Table 6.6 shows the comparison of the achieved average recognition rate of
the proposed framework with the state-of-the-art methods using same database
(i.e Cohn-Kanade database). The methode proposed in [TTUP13] states results
on 1632 images, which roughly corresponds to 55 video sequences as
Cohn-Kanade database has average of 30 images per video sequence. Results
from [YLM10] are presented for the two configurations. “[YLM10]a” shows the
result when the method was evaluated for the last three frames from the
sequence while “[YLM10]b” presents the reported result for the frames which
encompasses the status from onset to apex of the expression. It can be observed
from the Table 6.6 that the proposed framework is comparable to any other
state-of-the-art method in terms of expression recognition accuracy. The method
discussed in “[YLM10]b” is directly comparable to our method, as we also
evaluated the framework on similar frames. In this configuration, our framework
is better in terms of average recognition accuracy.
117

Results on universal expressions Recognizing expressions by analyzing texture
Sequence Class Performance Recog.Num Num Measure Rate (%)
[LBF+06] 313 7 leave-one-out 93.3[ZP07] 374 6 2-fold 95.19[ZP07] 374 6 10-fold 96.26[KZP08] 374 6 5-fold 94.5[Tia04] 375 6 - 93.8[YLM10]a 352 6 66% split 92.3[YLM10]b 352 6 66% split 80[TTUP13] 55 7 seven-fold 96.9[GL13] 315 6 five-fold 97.3Ours: framework proposed 309 6 10-fold 95.3in Chapter 5Ours 309 6 10-fold 96.7Ours 309 6 2-fold 95.2
Table 6.6: Comparison with the state-of-the-art methods for posed expressions.
In general, Tables 6.4, 6.5 and 6.6 shows that the framework is better than
the state-of-the-art frameworks in terms of average expression recognition
performance, time and memory costs of feature extraction processes. These
results show that the system could be used for real-time applications with high
degree of confidence.
6.3.2 Second experiment: low resolution image sequences
Most of the existing state-of-the-art systems for expressions recognition report
their results on high resolution images with out reporting results on low
resolution images. As mentioned earlier there are many real world applications
that require expression recognition system to work amicably on low resolution
images. Smart meeting, video conferencing and visual surveillance are some
examples of such applications. To compare with Tian’s work [Tia04], we tested
our proposed framework on low resolution images of four different facial
resolutions (144 x 192, 72 x 96, 36 x 48, 18 x 24 ) based on Cohn-Kanade
database. Tian’s work can be considered as the pioneering work for low
resolution image facial expression recognition. Table 6.7 shows the images at
different spatial resolution along with the average recognition accuracy achieved
118

Recognizing expressions by analyzing texture Results on universal expressions
by the different methods. Low resolution image sequences were obtained by down
sampling the original sequences. All the other experimental parameters i.e.
descriptor, number of sequences and region of interest, were same as mentioned
earlier in the Section 6.3.
PHOG [KMKB12b] 95.3 90.3 81 75 71.2Gabor [Tia04] 91.7 92.2 91.6 77.6 68.2
Gabor [SGM09] 89.8 89.8 89.2 83 75.1LBP [SGM09] 92.6 92.6 89.9 84.3 76.9
PLBP 96.7 95.3 93.9 92.8 90.5
Table 6.7: Average recognition accuracy (%) for six universal expressions on fivedifferent facial image resolutions. First column corresponds to original resolution.
Table 6.7 and Figure 6.5 report and compare the recognition results of the
proposed framework with the state-of-the-art methods on four different low facial
resolution images. Reported results of our proposed method are obtained using
support vector machine (SVM)” with χ2 kernel and γ=1. In Figure 6.5 recognition
curve for our proposed method is shown as PLBP-SVM, recognition curves of
LBP [SGM09] and Gabor [SGM09] are shown as LBP[JIVC] and Gabor[JIVC]
respectively, curve for Tian’s work [Tia04] is shown as Gabor[CVPRW] while Khan
et al. [KMKB12b] proposed system’s curve is shown as PHOG[ICIP] (framework
explained in Chapter 5 and specifically Section 5.4.3).
Results reports in LBP [SGM09] and Gabor [SGM09], the different facial image
resolution are 110 x 150, 55 x 75, 27 x 37 and 14 x 19 which are comparable to
the resolutions of 144 x 192, 72 x 96, 36 x 48, 18 x 24 pixels in our experiment.
Referenced table and figure show the supremacy of the proposed framework for low
resolution images. Specially for the smallest tested facial image resolution (18 x
24), our framework performs much better than any other compared state-of-the-art
method. Figure 6.6 shows the spatial resolution of salient regions for the smallest
119

Results on universal expressions Recognizing expressions by analyzing texture
Figure 6.5: Robustness of different methods for facial expression recognitionwith decreasing image resolution (CK database). PHOG[ICIP] corresponds toframework proposed by Khan et. al [KMKB12b] (framework explained in Chapter5 and specifically Section 5.4.3), Gabor [CVPRW] corresponds to Tian’s work[Tia04], LBP[JIVC] and Gabor[JIVC] corresponds to results reported by Shan et.al [SGM09]
tested facial image resolution. It is difficult to recognize expression with naked
eye at this resolution but good results achieved by the proposed framework show
the discriminative strength of the proposed descriptor i.e. PLBP. Results from
the first and second experiments show that the proposed framework for facial
expression recognition works amicably on classical dataset (CK dataset) and its
performance is not affected significantly for low resolution images. Secondly, the
framework has a very low memory requirement and thus it can be utilized for
real-time applications.
120
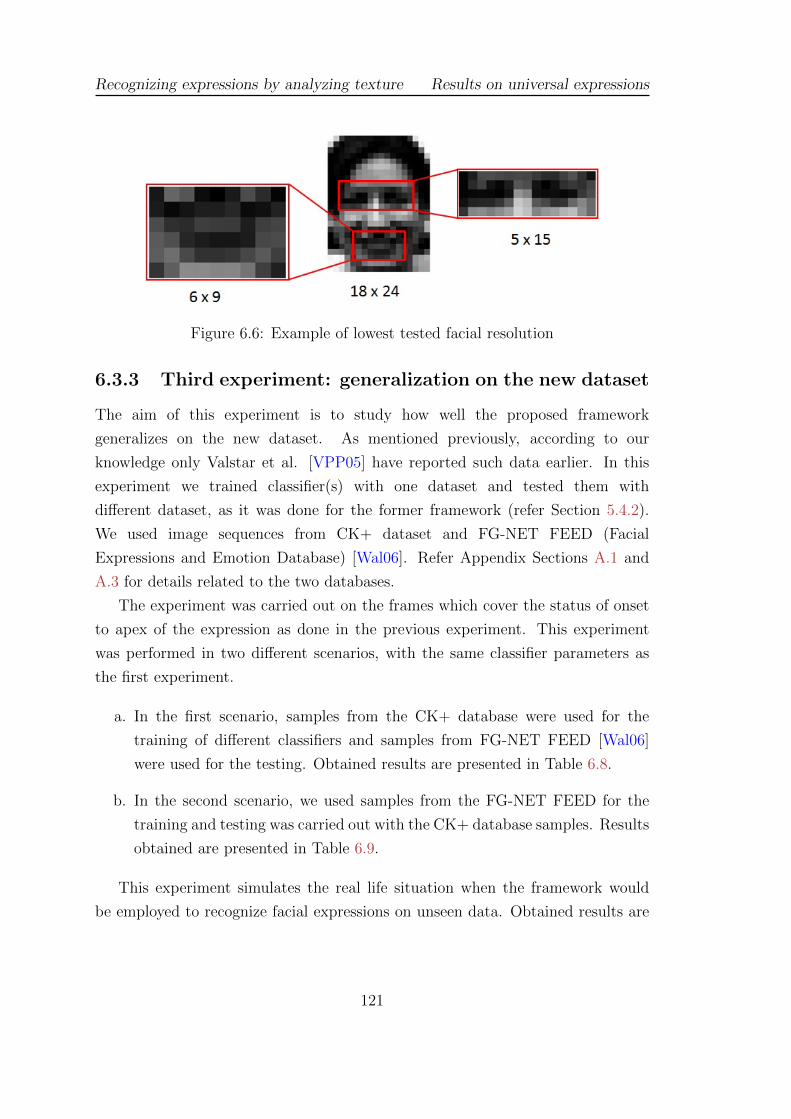
Recognizing expressions by analyzing texture Results on universal expressions
Figure 6.6: Example of lowest tested facial resolution
6.3.3 Third experiment: generalization on the new dataset
The aim of this experiment is to study how well the proposed framework
generalizes on the new dataset. As mentioned previously, according to our
knowledge only Valstar et al. [VPP05] have reported such data earlier. In this
experiment we trained classifier(s) with one dataset and tested them with
different dataset, as it was done for the former framework (refer Section 5.4.2).
We used image sequences from CK+ dataset and FG-NET FEED (Facial
Expressions and Emotion Database) [Wal06]. Refer Appendix Sections A.1 and
A.3 for details related to the two databases.
The experiment was carried out on the frames which cover the status of onset
to apex of the expression as done in the previous experiment. This experiment
was performed in two different scenarios, with the same classifier parameters as
the first experiment.
a. In the first scenario, samples from the CK+ database were used for the
training of different classifiers and samples from FG-NET FEED [Wal06]
were used for the testing. Obtained results are presented in Table 6.8.
b. In the second scenario, we used samples from the FG-NET FEED for the
training and testing was carried out with the CK+ database samples. Results
obtained are presented in Table 6.9.
This experiment simulates the real life situation when the framework would
be employed to recognize facial expressions on unseen data. Obtained results are
121

Results on universal expressions Recognizing expressions by analyzing texture
presented in Tables 6.8 and 6.9. Reported average recognition percentages for the
training phase were calculated using 10 -fold cross validation method. Obtained
results are encouraging and they can be further improved by training classifiers on
more than one dataset before using in real life scenario.
SVM C4.5 DT RF 2NNTraining samples 96.7 94.7 96.2 97.9Test samples 81.9 74.8 79.5 83.1
Table 6.8: Average recognition accuracy (%): training classifier on CK+ databaseand testing it with FG-NET FEED
SVM C4.5 DT RF 2NNTraining samples 92.3 91.2 90.5 93.3Test samples 80.5 77.3 79 84.7
Table 6.9: Average recognition accuracy (%): training classifier on FG-NET FEEDand testing it with CK+ database
6.3.4 Fourth experiment: spontaneous expressions
Spontaneous/natural facial expressions differ substantially from posed
expressions [BLB+02]. The same has also been proved by psychophysical work
[Ekm01, WBG87, EF82]. Ekman and Friesen [EF82] stated that the main
difference between spontaneous and fake expression lies in some of the
topographical and temporal aspect of these expressions. Weiss et al. [WBG87]
investigated some of the temporal differences and found shorter onset times and
more irregularities (pause and stepwise intensity changes) for posed/deliberate
facial expressions. They also provided the evidence that spontaneous expressions
are less irregular than posed expressions. Valstar et al. [VPAC06] experimentally
showed that temporal dynamics of spontaneous and posed brow actions are
different from each other. We also observed the same trend when working with
posed (CK) and spontaneous expressions databases (MMI) [VP10] (refer
Appendix Section A.2). In CK database actors show series of exaggerated
expressions with stepwise intensity changes. While spontaneous expressions
122

Recognizing expressions by analyzing texture Results on universal expressions
displayed in MMI database are devoid of any exaggeration and very smooth in
terms of intensity changes. Recently efforts are growing towards automatic
analysis of spontaneous expressions but research needs to be done to recognize
wide array of spontaneous expressions. Few existing spontaneous expression
recognition algorithms are able to differentiate spontaneous from posed
expressions i.e. identification of fake smile [CS04] and identification of fake pain
expression [LBL07].
To test the performance of the proposed framework on spontaneous facial
expressions we used 392 video segments from part IV and V of the MMI facial
expression database [VP10]. Part IV and V of the database contains induced
spontaneous expressions (deliberately evoked in subjects by outside perceived
stimuli such as watching dramas or reading jokes) recorded from 25 participants
aged between 20 and 32 years in two different settings (see Figure 6.7 for
example). Due to ethical concerns the database contains only the video recording
of the expressions of happiness, surprise and disgust [VP10]. Table 6.10 shows
the obtained results for the the experiment.
Figure 6.7: Examples frames from MMI-Facial Expression Database. The firstrow is taken from Part V of the database and shows expressions of happiness anddisgust. The second row shows expressions of happiness and disgust taken fromPart IV of the database. The third row shows four frames of a single sequence inwhich the participant showed an expression of disgust [VP10].
123

Pain recognition Recognizing expressions by analyzing texture
The experiment was again carried out on the frames which covers the status
of onset to apex of the expression, as done in the first two experiments. Salient
facial regions were obtained automatically by using Viola-Jones object detection
algorithm [VJ01] and were processed to obtain proposed PLBP features. As done
in other two experiments we created image pyramid up to level 1, so in turn
got five sub-regions from one facial region i.e. mouth region. LBP u28,2 operator
was employed to extract features from every sub-region making 295 dimensional
feature vector (59 dimensions / sub-region, see Section 6.2 for the dimensionality
calculation).
Two-fold Ten-foldSVM 90.2 912-nearest neighbor 91 91.4Random forest 88.3 90.3C4.5 decision tree 81.7 88
Table 6.10: Average recognition performance(%) for spontaneous expressions
Algorithm of Park et al.[PK08] for spontaneous expression recognition
achieved results for three expressions in the range of 56% to 88% for four
different configurations which is less than recognition rate of our proposed
algorithm, although results cannot be compared directly as they used different
database.
6.4 Pain recognition
Most of the models for facial expressions recognition [LBF+06, ZP07, ZJ05, PP06,
VPP05, KMKB12b] function only for six universal facial expressions. There exist
very few computational models that can recognize very subtle facial expressions
i.e. pain [LBL07, LCM+11, ALC+09] and fatigue [ZZ06, FYS07].
Pain monitoring of patients (in a clinical scenario) is a very complicated,
subjective but as well as very important task. Usually pain is self reported and
according to Hadjistavropoulos et al. [HCL04] it (self report) has many
limitations. Thus, it is desirable to design such a system that can automate this
task. Generally, manual monitoring of pain has following problems. First, pain
124

Recognizing expressions by analyzing texture Pain recognition
cannot be recorded continuously. Second, the problem of subjectivity i.e.
different patients have different perception of pain and can under report or over
report the pain. Lastly, the person recording the pain has to make judgment of
pain level, which could vary from person to person (again subjectivity problem).
An automatic computer vision system can solve all of the above mentioned
problems.
6.4.1 Novelty of proposed approach
In this thesis we are proposing a framework that can recognize pain by analyzing
face. This work can be considered as the first of its kind, as the previous algorithms
that recognize pain [CB94, LCM+11, ALC+09] utilize facial action coding system
(FACS) [EF78] or employ some kind of face registration, cropping or alignment
[MR08, MR06, CLTA12] as a preprocessing. Our proposed framework is neither
based on FACS nor it requires face alignment.
FACS describes the facial expressions in terms of 46 component movements or
action units (AUs), which roughly correspond to the individual facial muscle
movements. The problem with using FACS is the time required to code every
frame of the video. FACS was envisioned for manual coding by FACS human
experts. It takes over 100 hours of training to become proficient in FACS, and it
takes approximately 2 hours for human experts to code each minute of video
[LBL07]. Second limitation of existing algorithms for pain detection
[LBL07, LCM+11, ALC+09] is the problem of face registration. The algorithms
proposed in [LCM+11, ALC+09] are based on Active Appearance Models
(AAMs) [CEJ98] and it is known that AAM fails to register face when either the
initial shape estimate of face is too far off and /or the appearance model fails to
direct search toward a good match. Another limitation of AAMs is the
computational complexity associated with the training phase [LBHW07]. Our
proposed algorithm rectifies these problems as it doesn’t require FACS coding
and face image to be registered.
We are proposing a model that can recognize pain by analyzing shape and
appearance information of the face. We have used shape and appearance features
for detecting pain as according to Lucey et al. [LCM+11] both shape (i.e. contour)
125

Pain recognition Recognizing expressions by analyzing texture
and appearance (i.e. texture) are important for pain detection. In our proposed
model we have extracted shape information using pyramid histogram of orientation
gradients (PHOG) [BZM07] (See Chapter 5) and appearance information using
proposed descriptor called Pyramid local binary pattern (PLBP) (discussed earlier
in Section 6.1).
6.4.2 Pain expression database
We have used UNBC-McMaster Shoulder Pain Expression Archive Database
[LCP+11] to test the performance of the proposed model as done in
[LCM+11, ALC+09]. For details on UNBC-McMaster Shoulder Pain Expression
Archive Database see Appendix Section A.8.
All frames in the distribution are FACS coded and the PSPI (Prkachin and
Solomon Pain Intensity Scale) pain score [Prk92, PS08] is also provided for every
frame. PSPI defines pain with the help of FACS action units. According to PSPI
pain is the sum of intensities of action units related to eye brow lowering, cheek
raiser, nose wrinkles, lip raiser and eye closure. We used PSPI score to divide the
database in two parts. First part contained frames with pain score of 0 (no pain),
while the other part contained frames that show patients with pain (PSPI > 0).
In this way 40,029 frames were categorized in first part (82.7%) and 8,369 frames
were categorized in second part (17.3%).
6.4.3 Framework
As mentioned earlier, we extracted shape and appearance features from the face as
according to Lucey et al. [LCM+11] both shape (i.e. contour) and appearance (i.e.
texture) are important for detecting pain. In our proposed framework 1 for pain
detection, we extracted shape information using pyramid histogram of orientation
gradients (PHOG) [BZM07]. For extracting appearance information we are using
proposed descriptor called Pyramid local binary pattern (PLBP) (discussed in
Section 6.1).
1video showing the result of proposed framework is available at: http://www.youtube.com/
watch?v=O_AIde58ZEo
126

Recognizing expressions by analyzing texture Pain recognition
Figure 6.8: Overview of the framework.
The schematic overview of the proposed framework is illustrated in Figure 6.8
and its steps are discussed below.
1. The first step of the framework is to detect the face from the input image
sequence. The framework uses Viola-Jones object detection algorithm [VJ01]
to detect/track face in the video.
2. Then, the framework divides the detected face image into two equal parts.
The upper face part contain regions of eyes and wrinkles on the upper
portion of nose, while the lower part contains the regions of mouth and
lower portion of the nose (see Figure 6.8 for illustration). This is done as
according to Ashraf et al. [ALC+09], regions around the eyes, eyebrows,
and lips contribute significantly towards pain vs. no pain detection and
these regions can be roughly localized by dividing the face image into two
parts. The purpose of dividing the face image into two is to give equal
importance to the upper and lower portion of the face. Thus, the extracted
features will contain localized as well as holistic information of the face as
127

Pain recognition Recognizing expressions by analyzing texture
the final feature vector is the concatenation of features from different
regions and different pyramid levels.
3. Afterwards, the framework extracts PHOG and PLBP features from the
upper and lower face portions and concatenates them to make the final
feature vector. In Figure 6.8 the upper face portion is annotated as “eyes”,
while the lower face portion is annotated as “mouth”.
4. Then, the concatenated feature vector is fed to the classifier for the final
classification of the sequence.
6.4.4 Experiment
The performance of the framework was evaluated for four different classifiers
(mentioned below) and up to three pyramid levels (for PHOG and PLBP).
1. “Support Vector Machine (SVM)” with χ2 kernel
2. C4.5 Decision Tree (DT) with reduced-error pruning
3. Random Forest (RF) of 10 trees
4. 2 Nearest Neighbor (2 NN) based on Euclidean distance
The framework is evaluated on the complete database [LCP+11] (40,029 frames
for no-pain examples and 8,369 frames for pain exmaples). The obtained results
are presented in Figure 6.9 and Table 6.11. These values are calculated using 10 -
fold cross validation. The data presented in the figure not only shows the result for
the proposed framework (last column in all four graphs, annotated as “combined”)
but also shows the result if PLBP or PHOG descriptors are used separately (with
the same framework as discussed in Section 6.4.3, the only difference will occur in
step 3 of the framework, where instead of extracting both the features only one
feature will be extracted). The result proves that the recognition accuracy of the
proposed framework for pain detection (i.e pain vs no pain) increases by combining
two features. The results of proposed framework are tabulated in Table 6.11.
One of the most interesting aspects of our approach is that it gives excellent
results for a simple 2 NN classifier which is a non-parametric method. This
128

Recognizing expressions by analyzing texture Pain recognition
Figure 6.9: Results obtained with the proposed framework. Results are presentedfor four different classifiers, with the first row showing results for “SVM” and“2 NN” while the second row showing results for “decision tree” and “randomforest”.
points to the fact that framework do not need computationally expensive
methods such as SVM, Random forests or decision trees to obtain good results.
In general, the proposed framework achieved high expression recognition
accuracies irrespective of the classifiers, proves the descriptive strength of the
features. For comparison and reporting results (reference Table 6.12), we have
used the classification results obtained by the SVM as it is the most cited
method for classification in the literature.
Figure 6.10 shows the influence of the size of the training set on the
performance of the four classifiers used in the experiment. For all the classifiers
we have computed the average recognition accuracy using different number of
folds (k ’s) for the k -fold cross validation technique and plotted them in the
129

Pain recognition Recognizing expressions by analyzing texture
Pyramid LevelLevel 0 Level 1 Level 2
SVM 90.7 96.1 96.42NN 96.1 96.9 96.9Decision tree 87.3 87.5 90.2Random Forest 92.7 92 95.9
Table 6.11: Proposed framework recognition rate (%) for three pyramid levels.
Figure 6.10: Evolution of the achieved average recognition accuracy for theexpression of pain with the increasing number of folds for the k -fold cross validationtechnique.
Figure 6.10. Figure 6.10 also shows the supremacy of 2NN classifier in terms of
achieved recognition rate. It is also observable from the figure that 2NN classifier
achieved highest recognition rate among the four classifiers even with relatively
130

Recognizing expressions by analyzing texture Pain recognition
small training set (i.e. 2-folds). This indicates how well our novel feature space
was clustered.
Method Database used Recognition rate (%)[LCM+11] UNBC-McMaster[LCP+11] 84.7[ALC+09] UNBC-McMaster[LCP+11] 81.2[MR08] UnKnown 93[MR06] UnKnown 92.08[CLTA12] UNBC-McMaster [LCP+11] 89.1Ours UNBC-McMaster [LCP+11] 96.4
Table 6.12: Result comparison with the state-of-the-art methods for painrecognition
Another significant contribution of the proposed framework is the
computational simplicity. State-of-the-art algorithms [LCM+11, ALC+09]
achieves hit rate of 84.7% and 81.2 % respectively by using ∼ 27,000 dimensional
feature vector. While the proposed framework is able to produce results better
than state-of-the-art algorithms (see Table 6.12) and it utilizes relatively
significantly smaller feature vector (in terms of dimensions). Feature vector
dimensionality for different pyramid levels are presented in Table 6.13. Table
6.12 shows the comparison of the achieved average recognition rate of the
proposed framework with the state-of-the-art methods for pain recognition.
PHOG [BZM07] PLBP Combined(proposed descriptor)
Level 0 16 118 134Level 1 80 590 670Level 2 336 2468 2814
Table 6.13: Feature vector dimensionality for different descriptors. Valuespresented here are obtained after concatenation of histograms for upper and lowerface images.
With the proposed framework high recognition accuracy, reduction in feature
vector dimensionality and reduction in computational time for feature extraction
is achieved. Our proposed framework for pain recognition can be used for real-
time applications since its unoptimized Matlab implementation run at 8 frames /
131

Conclusion Recognizing expressions by analyzing texture
second (on windows 7 machine, with i7-2760QM processor and 6 GB RAM) which
is enough as facial expression does not change abruptly.
6.5 Conclusion
In this chapter we presented novel descriptor (PLBP) and framework for
automatic and reliable facial expression recognition. Framework is based on
initial study of human vision (see Chapter 3) and works adequately on posed as
well as on spontaneous expressions (Novel framework published in “Pattern
Recognition Letters” [KMKB13a]). Key conclusions drawn from the study are:
1. Facial expressions can be analyzed automatically by adopting human visual
system phenomenon i.e. extracting features only from the salient facial
regions.
2. Features extracted using proposed pyramidal local binary pattern (PLBP)
operator have strong discriminative ability as the recognition result for six
basic expressions is not effected by the choice of classifier.
3. Proposed framework is robust for low resolution images, spontaneous
expressions and generalizes well on unseen data.
4. Proposed framework can be used for real-time applications since its
unoptimized Matlab implementation runs at 30 frames/second on Windows
64 bit machine with i7 processor running at 2.4 GHz having 6GB of RAM.
In the last part of chapter, we presented framework for automatic recognition
of “pain” (Framework for pain detection published in “IEEE International
Conference on Multimedia and Expo” [KMKB13b]). We extended and tweaked
previously proposed two frameworks (i.e. first based on PHOG and second based
on PLBP features) for facial expression recognition in order to recognize very
subtle expression of pain. This work can be considered as the first of its kind, as
the previous algorithms that recognize pain utilize facial action coding system
(FACS) or employ some kind of face registration, cropping or alignment as a
preprocessing. Our proposed framework is neither based on FACS nor it requires
face alignment.
132

Chapter 7
Conclusion and perspectives
Contents7.1 Contributions . . . . . . . . . . . . . . . . . . . . . . . . . 133
7.1.1 Exploring human visual system . . . . . . . . . . . . . . 134
7.1.2 Descriptor for low resolution stimuli . . . . . . . . . . . 136
7.1.3 Novel framework for pain recognition . . . . . . . . . . . 137
7.2 Perspectives . . . . . . . . . . . . . . . . . . . . . . . . . . 137
7.1 Contributions
In the beginning of this report, challenges faced by computer vision community
for recognizing facial expressions automatically are mentioned (refer Section 1.2.1).
These challenges include computational complexity, inadequacy for uncontrolled
environment i.e. low resolution images, recognition of subtle and micro expressions.
In this research work we have proposed different frameworks for facial
expression recognition to overcome some of the mentioned challenges. All of
proposed frameworks are inspired from human visual system, thus extracts
features only from perceptual salient regions (refer Section 7.1.1). To understand
human visual system, we have conducted psycho-visual experimental study with
the help of an eye-tracking system. Results deduced from the experiment serves
as the basis to determine salient facial regions which are algorithmically
133

Contributions Conclusion and perspectives
processed to extract features for automatic analysis of expressions. Summary of
results obtained by proposed frameworks on different databases is presented in
Table 7.1 and are also summarized in this conclusion.
Reference Features Database RecognitionChapter Rate (%)Chapter 4 Brightness CK+, universal expressions 71.2
and entropy (Refer Appendix A.1)Chapter 4 Brightness FEED, universal expressions 65.7
and entropy (Refer Appendix A.3)Chapter 5 PHOG CK+, universal expressions 95.3Chapter 5 PHOG FEED, universal expressions 90.3Chapter 6 PLBP CK+, universal expressions 96.7Chapter 6 PLBP FEED, universal expressions 92.3Chapter 6 PLBP MMI, spontaneous Expressions 91
(Refer Appendix A.2)Chapter 6 PHOG Pain Expression Database 96.4
and PLBP (Refer Appendix A.8)
Table 7.1: Summary of results obtained by different novel frameworks proposed inthis research work.
7.1.1 Exploring human visual system
In the literature survey (for reference see Chapter 2) different methods for
automatic facial expression recognition are mentioned. To analyze face in order
to get discriminative information, most of these methods extract features based
on some mathematical or geometrical heuristic. It is demonstrated in this
research work that the task of expression analysis and recognition could be done
in more conducive manner by understanding human visual system.
One of the most acceptable theory for answering the question of how human
visual system analyzes stimuli in real time is by considering “salient regions”
[Zha06]. According to oxford dictionary “salient” means most noticeable or most
important. Then, saliency in stimuli refers to the most noticeable part or region
of a scene. By focusing only on salient regions, allow only a small part of
incoming sensory information to reach short term memory thus understanding a
134

Conclusion and perspectives Contributions
complex scene is a series of computationally less demanding, local visual analysis
problem.
Thus, we begin this research work by conducting a psycho-visual
experimental study to find out which facial regions are perceptually salient. We
have considered six universal facial expressions for psycho-visual experimental
study as these expressions are proved to be consistent across cultures. These six
expressions are anger, disgust, fear, happiness, sadness and surprise [Ekm71]. To
find out which facial region is salient for different expressions eye movements of
15 subjects were recorded with an eye-tracker (Eyelink II system from SR
Research, Canada) in free viewing conditions as they watch a collection of 54
videos selected from Cohn-Kanade (CK) facial expression database (Refer
Appendix Section A.1). Experimental study helped in understanding visual
attention and provided insight into which facial region(s) emerges as the salient
according for the six universal facial expressions (See Chapter 3 for details).
Results deduced from the study were then as the basis for the frameworks
proposed during the course of this research work. Following are the main
advantages gained by understanding and utilizing human visual attention.
1. We have validated the classical results (on visual attention) from the domain
of human psychology, cognition and perception by a novel approach which
incorporates eye-tracker in the experimental methodology protocol. At the
same time results have been extended to include all the six universal facial
expressions which was not the case in the classical studies.
2. It is demonstrated that highly discriminative feature space is created by
extracting features only from the perceptually salient facial regions. Thus,
human visual system inspired frameworks achieved high facial expression
recognition (FER) accuracy (see result section of Chapter 5 and 6).
3. As the algorithms are based on human vision they extract features only from
the salient facial region. Thus reducing feature vector dimensions and feature
extraction computation time. This makes proposed algorithms suitable for
real-time applications.
135

Contributions Conclusion and perspectives
7.1.2 Descriptor for low resolution stimuli
We have proposed novel descriptor for facial features analysis, “Pyramid of Local
Binary Pattern” (PLBP) that works adequately on high as well as low resolution
stimuli. PLBP is a spatial representation of local binary pattern (LBP) and it
represents stimuli by its local texture (LBP) and the spatial layout of the
texture. The spatial layout is acquired by tiling the image into regions at
multiple resolutions. If only the coarsest level is used, then the descriptor reduces
to a global LBP histogram. Comparing to the multi-resolution LBP of Ojala et
al. [OPM02] our descriptor selects samples in a more uniformly distributed
manner, whereas Ojalas LBP takes samples centered around a point leading to
missing some information in the case of face (which is different than a repetitive
texture). Based on PLBP descriptor we have proposed framework for facial
expression recognition. Framework achieved results similar or better than
state-of-the-art methods for high as well as low resolution stimuli (for reference
see Chapter 6).
Table 7.2 reports and compares the recognition results of our proposed
framework (refer Chapter 5 and Chapter 6) with the state-of-the-art methods on
four different low facial resolution images. Reported results of our proposed
methods are obtained using support vector machine.
PHOG [KMKB12b] 95.3 90.3 81 75 71.2Gabor [Tia04] 91.7 92.2 91.6 77.6 68.2
Gabor [SGM09] 89.8 89.8 89.2 83 75.1LBP [SGM09] 92.6 92.6 89.9 84.3 76.9
PHOG: Chapter 5 95.3 90.3 81 75 71.2PLBP: Chapter 6 96.7 95.3 93.9 92.8 90.5
Table 7.2: Average recognition accuracy (%) for six universal expressions on fivedifferent facial image resolutions. First column corresponds to original resolution.
136

Conclusion and perspectives Perspectives
7.1.3 Novel framework for pain recognition
Most of the models for facial expressions recognition work only for six universal
facial expressions. There exist very few computational models that can recognize
very subtle facial expressions i.e. fatigue or pain. Pain monitoring of patients (in a
clinical scenario) is a very complicated but as well as very important task. Usually
pain is self reported, thus carry lot of subjectivity. It could be very beneficial for
medical practitioners to have a system that can assist them in pain monitoring
of patients. Thus, it is desirable to design such a system that can recognize pain
automatically.
We have proposed model that can recognize pain by analyzing shape and
appearance information of the face. We have used shape and appearance features
for detecting pain as according to Lucey et al. [LCM+11] both shape (i.e.
contour) and appearance (i.e. texture) are important for pain detection. In our
proposed model we have extracted shape information using pyramid histogram of
orientation gradients (PHOG) and appearance information using proposed
descriptor called Pyramid local binary pattern (PLBP). This work can be
considered as the first of its kind, as the previous algorithms that recognize pain
utilize facial action coding system (FACS) [EF78] or employ some kind of face
registration, cropping or alignment as a preprocessing. Our proposed framework
is neither based on FACS nor it requires face alignment. We have tested our
proposed model on UNBC-McMaster Shoulder Pain Expression Archive
Database and achieved encouraging results (for reference see Section 6.4.4 and
Table 7.1).
7.2 Perspectives
In future, we plan to investigate the effect of occlusion as this parameter could
significantly impact the performance of the framework for real world
applications. Secondly, the notion of movement could improve the performance
of the proposed framework for real world applications as the experimental study
conducted by Bassili [Bas79] suggested that dynamic information is important
for facial expression recognition. Another parameter that needs to be
137

Perspectives Conclusion and perspectives
investigated is the variations of camera angle as for many applications frontal
facial pose is difficult to record. Lastly, in future we would also like to evaluate
the proposed framework on streaming media artifacts i.e. ringing, contouring,
posterization,etc.
Figure 7.1: The valence-arousal (V-A) space for emotion analysis. Illustrationfrom [HTKW13].
In a larger context, computer vision community is moving from categorical
(fix or predefined number of expressions) to continuous/dimensional approach in
recognizing facial expressions i.e. continuous affect analysis. Continuous affect
analysis refers to continuous analysis as well as analysis that uses affect
phenomenon represented in dimensional space (e.g. valence-arousal space). In
continuous affect analysis expressions are considered as regions falling in a 2D
space e.g. valence and arousal (i.e., V-A space) [GS13, HTKW13], as illustrated
in Figure 7.1. Arousal refers to the overall level of physiological arousal and
valence refers to the state of pleasure, ranging from negative to positive. For
more discussion, refer to Section 2.1.4 which presents Russell’s circumplex model
that advocates affective states are not discrete rather maps them to continuous
138

Conclusion and perspectives Perspectives
space having dimensions of valence and arousal. To develop a system that can
perform continuous affect analysis, number of challenges are required to be
tackled [GS13].
1. How to process continuous input. In continuous input no information about
starting and ending time of affective events, expressions and affective states
is available. In non-continuous input data is usually flagged with the onset,
offset and apex of expression.
2. Modalities and cues. Humans express affect and emotions through different
modalities i.e. vocal signals, visual signals and bio signals. It is difficult to
quantify the importance of different modalities and cues, which is essential
for the continuous, fast and efficient affect analysis.
3. Database. It is difficult to create affective database for continuous analysis as
it is hard to engage human subjects for a longer duration of time. Secondly,
responsiveness of subjects decreases with time.
4. Performance evaluation. Categorical affect recognition methods use different
metrics to evaulte their performance e.g. F1 measure, average recognition
accuracy (also used in this research work), area under the ROC curve etc.
Finding an optimal evaluation metrics for dimensional and continuous affect
prediction remains an open research issue [GP10].
5. Miscellaneous. Other problems include feature extraction, finding an optimal
set of features, creating prediction methods that can handle continuous input,
and training automatic predictors that can generalize well.
Another interesting problem that is catching the attention of computer vision
community is to recognize facial micro expressions. Facial micro-expressions are
rapid involuntary facial expressions which reveal suppressed affect. These are
very rapid (1/3 to 1/25 second) involuntary facial expressions which give a brief
glimpse to feelings that people undergo but try not to express [PLZP11]. The
major challenges in recognising micro expressions involve their very short duration,
involuntariness and lack of training and benchmarking database.
139

Perspectives Conclusion and perspectives
140

Appendix A
Facial expression databases
Contents
A.1 Cohn-Kanade facial expression database . . . . . . . . 142
A.2 MMI facial expression database . . . . . . . . . . . . . . 143
A.3 FG-NET Facial Expressions and Emotion Database . . 147
A.4 Japanese Female Facial Expression Database . . . . . . 147
A.5 AR database . . . . . . . . . . . . . . . . . . . . . . . . . 149
A.6 CAS-PEAL Database . . . . . . . . . . . . . . . . . . . . 150
A.7 Radboud Faces Databases (RaFD) . . . . . . . . . . . . 152
A.8 Pain Expression Database . . . . . . . . . . . . . . . . . 153
A.9 Drawbacks of the current databases . . . . . . . . . . . 155
One of the most important aspects of developing any new facial expression
recognition or detection system is the choice of the database that will be used for
testing the new system. If a common database is used by all the researchers,
then testing the new system, comparing it with the other state of the art systems
and benchmarking the performance becomes a very easy and straightforward job.
141

Cohn-Kanade facial expression database Facial expression databases
However, building such a common database that can satisfy the various
requirements of the problem domain and become a standard for future research
is a difficult and challenging task.
Let us now look at some of the popular expression databases that are publicly
and freely available. There are many databases available and covering all of them
will not be possible. Thus, I will be covering only those databases that have mostly
been used in the past few years.
A.1 Cohn-Kanade facial expression database
Cohn-Kanade(CK) database also known as the CMU-Pittsburg AU coded database
[KCT00]. This is a fairly extensive database and has been widely used by the face
expression recognition community.
Subjects: The database contains 97 university students enrolled in introductory
psychology classes. They ranged in age from 18 to 30 years. 65% were female,
15% were African-American, and 3% were Asian or Latino.
Samples: The observation room was equipped with a chair for the subject and
two Panasonic WV3230 cameras, each connected to a Panasonic S-VHS AG-7500
video recorder with a Horita synchronized time-code generator. One of the cameras
was located directly in front of the subject, and the other was positioned 300 to the
right of the subject. Only image data from the frontal camera was available in this
database. Subjects were instructed by an experimenter to perform a series of 23
facial displays that included single action units (e.g., AU 12, or lip corners pulled
obliquely) and combinations of action units (e.g., AU1+2, or inner and outer brows
raised). Before performing each display, an experimenter described and modelled
the desired display. Six of the displays were based on descriptions of prototypic
basic emotions (i.e., joy, surprise, anger, fear, disgust, and sadness). See Figure
A.1 for the sample face expression images from the CohnKanade database.
Later, CK database was extended to extended Cohn-Kanade (CK+) database
[LCK+10]. CK+ database contains 593 sequences across 123 subjects which are
FACS [EF78] coded at the peak frame. Out of 593 sequences only 327 sequences
have emotion labels. This is because these are the only ones that fit the prototypic
142

Facial expression databases MMI facial expression database
definition. Database consists of subjects aged from 18 to 50 years old, of which
69% were female, 81% Euro-American, 13% Afro-American and 6% others. Each
video (without sound) showed a neutral face at the beginning and then gradually
developed into one of the six facial expression
Figure A.1: Example of Cohn- Kanade Facial Expression Database.
Salient features:
a. Image sequences considered instead of mug shots.
b. Evaluation performed based on Action Unit recognition.
A.2 MMI facial expression database
The developers of MMI facial expression database are from the Man-Machine
Interaction group of Delft University of Technology, Netherlands. This was the first
web-based facial expression database [PVRM05]. The basic criteria defined for this
database include easy accessibility, extensibility, manageability, user-friendliness,
with online help files and various search criteria. The database contains both still
143

MMI facial expression database Facial expression databases
as well as video streams depicting the six basic expressions: happiness, anger,
sadness, disgust, fear and surprise (see Figure A.2). It contains more than 3000
samples of both static images and image sequences of faces in frontal and in profile
view displaying various facial expressions of emotion, single AU activation, and
multiple AU activation.
Figure A.2: Example of MMI Facial Expression Database.
Figure A.3: Examples of static frontal-view images of facial expressions in theMMI Facial Expression Database.
144

Facial expression databases MMI facial expression database
Figure A.4: Examples of apex frames of dual-view image sequences in MMI FacialExpression Database.
The properties of the database can be summarised in the following way:
Sensing: The static facial-expression images are all true colour (24-bit) images
which, when digitised, measure 720 x 576 pixels. There are approximately 600
frontal and 140 dual-view static facial-expression images (see Figure A.3). Dual-
view images combine frontal and profile view of the face, recorded using a mirror.
All video sequences have been recorded at a rate of 25 frames per second using
a standard PAL camera. There are approximately 335 frontal-view, 30 profile-
view, and 2000 dual-view facialexpression video sequences (see Figure A.4). The
sequences are of variable length, lasting between 40 and 520 frames, picturing
neutral-expressive-neutral facial behaviour patterns.
Subjects: Database includes 69 different faces of students and research staff
members of both sexes (44% female), ranging in age from 19 to 62, having either
a European, African, Asian, Carribean or South American ethnic background.
Samples: The database consists of four major parts: one part of posed
expression still images, one part of posed expression videos and two parts of
spontaneous expression videos. For the posed expressions the subjects were asked
to display 79 series of expressions that included either a single AU (e.g., AU2) or
a combination of a minimal number of AUs (e.g., AU8 cannot be displayed
without AU25) or a prototypic combination of AUs (such as in expressions of
emotion). The subjects were instructed by an expert (a FACS coder) on how to
display the required facial expressions.
For the posed videos, the subjects were asked to include a short neutral state
at the beginning and at the end of each expression. They were asked to display
the required expressions while minimising out-of-plane head motions. The posed
145

MMI facial expression database Facial expression databases
expression videos were recorded using a mirror placed on a table next to the subject
at a 45 degrees angle so that the subjects profile face was recorded together with
the frontal view. The still images were recorded using natural lighting and variable
backgrounds (e.g., Figure A.3). The posed expression videos were recorded with
a blue screen background and two high-intensity lamps with reflective umbrellas
(e.g., Figure A.4).
The first part of the spontaneous expression videos was recorded in a living
room environment with no professional lighting added. The subjects were shown
both funny and disgusting clips on a PC. Their reaction to the clips was recorded
and cut into separate neutral-expressive-neutral videos. The expressions recorded
were mainly happiness and disgust, with a fair number of surprise expressions
captured as well. The second part of the spontaneous data consists of 11 primary
school children who were recorded by a television crew of the Dutch tv program
Klokhuis. They were asked to laugh on command. There was also a comedian
present who made jokes during the recording, which made the children laugh.
These spontaneous expressions were again cut into videos that contain neutral-
expressive-neutral sequences. This set of data contains severe head pose variations,
as the children were free to move and thought they weren’t being recorded at the
time.
During this research work we have used part IV and V of MMI facial expression
database [VP10] to test the perfomance of our proposed framework. Part IV and
V of the database contains spontaneous/naturalistic expressions recorded from 25
participants aged between 20 and 32 years. Of these, 12 were female and 13 male.
Of the female participants, three were European, one was South American, and
eight were Asian. Of the men, seven were European, two were South American
and four were of Asian background. Part IV of the database has been annotated
for the six basic emotions and facial muscle actions. Part V of the database has
been annotated for voiced and unvoiced laughters.
Salient features:
a. First web-based facial expression database.
b. Includes both still images and image sequences.
146

Facial expression databases FG-NET Facial Expressions and Emotion Database
A.3 FG-NET Facial Expressions and Emotion
Database
The FG-NET Facial Expressions and Emotion Database (FG-NET FEED) from
the Technical University Munich is an image database containing face images
showing a number of subjects performing the six different basic emotions (see
Figure A.5) defined by Ekman et al. [Ekm71]. The database has been developed
in an attempt to assist researchers who investigate the effects of different facial
expressions [Wal06]. The database has been generated as part of the European
Union project FG-NET (Face and Gesture Recognition Research Network).
Subjects: The database contains material gathered from 18 different
individuals so far. It is intended to expand this gallery in the future. Each
individual performed all six desired actions three times. Additionally three
sequences doing no expressions at all are recorded. Alltogether this gives an
amount of 399 sequences. Depending on the kind of emotion, a single recorded
sequence can take up to several seconds.
Samples: The images were acquired using a Sony XC-999P camera equipped
with a 8mm COSMICAR 1:1.4 television lens. A BTTV 878 framegrabber card
was used to grab the images with a size of 640x480 pixels, a colour depth of 24
bits and a framerate of 25 frames per second. Due to capacity reasons, the images
where converted into 8 Bit JPEG-compressed images with a size of 320x240.
Salient features:
a. The expressions on the faces are considered as natural as possible.
A.4 Japanese Female Facial Expression
Database
Subjects: Ten female subjects posed for the six basic expressions: happiness,
sadness, anger, disgust, fear and surprise, and the neutral face (see Figure A.6 ).
147

Japanese Female Facial Expression Database Facial expression databases
Figure A.5: Image captures from the video sequences of the six universalexpressions from the FG-NET FEED.
Each of the subjects posed with three to four examples per expression to make a
total of 219 images [LSKG98].
Samples: The still images were captured in a controlled environment. The
semantic ratings of the expressions were performed from psychological experiments
averaged over 60 Japanese female subjects as ground truth. According to Michael
J Lyons, any expression is never a pure expression but a mixture of different
emotions. So, a 5 level scale was used for each of the expression images (5 for
high and 1 for low). Two such ratings were given, one with fear expression images
and the other without fear expression images. The expression images are labeled
as per the predominant expression in that image. Considerably low resolution
images used 256 x 256 with the number of subjects just equal to ten (smallest in
comparison with other databases).
Salient features:
a. It is the only facial expression database that uses the minimum number of
subjects.
b. Manual rating used to identify facial expressions.
148
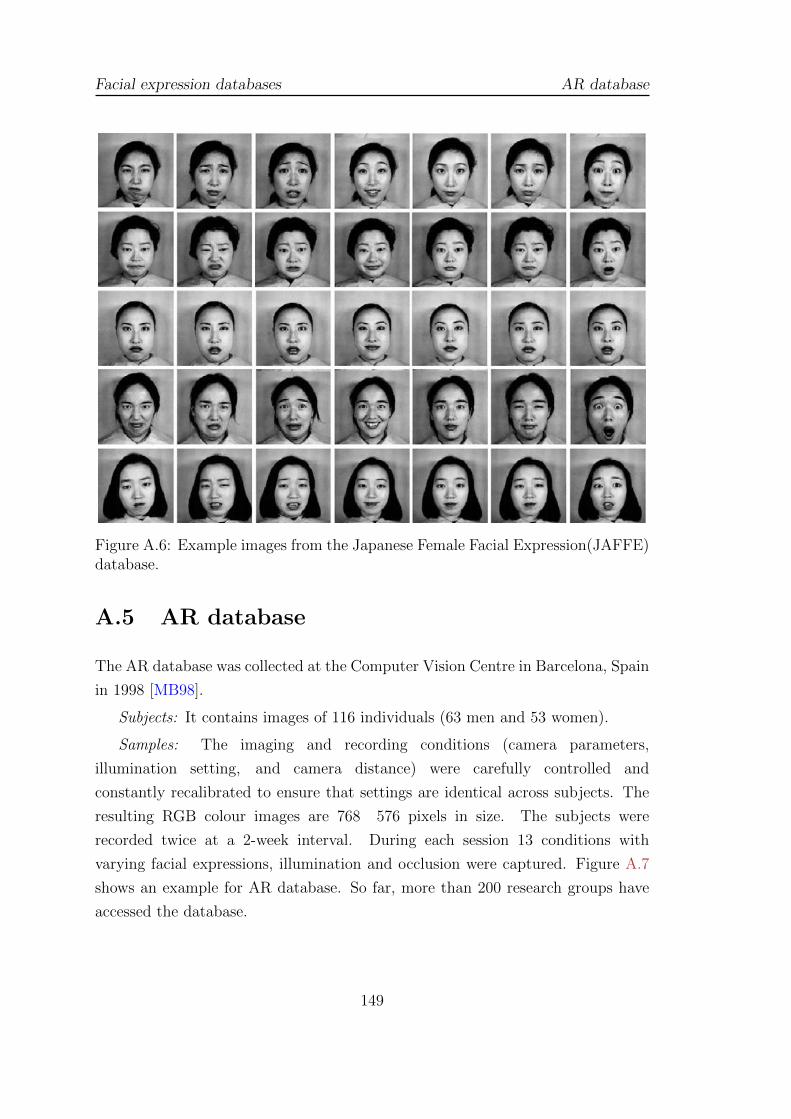
Facial expression databases AR database
Figure A.6: Example images from the Japanese Female Facial Expression(JAFFE)database.
A.5 AR database
The AR database was collected at the Computer Vision Centre in Barcelona, Spain
in 1998 [MB98].
Subjects: It contains images of 116 individuals (63 men and 53 women).
Samples: The imaging and recording conditions (camera parameters,
illumination setting, and camera distance) were carefully controlled and
constantly recalibrated to ensure that settings are identical across subjects. The
resulting RGB colour images are 768 576 pixels in size. The subjects were
recorded twice at a 2-week interval. During each session 13 conditions with
varying facial expressions, illumination and occlusion were captured. Figure A.7
shows an example for AR database. So far, more than 200 research groups have
accessed the database.
149

CAS-PEAL Database Facial expression databases
Figure A.7: AR database. The conditions are (1) neutral, (2) smile, (3) anger, (4)scream, (5) left light on, (6) right light on, (7) both lights on, (8) sun glasses, (9)sun glasses/left light (10) sun glasses/right light, (11) scarf, (12) scarf/left light,(13) scarf/right light.
Salient features:
a. First ever facial expression database to consider occlusions in face images.
b. Inclusion of scream, a non-prototypic gesture, in the database.
c. To enable testing and modelling using this database, 22 facial feature points
are manually labelled on each face.
A.6 CAS-PEAL Database
The CAS-PEAL (pose, expression, accessory, lighting) Chinese face database was
collected at the Chinese Academy of Sciences (CAS) between August 2002 and
April 2003 [GCS+04].
Subjects: It contains images of 66 to 1040 subjects (595 men, 445 women) in
seven categories: pose, expression, accessory, lighting, background, distance, and
150
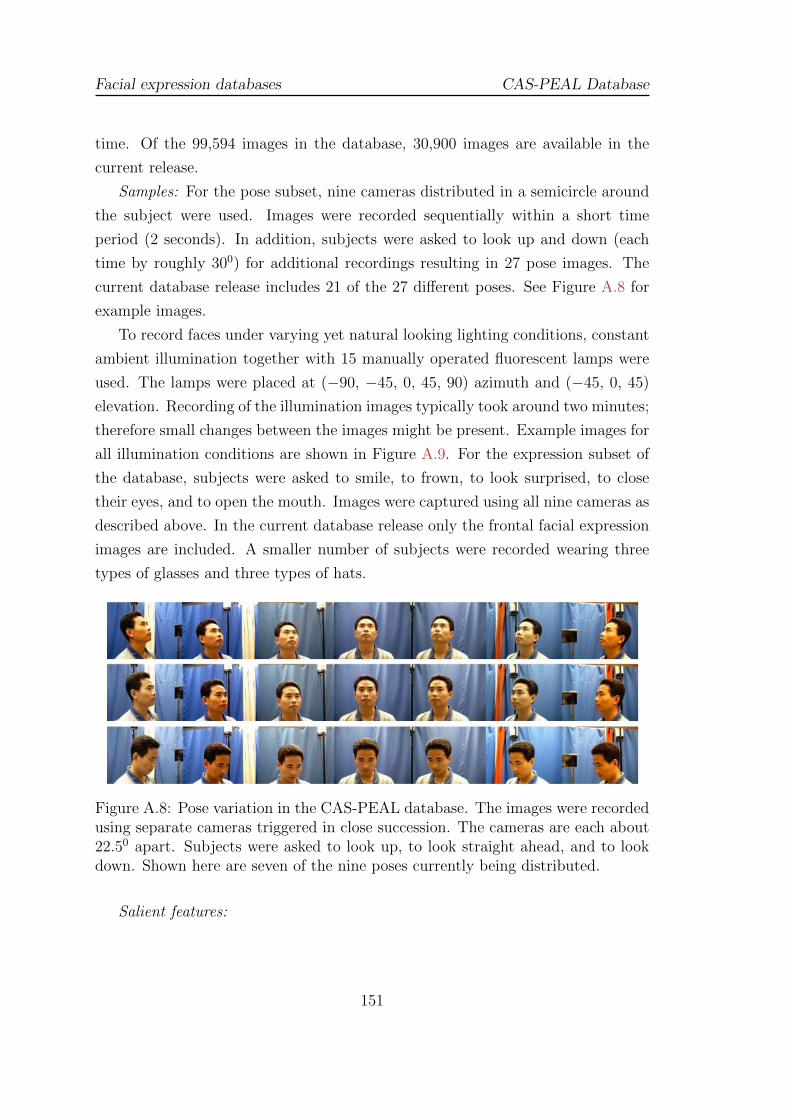
Facial expression databases CAS-PEAL Database
time. Of the 99,594 images in the database, 30,900 images are available in the
current release.
Samples: For the pose subset, nine cameras distributed in a semicircle around
the subject were used. Images were recorded sequentially within a short time
period (2 seconds). In addition, subjects were asked to look up and down (each
time by roughly 300) for additional recordings resulting in 27 pose images. The
current database release includes 21 of the 27 different poses. See Figure A.8 for
example images.
To record faces under varying yet natural looking lighting conditions, constant
ambient illumination together with 15 manually operated fluorescent lamps were
used. The lamps were placed at (−90, −45, 0, 45, 90) azimuth and (−45, 0, 45)
elevation. Recording of the illumination images typically took around two minutes;
therefore small changes between the images might be present. Example images for
all illumination conditions are shown in Figure A.9. For the expression subset of
the database, subjects were asked to smile, to frown, to look surprised, to close
their eyes, and to open the mouth. Images were captured using all nine cameras as
described above. In the current database release only the frontal facial expression
images are included. A smaller number of subjects were recorded wearing three
types of glasses and three types of hats.
Figure A.8: Pose variation in the CAS-PEAL database. The images were recordedusing separate cameras triggered in close succession. The cameras are each about22.50 apart. Subjects were asked to look up, to look straight ahead, and to lookdown. Shown here are seven of the nine poses currently being distributed.
Salient features:
151

Radboud Faces Databases (RaFD) Facial expression databases
Figure A.9: Illumination variation in the CAS-PEAL database. The images wererecorded with constant ambient illumination and manually triggered fluorescentlamps.
a. Time/age consideration during image collection.
b. Inclusion of multiple accessories in database.
c. Consideration of surprise and open mouth categories in the database.
A.7 Radboud Faces Databases (RaFD)
RaFD is a set of pictures of 67 models (including Caucasian males and females,
Caucasian children, both girls and boys, and Moroccan Dutch males) displaying
eight different emotions [LDB+10].The RaFD in an initiative of the Behavioural
Science Institute of the Radboud University Nijmegen, which is located in
Nijmegen (the Netherlands), and can be used freely for non-commercial scientific
research by researchers who work for an officially accredited university.
Subjects: 67 models were trained accordingly to the Facial Action Coding
System, each model was trained to show the following expressions: Anger, disgust,
fear, happiness, sadness, surprise, contempt, and neutral (Figure A.10 (a)). Each
152

Facial expression databases Pain Expression Database
emotion was shown with three different gaze directions and all pictures were taken
from five camera angles simultaneously (Figure A.10(b) and (c) respectively).
Figure A.10: (a) Eight emotional expressions from top left: sad, neutral, anger,contemptuous, disgust, surprise, fear and happiness, (b) Three gaze directions:left, straight and right, (c) Five camera angles at 1800, 1350, 900, 450 and 00.
Salient features:
a. Contempt, a non-prototypic expression considered.
b. Different gaze directions considered.
c. It is latest facial expression database.
A.8 Pain Expression Database
In this research work we have used “UNBC-McMaster Shoulder Pain Expression
Archive Database” [LCP+11] to test our proposed algorithm that recognizes
153

Pain Expression Database Facial expression databases
expression of pain. Researchers at the McMaster University and University of
Northern British Columbia (UNBC) captured video of patient’s faces (who were
suffering from shoulder pain) while they were performing a series of
range-of-motion tests (abduction, flexion, and internal and external rotation of
each arm separately) to their affected and unaffected limbs on two separate
occasions [LCP+11]. Frames in the distribution have a spatial resolution of 320 x
240 pixels. In the distributed database archive there are 200 sequences across 25
subjects, which totals 48,398 images. Spontaneous expression of pain from
patients is recorded using digital cameras. Figure A.11 shows an example frames
from the database. It is observable from the figure that there is a considerable
head movement that occurs during sequences as the patient experiences pain.
Figure A.11: Examples of some of the sequences from the UNBC-McMaster PainShoulder Archive
All frames in the distribution are FACS coded and the PSPI (Prkachin and
Solomon Pain Intensity Scale) pain score [Prk92, PS08] is also provided for every
frame. PSPI defines pain with the help of FACS action units. According to PSPI
pain is the sum of intensities of action units related to eye brow lowering, cheek
raiser, nose wrinkles, lip raiser and eye closure.
Salient features:
1. Temporal Spontaneous Expressions: 200 video sequences containing
spontaneous facial expressions relating to genuine pain.
154

Facial expression databases Drawbacks of the current databases
2. Manual FACS codes: 48,398 FACS coded frames,
3. Self-Report and Observer Ratings: associated pain self-report and observer
ratings at the sequence level
4. Tracked Landmarks: 66 point AAM landmarks.
A.9 Drawbacks of the current databases
Some of the problems faced by researchers with respect to the use of available
databases are:
1. Temporal patterns of the videos: Cohen et al. reported that they could
not make use of the Cohn-Kanade database to train and test a Multi-Level
HMM classifier because each video sequence ends in the peak of the facial
expression, i.e. each sequence was incomplete in terms of its temporal pattern
[CSG+03].
2. Topographic modeling: Wang and Yin reported that they note that
topographic modeling is a pixel based approach and is therefore not robust
against illumination changes. But in order to conduct illumination related
studies, they were unable to find a database that had expressive faces
against various illuminations [WY07].
3. Low resolution stimuli: As mentioned earlier there are many real world
applications that require expression recognition system to work amicably
on low resolution images. Smart meeting, video conferencing and visual
surveillance are some examples of such applications. There is no standard
database that provides low resolution stimuli. Thus in this research work
we spatially downgraded stimuli from Cohn-Kanade database to test our
proposed method.
155

Drawbacks of the current databases Facial expression databases
156

Appendix B
Gaze Maps
As mentioned in the Section 3.3.1, the most intuitively revealing output that can
be obtained from the recorded fixations data is to obtain gaze maps. During the
psycho-Visual experiment, for every frame of the video and each subject i, the eye
movement recordings yielded an eye trajectory T i composed of the coordinates of
the successive fixations fk, expressed as image coordinates (xk, yk):
T i = (f i1, f
i2, f
i3, ....) (B.1)
As a representation of the set of all fixations f ik, a human gaze map H(x) was
computed, under the assumption that this map is an integral of weighted point
spread functions h(x) located at the positions of the successive fixations. It is
assumed that each fixation gives rise to a normally (gaussian) distributed activity.
The width σ of the activity patch was chosen to approximate the size of the fovea.
Formally, H(x) is computed according to Equation B.2:
H(x) = H(x, y) =
Nsubj∑i=1
∑fk∈T i
exp((xk − x)2 + (yk − y)2
σ2) (B.2)
where (xk, yk) are the spatial coordinates of fixation fk, in image coordinates.
In all of the figures in this appendix gaze maps are presented as the heat maps
where the colored blobs / human fixations are superimposed on the frame of a
157

Gaze Maps
video to show the areas where observers gazed. The longer the gazing time, the
warmer the color is. Video showing gaze pattern of one subject for six universal
expressions is available at: http://www.youtube.com/watch?v=3pH3lXf8Ik4.
Figure B.1: Gaze maps for the expression of happiness.
158

Gaze Maps
Figure B.2: Gaze maps for the expression of surprise.
159

Gaze Maps
Figure B.3: Gaze maps for the expression of sadness.
160

Gaze Maps
Figure B.4: Gaze maps for the expression of disgust.
161

Gaze Maps
Figure B.5: Gaze maps for the expression of fear.
162

Gaze Maps
Figure B.6: Gaze maps for the expression of anger.
163

Gaze Maps
164

Appendix C
Color space conversion
Following are the equations to convert XY Z to L∗a∗b∗ color space:
L∗ = 116f(Y/Yn)− 16 (C.1)
a∗ = 500 [f(X/Xn)− f(Y/Yn)] (C.2)
b∗ = 200 [f(Y/Yn)− f(Z/Zn)] (C.3)
where
f(t) =
t1/3 if t > ( 629
)3
13
(296
)2t+ 4
29otherwise
(C.4)
Here X, Y and Z are the CIE XYZ tristimulus values, while Xn, Yn and Zn
are the CIE XYZ tristimulus values of the reference white point (the subscript n
suggests ”normalized”).
Following is the equations to convert RGB to XYZ color space:XYZ
=
2.7690 1.7518 1.1300
1.0000 4.5907 0.0601
0.0000 0.0565 5.5943
.RGB
(C.5)
165

Color space conversion
166
References
[AHES09] R. Achanta, S. Hemami, F. Estrada, and S. Susstrunk. Frequency-
tuned salient region detection. In IEEE International Conference on
Computer Vision and Pattern Recognition, 2009. xx, xxi, 72, 74, 75,
76, 78, 79, 80
[AHP04] T. Ahonen, A. Hadid, and M. Pietikainen. Face recognition with
local binary patterns. In European Conference on Computer Vision,
2004. 41, 106
[ALC+09] A.B. Ashraf, S. Lucey, J. F. Cohn, T. Chen, Z. Ambadar, K. M.
Prkachin, and P. E. Solomon. The painful face - pain expression
recognition using active appearance models. Image and Vision
Computing, 27(12):1788 – 1796, 2009. 124, 125, 126, 127, 131
[AM04] K. Anderson and P. W. McOwan. Robust real-time face tracker
for use in cluttered environments. Computer Vision and Image
Understanding, 95:184–200, 2004. 28
[AM06] K. Anderson and P. W. McOwan. A real-time automated system for
the recognition of human facial expressions. Trans. Sys. Man Cyber.
Part B, 36:96–105, 2006. 8
[AR92] N. Ambady and R. Rosenthal. Thin slices of expressive behavior
as predictors of interpersonal consequences: A metaanalysis.
Psychological Bulletin, 11(2):256–274, 1992. 2, 14
167

REFERENCES REFERENCES
[AS93] M.F. Augusteijn and T.L. Skufca. Identification of human faces
through texture-based feature recognition and neural network
technology. In IEEE International Conference on Neural Networks,
1993. 28
[AS07] S. Avidan and A. Shamir. Seam carving for content-aware image
resizing. In ACM Transactions on Graphics, volume 26, page Article
No.10, 2007. 50
[Bas79] J. N. Bassili. Emotion recognition: The role of facial movement and
the relative importance of upper and lower areas of the face. Journal
of Personality and Social Psychology, 37:2049–2058, 1979. 137
[BB06] S. Bezryadin and P. Bourov. Color coordinate system for accurate
color image editing software. In International Conference Printing
Technology, pages 145–148, 2006. xxi, 72, 81, 82
[BE75] J. D. Boucher and P. Ekman. Facial areas and emotional information.
Journal of communication, 25:21–29, 1975. 64, 67
[BGJH09] Y. Bai, L. Guo, L. Jin, and Q. Huang. A novel feature extraction
method using pyramid histogram of orientation gradients for smile
recognition. In International Conference on Image Processing, 2009.
38, 39
[BL+03] M. S. Bartlett, G. Littlewort, , I. Fasel, and J. R. Movellan. Real
time face detection and facial expression recognition: Development
and applications to human computer interaction. In Conference on
Computer Vision and Pattern Recognition Workshop, 2003., june
2003. 117
[BLB+02] M. S. Bartlett, G. Littlewort, B. Braathen, T. J. Sejnowski, and J. R.
Movellan. A prototype for automatic recognition of spontaneous
facial actions. In Advances in Neural Information Processing
Systems, 2002. 23, 122
168

REFERENCES REFERENCES
[BLF+06] M. S. Bartlett, G. C. Littlewort, M. G. Frank, C. Lainscsek, I. R.
Fasel, and J. R. Movellan. Automatic recognition of facial actions in
spontaneous expressions. Journal of Mutlimedia, pages 1–14, 2006.
23
[Bul01] P. Bull. State of the art: Nonverbal communication. Psychologist,
14:644–647, 2001. 2, 14
[Bus35] G.T. Buswell. How people look at pictures. The University of Chicago
Press, 1935. 49
[BZM07] A. Bosch, A. Zisserman, and X. Munoz. Representing shape with
a spatial pyramid kernel. In 6th ACM International Conference on
Image and Video Retrieval, pages 401–408, 2007. 90, 126, 131
[CB94] J. Cacioppo and G. Berntson. Relationship between attitudes and
evaluative space: A critical review, with emphasis on the separability
of positive and negative substrates. Psychological Bulletin, 115:401–
423, 1994. 21, 125
[CE05] J. F. Cohn and P. Ekman. Measuring facial action by manual
coding, facial emg, and automatic facial image analysis. In J. A.
Harrigan, R. Rosenthal, and K. Scherer, editors, Handbook of
nonverbal behavior research methods in the affective sciences, pages
9 – 64. Oxford University Press, NY., 2005. 15
[CEJ98] T. F Cootes, G. J. Edwards, and Taylor C. J. Active appearance
models. In European Conference on Computer Vision, 1998. 125
[CET98] T. F. Cootes, G. J. Edwards, and C. J. Taylor. Active appearance
models. In European Conference on Computer Vision, 1998. 29, 38
[CHTH94] T. F. Cootes, A. Hill, C. Taylor, and J. Haslam. The use of active
shape models for locating structures in medical images. Image and
Vision Computing, 12:355–366, 1994. 29, 38
[CIE31] CIE1931. Commission internationale de l’Eclairage proceedings
(CIE). Cambridge University Press, Cambridge., 1931. 83
169
REFERENCES REFERENCES
[CKWB05] D. W. Cunningham, M. Kleiner, C. Wallraven, and H. H. Bulthoff.
Manipulating video sequences to determine the components of
conversational facial expressions. ACM Transactions on Applied
Perception, 2:251–269, 2005. 64, 65
[CLFD94] P. Carrera-Levillain and J. Fernandez-Dols. Neutral faces in context:
Their emotional meaning and their function. Journal of Nonverbal
Behavior, 18:281–299, 1994. 2, 14
[CLTA12] J. Chen, X. Liu, P. Tu, and A. Aragones. Person-specific expression
recognition with transfer learning. In IEEE International Conference
on Image Processing (ICIP), 2012. 125, 131
[Coh00] J. B. Cohen. Visual Color and Color Mixture: The Fundamental
Color Space. University of Illinois Press, 2000. 82
[CS04] J. F. Cohn and K. L. Schmidt. The timing of facial motion in
posed and spontaneous smiles. International Journal of Wavelets,
Multiresolution an Information Processing, 2:1–12, 2004. 123
[CSE+92] H. Collewijin, M. R. Steinman, J. C. Erkelens, Z. Pizlo, and J. Steen.
The Head-Neck Sensory Motor System. Oxford University Press,
1992. 60
[CSG+03] I. Cohen, N. Sebe, A. Garg, L. S. Chen, , and T. S. Huang. Facial
expression recognition from video sequences: Temporal and static
modeling. Computer Vision and Image Understanding, 91:160–187,
2003. 155
[CZM+11] M Cheng, G. Zhang, N. J. Mitra, X. Huang, and S. Hu. Global
contrast based salient region detection. In Computer Vision and
Pattern Recognition, 2011. 87
[DAGG11] A. Dhall, A. Asthana, R. Goecke, and T. Gedeon. Emotion
recognition using PHOG and LPQ features. In IEEE Automatic Face
and Gesture Recognition Conference FG2011, Workshop on Facial
Expression Recognition and Analysis Challenge FERA, 2011. 40, 42
170

REFERENCES REFERENCES
[Dar72] C. Darwin. The Expression of the Emotions in Man and Animals.
1872. 16
[DBH+99] G. Donato, M. S. Bartlett, J. C. Hager, P. Ekman, and T. J.
Sejnowski. Classifying facial actions. IEEE Transaction on Pattern
Analysis and Machine Intelligence, 21:974–989, 1999. 34, 35
[dCW02] A. C. de C. Williams. Facial expression of pain: An evolutionary
account. Behavioral and Brain Sciences, 25:439–488, 2002. 9
[DN96] Y. Dai and Y. Nakano. Face-texture model based on SGLD and its
application in face detection in a color scene. Pattern Recognition,
29:1007–1017, 1996. 28
[DT05] N. Dalal, , and B. Triggs. Histograms of oriented gradients for human
detection. In IEEE Conference on Computer Vision and Pattern
Recognition, 2005. 90, 92
[EA02] H. A. Elfenbein and N. Ambady. On the universality and cultural
specificity of emotion recognition: A meta-analysis. Psychological
Bulletin, 28:203–235, 2002. 51
[EF75] P. Ekman and W. V. Friesen. Unmasking the Face: A Guide to
Recognizing Emotions from Facial Clues. Prentice Hall, Englewood
Cliffs, New Jersey, 1975. 2, 14
[EF78] P. Ekman and W. Friesen. The facial action coding system: A
technique for the measurement of facial movements. Consulting
Psychologist, 1978. 4, 9, 15, 17, 39, 40, 60, 84, 85, 113, 125, 137,
142
[EF82] P. Ekman and W. Friesen. Felt, false, and miserable smiles. Journal
of Nonverbal Behavior, 6(4):238–252, 1982. 122
[EFE72] P. Ekman, W. V. Friesen, and P. Ellsworth. Emotion in the
Human Face: Guidelines for Research and an Integration of Findings.
Pergamon Press, New York, 1972. 2, 14
171

REFERENCES REFERENCES
[Ekm71] P. Ekman. Universals and cultural differences in facial expressions
of emotion. In Nebraska Symposium on Motivation, pages 207–283.
Lincoln University of Nebraska Press, 1971. 2, 15, 50, 84, 135, 147
[Ekm93] P. Ekman. Facial expression of emotion. Psychologist, 48:384–392,
1993. 2, 14, 15
[Ekm01] P. Ekman. Telling Lies: Clues to Deceit in the Marketplace, Politics,
and Marriage. W. W. Norton & Company, New York, 3rd edition,
2001. 2, 14, 122
[Ekm06] P. Ekman, editor. Darwin and Facial Expression: A Century of
Research in Review. Malor Books, 2006. 16
[EP95] I. Essa and A. Pentland. Facial expression recognition using a
dynamic model and motion energy. In International Conference on
Computer Vision, 1995. 41
[ER05] P. Ekman and E. L. Rosenberg. What the face reveals: Basic and
applied studies of spontaneous expression using the Facial Action
Coding System. Oxford University Press. NY., 2005. 9, 23
[FDWS91] J. Fernndez-Dols, H. Wallbott, and F. Sanchez. Emotion category
accessibility and the decoding of emotion from facial expression and
context. Journal of Nonverbal Behavior, 15:107–123, 1991. 2, 14
[FMGP04] B. Fasel, F. Monay, and D. Gatica-Perez. Latent semantic analysis
of facial action codes for automatic facial expression recognition.
In Proceedings of the 6th ACM SIGMM international workshop on
Multimedia information retrieval, pages 181–188, 2004. 19
[FS95] Y. Freund and R. E. Schapire. A decision-theoretic generalization
of on-line learning and an application to boosting. In European
Conference on Computational Learning Theory, pages 23–37.
Springer-Verlag, 1995. 30, 31, 43
172

REFERENCES REFERENCES
[FYS07] X. Fan, B. Yin, and Y. Sun. Yawning detection for monitoring
driver fatigue. In International Conference on Machine Learning
and Cybernetics, volume 2, pages 664 –668, aug. 2007. 124
[GCS+04] W. Gao, B. Cao, S. Shan, and X. Zhang D. Zhou, and
D. Zhao. CAS-PEAL large-scale chinese face database and evaluation
protocols. Technical report, JDL-TR-04-FR-001, Joint Research &
Development Laboratory, 2004, 2004. 24, 150
[GL13] D. Ghimire and J. Lee. Geometric feature-based facial expression
recognition in image sequences using multi-class adaboost and
support vector machines. Sensors, 13:7714–7734, 2013. 5, 98, 99,
118
[GMK02] M.A Golner, W.B. Mikhael, and V. Krishnang. Modified jpeg image
compression with region-dependent quantization. Circuits, Systems
and Signal Processing, 21(2):163–180, 2002. 50
[GP10] H. Gunes and M. Pantic. Automatic, dimensional and continuous
emotion recognition. International Journal of Synthetic Emotions,
1:68–99, 2010. 139
[GS13] H. Gunes and B. Schuller. Categorical and dimensional affect analysis
in continuous input: Current trends and future directions. Image and
Vision Computing, 31(2):120 –136, 2013. 138, 139
[GZZM10] Z. Guo, L. Zhang, D. Zhang, and X. Mou. Hierarchical multiscale lbp
for face and palmprint recognition. In IEEE International Conference
on Image Processing, pages 4521–4524, sept. 2010. 110
[HAL09] Y. Huang, X. Ao, and Y. Li. Real time face detection based on
skin tone detector. International Journal of Computer Science and
Network Security, 9:71–77, 2009. 27
[Han44] N. Hanawalt. The role of the upper and lower parts of the face as
the basis for judging facial expressions: Ii. in posed expressions and
173

REFERENCES REFERENCES
”candid camera” pictures. Journal of General Psychology, 31:23–36,
1944. 67
[Har06] Jonathon Stephen Hare. Saliency for Image Description and
Retrieval. PhD thesis, University of Southampton, 2006. 6, 50
[HBK00] U. Hess, S. Blairy, and R. E. Kleck. The influence of facial emotion
displays, gender, and ethnicity on judgments of dominance and
affiliation. Nonverbal Behavior, 24:265–283, 2000. 51
[HCL04] T. Hadjistavropoulos, K. D. Craig, and S.K. Lacelle. Pain:
Psychological Perspectives, chapter Social influences and the
communication of pain, pages 87–112. 2004. 124
[HFH+09] M. Hall, E. Frank, G. Holmes, B. Pfahringer, P. Reutemann, and
I. Witten. The WEKA data mining software. SIGKDD Explorations,
11, 2009. 42
[HGN04] E. Hadjidemetriou, M.D. Grossberg, and S.K. Nayar. Multiresolution
histograms and their use for recognition. IEEE Transactions on
Pattern Analysis and Machine Intelligence, 26(7):831 –847, july 2004.
106
[HMHY+97] C. Han, L. Mark, Hong-Yuan, G. Yu, and L. Chen. Fast face
detection via morphology-based pre-processing. In Image Analysis
and Processing, pages 469–476. Springer Berlin Heidelberg, 1997. 27
[HTKW13] L. Hsu, W. Tseng, L. Kang, and Y. Wang. Seeing through
the expression: Bridging the gap between expression and emotion
recognition. In IEEE International Conference on Multimedia and
Expo, 2013. xxiii, 138
[HXM+04] Y. Hu, X. Xie, W.-Y. Ma, L.-T. Chia, and D. Rajan. Salient region
detection using weighted feature maps based on the human visual
attention model. In Pacific Rim Conference on Multimedia, 2004. 75
174

REFERENCES REFERENCES
[HZ07] X. Hou and L. Zhang. Saliency detection: A spectral residual
approach. In IEEE Conference on Computer Vision and Pattern
Recognition, 2007. xxi, 74, 75, 77, 78, 79
[IKN98] L. Itti, C. Koch, and E. Niebur. A model of saliency-based visual
attention for rapid scene analysis. In IEEE Transactions on Pattern
Analysis and Machine Intelligence, volume 20, pages 1254–1259,
1998. xx, xxi, 6, 50, 74, 75, 78, 79
[Itt04] L. Itti. Automatic foveation for video compression using a
neurobiological model of visual attention. IEEE Transactions on
Image Processing,, 13(10):1304–1318, 2004. 50
[Iza09] C. E. Izard. Emotion theory and research: Highlights, unanswered
questions, and emerging issues. Annual Review of Psychology, 60:1–
25, 2009. 15
[Jam90] W James. The Principles of Psychology. London : Macmillan, 1890.
5
[JHP06] C. Koch J. Harel and P. Perona. Graph-based visual saliency. In
Proceedings of Neural Information Processing Systems (NIPS), 2006.
xx, xxi, 74, 75, 76, 77, 78, 79
[JOW+05] T. Jost, N. Ouerhani, R. Wartburg, R. Muri, and H. Hugli. Assessing
the contribution of color in visual attention. Computer Vision and
Image Understanding. Special Issue on Attention and Performance
in Computer Vision, 100:107–123, 2005. 5, 58
[JVP11] B. Jiang, M. F. Valstar, and M. Pantic. Action unit detection using
sparse appearance descriptors in space-time video volumes. In IEEE
Conference on Automatic Face and Gesture Recognition, 2011. 42
[KBP08] I. Kotsia, I. Buciu, and I Pitas. An analysis of facial expression
recognition under partial facial image occlusion. Image and Vision
Computing, 26:1052–1067, 2008. 42
175

REFERENCES REFERENCES
[KCT00] T. Kanade, J. F. Cohn, and Y. Tian. Comprehensive database for
facial expression analysis. In Fourth IEEE International Conference
on Automatic face and Gesture Recognition (FG’00), pages 46–53,
2000. 23, 35, 36, 37, 39, 43, 142
[KKD10] R.A. Khan, H. Konik, and E. Dinet. Enhanced image saliency model
based on blur identification. In 25th International Conference of
Image and Vision Computing New Zealand, December 2010. 50
[KMKB11] R. A. Khan, A. Meyer, H. Konik, and S. Bouakaz. Facial
expression recognition using entropy and brightness features. In
11th International Conference on Intelligent Systems Design and
Applications (ISDA), December 2011. 87
[KMKB12a] R. A. Khan, A. Meyer, H. Konik, and S. Bouakaz. Exploring human
visual system: study to aid the development of automatic facial
expression recognition framework. In Computer Vision and Pattern
Recognition Workshop, 2012. 69
[KMKB12b] R. A. Khan, A. Meyer, H. Konik, and S. Bouakaz. Human vision
inspired framework for facial expressions recognition. In IEEE
International Conference on Image Processing, 2012. xxii, 42, 103,
119, 120, 124, 136
[KMKB13a] R.A. Khan, A. Meyer, H. Konik, and S. Bouakaz. Framework for
reliable, real-time facial expression recognition for low resolution
images. Pattern Recognition Letters, 34(10):1159–1168, 2013. 132
[KMKB13b] R.A. Khan, A. Meyer, H. Konik, and S. Bouakaz. Pain detection
through shape and appearance features. In IEEE International
Conference on Multimedia and Expo (ICME), pages 1–6, 2013. 132
[KP97] C. Kotropoulos and I. Pitas. Rule-based face detection in frontal
views. In IEEE International Conference on Acoustics, Speech, and
Signal Processing, pages 2537–2540, 1997. 26
176

REFERENCES REFERENCES
[KT04a] S. H. Kohsia and M.M. Trivedi. Robust real-time detection, tracking,
and pose estimation of faces in video streams. In International
Conference on Pattern Recognition, 2004. 30
[KT04b] M. Kolsch and M. Turk. Analysis of rotational robustness of hand
detection with a viola-jones detector. In International Conference on
Pattern Recognition, pages 107–110, 2004. 30, 90
[KT09] S. P. Khandait and R.C. Thool. Hybrid skin detection algorithm
for face localization in facial expression recognition. In Advance
Computing Conference, pages 398–401, 2009. 27
[KU85] C. Koch and S. Ullman. Shifts in selective visual attention: towards
the underlying neural circuitry. Human Neurobiology, 4:219–227,
1985. 74
[KZP08] I. Kotsia, S. Zafeiriou, and I. Pitas. Texture and shape information
fusion for facial expression and facial action unit recognition. Pattern
Recognition, 41:833–851, 2008. 5, 40, 42, 86, 98, 99, 118
[LBF+06] G. Littlewort, M. S. Bartlett, I. Fasel, J. Susskind, and J. Movellan.
Dynamics of facial expression extracted automatically from video.
Image and Vision Computing, 24:615–625, 2006. 5, 34, 43, 86, 98,
99, 118, 124
[LBHW07] Y. M. Lui, J.R. Beveridge, A.E. Howe, and L.D. Whitley. Evolution
strategies for matching active appearance models to human faces. In
International Conference on Biometrics: Theory, Applications, and
Systems, 2007. 30, 125
[LBL07] G. Littlewort, M. S. Bartlett, and K. Lee. Faces of pain: automated
measurement of spontaneous facial expressions of genuine and posed
pain. In 9th international conference on Multimodal interfaces, 2007.
19, 42, 123, 124, 125
177

REFERENCES REFERENCES
[LBP95] T. K. Leung, M.C. Burl, and P. Perona. Finding faces in cluttered
scenes using random labeled graph matching. In International
Conference on Computer Vision, pages 637–644, 1995. 27
[LCK+10] P. Lucey, J. F. Cohn, T. Kanade, J. Saragih, Z. Ambadar, and
I. Matthews. The extended cohn-kande dataset (CK+): A complete
facial expression dataset for action unit and emotion-specified
expression. In IEEE Conference on Computer Vision and Pattern
Recognition Workshops, 2010. 60, 84, 94, 112, 113, 142
[LCM+11] P. Lucey, J. F. Cohn, I. Matthews, S. Lucey, S. Sridharan, J. Howlett,
and K.M. Prkachin. Automatically detecting pain in video through
facial action units. IEEE Transactions on Systems, Man, and
Cybernetics, Part B: Cybernetics, 41(3):664 –674, june 2011. 124,
125, 126, 131, 137
[LCP+11] P. Lucey, J. F. Cohn, K. M. Prkachin, P. E. Solomon, and
I. Matthews. Painful data: The UNBC-McMaster shoulder pain
expression archive database. In IEEE International Conference on
Automatic Face and Gesture Recognition, pages 57 –64, 2011. 8, 126,
128, 131, 153, 154
[LDB+10] O. Langner, R. Dotsch, G. Bijlstra, D. H. J. Wigboldus, S. T. Hawk,
and V. A. Knippenberg. Presentation and validation of the radboud
faces database. Cognition and Emotion, 24:1377–1388, 2010. 152
[Leo96] Breiman Leo. Bagging predictors. Machine Learning, 24:123–140,
1996. 43
[LFCY06] S. Liao, W. Fan, A. C. S. Chung, and D. Yeung. Facial expression
recognition using advanced local binary patterns, tsallis entropies
and global appearance features. In IEEE International Conference
on Image Processing, 2006. 42
[LFT10] Y. Lin, B. Fang, and Y. Tang. A computational model for saliency
maps by using local entropy. In AAAI Conference on Artificial
Intelligence, 2010. 72
178

REFERENCES REFERENCES
[LQI11] Z. Li, S. Qin, and L. Itti. Visual attention guided bit allocation in
video compression. Image and Vision Computing, 29:1–14, 2011. 50
[LSKG98] M. Lyons, Akamatsu S, M. Kamachi, and J. Gyoba. Coding facial
expressions with gabor wavelet. In In 3rd International Conference
on Automatic Face and Gesture Recognition., 1998. 148
[LSP06] S. Lazebnik, C. Schmid, and J. Ponce. Beyond bags of features:
spatial pyramid matching for recognizing natural scene categories.
In IEEE Conference on Computer Vision and Pattern Recognition,
2006. 92
[LVB+93] M. Lades, J. C. Vorbruggen, J. Buhmann, J. Lange, C. Malsburg,
R. P. Wurtz, and W. Konen. Distortion invariant object recognition
in the dynamic link architecture. IEEE Transactions on Computers,
42:300–311, 1993. 34
[Man84] G. Mandler. Mind and body: Psychology of emotion and stress. W.W.
Norton and Company. New York., 1984. 21
[MB98] A. R. Martinez and R. Benavente. The AR face database. Technical
report, Computer Vision Center (CVC), Barcelona, 1998. 149
[MB10] H. Mekami and S. Benabderrahmane. Towards a new approach
for real time face detection and normalization. In International
Conference on Machine and Web Intelligence, pages 455–459, 2010.
26, 30
[MB11] S. Moore and R. Bowden. Local binary patterns for multi-view facial
expression recognition. Computer Vision and Image Understanding,
115(4):541 – 558, 2011. 110
[Mit97] Tom M. Mitchell. Machine Learning. McGraw-Hill Science, 1997. 40
[MKH+07] G. Michael, K. Kristian, H. Helen, N. Clifford, S. Bjorn, R. Gerhard,
and M. Tobias. On the necessity and feasibility of detecting a
drivers emotional state while driving. In Affective Computing and
179

REFERENCES REFERENCES
Intelligent Interaction, Lecture Notes in Computer Science, pages
126–138. 2007. 22
[MP98] H. Moon and P.J. Phillips. The FERET verification testing protocol
for face recognition algorithms. In Third IEEE International
Conference on Automatic Face and Gesture Recognition, 1998. 24
[MR73] A. Mehrabian and J. Russell. A measure of arousal seeking tendency.
environment and behavior. Environment and Behavior, 5:5:315–333.,
1973. 21
[MR06] M. M. Monwar and S. Rezaei. Appearance-based pain recognition
from video sequences. In International Joint Conference on Neural
Networks, pages 2429–2434, 2006. 125, 131
[MR08] M. Monwar and S. Rezaei. Video analysis for view-based painful
expression recognition. In IEEE International Joint Conference on
Neural Networks, pages 3619–3626, 2008. 125, 131
[MZ03] Y. F. Ma and H. J. Zhang. Contrast-based image attention analysis
by using fuzzy growing. In 11th ACM International Conference on
Multimedia, pages 374–381, 2003. 50, 75
[NCWB08] M. Nusseck, D. W. Cunningham, C. Wallraven, and H. H. Bulthoff.
The contribution of different facial regions to the recognition of
conversational expressions. Journal of vision, 8:1–23, 2008. 64, 65
[NH98] A.V. Nefian and III Hayes, M.H. Face detection and recognition
using hidden markov models. In IEEE International Conference on
Image Processing, volume 1, pages 141–145 vol.1, 1998. 30
[OAVE93] B. Olshausen, C. Anderson, and D. Van Essen. A neurobiological
model of visual attention and invariant pattern recognition based on
dynamic routing of information. Neuroscience, 13:4700–4719, 1993.
6, 50
180

REFERENCES REFERENCES
[OFG97] E. Osuna, R. Freund, and F. Girosi. Training support vector
machines: an application to face detection. In IEEE Conference
on Computer Vision and Pattern Recognition, pages 130–136, 1997.
30
[OP99] T. Ojala and M. Pietikainen. Unsupervised texture segmentation
using feature distributions. Pattern Recognition, 32:477– 486, 1999.
36, 107
[OPH96] T. Ojala, M. Pietikainen, and D. Harwood. A comparative study of
texture measures with classification based on featured distribution.
Pattern Recognition, 29:51–59, 1996. 36, 106, 107
[OPM02] T. Ojala, M. Pietikainen, and T. Maenpaa. Multiresolution gray-
scale and rotation invariant texture classification with local binary
patterns. IEEE Transaction on Pattern Analysis and Machine
Intelligence, 24:971–987, 2002. xxii, 36, 106, 107, 108, 136
[Pan09] M. Pantic. The Encyclopedia of biometrics, volume 6, chapter Facial
Expression Analysis. 2009. xvii, 16
[Par74] F. I. Parke. A parametric model for human faces. PhD thesis,
Department of Computer Science, University of Utah, 1974. 13
[PK08] S. Park and D. Kim. Spontaneous facial expression classification
with facial motion vector. In IEEE Conference on Automatic Face
and Gesture Recognition, 2008. 124
[Plu80] R. Plutchik. Emotion: A psychoevolutionary synthesis. Harper and
Row, New York., 1980. 19
[PLZP11] T. Pfister, X. Li, G. Zhao, and M. Pietikainen. Recognising
spontaneous facial micro-expressions. In International Conference
on Computer Vision, pages 1449–1456, 2011. 139
[POP98] C. P. Papageorgiou, M. Oren, and T. Poggio. A general framework for
object detection. In International Conference on Computer Vision,
pages 555–562, 1998. 30
181

REFERENCES REFERENCES
[PP06] M. Pantic and I. Patras. Dynamics of facial expression: recognition
of facial actions and their temporal segments from face profile image
sequences. IEEE Transactions on Systems, Man, and Cybernetics,
36:433–449, 2006. 38, 124
[PPNH06] M. Pantic, A. Pentland, A. Nijholt, and T. Huang. Human computing
and machine understanding of human behavior: A survey. In ACM
International Conference on Multimodal Interfaces, 2006. 2, 9, 38,
39
[Prk92] K. Prkachin. The consistency of facial expressions of pain: a
comparison across modalities. Pain, 51:297–306, 1992. 126, 154
[PS08] K. Prkachin and P. E. Solomon. The structure, reliability and validity
of pain expression: Evidence from patients with shoulder pain. Pain,
139:267–274, 2008. 126, 154
[PS10] G.A. Poghosyan and H. G. Sarukhanyan. Decreasing volume of face
images database and efficient face detection algorithm. Information
Theories and Applications, 17, 2010. 36
[PVRM05] M. Pantic, M. F. Valstar, R. Rademaker, and L. Maat. Web-
based database for facial expression analysis. In IEEE International
Conference on Multimedia and Expo, 2005. 24, 39, 61, 143
[QL08] M. Qi and Z. Liming. Saliency-based image quality assessment
criterion. In De-Shuang Huang, II Wunsch, DonaldC., DanielS.
Levine, and Kang-Hyun Jo, editors, Advanced Intelligent Computing
Theories and Applications. With Aspects of Theoretical and
Methodological Issues, volume 5226 of Lecture Notes in Computer
Science, pages 1124–1133. Springer Berlin Heidelberg, 2008. 50
[Qui93] J. R. Quinlan. C4.5: Programs for Machine Learning. Morgan
Kaufmann, 1993. 44
182

REFERENCES REFERENCES
[RBK96] H.A. Rowley, S. Baluja, and T. Kanade. Neural network-based face
detection. In IEEE Conference on Computer Vision and Pattern
Recognition, pages 203–208, 1996. 30
[RCB02] U. Rajashekar, L. K. Cormack, and A.C Bovik. Visual search:
Structure from noise. In Eye Tracking Research & Applications
Symposium, pages 119–123, 2002. 6, 49, 50
[Rus80] J. Russell. A circumplex model of affect. journal of personality and
social psychology. Journal of Personality and Social Psychology,
39:1161–1178., 1980. 21
[Rus95] J Russell. Facial expression of emotion: What lies beyond minimal
universality. Psychological Bulletin, 118:379–391, 1995. 21
[SBR10] K. Scherer, T. Banziger, and E. Roesch, editors. A Blueprint for
Affective Computing. Oxford University Press, 2010. 2, 9, 21
[Sca98] B. Scassellati. Eye finding via face detection for a foveated, active
vision system. In 15th Nat. Conf. Artificial Intelligence, pages 969–
976, 1998. 28
[SF96] D. Saxe and R. Foulds. Toward robust skin identification in video
images. In International Conference on Automatic Face and Gesture
Recognition, pages 379–384, 1996. 27
[SGM09] C. Shan, S. Gong, and P. W. McOwan. Facial expression recognition
based on local binary patterns: A comprehensive study. Image and
Vision Computing, 27:803–816, 2009. xxii, 33, 35, 36, 37, 41, 42, 106,
115, 116, 117, 119, 120, 136
[Sin95] P. Sinha. Perceiving and Recognizing Three-Dimensional Forms. PhD
thesis, M. I. T., Cambridge, MA, 1995. 28
[Sir93] S.A. Sirohey. Human face segmentation and identification. Technical
Report CS-TR-3176, University of Maryland, USA., 1993. 27
183

REFERENCES REFERENCES
[SSBW92] M. Sayette, D. Smith, M. Breiner, and G. Wilson. The effect of
alcohol on emotional response to a social stressor. Journal of Studies
on Alcohol, 53:541–545, 1992. 9
[STR+05] V. Setlur, S. Takagi, R. Raskar, M. Gleicher, and B. Gooch.
Automatic image retargeting. In 4th International Conference on
Mobile and Ubiquitous Multimedia, pages 59–68, 2005. 50
[SW63] C. E. Shannon and W. Weave. The Mathematical Theory of
Communication. University of Illinois Press, 1963. 72
[Tia04] Y. Tian. Evaluation of face resolution for expression analysis. In
Computer Vision and Pattern Recognition Workshop, 2004. xxii, 34,
35, 86, 98, 99, 101, 118, 119, 120, 136
[TKC01] Y. Tian, T. Kanade, and J. F. Cohn. Recognizing action units for
facial expression analysis. IEEE Transactions on Pattern Analysis
and Machine Intelligence, 23:97–115, 2001. 19
[TKCis] Y. Tian, T. Kanade, and J. F. Cohn. Handbook of Face Recognition.
Springer, 2005, Chapter 11. Facial Expression Analysis. 23, 33
[TP91] M. Turk and A. Pentland. Eigenfaces for recognition. Journal of
Cognitive Neuroscience, 3:71–86, 1991. 30
[TSW+95] J. K. Tsotsos, M. C. Scan, W. Y. K. Wai, Y. Lai, N. Davis, and
F. Nuflo. Modeling visual attention via selective tuning. Artificial
Intelligence, 78:507–545, 1995. 6, 49
[TTUP13] A Tanveer, J. Taskeed, and C. Ui-Pil. Facial expression recognition
using local transitional pattern on gabor filtered facial images. IETE
Technical Review, 30(1):47–52, 2013. 98, 99, 117, 118
[Val08] Michel Francois Valstar. Timing is everything, a spatio-temporal
approach to the analysis of facial actions. PhD thesis, Imperial
College, 2008. xvii, 17, 18, 19, 21
184

REFERENCES REFERENCES
[Vap98] Vladimir N. Vapnik. Statistical Learning Theory. Wiley-Interscience,
1998. 41
[VJ01] P. Viola and M. Jones. Rapid object detection using a boosted
cascade of simple features. In IEEE Conference on Computer Vision
and Pattern Recognition, 2001. xviii, 30, 31, 32, 33, 35, 36, 72, 85,
90, 96, 111, 113, 124, 127
[VP06] M. Valstar and M. Pantic. Fully automatic facial action unit
detection and temporal analysis. In Computer Vision and Pattern
Recognition Workshop, 2006. 38, 39
[VP10] M.F. Valstar and M. Pantic. Induced disgust, happiness and surprise:
an addition to the MMI facial expression database. In International
Language Resources and Evaluation Conference, 2010. xxii, 113, 122,
123, 146
[VPAC06] M.F. Valstar, M. Pantic, Z. Ambadar, and J.F. Cohn. Spontaneous
vs. posed facial behavior: automatic analysis of brow actions.
In Proceedings of the 8th international conference on Multimodal
interfaces, ICMI ’06, pages 162–170, New York, NY, USA, 2006.
ACM. 122
[VPP05] M.F. Valstar, I. Patras, and M. Pantic. Facial action unit detection
using probabilistic actively learned support vector machines on
tracked facial point data. In IEEE Conference on Computer Vision
and Pattern Recognition Workshop, pages 76–84, 2005. 5, 38, 39, 99,
121, 124
[Wal06] F. Wallhoff. Facial expressions and emotion database.
www.mmk.ei.tum.de/˜waf/fgnet/feedtum.html, 2006. 84, 86,
94, 100, 121, 147
[WBG87] F. Weiss, G. Blum, and L Gleberman. Anatomically based
measurement of facial expressions in simulated versus hypnotically
induced affect. Motivation and Emotion, 11(1):67–81, 1987. 122
185

REFERENCES REFERENCES
[WCX11] W. Wang, W. Chen, and D. Xu. Pyramid-based multi-scale
lbp features for face recognition. In International Conference on
Multimedia and Signal Processing (CMSP), volume 1, pages 151 –
155, 2011. 110
[WO06] J. Whitehill and C.W. Omlin. Haar features for FACS AU
recognition. In Automatic Face and Gesture Recognition, 2006. 36
[WS00] G. Wyszecki and W. S. Stiles. Color Science: Concepts and Methods,
Quantitative Data and Formulae. Wiley-Interscience, 2000. 72, 76
[WWJ13] Ziheng Wang, Shangfei Wang, and Qiang Ji. Capturing complex
spatio-temporal relations among facial muscles for facial expression
recognition. In IEEE Conference on Computer Vision and Pattern
Recognition, pages 3422–3429, 2013. 5
[WY07] J. Wang and L. Yin. Static topographic modeling for facial
expression recognition and analysis. Computer Vision and Image
Understanding, 108:19–34, 2007. 155
[Yan11] Peng Yang. Facial expression recognition and expression intensity
estimation. PhD thesis, New Brunswick Rutgers, The State
University of New Jersey, 2011. 41, 43
[YH94] G. Yang and T. Huang. Human face detection in a complex
background. Pattern Recognition, 27:53–63, 1994. 26
[YKA02] Ming-Hsuan Yang, D. Kriegman, and N. Ahuja. Detecting faces
in images: a survey. IEEE Transactions on Pattern Analysis and
Machine Intelligence, 24:34–58, 2002. 26, 28, 30
[YLM10] P. Yang, Q. Liu, and D. N. Metaxas. Exploring facial expressions with
compositional features. In IEEE Conference on Computer Vision and
Pattern Recognition, 2010. 5, 36, 43, 85, 86, 96, 98, 99, 113, 117, 118
[Yng70] V. H. Yngve. On getting a word in edgewise. In Papers from the Sixth
Regional Meeting of the Chicago Linguistic Society, pages 567–578.
Chicago Linguistic Society, 1970. 2, 14
186

REFERENCES REFERENCES
[Zha06] L. Zhaoping. Theoretical understanding of the early visual processes
by data compression and data selection. Network: computation in
neural systems, 17:301–334, 2006. 5, 134
[ZHF+06] Z. Zeng, Y. Hu, Y. Fu, T. S. Huang, G. I. Roisman, and Z. Wen.
Audio-visual emotion recognition in adult attachment interview.
In Proceedings of the 8th international conference on Multimodal
interfaces, 2006. 3
[ZJ05] Y. Zhang and Q. Ji. Active and dynamic information fusion for facial
expression understanding from image sequences. IEEE Transactions
on Pattern Analysis and Machine Intelligence, 27:699–714, 2005. 38,
39, 124
[ZLY+12] Lin Zhong, Qingshan Liu, Peng Yang, Bo Liu, Junzhou Huang, and
D.N. Metaxas. Learning active facial patches for expression analysis.
In IEEE Conference on Computer Vision and Pattern Recognition,
pages 2562–2569, 2012. 5
[ZP07] G. Zhao and M. Pietikainen. Dynamic texture recognition using
local binary patterns with an application to facial expressions. IEEE
Transaction on Pattern Analysis and Machine Intelligence, 29:915–
928, 2007. 5, 36, 37, 42, 86, 98, 99, 106, 118, 124
[ZPRH09] Z. Zeng, M. Pantic, G.I. Roisman, and T.S. Huang. A survey of affect
recognition methods: Audio, visual, and spontaneous expressions.
IEEE Transactions on Pattern Analysis and Machine Intelligence,
31:39 –58, 2009. 2
[ZZ06] Z. Zhang and J. Zhang. Driver fatigue detection based intelligent
vehicle control. In 18th International Conference on Pattern
Recognition, volume 2, pages 1262 –1265, 2006. 124
[ZZH09] J. Zhang, Q. Zhang, and J. Hu. Rgb color centroids segmentation
(CCS) for face detection. ICGST International Journal on Graphics,
Vision and Image Processing, 9:1–9, 2009. 27
187