Embed Size (px)
Citation preview

Thermoplastic elastomers via controlled radical graftpolymerizationCitation for published version (APA):Tuzcu, G. (2012). Thermoplastic elastomers via controlled radical graft polymerization. Technische UniversiteitEindhoven. https://doi.org/10.6100/IR739789
DOI:10.6100/IR739789
Document status and date:Published: 01/01/2012
Document Version:Publisher’s PDF, also known as Version of Record (includes final page, issue and volume numbers)
Please check the document version of this publication:
• A submitted manuscript is the version of the article upon submission and before peer-review. There can beimportant differences between the submitted version and the official published version of record. Peopleinterested in the research are advised to contact the author for the final version of the publication, or visit theDOI to the publisher's website.• The final author version and the galley proof are versions of the publication after peer review.• The final published version features the final layout of the paper including the volume, issue and pagenumbers.Link to publication
General rightsCopyright and moral rights for the publications made accessible in the public portal are retained by the authors and/or other copyright ownersand it is a condition of accessing publications that users recognise and abide by the legal requirements associated with these rights.
• Users may download and print one copy of any publication from the public portal for the purpose of private study or research. • You may not further distribute the material or use it for any profit-making activity or commercial gain • You may freely distribute the URL identifying the publication in the public portal.
If the publication is distributed under the terms of Article 25fa of the Dutch Copyright Act, indicated by the “Taverne” license above, pleasefollow below link for the End User Agreement:www.tue.nl/taverne
Take down policyIf you believe that this document breaches copyright please contact us at:[email protected] details and we will investigate your claim.
Download date: 11. Aug. 2020

Thermoplastic Elastomers via Controlled Radical
Graft Polymerization
PROEFSCHRIFT
ter verkrijging van de graad van doctor aan de TechnischeUniversiteit Eindhoven, op gezag van de rector magnificus,
prof.dr.ir. C.J. van Duijn, voor een commissie aangewezen doorhet College voor Promoties in het openbaar te verdedigen op
woensdag 31 oktober 2012 om 16.00 uur
door
Gozde Tuzcu
geboren te Izmit, Turkije

Dit proefschrift is goedgekeurd door de promotor:
prof.dr.ir. L. Klumperman
Copromotor:
dr.ir. J.G.P. Goossens
A catalogue record is available from the Eindhoven University of Technology Library.
ISBN: 978-90-386-3286-5
Copyright c© 2012 by Gozde Tuzcu
The work described in this thesis was performed at the Laboratories of Polymer Chem-
istry (SPC) and Polymer Technology (SKT) within the department of Chemistry and
Chemical Engineering, Eindhoven University of Technology, the Netherlands. This
work is part of the research program of the Dutch Polymer Institute (DPI), project
#649.
Printed by the Eindhoven University Press, The Netherlands.
Cover design by Gozde Tuzcu.

”Life is not the opposite of death.
Death is the opposite of birth.
Life is eternal.”
Anathema
To my family...

Contents
Glossary ix
1 Introduction 1
1.1 Rubbers and Thermoplastic Elastomers . . . . . . . . . . . . . . . . . . 2
1.1.1 Vulcanization and Thermoset Elastomers . . . . . . . . . . . . . 2
1.1.2 Thermoplastic Elastomers . . . . . . . . . . . . . . . . . . . . . . 3
1.1.2.1 Types and General Characteristics of Thermoplastic Elas-
tomers . . . . . . . . . . . . . . . . . . . . . . . . . . . 4
1.1.2.2 Aspects of Industrial Production of TPEs . . . . . . . . 9
1.2 CRP in Macromolecular Architecture . . . . . . . . . . . . . . . . . . . . 11
1.2.1 Use of CRP methods in TPE synthesis . . . . . . . . . . . . . . . 13
Bibliography 19
2 Synthesis and End-group Functionalization of Thermoplastic Poly-
mers 23
2.1 Introduction . . . . . . . . . . . . . . . . . . . . . . . . . . . . . . . . . . 24
2.2 Experimental Section . . . . . . . . . . . . . . . . . . . . . . . . . . . . . 28
2.2.1 Materials . . . . . . . . . . . . . . . . . . . . . . . . . . . . . . . 28
2.2.2 Methods . . . . . . . . . . . . . . . . . . . . . . . . . . . . . . . . 28
2.2.3 Synthesis of PS and P(SMI) with ω-amine Functionality . . . . . 29
2.2.3.1 ω-Bromide-functional PS . . . . . . . . . . . . . . . . . 29
2.2.3.2 ω-Amine-functional PS . . . . . . . . . . . . . . . . . . 30
2.2.3.3 α-Nitrile-functional PS . . . . . . . . . . . . . . . . . . 31
2.2.3.4 α-Amine-functional PS . . . . . . . . . . . . . . . . . . 31
2.2.3.5 ω-Bromide-functional P(SMI) . . . . . . . . . . . . . . 31
iii

CONTENTS
2.2.3.6 ω-Amine-functional P(SMI) . . . . . . . . . . . . . . . . 32
2.2.4 Synthesis of PS and P(SMI) with ω-thiol Functionality . . . . . . 32
2.2.4.1 ω-Dithioester-functional PS . . . . . . . . . . . . . . . . 32
2.2.4.2 ω-Thiol-functional PS . . . . . . . . . . . . . . . . . . . 32
2.2.4.3 ω-Dithioester-functional P(SMI) . . . . . . . . . . . . . 32
2.2.4.4 ω-Thiol-functional P(SMI) . . . . . . . . . . . . . . . . 33
2.3 Results and Discussion . . . . . . . . . . . . . . . . . . . . . . . . . . . . 33
2.3.1 ARGET ATRP of Styrene . . . . . . . . . . . . . . . . . . . . . . 33
2.3.2 Transformation of Bromide Moiety to Amine in PS . . . . . . . . 35
2.3.3 Transformation of Bromide Moiety to Thiol in PS . . . . . . . . 40
2.3.4 RAFT Polymerization of Styrene . . . . . . . . . . . . . . . . . . 42
2.3.5 Transformation of Nitrile Moiety into Amine in PS . . . . . . . . 45
2.3.6 Transformation of Dithioester Moiety into Thiol in PS . . . . . . 47
2.3.7 ω-Amine-functional P(SMI) . . . . . . . . . . . . . . . . . . . . . 50
2.3.8 ω-Thiol-functional P(SMI) . . . . . . . . . . . . . . . . . . . . . . 53
2.4 Conclusions . . . . . . . . . . . . . . . . . . . . . . . . . . . . . . . . . . 58
Bibliography 59
3 Thermoplastic Elastomers via Amine-Anhydride Coupling 61
3.1 Introduction . . . . . . . . . . . . . . . . . . . . . . . . . . . . . . . . . . 62
3.2 Experimental Section . . . . . . . . . . . . . . . . . . . . . . . . . . . . . 64
3.2.1 Materials . . . . . . . . . . . . . . . . . . . . . . . . . . . . . . . 64
3.2.2 Methods . . . . . . . . . . . . . . . . . . . . . . . . . . . . . . . . 64
3.2.3 Dehydration of Maleic Acid Pendant-functions on EPM . . . . . 65
3.2.4 Amine-anhydride Coupling of EPM and PS-NH2 . . . . . . . . . 65
3.2.5 Amine-anhydride Coupling of EPM and P(SMI)-NH2 . . . . . . 65
3.2.6 Dehydration of Amic Acid Function into Imide . . . . . . . . . . 65
3.3 Results and Discussion . . . . . . . . . . . . . . . . . . . . . . . . . . . . 66
3.3.1 Approaches for the Quantitative Analysis of Grafting Efficiency . 66
3.3.2 Effect of Molar Mass of Building Blocks . . . . . . . . . . . . . . 69
3.3.2.1 Molar Mass of the Grafting Chain . . . . . . . . . . . . 69
3.3.2.2 Molar Mass and Functionality of the Grafted Chain . . 71
3.3.3 Effect of the Composition of the Building Blocks . . . . . . . . . 72
iv

CONTENTS
3.3.4 Effect of Stoichiometry of Building Blocks and Reaction Concen-
tration . . . . . . . . . . . . . . . . . . . . . . . . . . . . . . . . . 72
3.4 Conclusions . . . . . . . . . . . . . . . . . . . . . . . . . . . . . . . . . . 74
Bibliography 77
4 Thermoplastic Elastomers via Thiol-ene Coupling 79
4.1 Introduction . . . . . . . . . . . . . . . . . . . . . . . . . . . . . . . . . . 80
4.2 Experimental Section . . . . . . . . . . . . . . . . . . . . . . . . . . . . . 82
4.2.1 Materials . . . . . . . . . . . . . . . . . . . . . . . . . . . . . . . 82
4.2.2 Methods . . . . . . . . . . . . . . . . . . . . . . . . . . . . . . . . 82
4.2.3 Model Reactions for Thiol-ene Coupling . . . . . . . . . . . . . . 82
4.2.4 Thiol-ene Coupling of Vinylic PB and PS-SH . . . . . . . . . . . 83
4.2.5 Thiol-ene Coupling of Vinylic PB and P(SMI) . . . . . . . . . . 83
4.3 Results and Discussion . . . . . . . . . . . . . . . . . . . . . . . . . . . . 83
4.3.1 Proof of Concept - Model Reactions . . . . . . . . . . . . . . . . 83
4.3.2 Radical Thiol-ene Coupling in Polymer-polymer Coupling . . . . 86
4.3.3 Effect of Molar Mass of Building Blocks . . . . . . . . . . . . . . 88
4.3.3.1 Molar Mass of the Grafting Chain . . . . . . . . . . . . 88
4.3.3.2 Molar Mass of the Grafted Chain . . . . . . . . . . . . 89
4.3.4 Effect of Stoichiometry of Building Blocks and Reaction Concen-
tration . . . . . . . . . . . . . . . . . . . . . . . . . . . . . . . . . 90
4.3.5 Composition of Building Blocks, Effects of Two-solvent System . 91
4.3.6 Effect of Reaction Temperature and Initiator Activity . . . . . . 95
4.4 Conclusions . . . . . . . . . . . . . . . . . . . . . . . . . . . . . . . . . . 97
Bibliography 99
5 Thermoplastic Elastomers via Nitroxide Mediated Graft Polymeriza-
tion 101
5.1 Introduction . . . . . . . . . . . . . . . . . . . . . . . . . . . . . . . . . . 102
5.2 Experimental Section . . . . . . . . . . . . . . . . . . . . . . . . . . . . . 104
5.2.1 Materials . . . . . . . . . . . . . . . . . . . . . . . . . . . . . . . 104
5.2.2 Methods . . . . . . . . . . . . . . . . . . . . . . . . . . . . . . . . 104
5.2.3 Synthesis of Amine-functional NMP Initiator . . . . . . . . . . . 105
v
CONTENTS
5.2.3.1 Synthesis of 2-methyl-2-[N-tert-butyl-N-(1-diethoxyphosphoryl-
2,2-dimehtylpropyl)amino]-N-propionylsuccinimide (NPS
SG-1) . . . . . . . . . . . . . . . . . . . . . . . . . . . . 105
5.2.3.2 Synthesis of 2-methyl-2-[N-tert-butyl-N-(1-diethoxyphosphoryl-
2,2-dimethylpropyl)aminoxy]-N-aminoethylpropionamide
(NAP SG-1) . . . . . . . . . . . . . . . . . . . . . . . . 105
5.2.4 NMP of Styrene . . . . . . . . . . . . . . . . . . . . . . . . . . . 106
5.2.5 Ex-situ Modification of ω-nitroxide Functionality . . . . . . . . . 106
5.2.6 Synthesis of NMP Macroinitiator . . . . . . . . . . . . . . . . . . 106
5.2.7 Graft Polymerization of Styrene from Macroinitiator . . . . . . . 106
5.2.8 In-situ Modification of ω-nitroxide Functionality . . . . . . . . . 107
5.3 Results and Discussion . . . . . . . . . . . . . . . . . . . . . . . . . . . . 107
5.3.1 Synthesis of Amine-functional NMP Initiator . . . . . . . . . . . 107
5.3.2 A pre-study: NMP of Styrene . . . . . . . . . . . . . . . . . . . . 109
5.3.3 In-situ and Ex-situ End-modification of ω-nitroxide-functional PS 112
5.3.4 Synthesis of NMP Macroinitiator . . . . . . . . . . . . . . . . . . 113
5.3.5 Graft Polymerization of Styrene from Macroinitiator and In-situ
Modification of the Nitroxide Functionality . . . . . . . . . . . . 115
5.4 Conclusions . . . . . . . . . . . . . . . . . . . . . . . . . . . . . . . . . . 118
Bibliography 121
6 Structure-Property Relations of TPEs with Graft Topology 123
6.1 Introduction . . . . . . . . . . . . . . . . . . . . . . . . . . . . . . . . . . 124
6.2 Experimental Section . . . . . . . . . . . . . . . . . . . . . . . . . . . . . 125
6.2.1 Materials . . . . . . . . . . . . . . . . . . . . . . . . . . . . . . . 125
6.2.2 Methods and Characterization Techniques . . . . . . . . . . . . . 126
6.2.2.1 TEM Measurements of the Samples . . . . . . . . . . . 126
6.2.2.2 Compression Molding of the TPE Samples . . . . . . . 126
6.2.2.3 DMTA Analysis of TPE Samples . . . . . . . . . . . . . 126
6.2.2.4 Tensile Tests of TPE Samples . . . . . . . . . . . . . . 126
6.2.2.5 Interpretation of Data . . . . . . . . . . . . . . . . . . . 127
6.3 Results and Discussion . . . . . . . . . . . . . . . . . . . . . . . . . . . . 127
6.3.1 Morphology of the Graft TPEs: A General Comparison . . . . . 127
vi

CONTENTS
6.3.2 Effect of Stoichiometry of the Components . . . . . . . . . . . . 129
6.3.2.1 Morphology . . . . . . . . . . . . . . . . . . . . . . . . . 129
6.3.2.2 Thermomechanical Properties . . . . . . . . . . . . . . 129
6.3.2.3 Tensile Properties . . . . . . . . . . . . . . . . . . . . . 132
6.3.3 Effect of Coupling Efficiency . . . . . . . . . . . . . . . . . . . . 132
6.3.3.1 Morphology . . . . . . . . . . . . . . . . . . . . . . . . . 132
6.3.3.2 Thermomechanical Properties . . . . . . . . . . . . . . 135
6.3.3.3 Tensile Properties . . . . . . . . . . . . . . . . . . . . . 139
6.3.4 Effect of the Molar Mass of the Components . . . . . . . . . . . 140
6.3.4.1 Morphology . . . . . . . . . . . . . . . . . . . . . . . . . 140
6.3.4.2 Thermomechanical Properties . . . . . . . . . . . . . . 142
6.3.4.3 Tensile Properties . . . . . . . . . . . . . . . . . . . . . 142
6.3.5 Effect of the Composition of the Building Blocks . . . . . . . . . 144
6.3.5.1 Thermomechanical and Tensile Properties . . . . . . . . 145
6.3.6 Effect of Topology . . . . . . . . . . . . . . . . . . . . . . . . . . 147
6.4 Conclusions . . . . . . . . . . . . . . . . . . . . . . . . . . . . . . . . . . 151
Bibliography 153
7 Outlook 155
Bibliography 159
Summary 161
Acknowledgements 165
Curriculum Vitae 169
vii

Glossary
1-PEBr (1-bromoethyl) benzene
∆Gmix Gibbs free energy of mixing
∆Hmix enthalpy of mixing
∆Smix entropy of mixing
σmax maximum stress
σR stress at break
σ50 stress at 50% elongation
σ100 stress at 100% elongation
ACHN 1,1’-Azobis(cyclohexanecarbonitrile)
AIBN azobisisobutyronitrile
AMVN 2,2’-Azobis(2.4-dimethyl valeroni-
trile)
ARGET activators regenerated by electron
transfer
ATR attenuated total reflectance
ATRP atom transfer radical polymerization
BHT 3,5-di-tert-butyl-4-hydroxytoluene
BMS BH3.S(CH3)2, borane dimethyl sul-
fide complex
CDB cumyl dithiobenzoate
CE coupling efficiency
CHCl3 chloroform
CIPDB 2-cyanoisoprop-2-yl dithiobenzoate
CRP controlled radical polymerization
CTA chain transfer agent
CuBr2 copper(II)bromide
D dispersity
DCC N-N’dicyclohexylcarbodiimide
DCM dichloromethane
DCU N,N’-dicyclohexylurea
DMF dimethyl formamide
DMTA dynamic mechanical thermal analysis
E′ storage modulus
εR strain at break
EBiB ethyl 2-bromo-2-methylpropanoate
EPM maleated poly(ethylene-co-
propylene) rubber
EPDM poly(ethylene-co-propylene-co-
diene) rubber
EVA poly(ethylene-co-vinyl acetate)
FTIR fourier transform infrared spec-
troscopy
GC gas chromatography
GPEC gradient polymer elution chromatog-
raphy
HCl hydrochloric acid
LDPE low density polyethylene
LiAlH4 lithium aluminum hydride
MALDI-TOF-MS matrix assisted laser des-
orption/ionization time-of-flight
mass spectrometer
MAMA SG-1 2-((tert-butyl(1-(diethoxyphosphoryl)-
2,2-dimethylpropyl)amino)oxy)-2-
methylpropanoic acid
Me6TREN tris[2-(dimethylamino)ethyl]amine
MgSO4 magnesium sulfate
M c molar mass between the crosslink
points
M e entanglement molar mass
ix

GLOSSARY
M n number average molar mass
M p peak molar mass
NPS SG-1 2,5-dioxopyrrolidin-1-yl-2-((tert-
butyl(1-(diethoxyphosphoryl)-
2,2-dimethylpropyl)amino)oxy)-2-
methylpropanoate
NAP SG-1 diethyl (1-(((1-((2-aminoethyl)amino)-
2-methyl-1-oxopropan-2-yl)oxy)(tert-
butyl)amino)-2,2-dimethylpropyl)
phosphonate
N2H4.H2O hydrazine monohydrate
NaN3 sodium azide
NaOH sodium hydroxide
NHS N-hydroxysuccinimide
NMP nitroxide mediated polymerization
NMR nuclear magnetic resonance
NR natural rubber
PB 1,2-polybutadiene
P(Bu)3 tributylphosphine
P(Ph)3 triphenylphosphine
PS polystyrene
P(SMA) poly(styrene-alt-maleic anhydride)
P(SMI) poly(styrene-alt-N-phenyl maleimide)
PVC poly(vinylchloride)
RAFT reversible addition fragmentation
chain transfer
RI refractive index
SEBS poly(styrene-b-ethylene/butylene-b-
styrene)
SEC size exclusion chromatography
SN2 bimolecular nucleophilic substitution
TAI trichloroacetyl isocyanate
TC thermoplastic component
TEM transmission electron microscopy
THF tetrahydrofuran
Tg glass transition temperature
Tm melting temperature
TPE thermoplastic elastomer
UV ultraviolet
x

1
Introduction
Abstract
Thermoplastic elastomers (TPEs) are the successors of conventional thermoset rub-
bers. While bringing cheaper solutions for the production process, they introduce new
tunable properties by utilizing new inventions in macromolecular engineering. Despite
the polymerization step, which is more sophisticated and expensive, the overall pro-
duction process is more profitable than conventional thermoset elastomer production
due to the excluded curing step. Now, controlled/living radical polymerization (CRP)
techniques provide simpler and robust polymerization conditions while bringing the
possibility of controlling the architecture of the macromolecules and is expected to be
a robust tool for the polymer industry. In this PhD study, TPEs with graft copolymer
topology were studied by utilizing CRP techniques in different synthetic approaches.
1

1 Introduction
1.1 Rubbers and Thermoplastic Elastomers
The words ‘elastomer’ and ‘rubber’ are generally used interchangeably. The word
‘elastomer’ is derived from elastic polymer and is a general term used for every kind
of polymer, which shows elastic behavior. However, the word ‘rubber’ is preferably
used for vulcanizates that are chemically crosslinked. An elastomer backbone can be
saturated such as ethylene propylene rubber (EPM), unsaturated such as natural rubber
(NR), or have pendant functionalities such as neoprene. An elastomer without chemical
or physical crosslinks is not sufficiently resistant against high shear or high temperature
applications. Desired rubbery behavior with a high temperature and shear resistance
can be achieved by forming a network structure within the elastomeric chains. Methods
that have been used for rubber and thermoplastic elastomer production and general
characteristic of different types of elastomers will be discussed in the following sections.
1.1.1 Vulcanization and Thermoset Elastomers
Natural rubber is a temperature and oxygen sensitive material due to fact that it
contains a large number of unsaturated bonds and has a low T g. Vulcanization by
molecular sulfur is the first technique invented for producing a durable elastomer with
good mechanical properties. Vulcanization is a general name for the chemical reactions
used for forming a 3-D network structure within the elastomer chains. There are sev-
eral vulcanization methods being used depending on the type of the elastomer to be
crosslinked. In industry, mainly two different vulcanization techniques are used: sul-
fur vulcanization and peroxide vulcanization. Sulfur vulcanization is the first method
invented by Charles Goodyear in 1844, and it is used for curing elastomers with unsat-
urated bonds. Peroxide vulcanization became more interesting after the introduction
of new synthetic elastomers with a saturated main chain. This interest was due to
the simpler chemistry involved in peroxide vulcanization. The peroxide vulcanization
process results in the formation of only covalent carbon-carbon bonds between the elas-
tomer chains, whereas in sulfur vulcanization, sulfide linkages form as well as covalent
carbon-carbon bonds. In this respect, sulfur vulcanization formulation would be more
complicated than peroxide formulation. However, the peroxide vulcanization reaction
has its own disadvantages, such as oxygen sensitivity. Eventually, both techniques have
2

1.1 Rubbers and Thermoplastic Elastomers
their own specifications and are widely used in the rubber industry for the production
of thermoset elastomers with varying properties.
In vulcanization processes, a 3-D network structure is established. This covalent
crosslinking prevents the material to flow at elevated temperatures. This feature leads
the crosslinked rubbers to be used in high shear applications such as tires. However,
crosslinking prevents reprocessing and recycling, as well. There are some techniques
used [1] for recycling of the crosslinking rubber such as pulverizing under high shear
stress and devulcanizing at high temperatures in an extruder. The elastic constant of
S-S bonds is much lower than that of C-C bonds, therefore the pulverization process
under high shear potentially leads to selective devulcanization. There are chemical
techniques that selectively cleave the sulfur linkages, such as reacting the swollen rub-
ber with alkali metals [2]. Devulcanization processes need to be improved to provide
simpler and cheaper solutions for rubber recovery, since the waste rubber as landfills is
overwhelmingly increased and this way of processing the waste rubber is not economical
and environmentally friendly [3]. However, devulcanization of scrap rubber is an extra
step in the production of recycled rubber, which increases the energy consumption and
almost every technique results in partially degraded rubber [3]. Thermoset elastomer
production essentially returns to the producer costly with additional vulcanization step
and a devulcanization step for the reclaim of the rubber, which is not efficient or eco-
nomical. Thermal stability of the thermoset rubber brings the limitations in reclaiming
and reprocessing. Thermoplastic elastomers could be the solution for this contradiction
between the high thermal stability and efficient reprocessibility. TPEs may become the
successors of crosslinked rubbers if thermal stability gets improved with retention of
reprocessing efficiency.
1.1.2 Thermoplastic Elastomers
Following the significant development in applications of polymer chemistry during
World War II, it was possible to produce polymers with desired composition and
constitution. Thermoplastic elastomers have been invented and commercial produc-
tion has been started in the 1950s, with the first patent by DuPont on thermoplas-
tic polyurethanes [4]. Before TPEs were developed, only crosslinked rubbers and
plasticized PVC were available in the market as a flexible/rubbery material. While
crosslinked rubbers show so-called rubbery behavior, they have disadvantages in terms
3

1 Introduction
of compounding with fillers, stabilizers and curing agents and in terms of reprocessi-
bility, plasticized PVC is a thermoplastic material, which can be reprocessed and com-
pounded [5]. Low density polyethylene (LDPE) and ethylene-vinyl acetate copolymer
(EVA) are other examples of thermoplastic polymers that can be flexible. However, the
ultimate property of these materials are not rubbery due to absence chemical/physical
network formation among the chains. The key property of a thermoplastic elastomer is
a consistent rubbery behavior over a temperature range, which EVA or PVC does not
have [6],[7]. This behavior could only be achieved by vulcanization of the rubbers. The
contradiction of achieving a rubbery behavior and reprocessing between the crosslinked
rubbers and plasticized PVC-like materials were to be resolved by thermoplastic elas-
tomers.
1.1.2.1 Types and General Characteristics of Thermoplastic Elastomers
Commercially available TPEs are also either block copolymers with incompatible
segments, or elastomer/hard thermoplastic polymer blends. Blends generally exhibit
macrophase separation (domain size in µm scale), while block copolymers have a mi-
crophase separation, which is also called segregation (domain size in nm scale). An
illustration of phase separation in TPEs is shown in Figure 1.1.
Block copolymers can be classified into two main types, which are copolymers with
a crystalline hard phase and those with an amorphous hard phase. The figure illustrates
the TPE morphology with an amorphous hard phase. TPEs with an amorphous hard
phase have two distinct T gs, separately for the soft and the hard phase, while TPEs
with a crystalline hard phase have a T g for the soft phase and a Tm for the crystalline
phase. An example of a typical modulus-temperature curve for a styrenic TPE is
shown in Figure 1.2, which has similar thermomechanical behavior as semi-crystalline
block TPEs. Modulus-temperature curves are obtained by dynamic mechanical thermal
analysis (DMTA) measurements. This technique provides information about the T g
of the phases, the hardness of the material, the temperature window where rubbery
behavior is observed, and suitable temperature values for the melt processing.
The T g or Tm of the hard phase is generally far above ambient temperature to
be able to give sufficient stiffness to TPE in a wide service temperature range and
related to the flow temperature, T flow of the material, which is the temperature for
the processing (point D in Figure 1.2). The T g value of the elastomer phase indicates
4

1.1 Rubbers and Thermoplastic Elastomers
Figure 1.1: Illustration of the phase separation in TPEs - Blue areas are denotedas the dispersed hard phase, and black lines are the matrix elastomer phase
mo
du
lus
(MP
a)
temperature ( C)°temperature ( C)°
1000
1
100
10
-50 0 50 100 150
A
B
C
D
Figure 1.2: Typical modulus-temperature curve for styrenic TPEs - point A isthe T g of elastomer phase, point B is the Tflex, point C is the T g of the hard phase, andpoint D is Tflow
5
1 Introduction
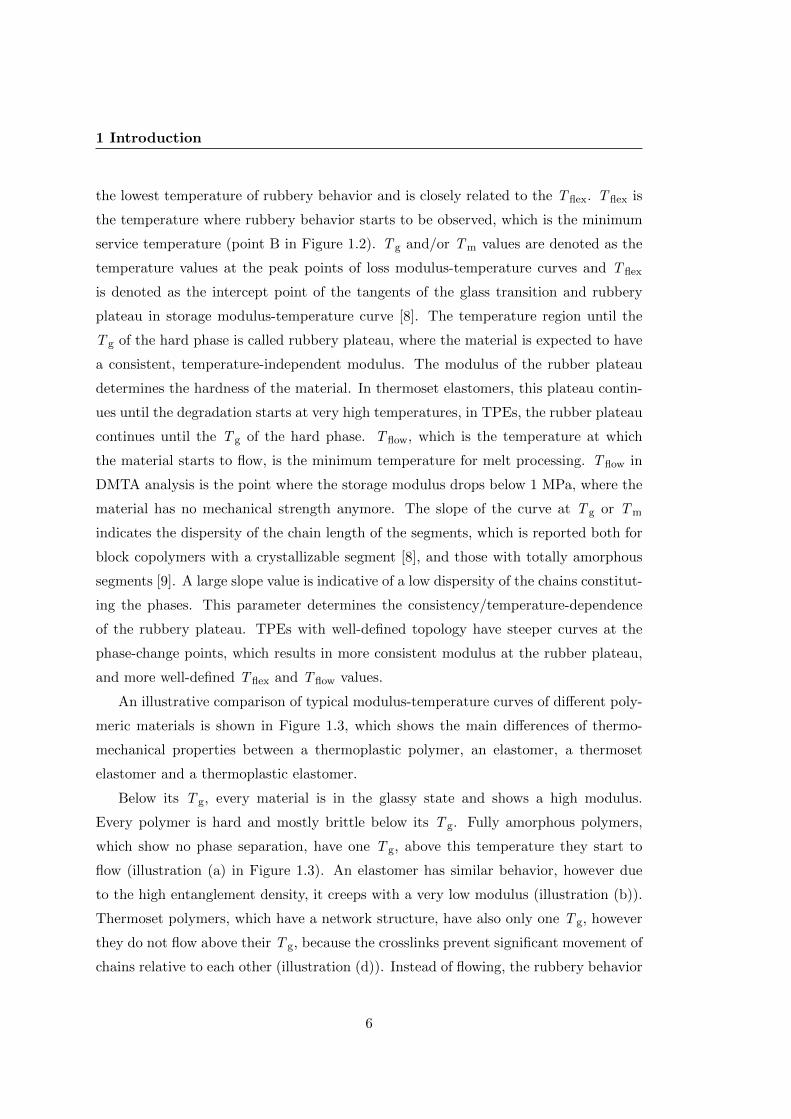
the lowest temperature of rubbery behavior and is closely related to the T flex. T flex is
the temperature where rubbery behavior starts to be observed, which is the minimum
service temperature (point B in Figure 1.2). T g and/or Tm values are denoted as the
temperature values at the peak points of loss modulus-temperature curves and T flex
is denoted as the intercept point of the tangents of the glass transition and rubbery
plateau in storage modulus-temperature curve [8]. The temperature region until the
T g of the hard phase is called rubbery plateau, where the material is expected to have
a consistent, temperature-independent modulus. The modulus of the rubber plateau
determines the hardness of the material. In thermoset elastomers, this plateau contin-
ues until the degradation starts at very high temperatures, in TPEs, the rubber plateau
continues until the T g of the hard phase. T flow, which is the temperature at which
the material starts to flow, is the minimum temperature for melt processing. T flow in
DMTA analysis is the point where the storage modulus drops below 1 MPa, where the
material has no mechanical strength anymore. The slope of the curve at T g or Tm
indicates the dispersity of the chain length of the segments, which is reported both for
block copolymers with a crystallizable segment [8], and those with totally amorphous
segments [9]. A large slope value is indicative of a low dispersity of the chains constitut-
ing the phases. This parameter determines the consistency/temperature-dependence
of the rubbery plateau. TPEs with well-defined topology have steeper curves at the
phase-change points, which results in more consistent modulus at the rubber plateau,
and more well-defined T flex and T flow values.
An illustrative comparison of typical modulus-temperature curves of different poly-
meric materials is shown in Figure 1.3, which shows the main differences of thermo-
mechanical properties between a thermoplastic polymer, an elastomer, a thermoset
elastomer and a thermoplastic elastomer.
Below its T g, every material is in the glassy state and shows a high modulus.
Every polymer is hard and mostly brittle below its T g. Fully amorphous polymers,
which show no phase separation, have one T g, above this temperature they start to
flow (illustration (a) in Figure 1.3). An elastomer has similar behavior, however due
to the high entanglement density, it creeps with a very low modulus (illustration (b)).
Thermoset polymers, which have a network structure, have also only one T g, however
they do not flow above their T g, because the crosslinks prevent significant movement of
chains relative to each other (illustration (d)). Instead of flowing, the rubbery behavior
6

1.1 Rubbers and Thermoplastic Elastomers
E’
(MP
a)
T ( C)°T ( C)°
( a )
( d )( c )
( b )
E’
(MP
a)
E’
(MP
a)
E’
(MP
a)
T ( C)°T ( C)°T ( C)°T ( C)°
T ( C)°T ( C)°
Figure 1.3: Illustrations of typical modulus-temperature curves of differentpolymeric materials - (a) thermoplastic polymer, (b) neat elastomer, (c) thermoplasticelastomer, (d) thermoset elastomer
remains until the material starts to degrade. Thermoplastic elastomers, as described
above in detail, shows a combined behavior of a thermoplastic polymer and an elastomer
(illustration (c)).
Additional properties such as elastic modulus, yield strength, and elongation at
break are distinguishing features of an elastic material. These features are investigated
by stress-strain curves obtained by tensile strength tests. A comparison of stress-strain
curves of polymeric materials with different mechanical properties is shown in Figure
1.4. A very hard and brittle material exhibits a behavior similar to curve A that has no
yield stress. The material breaks before it is exposed to plastic deformation. A material,
which is hard but not as brittle as the example of curve A, exhibits a yield point, but
breaks immediately due to insufficient entanglements, which is illustrated by the curve
B. If a thermoplastic material has sufficient entanglements, it shows a strain softening
after the yield point, where the material creeps. Strain softening continues up to the
point where the chains are aligned, possible local crystallization and entanglements
results in strain hardening. This behavior of a hard and tough material is illustrated
by the curve C. Neat elastomers have a tensile behavior similar to curve E, which is
7

1 Introduction
a very low yield stress, high elongation at break with a very low modulus. This is
actually the flow behavior of a highly viscous liquid. Thermoplastic elastomers have a
tensile behavior similar to curve D. Higher yield stress, due to the hard segment, but
no strain softening if there is no creep in the hard phase. The build-up in stress is due
to the physical crosslinks among the elastomer chains. Crosslinked rubber has similar
behavior as thermoplastic elastomers under tensile stress. However, crosslinked rubbers
show almost no yield stress, since they possess a perfect 3-D network structure, plastic
deformation is virtually absent. The elastic modulus of the crosslinked rubber depends
on the crosslinking density.
A B
C
D
E
stre
ss
strain
Figure 1.4: Typical stress-strain curves for different polymers - A, hard andbrittle; B, hard and strong; C, hard and tough; D, soft and tough; E, soft and weak
Elastic modulus is defined as the slope of the stress-strain curve in the elastic region.
Elastic modulus (stiffness) of thermoplastic elastomers with block topology depends
on the chain length of the soft block and the hard block(s). This feature eventually
defines the volume fractions of the hard phase and the soft phase. The chain length
of the segments determines the number of entanglements per chain as well, which is
another parameter determining the tensile properties. Furthermore, molar mass of
the elastomer segment between the crosslinking points (M c) has a direct relationship
with the stiffness of the corresponding material. This relationship is described by the
8

1.1 Rubbers and Thermoplastic Elastomers
Equation 1.1 [10]:
f = (RTρ/Mc)(λ− 1/λ2) (1.1)
where f is the tensile stress; ρ is the density of the polymer; R is the gas constant; T
is the absolute temperature; M c is the molar mass between crosslinks; λ is the extension
ratio. A tri-block TPE has an M c value the same as the molar mass of the elastomer
segment. However, tensile behavior of a tri-block TPE deviates from the estimated
behavior due to neglecting the effects of hard phase as a filler and the entanglements
in the elastomeric phase [10]. This filler effect, especially in high volume percentages of
the hard segment results in a yield point in stress-strain curves with a strain softening,
where the hard segment creeps under stress.
1.1.2.2 Aspects of Industrial Production of TPEs
Commercially available TPEs consist of 6 different types, which can be classified into
two main groups of block copolymers with incompatible segments and elastomer/hard
thermoplastic polymer blends. A table for the classification of TPE materials is shown
in table 1.1.
Table 1.1: Types of commercial TPE products
TPEsType Class Production
methodStructure
Copolymers
TPE-S* anionic poly-merization
di-/tri-blockcopolymer
TPE-U polyaddition multi-blockcopolymer
TPE-E polycondensation multi-blockcopolymer
TPE-A polycondensation multi-blockcopolymer
BlendsTPE-O metal catalysis homo-
/copolymerblend
TPE-V metal catalysis homo-/copolymerblend
+ dynamic vul-canization
crosslinked
*TPE-S: styrenic TPEs, TPE-U: thermoplastic polyurethanes,TPE-E: thermoplastic polyesters, TPE-A: thermoplastic polyamidesTPE-O: thermoplastic polyolefins, TPE-V: thermoplastic vulcanizates
In industry, production techniques and formulations for TPE blends are greatly
9

1 Introduction
patented. The materials are based on a wide variety of thermoplastic polymers and
elastomers, which are obtained by simple blending, reactive blending or dynamic vul-
canization. Blending may be followed by a curing process resulting in a partially
crosslinked product, which is still reprocessible. Blending provides improvement of
the properties of the polymers and synthesis of new materials from existing polymers.
Blends have a wide variety of different types of polymers and elastomers. Thermoplastic
polyolefins (TPE-O) include the majority of the commercial TPE blends. Polyolefins
are synthesized via transition metal catalysis. The constitution of the polymers is de-
termined by the molecular structure of the metal complex used, which leads to partial
crystallization of the segments. TPE-Os consist of a semi-crystalline polyolefin (such as
PP or PE) and a polyolefin rubber (such as EPM or EPDM), and crystalline parts of the
segments phase separate, forming physical crosslinks that leads to a overall thermoplas-
tic elastomer characteristics. Miscibility of the phases enhances the co-crystallization
of the components [11], which plays a role in the morphology and properties of the
resultant blend. In industry, blends are partially cured for better durability.
Thermoplastic vulcanizates (TPE-V), which is a TPE blend dynamically vulcan-
ized during the compounding step. The resultant material is a crosslinked rubber
dispersed in a thermoplastic matrix. Vulcanization is generally done due to the low
tensile strength and oil resistance of the elastomer phase [12]. The classes of TPE
blends have no strict distinction. While there are simple blends of elastomers and ther-
moplastics, there are blends composed of copolymers, which used singularly as a TPE,
with thermoplastics and elastomers, to enhance the compatibility of the elastomer and
thermoplastic phases [13], or altering the morphology and properties of the TPE block
copolymer [14].
The other four types of TPEs are block copolymers exhibiting phase separation.
In industry, TPEs with block copolymer topology are being produced either via step-
growth polymerization (thermoplastic polyurethanes (TPE-U), polyesters (TPE-E) and
polyamides (TPE-A)) or anionic polymerization (styrenic TPEs, TPE-S).
In step-growth polymerization, segmented block copolymers are formed where the
hard segment is crystallisable and provides the driving force for the phase separation
[15]. The constitution of the segments are well-defined, however the D of the resultant
polymer is 2.0, which is typical in step-growth polymerization. Additionally, due to the
nature of step-growth polymerization, high molar masses can only be reached at high
10

1.2 CRP in Macromolecular Architecture
conversions. Therefore, the synthesis of TPEs are done in two steps, where first the α,ω-
di-functional oligomers are synthesized as a precursor of the blocks and block copolymer
is synthesized by the polycondensation of the oligomers [16]. This two-step process leads
to longer segments which would exhibit explicit crystallization. Production of TPEs via
step-growth polymerization is generally done in bulk, which needs high temperatures to
maintain the homogeneity of the reaction. These two requirements induce side reactions
throughout the polymerization process and lead to crosslinking/degradation [17].
Anionic polymerization is a living polymerization process. Polymers synthesized
via anionic polymerization have a D close to 1.0. The polymerization proceeds with
no termination until all the monomer is consumed. This feature provides the ability to
tune the properties of the material precisely by tuning the molar mass. The resultant
polymer can be further end-functionalized and copolymers with different topologies can
be achieved with various coupling techniques [18]. Disadvantage of such a technique
is the fact that water, oxygen and CO2 should be totally excluded from the reaction
environment. Trace amounts of those impurities lead to termination. This weakness of
anionic polymerization limits the industrial applications that requires robustness.
1.2 CRP in Macromolecular Architecture
Controlled radical polymerization (CRP) is the most recent development for synthe-
sizing well defined polymers with low D values and high degrees of end-functionality.
Before the CRP methods were invented, the only living polymerization techniques were
ionic polymerizations (living cationic and anionic polymerization). Cationic polymer-
ization was very limited in terms of industrial application due to the hard control and
complexity of the polymerization reaction and very low temperatures needed for ob-
taining polymers with low dispersity [19]. Anionic polymerization is relatively more in-
dustrially applicable, since the reaction conditions are more convenient and controllable
[20] however both polymerization techniques suffer from the high sensitivity towards
water, oxygen and the type of solvent used, which makes the technique weak in terms of
industrial applications. Polycondensation or radical polymerization were widely used in
industrial applications in spite of high dispersities of the resultant polymers. By the in-
troduction of CRP techniques, it became possible to produce well-defined polymers via
fairly robust reaction conditions. There have been different CRP techniques developed
11

1 Introduction
in last decades, which can be divided into three main groups in terms of mechanism,
i.e. atom transfer radical polymerization (ATRP), reversible addition-fragmentation
chain-transfer polymerization (RAFT polymerization) and nitroxide-mediated radical
polymerization (NMP). The mechanism of these reactions will be introduced and dis-
cussed in detail in further chapters.
Since the 1960’s, polymer chemists have been searching for a polymerization tech-
nique that is living/pseudo-living and robust. In 1995, the groups of Matyjaszewski
and Sawamoto, independently reported ATRP, which was the most robust pseudo-
living polymerization reported to that date [21]. This discovery was a major step for
the industrial world as well as the scientific world, which enables the radical polymer-
ization to be controlled and tailored. ATRP works on the basis of a halogen atom
transfer between a growing chain and a metal complex, which makes the growing chain
switch between dormant and active mode, providing uniform growth of the chains.
Eventually, polymers with very low dispersity and high halogen end-functionality are
obtained. There are different ATRP methods serving different options for designing
suitable formulations for a specific application. For instance, reverse ATRP with active
catalysts is suitable for reactions which requires a low reaction temperature such as
emulsion polymerization [22]. Activators regenerated by electron transfer (ARGET)
ATRP serves an easy reaction set-up and low concentrations of metal halide, next to
the possibility of polymerization in presence of air with monomers bearing functions
that are intrinsic reducing agents [23].
RAFT polymerization was discovered as a controlled radical polymerization tech-
nique in 1998. RAFT polymerization can be used with a wide variety of monomers and
reaction conditions, resulting in very low dispersities [24]. RAFT polymerization mech-
anism is based on a conventional radical polymerization, in which the propagation was
controlled by chain transfer agents (CTA). Thiocarbonylthio compounds are generally
used as a CTA, and free radical initiators are used as initiators. Polymers synthe-
sized via RAFT polymerization have high thiocarbonyl thio end-functionality. There
are different types of CTA classified according to the Z substituent of the molecule,
e.g. dithiobenzoates, dithiocarbamates and trithiocarbonates. Each type of CTA has
different chain transfer rates that allow one to adjust the polymerization conditions
according to the reaction temperature, monomer and solvent to be selected [25]. The
rate of the polymerization is also tuned by using different R groups, which play a role in
12

1.2 CRP in Macromolecular Architecture
determining the chain transfer coefficient relative to its stability in the form of a radical
[26]. In this respect, RAFT polymerization is a very versatile CRP technique, which
enables to have a reaction design according to the desired conditions and performance.
NMP has the simplest mechanism among all CRP methods. An alkoxyamine is
used both as a thermal initiator and as ‘capping’ agent. The ‘living’ nature of NMP
reactions is based on ‘persistent radical effect’ concept first proposed by Fischer [27],
on which ATRP is based, as well. The substituents on the alkoxyamine determine
the stability of the nitroxide radical, end-capping the growing polymer chain, and the
alkyl radical, initiating the polymerization, both of which are formed by the homolytic
dissociation of the alkoxyamine.
All three CRP methods performed in this thesis will be introduced and discussed
in detail in the relevant chapters.
Macromolecular architecture and tailoring has found new possibilities by the in-
troduction of CRP methods. Different CRP methods generate different chain-end
functionalities, and with various chemical reactions, it is possible to obtain various
chain-end functionalities that can be used for further polymer-polymer coupling re-
actions, switching polymerization methods for chain extension reactions to synthesize
novel copolymers with various topologies. The combination of different CRP methods
within each other and with robust and efficient chemical reactions allows the polymer
chemist to design almost any macromolecule imaginable. In this respect, one step fur-
ther is made in tailoring macromolecules to answer the needs of developing polymer
technology. However, there is still some way to go for an efficient and sustainable indus-
trial production. In this respect, nature is an excellent model for robust polymerization
techniques that provide monodisperse polymers with perfectly designed architectures.
The very best example of this concept is protein synthesis. Exploring nature’s way of
building macromolecules in an efficient and sustainable manner is the ultimate point of
polymer science. The gap between molecular biology and polymer chemistry is the con-
ditional challenge to overcome the limitation of mimicking/realizing nature in polymer
industry.
1.2.1 Use of CRP methods in TPE synthesis
In academia, many different techniques have been and are still being developed for
the synthesis of thermoplastic elastomers. Synthetic studies associated with TPEs
13

1 Introduction
are based on biodegradable blends or copolymers [28], [29]; copolymers with various
topologies such as star [30], graft [31],[32]; block copolymers synthesized with vari-
ous techniques such as RAFT emulsion polymerization [33]. Multi-block copolymers
produced via polyaddition are investigated in terms of biodegradability in recent years
[34]. Many experimental and theoretical studies are done for the structure-morphology-
property relations of TPEs with various topologies, such as modeling phase separation
behavior of TPEs with non-linear molecular structure, which showed that these non-
linear topologies lead to a better stabilization of spherical and cylindrical phases at high
volume fractions of the hard phase [35]. The mechanical properties of the TPE basi-
cally depend on the strength of the interaction between the two phases and the intrinsic
properties of each phase. The elastomeric phase is expected to have a large elastic de-
formation, while the thermoplastic phase is expected to be sufficiently hard to support
elastic deformation without creep. These parameters are dependent on macromolecular
topology as well as the composition of the segments. Composition of the segments is
one of the key parameters determining the elastic modulus and the temperature win-
dow for the rubbery behavior, due to the fact that it determines the T g and the Tm of
the phases. On the other hand, the topology of the copolymer is the main parameter
determining the properties of the interaction between the soft and the hard phase. A
TPE blend has only physical interaction between the phases, namely entanglements
and van der Waals interactions. Tri-block styrenic TPEs have covalent bonds between
the segments, which is the main reason for its superior properties compared to a blend.
Tri-block TPEs are currently synthesized by anionic polymerization. One of the main
reasons for this preference is the lack of a technique to polymerize olefins and thermo-
plastics in one pot. Polymerization of olefins is not possible via conventional radical
methods, due to poor control of the constitution, which leads to uncontrolled branch-
ing. The only way of using CRP methods on TPE synthesis is to use a pre-synthesized
elastomer and either modify it to a macroinitiator and polymerize the thermoplastic
segment from it, or make copolymers with block or graft topology via polymer-polymer
coupling with a high end-functional thermoplastic polymer. The ultimate properties
are ideally expected to be obtained by tri-/multi-block topology, in which the elastomer
segment is covalently bonded to two thermoplastic segment from both chain-ends. Al-
though the tri-block topology is the best structure for the best properties, due to the
large chain lengths, the melt viscosity of the block copolymer is much higher than the
14

1.2 CRP in Macromolecular Architecture
intrinsic viscosities of the homopolymers constituting the building blocks [10]. This
leads to limitations in the flow process due to high entanglement density per chain and
high order-disorder transition temperatures. The research on TPEs therefore shifted
to graft and star topologies, in which CRP techniques and click reactions are widely
used. While TPEs with star topology can be considered as a bundle of block copoly-
mers, TPEs with graft topology slightly differ from TPEs with block topology. In the
graft topology, hard segments are chemically bonded to the elastomeric main chain as
pendant chains. The graft topology does not significantly change the hydrodynamic
volume of the main chain, which is expected to have no significant effect on viscosity, as
well. In this manner, graft topology could be an alternative to overcome the processing
limitations of TPEs. In Figure 1.5 two cartoons illustrate the TPEs with block and
graft topologies.
HP
SP (M )c
HP
SP
(M )cDE
Figure 1.5: Illustrative comparison of a block and a graft topology - HP: hardphase, SP: soft phase, M c: molar mass between crosslinking points, DE: dangling end
In graft topology, the parameters determining the structure-property relations are
different than those in block-topology. First of all, the M c value changes in conjunction
with the grafting density. Secondly, graft topology results in dangling ends at both sides
of the elastomer main chain. The chain length of the dangling ends is another parameter
that is also related to the grafting density. Thirdly, there is a correlation between
the chain length and the grafting density in terms of weight fraction of the grafted
chains. The weight fraction of the hard segment should not exceed a certain value,
which depends on the interaction parameters of the components, otherwise it leads
to phase inversion. This brings an inverse correlation between the grafting density
15

1 Introduction
and the length of the grafted chain for a certain weight ratios of the components.
The key element in synthesizing TPEs with graft topology is the degree of control
over the resultant structure, namely narrow distribution of the chain lengths and a
minimum fraction of free non-grafted chains. In polymer chemistry, three different
approaches are used for the synthesis of a copolymer with graft topology involving
CRP techniques. First approach is ‘grafting through’, in which a mixture of monomers
and macromonomers are copolymerized in one pot. Monomers constitute the main
chain and the macromonomers constitute the grafting chains. Second approach is
called ‘grafting onto’, in which the main chain with pendant functions and grafting
chains with end-functionalities are synthesized separately and conjugated via coupling
reactions. The third approach is called ‘grafting from’, in which the main chain polymer
is employed as a macroinitiator and the monomer is polymerized from the initiating
pendant functions, constituting the grafting chains. All three grafting approaches are
illustrated in Figure 1.6
( a )
( c )
( b )
Figure 1.6: Grafting reactions - (a) grafting onto, (b) grafting from, (c) graftingthrough
In this thesis, ‘grafting onto’ and ‘grafting from’ approaches are investigated. ‘Graft-
ing through’ is not an option, since copolymerization of olefins with thermoplastic
macromonomers via CRP techniques or conventional free radical methods is not cur-
rently possible, as explained above. In the ‘grafting onto’ approach, amine-anhydride
16

1.2 CRP in Macromolecular Architecture
and radical thiol-ene coupling reactions are investigated, to achieve desired thiol and
amine end-functionalities, RAFT polymerization and ARGET ATRP are employed.
ATRP and RAFT polymerization will be introduced and discussed in detail in Chapter
2. The ‘Grafting onto’ approaches by amine-anhydride coupling and radical thiol-ene
coupling are introduced and discussed in Chapter 3 and 4, respectively. In the ‘grafting
from’ approach, NMP is investigated, since this technique has a simple formulation.
This technique will be introduced in Chapter 5, which relates to the synthesis of TPEs
with nitroxide mediated graft polymerization. All synthesized TPEs with graft topol-
ogy are compared in terms of structure-morphology-property relations in Chapter 6.
Outlook and recommendations are given in Chapter 7.
17

1 Introduction
18

Bibliography
[1] K. Fukumori, M. Matsushita, H. Okamoto, and N. Sato. A new material recyclingtechnology for automobile rubber waste. SAE international. 3
[2] R. D. Myers, P. Nicholson, J. B. Macleod, and M. E. Moir. Rubber devulcanizationprocess, February 1997. 3
[3] B. Adhikari, D. De, and S. Maiti. Progress in Polymer Science, 25(7):909 – 948,2000. 3
[4] K. Manfred and E. L. Wittbecker. Polyurethane polymer, February 1961. 3
[5] M. T. Berard, C. A. Daniels, J. W. Summers, and C. E. Wilkes. PVC handbook.Hanser, 2005. 4
[6] A. Tzur, M. Narkis, and A. Siegmann. Journal of Applied Polymer Science,82(3):661–671, 2001. 4
[7] L. Chazeau, J. Y. Cavaill, G. Canova, R. Dendievel, and B. Boutherin. Journal ofApplied Polymer Science, 71(11):1797–1808, 1999. 4
[8] G. Biemond, J. Feijen, and R. Gaymans. Journal of Materials Science, 43:3689–3696, 2008. 6
[9] K. Almdal, J. H. Rosedale, and F. S. Bates. Macromolecules, 23(19):4336–4338,1990. 6
[10] G. Holden, E. T. Bishop, and N. R. Legge. Journal of Polymer Science Part C:Polymer Symposia, 26(1):37–57, 1969. 9, 15
[11] G. Matsuba, K. Shimizu, H. Wang, Z. Wang, and C. C. Han. Polymer, 45(15):5137– 5144, 2004. 10
[12] G. Holden. Thermoplastic Elastomers. John Wiley & Sons, Inc., 2002. 10
[13] C. R. Lindsey, D. R. Paul, and J. W. Barlow. Journal of Applied Polymer Science,26(1):1–8, 1981. 10
[14] D. J. Kinning, K. I. Winey, and E. L. Thomas. Macromolecules, 21(12):3502–3506,1988. 10
19

BIBLIOGRAPHY
[15] B. P. Grady and S. L. Cooper. 13 - thermoplastic elastomers. In Science andTechnology of Rubber, pages 555–617. Academic Press, Burlington, third editionedition, 2005. 10
[16] E. Marchal. Polycondensation Reactions in Thermoplastic Elastomer Chemistry:State of the Art, Trends, and Future Developments, pages 33–73. Wiley-VCHVerlag GmbH & Co. KGaA, 2006. 11
[17] Z. Roslaniec. Polyester Thermoplastic Elastomers: Synthesis, Properties, andSome Applications, pages 75–116. Wiley-VCH Verlag GmbH & Co. KGaA, 2006.11
[18] R. Weidisch, S. P. Gido, D. Uhrig, H. Iatrou, J. Mays, and N. Hadjichristidis.Macromolecules, 34(18):6333–6337, 2001. 11
[19] K. Matyjaszewski and A. H. E. Mller. Controlled and Living Polymerizations FromMechanisms to Applications. Wiley-VCH, 2009. 11
[20] D. Baskaran and A. H. E. Mller. Progress in Polymer Science, 32(2):173–219,2007. 11
[21] J. Wang and K. Matyjaszewski. Journal of the American Chemical Society,117(20):5614–5615, 1995. 12
[22] M. Li and K. Matyjaszewski. Macromolecules, 36(16):6028–6035, 2003. 12
[23] H. Dong and K. Matyjaszewski. Macromolecules, 41(19):6868–6870, 2008. 12
[24] J. Chiefari, Y. K. Chong, F. Ercole, J. Krstina, J. Jeffery, T. P. T. Le, R. T. A.Mayadunne, G. F. Meijs, C. L. Moad, G. Moad, E. Rizzardo, and S. H. Thang.Macromolecules, 31(16):5559–5562, 1998. 12
[25] J. Chiefari, R. T. A. Mayadunne, C. L. Moad, G. Moad, E. Rizzardo, A. Postma,, and S. H. Thang. Macromolecules, 36(7):2273–2283, 2003. 12
[26] Y. K. Chong, J. Krstina, T. P. T. Le, G. Moad, A. Postma, E. Rizzardo, and S. H.Thang. Macromolecules, 36(7):2256–2272, 2003. 13
[27] H. Fischer. Journal of Polymer Science Part A: Polymer Chemistry, 37(13):1885–1901, 1999. 13
[28] L. Wang, Z. Zhang, H. Chen, S. Zhang, and C. Xiong. Journal of Polymer Re-search, 17:77–82, 2010. 14
[29] W. Wang, Y. Guo, and J. U. Otaigbe. Polymer, 51(23):5448 – 5455, 2010. 14
[30] A. Juhari, J. Mosncek, J. A. Yoon, A. Nese, K. Koynov, T. Kowalewski, andK. Matyjaszewski. Polymer, 51(21):4806 – 4813, 2010. 14
[31] D. Uhrig, R. Schlegel, R. Weidisch, and J. Mays. European Polymer Journal,47(4):560 – 568, 2011. 14
[32] T. Fonagy, B. Ivan, and M. Szesztay. Journal of Reinforced Plastics and Compos-ites, 21(15):1411–1419, 2002. 14
20

BIBLIOGRAPHY
[33] Y. Luo, X. Wang, Y. Zhu, B. Li, and S. Zhu. Macromolecules, 43(18):7472–7481,2010. 14
[34] D. Cohn and A. H. Salomon. Biomaterials, 26(15):2297 – 2305, 2005. 14
[35] N. A. Lynd, F. T. Oyerokun, D. L. ODonoghue, D. L. Handlin, and G. H. Fredrick-son. Macromolecules, 43(7):3479–3486, 2010. 14
21

BIBLIOGRAPHY
22

2
Synthesis and End-group
Functionalization of
Thermoplastic Polymers
Abstract
Performance of a macromolecular architecture based on polymer-polymer coupling
is strongly dependent on well-defined building blocks. CRP techniques make it possi-
ble to synthesize a wide range of different types of polymers with low dispersity (D)
and desired chain-end functionality with high yields in a robust way. In this chapter,
the synthesis of two different high T g thermoplastic polymer, polystyrene (PS) and
poly(styrene-alt-N-phenyl maleimide)(P(SMI)) have been described with two different
desired chain end-functionalities, which are thiol and amine moieties. These high T g
polymers have been used further for polymer-polymer coupling studies, which will be
reported in detail in following chapters.
23

2 Synthesis and End-group Functionalization of Thermoplastic Polymers
2.1 Introduction
The most straight-forward way to obtain well-defined amorphous high T g polymers
with high ω- or α- functionality starts with a suitable living radical polymerization tech-
nique. The polymer chain is terminated or initiated by a suitable functionality that, if
necessary, can be converted into the desired end-group. One of the controlled polymer-
ization methods that has been performed in the present study is ARGET ATRP. ATRP
in general provides a ω-halide functionality, which is considered as a good leaving group
for nucleophilic substitution or elimination reactions. Additionally, PS synthesized by
ARGET ATRP has a high chain-end functionality (around 90%), and dispersity of 1.2
for conversions of 40% or higher [1]. All these features make ARGET ATRP products
excellent building blocks for further polymer-polymer coupling reactions.
One of the motivations to choose ARGET ATRP is the fact that the amount of
copper used is much less than the amount used in a conventional ATRP procedure,
which is more environment-friendly and makes the follow-up of the polymerization and
the work-up easier. Secondly, the presence of a reducing agent in excess amount helps
to make the reaction less sensitive to oxygen, which makes the reaction more robust
while resulting in low dispersity and high functionalities.The third motivation for using
ARGET ATRP is that ascorbic acid, which is used as a reducing agent, has a limited
solubility in anisole. This leads to a reduction in propagation rate relative to a solvent
in which the reducing agent would be completely soluble. [2].
The other polymerization technique performed in the current study is RAFT poly-
merization. The motivation for using the RAFT polymerization technique was to be
able to obtain higher ω-thiol functionality, which was only 60% via ARGET ATRP
followed by S -alkylation. RAFT polymerizations performed with CIPDB results in
ω-dithiobenzoate functionality and α-nitrile functionality, which could be transformed
into a thiol via aminolysis and an amine via reduction, respectively. Additionally,
RAFT polymerization is compatible with the maleic anhydride monomer unlike ATRP.
Copolymerization of maleic anhydride with styrene will result in a thermoplastic poly-
mer with a higher T g next to the improved surface adhesion properties thanks to the
anhydride functionalities.
Motivations for postpolymerization reactions described in the literature are gener-
ally polymer-polymer coupling reactions or reinitiation by various types of polymer-
24
2.1 Introduction
izations. Polymer-polymer coupling studies are nowadays often based on robust click
reactions such as Huisgen azide-alkyne 1,3-cycloaddition [3]. The combination of dif-
ferent polymerization methods is studied to utilize the advantages of each technique
such as the synthesis of block copolymers where both blocks require different poly-
merization methods [4] or the synthesis of block or multiarm star copolymers with a
heterogeneous di- or tri- functional CRP initiator without the disadvantage of low yield
end-functionality of the macroinitiator [5]. Both RAFT and ATRP techniques are the
basic tools used intensively for the synthesis of complex macromolecular architectures.
In this study, as indicated above, the CRP methods are used to obtain highly ω- or
α-functional polymers, which will be used as building blocks for coupling reactions on
the way to the synhtesis of TPEs with graft topology. The post-polymerization reac-
tions done on ω-bromide-functional and ω-dithioester-functional polymers were chosen
according to the desired amine and thiol functionality. The minimum number of steps
and maximum conversion yields were sought and the techniques were compared in terms
of these features.
Among all approaches for the synthesis of ω-amine-functional polymers, the first
approach (route 1) was Gabriel synthesis. Gabriel synthesis is named after the German
chemist Siegmund Gabriel who investigated the transformation of halide compounds
to a primary amine by N -alkylation of potassium phthalimide in 1887 [6]. Traditional
Gabriel synthesis compromise a phthalimide salt, which nucleophilicly substitutes or
eliminates the halide moiety followed by the hydrolysis of the phthalimide moiety into
a primary amine by hydrazine. Nucleophiles give more elimination reactions if their
basicity gets stronger or if the nucleophile or the halide compound gets more sterically
hindered. While long alkyl primary halides give high yields of substitution, tertiary
halides give 100% elimination product. The bromide moiety in PS is a secondary halide,
which will result in both elimination and substitution products, which was worth to
investigate quantitatively. The approaches to obtain ω-amine-functional PS primarily
synthesized via ARGET ATRP are shown in Figure 2.1
The second approach (route 2) for the ω-amine functionality was azidation followed
by reduction by LiAlH4 or by a Staudinger reaction. Azidation reactions are known to
be quantitative and easily reduced to an amine by various reducing agents in various
conditions. For instance, lithium aluminum hydride is one of the widely used reducing
agent for azide end-functional PS [7], [8]. In cases where the functional groups on the
25

2 Synthesis and End-group Functionalization of Thermoplastic Polymers
Figure 2.1: Route 1(top), and Route 2 (bottom) for ω-amine-functional PS -Steps are ARGET ATRP of PS followed by gabriel reaction (route 1) or azide route (route2)
polymer are susceptible to be reduced by LiALH4, a milder reducing agent has to be
chosen for the reduction. Triphenylphosphine (P(Ph)3) is a commonly used reducing
agent used in the cases where the LiAlH4 reduction results in side reactions. However,
reduction by P(Ph)3 proceeds in two steps, in which the first step, the formation of
phosphoranimine adduct, is fast; and the second step, the hydrolysis of phosphoran-
imine by water is slow [9]. In this work, LiAlH4 and P(Ph)3 are compared as reducing
agents for the ω-azide-functional PS and P(SMI) in terms of yield and side reactions.
The third approach for the ω-amine functionality was reduction of α-nitrile func-
tionality of PS synthesized via RAFT polymerization. BMS, which is known to be a
mild reducing agent for nitrile groups and a good candidate for the selective reduction
of nitriles in the presence of dithioester, was used for the reduction of nitrile to amine
in PS with ω-dithioester functionality. The reaction was investigated in terms of yield
and side reactions. This route was an opportunity to obtain both thiol and amine
functionality from a single batch, which will have the same molar mass, distribution
and primary functionality, which could be used as constant parameters in the study
of further polymer-polymer coupling reactions. Figure 2.2 shows the reaction steps to
obtain amine end-function on a PS primarily synthesized via RAFT polymerization.
26

2.1 Introduction
Figure 2.2: Route for amine end-functional PS primarily synthesized via RAFTpolymerization - PS with a nitrile moiety is obtained after RAFT polymerization andreduction of nitrile moiety by BMS in an acidic medium
The first approach for the ω-thiol-functional polymers was S -alkylation route fol-
lowing ARGET ATRP. The aim for investigating this route was to be able to obtain
both amine and thiol functionalities from a single batch. S-alkylation of thiourea with
an alkylbromide followed by the cleavage of the formed isothiouronium salt with an
alkali is an indirect method of mercapto-de-halogenation [10]. This reaction is a well
known ancient method for the transformation of halides into thiols. Similar to the
Gabriel synthesis, nucleophilic thiourea attack gives mainly substitution for primary
halides and elimination for sterically hindered halides.
Figure 2.3: Routes for thiol end-functional PS - Aminolysis (top) and S -alkylation(bottom)
As an alternative approach to the S -alkylation, ω-thiol-functional PS and P(SMI)
were synthesized via the aminolysis of the thioester by a primary amine that nucle-
ophilicly substitutes the dithioester. The aminolysis reaction is known to give quan-
titative yields as long as oxidative coupling of thiyl anions is suppressed [11, 12, 13].
Oxidative coupling is prevented by reducing agents such as sodium bisulfate [12], TCEP
27

2 Synthesis and End-group Functionalization of Thermoplastic Polymers
[14] or PBu3 [11]. Reducing agents such as zinc/acetic acid are also used to cleave the
disulfide bonds into thiols as a second step after aminolysis of the thioester moiety [15].
Figure 2.3 shows both of the approaches to obtain an thiol end-functionality in PS.
In this chapter, aiming at the synthesis of well defined high T g thermoplastics with
high amine and thiol end-functionality, different polymerization and post-polymerization
methods were compared in terms of robustness and reaction efficiency.
2.2 Experimental Section
2.2.1 Materials
Styrene (Aldrich, >99%) was vacuum distilled and stored under argon, azobisisobuty-
ronitrile (AIBN, Aldrich) was recrystallized from methanol, tris[2-(dimethylamino)ethyl]
amine (Me6TREN) was synthesized according to the literature [16], N-phenyl maleimide
(MI, Aldrich, 97%), anisole (Aldrich, 99%), toluene (Biosolve, AR), dimethylformamide
(DMF, Biosolve, AR), 1,4-dioxane (Merck, >99%), L-ascorbic acid (Sigma, >99%),
CuBr2 (Aldrich, 99%), ethyl 2-bromoisobutyrate (EBiB, Aldrich, 98%), 1-phenyl ethyl-
bromide (1-PEBr, Aldrich, 97%), thiourea (Aldrich, 99%), potassium phthalimide
(Aldrich, 98%), hydrazine monohydrate (N2H4.H2O, Aldrich, 98%), sodium azide (NaN3,
Aldrich, 99%), lithium aluminium hydride (LiAlH4, Aldrich, 95%), hydrochloric acid
(HCl, Merck, 32% in water), dichloromethane (DCM, Biosolve, AR), methanol (Bio-
solve, AR), ethanol (Biosolve, AR), n-hexane (Biosolve, AR), tetrahydrofuran (THF,
AR, Biosolve) triphenylphosphine [P(Ph)3, Aldrich, 95%], anhydrous magnesium sul-
fate (MgSO4, Sigma, >98%), 2-cyanoprop-2-yl dithiobenzoate (CIPBD, Aldrich, >97%),
cumyl dithiobenzoate (CDB, synthesized by van den Dungen [17]), dimethyl sulfide bo-
rane [BMS, BH3.S(CH3)2, Aldrich, 2 M in THF], ethanolamine (Aldrich, 99.5%), and
tributylphosphine [P(Bu)3, Aldrich, 97%] was used as received.
2.2.2 Methods
Monomer conversion in the polymerization reactions was determined by a GC450
gas chromatograph (Varian) equipped with a CP-Wax 52CB capillary column (length:
25 m; diameter: 0.4 cm) and with a glass PEG pre-column. Injection temperature was
250 ◦C, and detector temperature was 300 ◦C. Analyses were carried out according to
28

2.2 Experimental Section
the following temperature profile: 60 ◦C for 1 min, from 60 ◦C to 100 ◦C with 10 ◦C/min
rate, from 100 ◦C to 210 ◦C with 20 ◦C/min rate, 210 ◦C for 1 min.
The 1H NMR analyses were performed on a Mercury 400, CDCl3 was used as a
solvent for all samples. 10-15 mg of sample was dissolved in 0.8 mL of CDCl3.
Number average molar mass (M n) and dispersity (D) values were measured by
Size Exclusion Chromatography (SEC) on a Waters Alliance system equipped with
a Waters 2695 separation module, a Waters 2414 refractive index detector (35 ◦C), a
Waters 2487 dual absorbance detector, a PSS SDV 5 µm guard column followed by 2
PSS SDV linearXL 5 µm columns (8 mm * 300 mm) in series at 40 ◦C. Tetrahydrofuran
(THF stabilized with BHT, Biosolve) with 1% (v/v) acetic acid was used as eluent at a
flow rate of 1.0 mL/min. The molar masses were calculated with respect to polystyrene
standards (Polymer Laboratories, M p = 580 Da up to M p = 7.1x10⁶ Da). The samples
were dissolved in eluent solution with a concentration of 1 mg/mL and filtered through
a 0.2 µm PTFE filter (13 mm, PP housing, Alltech).
MALDI-TOF-MS analysis were performed on a Voyager DE-STR from Applied
Biosystems equipped with a 337 nm nitrogen laser with an accelerating voltage of 25
kV. The cationizing agent was either silver trifluoroacetate (Aldrich, 98%) or potas-
sium trifluoroacetate (Fluka, >99%). Polymer samples were dissolved in THF with a
concentration of 1 mg/mL. Spectra were acquired in the reflector mode.
2.2.3 Synthesis of PS and P(SMI) with ω-amine Functionality
2.2.3.1 ω-Bromide-functional PS
A dry Schlenk flask was charged with CuBr2 (0.0108 g, 0.0482 mmol) and ascorbic
acid (0.0849 g, 0.482 mmol) and filled by argon gas. In a separate flask, Me6TREN
(0.1109 g, 0.482 mmol) was dissolved in 1-2 mL anisole and added to the reaction
flask. The formation of copper complex was observed by the yellowish green color of
the solution. 15.06 g of monomer (styrene)(0.14 mol) and 14 mL anisole (total solvent
amount was 16.5 mL) were added to the reaction flask and the solution was degassed
for half an hour by bubbling argon through. After degassing ended, the Schlenk flask
was heated up to 90 ◦C in an oil bath. In a separate flask, EBiB (0.94 g, 4.82 mmol) was
weighed and dissolved in 1-2 mL anisole and degassed for half an hour by bubbling argon
through. The initiator solution was injected into the reaction flask. The polymerization
29

2 Synthesis and End-group Functionalization of Thermoplastic Polymers
was allowed to proceed until the desired conversion was reached, and the reaction was
quenched by cooling and exposing the contents of the flask to air. The polmer in the
reaction mixture was precipitated in 160 mL of ethanol, vacuum filtrated, and the
residue was dried overnight under vacuum at 60 ◦C. In necessary cases, product was
purified from residual solvent and monomer by repeating the work-up procedure by
redissolving the polymer in THF.
2.2.3.2 ω-Amine-functional PS
Gabriel Synthesis Route Typically, ω-bromide-functional PS (2.5 g, 0.001 mol)
and potassium phthalimide (1.85 g, 0.01 mol) were dissolved in 10 mL DMF. The
mixture was stirred at 80 ◦C overnight in an argon atmosphere. The reaction mixture
was precipitated in ethanol, filtered, and dried under vacuum at 60 ◦C. The reduction
of ω-phthalimide function into an amine was done as follows: ω-phthalimide-functional
PS (2.5 g, 0.001 mol) was dissolved in 10 mL DMF and hydrazine monohydrate (0.5
g, 0.01 mol) was added. The reaction mixture was degassed with argon for 30 minutes
and heated to 80 ◦C. The mixture was stirred overnight in an argon atmosphere. After
cooling down to ambient temperature, the reaction mixture was treated with HCl to
liberate the amine. The reaction mixture was precipitated in ethanol, filtered, and
dried under vacuum at 60 ◦C.
Azide Route Typically, ω-bromide-functional PS (2.5 g, 0.001 mol) was dissolved
in 10 mL DMF, and sodium azide (130 mg, 0.002 mol) was added to the solution.
The mixture was stirred overnight at room temperature. Formed NaBr salt was fil-
tered, and the filtrate was precipitated in ethanol, vacuum filtered, and the residue
was dried overnight under vacuum at 60 ◦C. The reduction of ω-azide-functional PS
was performed via two different procedures. In the first reduction procedure, 10-fold
excess LiAlH4 (0.4 g) was dispersed in 10 mL dry THF, PS (2.5 g, 0.001 mol) was dis-
solved in 30 mL dry THF, and slowly added to the LiALH4 suspension. The solution
was stirred for 12 hours at room temperature. The excess LiAlH4 was separated by
filtration and the polymer in the filtrate was precipitated in methanol. The polymer
was filtrated and redissolved in DCM. The grey precipitate formed was filtrated over
celite, the filtrate volatiles were evaporated in a rotary evaporator and the residue was
redissolved in CHCl3, precipitated in ethanol and vacuum filtered. The product was
30
2.2 Experimental Section
dried overnight under vacuum at 60 ◦C. In the second reduction procedure, PS (2.5 g,
0.001 mol) was dissolved in 10 mL THF/water mixture (20:1), and next P(Ph)3 (1.31
g, 0.005 mol) was added. The solution was stirred for 24 hours at room temperature
and the volatile content was evaporated in rotary evaporator, the residue was dissolved
in 40 mL toluene/water mixture (1:1), mixed until the layers were clear. The aque-
ous layer was separated and the toluene layer was extracted three times with water
(3x20 mL). The combined toluene solution was dried over MgSO4, concentrated, and
the polymer was precipitated in ethanol and vacuum filtered. The product was dried
overnight under vacuum at 60 ◦C.
2.2.3.3 α-Nitrile-functional PS
A dry Schlenk flask was charged with styrene (10.4 g, 0.1 mol), toluene (8 mL) and
CIPDB (0.44 g, 0.002 mol), and degassed for 30 minutes by bubbling argon through.
The flask was immersed in an oil bath and heated up to 70 ◦C. In a separate flask,
AIBN (0.0656 g, 0.0004 mol) dissolved in toluene (2 mL), degassed for 30 minutes
and injected into the Schlenk flask. The reaction was allowed to proceed until the
desired conversion was reached. The reaction was quenched by cooling and exposing
the content of the flask to air. The product was isolated from the reaction mixture by
precipitation in ethanol, vacuum filtered, and dried overnight under vacuum at 60 ◦C.
2.2.3.4 α-Amine-functional PS
Typically, α-nitrile-functional PS (2.5 g, 0.001 mol) was dissolved in 10 mL THF and
BH3.S(CH3)2 (0.5 mL; 2 M in THF, 0.001 mol) was added. The solution was heated to
reflux for 5 hours. After cooling to ambient temperature, the solution was treated with
1M HCl solution in THF (4 mL), and stirred at ambient temperature for 1 hour. This
step was repeated three times. The solution was concentrated up to 20% solid content,
precipitated in cold ethanol and vacuum filtered. The product was dried overnight
under vacuum at 60 ◦C.
2.2.3.5 ω-Bromide-functional P(SMI)
Copolymerization of styrene and N-phenyl maleimide was performed similarly as
stated in section 2.2.3.1. Styrene and N-phenyl maleimide monomers are used in
equimolar amounts.
31

2 Synthesis and End-group Functionalization of Thermoplastic Polymers
2.2.3.6 ω-Amine-functional P(SMI)
Transformation of the bromide end-group into an amine was done via azide route
followed by the Staudinger reaction as described in subsection 2.2.3.2. Isolation of the
product was done by precipitating the polymer product in n-hexane.
2.2.4 Synthesis of PS and P(SMI) with ω-thiol Functionality
2.2.4.1 ω-Dithioester-functional PS
ω-Dithioester-functional PS was synthesized by RAFT polymerization as described
in section 2.2.3.3.
2.2.4.2 ω-Thiol-functional PS
Aminolysis Route Typically, ω-dithioester-functional PS (2.5 g, 0.001 mol) was
dissolved in 1,4-dioxane (10 mL) in a Schlenk flask, degassed for 30 minutes by argon
bubbling, P(Bu)3 (0.2 g, 0.001 mol) and 2-ethanolamine (0.6 g, 0.01 mol) were simul-
taneously injected into the flask. The solution was stirred at ambient temperature, in
an argon atmosphere for 3 hours. After precipitating in ethanol, and vacuum filtration,
collected product was dried overnight under vacuum at 60 ◦C.
S-alkylation Route Typically, ω-bromide-functional PS (2.5 g, 0.001 mol) and
thiourea (0.77 g, 0.01 mol) were dissolved in DMF (30 mL). The solution was stirred at
100 ◦C for 24 hours. 0.4 g NaOH was dissolved in 3 mL distilled water and added to the
polymer solution. The solution was stirred at 110 ◦C for an additional 24 hours. After
cooling down the reaction mixture, 0.5 mL H2SO4 (95%, 0.01 mol) was dissolved in 2
mL water and added to the reaction mixture and the solution was stirred at ambient
temperature for an additional 5 hours. The product was precipitated in ethanol, and
vacuum filtered. The product was dried overnight under vacuum at 60 ◦C.
2.2.4.3 ω-Dithioester-functional P(SMI)
ω-Dithioester-functional P(SMI) was synthesized by RAFT polymerization as de-
scribed in section 2.2.3.3. 1,4-Dioxane was used instead of toluene.
32

2.3 Results and Discussion
2.2.4.4 ω-Thiol-functional P(SMI)
ω-Thiol-functional P(SMI) was synthesized via aminolysis as described in subsection
2.2.4.2.
2.3 Results and Discussion
2.3.1 ARGET ATRP of Styrene
ARGET ATRP was found to be a robust controlled radical polymerization technique.
The presence of a reducing agent both lowers the oxygen sensitivity of the reaction,
and allows catalytic amount of copper to be used. Secondly, copper(II)bromide used
as a starting compound, is much more stable than copper(I) bromide during storage,
so that the amount of copper to be used efficiently is much precise than the ATRP
systems using copper(I), and makes the preparation steps easier. The mechanism of
ARGET ATRP is illustrated in Figure 2.4
Figure 2.4: Mechanism of ARGET ATRP - (a) activation step in main equilibrium,(b) deactivation step in main equilibrium, (c) propagation, (d) termination, (e) regenerationof Cu(I) activator
Table 2.1 shows results of different batch of ω-bromide-functional PS synthesized
with experimental details. Theoretical M n values are calculated according to the
monomer-to-initiator ratio with the conversion value calculated from the GC mea-
surements. The M n values calculated theoretically, and the values obtained from SEC
and the 1H NMR measurements may be different. There are various reasons for these
differences; emphe.g. low theoretical values with respect to the measured ones may
imply the inefficiency of the initiating step, high theoretical values with respect to the
33

2 Synthesis and End-group Functionalization of Thermoplastic Polymers
measured ones could be thermal initiation. However, the theoretical values calculated
and measured are in rather good agreement with each other.
Lower concentration of active radical chains results in lower D values. The sample
PS4 has a higher D value than the other samples in the table indicating poor control
of the active chains and termination. Kinetic plots of the PS2 and PS4 show that
termination reactions are more significant, and PS4 having higher molar mass shows
higher dispersity. Figure 2.5 shows the ln([M]0/[M]t) vs. time curves of these two
reactions compared with those of the reactions PS8 and PS9.
Table 2.1: ω-bromide-functional PS samples synthesized via ARGET ATRP
Sample [Mon]:[Ini] Time Conversion Initiator M n M n M n Functionality D(h) (%) used (theo) (SEC) (1H NMR) (%)(1H NMR) (SEC)
PS1 30:1 24 60 EBiB 1874 2155 2770 93 1.14PS2 93:1 90 46.5 1-PEBr 5580 5542 7664 90 1.15PS3 30:1 25 53 1-PEBr 1590 1766 2523 94 1.17PS4 207:1 70 56 1-PEBr 12048 11017 13206 76 1.4PS5 48:1 4 34 1-PEBr 1784 1424 1737 90 1.13PS6 96:1 21.5 45 1-PEBr 4500 4396 4083 97 1.11PS7 192:1 21.5 23 1-PEBr 4600 4930 5249 99 1.17PS8 29:1 49 93 EBiB 2842 3317 4155 93 1.13PS9 29:1 49 93 EBiB 2842 2938 3530 90 1.15
All ARGET ATRP reactions are performed with [ini]:[Cu(II)Br2]:[Me6TREN]:[Asc.A.]
of 1 : 0.01 : 0.1 : 0.1. End-functionality yields were calculated according to the ra-
tio of signals of initiating group and signal of the gemini proton next to the bromide
moiety (see Figure 2.1 for structures). Two different ATRP initiators were used in
ARGET ATRP of styrene. One is EBiB, which has a methylene group adjacent to the
ester moiety. Methylene group has a signal at around 3.5 ppm and this signal does
not overlap with any other signals of the polymer. 1-PEBr has a methyl group with
a signal at 1.0 ppm, which is slightly overlapping with the methylene signals of the
main chain. This overlap increases the uncertainity in calculating the extent of func-
tionality and M n values by 1H NMR. The extent of this error depends on the average
chain length of the polymer. For instance, PS5 sample has a lower M n value and in
the 1H NMR spectrum of the sample overlapping is less significant than in the case
of PS6 sample. Nevertheless, integration in the 1H NMR spectra itself has a 5% error
in standard measurements, additionally poor signal to noise ratio in integrating the
signals of end-functionalities and initiating moieties in polymers increases this error.
The results found in the 1H NMR spectra of PS synthesized with 1-PEBr are in 10%
error window that we find adequately accurate. MALDI-TOF measurements show the
34

2.3 Results and Discussion
10 20 30 40 50 60 70 80 90 100
0.25
0.30
0.35
0.40
0.45
0.50
0.55
0.60
0.65
ln([
M] 0
/[M
] t)
time (h)
0.9514
PS2
20 30 40 50 60 70
0.2
0.3
0.4
0.5
0.6
0.7
0.8
0.9
ln([
M] 0
/[M
] t)
time (h)
0.97482
PS4
0 10 20 30 40 50
0.0
0.5
1.0
1.5
2.0
2.5
3.0
ln([
M] 0
/[M
] t)
time (h)
0.98703
PS8
0 10 20 30 40 50
0.0
0.5
1.0
1.5
2.0
2.5
3.0
ln([
M] 0
/[M
] t)
time (h)
0.9989
PS9
Figure 2.5: ln([M]0/[M]t) vs time plots of ARGET ARTP reactions - PS2 (topleft), PS4 (top right), PS8 (bottom left) and PS9 (bottom right) with R2 values of thelinear fits
presence of bromide moiety qualitatively, but MALDI-TOF data is not quantitative
due to the uncontrolled selective ionization of the chains. Therefore, the 1H NMR data
is the most efficient of all possible quantitative characterization methods.
2.3.2 Transformation of Bromide Moiety to Amine in PS
Polymers that are synthesized via ARGET ATRP have a halide moiety as an ω-
function. The polymers synthesized in this study have a bromide moiety. Transfor-
mation of the bromide moiety into an amine was possible via a number of different
approaches. First approach (route 1) was the Gabriel synthesis, i.e. the alkylation of
the bromide function with a phthalimide, followed by the deprotection with hydrazine,
which gives the ω-amine functionality. As an alternative to the Gabriel synthesis, a
second approach (route 2) was followed. This was the azidation of the bromide moi-
ety, followed by the reduction of the azide into an amine. Figure 2.1 is illustrating
both routes performed for the synthesis of amine end-functional PS in the introduction
section.
35

2 Synthesis and End-group Functionalization of Thermoplastic Polymers
In route 1, the reaction products of the transformation of bromide into phthalimide
were found to be 45% ω-phthalimide function and 55% PS with unsaturated end-group,
according to the 1H NMR analysis. The main reason for the low yield was the low
nucleophilic activity of the phthalimide against the secondary alkyl bromide moiety and
the preference of an elimination reaction instead of an SN2 reaction. The competition
between an SN2 and an elimination reaction is affected not only by the position of the
halide, but also by the solvent used in the reaction and by the reaction temperature.
DMF and THF are two solvents, which are suitable for the minimization of elimination
reactions due to their appropriate polarity index values for this reactions. In this study,
DMF was chosen since it has been found to be more efficient for substitution than THF
due to the moderate solubility of potassium phthalimide [18]. Despite the use of DMF,
there is relatively much elimination product, which is probably due to the fact that the
terminal bromide is secondary.
In route 2, bromide functionality of PS that was synthesized with the same ARGET
ATRP procedure, was transformed into an azide, and the azide moiety was reduced to
an amine with a reducing agent where two different reducing agents are comparatively
used. LiAlH4, which is a powerful reducing agent, was used succesfully for the reduction
of azide by Fallais et al. [7]. In addition, the ester moiety of the EBiB initiator present
as an α- function was reduced to an alcohol as a side reaction.
The 1H NMR spectrum of PS-N3 (Figure 2.6), shows the quantitative transforma-
tion of the bromide moiety into azide without any side reactions. In the spectrum
of PS-NH2 that was obtained by the LiAlH4 reduction, reduction of ester moiety was
observed as a side reaction. The signals at 2.9 ppm and 0.6 ppm were assigned to the
reduction product of the initiating ester moiety.
The (partial) reduction of the ester moiety leads to problems in the quantification
of the ω-amine function via 1H NMR due to the disappearance of the shifts of gem-
ini protons adjacent to the ester group, which are labeled in comparative 1H NMR
spectra of PS-N3. Moreover, an α-hydroxy functionality may interfere later on with
the intended amine-anhydride coupling reaction. The solution to the problem could
be either change of the initiator used, or using a milder reducing agent that selectively
reduces the azide function in the presence of an ester moiety. Both approaches were
investigated, since both of them have their own advantages. A milder reducing agent,
P(Ph)3, was studied since the signal of the initiating group, the methylene group on the
36

2.3 Results and Discussion
ppm (t1)1.02.03.04.0
ppm (f1)1.02.03.04.0
(i)
(ii)
a b
c
d
d
e
DMF
Figure 2.6: Comparative 1H NMR spectra of PS-NH2 (i) and PS-N3 (ii) -Signal assignments are as follows: (a) gemini proton adjacent to azide moiety, (b) twogemini protons adjacent to ester moiety (initiating group), (c) two methyl groups adjacentto the ester moiety, (d) two gemini protons adjacent to hydroxy group (reduction productof the ester moiety), (e) two methyl groups of the 2-dimethyl alcohol moiety
37

2 Synthesis and End-group Functionalization of Thermoplastic Polymers
ester moiety, is an isolated chemical shift at 3.6 ppm. Therefore the functionality yield
can be calculated precisely by using EBiB initiator. An alternative initiator, 1-PEBr
was also tried, since the hydrolysis of phosphoranimine was expected to be incomplete.
Another reason to use 1-PEBr as an alternative initiator was the fact that methylene
group on EBiB initiator will not give a significantly separate shift in the intended amine
functional P(SMI) synthesis, since the main chain shifts of P(SMI) copolymer overlap
with the ester methylene shift. Comparative 1H NMR spectra of PS-Br synthesized
with EBiB initiator, its azide and amine end-functional derivatives, and the amine
derivative reacted with trichloroacetyl isocyanate (TAI) are shown in Figure 2.7 with
the corresponding structures and labeled protons. The reduction of azide was done
with P(Ph)3. In spectrum labeled as (iv), there’s seen 3 signals labeled as (e) which
are the aromatic groups of P(Ph)3. Since they have a weaker signal in the spectrum of
PS-NH2, which is labeled as (iii), they are suggested to be nucleophilicly substituted
by excess TAI, while a carbodiimide moiety forms at the ω position of PS, and P(Ph)3
leaves as an oxide [19].
The azide route with P(Ph)3 reduction was also performed with PS-Br that is
synthesized with 1-PEBr. Quantitative yields were obtained for this reaction as well.
SEC measurements have shown that hydrodynamic volume is affected by the mod-
ification of the end-groups, which is observed in the SEC measurements of low molar
mass PS (see Figure 2.8) more significantly compared to relatively high molar mass PS.
In the same figure, the high molar mass shoulder observed in the SEC traces of PS-
NH2 is the product formed during the reduction of the azide moiety by P(Ph)3. The
molar mass of the shoulder is exactly two times of that of the main peak, which implies
the combination of the two functional chain ends. Shoulder formation was observed in
both PS samples prepared by EBiB and 1-PEBr. This phenomenon could be due to the
coupling of two azide functional chains during the transition state that is illustrated in
Figure 2.9.
Two azide functional PS chains conjugate in the presence of a phosphine, where
the phosphine is complexing with azide groups from two PS chains. The transition
states of phosphoranimine formation was described in Leffler and Temple’s work [21].
It is observed that stirring the reaction for a longer time in a THF-water mixture
improves the dissociation of the conjugated chains. Presence of water as a proton source
throughout the reaction was credited to decrease the extent of coupling. Reduction with
38
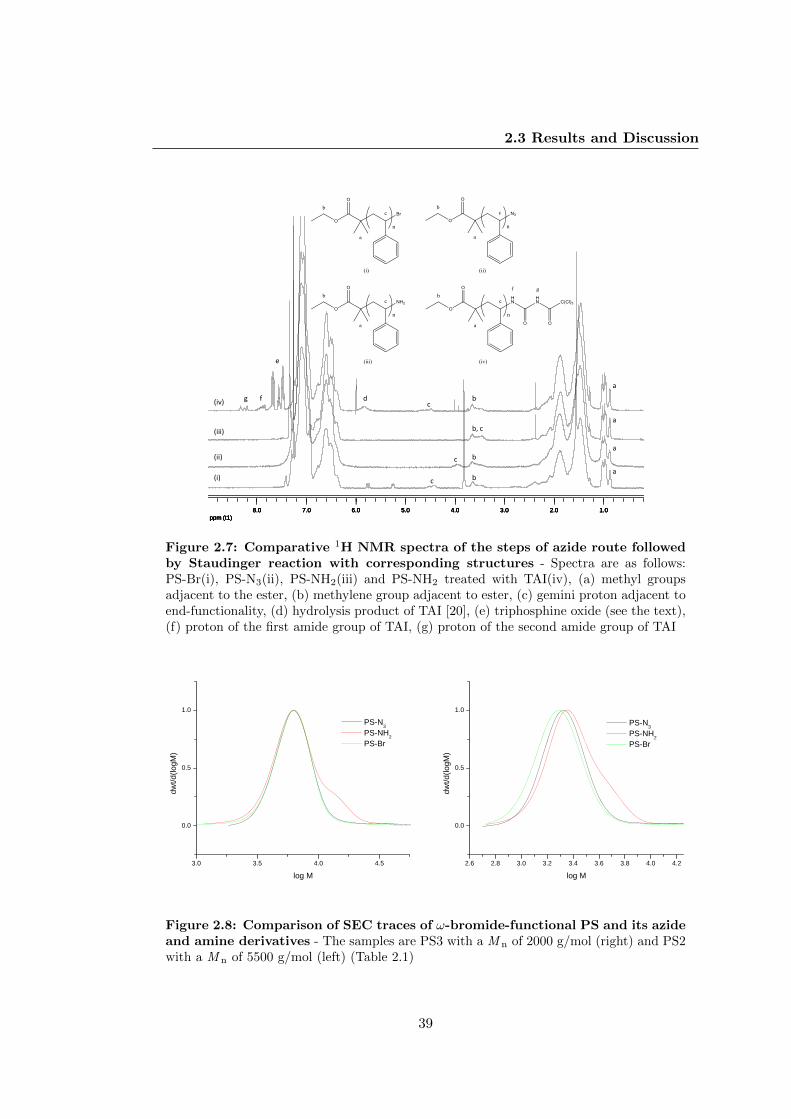
2.3 Results and Discussion
ppm (t1)
1.02.03.04.05.06.07.08.0
ppm (t1)
1.02.03.04.05.06.07.08.0
ppm (t1)
1.02.03.04.05.06.07.08.0
ppm (t1)
1.02.03.04.05.06.07.08.0
a
a
a
a
b
b, c
b
b
c
c
c
d
e
f g
(i)
(ii)
(iii)
(iv)
Figure 2.7: Comparative 1H NMR spectra of the steps of azide route followedby Staudinger reaction with corresponding structures - Spectra are as follows:PS-Br(i), PS-N3(ii), PS-NH2(iii) and PS-NH2 treated with TAI(iv), (a) methyl groupsadjacent to the ester, (b) methylene group adjacent to ester, (c) gemini proton adjacent toend-functionality, (d) hydrolysis product of TAI [20], (e) triphosphine oxide (see the text),(f) proton of the first amide group of TAI, (g) proton of the second amide group of TAI
3.0 3.5 4.0 4.5
0.0
0.5
1.0
dwt/d
(logM
)
log M
PS-N3 PS-NH2 PS-Br
2.6 2.8 3.0 3.2 3.4 3.6 3.8 4.0 4.2
0.0
0.5
1.0
dwt/d
(logM
)
log M
PS-N3 PS-NH2 PS-Br
Figure 2.8: Comparison of SEC traces of ω-bromide-functional PS and its azideand amine derivatives - The samples are PS3 with a M n of 2000 g/mol (right) and PS2with a M n of 5500 g/mol (left) (Table 2.1)
39

2 Synthesis and End-group Functionalization of Thermoplastic Polymers
Figure 2.9: Phosphoranimine formation during azide-phosphine reaction - Illus-tration of the transition states during phosphoranimine formation
LiAlH4 gives quantitative yields as well and no coupling of chains were observed in SEC
measurements. Therefore, ω-amine-functional PS would be preferred to be synthesized
by LiAlH4 reduction due to the disadvantage of problematical hydrolysis step of P(Ph)3
reduction. However, LiAlH4 is a strong reducing agent, which wouldn’t be preferred in
the synthesis of ω-amine-functional P(SMI) that will likely give side reactions with the
imide carbonyls.
2.3.3 Transformation of Bromide Moiety to Thiol in PS
ω-Thiol-functional PS was synthesized from PS-Br synthesized by ARGET ATRP by
S-alkylation of the bromide end-group followed by the hydrolysis of the isothiouronium
salt formed. Yield of the thiol functionality, which was calculated from the 1H NMR
spectrum, was 60%. S-alkylation was complete, but not only the substitution product
formed but also did the elimination product. Hydrolysis of the isothiouronium salt was
not complete and thiouronium moiety was observable both in 1H NMR and MALDI-
TOF-MS analysis. Figure 2.10 shows the comparative the 1H NMR spectra of ω-
bromide-functional PS and ω-thiol-functional PS, where all signals of end-groups are
assigned.
Intended nucleophilic substitution of bromide by thiourea also gives elimination
products due to the secondary bromide moiety at the end of the chain, which is observed
in Gabriel reaction as well, with an adjacent phenyl ring increasing the steric hindrance.
40

2.3 Results and Discussion
ppm (t1)
0.01.02.03.04.05.06.07.08.09.0
ppm (t1)
0.01.02.03.04.05.06.07.08.09.0
d,e
(i)
(ii) a b
c d
f
(i) (ii)
a b
c d
e
f
Figure 2.10: Comparative 1H NMR of PS-Br (i) and PS-SH (ii) - Signal as-signments: (a) acidic protons of amine group of isothiouronium moiety (ii), (b) terminalproton of unsaturated end-group (ii), (c) gemini proton adjacent to bromide moiety (i),(d) methine protons adjacent to ethylester-α function (i,ii), (e) gemini proton adjacent toisothiouronium moiety (ii), (f) gemini proton adjacent to thiol moiety (ii)
41

2 Synthesis and End-group Functionalization of Thermoplastic Polymers
Eventually, modification of the bromine moiety into a thiol in a two-step reaction,
which is a relatively laborious technique with a maximum 60% functionalization yield,
was not sufficiently successful for the utilization of the building blocks synthesized with
this technique further in intended thiol-ene coupling reactions. The synthesis of ω-thiol-
functional PS via aminolysis of dithioester moiety, which would be primarily obtained
by RAFT polymerization, was decided to be investigated as an alternative approach.
2.3.4 RAFT Polymerization of Styrene
PS was synthesized via RAFT polymerization where AIBN has been used as a radical
initiator and dithiobenzoate with a cyanoisopropyl leaving group as a RAFT agent.
This procedure leads to a polymer with a dithiobenzoate moiety as an end-function and
cyanoisopropyl moiety as an initiating function. The main difference between RAFT
polymerization and ATRP in terms of kinetics is the initiation behavior and equilibrium.
The mechanism of RAFT polymerization is shown in Figure 2.11. As shown in this
figure, the initiation is actually the same as the initiation in conventional free radical
polymerization (reaction Ia and Ib). Additional to the conventional initiation, in RAFT
polymerization, the R group on the chain transfer agent (CTA) homolytically cleaves
during chain transfer and reinitiates new chains (reaction IIIb). The amount of CTA
relative to the radical initiator is large, so that the theoretical molar mass is accepted
to be calculated based on the molar ratio of monomer to CTA. This actually means
that the number of chains initiated by radical initiator is negligible relative to the
number of chains initiated by CTA. The conventional initiation continues throughout
the polymerization, which leads to the observation of low molar mass tailing in SEC
analysis. These initiation phenomena leads to higher D values, also due to the non-
stoichiometric amounts of initiating groups and CTA, termination reactions becomes
more significant in longer reaction times at high conversions.
The reason for relatively higher dispersity than a principally expected value are
the relatively large time constants in the pre-equilibrium (IIa and IIb) and the core
equilibrium (IV) between the active propagating radicals and dormant chains as Moad
and coworkers described [22], which inhibits the equal probability for all chains to grow
simultaneously. RAFT polymerization has been chosen for the synthesis of ω-thiol-
functional PS since the hydrolysis of the dithioester to a thiol is the most convenient
way to obtain a high thiol end functionality. Besides, usage of CIPDB as a CTA results
42

2.3 Results and Discussion
Initiator I
I. Initiation
Imonomer
P1
II. Pre-equilibrium
(Ia) (Ib)
Pm
SS
Z
R SS
Z
RPm SS
Z
PmR
RSS
Z
R SS
Z
RR
III. Propagation
(IIa)
(IIb)
Pnmonomer
Pn+1 (IIIa) Rmonomer
P1 (IIIb)
IV. Core equilibrium
Pn
SS
Z
Pm SS
Z
PmPn SS
Z
PnPm
V. Termination
Pn Pm Pn+m (Va) Pn Pm (Vb)Pn Pm
R R R-R (Vc) Pn I Pn (Vd)
Pn R Pn (Ve)
(IV)
Figure 2.11: Fundamental reaction stpes in the RAFT process - (Ia) dissociationof the initiator, (Ib) first monomer addition, (IIa, IIb) initial addition-fragmentation equi-librium, (IIIa) main propagation, (IIIb) reinitiation, (IV) main addition-fragmentationequilibrium, (Va) termination by combination of growing chains, (Vb) termination bydisproportionation of growing chains, (Vc) termination by combination of fragmented Rgroups, (Vd) termination by combination of growing chain and dissociated initiator, (Ve)termination by combination of growing chain and fragmented R group
43

2 Synthesis and End-group Functionalization of Thermoplastic Polymers
in a nitrile-α-functional PS that can be further reduced to an amine function in one
step. Table 2.2 shows the results of different batches of ω-dithioester-functional PS
synthesized.
Table 2.2: ω-dithioester-functional PS samples synthesized via RAFT polymerization
Sample [Mon]:[CTA] Time Conversion M n M n M n Functionality (%) D(h) (%) (theo) (SEC) (1H NMR) (1H NMR) (SEC)
PS1 20:1 7 46 960 1147 1374 75 1.19PS2 20:1 16 32 865 1202 1270 73 1.11PS3 40:1 10 37 1541 2131 2291 68 1.2PS4 96:1 38 41 4100 6585 7123 70 1.25PS5 48:1 46 38 1900 4226 3895 70 1.25PS6 24:1 46 37 925 1892 2228 74 1.17PS7 40:1 29 26 1083 1704 1597 79 1.12PS8 80:1 48 31 2582 3445 3631 74 1.16PS9 160:1 48 35 5832 7105 7285 65 1.21PS10 285:1 40 32 9522 15967 15800 72 1.38PS11 20:1 24 42 874 976 1312 85 1.12
RAFT polymerization has two types of initiation: one is the ”initiation” taking
place by the attack of an initiator-derived primary radical to the monomer and the
other is the ”reinitiation” where the R group of the CTA homolytically cleaves during
the chain transfer and initiates a new chain by attacking to the monomer. These two
different initiation processes produce two different types of polymer one of which is
initiated by the thermal initiator and other is initiated by the CTA. All polymerization
reactions are performed at 70 ◦C at which AIBN has a halflife time of 10 hours. For
the polymerizations in which the reaction time is less than 30 hours, initiation con-
tinues throughout the polymerization by thermally cleaved initiator radical. McLeary
et al. have shown that CIPDB is completely consumed after 50 minutes in styrene
polymerization performed at 70 ◦C with AIBN [23] where the amount of CTA was 8
times of that of AIBN. In this study, the amount of CTA was 5 times that of AIBN,
which means the consumption time should be shorter. This fact implies that at least
70% of the PS chains were formed by reinitiation in all polymerizations performed, and
the rest of the chains were initiated by AIBN. Therefore, measured M n values would
be expected to be lower than the theoretical values. However, calculated theoretical
values are lower than the calculated value from the 1H NMR spectra, implying at first
that the initiation and reinitiation were not efficient. This could be only due to the
impurities present in both CTA and AIBN. The M n values from SEC measurement
were calculated according to PS standards. End-groups affect the retention time, thus
44
2.3 Results and Discussion
influence the M n value. Therefore, a systematic error due to the interaction of chain-
end functionalities with the stationary phase should be taken into account for SEC
measurements. There were no anomalies observed in the SEC traces and D values
were in the expected range for RAFT polymerization of styrene. The kinetic plots of
the reactions with a reaction time longer than 30 hours, in which the AIBN present
in the reaction mixture was mostly consumed (>75%), showed more termination than
the reactions quenched at shorter times. Therefore, it is concluded that CIPDB is not
dynamic enough to maintain a constant radical concentration.
The resulting polymers have 100% nitrile-α function as a result of the nitrile moi-
ety present both in CIPDB and AIBN. Terminal functionality and M n values of the
PS samples were calculated according to the 1H NMR analysis. Dithioester terminal
functionality were calculated according to the ratio of the area of the methyl protons
adjacent to the nitrile-α function (Aα) to the ortho protons of the ω-thiobenzoate func-
tion (Aω). M n values were calculated according to the ratio the area of the aromatic
proton signals of the main chain (Ap), respectively. An example of 1H NMR spectrum
of sample PS7 is shown in Figure 2.12 with integration results of the signals and the
formulas are:
%functionality =Aω/2
Aα/3(2.1)
Mn =Ap/5
Aα/3∗M(styrene) (2.2)
2.3.5 Transformation of Nitrile Moiety into Amine in PS
As stated in the previous subsection, PS synthesized with RAFT polymerization
has a nitrile moiety in the initiating group (α-function). The nitrile function can be
reduced to an amine by BH3.S(CH3)2 (BMS) in one step [24]. The transformation of
the nitrile moiety into an amine (Figure 2.2) was investigated as a third approach to
obtain amine-end-functional PS. This route was an opportunity to obtain an amine
function in a one-step post-polymerization process. Figure 2.13 shows the comparative
1H NMR of nitrile-α-functional PS-RAFT and PS product treated with BMS.
BMS is known to be an effective reducing agent for carboxylic acids, esters, primary
amides and nitriles [25]. Reactivity of BMS towards esters is lower than towards the
45

2 Synthesis and End-group Functionalization of Thermoplastic Polymers
a
b
c
a
b
c
Figure 2.12: 1H NMR spectrum of sample PS7 - (a) ortho protons of the ω-thiobenzoate function (Aω), (b) aromatic protons of the main polymer chain (Ap), (c)methyl protons adjacent to the nitrile-α function (Aα)
ppm (t1)
0.501.001.502.00
ppm (t1)
0.501.001.502.00
a
a b c
(i)
(ii)
a b c
Figure 2.13: Comparative 1H NMR spectra and corresponding structures - (i)nitrile-α-functional PS and (ii) PS reduction product, (a) methyl signals adjacent to nitrile,(b) methyl signals adjacent to imine, (c) methyl signals adjacent to methylamine
46

2.3 Results and Discussion
acids and nitriles. This fact serves the possibility of selective reduction of nitriles in the
presence of dithioesters. Dithioesters are also known to be readily reactive towards both
electrophiles and nucleophiles. However, to the best of the author’s knowledge, there
is no study reported on reduction of dithioesters by BMS in literature. In the study
of reduction of PS-RAFT with a nitrile-α function, BMS reaction followed by an acid
treatment was performed to transform nitrile function into a methyl amine. SEC traces
of reaction samples show that there is shoulder formation. Increase in the molar mass
could imply both disulfide and borazine formation [25]. Disulfide formation should
exactly double the molar mass calculated from SEC measurements, while borazine
forms a three-arm-star structure, which will not be seen as a double or triple molar
mass in SEC traces. The 1H NMR analysis (Figure 2.13) showed that there are amine,
imine and nitrile end-groups and SEC measurements showed that there is an increase
in the molar mass more than a double, which means there is a conjugation between
two or more polymer chains due to complexation between boron and nitrogen and
disulfide formation. Acid treatment did not break the conjugation, which strengthens
the possibility of disulfide formation. Therefore, the reduction of the nitrile moiety was
performed with a PS-SH as well in which the dithioester moiety was already transformed
into thiol by aminolysis. Acid treatment was successful according to SEC traces that are
shown in Figure 2.14. However, after isolation of the product, the 1H NMR spectrum
showed that reduction to an amine was not complete, the signals concerning the imine
moiety were still present. SEC trace of the isolated product showed the remaining
shoulder at higher than a double molar mass, which implies the conjugation remains.
Figure 2.14 shows the effect of acid treatment after the shoulder has formed. Upon
addition of HCl to the reaction, the shoulder is disappearing. The molar mass corre-
sponds of the peaks calculated are around 3000 and 8500, which also implies that there
is a complexation where more than 2 chains are involved.
2.3.6 Transformation of Dithioester Moiety into Thiol in PS
Aminolysis is a type of transesterification reaction where the nucleophilic amine
attacks to the carbonyl of the ester and forms an amide and a primary alcohol by
the migration of one of the acidic protons of the amine. This mechanism works for
thioesters as well. Figure 2.15 illustrates the thiol formation by the aminolysis of a
dithioester.
47

2 Synthesis and End-group Functionalization of Thermoplastic Polymers
2.5 3.0 3.5 4.0 4.5 5.0 5.5
0.0
0.2
0.4
0.6
0.8
1.0
dw
t/d
(lo
gM
)
(no
rma
lize
d)
logM
(a)
(b)
(c)
(d)
Figure 2.14: SEC traces of the follow up of the reduction of the nitrile moietyon PS-SH by BMS - (a)before the acid treatment, (b) after the first HCl addition, (c)after the 2nd HCl addition , (d) after the 3rd HCl addition
S Z
S
R1
R2 NH2S
R1
Z
S
HN
R2
H
R1 SHZ
S
NH
R2
Figure 2.15: Mechanism of aminolysis reaction - The reaction takes place by thenucleophilic substitution of amine with the thiyl group of the thioester
48
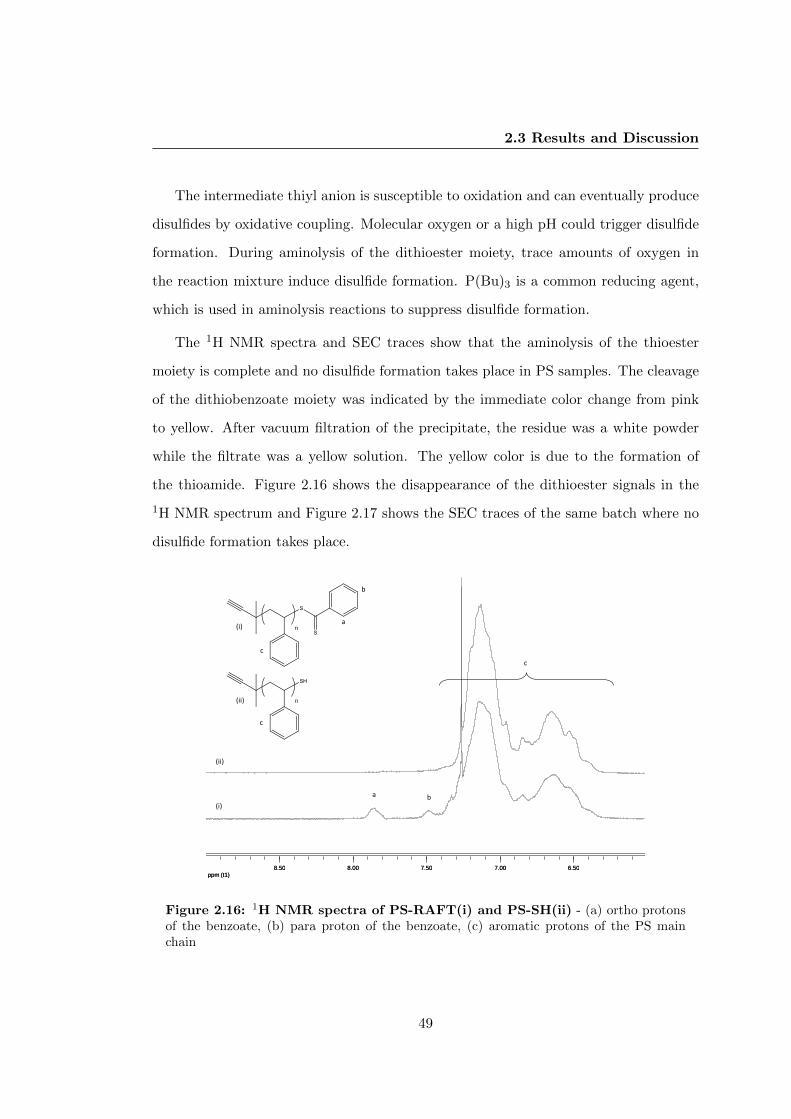
2.3 Results and Discussion
The intermediate thiyl anion is susceptible to oxidation and can eventually produce
disulfides by oxidative coupling. Molecular oxygen or a high pH could trigger disulfide
formation. During aminolysis of the dithioester moiety, trace amounts of oxygen in
the reaction mixture induce disulfide formation. P(Bu)3 is a common reducing agent,
which is used in aminolysis reactions to suppress disulfide formation.
The 1H NMR spectra and SEC traces show that the aminolysis of the thioester
moiety is complete and no disulfide formation takes place in PS samples. The cleavage
of the dithiobenzoate moiety was indicated by the immediate color change from pink
to yellow. After vacuum filtration of the precipitate, the residue was a white powder
while the filtrate was a yellow solution. The yellow color is due to the formation of
the thioamide. Figure 2.16 shows the disappearance of the dithioester signals in the
1H NMR spectrum and Figure 2.17 shows the SEC traces of the same batch where no
disulfide formation takes place.
ppm (t1)6.507.007.508.008.50
ppm (t1)6.507.007.508.008.50
(i)
(ii)
a b
c
(i)
(ii)
a
b
c
c
Figure 2.16: 1H NMR spectra of PS-RAFT(i) and PS-SH(ii) - (a) ortho protonsof the benzoate, (b) para proton of the benzoate, (c) aromatic protons of the PS mainchain
49

2 Synthesis and End-group Functionalization of Thermoplastic Polymers
2.6 2.8 3.0 3.2 3.4 3.6 3.8 4.0
0.0
0.2
0.4
0.6
0.8
1.0d
wt/d
(lo
gM
)
log M
PS-RAFT
PS-SH
Figure 2.17: SEC traces - ω-dithioester-functional PS (black) and ω-thiol-functionalPS (red)
2.3.7 ω-Amine-functional P(SMI)
ω-Amine-functional P(SMI) was synthesized by ARGET ATRP of styrene with N-
phenyl maleimide followed by the transformation of the bromide moiety into an azide
and the reduction of the azide into an amine. In the copolymerization of styrene
and phenyl maleimide, monomers exhibit low reactivity ratios (<<1) due to the charge
transfer complex formation [26]. These two monomers give alternating copolymers even
where non-stoichiometric amounts of monomers are incorporated into the polymeriza-
tion reaction in case of both free radical polymerization conditions [27] and ATRP [28].
Table 2.3 shows two examples of copolymerizations of styrene and N-phenyl maleimide.
P(SMI)1 was synthesized with 10% excess amount of N-phenyl maleimide, and P(SMI)2
was synthesized with 20% excess styrene intending to compare the alternating fashion
by MALDI-TOF-MS. The MALDI-TOF-MS spectrum of P(SMI)1 (Figure 2.18) and
PSMI2 (Figure 2.19) show the constitutional fashion of the repeating units. The sam-
ples were ionized by potassium.
Table 2.3: ω-bromide-functional P(SMI) samples synthesized via ARGET ATRP
Sample [Mon]:[ini] Time Conv. M n M n M n D(h) (%) (theo) (SEC) (MALDI-TOF-MS) (SEC)
P(SMI)1 68:1 2.5 65 6008 6302 6137 1.66P(SMI)2 30:1 4.5 45 2125 1984 3741 1.49
50

2.3 Results and Discussion
799.0 2639.4 4479.8 6320.2 8160.6
Mass (m/z)
0
10
20
30
40
50
60
70
80
90
100
%In
ten
sit
y
1703.2 1708.8
Mass (m/z)
1703.2 1708.8
Mass (m/z)
1368.0 1611.8 1855.6 2099.4 2343.2 2587.0
Mass (m/z)
0
3725.0
0
10
20
30
40
50
60
70
80
90
100
%In
ten
sit
y
4st+
5m
i
5st+
5m
i
5st+
6m
i
7st+
7m
i
6st+
7m
i
6st+
6m
i
1st
1mi
Mass (m/z)
Mass (m/z)
Mass (m/z)
% in
te
nsity
% in
te
nsity
1611.8 1855.6 2099.42343.2
Figure 2.18: MALDI-TOF-MS spectrum of P(SMI)1 - Full spectrum (top), zoomin the region 1400-2600 (bottom left), and the comparison of signal shape of the measuredand calculated (bottom right)
51

2 Synthesis and End-group Functionalization of Thermoplastic Polymers
599.0 2479.4 4359.8 6240.2 8120.6 10001.0
Mass (m/z)
0
4007.0
0
10
20
30
40
50
60
70
80
90
100
%In
ten
sit
y
1422.2 1426.4 1430.6
Mass (m/z)
1422.2 1426.4 1430.6
Mass (m/z)
1360.0 1613.2 1866.4 2119.6 2372.8 2626.0
Mass (m/z)
0
4007.0
0
10
20
30
40
50
60
70
80
90
100
%In
en
sit
y
4st+
5m
i
5st+
5m
i
5st+
6m
i
6st+
6m
i
Mass(m/z)
% intensity
% intensity
Mass(m/z)Mass(m/z)
1613.2 1866.4 2119.6 2372.8
Figure 2.19: MALDI-TOF-MS spectrum of P(SMI)2 - Full spectrum (top), zoomin the region 1400-2600 (bottom left), and the comparison of signal shape of the measuredand calculated (bottom right)
The MALDI-TOF-MS spectra of both P(SMI)1 and P(SMI)2 show an alternating
fashion. In figures 2.18 and 2.19, the repeating units are shown. While the intensity
of the signals of perfectly alternating chains is the largest, the signals of the diads of
styrene or maleimide units are also present with a much lower prevalency. However,
there are no signals of chains in which there are two styrene or MI units more than the
other. These results are in agreement with the literature concerning the domination of
alternating fashion in non-stoichiometric feed of monomers [27] [28].
The bromide end-group ofthe polymer dissociates during the ionization, signals
showing up in the spectra of the P(SMI) samples are assigned to the chains with unsat-
urated ends. There is a distribution observed in the spectrum where the bromide end
group was not dissociated. None of the applied analysis methods could quantitatively
indicate the extent of end-functionality of the synthesized P(SMI) samples. FTIR could
be a method to quantitatively measure the extent of desired end functionality. How-
ever, the exact molar mass is not known, therefore the value found from FTIR analysis
would not be more than a rough estimate. The 1H NMR gives a rough implication of
the functionality yield, since the shift of the gemini proton of the bromide moiety is
52

2.3 Results and Discussion
visible.
From the procedures applied to the bromide-end function in PS, shown in Figure
2.1, azide route followed by P(Ph)3 reduction, which gave the highest yield, was also
applied for the transformation of bromide-end functionality in P(SMI) into an amine.
The first step, which is the transformation from bromide to an azide was successful
according to the 1H NMR measurements. A color change was observed during the
reaction, which may imply the interaction of NaN3 with the imide ring carboxyl groups.
No coupling was observed in SEC measurements. Reduction of the azide into an amine
was performed with P(Ph)3. Reduction with LiAlH4 was not performed since LiAlH4
is known to be a strong reducing agent that will reduce any type of carbonyl group
and also imides [29]. Reduction was done by Staudinger reaction. The first part of the
procedure was the same as the reduction of PS, however the separation of phosphine
oxide and the polymer product was not possible by extraction using a toluene-water
mixture. P(SMI) does not dissolve in toluene. The isolation of the product was done
by precipitation in n-hexane. Amine functionality was observed in the 1H NMR as
well as in MALDI-TOF-MS spectra. Comparison of 1H NMR signals of different ω-
functionalities of P(SMI) is shown in Figure 2.20. Calculated amine functionality yield
from the 1H NMR spectrum was 56%. SEC traces showed no high molar mass shoulder.
2.3.8 ω-Thiol-functional P(SMI)
One of the motivations to investigate the RAFT polymerization route was the syn-
thesis of P(SMA) copolymer. However, due to the failures in post-polymerization
reactions, the P(SMA) route was totally left. Instead of anhydride, a more stable,
resistant group against nucleophilic attacks but still with a high T g, MI was chosen for
the copolymerization studies.
RAFT copolymerization of styrene and MI showed a higher propagation rate than
the homopolymerization of PS. A coversion higher than 60% was reached in three
hours. Table 2.4 shows the reaction parameters and the characterization results of
RAFT polymerization of P(SMI). The molar ratio of monomer to CTA was given
according to the total monomer amount of styrene and MI. The molar mass of the
copolymers was measured by SEC and MALDI-TOF-MS. The real molar mass of the
copolymer was measurable neither by 1H NMR due to the overlapping of the methyl
53

2 Synthesis and End-group Functionalization of Thermoplastic Polymers
ppm (t1)4.505.005.50
ppm (t1)4.505.005.50
ppm (t1)4.505.005.50
ppm (t1)4.505.005.50
a
a b
b
c
c
(i)
(i) (ii)
(ii)
(iii)
(iii)
(iv)
(iv)
Figure 2.20: 1H NMR signals of different ω- functionalities of P(SMI) -(i) ω-bromide-functional P(SMI), (ii)ω-azide-functional P(SMI), (iii) ω-amine-functionalP(SMI), ω-amine-functional P(SMI) reacted with TAI
54

2.3 Results and Discussion
peaks of the initiating function with the main chain methylene signals, nor by SEC due
to the calibration settings according to PS standards. However, MALDI-TOF-MS gave
an indication for the real molar mass, which could be compared with SEC results and
theoretical values. Although, the mass discrimination is a reality in MALDI-TOF-MS
analysis, there is a general agreement that MALDI average molar masses are accurate
for samples with low dispersity [30]. MALDI-TOF additionally gives an qualitative
information about the end groups and the topology of the chain.
Table 2.4: ω-dithioester-functional P(SMI) samples synthesized via RAFT polymerization
Sample [Mon]:[CTA] Time Conv. M n M n M n D(h) (%) (theo) (SEC) (MALDI-TOF-MS) (SEC)
P(SMI)3 22:1 3 67 4525 3374 5063 1.17P(SMI)4 100:1 3 61 11092 5746 9478 1.21
P(SMI)3 has been synthesized with 20 molar % excess styrene, and P(SMI)4 has
been synthesized with equimolar amounts of styrene and N-phenyl maleimide. Con-
stitutional analysis was done by MALDI-TOF-MS measurements. P(SMI)3 was syn-
thesized with CIPDB. In P(SMI)3, the dithioester end-functionality dissociated during
the MALDI-TOF-MS analysis and the spectrum of hydrogen-terminated product was
observed. However, there was another distribution observed, which complicated the
spectrum. Different distributions hamper the correct analysis for the constitutional
structure of the copolymer. P(SMI)4 was synthesized with CDB which was used as a
CTA. In MALDI TOF MS analysis, P(SMI)4 sample has also shown different distribu-
tions with signals overlapping each other. In this sample, the distributions were also
due to chains initiated separately by AIBN and CTA. Despite the fact that it was pos-
sible to follow the alternating chains in the spectrum, the effect of non-stoichiometric
monomer feed on the constitution of the chains was not clearly detectable. Figure
2.21 shows the MALDI-TOF-MS analysis results of the P(SMI)3. The molar mass of
this polymer was low enough to observe the overlapping peaks more clearly. Addition-
ally, the initiating group on AIBN and CTA were the same, decreasing the number of
distributions due to different end groups.
The distributions due to different end groups were concluded to be due to poor ion-
ization of dithioester moiety and producing different types of end functionalities during
the MALDI-TOF-MS measurements. In Figure 2.21, the calculated peak compared to
55

2 Synthesis and End-group Functionalization of Thermoplastic Polymers
799.0 2639.4 4479.8 6320.2 8160.6 10001.0
Mass (m/z)
0
3340.0
0
10
20
30
40
50
60
70
80
90
100
2478.2 2483.8
Mass (m/z)
2478.2 2483.8
3228 3423 3618 3813 4008 4203
Mass (m/z)
0
3306.1
0
10
20
30
40
50
60
70
80
90
100
1st
1mi
Mass (m/z)
% in
ten
sit
y%
inte
nsit
y
Figure 2.21: MALDI-TOF-MS spectrum of P(SMI)3 - Full spectrum (top), zoomin the region 3200-4200 (bottom left), and the comparison of signal shape of the measuredand calculated (bottom right)
56

2.3 Results and Discussion
measured one was for the chain with a dithiobenzoate moiety. However, that calculated
fraction is not the prevalent fraction.
The ratio of the areas of main chain methylenes and aromatics in the 1H NMR
spectrum gives an indication about the composition of the polymer chain. Spectra of
both P(SMI)3 and P(SMI)4 showed stoichiometric amounts of styrene and N-phenyl
maleimide. MALDI-TOF-MS measurements also gave an indication that not more than
2 sequential repeating units of the same monomer are present. This observation implies
that nonstoichiometric feed of the comonomers result in prevalent alternating fashion
also in RAFT copolymerization of styrene with N-phenyl maleimide.
The M n values obtained from MALDI-TOF-MS analyses were compared with the
values calculated from 1H NMR according to the dithioester moiety. By this compar-
ison, rough estimation of end-functionalities was done. 80% dithioester functionality
was calculated for P(SMI)3 and 76% functionality was calculated for P(SMI)4.
ppm (t1)
6.006.507.007.508.008.50ppm (t1)
6.006.507.007.508.008.50
(i)
(ii)
a
b
c
(ii)
(i)
b
c
c
a
Figure 2.22: 1H NMR of P(SMI)3 (ii) and its reduction product after aminol-ysis (i) - (a) ortho protons of thiobenzoate, (b) para proton of thiobenzoate, (c) aromaticgroups of the main chain
Copolymers of styrene with maleic anhydride could be synthesized via RAFT poly-
merization. However, aminolysis reaction in this copolymer is not suitable due to
the high electrophilic nature of the anhydride groups. Maleimides do not react with
57

2 Synthesis and End-group Functionalization of Thermoplastic Polymers
amines which makes the aminolysis reaction possible for the end-group modification of
maleimide copolymers synthesized via RAFT polymerization.
The procedure for the aminolysis of dithioester moiety into a thiol in PS has been
performed for ω-dithioester-functional P(SMI) as well. The product has been charac-
terized by 1H NMR, and it is observed that the signals that correspond to the aromatic
protons of the dithioester moiety have disappeared. SEC traces showed slight high
molar mass shoulder which implies that there is some disulfide formation. Deconvolu-
tion of the peaks showed that around 8% of the chains are terminated by coupling in
both samples. Figure 2.22 shows 1H NMR characteristic peaks of P(SMI)-RAFT and
P(SMI)-SH. Signals of protons of thiobenzoate group in ortho and para positions have
disappeared in the aminolyzed sample.
2.4 Conclusions
Among all approaches on the way of obtaining well-defined, highly functional high T g
thermoplastic polymers with a thiol moiety, the RAFT polymerization route followed
by aminolysis has been found to be the most effective for the synthesis of ω-thiol-
functional PS. RAFT polymerization followed by the aminolysis has milder reaction
conditions, shorter reaction time and higher end-function purity compared to the S-
alkylation route. ARGET ATRP followed by the azide route and LiALH4 reduction
is the most efficient route for the PS synthesized with 1-PEBr initiator in order to
have the highest functionality and for preventing further potential side reactions in
amine-anhydride coupling reactions. The staudinger reaction should be preferred for
the ω-amine-functional P(SMI) synthesis due to the side reaction of LiAlH4 with the
imide carbonyls. These well-defined high functional polymer are to be used as building
blocks for the further polymer-polymer coupling reactions on the way of synthesizing
TPEs with graft morphology.
58

Bibliography
[1] W. Jakubowski, B. Kirci-Denizli, R. R. Gil, and K. Matyjaszewski. Macromolec-ular Chemistry and Physics, 209(1):32–39, 2008. 24
[2] K. Min, H. Gao, and K. Matyjaszewski. Macromolecules, 40(6):1789–1791, 2007.24
[3] J. Lutz. Angewandte Chemie International Edition, 46(7):1018–1025, 2007. 25
[4] M. D. Rowe, Brenton A. G. Hammer, and Stephen G. Boyes. Macromolecules,41(12):4147–4157, 2008. 25
[5] C. Celik, G. Hizal, and U. Tunca. Journal of Polymer Science Part A: PolymerChemistry, 41(16):2542–2548, 2003. 25
[6] S. Gabriel. Berichte der deutschen chemischen Gesellschaft, 20(2):2224–2236,1887. 25
[7] I. Fallais, J. Devaux, and R. Jerome. Journal of Polymer Science Part A: PolymerChemistry, 38(9):1618–1629, 2000. 25, 36
[8] J. J. Cernohous, C. W. Macosko, and T. R. Hoye. Macromolecules, 31(12):3759–3763, 1998. 25
[9] J. W. Lee and P. L. Fuchs. Organic Letters, 1(2):179–182, 1999. 26
[10] J. March. Advanced organic chemistry: reactions, mechanisms, and structure.Wiley-Interscience publication. Wiley, 1992. 27
[11] M. Li, P. De, S. R. Gondi, and B. S. Sumerlin. Journal of Polymer Science PartA: Polymer Chemistry, 46(15):5093–5100, 2008. 27, 28
[12] D. L. Patton, M. Mullings, T. Fulghum, and R. C. Advincula. Macromolecules,38(20):8597–8602, 2005. 27
[13] X. Qiu and F. M. Winnik. Macromolecules, 40(4):872–878, 2007. 27
[14] C. W. Scales, A. J. Convertine, and C. L. McCormick. Biomacromolecules,7(5):1389–1392, 2006. 28
[15] Moad G., Y.K. Chong, A. Postma, E. Rizzardo, and S. H. Thang. Polymer,46(19):8458–8468, 2005. 28
59

BIBLIOGRAPHY
[16] G. J. P. Britovsek, J. England, and A. J. P. White. Inorganic Chemistry,44(22):8125–8134, 2005. 28
[17] E. T. A. van den Dungen, H. Matahwa, J. B. McLeary, R. D. Sanderson,and B. Klumperman. Journal of Polymer Science Part A: Polymer Chemistry,46(7):2500–2509, 2008. 28
[18] M. S. Gibson and R. W. Bradshaw. Angewandte Chemie International Edition inEnglish, 7(12):919–930, 1968. 36
[19] H. Staudinger and Jules Meyer. Helvetica Chimica Acta, 2(1):635–646, 1919. 38
[20] A. Postma, T. P. Davis, G. Moad, and M. S. O’Shea. Reactive and FunctionalPolymers, 66(1):137 – 147, 2006. 39
[21] J. E. Leffler and R. D. Temple. Journal of the American Chemical Society,89(20):5235–5246, 1967. 38
[22] G. Moad, E. Rizzardo, and S. H. Thang. Australian Journal of Chemistry,58(6):379, 2005. 42
[23] J. B. McLeary, F. M. Calitz, J. M. McKenzie, M. P. Tonge, R. D. Sanderson, andB. Klumperman. Macromolecules, 37(7):2383–2394, 2004. 44
[24] B. H. Kaae, K. Harpsoe, J. S. Kastrup, A. C. Sanz, D. S. Pickering, B. Metzler,R. P. Clausen, M. Gajhede, P. Sauerberg, T. Liljefors, and U. Madsen. Chemistry& Biology, 14(11):1294 – 1303, 2007. 45
[25] Herbert C. Brown, Yong Moon Choi, and S. Narasimhan. The Journal of OrganicChemistry, 47(16):3153–3163, 1982. 45, 47
[26] H. Cheng, G. Zhao, and D. Yan. Journal of Polymer Science Part A: PolymerChemistry, 30(10):2181–2185, 1992. 50
[27] S. Iwatsuki, M. Kubo, M. Wakita, Y. Matsui, and H. Kanoh. Macromolecules,24(18):5009–5014, 1991. 50, 52
[28] G. Chen, Z. Wu, J. Wu, Z. Li, and F. Li. Macromolecules, 33(2):232–234, 2000.50, 52
[29] M. S. B. Nayar and P. S. Callery. The Journal of Organic Chemistry, 46(5):1044–1045, 1981. 53
[30] S. D. Hanton. Chemical Reviews, 101(2):527–570, 2001. 55
60

3
Thermoplastic Elastomers via
Amine-Anhydride Coupling
Abstract
Conversion efficiency is the most important factor in polymer-polymer coupling re-
actions. Ill-defined products are prohibited by high conversions even in stoichiometric
amount of the building blocks. Amine-anhydride coupling reaction between PS and
EPM was found to be highly efficient and robust at a wide variety of reaction parame-
ters. In this chapter, the study on amine-anhydride coupling reaction between ω-amine-
functional thermoplastic polymers (PS and P(SMI)) and maleated ethylene-propylene
copolymer (EPM) will be described and grafting yield results will be discussed with
respect to the various reaction parameters.
61

3 Thermoplastic Elastomers via Amine-Anhydride Coupling
3.1 Introduction
One of the synthesis routes of TPEs with graft morphology is the ‘grafting onto’
approach which is grafting a molecule bearing a suitable function onto a pendant-
functional polymer or a functional surface. The ‘Grafting onto’ approach is used for
making copolymers with brush-/comb-like topologies [1], for modification of a polymer
to alter its properties [2] and for surface modification [3]. Click reactions such as Huis-
gen azide-alkyne 1,3-cycloaddition are widely used in grafting onto reactions. Click
reactions are to give high yields in stoichiometric amounts of components, which leads
to well-defined structures in the synthesis of copolymers via polymer-polymer coupling.
Sharpless et al. state that the formation of an intermolecular C-C bond is much tougher
than the formation of heteroatom bonds. Heteroatom connections with spring-loaded
electron-poor sites are ‘the key elements in a fast, process-driven approach to molec-
ular discovery’ [4]. In this respect, reactions involving heteroatoms such as thiol-ene
coupling and amine-anhydride coupling are promising to be used as highly-efficient cou-
pling reactions. Amine-anhydride coupling is the scope of this chapter, while thiol-ene
coupling will be discussed in Chapter 4.
The coupling reaction between an amine and a cyclic anhydride is the most common
technique used for reactive compatibilization of blends in the melt. Amine-anhydride
coupling is known to be fast and able to proceed to complete conversion in a homo-
geneous melt. However, graft copolymer formation was found to be slower than the
formation of a block copolymer, and the rates were affected by thermodynamic inter-
actions of the immiscible polymers [5]. The amine-anhydride reaction is known to be
not diffusion controlled for homogeneous reactions [6], which is potentially promising
for high yields in heterogeneous reactions.
In polymer-polymer coupling reactions in general, physical parameters such as solu-
tion viscosity and miscibility of the polymers are the main factors affecting the coupling
yield. Polymer-polymer coupling reactions require special attention for one of these
physical aspects, which is miscibility or entropy of mixing. No matter how efficient
and robust a coupling reaction is, miscibility of the components plays the main role in
polymer-polymer coupling. Mixtures of incompatible polymers exhibit phase separa-
tion. Phase separation occurs in order to minimize the contact area between the two
components. Miscibility of two components can be predicted from the Gibbs energy of
62

3.1 Introduction
mixing (∆Gmix), which is formulated by the Equation 3.1:
∆Gmix = ∆Hmix − T∆Smix (3.1)
where ∆Hmix and ∆Smix are enthalpy and entropy of mixing, respectively at a
temperature T. If only ∆Gmix<0 and second derivative of ∆Gmix value with respect
to the composition is positive, the mixing is favorable. To achieve ∆Gmix<0, entropic
term should be larger than the enthalpic term. The most relevant explanation of the
entropy and the enthalpy of polymer mixtures is expressed in the Flory-Huggins theory.
Flory-Huggins equation can be expressed as shown in equation 3.2 [7]:
∆GmixRT
=φ1
r1lnφ1 +
φ2
r2lnφ2 + χFHφ1φ2 (3.2)
where φ1 and φ2 are the volume fractions and r1 and r2 are the relative molar
volumes of polymer 1 and polymer 2, respectively; where r1 is equal to 1 for a solvent,
χFH is the Flory-Huggins interaction parameter, R is the gas constant and T is the
absolute temperature. The first two terms in the equation are related to the entropy of
mixing and the last element is related to the enthalpy of mixing. The entropic element
of the equation simply states that entropy of mixing decreases with an increase in the
molar mass. In the enthalpic element, the χFH term is a material-specific parameter
which is dependent on temperature and concentration [7]. In the melt, PB is immiscible
with PS or P(SMI). The use of a common solvent overcomes this phase separation
barrier, by adding a third component in the Flory-Huggins theory, with r1 = 1, which
dramatically increases the value of the entropic element and shifts the Gibbs free energy
to a negative value.
Swelling and solubility properties of the components is another factor affecting the
miscibility. The dissolution process of a polymer is described by two steps. The first
step is swelling, where the solvent or any low molar mass compound diffuses through the
chains and forms a polymer gel. If the amount of solvent is large enough, the swelling
continues and at a point, solvent molecules surround the whole chain and disentangle-
ment starts. The polymer dissolves completely when there are no more entanglements
among the chains. Molar mass of a polymer has an effect on the dissolution process
of the polymer in a medium. A higher molar mass means a larger number of entan-
glements per chain and consequently more solvent is needed to dissolve polymers with
63

3 Thermoplastic Elastomers via Amine-Anhydride Coupling
higher molar masses. The entanglement molar mass (M e), which is the molar mass
between the entanglement points, is an intrinsic property of a polymer. EPM could
be considered to have an approximate entanglement molar mass of 3000 which is the
average between the M e of polypropylene, which is 5000 and polyethylene, which is
1000 [8]. Polymers with low entanglement molar mass require a larger amount of sol-
vent to be fully dissolved. Interactions of amine and anhydride groups may potentially
be affected by the solubility properties of EPM and diffusion phenomena between the
thermoplastic phase and the elastomer phase.
In this chapter, the grafting onto approach was studied within an amine-ω-functional
high T g thermoplastic polymer, namely PS and P(SMI) and anhydride-pendant func-
tional elastomer in terms of amine-anhydride coupling. PS and P(SMI) obtained with
high amine end-functionalities were coupled with EPM elastomer. Molar mass of PS,
molar mass of EPM, weight ratio of the components, reaction concentration, stoichiom-
etry of the functional groups and composition of the grafting polymers were varied.
TPEs obtained were compared in terms of grafting yield and will be compared in terms
of resulting mechanical properties in Chapter 6.
3.2 Experimental Section
3.2.1 Materials
Toluene (Biosolve, AR), tetrahydrofuran (THF, Biosolve, AR) were used as received,
PS-NH2 and P(SMI)-NH2 were synthesized according to the procedures explained in
Chapter 2. Maleated ethylene-propylene copolymers (EPM) with various molar mass
and maleic anhydride content (see Table 3.4) were donated by LANXESS N.V.
3.2.2 Methods
Compositional characterization of the samples was done by Fourier Transform In-
frared Spectroscopy consisting of a Bio-Rad Excalibur FTS3000MX infrared spectrom-
eter with an ATR diamond unit (Golden Gate). The solid samples were pressed onto
the ATR crystal with the help of the pressure handle, 60 scans were made per spectrum
with a resolution of 4 cm−1.
Number average molar mass (M n) and dispersity (D) values were measured by
Size Exclusion Chromatography (SEC) on a Waters Alliance system equipped with
64

3.2 Experimental Section
a Waters 2695 separation module, a Waters 2414 refractive index detector (35 ◦C), a
Waters 2487 dual absorbance detector (254 nm was used), a PSS SDV 5 µm guard
column followed by 2 PSS SDV linearXL 5 µm columns (8 mm * 300 mm) in series
at 40 ◦C. Tetrahydrofuran (THF stabilized with BHT, Biosolve) with 1% (v/v) acetic
acid was used as eluent at a flow rate of 1.0 mL/min. The molar masses were calculated
with respect to polystyrene standards (Polymer Laboratories, M p = 580 Da up to M p
= 7.1x10⁶ Da). The samples were dissolved in eluent solution with a concentration of
1 mg/mL and filtered through a 0.2 µm PTFE filter (13 mm, PP housing, Alltech).
3.2.3 Dehydration of Maleic Acid Pendant-functions on EPM
A Schlenk flask was charged with 1 g of EPM (M n: 50 kg/mol, D: 2.25, 2.1% maleic
anhydride (w/w)), heated up to 150 ◦C in an oil bath, kept under high vacuum for 4
hours.
3.2.4 Amine-anhydride Coupling of EPM and PS-NH2
1 g of dehydrated EPM (0.21 mmol anhydride) was dissolved in 20 mL of PS solution
(1 g, 0.13 mmol amine) in dry toluene and stirred overnight at ambient temperature.
The polymer was precipitated in ethanol, filtered and dried under vacuum at 60 ◦C.
3.2.5 Amine-anhydride Coupling of EPM and P(SMI)-NH2
1 g of dehydrated EPM (0.21 mmol anhydride) was dissolved in 20 mL of P(SMI)
solution (1 g, 0.1 mmol amine) in dry THF and stirred overnight at ambient tempera-
ture. The copolymer was precipitated in ethanol, filtered and dried under vacuum at
60 ◦C.
3.2.6 Dehydration of Amic Acid Function into Imide
A Schlenk flask was charged with 2 g of amine-anhydride reaction product, heated
up to 150 ◦C in an oil bath, and kept under high vacuum for 4 hours.
65
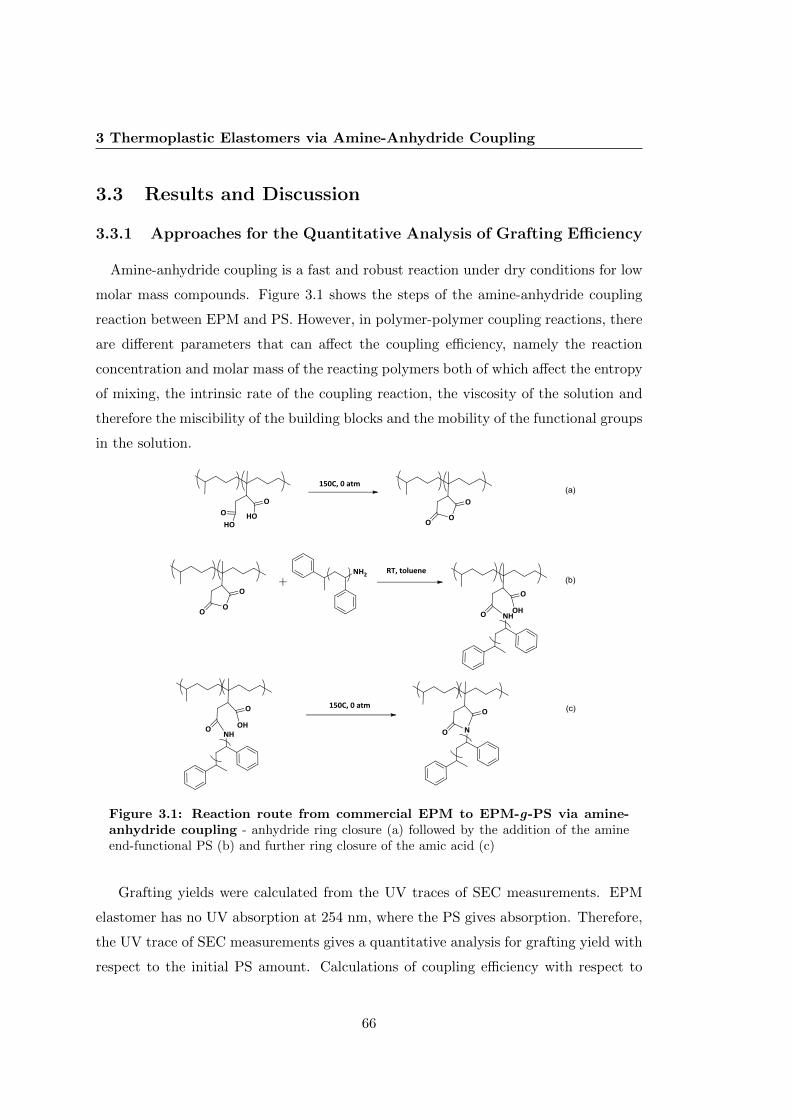
3 Thermoplastic Elastomers via Amine-Anhydride Coupling
3.3 Results and Discussion
3.3.1 Approaches for the Quantitative Analysis of Grafting Efficiency
Amine-anhydride coupling is a fast and robust reaction under dry conditions for low
molar mass compounds. Figure 3.1 shows the steps of the amine-anhydride coupling
reaction between EPM and PS. However, in polymer-polymer coupling reactions, there
are different parameters that can affect the coupling efficiency, namely the reaction
concentration and molar mass of the reacting polymers both of which affect the entropy
of mixing, the intrinsic rate of the coupling reaction, the viscosity of the solution and
therefore the miscibility of the building blocks and the mobility of the functional groups
in the solution.
Figure 3.1: Reaction route from commercial EPM to EPM-g-PS via amine-anhydride coupling - anhydride ring closure (a) followed by the addition of the amineend-functional PS (b) and further ring closure of the amic acid (c)
Grafting yields were calculated from the UV traces of SEC measurements. EPM
elastomer has no UV absorption at 254 nm, where the PS gives absorption. Therefore,
the UV trace of SEC measurements gives a quantitative analysis for grafting yield with
respect to the initial PS amount. Calculations of coupling efficiency with respect to
66

3.3 Results and Discussion
total PS, amine, EPM and anhydride are defined by equations 3.3, 3.4, 3.5, and 3.6,
which are:
CEPS =Ag
Ag +Af(3.3)
CEamine =CEPSf
(3.4)
CEEPM = CEPS ∗ [PS]
Mn(PS)∗ Mn(EPM)
[EPM ](3.5)
CEMAn = CEPS ∗ [PS]
Mn(PS)∗ Mn(MAn)
[MAn](3.6)
where CEPS is the coupling efficiency with respect to total PS amount in the
resultant TPE, CEamine is the coupling efficiency with respect to the amine end-
functionality, CEEPM is the coupling efficiency with respect to the EPM chains, and
CEMAn is the coupling efficiency with respect to the anhydride concentration present in
the solution. Ag is the area of the SEC signal corresponds to the conjugated PS chains,
Af is the area of the SEC signal corresponds to the free PS chains, f is the fraction
of PS chains with a amine functionality, [PS], [amine], [EPM] and [MAn] are the con-
centrations of the PS, amine moiety, EPM and anhydride groups in the corresponding
reactions.
The SEC method is not a sufficient technique to quantify the grafting yield with
respect to elastomer, since the retention times of the grafted and non-grafted elastomer
in RI traces are fairly close, and there is no clear observation of a change in the shape
of the peak. An example of a SEC measurement is shown in Figure 3.2.
Complementary characterization for the modified anhydride units was done by
FTIR. FTIR is a robust method in terms of analyzing the coupling efficiency with
respect to the elastomer. In amine-anhydride coupling, as it is seen in Figure 3.1, the
anhydride ring opens with the nucleophilic attack of the amine and amic acid is formed.
Following ring closure of the amic acid leads to the imide formation.
Infrared absorption frequencies of carboxylic anhydride, amide, acid and imide func-
tional groups are distinguishable in the spectrum. In Table 3.1, assignments of absorp-
tion frequencies of the concerned functional groups are shown.
FTIR measurements were performed by the ATR method. The presence of imide
carbonyl anti-symmetric stretch around 1785 cm−1 supports the SEC data qualitatively.
In Figure 3.3, the formation of an imide is seen while the anhydride units are still present
67

3 Thermoplastic Elastomers via Amine-Anhydride Coupling
14 16 18 20 22
0.00
0.02
0.04n
orm
aliz
ed
UV
sig
na
l (2
54
nm
)
retention time (min)
C124
PS
EPM
Figure 3.2: UV traces of SEC measurements of reactants and the product ofamine-anhydride coupling - EPM and EPM-g-PS (C124, see Table 3.3) samples areboth measured before the ring closure
Table 3.1: Assignment of the IR absorption frequencies of corresponding groups [9]
Wavenumber(cm−1) Assignment1785 maleic anhydride C=O (anti-symmetric stretch)1860 maleic anhydride C=O (symmetric stretch)1725 maleic acid C=O1705 maleimide C=O (anti-symmetric stretch)1770 maleimide C=O (symmetric stretch)1650 amic acid C=O (amide stretch)1720 amic acid C=O(acid stretch)1540 amide N-H (bending)1370 methyl C-H (symmetric deformation)
which implies that the grafting is not complete. Quantitative analysis of the imidization
reaction by FTIR method was done by normalizing the spectra with respect to the
symmetric deformation of pendant methyl groups on elastomeric main chain which
gives an absorption around 1370 cm−1. Decrease in the area of anhydride carbonyl
anti-symmetric stretch absorption was calculated. This data gives an indication of the
grafting yield with respect to the elastomeric building block.
Both SEC and FTIR are not sufficient to analyze the grafting efficiency quanti-
tatively with respect to the elastomer, since the anhydride functionality is randomly
distributed on the EPM main chain. Quantitative analysis of non-grafted elastomer
needs to be done by a chromatographic technique. Although, the separation of func-
tional and non-functional chains of EPM was successful by the GPEC method [10],
the separation of functional non-grafted EPM chains and grafted EPM chains was not
68

3.3 Results and Discussion
1300 1400 1500 1600 1700 1800
CH2 + CH
3
CH3
aromatic C=Cimide anhydride
wavenumber (cm-1)
EPM-g-MA
EPM-g-MAn
EPM-g-PS
acid
Figure 3.3: Comparison of neat EPM (maleic acid pendant function), EPM-MAn (maleic anhydride pendant function), and EPM-g-PS (PS grafted EPM- The spectra are shifted vertically for clarity, and characteristic peaks are labeled
achieved. Therefore the results will not be discussed here.
3.3.2 Effect of Molar Mass of Building Blocks
3.3.2.1 Molar Mass of the Grafting Chain
PS-NH2 homopolymer has been synthesized in different molar masses for the utiliza-
tion in amine-anhydride coupling reactions. The details of the synthesis were discussed
in Chapter 2. Table 3.2 shows the list of the PS-NH2 samples with characterization
data.
Table 3.2: ω-amine functional PS utilized in amine-anhydride coupling reactions
Sample % f M n D(SEC) (SEC)
PS117 82 2,000 1.26PS123 78 5,800 1.25PS124 75 2,300 1.3PS137A 60 10,000 1.2PS137B 82 10,000 1.4PS148 24 4,800 1.26
Table 3.3 shows a list of coupling reactions between EPM and PS performed by
varying the molar mass of PS, solid content, and weight ratio of the reactants.
69

3 Thermoplastic Elastomers via Amine-Anhydride Coupling
Table 3.3: A set of PS-EPM coupling reactions at varying reaction parameters
Sample solid content [MAn]/[NH2] EPM/PS M n PS CEamine CEEPM
(g/100 mL solvent) (w/w) (SEC) (%) (%)C101 5 1:1.8 1 2000 69 1200C125 10 1:0.6 1 5800 89 577C128 10 1:0.2 2 10000 90 179C104 20 1:0.3 2 5800 100 326C118 20 1:0.14 2 10000 63 92C105 17 1:0.16 4 5800 93 152C106 16 1:0.3 5 2300 100 343C107 15 1:0.17 9 2300 100 177C108 10 1:0.17 9 2300 87 150C123 13 1:0.07 9 5800 70 50C119 20 1:0.07 4 10000 25 19C122 10 1:0.1 3 10000 50 50C124 13 1:0.8 2 2300 83 709C130 10 1:0.04 9 10000 68 31
Increasing PS molar mass would be expected to result in lower coupling yields un-
der constant solid content and constant weight ratio of PS to EPM. However, variation
in the molar mass of PS while keeping the solid content and weight ratio of the reac-
tants constant, varies the stoichiometric ratio of amine to anhydride functionalities. A
comparison of the samples C125 and C128, where the solution concentration is rela-
tively low diminishing the effect of the viscosity, shows that high molar mass PS and
low molar mass PS possess nearly the same coupling efficiency. This implies that, the
other parameters such as stoichiometry of reactants and solution concentration could
be more significant than the molar mass of the thermoplastic polymer grafting onto the
elastomer.
Figure 3.4 represents the coupling efficiencies of the reactions as a function of EPM
concentration for different PS molar masses. The results imply that increasing the
EPM concentration, decreases the coupling efficiency of high molar mass PS. This is
valid for the PS with 10 kg/mol molar mass, however this was not seen for the PS with
5 kg/mol molar mass. It could be claimed that while the miscibility was sufficient even
in high concentrations of EPM for the 5 kg/mol PS, for the 10 kg/mol PS entropy of
mixing decreases so dramatically that it results in very low coupling efficiency values.
The results were associated with entropy of mixing since a visible phase separation was
observed in coupling reactions done in high concentrations with 10 kg/mol PS. This
phenomena will be discussed in Section 3.3.4.
70

3.3 Results and Discussion
2 4 6 8 10 12 14 16
40
50
60
70
80
90
100
110
CE
am
ine
EPM conc (g/100 mL solvent)
PS 2000
PS 5000
PS 10000
Figure 3.4: Coupling efficiency trends of EPM-PS coupling reactions - CEaminevs. EPM concentration is drawn with respect to the molar mass of PS
3.3.2.2 Molar Mass and Functionality of the Grafted Chain
Five different EPM elastomers were used in the coupling reactions. Table 3.4 shows
the results of PS-EPM coupling reactions with the characteristics of the EPM elas-
tomers that have been used. All reactions are done at a solid content of 10 g/100 mL
solvent.
Table 3.4: EPM-PS coupling with varying EPM molar mass and functionality
Sample [MAn]/[NH2] EPM/PS M n EPM %f CEamine CEEPM
(w/w) (SEC) (EPM) (%) (%)C141A 1:0.06 4 50,000 2.1 79 51C141B 1:0.06 4 50,000 2.2 87 63C141C 1:0.06 4 25,000 2.1 83 28C141D 1:0.12 4 50,000 1.1 50 34C141E 1:0.06 4 60,000 2.2 50 41
No significant difference in coupling efficiency was seen between the batches per-
formed with 50 kg/mol and 25 kg/mol EPM, however EPM with 60 kg/mol molar mass
showed significantly less coupling efficiency than the others, which is expected due to
lower entropy of mixing. The EPM sample with 1.1% anhydride content, which has 50
kg/mol molar mass, showed lower coupling efficiency than those with higher anhydride
71

3 Thermoplastic Elastomers via Amine-Anhydride Coupling
content. The molar mass of the elastomer could be considered as a factor, due to its
effect on dissolution process. However, the decrease in the density of anhydride groups
also decreases the coupling efficiency. This implies that the diffusivity of PS chains are
more limited in EPM with low anhydride content. This is probably due to the fact
that low anhydride content lowers the ‘compatibilizer’ effect, and also the number of
encounters of the reacting groups.
3.3.3 Effect of the Composition of the Building Blocks
Synthesis of ω-amine functional P(SMI) was performed, of which the details were dis-
cussed in Chapter 2. Table 3.5 shows the reaction parameters compared with coupling
efficiency results of coupling reactions performed between EPM and P(SMI).
Table 3.5: EPM-P(SMI) coupling with varying solid content
Sample solid content [MAn]/[NH2] EPM/P(SMI) M n P(SMI) %f CEamine CEEPM
g/100 mL solvent (w/w) (SEC) (P(SMI)) (%) (%)C301 10 1:0.11 4 6000 56 10 114C302 7 1:0.11 4 6000 56 20 15.6C303 4 1:0.22 2 6000 56 8 33.3C304 7 1:0.22 2 6000 56 6 25C305 10 1:0.22 2 6000 56 6 25
Visible phase separation was observed at 10 % solid content. This observation shows
that the miscibility of P(SMI) with EPM is lower than that of PS with EPM. Dilution
slightly increased the coupling efficiency, however it is far away from a quantitative
yield. Since the reaction mixtures with relatively low concentrations were optically
clear, no dramatic increase in coupling yields suggests that molecular mixing was not
achieved in moderate dilution. In high dilutions, the decreased number of encounters
plays the significant role in low coupling efficiency. Using THF instead of toluene could
have a minor effect from the point of high hygroscopic nature of THF, which introduces
moist to the reaction.
3.3.4 Effect of Stoichiometry of Building Blocks and Reaction Con-
centration
In a common solvent, EPM and PS may be miscible or phase separate at room
temperature depending on the solution concentration and molar mass of polymers. As
the molar mass of the polymer increases, at constant solution concentration, the entropy
72

3.3 Results and Discussion
of mixing decreases. At a certain point, value of entropy of mixing is so low that two
polymers eventually phase separate in a common solvent. This phenomenon is valid
in case of increasing the solution concentration at constant molar mass of polymers.
Table 3.6 shows the list of coupling reactions where the stoichiometry of reactants and
solution concentration was varied.
Table 3.6: Comparative EPM-PS coupling reactions at varying reaction concentrationand stoichiometry of reactants
Sample solid content [MAn]/[NH2] EPM/PS M n PS CEamine CEEPM
(g/100 mL solvent) (w/w) (SEC) (%) (%)C114 13 1:0.20 3.3 5800 83 163C115 6.5 1:0.20 3.3 5800 83 163C116 4.3 1:0.20 3.3 5800 80 158C117 20 1:0.3 1 10000 62 179C118 20 1:0.14 2 10000 63 92C119 20 1:0.07 4 10000 25 19C120 20 1:0.03 9 10000 35 11C128 10 1:0.2 2 10000 90 179C130 10 1:0.04 9 10000 68 31
Elastomers, even in dilute solutions (< 5% solid content) increase the solution
viscosity dramatically, the chains swell and shows gel-like behavior. This viscosity
change plays a physical role in the coupling reactions. Higher viscosity reduces the
mobility of the chains. However, on the other hand, despite a high viscosity, high
concentration of the reaction mixture potentially leads to an increase in the possibility
of encounter of the reacting groups as well.
The samples C119 and C120 showed visible phase separation, while C117 and C118
showed no visible phase separation. This is due to the EPM concentration in the solu-
tion. Above a certain value of EPM concentration, two polymer phases are not miscible
anymore. As expected, the coupling efficiency of the reactions done in heterogeneous
medium are significantly lower than those done in homogeneous medium. While keep-
ing the reactant stoichiometry constant, the solution concentrations were decreased and
quantitative coupling was achieved with 10 kg/mol PS samples. Nevertheless, the effect
of stoichiometry was not observed. A graph of coupling efficiency vs. EPM concen-
tration was plotted with respect to the stoichiometric ratio of the reactant functions
(Figure 3.5), no significant trend is seen.
Further dilution was done (samples C114, C115 and C116) at constant stoichiome-
try of the reactants, and a slight decrease was found in the most dilute solution. This
73

3 Thermoplastic Elastomers via Amine-Anhydride Coupling
2 4 6 8 10 12 14 16
40
50
60
70
80
90
100
110
CE
am
ine
EPM conc. (g/100 mL solvent)
[MAn]/[NH2]<4
4<[MAn]/[NH2]<7
7<[MAn]/[NH2]
Figure 3.5: Coupling efficiency trends of EPM-PS coupling reactions - CEaminevs. EPM concentration is drawn with respect to the stoichiometry of the reactants
implies that there is an optimum solution concentration for the highest coupling effi-
ciency which was found in the range between 10 and 20 g/100 mL solvent. In these
concentrations, depending on the stoichiometry of the reactants and molar mass of the
polymers as well, quantitative coupling could be achieved.
3.4 Conclusions
Amine-anhydride coupling was found to be a robust reaction for polymer-polymer
couplings with quantitative yields under optimum conditions. The data obtained in this
study showed that as long as PS and EPM is miscible in a common solvent, the amine-
anhydride reaction results in quantitative yields at ambient temperature. Increasing
molar mass of PS decreases the miscibility/diffusion of PS chains into the elastomeric
medium. The main parameter determining the coupling efficiency was found to be the
EPM concentration which directly affects the miscibility of the conjugating polymers
and solution viscosity. However if the molar mass of PS is low enough to allow diffusion
through the elastomeric medium, quantitative coupling is achievable in a wide rage
of solution concentration. Furthermore, overdilution decreases the coupling efficiency
74

3.4 Conclusions
due to the decreasing number of encounters of the reactant functions, which could be
compensated by larger reaction times.
Miscibility of P(SMI) and EPM is lower than that of PS and EPM under the
same conditions. Further dilution of P(SMI)-EPM coupling reactions resulted in higher
coupling efficiencies. The coupling efficiency is limited due to the necessity of high
dilution to overcome the incompatibility of the conjugating polymers.
Despite the fact that the quantitative coupling is achieved in the reactions per-
formed, the amine functionality is not 100% in the starting PS and P(SMI) compounds,
therefore the resultant TPEs still have non-grafted free thermoplastic polymer chains
present in their structure.
75

3 Thermoplastic Elastomers via Amine-Anhydride Coupling
76

Bibliography
[1] H. Gao and K. Matyjaszewski. Journal of the American Chemical Society,129(20):6633–6639, 2007. 62
[2] T. Chen, G. Kumar, M. T. Harris, P. J. Smith, and G. F. Payne. Biotechnologyand Bioengineering, 70(5):564–573, 2000. 62
[3] F. Bauer, H. Ernst, U. Decker, M. Findeisen, H. Glsel, H. Langguth, E. Hartmann,R. Mehnert, and C. Peuker. Macromolecular Chemistry and Physics, 201(18):2654–2659, 2000. 62
[4] H. C. Kolb, M. G. Finn, and K. B. Sharpless. Angewandte Chemie InternationalEdition, 40(11):2004–2021, 2001. 62
[5] C. V. Macosko, H. K. Jeon, and T. R. Hoye. Progress in Polymer Science,30(89):939 – 947, 2005. 62
[6] C.A. Orr, J.J. Cernohous, P. Guegan, A. Hirao, H.K. Jeon, and C.W. Macosko.Polymer, 42(19):8171 – 8178, 2001. 62
[7] Y. C. Bae, J. J. Shim, D. S. Soane, and J. M. Prausnitz. Journal of AppliedPolymer Science, 47(7):1193–1206, 1993. 63
[8] F. Mighri, M. A. Huneault, A. Ajji, G. H. Ko, and F. Watanabe. Journal ofApplied Polymer Science, 82(9):2113–2127, 2001. 64
[9] C. X. Sun, M. A. J. van der Mee, J. G. P. Goossens, and M. van Duin. Macro-molecules, 39(9):3441–3449, 2006. 68
[10] P.J.C.H. Cools, F. Maesen, B. Klumperman, A.M. van Herk, and A.L. German.Journal of Chromatography A, 736(12):125 – 130, 1996. 68
77

BIBLIOGRAPHY
78

4
Thermoplastic Elastomers via
Thiol-ene Coupling
Abstract
Efficiency and orthogonality of the chemistry used in polymer-polymer coupling
reactions are the key concepts for synthesizing well-defined macromolecular architec-
tures without purification or post-reaction steps. Radical thiol-ene coupling reaction is
a good candidate for this aim, since this approach is known to be successful in poly-
merization and polymer functionalization applications, and there are few studies on
its efficiency in polymer-polymer coupling reactions. In this chapter, thermoplastic
elastomers with graft topology were synthesized via radical thiol-ene coupling reaction
between 1,2-polybutadiene and ω-thiol-functional PS and P(SMI). Coupling efficiency
results will be presented and discussed with respect to the varied reaction parameters.
79

4 Thermoplastic Elastomers via Thiol-ene Coupling
4.1 Introduction
Radical thiol-ene coupling is the second ’grafting onto’ approach for the synthesis of
TPEs with graft morphology. Thiol-ene coupling was investigated in different aspects
in polymer chemistry such as a polymerization technique for synthesizing copolymers
with different topologies, a ’click’ technique for polymer-polymer coupling and polymer
functionalization. Radical thiol-ene reaction has been found to be orthogonal and
efficient for the polymer functionalization [1], [2], as well as the Michael addition, in
which an activated double bond is coupled with a thiol-bearing molecule in presence of
a phosphine-based catalyst. Michael addition was also reported as an efficient technique
for polymer-polymer couplings [3], which therefore can be considered as a click reaction.
However limitations in efficiency have been reported in the polymer-polymer coupling
reactions via radical thiol-ene coupling [4]. These findings raised the question that
radical thiol-ene reactions could be proposed as a type of ‘click chemistry’ for polymer-
polymer coupling reactions. The mechanism for thiol-ene coupling is illustrated in
Figure 4.1.
R SH R S
R S
R1
SR
R1
SR
R1
R SHS
RR1
R S
ini.
Figure 4.1: Mechanism of radicalic thiol-ene reaction - Initiator is either a thermalinitiator or a photoinitiator
The mechanism of radical thiol-ene reaction is that of a type of a chain transfer
reaction. Ideally, the reaction pathways would consist of only an initiation, one-step
propagation and a chain transfer step which are shown in Figure 4.1 from top to bottom,
respectively. However, homo-propagation and hydrogen abstraction from unsaturated
bonds are also reported [4]. In the ideal mechanism, the key concept is that the free
radical formed abstracts the acidic proton of the thiol and the formed thiyl radical
subsequently reacts with the unsaturated bond. The formed adduct radical abstracts
80

4.1 Introduction
a proton from another thiol, and the formed thiyl radical attacks another unsaturated
bond. This sequence of steps is referred to as propagation. In the presence of a suf-
ficient amount of thiol with respect to the amount of unsaturated bonds, in principle,
it is expected that the free radical formed from the dissociation of the thermal initia-
tor selectively abstracts a hydrogen atom instead of reacting with the double bonds.
However, it turned out that a stoichiometric amount of thiol to alkene does not lead to
quantitative coupling. Only in the case of excess thiol to alkene, quantitative thiol-ene
coupling is observed [4].
One of the main motivations to use radical thiol-ene reaction for the TPE synthesis
was the opportunity to utilize 1,2-polybutadiene (PB) elastomer without prior modifi-
cation step. Michael addition is not an option for this material, since the double bonds
on PB are not adjacent to a electron-withdrawing group. Moreover, radical thiol-ene
coupling, in which no catalyst is required, counts as clean chemistry compared to Huis-
gen azide-alkyne 1,3-cycloaddition and Michael addition. Radical thiol-ene coupling
as a polymer-polymer coupling method has been scarsely reported [5], so that there is
plenty of scope for the exploration of the characteristics of radical thiol-ene chemistry
in macromolecular media.
In polymer-polymer coupling reactions in general, as discussed in the introduction
of Chapter 3, physical parameters such as solution viscosity and miscibility of the
polymers are the main factors affecting the coupling yield. PB is immiscible with PS or
P(SMI). PB has an M e of 2000 which is relatively a low value compared to other types of
polymers [6]. Similar to the concept introduced in Chapter 3, the extent of miscibility
of PB with the thermoplastic polymers in a common solvent, and diffusivity of PS
chains into swollen PB matrix will be the additional factors influencing the coupling
efficiency.
In this chapter, the efficiency of thiol-ene coupling reaction of 1,2-polybutadiene
(PB) with PS-SH and P(SMI)-SH was investigated by varying the molar ratio of thiol
moiety to alkene moiety, molar mass of the grafting and grafted chains, reactant con-
centration, reaction temperature and type of initiator.
81

4 Thermoplastic Elastomers via Thiol-ene Coupling
4.2 Experimental Section
4.2.1 Materials
Azobisisobutyronitrile (AIBN, Aldrich), 1,1’-Azobis(cyclohexanecarbonitrile) (ACHN,
Aldrich) were recrystallized from methanol, 2,2’-Azobis(2.4-dimethyl valeronitrile) (AMVN,
Wako), PB (Ricon R© 156, 1400 g/mol 66% 1,2-vinyl content), PB (Ricon R© 150, 20,000
g/mol, 75% 1,2-vinyl content), benzyl mercaptane, 1-phenyl ethyl mercaptane (1-
PESH), toluene (Biosolve, AR), 1,4-dioxane (Merck, >99%) were used as received,
thiol-ω-functional PS, and thiol-ω-functional P(SMI) were synthesized as described in
Chapter 2.
4.2.2 Methods
1H NMR analyses were performed on a Mercury 400, CDCl3 was used as a solvent
for all samples. 10-15 mg of sample was dissolved in 0.8 mL of CDCl3.
Number average molar mass (M n) and dispersity (D) values were measured by
Size Exclusion Chromatography (SEC) on a Waters Alliance system equipped with
a Waters 2695 separation module, a Waters 2414 refractive index detector (35 ◦C), a
Waters 2487 dual absorbance detector (320 nm was used), a PSS SDV 5 µm guard
column followed by 2 PSS SDV linearXL 5 µm columns (8 mm * 300 mm) in series
at 40 ◦C. Tetrahydrofuran (THF stabilized with BHT, Biosolve) with 1% (v/v) acetic
acid was used as eluent at a flow rate of 1.0 mL/min. The molar masses were calculated
with respect to polystyrene standards (Polymer Laboratories, M p = 580 Da up to M p
= 7.1x10⁶ Da). The samples were dissolved in eluent solution with a concentration of
1 mg/mL and filtered through a 0.2 µm PTFE filter (13 mm, PP housing, Alltech).
4.2.3 Model Reactions for Thiol-ene Coupling
In a Schlenk flask, PB (0.1 g, 1.85 mmol double bonds) and benzyl thiol (1.15 g, 9.25
mmol) were dissolved in 5 mL of toluene, degassed with nitrogen for 30 minutes, and
heated to 65 ◦C. 0.15 g of AIBN (0.925 mmol) was dissolved in 1 mL of toluene and
degassed separately. The AIBN solution was injected into the polymer solution. The
reaction mixture was stirred for 20 hours at 65 ◦C under nitrogen atmosphere.
82

4.3 Results and Discussion
4.2.4 Thiol-ene Coupling of Vinylic PB and PS-SH
In a Schlenk flask, PB (2 g, 37 mmol double bond) and thiol-ω-functional PS (1.0 g,
0.4 mmol) were dissolved in 20 mL of toluene, degassed with nitrogen for 30 minutes,
and heated up to 65 ◦C. 4.0 mg of AIBN (0.024 mmol) was dissolved in 1 mL of toluene
and degassed separately. AIBN solution was injected into the polymer solution. The
reaction mixture was stirred for 20 hours under nitrogen atmosphere.
4.2.5 Thiol-ene Coupling of Vinylic PB and P(SMI)
In a Schlenk flask, PB (2 g, 37 mmol double bond) and thiol-ω-functional P(SMI) (1.0
g, 0.2 mmol) were dissolved in 20 mL of 1,4-dioxane-toluene mixture (1:2), degassed
with nitrogen for 30 minutes, and heated up to 65 ◦C. 4.0 mg of AIBN (0.024 mmol)
was dissolved in 1 mL of toluene and degassed separately. AIBN solution was injected
into the polymer solution. The reaction mixture was stirred for 20 hours under nitrogen
atmosphere.
4.3 Results and Discussion
4.3.1 Proof of Concept - Model Reactions
Model thiol-ene coupling reactions were carried out in order to investigate the be-
havior of internal and external vinylic double bonds of PB elastomer towards a primary
thiyl radical. The reaction temperature was 65 ◦C, which is the temperature for a 10-
hour half-life time of AIBN in toluene. In the reactions, equimolar amounts of double
bonds to thiol were used and the amount of radical initiator was varied. The amount
of AIBN was varied between 50 mol% and 5 mol% with respect to thiol. Coupling
efficiency was calculated from 1H NMR analysis results.
The model thiol-ene reaction of a low molar mass vinylic PB with benzyl thiol
showed high coupling efficiency for the external double bonds. The effect of AIBN con-
centration was not clearly observed in the 1H NMR spectra, due to the poor integration
of overlapping peaks. The yields of coupling reactions with 50%, 10% and 5% AIBN
concentration were roughly calculated from 1H NMR spectra and it is found that ap-
proximately 90% of the external (pendant) vinyl groups were coupled with thiol, while
internal double bonds were much less reactive. Conversion of internal double bonds was
83

4 Thermoplastic Elastomers via Thiol-ene Coupling
ca. 10%. This model reaction showed that internal bond reactivity towards a primary
thiyl radical is so low that the the extent of reaction of internal double bonds with a
secondary thiyl radical or a secondary thiyl moiety on a PS chain can be considered as
negligible.
The UV absorption of aromatic and aliphatic compounds is significantly different,
benzyl thiol has an absorption under 320 nm wavelength, whereas vinylic PB is not
active. As a consequence, the UV traces of SEC measurements at 320 nm provide a
qualitative result for the model grafting reactions. Figure 4.2 shows comparative RI
and UV 320 nm traces of PB before and after grafting reactions.
8 10 12 14 16 18 20
0.0
0.2
0.4
0.6
0.8
1.0
no
ma
lize
d R
I sig
na
l
retention time
PB-g-BT
PB
12 14 16 18
-0.01
0.00
0.01
0.02
UV
sig
na
l (3
20
nm
)
retention time
PB-g-BT
PB
Figure 4.2: Comparative SEC traces of neat PB and PB-g-BT (benzyl thiolgrafted) - RI trace (left), UV trace (320 nm) (right)
The RI traces shown in Figure 4.2 show a shift in retention time, which corresponds
to a change in the hydrodynamic volume of the material, which is due to a change in
the structure. In the UV traces, the difference between neat PB and the reaction
product after thiol-ene coupling with benzyl thiol clearly shows that the grafting was
successful. However, a high molar mass shoulder which is already present in the neat
PB clearly increased. This implies that some radicals were terminated by combina-
tion. Consequently, the calculation of reaction yield from 1H NMR spectra was slightly
overestimated.
A second set of model reactions with a secondary thiol was performed, which was
expected to give more insight in the coupling efficiency of ω-thiol-functional PS. In these
model reactions, 1-PESH and high molar mass PB were used. 1H NMR data indicated
that the external double bonds were not totally converted in the reactions where an
equimolar ratio of thiol to ene was used. This result, when compared to the first
84

4.3 Results and Discussion
set of model coupling reactions, shows that a secondary thiyl radical is significantly
less reactive than a primary thiyl. Table 4.1 summarizes the reactions with varied
parameters and extent of conversion values.
Table 4.1: model thiol-ene coupling reactions between vinylic PB and 1-PESH
Sample reactant [vinyl]:[thiol]:[AIBN] T CEvinyl
concentration ( ◦C) (%)(g/100 mL)
A1 2.85 10:10:0.5 65 65A2 3.01 10:5:0.25 65 58B1 2.85 10:10:0.5 65 62B2 2.31 10:5:0.5 65 65C1 3.51 10:10:0.25 65 50C2 2.96 10:10:1 65 75
The extent of modification of external vinyl bonds was found to be roughly 60%.
The calculation was done by assuming that the extent of reaction of internal double
bonds is so little that it can be neglected. The effect of initiator amount was found to
be significant. Increasing the initiator amount, increases the coupling efficiency. Sam-
ple A1 and B1 are a reproduction of the same reaction where 5% error was found in
the calculation of the coupling efficiency values. In the model reactions, no difficul-
ties existed during the filtration of the SEC samples prior to the measurements, and
no shoulders were observed for the samples where an equimolar amount of thiol to
vinyl groups was used. These results lead to a remark that there were no significant
termination reactions for these reactions, which makes the calculations from 1H NMR
spectra reliable. The samples A2 and B2 exhibit high molar mass shoulders in SEC
measurements (Figure 4.3), where the molar concentration of double bonds was in ex-
cess relative to thiols. The shoulder was more significant in sample A2 than it was in
sample B2, where less initiator was employed. This result suggests that a low concen-
tration of thiyl radicals with respect to the vinyl groups increases the homopropagation
of vinyl bonds due to a lack of thiol groups that supply the hydrogen atom for a chain
transfer. The calculation of the coupling efficiency values for samples A2 and B2 are
therefore an overestimation. However, an increase in initiator concentration increases
the extent of the addition of the thiol relative to homopropagation, which was also seen
in the samples where equimolar amounts of reactants were used.
The UV traces and the molar mass distribution results of the reaction products
listed in Table 4.1 compared to neat PB are shown in Figure 4.3. While neat PB
shows no UV activity, all coupled products are UV active. SEC measurements are
85

4 Thermoplastic Elastomers via Thiol-ene Coupling
not absolutely quantitative, since the thiol compound has no distinct peak in the SEC
traces, and no internal standard was used in the reactions. However, normalization
of UV traces relative to RI traces was done and the areas calculated therefrom are in
agreement with the results obtained from 1H NMR analysis for the reactions where no
high molar mass shoulder observed.
12 13 14 15 16 17 18 19
0.0
0.2
0.4
0.6
0.8
1.0
RI sig
na
l
retention time
PB
A1
A2
B1
B2
C1
C2
13 14 15 16 17
-0.0002
0.0000
0.0002
0.0004
0.0006
0.0008
0.0010
0.0012
0.0014
0.0016
0.0018
No
rma
lize
d U
V s
ign
al (3
20
nm
)
retention time
PB
A1
A2
B1
B2
C1
C2
Figure 4.3: Comparative SEC traces of neat PB and PB-g-PT (1-phenyl ethylthiol grafted) samples - RI trace (left), UV trace (right)
4.3.2 Radical Thiol-ene Coupling in Polymer-polymer Coupling
The radical thiol-ene coupling reaction was investigated in terms of coupling effi-
ciency with respect to a number of parameters, namely molar masses of the building
blocks, stoichiometric ratio of the functional groups, reaction temperature and reac-
tant concentration. A number of reactions were performed in which these parameters
were varied. All thiol-ene coupling reactions were done in toluene and in the presence
of thermal free radical initiators. A molar excess of the double bonds was used in
all reactions, since the weight fraction of the elastomer in the resultant TPE should
exceed that of the hard segment. This fact is a disadvantage according to the model
reactions performed, where low coupling efficiency and PB-PB coupling were observed
in reactions in which less thiol used, and according to the literature mentioned in the
introduction section. However, the coupling efficiencies obtained from model reactions
are high enough to investigate the parameters affecting the coupling efficiency in poly-
meric medium. Additionally, differences in coupling efficiencies will be a parameter in
the discussions on structure-property relations, which will be introduced in Chapter 7.
86

4.3 Results and Discussion
Coupling efficiency results were calculated according to UV traces of SEC measure-
ments at 320 nm. The coupling product has a UV active fraction at lower retention
times which corresponds to PS conjugated to PB. The fraction at the higher retention
times corresponds to the non-conjugated PS. The ratio of the areas of these two peaks
to the total area gives the percent amount of conjugated and non-conjugated PS with
respect to the total PS present in the product. Calculations of coupling efficiency with
respect to total PS, thiol, PB and vinyl are defined by equations 4.1, 4.2, 4.3, and 4.4,
which are:
CEPS =Ag
Ag +Af(4.1)
CEthiol =CEPSf
(4.2)
CEPB = CEPS ∗ [PS]
Mn(PS)∗ Mn(PB)
[PB](4.3)
CEvinyl = CEPS ∗ [PS]
Mn(PS)∗ Mn(vinyl)
[vinyl](4.4)
where CEPS is the coupling efficiency with respect to total PS amount in the re-
sultant TPE, CEthiol is the coupling efficiency with respect to the thiol functionality,
CEPB is the coupling efficiency with respect to the PB chains, and CEvinyl is the cou-
pling efficiency with respect to the vinyl concentration present in the solution. Ag is
the area of the SEC signal corresponds to the grafted PS chains, Af is the area of the
SEC signal corresponds to the free PS chains, f is the fraction of PS chains with a
thiol functionality, [PS], [thiol], [PB] and [vinyl] are the concentrations of the PS, thiol
moiety, PB and vinyl groups in the corresponding reactions.
PS-SH homopolymer with different molar masses have been synthesized for uti-
lization in thiol-ene coupling reactions. The details of the synthesis were discussed
in Chapter 2. Table 4.2 shows the list of the PS-SH samples synthesized via RAFT
polymerization followed by aminolysis and were used in thiol-ene coupling reactions.
Maximum coupling efficiency achieved in all thiol-ene coupling reactions was around
60% with respect to total PS present in the product. This value is also in agreement
with the model reaction results.
87

4 Thermoplastic Elastomers via Thiol-ene Coupling
Table 4.2: ω-thiol functional PS utilized in thiol-ene coupling reactions
Sample % f M n D(1H NMR) (SEC) (SEC)
PS125-1 60 7,500 1.28PS125-3 51 2,500 1.2PS136 75 14,000 1.33PS146-1 61 1,600 1.13PS146-2 78 3,400 1.16PS146-3 69 7,000 1.21
4.3.3 Effect of Molar Mass of Building Blocks
4.3.3.1 Molar Mass of the Grafting Chain
Table 4.3 shows the reactions performed between vinylic PB and ω-thiol-functional
PS where the molar mass of PS was varied. PB with a molar mass of 20 kg/mol was
used in all reactions. The coupling efficiency values were calculated with respect to the
thiol amount and number of PB chains.
Table 4.3: PB-PS coupling reactions by varying the molar mass of PS
Run solid content [DB]:[thiol]:[ini] PB/PS (w/w) T M n (PS) CEthiol CEPB
g/100 mL solvent ( ◦C) (%) (%)112 8.5 370:2.0:0.2 2 65 2,500 63 128113 8.5 370:0.8:0.06 2 65 7,500 37 30141 10 370:0.54:0.04 2 65 14,000 35 19150A 11 370:0.43:0.03 2.5 65 14,000 78 33150D 11 370:1.6:0.16 2.5 65 2,500 59 96150B 17 370:1.8:0.12 0.6 65 14,000 51 93150G 16 370:5.8:0.57 0.7 65 2,500 35 206151B 10 370:2.0:0.16 4 65 1,600 38 72151E 10 370:1.15:0.07 4 65 3,400 39 43142 10 370:0.27:0.02 4 65 14,000 33 9
According to the coupling efficiency results of the reaction sets, no distinct trend was
observed with respect to the molar mass of the polymer. First of all, keeping the weight
ratio of the reacting polymers constant, while varying the molar mass of PS, changes
the stoichiometric ratio of thiol to double bond. This has a tremendous influence on
the conversion of the second order thiol-ene coupling reaction [7]. If the stoichiometric
ratio of thiol to double bond would be kept constant, while varying the molar mass of
PS, weight ratio of reacting polymers would be affected, which influences the solution
viscosity and therefore the miscibility and the mobility of the components. Secondly,
the PS samples synthesized for coupling reactions have different different degrees of
chain-end functionality. Non-functional chains blur the correlation between the molar
mass and the coupling efficiency. Variation in the degree of chain-end functionality
88

4.3 Results and Discussion
also changes the ratio of thiol functionality to the initiator used. Model reactions
show that the initiator concentration is one of the main factors affecting the coupling
efficiency. Secondly, the molar mass of PS does not affect the viscosity of the reaction
mixture in a significant way. The viscosity of the solution is mainly determined by
the concentration of PB. As long as the components are miscible (no visible phase
separation), the molar mass range of PS used can be concluded to have no significant
effect on coupling efficiency, compared to stoichiometric ratio of thiol to double bonds
and compared to the initiator concentration.
4.3.3.2 Molar Mass of the Grafted Chain
The molar mass of the elastomer becomes the main parameter determining the vis-
cosity of the solution at constant values of the solid content. A high viscosity results
in a low mobility of the chains, which actually means that the frequency of encounters
of the functional groups decreases with increasing viscosity. However, if the viscosity
was kept constant by dilution, the frequency of encounters would decrease due to the
space occupied by solvent molecules. In the reactions performed in this study, the solid
content was kept constant in order to observe the diffusivity and miscibility behavior of
the conjugating chains. Two different molar masses of PB were investigated. Table 4.4
shows the reactions performed by varying the molar mass of PB, with reaction param-
eters and coupling efficiencies calculated according to total PS amount and external
vinylic bonds of PB.
Table 4.4: PB-PS coupling reactions by varying the Mwt of PB
Sample solid content [DB]:[thiol]:[AIBN] PB/PS (w/w) T M n (PS) M n (PB) CEPS CEvinyl
g/100 mL solvent ( ◦C) (%) (%)111 15 370:2.0:0.2 2 65 2,500 1,400 35 0.58112 8.5 370:2.0:0.2 2 65 2,500 20,000 32 0.45211A 8.5 370:2.3:0.15 2 65 3,400 1,400 27 0.32212A 15 370:2.3:0.15 2 65 3,400 20,000 43 0.45211B 10 370:2.3:0.15 2 65 3,400 1,400 21 0.26212B 10 370:2.3:0.15 2 65 3,400 20,000 31 0.33
Model reactions showed that a secondary thiol is almost non-reactive towards an
internal double bond. The PB samples used in this study have different molar fractions
of vinylic bonds. The highest extent of addition is observed in sample 111, where the
lowest molar mass components mixed at the highest concentration. However, the next
highest addition yields are seen in 112 and 212B in which higher molar mass PB is
89

4 Thermoplastic Elastomers via Thiol-ene Coupling
used. This result is not in agreement with the polymer mixing theory, and when the
samples 211B and 212B are compared, higher molar mass PB is observed to show higher
coupling efficiency. This could be due to the overdilution of the low molar mass PB
and PS mixtures. Molecular mixing is enhanced by dilution, however, it decreases the
number of encounters of the thiyl radicals and and the vinyl groups that are already
at a lower concentration in low molar mass PB.
4.3.4 Effect of Stoichiometry of Building Blocks and Reaction Con-
centration
In this study, the stoichiometry of the building blocks was varied, while the concen-
tration of PB was kept between 6-8 g per 100 mL solvent to be able to allow the PS
chains in each batch to diffuse under equal conditions. Thus, the effect of thiol/ene
stoichiometry could be seen. PB with a molar mass of 20 kg/mol was used, and the
reaction temperature was 65 ◦C in all reactions.
Table 4.5: PB-PS coupling reactions at varying stoichiometry of the building blocks
Sample solid content [vinyl]:[thiol]:[AIBN] PB/PS (w/w) M n (PS) CEPS CEPB
g/100 mL solvent (%) (%)140 10 139:0.66:0.04 1 14,000 48 69141 10 180:0.47:0.03 2 14,000 26 19142 10 222:0.27:0.02 4 14,000 25 9150A 11 370:0.43:0.03 2.5 14,000 59 33150B 17 370:1.8:0.12 0.6 14,000 38 93150C 9 370:0.36:0.04 11 2,500 34 25150D 11 370:1.6:0.16 2.5 2,500 30 96150E 13 370:2.9:0.29 1.4 2,500 26 149150G 16 370:5.8:0.57 0.7 2,500 18 206150J 14 370:1.8:0.12 0.6 14,000 40 95
The first three entries in Table 4.5 were performed at a constant solid content.
An increase in the PB/PS weight ratio leads to a decrease in the coupling efficiency.
This is due to a decrease in the amount of solvent, which decreases the miscibility of
the components and immobilizes the chains. To distinguish between the parameters
solid content and PB concentration, the reactions with the code 150 in Table 4.5 were
performed. Figure 4.4 shows the comparative SEC traces of the coupling products of
the reactions 150C, D, E and G.
The graph shown in Figure 4.5 summarizes the trend of coupling efficiency with
respect to the solid content, stoichiometry of building blocks and PB concentration
of the reactions 150C, D, E, G. Coupling efficiency decreases with increasing PS/PB
90

4.3 Results and Discussion
14 16 18 20 22
0.0
0.5
1.0
no
rma
lize
d U
V s
ign
al (3
20
nm
)
retention time
PB
C150C
C150D
C150E
C150G
PS
Figure 4.4: UV traces of SEC measurements - Comparison of neat PB, PS andcoupling products of the reactions listed in Table 4.5
weight ratio and with increasing solid content. Although, the concentration of PB
decreases from 8 to 6.5, the efficiency of diffusion of PS into PB also decreases due to
the more concentrated reaction medium.
A comparative graph of the reactions 150A, B and J is shown in Figure 4.6. The
trend observed in this set of reactions is in agreement with the trend that was observed
in the previously mentioned reaction set. The coupling efficiency is mainly dependent
on the solid content, if the stoichiometry of functional groups is kept constant.
4.3.5 Composition of Building Blocks, Effects of Two-solvent System
The main motivation to use P(SMI) as the grafting polymer is to improve the thermal
properties of the resultant TPE, thanks to the high T g of P(SMI) which is around
180 ◦C for the fully alternating constitution [8]. Table 4.6 shows the characteristics of
P(SMI) copolymers used in the coupling reactions.
Table 4.6: ω-thiol functional P(SMI) utilized in thiol-ene coupling reactions
Sample functionality (%) M n (SEC) DP(SMI)3 75 5000 1.25P(SMI)4 70 9500 1.3
Toluene was not used as a solvent in these coupling reactions since P(SMI) does not
dissolve in toluene. Instead, the reactions are performed in toluene-dioxane mixtures.
91

4 Thermoplastic Elastomers via Thiol-ene Coupling
c
d
e
g0
5
10
15
20
25
30
35
PB/PS
solid cont.
PB / tol
CE
Figure 4.5: Coupling efficiency trends of reactions 150C, D, E, G - CEPS resultsare plotted in comparison with the reaction parameters, values are normalized for betterdiscrimination
a
b
j0
10
20
30
40
50
60
PS / PB
PB / tol
solid cont.
CE
Figure 4.6: Coupling efficiency trends of reactions 150A, B, J - CEPS resultsare plotted in comparison with the reaction parameters, values are normalized for betterdiscrimination
92

4.3 Results and Discussion
The solubility of PB in 1,4-dioxane is lower than that in toluene [9]. Using a mixture
of two miscible solvents each dissolving one of the components better is a physical
factor affecting the coupling efficiency of the reactants. Table 4.7 shows the reaction
parameter and calculated coupling efficiencies of the PB-P(SMI) coupling reactions, all
reaction were performed at 65 ◦C and 20 kg/mol PB was used.
Table 4.7: PB-P(SMI) coupling reactions
Sample solid content [vinyl]:[thiol]:[AIBN] PB/P(SMI) M n toluene/dioxane CEP (SMI) CEPB
g/100 mL solvent (w/w) (P(SMI)) (v/v) (%) (%)201 6.6 185:2.00:0.1 1 5,000 2 16 64202 6.6 185:1.08:0.05 2 5,000 2 17 34203 6.6 185:0.5:0.025 4 5,000 2 22 22204 10 185:1.05:0.05 1 9,500 1 3 6205 10 185:0.5:0.025 2 9,500 2 8 8.5206 10 185:0.25:0.013 4 9,500 4 18 9.5
All entries in Table 4.7 show an opposite trend compared to the trend of the reaction
set performed with PS in which the stoichiometry was investigated as a parameter.
This opposite behavior cannot be attributed to compositional difference of P(SMI),
since P(SMI) is also immiscible with PB in the melt. Therefore, instead of an increase,
a decrease would have been expected for the same conditions. However, the reactions
were performed in different ratios of 1,4-dioxane-toluene mixtures, differently from the
batches with PS. 1,4-dioxane and toluene are miscible. All batches were optically clear
during preparation and throughout the reaction, which is an indication that there is
no phase separation between the polymer solutions, and P(SMI) does not precipitate
due to presence of toluene. The first three reactions were done in 2:1 toluene-dioxane
mixture. In the last three reactions, the volume ratio of toluene to 1,4-dioxane was
adjusted according to weight ratio of PB and P(SMI). Figure 4.7 shows the coupling
efficiency trends with respect to the reaction parameters.
First of all, due to the higher solid content in the second set of the reactions, the
coupling efficiency values are relatively lower. The increase in the coupling efficiency
is more significant in the second set of the reactions. This trend indicates that an
increase in the fraction of toluene, does not negatively affect the diffusivity of P(SMI)
chains into the PB phase. Oppositely, a higher amount of toluene swells PB to a larger
extent that miscibility of the polymer solutions is enhanced. Using two-miscible-solvent
system in general appears to be enhancing the miscibility of the polymer solutions. In
other words, the swelling of the elastomer is somewhat limited by using 1,4-dioxane
93

4 Thermoplastic Elastomers via Thiol-ene Coupling
R201
R202
R203
R204
R205
R206
0
5
10
15
20
tol / diox
PB / P(SMI)PB / tol
P(SMI) / dioxCE
Figure 4.7: Coupling efficiency trends of reactions 201-206 - CEPS results areplotted in comparison with the reaction parameters, values are normalized for better dis-crimination
94

4.3 Results and Discussion
additionally which is a good solvent for P(SMI), where the mobility of PS gets enhanced
due to the higher amount of solvent incorporated with P(SMI) rather than PB. This
could result in such a mixture of somewhat multiple semi-phases that the P(SMI)
solution in 1,4-dioxane is in a dynamic equilibrium with the PB solution in toluene.
Decreasing the P(SMI) concentration while keeping the solvent ratio constant, allows
the dioxane to be incorporated more with PB, which explains why not a decrease but
an increase was observed in the first set. However, this effect appears to be not as
strong as the effect of increase in the extent of swelling of PB, which is indicated by
the dramatic change of coupling efficiency in the second set of the reactions.
4.3.6 Effect of Reaction Temperature and Initiator Activity
One of the side reactions in thiol-ene coupling is homopropagation of the unsaturated
bonds, which is initiated by the addition of the free radical formed by the dissociation of
the initiator. This is due to the preference of the initiator-derived radical which attacks
to a double bond instead of abstracting a hydrogen atom from a thiol. Essentially,
if thiol is not in excess, addition of the initiator-derived radical to a double bond
is a significant side reaction in polymer-polymer coupling. Therefore, the reaction
temperature or type of the thermal initiator would play a role in the selectivity between
the two reactions. In this respect, a set of reactions was designed in order to investigate
various azo-initiators at various temperatures. Table 4.8 summarizes the parameters
and coupling efficiency results of the reactions performed.
Table 4.8: Thiol-ene coupling of PB and PS with different thermal initiators and tem-peratures
Run solid content [vinyl]:[thiol]:[ini] Initiator PB/PS (w/w) T t M n (PS) CEPS CEPB
g/100 mL solvent ( ◦C) (h) (%) (%)151A 10 55:0.38:0.03 ACHN 4 88 24 1,600 56 175151B 10 55:0.38:0.03 AIBN 4 65 24 1,600 23 72151C 10 55:0.38:0.03 AMVN 4 51 24 1,600 30 94151D 10 55:0.23:0.015 ACHN 4 88 24 3,400 56 83151E 10 55:0.23:0.015 AIBN 4 65 24 3,400 29 43151G 10 55:0.23:0.015 ADVN 4 51 24 3,400 45 66151H 8 55:0.10:0.007 ACHN 4 88 24 7,000 55 39151J 8 55:0.10:0.007 AIBN 4 65 24 7,000 40 29151K 8 55:0.10:0.007 AMVN 4 51 24 7,000 43 31152A 8 55:0.23:0.015 ACHN 4 65 96 3,400 17 25152B 8 55:0.23:0.015 AIBN 4 65 24 3,400 40 59152C 8 55:0.23:0.015 AMVN 4 65 5 3,400 24 36
All three azo-initiators utilized in this study possess a nitrile moiety. The nitrile
95

4 Thermoplastic Elastomers via Thiol-ene Coupling
group helps to stabilize the radical formed. Besides the stability and reaction preference
of the initiator-derived radical, reaction temperature plays a role in the side reactions.
Thioether adduct radicals have a choice to homopropagate, abstract a hydrogen atom
from another thiol or terminate by coupling with another radical group. Also in this
case, the probability of each of these events is also affected by the reaction temperature.
Highest coupling efficiency values were observed in the reactions done with ACHN
at 88 ◦C, the 10-hour half-life temperature of ACHN. This result is rather due to the
effect of the temperature on the mobility and therefore the miscibility of the polymer
chains than the activity of the initiator radical. Interestingly, reactions performed in the
presence of AMVN at 51 ◦C (10-hour half-life temperature of AMVN) showed higher
coupling efficiency than the reactions performed with AIBN at 65 ◦C. This is believed
to be due to the different structure of AMVN, which forms more stable radical than
AIBN [10]. A more stable radical, which is present in the medium containing the thiol
in minority and double bonds in majority, has a higher chance to abstract a hydrogen
from thiol which is the preferred path in ideal thiol-ene coupling reactions.
12 14 16 18 20 22 24
0.0
0.2
0.4
0.6
0.8
1.0
no
rma
lize
d R
I
retention time (min)
C152A
C152B
C152C
Figure 4.8: Comparative SEC traces of PB-PS coupling reactions - at 65 ◦C withdifferent types of initiator
The prevalance of the initiator-derived radical could be followed by performing the
reactions at the same temperature. The runs listed as 152A, 152B and 152C in table
4.8 are the reactions done at the same temperature with different initiators. Reactions
were followed by SEC measurements. Highest coupling efficiency value was observed
96

4.4 Conclusions
in the reaction performed in the presence of AIBN and at 65 ◦C, which is the 10 hour-
half-life temperature of the initiator. Neither of the ACHN or AMVN achieved that
extent of coupling. This means that continuous radical formation with a certain rate is
necessary for achieving high efficiencies in thiol-ene coupling. However, the shape of the
peaks corresponds to the coupled products (Figure 4.8) are the same, indicating that
there is no difference in the selectivity between an addition and hydrogen abstraction
reaction.
4.4 Conclusions
Model reactions between a low molar mass secondary thiol and PB elastomer showed
that coupling is not complete due to the fact that a secondary thiyl radical is not
as reactive as a primary thiyl towards unsaturated bonds. In the presence of excess
double bonds relative to thiol functionalities, homopropagation or termination by the
combination of two propagating PB chains is observed as a side reaction.
As expected, in polymer-polymer coupling reactions, the coupling efficiency value
obtained did not exceed the coupling efficiency obtained in the model reactions. Among
the parameters varied, solid content and reaction temperature were found to be the most
dominant factors affecting the coupling efficiency. Molar mass of the reactants implied
to affect the coupling efficiency, but it was not clearly observed. The variations in the
molar mass of the components changed the other parameters such as the stoichiometry
of the reactant groups and the solution viscosity, which blur the correlation between
the molar mass and the coupling efficiency.
The reactions that were carried out in a binary solvent mixture showed totally dif-
ferent characteristics when compared to the reactions done in a single solvent. The
mutual mixing behavior of two solvents, and solubility properties of the polymer com-
ponents in these solvents resulted in a opposite trend in terms of coupling efficiency to
that was observed in single-solvent system.
Increase in temperature enhances the solubility and the miscibility of the compo-
nents, but type of the initiator was also found to be significant. No difference was
observed in the preference of the initiator-derived radical between a hydrogen abstrac-
tion and addition reaction. However, the activity of AMVN was found to be higher
than that of AIBN at their own 10-hour half-life temperatures. The structure of the
97

4 Thermoplastic Elastomers via Thiol-ene Coupling
initiator seems to affect the coupling efficiency, thus AIBN is suspected to be the most
suitable radical source for the thiol-ene coupling reactions.
98

Bibliography
[1] C. E. Hoyle and C. N. Bowman. Angewandte Chemie International Edition,49(9):1540–1573, 2010. 80
[2] A. Dondoni. Angewandte Chemie International Edition, 47(47):8995–8997, 2008.80
[3] G. Mantovani, F. Lecolley, L. Tao, D. M. Haddleton, J. Clerx, J. L. M. Cornelissen,and K. Velonia. Journal of the American Chemical Society, 127(9):2966–2973,2005. 80
[4] S. P. S. Koo, M. M. Stamenovic, R. A. Prasath, A. J. Inglis, F. E. Du Prez,C. Barner-Kowollik, W. Van Camp, and T. Junkers. Journal of Polymer SciencePart A: Polymer Chemistry, 48(8):1699–1713, 2010. 80, 81
[5] B. S. Sumerlin and A. P. Vogt. Macromolecules, 43(1):1–13, 2010. 81
[6] D. R. Daniels, T. C. B. McLeish, B. J. Crosby, R. N. Young, and C. M. Fernyhough.Macromolecules, 34(20):7025–7033, 2001. 81
[7] B. Chiou and S. A. Khan. Macromolecules, 30(23):7322–7328, 1997. 88
[8] G. Liu, X. Li, L. Zhang, X. Qu, P. Liu, L. Yang, and J. Gao. Journal of AppliedPolymer Science, 83(2):417–422, 2002. 91
[9] R.G. Makitra, E.A. Zaglad’ko, A.A. Turovskii, and G.E. Zaikov. Russian Journalof Applied Chemistry, 77:323–326, 2004. 93
[10] S. J. Blanksby and G. B. Ellison. Accounts of Chemical Research, 36(4):255–263,2003. 96
99

BIBLIOGRAPHY
100

5
Thermoplastic Elastomers via
Nitroxide Mediated Graft
Polymerization
Abstract
The ‘grafting from’ technique is used as an alternative to ‘grafting onto’, since it
has some advantages compared to ‘grafting onto’ technique in terms of compatibility
of the reactants and grafting efficiency. In this last synthesis chapter, the ‘grafting
from’ approach was investigated in terms of nitroxide mediated graft polymerization
of PS from an elastomeric macroinitiator. By this technique, it is observed that the
grafting density and the molar mass of the grafts can be tuned in a more controlled
way, resulting in materials with well-defined structure.
101

5 Thermoplastic Elastomers via Nitroxide Mediated Graft Polymerization
5.1 Introduction
The second approach investigated in the synthesis of graft TPEs is the ‘grafting
from’ method. In this approach, the grafted chains are formed by polymerization from
the pendant functions of the main chain. In literature, the ‘grafting from’ technique
is used in many applications such as modification of surfaces [1], tuning the proper-
ties of proteins [2], and building complex macromolecular architectures [3], [4]. The
‘grafting from’ technique is also used as an alternative to the ‘grafting onto’ tech-
nique, since it does not suffer from the diffusion problems and low yields of polymer-
substrate/polymer-polymer coupling reactions [5].
Graft polymerization of a monomer from a polymer can simply be done by free
radical polymerization of a monomer in a medium where a polymer is present bearing
unsaturated groups as pendant functions or on the main chain. However, the resultant
material is a mixture of grafted polymer and free homopolymer of the monomer. The
resulting mixture cannot be counted as a well-defined structure. In order to synthesize
well defined copolymers via the ‘grafting from’ approach, a living/controlled polymer-
ization technique is required. CRP methods provide functional graft chain-ends, which
can be further chain-extended to obtain grafted block copolymers. Anionic polymer-
ization, ATRP and NMP work with a hetero-functional initiator, in which the leaving
group of the initiator participates in the ‘end-capping’ process. However, RAFT poly-
merization works with a normal radical initiator, and a highly reactive chain transfer
agent (CTA) which initiates the largest fraction of all polymer chains. This mechanism
of RAFT polymerization limits the potential of this technique to be used as a ‘graft-
ing from’ approach, due to the inevitable formation of free homopolymers. However,
RAFT polymerization finds applications as a ‘grafting from’ technique [2], [5]. ATRP
is a common technique used for the ‘grafting from’ approach. The advantage of ATRP
compared to the other CRP techniques is that the initiation takes place instantly which
allows all the grafting chains to grow simultaneously in the early stages of propaga-
tion. This feature results in denser grafts especially for surface applications where the
hindrance plays an important role. However, the presence of metal complexes leads to
some limitations particularly in bio-related applications.
The third CRP alternative, NMP, has a much simpler formulation than ATRP or
RAFT polymerization. The hetero-functional initiator, alkoxyamine, thermally disso-
102

5.1 Introduction
ciates and the cleaved persistent radical (nitroxide) works as an ’end-capping agent’.
Figure 5.1 shows the mechanism of NMP initiated with a hetero-functional initiator.
Figure 5.1: Mechanism of NMP - (a) dissociation of alkoxyamine, (b) initiation, (c)deactivation in main equilibrium, (d) activation in main equilibrium, (e) propagation
NMP could also be employed with just a nitroxide radical with conventional free
radical initiators, instead of an alkoxyamine. However, hetero-functional alkoxyamine
initiators have better control over molar mass and dispersity than the stable radical-
free radical initiator combination [6]. Additional nitroxide radical is also used together
with the alkoxyamine to have a better control on molecular weight and dispersity in
case of fast polymerizing monomers (e.g. acrylates), or to maximize the polymerization
rate by increasing the reaction temperature. [7].
Use of NMP as a ‘grafting from’ technique in the synthesis of TPEs requires end-
group modification, due to the thermal instability of the alkoxyamine moiety. The end-
functionalization of polymers synthesized via NMP is carried out in order to introduce
new functional end-groups and improving the thermal stability [8]. In this study, it was
desired to have hydrogen terminated chains to prevent any possible reactions during
melt processing. Thiols could be used for the substitution of alkoxyamine group by a
hydrogen. The reaction is illustrated in Figure 5.2. Thiols work as a chain transfer
agent in radical polymerizations, while terminating the growing chain with a hydrogen,
initiates other chains by addition to the double bond [9].
TPE with a graft topology was achieved by grafting an amine functional NMP
initiator onto the EPM (amine-anhydride coupling) followed by graft polymerization of
styrene from the macroinitiator. The amine-functional NMP initiator was synthesized
103
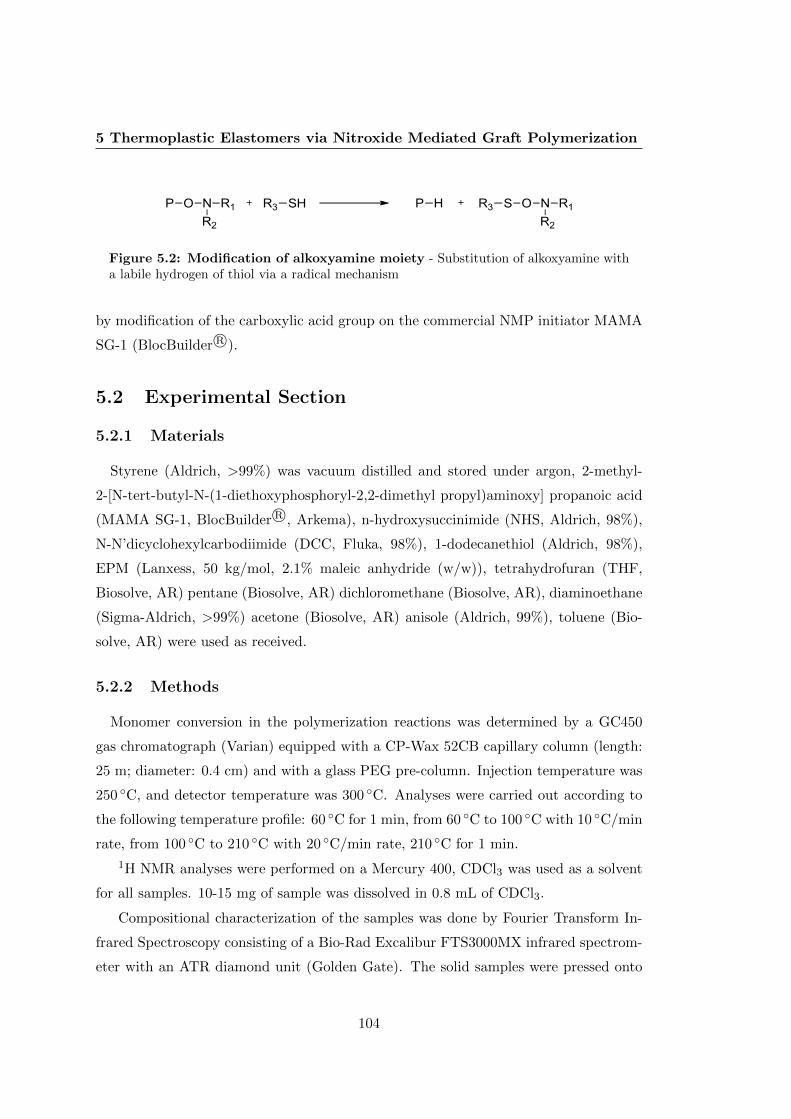
5 Thermoplastic Elastomers via Nitroxide Mediated Graft Polymerization
Figure 5.2: Modification of alkoxyamine moiety - Substitution of alkoxyamine witha labile hydrogen of thiol via a radical mechanism
by modification of the carboxylic acid group on the commercial NMP initiator MAMA
SG-1 (BlocBuilder R©).
5.2 Experimental Section
5.2.1 Materials
Styrene (Aldrich, >99%) was vacuum distilled and stored under argon, 2-methyl-
2-[N-tert-butyl-N-(1-diethoxyphosphoryl-2,2-dimethyl propyl)aminoxy] propanoic acid
(MAMA SG-1, BlocBuilder R©, Arkema), n-hydroxysuccinimide (NHS, Aldrich, 98%),
N-N’dicyclohexylcarbodiimide (DCC, Fluka, 98%), 1-dodecanethiol (Aldrich, 98%),
EPM (Lanxess, 50 kg/mol, 2.1% maleic anhydride (w/w)), tetrahydrofuran (THF,
Biosolve, AR) pentane (Biosolve, AR) dichloromethane (Biosolve, AR), diaminoethane
(Sigma-Aldrich, >99%) acetone (Biosolve, AR) anisole (Aldrich, 99%), toluene (Bio-
solve, AR) were used as received.
5.2.2 Methods
Monomer conversion in the polymerization reactions was determined by a GC450
gas chromatograph (Varian) equipped with a CP-Wax 52CB capillary column (length:
25 m; diameter: 0.4 cm) and with a glass PEG pre-column. Injection temperature was
250 ◦C, and detector temperature was 300 ◦C. Analyses were carried out according to
the following temperature profile: 60 ◦C for 1 min, from 60 ◦C to 100 ◦C with 10 ◦C/min
rate, from 100 ◦C to 210 ◦C with 20 ◦C/min rate, 210 ◦C for 1 min.
1H NMR analyses were performed on a Mercury 400, CDCl3 was used as a solvent
for all samples. 10-15 mg of sample was dissolved in 0.8 mL of CDCl3.
Compositional characterization of the samples was done by Fourier Transform In-
frared Spectroscopy consisting of a Bio-Rad Excalibur FTS3000MX infrared spectrom-
eter with an ATR diamond unit (Golden Gate). The solid samples were pressed onto
104

5.2 Experimental Section
the ATR crystal with the help of the pressure handle, 60 scans were made per spectrum
with a resolution of 4 cm−1.
Number average molar mass (M n) and dispersity (D) values were measured by
Size Exclusion Chromatography (SEC) on a Waters Alliance system equipped with
a Waters 2695 separation module, a Waters 2414 refractive index detector (35 ◦C), a
Waters 2487 dual absorbance detector, a PSS SDV 5 µm guard column followed by 2
PSS SDV linearXL 5 µm columns (8 mm * 300 mm) in series at 40 ◦C. Tetrahydrofuran
(THF stabilized with BHT, Biosolve) with 1% (v/v) acetic acid was used as eluent at a
flow rate of 1.0 mL/min. The molar masses were calculated with respect to polystyrene
standards (Polymer Laboratories, M p = 580 Da up to M p = 7.1x10⁶ Da). The samples
were dissolved in eluent solution with a concentration of 1 mg/mL and filtered through
a 0.2 µm PTFE filter (13 mm, PP housing, Alltech).
5.2.3 Synthesis of Amine-functional NMP Initiator
5.2.3.1 Synthesis of 2-methyl-2-[N-tert-butyl-N-(1-diethoxyphosphoryl-2,2-
dimehtylpropyl)amino]-N-propionylsuccinimide (NPS SG-1)
MAMA SG-1 (4.8 g, 12.6 mmol) and NHS (1.81 g, 17.7 mmol) were dissolved in 20
mL THF. The solution was degassed with Argon for 30 minutes. A degassed solution
of DCC (3 g, 14.5 mmol) in 5 mL THF was added. After stirring for 1.5 hours at
0 ◦C, the precipitated N,N’-dicyclohexylurea (DCU) was removed by filtration. The
filtrate was concentrated under vacuum to one third volume and placed at −20 ◦C.
After 2h, the residual DCU was precipitated and removed by filtration. The filtrate
was concentrated under reduced pressure. The recovered solution was precipitated
in pentane. The obtained precipitate was further washed with water to remove the
remaining NHS. After drying under vacuum at room temperature, a white powder was
recovered. Yield: 56.4% (3.4 g, 7.1 mmol).
5.2.3.2 Synthesis of 2-methyl-2-[N-tert-butyl-N-(1-diethoxyphosphoryl-2,2-
dimethylpropyl)aminoxy]-N-aminoethylpropionamide (NAP SG-1)
NPS SG-1 (3 g, 6.27 mmol) was dissolved in 30 mL dichloromethane. This was added
to a solution of etylenediamine (19.09 g, 317.65 mmol) in 30 mL dichloromethane. After
addition is complete, the reaction mixture was stirred for 5 hours at room temperature.
105

5 Thermoplastic Elastomers via Nitroxide Mediated Graft Polymerization
The solution was extracted with water (3x15 mL). Organic layer was concentrated under
vacuum at 20 ◦C, and the product was recovered as oil. Yield: 65% (1.95 g, 4.6 mmol).
5.2.4 NMP of Styrene
In a Schlenk flask, NPS SG-1 (0.05 g, 0.10 mmol) and styrene (5.22 g, 50.2 mmol) were
dissolved in 5 mL toluene, 0.5 mL anisole is added as an internal standard. The solution
was bubbled with argon for 30 minutes and the t0 sample was taken. The solution was
heated to 90 ◦C. Conversion was followed by GC and build up of molecular with SEC.
After reaching a certain conversion, the reaction was quenched and the solution was
precipitated in methanol. Subsequent to the vacuum filtration, the polymer was dried
under vacuum at ambient temperature.
5.2.5 Ex-situ Modification of ω-nitroxide Functionality
Nitroxide bearing PS (0.5 g, 0.08 mmol) and 1-dodecanethiol (30 mg, 0.15 mmol)
were dissolved in 10 mL toluene, heated to 100 ◦C and stirred for 45 minutes. The
product was isolated by precipitation in methanol, vacuum filtered and dried under
vacuum at 40 ◦C.
5.2.6 Synthesis of NMP Macroinitiator
EPM (0.5 g, 1.05x10⁻⁴ mol MAn) was heated up to 150 ◦C for 3 hours under high
vacuum in a Schlenk flask. NAP SG-1 (0.44 g, 1.05x10⁻³ mol amine functionality) was
dissolved in dry toluene (50 mL) was added and the flask was stirred until EPM was
dissolved and for additional 5 hours. The solution was precipitated in 400 mL acetone.
The macroinitiator was collected by vacuum filtration, and dried under vacuum at
ambient temperature.
5.2.7 Graft Polymerization of Styrene from Macroinitiator
The macroinitiator (0.5 g) was dissolved in 10 mL toluene and 1 mL anisole was
added as internal standard. The solution was bubbled with argon for 30 minutes in a
Schlenk flask. Styrene (4.52 g, 43.4 mmol) was added to the solution and the t0 sample
was taken. The solution was heated up to 90 ◦C. Conversion was followed by GC and
build up of molar mass with SEC. After reaching a certain conversion, the reaction was
106

5.3 Results and Discussion
quenched and the solution was precipitated in methanol. After vacuum filtration the
polymer was dried under vacuum at room temperature to remove any volatiles.
5.2.8 In-situ Modification of ω-nitroxide Functionality
During the polymerization procedure explained in Section 5.2.7, 1-dodecanethiol
(0.212 g, 1.05x10⁻³ mol) is added to the solution and the reaction was stirred at the
same temperature for 45 minutes.
5.3 Results and Discussion
5.3.1 Synthesis of Amine-functional NMP Initiator
MAMA SG-1 has a carboxylic acid group on its initiating side. By the transformation
of the acid group into an amine it will be possible to graft the initiator onto pendant
anhydride functions of EPM elastomer. Transformation of the carboxylic acid into an
amine was done in two steps, first of which was the attachment of succinimide by DCC
coupling to form an activated ester group, and subsequently reacting this succinimide
ester group with excess diamine. The reaction steps of the transformations are shown
in Figure 5.3.
Figure 5.3: Reaction steps of the transformation of MAMA SG-1 to NAP SG-1- First step is DCC coupling and the second step is aminolysis
107

5 Thermoplastic Elastomers via Nitroxide Mediated Graft Polymerization
During the attachment of succinimide on to the carboxylic acid, DCU, which forms
as an oxidation product of DCC, precipitates during the reaction and shifts the reaction
equilibrium to the right. The succinimide ester group formed is an activated ester which
is labile for nucleophilic attacks. A large excess of ethylenediamine nucleophilically
substitutes the succinimide group by minimizing the coupling reactions. Figure 5.4
shows comparative 1H NMR spectra of the SG1 derivatives.
ppm (t1)
1.02.03.04.05.06.07.08.0
ppm (t1)
1.02.03.04.05.06.07.08.0
ppm (t1)
1.02.03.04.05.06.07.08.0
a
b
c
d
e
a
a
a
b
b
d
d
c
e
f
g
f
g
h
j
j h
d
c
c
e
e
f
f
b
g
g
a
a
b
b
c
d
c
d
e
e
f
f
Figure 5.4: Comparative 1H NMR spectra of the SG1 derivatives - MAMA SG-1(bottom), NPS SG-1 (middle) and NAP SG-1 (top)
Integration on 1H NMR spectra of the derivatives shows that the isolated products
obtained the desired functionalities quantitatively. In the transformation of NPS SG-
1 into NAP SG-1, the product obtained was not completely isolated from the NHS
formed as a side product. The shift, which is seen at 2.8 ppm in the 1H NMR spectrum
of NAP SG-1 in Figure 5.4, is caused by the methylene protons of NHS. This shift is
seen in spectra of both NPS SG-1 and NAP SG-1, which leads one to suspect whether
the transformation is complete or not. Additionally, the shift of the proton of the
hydroxide group is not visible. However, the integration values of methylene protons
108

5.3 Results and Discussion
adjacent to phosphoryl group and methylene protons adjacent to the formed amide are
in agreement with the fact that succinimide ester groups are quantitatively converted
to amide. On the other hand, the integration values of methylene protons adjacent to
amide, amine and the protons of amine moiety are also in agreement with complete
conversion and selectivity. This fact also eliminates the possibility of coupling of two
SG-1 molecules in case of insufficient amount of diamine.
5.3.2 A pre-study: NMP of Styrene
Homopolymerization of styrene in toluene via NMP was investigated in order to have
an insight in polymerization kinetics depending on the concentration and temperature.
The findings of this study were expected to clarify the conditions to be applied for the
graft polymerization of styrene from EPM-g-SG1 macroinitiator. Table 5.1 summarizes
the reaction conditions and results of the polymerizations performed. MAMA SG-1 and
NPS SG-1 were comparatively used as an initiator in order to investigate the effect of
the structure of initiating moiety on reaction rate and controllability.
Table 5.1: Reaction conditions and results of NMP reactions
Run [Mon]:[Ini] Ini. t(h) T M n DR112 384:1 MAMA SG-1 28 90 7375 1.3R116 400:1 MAMA SG-1 47 90 18521 1.24R119 420:1 MAMA SG-1 27 90 18526 1.2R122 46:1 MAMA SG-1 3.5 90 820 1.05R106 476:1 NPS SG-1 6.5 95 6340 1.23R108 561:1 NPS SG-1 100 90 11038 1.36R110 357:1 NPS SG-1 53 100 26770 1.3R124 51:1 NPS SG-1 4.2 110 1961 1.1
The conversion of polymerization reactions performed with MAMA SG-1 was not
possible to follow with GC due to the dramatically fluctuating concentration values.
This was possibly due to the overlapping peaks of internal standard and dissociation
product of the MAMA SG-1 during GC measurement. However, a reasonable in-
crease in molar mass was observed in SEC measurements. Therefore, instead of the
ln([M]0/[M]t), ln(M n) was followed as a function of time. Polymerization studies of
styrene with MAMA SG-1 showed linear increase of ln(M n) against time. Two ln(M n)
and D vs. time plots of R119 and R122 are shown in Figure 5.5.
Plot of R119 shows a linear growth of ln(M n) against time up to 50% conversion,
roughly. Conversion values were estimated from the comparison of the M n values
109

5 Thermoplastic Elastomers via Nitroxide Mediated Graft Polymerization
20 40 60 80 100 120 140 160 180 200 220
1.000
1.025
6.55
6.60
6.65
6.70
6.75
Ð \
\ ln
(M
n)
time (min)
1250 1300 1350 1400 1450 1500 1550 1600 1650
1.1
1.2
9.60
9.65
9.70
9.75
9.80
9.85
9.90
Ð \
\ ln
(M
n)
time (min)
Figure 5.5: D and ln(M n) vs. time plots - R119 (right), R122 (left)
measured by SEC and theoretical M n to be reached at 100% conversion. Dispersity
values are also virtually constant. Plot of R122 gives an idea for the initiation behavior
of the polymerization. Linear growth of M n is observed up to 17% conversion, and
dispersity values remain constant at 1.03.
Polymerizations have also been performed in the presence of NPS SG-1. Conversion
values were successfully measured by GC. The last five entries in the table 5.1 are the
polymerizations done in the presence of NPS SG-1. The GC measurements were found
to be more realistic in the polymerizations performed by the NPS SG-1 than the ones
performed with MAMA SG-1, therefore conversion values were also taken into account
besides the ln(M n) vs. time plots. Figure 5.6 shows M n vs. conversion and ln([M]0
/[M]t) vs. time plots of the reactions performed at different temperatures (table 5.1).
The kinetic plots of the polymerizations show that there is slow initiation. When
the temperature is increased, slow initiation behavior diminishes. R110 gave the best
results in terms of controllability of the reaction, however 50% conversion has been
reached in 50 hours. R124 was found to be much faster, however the rate of initiation
was not compatible with the rate of propagation. Thus, slow initiation behavior was
observed in the kinetic plot of R124. Dispersity values remain constant at the values
entered in Table 5.1.
110

5.3 Results and Discussion
0 1000 2000 3000 4000 5000
0.00
0.05
0.10
0.15
0.20
0.25
0.30
0.35
ln([
M0]/[M
t])
time (min)
R108
0.00 0.05 0.10 0.15 0.20 0.25 0.30
1000
2000
3000
4000
5000
6000
7000
8000
9000
Mn
conversion
0.9037
R108
50 100 150 200 250 300 350 400 450
0.04
0.05
0.06
0.07
0.08
0.09
0.10
0.11
0.12
0.13
ln([
M0]/[M
t])
time (min)
R106
0.04 0.05 0.06 0.07 0.08 0.09 0.10 0.11 0.12
2000
3000
4000
5000
6000
Mn
conversion
0.9936
R106
0 500 1000 1500 2000 2500 3000 3500
0.0
0.2
0.4
0.6
0.8
1.0
ln([
M0]/[M
t])
time (min)
R110
0.1 0.2 0.3 0.4 0.5 0.6
0
5000
10000
15000
20000
25000
Mn
conversion
0.997
R110
60 80 100 120 140 160 180 200 220
0.05
0.10
0.15
0.20
0.25
0.30
0.35
0.40
0.45
ln([
M0]/[M
t])
time (min)
R124
0.05 0.10 0.15 0.20 0.25 0.30 0.35
1200
1400
1600
1800
2000
Mn
conversion
0.974
R124
Figure 5.6: ln([M]0/[M]t) vs. time and M n vs. conversion plots - from top tobottom, R108, R106, R110, R124 (see Table 5.1)
111

5 Thermoplastic Elastomers via Nitroxide Mediated Graft Polymerization
5.3.3 In-situ and Ex-situ End-modification of ω-nitroxide-functional
PS
The nitroxide moiety at the end of the grafted chains leads to crosslinking during
high temperature processing, due to high activation rate at high temperatures that
leads to termination by combination. Therefore, investigation on the end-modification
of PS was necessary. The end-modification was done both in-situ and ex-situ. In-situ
modification would be preferred, since the number of steps decreases and the probabil-
ity of termination reactions during the isolation of the polymer would be eliminated.
However, in-situ reactions performed in the model polymerizations resulted in initia-
tion of new chains. Free nitroxide radicals present in the solution end-cap the newly
initiated chains, therefore a linear increase is observed in ln([M]0/[M]t) vs. time plots,
with a sharp change in the slope (Figure 5.7).
R124
50 100 150 200 250
0.0
0.1
0.2
0.3
0.4
0.5
0.6
0.7
0.8
ln([
M] 0
/[M
] t)
time
thiol
addition
Figure 5.7: ln([M]0/[M]t) vs. time plot of R124 - The reaction conditions are inTable 5.1
The 1H NMR spectrum of the isolated PS after thiol treatment was indicating that
the SG-1 moiety remained. This could be due to the SG-1 moiety attached to the newly
initiated chains, or a non-complete end-functionalization. Therefore, the reaction was
done ex-situ, where no monomer is present to be initiated to form new chains. 1H
NMR spectrum showed that signals of SG-1 moiety at the end of the chain disappeared
(Figure 5.8).
The ex-situ modification was done at both 90 ◦C and 100 ◦C. After 45 minutes, the
112
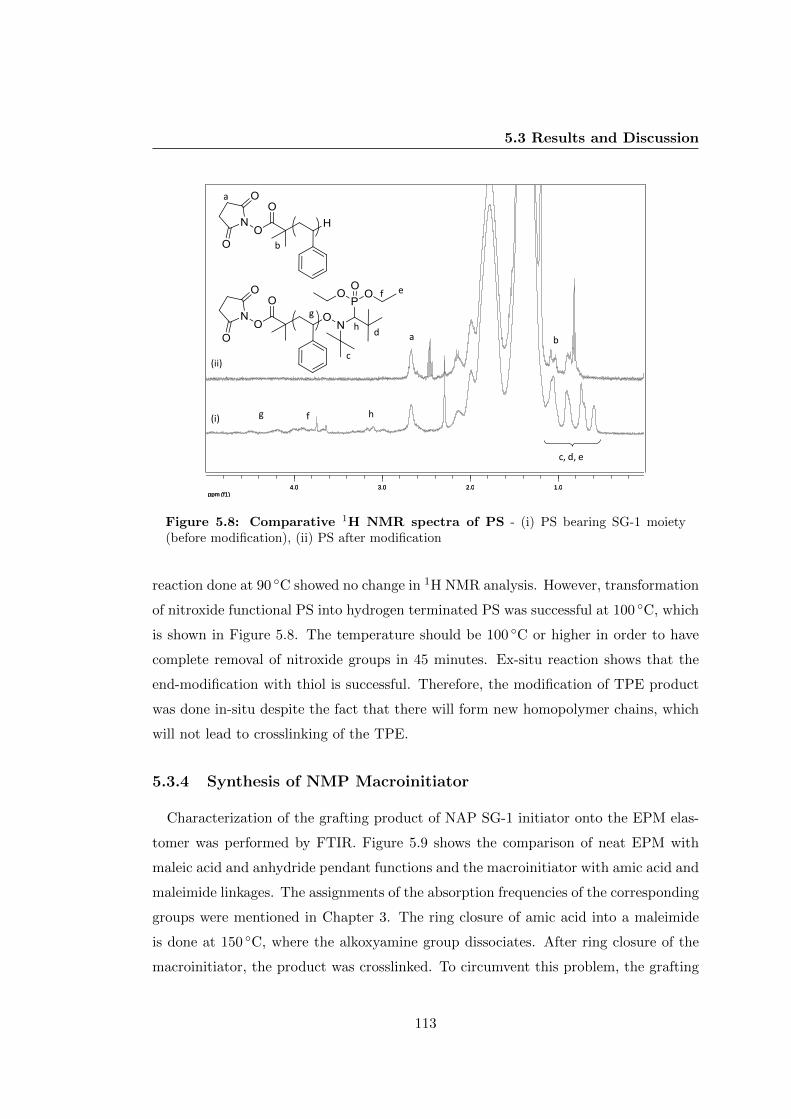
5.3 Results and Discussion
ppm (f1)1.02.03.04.0
ppm (f1)1.02.03.04.0
(i)
(ii)
a
a
b
b
c
c, d, e
d
e f
g
h
h f g
Figure 5.8: Comparative 1H NMR spectra of PS - (i) PS bearing SG-1 moiety(before modification), (ii) PS after modification
reaction done at 90 ◦C showed no change in 1H NMR analysis. However, transformation
of nitroxide functional PS into hydrogen terminated PS was successful at 100 ◦C, which
is shown in Figure 5.8. The temperature should be 100 ◦C or higher in order to have
complete removal of nitroxide groups in 45 minutes. Ex-situ reaction shows that the
end-modification with thiol is successful. Therefore, the modification of TPE product
was done in-situ despite the fact that there will form new homopolymer chains, which
will not lead to crosslinking of the TPE.
5.3.4 Synthesis of NMP Macroinitiator
Characterization of the grafting product of NAP SG-1 initiator onto the EPM elas-
tomer was performed by FTIR. Figure 5.9 shows the comparison of neat EPM with
maleic acid and anhydride pendant functions and the macroinitiator with amic acid and
maleimide linkages. The assignments of the absorption frequencies of the corresponding
groups were mentioned in Chapter 3. The ring closure of amic acid into a maleimide
is done at 150 ◦C, where the alkoxyamine group dissociates. After ring closure of the
macroinitiator, the product was crosslinked. To circumvent this problem, the grafting
113

5 Thermoplastic Elastomers via Nitroxide Mediated Graft Polymerization
reaction from the macroinitiator was done without closing the ring. This leads to the
question about the thermal stability of the amic acid. The reaction of an anhydride
and an amine is known to be a thermally reversible reaction for low molar mass amines
[10].
1300 1400 1500 1600 1700 1800 1900
wavenumber (cm-1)
EPM-g-SG1 (imide)
EPM-g-SG1 (amic acid)
EPM-MAn
EPM-MA
Figure 5.9: Comparative FTIR spectra of EPM with different pendant func-tions - The spectra are shifted for clarity
The thermal reversibility of the amic acid linkage on the EPM was investigated by
FTIR. Figure 5.10 shows the shift in the signal from 1720 to 1705 cm−1 which indicates
that amic acid is converted into maleimide. The measurement is done at 100 ◦C, which
is the graft polymerization temperature of styrene from the macroinitiator.
FTIR analysis was also used for quantitative characterization of the grafting effi-
ciency of NAP SG-1 onto the EPM. Following the ring closure of the amic acid linkages
on the macroinitiator, an FTIR spectrum was taken. The remaining anhydride signal
was compared with the anhydride signal of neat EPM. In the case that no anhydride
signal was observed, the grafting was considered to be complete. Stoichiometric ratio
amine functions of NAP SG-1 to anhydride functions of EPM resulted in quantitative
coupling.
114

5.3 Results and Discussion
500 1000 1500 2000 2500 3000 3500
wavenumber (cm-1)
0
10min
20min
30min
40min
50min
1h
2h
3h
4h
5h
1450 1500 1550 1600 1650 1700 1750 1800
Figure 5.10: FTIR spectra of EPM-g-SG1 - Follow-up of absorption signals of pen-dant carbonyl functions as a function of time
5.3.5 Graft Polymerization of Styrene from Macroinitiator and In-
situ Modification of the Nitroxide Functionality
Graft polymerization of styrene was performed at 100 ◦C, at which the model reac-
tions showed highest propagation rate with minimum termination. ln([M]0/[M]t) vs.
time plot of a graft polymerization of styrene from EPM-g-SG1 macroinitiator is shown
in Figure 5.11, on the left hand side. R2 value of the curve is close to unity that the
graft polymerization was considered to be controlled.
The TPEs were synthesized by varying the molecular weight of grafted PS. Table 5.2
shows the parameters and the summary of the characterization results of the reactions
performed.
Table 5.2: Reaction conditions and results of graft polymerizations
Run St/EPM t(h) conv. M n %PS(w/w) (%) (PS)
R132 1 29 40 3500 28R134 2 35 18 3000 25R136 3 37 23 5000 40
The polymerization was followed by SEC as well. Besides the shift in the retention
time of the elastomer peak, formation of PS homopolymer was also observed (Figure
115

5 Thermoplastic Elastomers via Nitroxide Mediated Graft Polymerization
0 5 10 15 20 25 30
0.0
0.1
0.2
0.3
0.4
0.5
0.6
ln([
M] 0
/[M
] t)
time (h)
0.999
R132
0 5 10 15 20 25 30
0.0
0.1
0.2
0.3
0.4
0.5
0.6
0.7
0.8
0.9
ln([
M] 0
/[M
] t)
time (h)
thiol
addition
Figure 5.11: ln([M]0/[M]t) vs. time plot - the NMP of styrene from EPM-g-SG1(R132) before thiol addition (left), and that before and after the thiol addition
5.12). Homopolymer formation could be due to the remaining trace amounts of NAP
SG-1 in the macroinitiator during the work-up of its synthesis. However, the remaining
initiators worked as sacrificial initiator and homopolymer peak observed in the SEC
measurements were used for the estimation of the molar mass of the grafted PS chains.
The molar mass of grafted chains and free chains were considered to be the same [11].
The molar mass obtained from SEC measurements are in agreement with the theoret-
ically calculated value. In the same figure, a slight high molar mass shoulder starts to
form in the sample taken after 28 hours, which is indicative of heavier branching or
slight crosslinking.
UV traces of the samples were followed as a function of time during the graft
polymerization. An example for the run R134 is shown in Figure 5.13. The traces show
that the UV activity of the peak corresponding to the grafted product is increasing
(peak at 17.0 min), and after thiol addition, a slight decrease was observed (due to
the substitution of the alkoxyamine end-groups), and the intensity of the signal of
the sample taken after 3 hours showed no decrease in the UV activity of the grafted
product, which means the end-group modification is complete. Remaining UV activity
of the peak is due to grafted PS.
1-Dodecanethiol was added after a certain conversion was reached, and reaction
was kept at the same temperature. Following the thiol addition the polymerization
rate dramatically increased, which is shown in Figure 5.11, on the right-hand side.
However, no increase of the molar mass was observed in the homopolymer present in
116

5.3 Results and Discussion
14 16 18 20 22 24
0.0
0.2
0.4
0.6
0.8
1.0n
orm
aliz
ed
RI
retention time (min)
4 h
16.5 h
28 h
Figure 5.12: RI traces of samples of R132 taken sequentially - Grafted product(peak at 17.0 min) and PS free homopolymer (peak at 22 min)
14 16 18 20 22
0.00
0.01
0.02
UV
sig
na
l (2
54
nm
)
retention time (min)
t0
t10
t20
t35
t36
(a.t.)
t39
(a.t.)
Figure 5.13: UV traces of samples of R134 taken sequentially - UV traces duringpolymerization and after thiol addition (a.t.)
117

5 Thermoplastic Elastomers via Nitroxide Mediated Graft Polymerization
the mixture, which indicates that the elimination of the nitroxide was successful, and
thiyl radical formed by the hydrogen abstraction initiated new chains.
The change in the reaction rate is more significant in grafting reactions than in
the homopolymerization of styrene (compare Figure 5.7 and Figure 5.11). The rate of
polymerization after thiol addition in PS homopolymerization is two times larger than
that in graft polymerization, despite the fact that thiol was used in larger excess in
graft polymerization. The high viscosity of the medium results in slower diffusion of
the thiol compound into the elastomeric medium and slower propagation of the new
chains. However, propagation of the new chains is still much faster than the graft
polymerization rate relative to the rate of PS homopolymerization.
5.4 Conclusions
Synthesis of styrenic TPE with graft topology was successful with NMP ‘grafting
from’ approach. The alkoxyamine initiators used were found to be successful in control-
ling molar mass and the dispersity of the growing polymer. The modification of MAMA
SG-1 into NAP SG-1 was done in two steps and overall yield was 36%. Macroinitiator
was synthesized via amine-anhydride coupling of NAP SG-1 and EPM, and resulted
in high coupling efficiency. This indicates that the grafting density can be tuned by
varying the stoichiometry of the reactants. Trace amounts non-grafted alkoxyamine
initiator was the most probable cause of homopolymerization of styrene during the
graft polymerization. However, this trace amount of homopolymer gave an indication
for the progress of the molar mass of the PS growing from the macroinitiator, and the
performance of the thiol addition. Thiol worked successfully as a chain transfer agent
in these NMP reactions. Ex-situ reactions showed that thiol leads to the substitution
of alkoxyamine end-group with the labile hydrogen of the thiol, and the reaction is
complete in less than 1 hour at 100 ◦C. In-situ reactions lead to the initiation of new
chains and the continuation of the NMP of styrene, therefore the end-modification was
not observed in 1H NMR analysis. However, ex-situ reactions showed that the end-
modification with thiol is successful. Therefore, the end-functionalization of graft TPE
was possible to be done in-situ. The TPE products obtained at the end of NMP graft
polymerization and thiol treatment were soluble, indicating no significant crosslinking
is present. With ‘grafting from’ approach, it is found to be possible to tune the molar
118

5.4 Conclusions
mass of graft chains and end-modify them in-situ by quenching the polymerization by
a thiol at desired conversion.
119

5 Thermoplastic Elastomers via Nitroxide Mediated Graft Polymerization
120

Bibliography
[1] K. Matyjaszewski, H. Dong, W. Jakubowski, J. Pietrasik, and A. Kusumo. Lang-muir, 23(8):4528–4531, 2007. 102
[2] P. De, M. Li, S. R. Gondi, and B. S. Sumerlin. Journal of the American ChemicalSociety, 130(34):11288–11289, 2008. 102
[3] G. Cheng, A. Bker, M. Zhang, G. Krausch, and A. H. E. Mller. Macromolecules,34(20):6883–6888, 2001. 102
[4] R. B. Grubbs, C. J. Hawker, J. Dao, and J. M. J. Frchet. Angewandte ChemieInternational Edition in English, 36(3):270–272, 1997. 102
[5] D. Roy, J. T. Guthrie, and S. Perrier. Macromolecules, 38(25):10363–10372, 2005.102
[6] C. J. Hawker, G. G. Barclay, A. Orellana, J. Dao, and W. Devonport. Macro-molecules, 29(16):5245–5254, 1996. 103
[7] C. Detrembleur, V. Sciannamea, C. Koulic, M. Claes, M. Hoebeke, and R. Jrme.Macromolecules, 35(19):7214–7223, 2002. 103
[8] E. Harth, C. J. Hawker, W. Fan, and R. M. Waymouth. Macromolecules,34(12):3856–3862, 2001. 103
[9] L. Petton, A. E. Ciolino, B. Dervaux, and F. E. Du Prez. Polym. Chem., 3:1867–1878, 2012. 103
[10] C. X. Sun, M. A. J. van der Mee, J. G. P. Goossens, and M. van Duin. Macro-molecules, 39(9):3441–3449, 2006. 114
[11] C. Bartholome, E. Beyou, E. Bourgeat-Lami, P. Chaumont, and N. Zydowicz.Macromolecules, 36(21):7946–7952, 2003. 116
121

BIBLIOGRAPHY
122

6
Structure-Property Relations of
TPEs with Graft Topology
Abstract
TPEs sythesized via various approaches, which are introduced and discussed in the
previous chapters, are investigated in terms of the relations between the molecular struc-
ture, morphology and thermomechanical and tensile properties of the material. The
graft TPEs with the ultimate properties are compared to TPEs with block topology.
The structure-property relations are investigated with respect to the coupling efficiency,
molar mass, composition and stoichiometry of the components, and the topology of the
samples. In this chapter, these parameters are introduced and data obtained via visual
and mechanical analyses of TPEs are elaborated and discussed in terms of achieving
ultimate mechanical properties.
123

6 Structure-Property Relations of TPEs with Graft Topology
6.1 Introduction
Thermal and mechanical properties of a material could be classified in two main cat-
egories: parameters determining the primary structure (composition and constitution),
and parameters determining the secondary structure (mesostructure or intermolecular
interactions). The primary structure is determined by the techniques used for macro-
molecular design, and it is supposed to not be affected by physical processes applied.
Secondary structure is also determined by the macromolecular design in the first place,
however, the thermal and mechanical processes affect the ultimate mesostructure.
Primary structure of a polymer is controlled by its composition, configuration and
constitution. Polymerization techniques determine the configuration and the consti-
tution of the polymer. An example could be the substituent groups on the metal
complexes used in metal-catalyzed polymerization of olefins that are determining the
stereoregularity of the polymer chain. The control on stereoregularity provides a con-
trol on the crytallization behavior of the polymer, which essentially determines the
secondary structure. Configurational and compositional characteristics of the metal
complex can also introduce constitutional changes, such as branching. Constitution of
a polymer could as well be adjusted just by choosing the monomers which have spe-
cific characteristics. For instance, maleic anhydride does not homopolymerize but only
copolymerize, of which the copolymerization with a co-monomer consequently may re-
sult in an alternating copolymer. Block and graft topologies are possible to build with
CRP techniques, which provides living chains to be transformed into various functions
that can be used for further polymerization or coupling reactions.
The secondary structure of a polymer is mainly determined by the primary struc-
ture. However, physical conditions as temperature or shear affect the way of physical
organization of the polymer chains. For instance, the heating rate determines the size
of the spherulites in polyolefins, which directly affects the morphology and resultant
properties of the material. Shear could convert the lamellar crystals into extended
chain crystals which consequently forms different microstructures, such as shish-kebab
morphology [1]. Crystalline parts, which have a different density and microstructure,
consequently behave as a different phase. This phenomenon is called crystallization-
induced phase segregation [2].
124

6.2 Experimental Section
Fully amorphous polymers phase separate due to the thermodynamic incompati-
bility of the polymer chains. This is generally a result of the different compositions
of the chains. A blend composed of two incompatible polymer shows a macro-phase
separation, where the size of the phases is in the micrometer range. The size of the sep-
arated phases in blends could be decreased by compounds called compatibilizers, or by
modification both or one of the components, which enhances the physical interactions
between the two phases.
Synthesis of well-defined copolymer topologies exhibiting phase-separation by CRP
techniques is in fact the ultimate point of compatibilizing blends. Well-defined struc-
tures show well-defined and tunable properties. Control of the macromolecular archi-
tecture of the copolymers provides an extra level on controlling the phase separation
behavior of these materials. A review by Ruzette et al., which summarizes the re-
lation between the topology and self-assembly behavior of block copolymers mainly
synthesized by CRP techniques [3], claims that combination of molecular disorder
and self-assembly of well defined copolymers leads to unique properties of copoly-
mer/homopolymer blends.
In this chapter, TPEs synthesized via ‘grafting onto’ and ‘grafting from’ approaches
will be compared with each other and with commercial styrenic triblock copolymers in
terms of morphology, thermomechanical properties and tensile properties. TPE samples
are blends of graft copolymers and homopolymers of the components in various ratios.
This graft copolymer homopolymer blend results in a mixed morphology of macro-
phase separation and micro-phase separation. The aim of this study is to understand
the effect of the changes in the macromolecular design on the morphology and the
properties of the corresponding TPE.
6.2 Experimental Section
6.2.1 Materials
TPE’s synthesized in Chapter 3, 4 and 5 were used as synthesized, poly(styrene-b-
ethylene/butylene-b-styrene) triblock copolymers (SEBS, Kraton grades G1650, G1652,
G1657 and G1730), toluene (Biosolve, AR), tetrahydrofuran (THF, Biosolve, AR) were
used as received.
125
6 Structure-Property Relations of TPEs with Graft Topology
6.2.2 Methods and Characterization Techniques
6.2.2.1 TEM Measurements of the Samples
All TEM grids were glow discharged prior to being used for sample preparation.
Each polymer sample was dissolved in toluene at 1 mg/mL concentration. A couple of
drops of solution were dripped in a petri dish containing a layer of water. After toluene
was evaporated, the formed polymer film was transferred to the TEM grid by carefully
submerging the grid in the water beneath the film layer with the help of tweezers and
dragging the grid upwards. The sample grids were placed on a petri dish and annealed
at 120 ◦C in a vacuum oven for 24 hours. Subsequently, EPM-g-PS sample grids were
vapor stained by ruthenium tetraoxide, and PB-g-PS sample grids were vapor stained
by osmium tetroxide for 15 minutes.
Phase separation behavior of the graft TPEs was investigated by transmission elec-
tron microscopy (TEM) measurements performed with a FEI Tecnai 20, type Sphera
TEM instrument with a LaB6 filament and operating voltage of 200 kV.
6.2.2.2 Compression Molding of the TPE Samples
Synthesized TPE samples were compression molded into rectangular molds with 0.5
mm thickness. Typically, compression mold with dimensions of 25 x 35 x 0.5 mm was
filled 1 g of TPE, compression molded between teflon sheets for 15 minutes under 200
bar at 130 ◦C.
6.2.2.3 DMTA Analysis of TPE Samples
Rectangular samples with dimensions of 15 x 5.3 x 0.5 mm were attached between
tension film clamps and measured within a temperature range from 100 ◦C to 200 ◦C at
a heating rate of 3 ◦C/min and a frequency of 1 Hz on DMA Q800 (TA instruments).
6.2.2.4 Tensile Tests of TPE Samples
Dumbbell-shaped tensile bars with dimensions of 35 x 2 x 0.5 mm and a parallel
specimen length of 17.5 mm were punched from compression-molded films. Tensile
tests were performed at room temperature with a constant speed of 1 mm/s on a Zwick
Z010 tensile tester equipped with 100 N force cell using TextXpert v7.11 software.
Three to six replicate measurements were performed for each material.
126
6.3 Results and Discussion
6.2.2.5 Interpretation of Data
In TEM images of EPM-g-PS and SEBS samples, the dark phases are the PS domain
and the light phases are the elastomeric domain (samples were stained by ruthenium
tetroxide). In TEM images of PB-g-PS samples, the dark phases are the elastomeric
phase and the light phases are the PS phase (samples were stained by osmium tetrox-
ide).
In DMTA measurements, the width of the rubber plateau was defined as the tem-
perature region between two T gs. The T g of the soft and the hard phases were obtained
by the tan δ vs. temperature curves. The storage modulus values of the rubber plateau
were taken from three different temperature points (E′1, E′2, and E′3) for the indication
of the temperature dependence.
The maximum stress (σmax), the stress at break (σR) and the strain at break (εR)
values of the samples were taken as the average of the measurements excluding the
highest and the lowest measurement value. Stress values were also recorded at 50%
strain (σ50) and 100% strain (σ100) if applicable.
6.3 Results and Discussion
TPE samples, the synthesis and characterization of which were discussed in Chapters
3, 4 and 5, were compared in terms of morphology and mechanical properties. The
chemical properties of the products of amine-anhydride coupling and thiol-ene coupling
discussed in this chapter are listed in Tables 6.1 and 6.3, respectively. Tables 6.2 and
6.4 show the mechanical properties of the products of amine-anhydride coupling and
thiol-ene coupling reactions, respectively. Samples prepared by nitroxide mediated graft
polymerization compared to styrenic TPEs with triblock copolymer topology will be
discussed in Section 6.3.6.
6.3.1 Morphology of the Graft TPEs: A General Comparison
The phase separation is the key concept of the thermoplastic elastomer behavior.
Both di/triblock copolymers and elastomer/thermoplastic polymer blends exhibit phase
separation. However, the size and the shape of the domains are strongly dependent on
the ordering behavior of the polymer chains constructing the mesostructure. This
127

6 Structure-Property Relations of TPEs with Graft Topology
Table 6.1: Chemical properties EPM-g-PS samples
Sample EPM/PS M n CEPS CEEPM
(w/w) (PS) (%) (%)C125 1 5800 67 577C128 2 10000 74 179C104 2 5800 75 326C118 2 10000 38 92C105 4 5800 70 152C106 5 2300 79 343C107 9 2300 80 177C119 4 10000 15 19C122 3 10000 30 50C124 2 2300 64 709C130 9 10000 56 31C141A 4 4800 19 51C141B 4 4800 20 63C141C* 4 4800 20 28C141D 4 4800 12 34C301** 4 6000 5 114C302 4 6000 11 15.6C114 3.3 5800 62 163C115 3.3 5800 62 163C116 3.3 5800 60 158C117 1 10000 37 179C120 9 10000 21 11C123 9 5800 52 50*EPM 25 kg/mol**Samples C301 and C302 are EPM-g-P(SMI)
phase behavior of the segments is one of the main parameters affecting the mechanical
properties.
A comparison of TEM images of EPM/PS blend, SEBS triblock copolymer (Kraton
G1652) and EPM-g-PS sample with 20 wt% PS content is shown in Figure 6.1. Kraton
G1652 is an SEBS triblock copolymer, with 30 wt% PS content. In general, a blend of
two imcompatible polymer exhibits macro-phase separation, as it is seen in the most
right image in the Figure 6.1, the size of the dispersed domain is in the micrometer
range. As far as these two components are compatibilized via the formation of covalent
bonds among incompatible chains, the size of the dispersed domains decreases (middle
image), and finally a material with incompatible segments completely covalently bonded
shows micro-phase separation (left image).
The EPM-g-PS sample used in Figure 6.1 is sample C105 (Table 6.2). This sample
has a 70% coupling efficiency with respect to the total PS content. The remaining 30%
PS consists of free chains and is present as a blend in the material. This results in a
mixture of macro and microphase separation in the morphology of the material, which
consequently leads to a heterogeneous morphology throughout the sample structure.
128

6.3 Results and Discussion
Table 6.2: Mechanical properties of the EPM-g-PS samples
Sample Tg Tg Storage modulus (MPa) σmax σR εR σ50 σ100(soft) (hard) E′1 E′2 E′3 (MPa) (MPa) (MPa) (%)
C125 -57 - 705 460 365 6.5 6.5 1.7 - -C128 -61 103 220 190 160 3.3 3.2 2.3 - -C104 -55 104 35 24 11 3.3 3.2 307.7 1.7 2.1C118 -54 - 230 190 165 1.4 1.4 1.2 - -C105 -56 - 14 9 3 1.3 1.7 273.4 1.2 1.4C106 -55 90 30 20 10 2.2 2.0 277.8 1.8 1.9C107 -56 93 3 2 1.5 0.4 0.3 138.8 0.4 0.4C119 -53 - 8 6 3 0.6 0.4 78.1 0.5 -C122 -56 105 60 45 25 1.3 1.3 5.1 - -C124 -59 89 180 130 90 3.9 3.0 194.8 3.4 3.6C130 -56 105 4 2 1 0.5 0.3 246.9 0.4 0.5C141A -54 - 6 2.5 1 1.1 1.0 256.7 1.0 1.1C141B -57 105 10 7 4 1.8 1.3 271.5 1.2 1.4C141C -56 - 7 4 2 0.4 0.3 80.3 0.3 -C141D -54 110 5 3 2 1.1 0.9 359.9 0.9 1.0C301 -58 - 6 3.5 1 0.9 0.62 145.6 0.9 0.9C302 -58 - 5 3 1 1.0 0.63 122.0 1.0 0.9C114 -51 99 40 30 17 2.0 1.6 67.3 1.8 -C115 -53 97 37 30 17 1.6 1.2 117.2 1.6 0.9C116 -53 97 45 35 25 2.1 1.7 107.3 2.0 1.8C117 -56 - 40 20 3 0.9 0.9 5.3 - -C120 -56 - 5 3 1.5 0.4 0.3 186.4 0.4 0.4C123 -51 - 5 3 1 0.4 0.3 158.8 0.4 0.4
6.3.2 Effect of Stoichiometry of the Components
6.3.2.1 Morphology
TPEs with graft morphology were compared in terms of PS content. Variation in the
weight fraction of PS does not make a significant difference in the morphology of the
samples. However, due to the presence of free PS and elastomer chains, materials show
a highly heterogeneous morphology. Sample C130 has a coupling efficiency lower than
sample C128, therefore the morphology of C130 is more heterogeneous than that of
sample C128. In Figure 6.2, the top two images belong to C130 showing the variation
of morphology in different areas of the sample due to the relatively lower coupling
efficiency. The bottom two images belong to the C128 sample, in which the variation
in morphology is less due to the higher coupling efficiency.
6.3.2.2 Thermomechanical Properties
Increasing the PS content in the TPEs increases the modulus regardsless of the
coupling efficiency, just due to the increased stiffness of the sample by the filler effect
of the PS. An example of a comparison between EPM-g-PS samples is shown in Figure
129

6 Structure-Property Relations of TPEs with Graft Topology
Figure 6.1: Comparative TEM images of a Kraton G1652 (left), EPM-g-PS(middle), and EPM/PS blend (right) - The scale bar is 100 nm, 200 nm and 500 nm,respectively
Figure 6.2: TEM images of EPM-g-PS samples - C130 (top), C128 (bottom), thescale bar is 200 nm
130
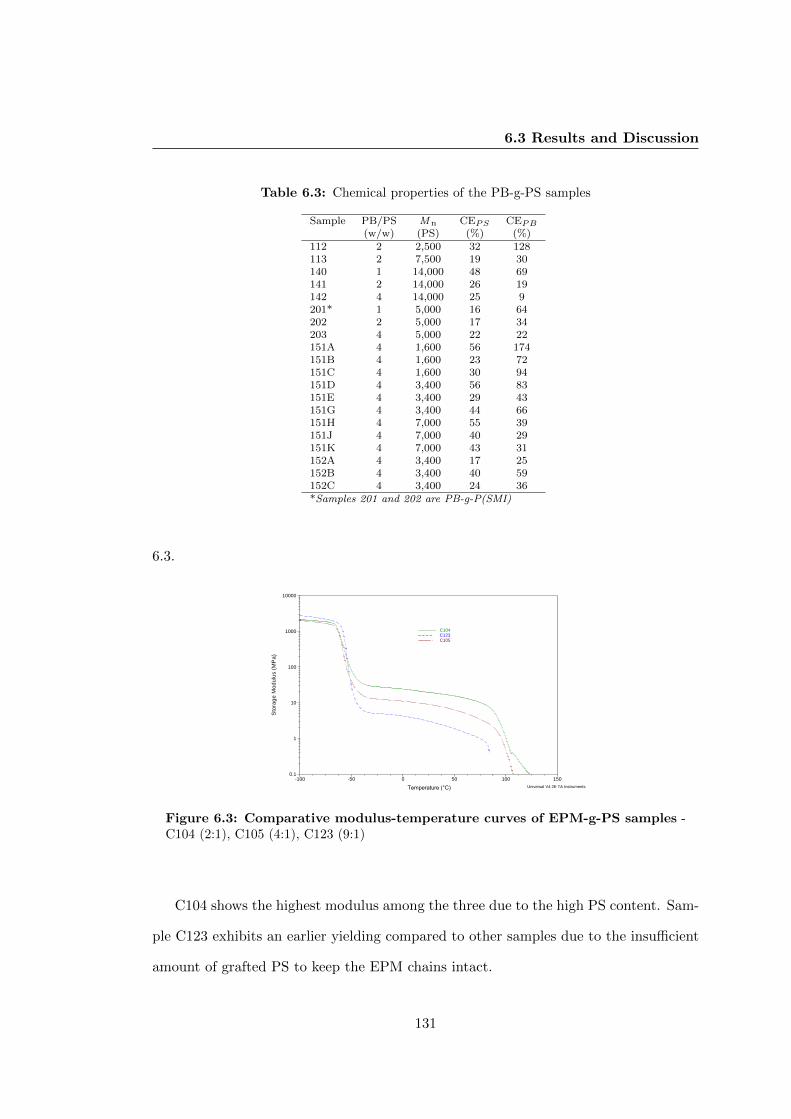
6.3 Results and Discussion
Table 6.3: Chemical properties of the PB-g-PS samples
Sample PB/PS M n CEPS CEPB
(w/w) (PS) (%) (%)112 2 2,500 32 128113 2 7,500 19 30140 1 14,000 48 69141 2 14,000 26 19142 4 14,000 25 9201* 1 5,000 16 64202 2 5,000 17 34203 4 5,000 22 22151A 4 1,600 56 174151B 4 1,600 23 72151C 4 1,600 30 94151D 4 3,400 56 83151E 4 3,400 29 43151G 4 3,400 44 66151H 4 7,000 55 39151J 4 7,000 40 29151K 4 7,000 43 31152A 4 3,400 17 25152B 4 3,400 40 59152C 4 3,400 24 36*Samples 201 and 202 are PB-g-P(SMI)
6.3.
0.1
1
10
100
1000
10000
Sto
rag
e M
od
ulu
s (
MP
a)
-100 -50 0 50 100 150
Temperature (°C)
C104––––––– C123– – – – C105––––– ·
Universal V4.2E TA Instruments
Figure 6.3: Comparative modulus-temperature curves of EPM-g-PS samples -C104 (2:1), C105 (4:1), C123 (9:1)
C104 shows the highest modulus among the three due to the high PS content. Sam-
ple C123 exhibits an earlier yielding compared to other samples due to the insufficient
amount of grafted PS to keep the EPM chains intact.
131

6 Structure-Property Relations of TPEs with Graft Topology
Table 6.4: Mechanical properties of the PB-g-PS samples
Sample Tg Tg Storage modulus (MPa) σmax σR εR σ50 σ100(soft) (hard) E′1 E′2 E′3 (MPa) (MPa) (MPa) (MPa) (%)
112 -18 106 6 4 3 2.3 2.3 252.0 0.9 1.2113 -27 120 5 3 2 3.8 3.7 912.6 0.8 0.9140 -24 102 41 27 22 1.6 1.512 32.5 1.7 -141 -19 108 32 21 17 2.6 2.5 123.3 2.0 2.5142 -20 110 12 9 7.5 4.9 4.8 323.2 0.8 1.3201 -17 217 28 22 20 3.7 3.7 40.8 - -202 -25 216 5.4 3.7 3.4 3.3 3.2 199.5 1.1 1.8203 -26 216 1.5 1 1 4.0 3.9 456.4 0.7 0.9151A -26 81 4 2 1 2.4 2.4 1809.2 0.6 0.7151B -26 80 3.5 2 1 0.5 0.4 237.6 0.5 0.5151C -24 - 1.5 1.0 0.3 0.9 0.8 1340.6 0.5 0.6151D -21 95 2.5 1.2 0.5 3.6 3.6 1104.5 1.0 1.2151E -23 - 4 2.5 1.5 0.6 0.4 124.0 0.6 0.5151G -24 100 9 6 4 0.9 0.6 249.2 0.9 0.8151H -26 106 3 1.3 0.6 2.5 2.5 827.0 0.8 0.8151J -27 106 5 3 2 1.3 1.2 915.5 0.7 0.8151K -25 106 7 5 2.5 1.1 0.8 506.0 0.9 0.9152A -28 - 4 2 1.5 0.6 0.4 119.9 0.6 0.5152B -26 95 8 5.5 4.5 1.9 1.6 1103.3 0.9 1.1152C -29 90 5.5 3.5 2.5 0.7 0.5 142.6 0.7 0.6
6.3.2.3 Tensile Properties
Figures 6.4, 6.5, and 6.6 shows the comparative stress strain curves where the weight
fraction of PS varied for the samples with 2300 g/mol PS, 5800 g/mol PS and 10 kg/mol
PS, respectively.
Tensile modulus of the samples increases with the increasing PS content. Ultimate
strength of the samples with the highest PS content shows the highest value, as well.
The samples with the lowest PS content show lower strain at break values than the
neat EPM, most likely due to the destruction of the entanglements among the elastomer
chains during the coupling reaction.
6.3.3 Effect of Coupling Efficiency
6.3.3.1 Morphology
In amine-anhydride coupling reactions, coupling efficiency was varied by changing
the concentration of the reaction solution. In high concentrations (20% solid content),
high molar mass PS (∼10 kg/mol) and EPM phase separate due to low entropy of
mixing. Mixing can be enhanced by decreasing the molar mass of the components or
by diluting the reaction solution.
132
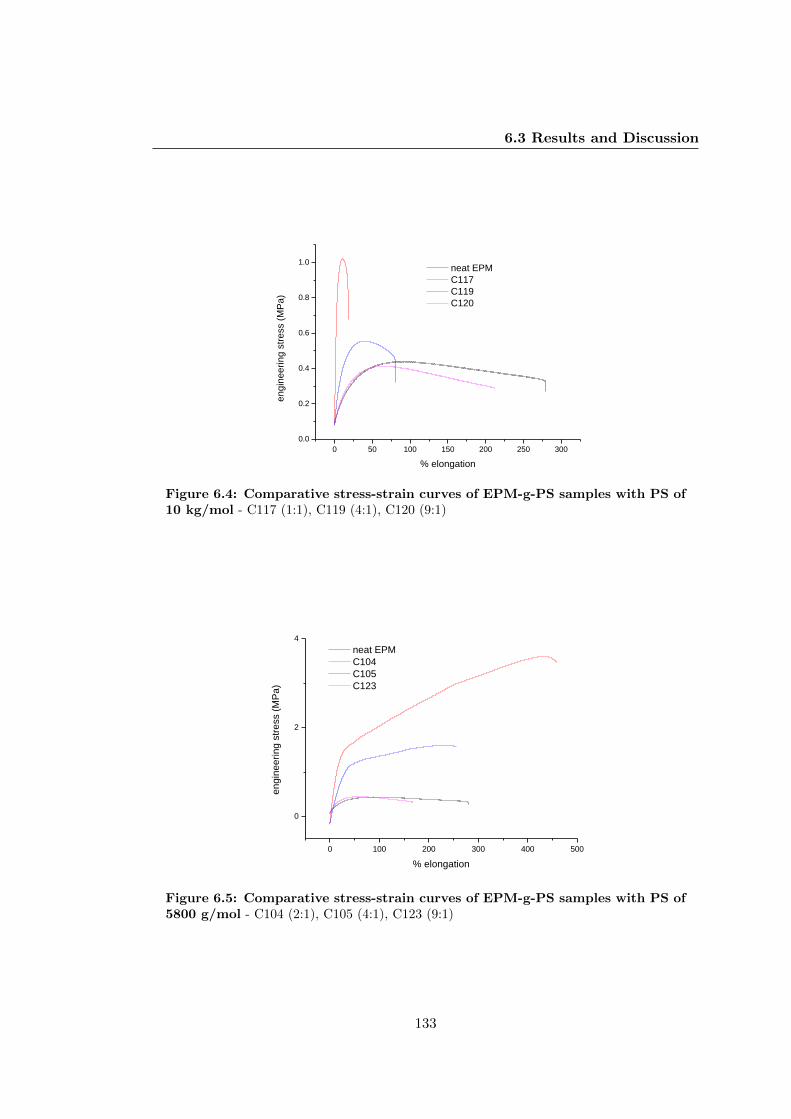
6.3 Results and Discussion
0 50 100 150 200 250 300
0.0
0.2
0.4
0.6
0.8
1.0
en
gin
ee
rin
g s
tre
ss (
MP
a)
% elongation
neat EPM
C117
C119
C120
Figure 6.4: Comparative stress-strain curves of EPM-g-PS samples with PS of10 kg/mol - C117 (1:1), C119 (4:1), C120 (9:1)
0 100 200 300 400 500
0
2
4
en
gin
ee
rin
g s
tre
ss (
MP
a)
% elongation
neat EPM
C104
C105
C123
Figure 6.5: Comparative stress-strain curves of EPM-g-PS samples with PS of5800 g/mol - C104 (2:1), C105 (4:1), C123 (9:1)
133

6 Structure-Property Relations of TPEs with Graft Topology
0 50 100 150 200 250 300
0
2
4
en
gin
ee
rin
g s
tre
ss (
MP
a)
% elongation
neat EPM
C124
C106
C107
Figure 6.6: Comparative stress-strain curves of EPM-g-PS samples with PS of2300 g/mol - C124 (2:1), C106 (5:1), C107 (9:1)
Amine-anhydride coupling reactions were done in different solution concentrations
while keeping the molar mass of the building blocks and weight fractions constant.
TEM images of coupling products obtained from the batches C118 and C128 (Table
6.1 and 6.2) are comparatively shown in Figure 6.7. In these reactions the EPM/PS
weight ratio was 2:1. Solid content varied in the batches where the EPM/PS weight
ratio was 9:1 (samples C120 and C130). The comparison of TEM images of these
samples are shown in Figure 6.8.
Figure 6.7: Comparative TEM images of C118 and C128 sample - The scale baris 200 nm and the EPM/PS weight ratio is 2:1
134

6.3 Results and Discussion
Figure 6.8: Comparative TEM images of C120 and C130 sample - The scale baris 500 nm and the EPM/PS weight ratio is 9:1
At low coupling efficiency values, samples with high PS content (33% in C118 and
C128) show a phase inversion (Figure 6.7). Although the PS content is lower than 50%,
TEM image of sample C118 indicates that the material is similar to a PS plasticized
with EPM elastomer.
In thiol-ene coupling reactions, the coupling efficiency was varied by changing the
reaction temperature. The results were discussed in Chapter 4. TEM study has shown
that the size of the PS domain decreases with increasing coupling efficiency. The
morphology of PB-g-PS samples were compared to a PB/PS blend. Figure 6.9 shows
the comparison of a PB/PS blend and the TPE samples C151D, C151E and C151G.
The size of the PS domains is the lowest in sample C151D, which has the highest
coupling efficiency.
6.3.3.2 Thermomechanical Properties
Figure 6.10 shows the comparison of modulus-temperature curves of the samples C120
and C130. Dilution, which overcomes the entropy barrier, allows the two polymer so-
lution to mix with each other. This entropy barrier becomes visible in the coupling
reactions at high concentrations where higher molar mass PS is used. This immisci-
bility negatively affects the coupling efficiency. The consequences of the low coupling
efficiency are apparent in morphological and mechanical characterization of the sam-
ples.
135

6 Structure-Property Relations of TPEs with Graft Topology
a) b)
c) d)
Figure 6.9: Comparative TEM images of PB/PS blend (a), C151D (b), C151E(c) and C151G (d) - The scale bar is 500 nm and the PB/PS weight ratio is 4:1
136

6.3 Results and Discussion
Dilution effect was analyzed in two different batch sets where EPM/PS weight ratio
was varied as a second parameter. Samples with low coupling efficiency show narrower
rubber plateau than those with higher coupling efficiency. This is due to the high
fraction of free elastomer chains starts to flow at lower temperatures, consequently
leading to failure.
0.1
1
10
100
1000
10000
Sto
rag
e M
od
ulu
s (
MP
a)
-100 -50 0 50 100 150
Temperature (°C)
C130––––––– C120– – – –
Universal V4.2E TA Instruments
Figure 6.10: Comparative modulus-temperature curves of EPM-g-PS samples- C120: low grafting yield, C130: high grafting yield
In Figure 6.10, C120 reaction was performed in concentrated medium , and C130
was in dilute medium. These samples have 10% PS content. Sample C130 has a wider
rubber plateau than sample C120. Samples C118 and C128 have 33% PS content.
These samples show the same trend, but with a higher modulus value due to higher PS
content.
The differences in coupling efficiency did not result in significant variation in the
modulus-temperature curves of the samples. A comparison of modulus-temperature
curves of PB-g-PS samples is shown in Figure 6.12 (sample properties Tables 6.3 and
6.4). While the effect of molar mass of PS is visible, the width of the rubber plateau
does not possess a parallel trend to the coupling efficiency values. This potentially
implies that a PB-PB conjugation might be taking place during compression molding,
this results in enhancement in the rubbery behavior of the samples, blurring the effect
of PB-PS coupling efficiency.
137

6 Structure-Property Relations of TPEs with Graft Topology
10
100
1000
10000
Sto
rag
e M
od
ulu
s (
MP
a)
-100 -50 0 50 100 150
Temperature (°C)
C118––––––– C128– – – –
Universal V4.2E TA Instruments
Figure 6.11: Comparative modulus-temperature curves of EPM-g-PS samples- C118: low grafting yield, C128: high grafting yield
0.1
1
10
100
1000
10000
Sto
rag
e M
od
ulu
s (
MP
a)
-50 0 50 100 150
Temperature (°C)
C151H––––––– C151J––––––– C151K––––––– C151D––– – – C151E––– ––– C151G––––– –
Universal V4.2E TA Instruments
Figure 6.12: Comparative modulus-temperature curves of PB-g-PS samples -C151D, E, G, H, J and K (Table 6.4
138

6.3 Results and Discussion
6.3.3.3 Tensile Properties
A positive effect of coupling efficiency was observed in tensile properties of the sam-
ples as well. Strain at break was improved in samples with higher coupling efficiency.
Samples with 10% PS content show strain softening due to creep of the non-grafted
elastomer chains (Figure 6.13). Grafting efficiency in sample C130 is 68% with respect
to PS, and 31% with respect to EPM, which means that roughly 70% of EPM chains
are non-grafted. However, a slight recovery in the creep behavior is observed in sample
C130 relative to C120, due to the higher coupling efficiency in sample C130.
Tensile moduli of the samples C120 and C130 show no difference. However, among
the samples where PS content is higher (33%), sample C128 shows a lower tensile
modulus at lower strain, and the slope of the curve becomes even larger than sample
C118, despite their equal PS content. This indicates the smaller size of the hard domains
dispersed homogeneously in the elastomeric matrix allows the elastomer phase to be
dominant parameter determining the stiffness of the material at lower % elongation,
and at high % elongation the effect of crosslinks becomes observable. In literature, the
tensile behavior of C118 and C128 are referred as more brittle failure and more ductile
failure, respectively, where the transition from brittle to ductile behavior takes place
at phase inversion [4]. This behavior could also be concluded from the TEM images
of these samples, where C118 shows a continuous phase of PS domain, which could be
considered as the matrix, and C128 has the elastomer phase as the matrix.
0 50 100 150 200 250
0.05
0.10
0.15
0.20
0.25
0.30
0.35
0.40
0.45
en
gin
ee
rin
g s
tre
ss (
MP
a)
% elongation
C120
C130
0.0 0.5 1.0 1.5 2.0 2.5 3.0
0.0
0.5
1.0
1.5
2.0
2.5
3.0
en
gin
ee
rin
g s
tre
ss (
MP
a)
% elongation
C118
C128
Figure 6.13: Strain-stress curves of EPM-g-PS samples - Comparison of samplesC120 and C130 (left) C118 and C128 (right)
139

6 Structure-Property Relations of TPEs with Graft Topology
0 200 400 600 800 1000
0.0
0.5
1.0
1.5
2.0
2.5
3.0
en
gin
ee
rin
g s
tre
ss (
MP
a)
% elongation
C151H
C151J
C151K
Figure 6.14: Strain-stress curves of PB-g-PS samples - C151H, J, and K
The effect of PB-PB conjugation is more clear in the stress-strain curves of the
samples (see Figure 6.14). C151H has the highest coupling efficiency. Although the
sample C151K has higher coupling efficiency than C151J, it exhibits creep and the
sample C151J shows strain hardening similar to sample C151H. These materials were
still soluble after compression molding, however more pressure was needed to filter the
solutions through the 0.2 µm filter, which indicates slight PB-PB conjugation.
6.3.4 Effect of the Molar Mass of the Components
6.3.4.1 Morphology
All TPEs synthesized in this study have PS segments both as grafts and as free
chains in various fractions. The phase separation behavior of free and grafted PS chains
exhibit difference related to their molar masses. While low molar mass free chains tend
to contribute in the phases established by the grafted chains, high molar mass free
chains do not exhibit such a behavior [5]. This results in less defined phase separation
in samples with higher molar mass PS than those with low molar mass PS, despite
the close values of coupling efficiency. Figure 6.15 shows the phase separation behavior
of three EPM-g-PS samples synthesized with different molar mass PS. Additionally,
density of a polymer decreases with increasing molar mass. High volume fraction PS
could be also a reason for less defined phase separation.
140

6.3 Results and Discussion
Figure 6.15: TEM images of EPM-g-PS samples - left: C106 (PS 2300 g/mol),middle: C105 (PS 5800 g/mol), right: C130 (PS 10 kg/mol), the scale bar is 200 nm
Figure 6.16: TEM images of EPM-g-PS samples - left: C124 (PS 2300 g/mol),middle: C104 (PS 5800 g/mol), right: C128 (PS 10 kg/mol), the scale bar is 200 nm
141

6 Structure-Property Relations of TPEs with Graft Topology
In Figure 6.16, EPM-g-PS samples with 33% PS content are compared in terms of
PS molar mass. The coupling efficiency values of these samples are close to each other.
Although the sample C124 has relatively lower coupling efficiency, it exhibits the most
ordered morphology. This findings imply that higher molar mass PS chains have rather
a tendency to possess a macro-phase separation than low molar mass PS due to lower
entropy of mixing.
6.3.4.2 Thermomechanical Properties
The effect of molar mass on mechanical properties is based on entanglement density
and T g. The entanglement molar mass of elastomers are around 2 kg/mol [6], [7], and
that of PS is 10 kg/mol [8]. The entanglements in PS are not a significant effect on the
stiffness of the material below its T g value. However, T g of a PS is strictly dependent
on the molar mass up to 10 kg/mol [8]. Thus, the width of the rubber plateau is
mainly dependent on the T g of the PS segment for the molar masses of PS used in this
study (below 10 kg/mol). In case of elastomers containing high molar mass PS, the
material would exhibit significant modulus after the T g of the PS due to the presence
of entanglements, however this region is not a part of the rubber plateau.
Figure 6.17 shows comparative thermal behavior of samples C124 and C128. C128
containing 10 kg/mol PS shows a wider rubber plateau than C124 containing 2300
g/mol PS. These two samples have equal PS fractions and close coupling efficiency
values. The difference in the width of the rubber plateau in this comparison is due to
the effect of the molar mass of PS on the T g of the hard phase.
Variation in the molar mass of EPM elastomer has a large effect on the rubbery
plateau (Figure 6.18). This is due to the lower number of entanglements per chain.
Entanglements among the elastomer chains play a role on rubbery plateau especially
in case of low coupling efficiency.
6.3.4.3 Tensile Properties
Comparative stress-strain curves of EPM-g-PS samples with various molar mass of
PS (Figure 6.19), show that the tensile behavior of the samples are directly related
to their phase separation behavior. While C128 shows a hard and brittle material
behavior, C104 shows a rather rubbery behavior and C124 shows a hard and tough
material behavior. C128 has the most heterogeneous morphology with the biggest PS
142

6.3 Results and Discussion
1
10
100
1000
10000
Sto
rag
e M
od
ulu
s (
MP
a)
-100 -50 0 50 100 150
Temperature (°C)
C124– – – – C128––––– ·
Universal V4.2E TA Instruments
Figure 6.17: Modulus-temperature curves of EPM-g-PS samples - C124 (PS 2300g/mol), C128 (PS 10 kg/mol)
0.1
1
10
100
1000
10000
Sto
rag
e M
od
ulu
s (
MP
a)
-100 -50 0 50 100 150
Temperature (°C)
C141C––––––– C141B– – – –
Universal V4.2E TA Instruments
Figure 6.18: Modulus-temperature curves of EPM-g-PS samples - C141B (EPM50 kg/mol), C141C (EPM 25 kg/mol)
143

6 Structure-Property Relations of TPEs with Graft Topology
domains, consequently showing high tensile modulus and low stress and strain values at
break. C104 has a rather more dispersed phase of PS domains, maintaining the EPM
phase as a matrix. This sample exhibits a tensile behavior similar to a compatibilized
blend. The phase separation behavior of C124 is a microphase separation but co-
continuous and gyroid-like, which consequently results in tensile behavior of hard and
tough material, similar to high-impact PS [9].
0 100 200 300 400 500
0
1
2
3
4
5
en
gin
ee
rin
g s
tre
ss (
MP
a)
% elongation
104
128
124
Figure 6.19: Stress-strain curves of EPM-g-PS samples - C124 (PS 2300 g/mol),C104 (PS 5800 g/mol) C128 (PS 10 kg/mol)
Comparison of stress-strain curves of EPM-g-PS samples with different EPM molar
mass (Figure 6.20) indicates the importance of entanglements between the non-grafted
chains and the grafted chains. The two materials compared have the same coupling
efficiency, however the tensile properties dramatically change due to the molar mass of
the EPM used.
6.3.5 Effect of the Composition of the Building Blocks
The TPEs containing P(SMI) copolymer have relatively lower coupling efficiency
values than the average value in TPEs with PS. Morphological studies showed that in
low coupling efficiency, the materials exhibit macrophase separation and heterogeneous
morphology. Due to these, the morphology of the TPE samples containing P(SMI) were
not investigated. Additionally, P(SMI) was not soluble in toluene, thus the preparation
144

6.3 Results and Discussion
-50 0 50 100 150 200 250 300 350
0.0
0.2
0.4
0.6
0.8
1.0
1.2
1.4
1.6
1.8
2.0
En
gin
ee
rin
g s
tre
ss (
MP
a)
% elongation
C141B
C141C
Figure 6.20: Stress-strain curves of EPM-g-PS samples - C141B (EPM 50 kg/mol),C141C (EPM 25 kg/mol)
of the TEM grids was not susceptible to the technique used in the preparation of TEM
grids of samples with PS.
6.3.5.1 Thermomechanical and Tensile Properties
All PB-g-PS and EPM-g-PS samples were compression molded at 130 ◦C, and PB-g-
P(SMI) and EPM-g-P(SMI) samples were compression molded at 200 ◦C for 15 minutes.
EPM-g-P(SMI) samples showed yielding at lower temperatures than PB-g-P(SMI) sam-
ples, first of all due to low coupling efficiency and slight crosslinking of PB-g-PS samples.
Comparative modulus vs. temperature curves are shown in Figure 6.21.
The T g of P(SMI) was obtained from tan δ vs. temperature curve of C201. T g
was not visible in C202 due to the lower P(SMI) content and partial crosslinking of the
sample. PB-g-P(SMI) samples were crosslinked to some extent due to the temperature
applied in compression molding in order to obtain homogeneous films. The T g of
P(SMI) is above 180 ◦C which is the temperature for PB to start crosslinking. This
result was found with a temperature study, which was done in order to investigate the
crosslinking behavior of PB during compression molding. Stress-strain curves of PB
sample compressed at different temperatures are shown in Figure 6.22. Compression
molded PB films at 110 ◦C, 130 ◦C and 150 ◦C were completely soluble in THF, however
the sample compressed at 180 ◦C was not soluble.
145

6 Structure-Property Relations of TPEs with Graft Topology
0.01
0.1
1
10
100
1000
10000
Sto
rag
e M
od
ulu
s (
MP
a)
-100 -50 0 50 100 150 200 250
Temperature (°C)
C301––––––– C302– – – – C201––––– · C202––– – –
Universal V4.2E TA Instruments
Figure 6.21: Comparative modulus-temperature curves of TPE samples - PB-g-P(SMI) (C201 and C202), EPM-g-P(SMI) (C301 and C302)
0 50 100 150 200 250 300
0.1
0.2
0.3
0.4
0.5
en
gin
ee
rin
g s
tre
ss (
MP
a)
% elongation
PB @ 110C
PB @ 130C
PB @ 150C
PB @ 180C
Figure 6.22: Stress-strain curves of PB films - PB samples were compression moldedat 110 ◦C, 130 ◦C, 150 ◦C and 180 ◦C for 15 minutes
146

6.3 Results and Discussion
6.3.6 Effect of Topology
The synthesized TPE samples were compared with triblock SEBS copolymers in
terms of morphology and mechanical properties. While well defined SEBS triblock
shows complete micro-phase separation (Figure 6.24), the TPEs with graft morphol-
ogy show heterogeneous morphology. The TPEs synthesized via the ‘grafting from’
approach contain free PS homopolymer as well as the TPEs synthesized via the ‘graft-
ing onto’ approach. This fact is certainly a factor in the formation of heterogeneous
morphology. However, the heterogeneous distribution of the pendant functionality on
the elastomer leads to a mixture of topologies from elastomeric backbone with a single
PS side chain to one with around twenty of PS side chains. This situation is poten-
tially the main effect on the heterogeneity of the morphology. TEM images of the TPE
samples synthesized via the ‘grafting from’ approach (Figure 6.23) show that the phase
separation behavior of the samples changes in different locations in the TEM grid of
the sample. Since, both of the morphologies seem to be in ordered state, this difference
was suggested to be due to the mixture of EPM chains with different extent of grafting.
Comparative DMTA curves of TPEs synthesized with graft polymerization (Table
6.5, and Table 6.6) and some SEBS triblock copolymers (Table 6.7) are shown in Figure
6.25.
Table 6.5: TPEs synthesized via graft polymerization
Sample %PS homopolymer M n
content (%) (PS)R132 28 8 3,500R134 25 8 3,000R136 40 15 5,000
Table 6.6: Mechanical properties of TPEs synthesized via graft polymerization
Sample Tg Tg Storage modulus (MPa) σmax σR εR σ50 σ100(soft) (hard) E′1 E′2 E′3 (MPa) (MPa) (%) (MPa) (MPa)
R132 -59 80 136 106 80 7.3 6.8 265.7 3.6 4.3R134 -62 51 173 128 78 4.7 4.2 367.4 2.3 2.5R136 -66 60 846 627 457 8.9 8.9 4.4 - -
DMTA analysis of the samples show that the rubber plateau of the samples with
graft topology is more temperature-independent than the that of samples with triblock
topology. This implies a stronger phase separation of the components, which could be
firstly due to the free PS homopolymer chains present in the structure. Additionally,
147
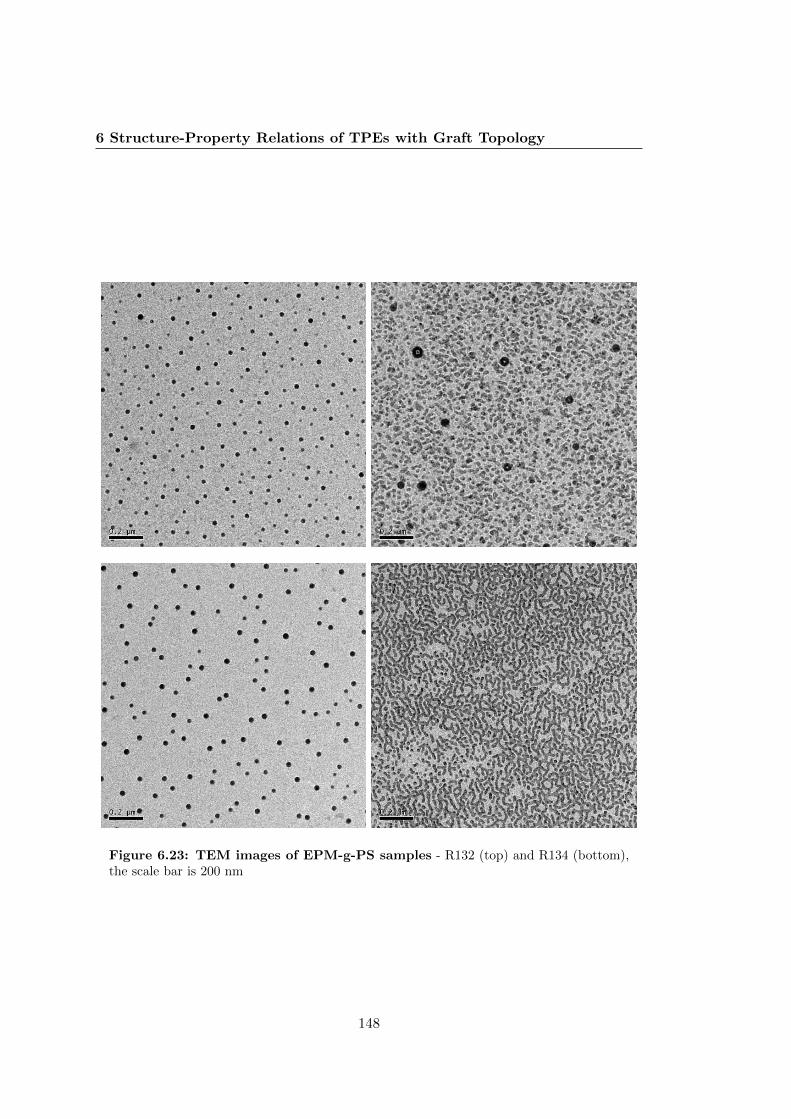
6 Structure-Property Relations of TPEs with Graft Topology
Figure 6.23: TEM images of EPM-g-PS samples - R132 (top) and R134 (bottom),the scale bar is 200 nm
148

6.3 Results and Discussion
Figure 6.24: TEM images of SEBS samples - G1652 (left), G1657 (right), the scalebar is 100 nm
0.1
1
10
100
1000
10000
Sto
rag
e M
od
ulu
s (
MP
a)
-100 -50 0 50 100 150
Temperature (°C)
RD132––––––– RD134– – – – RD136––––– · G1650––– – – G1657––– ––– G1730––––– – G1652–– –– –
Universal V4.2E TA Instruments
Figure 6.25: Comparative modulus-temperature curves of TPEs - RD 132, 134and 136 are TPEs with graft topology and G1650, 1652, 1657 and 1730 are TPEs withblock topology
149

6 Structure-Property Relations of TPEs with Graft Topology
Table 6.7: Properties of SEBS triblock copolymers
Sample %PS type diblock M n σR εRcontent (%) (PS) (MPa) (%)
G1650 30 SEBS 0 10,000 35 500G1652 30 SEBS 0 7,500 31 500G1657 13 SEBS/SEB 30 5,500 23 750G1730 20 SEPS 0 7,000 9 880
0 500 1000
-5
0
5
10
15
20
25
30
35
40
en
gin
ee
rin
g s
tre
ss (
MP
a)
% elongation
1657
1650
R132
R134
R136
Figure 6.26: Stress-strain curves of TPEs - RD 132, 134 and 136 are TPEs withgraft topology and G1650 and 1657 are TPEs with block topology
the slope of the T g transition of the elastomer phase is higher in G1730 sample than
the G1650 sample and G1652 sample. Despite the fact that these three samples are
all pure triblock copolymers, the T g transition of the elastomeric phase in G1650 and
G1652 are not as sharp as that of the sample G1730. The modulus continues to exhibit
a decay following the T g transition. This is an implication for this stronger segrega-
tion to be due to the interaction parameter of the components. Despite the fact that
the molar mass of the elastomeric segments between the crosslinking points are more
polydispersed in TPE samples with graft topology than those in TPEs with triblock
topology, strong phase separation results in more temperature-independent rubbery
plateau.
Comparison of tensile properties of the TPEs with graft and block topology indicates
that the stress and the strain values of the SEBS triblock copolymers are higher than
the TPEs synthesized with graft topology. Figure 6.26 shows the comparison of the
stress-strain curves of some SEBS and EPM-g-PS samples.
The graft TPEs are not as strong as the TPEs with block topology. This is mainly
150

6.4 Conclusions
due to the heterogeneous topology of the graft TPEs. As mentioned in previous chap-
ters, EPM elastomer used in this study have a fraction with no maleic anhydride pen-
dant functions. This heterogeneity results in weak areas in the sample which cause
failure at lower strain and stress values.
6.4 Conclusions
TPEs synthesized via coupling techniques (the ‘grafting onto’ approach) have a
significant fraction of non-grafted free elastomer and thermoplastic polymer chains.
This non-uniform structure of the material leads to macro-phase separation and con-
sequently, the sample has a non-uniform morphology. Mechanical and morphological
characteristics of the TPE samples with low coupling efficiency is similar to a compat-
ibilized TPE blend.
Coupling efficiency is the main parameter determining the ultimate tensile strength
and the temperature window for the rubber plateau. Increasing coupling efficiency
results in more homogeneous and ordered phase separation, of which the effects are
directly observable in mechanical properties. Coupling efficiency is mainly affected by
the miscibility of the components, as discussed in the previous chapters. This immisci-
bility results in a more heterogeneous morphology, due to inhomogeneous mixing of the
components. Mechanical properties is directly affected by this heterogeneity. Materi-
als, which have low coupling efficiencies have narrower rubber plateau and lower stress
and strain at break values.
Molar mass of the PS has a significant effect on morphological and mechanical
characteristics of the TPE samples. Low molar mass PS tends to participate in the
ordered morphology of the sample. High molar mass PS tends to exhibit a phase
separation more macroscopically. This is mainly due to the incompatible nature of the
samples and furthermore to the high molar mass, both of which decrease the entropy
of mixing. Consequently, high coupling efficiencies are obtained in samples with low
molar mass PS, and these samples have a wider variety of grafting density values, which
results in different ordered morphologies in the same sample. Rubber plateau is directly
affected by the molar mass of PS due to the difference in T g of the hard phase. Molar
mass of PS is not a main parameter affecting the tensile properties due to the fact that
the molar mass range studied in this work is below the entanglement molar mass of PS.
151

6 Structure-Property Relations of TPEs with Graft Topology
Stoichiometry of the components does not have a significant effect on the morphol-
ogy of the samples when compared to other parameters such as coupling efficiency
and molar mass of the components. However, stoichiometry significantly affects the
mechanical properties. Tensile and storage modulus of the specimen increases with
increasing thermoplastic polymer content.
Ultimate characteristics of the TPEs with graft topology synthesized in this work
was achieved by the ‘grafting from’ approach. This approach resulted in TPEs with
the lowest amount of free PS, the most homogeneous and ordered morphology and
the highest tensile strength values. However, the elastomer used in this approach has
a high dispersity and heterogeneous distribution of the pendant functions. This fact
brings about the local weak points due to the non-grafted elastomer chains present in
the resulting TPE causing early failures in tensile strength measurements.
152

Bibliography
[1] F. Zuo, J. K. Keum, L. Yang, R. H. Somani, and B. S. Hsiao. Macromolecules,39(6):2209–2218, 2006. 124
[2] P. J. Barham, M. J. Hill, A. Keller, and C. C. A. Rosney. Journal of MaterialsScience Letters, 7:1271–1275, 1988. 124
[3] A. Ruzette and L. Leibler. Nature Materials, 4:19–31, 2005. 125
[4] I. S. Miles and A. Zurek. Polymer Engineering & Science, 28(12):796–805, 1988.139
[5] V. Abetz and P. Simon. Phase behaviour and morphologies of block copolymers.In Volker Abetz, editor, Block Copolymers I, volume 189 of Advances in PolymerScience, pages 125–212. Springer Berlin / Heidelberg, 2005. 140
[6] F. Mighri, M. A. Huneault, A. Ajji, G. H. Ko, and F. Watanabe. Journal of AppliedPolymer Science, 82(9):2113–2127, 2001. 142
[7] D. R. Daniels, T. C. B. McLeish, B. J. Crosby, R. N. Young, and C. M. Fernyhough.Macromolecules, 34(20):7025–7033, 2001. 142
[8] P. G. Santangelo and C. M. Roland. Macromolecules, 31(14):4581–4585, 1998. 142
[9] G. Dagli, A.S. Argon, and R.E. Cohen. Polymer, 36(11):2173 – 2180, 1995. 144
153

BIBLIOGRAPHY
154

7
Outlook
Conventional TPEs with block topology consisting of hard and soft blocks are suc-
cessful in many applications in which solvent resistance, high shear or hih tempera-
ture stability are not the most important parameters. However, the polymerization
and processing techniques of these materials still have some drawbacks, such as the
high sensitivity of anionic polymerization and necessity of very high temperatures to
achieve the disordered state. In this dissertation alternative polymerization TPE ma-
terials with an alternative topology (graft copolymer) was introduced and investigated.
The structure-property relations of these elastomeric, phase-separated materials were
investigated in detail from a topologic point of view.
The key concept for excellent and tunable properties is the precise control over the
molecular structure. The ‘grafting onto’ approaches generally result in incomplete cou-
pling with respect to the thermoplastic precursor due to the fact that end-functionality
of the thermoplastic component is never 100%. This is not the main problem, since
the free thermoplastic chains with relatively low molar mass tend to diffuse into the
domains formed by the grafted thermoplastic chains in sufficiently high coupling effi-
ciencies. As a result, they do not have negative effects on mechanical properties of the
resulting TPEs. However, the thermoplastic content should be kept under a certain
value in order to prevent phase inversion, which brings about a limitation in the stoi-
chiometry of the reacting functional groups. Furthermore, a thermoplastic component
with a sufficiently high molar mass should be used for a proper T g of the hard phase,
which introduces a challenge in terms of entropy of mixing during coupling. The limita-
tion in the volume fractions of the components leads to an unbalanced stoichiometry of
155

7 Outlook
the functional groups, which prevents the elastomer chains to be completely grafted in
the cases where TPE samples contain high molar mass thermoplastic precursor. Non-
grafted elastomer chains dramatically decrease the tensile properties of the resulting
TPE.
Among the ‘grafting onto’ chemistries used in this work to obtain a TPE with graft
topology, amine-anhydride coupling was found to be a more straightforward technique
than the thiol-ene coupling, except for the necessity of dry conditions. Thiol-ene cou-
pling has inevitable homopropagation as a side reaction, especially in the cases where
excess vinyl is used. Furthermore, quantitative yields were obtained in amine-anhydride
coupling reactions. However, due to the lack of polymer precursors to be coupled, the
tensile properties were not optimum. Additionally, the quantitative yields were only
valid for the reactions where relatively low molar mass PS was used. Conclusively, the
success of polymer-polymer coupling reactions between two incompatible high molar
mass polymers is limited due to the physical conditions, even if the polymer precursors
are very well-defined. The ‘grafting onto’ approach may be preferred over the ‘grafting
from’ approach, for the sake of convenience in monomer and solvent-free melt process-
ing techniques for the industrial applications. In that case, the physical challenges
should be surpassed with high temperature and shear, maximizing the interfacial area
between two incompatible components. In this regard, CRP techniques are being fastly
developed towards straightforward industrial applications [1] [2] [3], which will enable
the production of well-defined building blocks with end or pendant functionalities. This
achievement will enhance the potential for producing copolymers with various topolo-
gies with polymer processing techniques including robust coupling reactions.
The ‘grafting from’ approach is more convenient than the ‘grafting onto’ approach
in terms of complete and more uniform grafting of the elastomer chains, since there are
no compatibility issues between the elastomer and the monomer. The thermoplastic
chains grow from each initiating moiety. If the elastomer is uniformly modified (no non-
functional chains), the resulting TPE will be free of non-grafted elastomer chains, and
optimum tensile properties may be acquired. From this point of view, the graft copoly-
merization of styrene with N-phenyl maleimide or maleic anhydride from a well defined
elastomeric macroinitiator via nitroxide mediated radical polymerization (NMP) seems
a promising approach to have the ultimate properties of a TPE with a graft topology.
The commercial NMP initiator MAMA SG-1 is a good candidate for the modification of
156

the functional elastomer, thanks to its carboxylic acid function that may be employed
directly or converted into various desired functions. Simple coupling reactions, which
exhibit quantitative yields at ambient temperatures (such as amine-anhydride coupling)
could be used for the grafting of the NMP initiator onto functional elastomers. The
choice of the solvent could be a challenge due to the high temperatures used for the
polymerization and the fact that olefinic elastomers and N-phenyl maleimide monomer
have a limited number of common solvents. Alternatively, the reaction could be done
in bulk, but in that case the polymerization conditions should be optimized by using
additional nitroxide radicals to control the propagation, since the polymerization rate
of copolymerization of styrene and maleimides or maleic anhydride is higher than that
of the homopolymerization of styrene.
The TPEs synthesized with a minimum amount of free PS chains in this study were
found to have a lower temperature-dependent modulus than that of the conventional
linear triblock SEBS copolymers. A lower temperature dependence of the rubbery
plateau modulus indicates that the material maintains a stable rubbery behavior within
the temperature range of the rubbery plateau. However, the tensile properties of the
graft TPEs prepared in this study were found to be lower than those of the TPEs
with triblock topology. This was mainly due to the lack of uniformity in the the
structure of the graft TPEs. In this regard, the elastomer precursors should be chosen
or synthesized with the requirement of having a low dispersity and uniformly distributed
pendant functions, in order to achieve the ultimate mechanical properties of TPE with
a graft topology.
A TPE with a well-defined graft topology is potentially superior to a TPE with
a block topology in terms of melt processing. Block copolymers have limitations in
accessing order-disorder transitions during melt processing, due to high molar mass
of the hard block that is necessary for sufficient tensile strength [4]. Studies done in
silico showed that alternative topologies lower the order-disorder transition tempera-
ture compared to linear block topology and therefore potentially are more convenient
for melt processing [5]. In this regard, a theoretical study should be performed for
estimating the phase separation behavior of the graft copolymers, of which to the best
of the author’s knowledge no examples have been found in literature.
While targeting for the ultimate mechanical properties of the TPEs with graft topol-
ogy, one of the main drawbacks could be the dangling ends of the elastomer backbone.
157

7 Outlook
Sufficiently long dangling ends may have sufficient entanglements that will not induce
a severe decline in the tensile properties. However, this condition will necessitate very
high molar mass elastomers, which challenges the melt processing conditions and limits
the options for constitutional structure of the resulting TPE. In this regard, the elas-
tomeric precursor should contain reactive groups not only as a pendant function along
the chain, but also at the chain ends. Alternatively, combination of block and graft
topologies could be a synergistic solution for reaching both the ultimate mechanical
properties and the enhancement of melt processing conditions.
158

Bibliography
[1] W. A. Braunecker and K. Matyjaszewski. Progress in Polymer Science, 32(1):93 –146, 2007. 156
[2] J. Nicolas, B. Charleux, and S. Magnet. Journal of Polymer Science Part A: Poly-mer Chemistry, 44(13):4142–4153, 2006. 156
[3] C. Barner-Kowollik and S. Perrier. Journal of Polymer Science Part A: PolymerChemistry, 46(17):5715–5723, 2008. 156
[4] N. A. Lynd, F. T. Oyerokun, D. L. ODonoghue, D. L. Handlin, and G. H. Fredrick-son. Macromolecules, 43(7):3479–3486, 2010. 157
[5] G. M. Grason and R. D. Kamien. Macromolecules, 37(19):7371–7380, 2004. 157
159

BIBLIOGRAPHY
160

Summary
Rubbery behavior with a consistent modulus over a wide temperature range is a
challenge in the search for ultimate structure-property relations of thermoplastic elas-
tomers (TPEs). This feature is closely related to the phase separation behavior and
the constitution of the segments and the T g of the phases.
Elastomer/thermoplastic blends and tri-/multi-block copolymers are industrial prod-
ucts that were developed to get desired mechanical properties and ease of processability
in TPEs. TPEs show a transition between elastic and viscous behavior with respect to
the applied temperature. They are acknowledged to be an alternative to vulcanized rub-
bers, since TPEs can be melt-processed thanks to their physically -crosslinked structure
as opposed to the chemically crosslinked structure of conventional rubbers/elastomers.
Current methods applied in industry to produce tri-/multi-block copolymers are
polycondensation and anionic polymerization, which both have disadvantages in terms
of either robustness, variety of suitable monomers or consistency of the mass distri-
bution. Controlled radical polymerization (CRP) methods, which are Atom Transfer
Radical Polymerization (ATRP), Nitroxide Mediated Polymerization (NMP) and Re-
versible Addition-Fragmentation chain Transfer (RAFT) polymerization are relatively
more robust and elegant techniques that provide well-defined functional polymers with
low dispersity. These well-defined functional polymers can be further used as building
blocks to design copolymers with various topologies.
In this PhD study, TPEs with graft topology are synthesized and structure-property
relations are investigated. Various living radical graft polymerization techniques are
used for the synthesis of high T g thermoplastics. These high T g polymers are grafted
on a functional elastomeric backbone via two different approaches, which are ‘grafting
161

Summary
onto’ and ’grafting from’. In the ‘grafting onto’ approach, ATRP and RAFT poly-
merization techniques are used to synthesize high T g thermoplastics that are subse-
quently grafted onto the elastomeric backbone by polymer-polymer conjugation reac-
tions, namely anhydride-amine coupling and thiol-ene coupling, respectively. NMP is
used in the ‘grafting from’ approach in which high T g polymer is grown from the initiat-
ing sites of the modified elastomeric backbone. Maleated poly(ethylene-c0-propylene)
rubber (EPM) is used for amine-anhydride coupling reactions in the ‘grafting onto’
approach, and it is modified into a macroinitiator for the ‘grafting from’ approach.
Polybutadiene (PB) with a high external vinyl content is used for thiol-ene coupling
reactions in the ‘grafting onto’ approach.
Structure-property relations are investigated in terms of molecular architecture,
morphology and thermal/mechanical properties. Size exclusion chromatography (SEC),
Nuclear Magnetic Resonance Spectroscopy (NMR) and Fourier Transform Infrared
Spectroscopy (FTIR) techniques are used to characterize the compositional and con-
stitutional structure of synthesized TPEs. Transmission electron microscopy (TEM)
analysis is performed for the morphological characterization and phase separation be-
havior of the samples. Dynamic mechanical thermal analysis (DMTA) and tensile tests
are performed for analyzing the thermal and mechanical properties. Relation between
the molecular architecture, phase separation behavior and thermal/mechanical proper-
ties are discussed in terms of a variety of structural features of the TPEs.
The ‘grafting from’ approach is found to be the more robust and efficient technique
for the synthesis of TPEs with graft topology. Graft polymerization of the monomer
from the elastomeric macromonomer results in relatively more well-defined topology
compared to the ‘grafting onto’ approach. Morphology studies show that the phase
separation behavior of the TPEs synthesized via the ‘grafting from’ approach is more
uniform. Synthesized TPEs show ordered phase separation as long as their molecular
structure is close to uniformity. Ordered phase separation is observed in the samples
with high coupling efficiency.
The ‘grafting onto’ approach results in ill-defined products with non-uniform and
incomplete grafting due to the immiscibility of the components especially in the cases
where high molar mass components are used. These products show heterogeneous
morphology with both micro and macro-phase separation.
162

Stiffness of the synthesized materials is found to increase with the increasing ther-
moplastic component content, regardless of the coupling efficiency. DMTA analyses
show that the coupling efficiency and the molar mass of the thermoplastic component
increase the temperature range for the rubbery plateau. Tensile tests show that the
coupling efficiency increases the stress and strain values at break. The molar mass of
the thermoplastic component does not have an effect on tensile properties due to the
fact that the entanglement molar mass for the thermoplastic component is not exceeded
for the polymers synthesized in this study.
The effect of composition of the thermoplastic component on the coupling efficiency
with elastomers and on the properties of the resulting materials is studied by comparing
PS with P(SMI). The miscibility of P(SMI) is lower than that of PS with the elastomers
used. The coupling efficiency cannot be enhanced due to the low entropy of mixing
in high reaction concentrations, and to the necessity of high dilution to overcome the
entropy barrier. Coupling reactions of P(SMI) and EPM, which are carried out in a
binary solvent mixture (1,4-dioxane-toluene), shows an increase in coupling efficiency
at lower concentrations of the reaction mixture. This is believed to be due to the
high miscibility of PB soultion in toluene and P(SMI) solution in 1,4-dioxane. Binary
solvent approach is promising to enhance the coupling efficiencies in reactions where
highly immiscible components are used.
Characterization techniques are used for the comparison of the synthesized TPEs
with graft topology with commercially available styrenic TPEs with tri-block topology.
While TPEs with graft topology showed a more temperature-independent rubbery be-
havior, stress and strain values at break were not as high as the TPEs with tri-block
topology. This is due to the high dispersity and the non-uniform pendant functional-
ity of the elastomer used resulting in weak domains in the structure of the resulting
material having early failures in tensile tests.
In conclusion, styrenic TPEs with graft topology are alternative to the styrenic
TPEs with block topology in terms of lower melt viscosities. Additionally, in the case
of low dispersity and highly uniform pendant functionality of the elastomer, the tensile
properties are promising to be competitive with that of the TPEs with block topology.
A combined molecular architecture of block and graft topologies is believed to be the
synergistic solution for the dilemma between the melt processability and good tensile
properties.
163

Summary
164

Acknowledgements
First of all, I would like to thank my promotor prof.dr. Bert Klumperman for his
guidance in this work. Bert, you are the most proper supervisor I could ever have
worked with. Your were so patient, optimistic and confident about me throughout the
study. I was never sure that I can manage all this, but there was you who had a big
reliance on me. Thank you so much for the mental support and the fruitful discussions.
Secondly, I am very thankful to my co-promotor dr. Martin van Duin, who guided
me with a great motivation and rationality. Martin, you taught me how to work in an
efficient way, to find simple answers for chaotic questions, to make clear points, and to
be rational and critical. I am so grateful for your very synergetic supervision.
My reading committee, prof.dr. Jan Meuldijk, prof.dr. Metin Acar, prof.dr. Ton
Peijs, and dr. Han Goossens are greatly acknowledged for their interest and efforts for
the enhancement of my thesis. Additionally, prof.dr. Alex van Herk, for his accep-
tance to be in my extended committee and for all his help and sincere collaboration
throughout my PhD life in TU/e.
SPC secretaries, Pleunie Smits and Caroline van Os-Rovers are many thanked for
all their sincere help and understanding in every issue of mine. Pleunie, thank you very
much for the warmth you gave which I feel from the first phone talk. Caroline, thank
you for all the cigarettes I smoke from you and for your one eye on me to take care like
a mother.
Thanks also go to Hanneke Lambermont-Thijs, Karin Dietz and Harry Philipsen for
MALDI-TOF-MS and GPEC measurements. Especially I would like to thank Hanneke
for her great help and support by optimizing the GPEC measurements of the TPEs.
Thanks also go to the former technical staff, Wieb Kingma and Wouter Gerritsen for
the nice time we shared in the labs, breaks and out of working hours. Rinske Knoop is
165

Acknowledgements
greatly acknowledged for her guidance in TEM measurements, and for nice chats and
the neighbourhood.
SKT people are many thanked for their understanding, help, patience and for letting
me use their machines and make some fumes around :) Anne Spoelstra is greatly
acknowledged for the scientific support and guidance for TEM measurements, Pauline
Schmit, Bob Fifield, Bjorn Tuerlings, Gizela Mikova, and Elena Miloskovska for the
instructions of the machines and their great sincere help whenever I needed it.
I would like to thank Martin Fijten for letting me use his expertise for SEC mea-
surements, for every kind of technical and scientific support, inspiring discussions, and
for being a perfect collaborator, and being a very sweet and trustworthy friend for all
times.
I am so grateful to dr. Dario Cavalli, dr. Rafael Sablong, Martin Ottink, Fabian
Karbach and Mark Pepels for discussing with me and teaching me in mini brainstorming
sessions and discussions and being patient enough to listen to my neverending and non-
understandable questions. Additionally, dr. Gijs Habraken is deeply acknowledged for
being the idea-father of the NMP chapter and sharing his own SG-1s with me.
Bahar Yeniad is greatly acknowledged for being my every-time-every-type sup-
porter, financial-mental sponsor and backer. Life in Eindhoven would not be this
meaningful, and complete if you were not here. I know, for you it’s just the opposite,
you damn the day you came to the same office with me, and you left me as soon as
you got the first chance :) But you love me sometimes, I know... And a bit Turk-
ish, seninle karsilasmis olduguma, hayatinin icine kendimi, hayatimin icine seni, cok
tesadufi sekillerde ve hic yokolmayacak bir halde sokmus olmaktan aslinda cok mem-
nun ve mutluyum. Benimle herseyini paylastigin icin cok cok minnettarim, ve bundan
sonra da umarim hep yaninda olabilirim :). Hayatta basina gelen hersey sana mutluluk
getirsin!
Camille Descour is also greatly acknowledged for her every-time-every-type support,
which was not less than Bahar. You are the coolest and the strongest girl I have ever
seen. The way we understand each other is very unique and very special to me. It
doesn’t mean that you speak French and I speak Turkish and somehow we understand
each other (actually it happens sometimes). I am very thankful for all the food, the
cigarettes, the clothes, the shoes, the car, the bed, the house, the events, the anger, the
happiness, the joy, the thoughts that you shared with me, and for everything you did
166

for me, which I cannot even list. I don’t think I can ever pay all these things back. But
you know, I will be with you whenever you tell me to and I will never play someone
else.
Seda Cantekin specially acknowledged for being the reason why I am here. I am not
in love with her but I love her :)). Seda, o e-maili attigin icin, mulakata geldigimde bana
evini actigin icin, sonrasinda da hep yanimda oldugun icin ve icten dostlugunu benimle
paylastigin icin cok tesekkur ederim. Paylastigimiz hersey hep cok anlamliydi. Sana
buyuk mutluluklar ve bol sans dilerim, ve hep yakinlarinda olacagima soz veriyorum.
My mom, Gulcin Tuzcu, my dad Sukru Tuzcu, my sisters Gamze Muslu and Gaye
Baykut, my brothers in law Yasar Muslu and Can Baykut, my nieces Ece Muslu and
Irem Baykut, and my nephew Emre Baykut are greatly acknowledged for their endless
love, support and for being the great family of mine. Beni ben yaptiginiz icin size ne
kadar tesekkur etsem az, bir evlat ailesine olan borcunu nasil odeyebilir bilmiyorum
ama sanirim bunun icin yasiyorum.
The people who I shared home with, Irmak Aladagli, Baris Yagci, Ozan Dogu
Tuna and Mark Berix, thank you for sharing your life in Eindhoven with me. Irmak,
ilk goz agrim :), benim icin yaptigin tum karsiliksiz deger bicilmez iyiliklerin icin,
buraya geldigim zaman, hem annem hem kardesim hem arkadasim oldugun icin cok
cok tesekkur ederim. Eindhovendaki ailemin bas mudavimi, her zaman birlikte olmak
dilegiyle, hersey her zaman gonlundeki gibi olsun. Baris, abi seni cok seviyorum, sonsuz
dostlugun, ictenligin, guvenin, ay artik iyice melankolige bagladim, yani seni anlatmak
cok zor, dunyaya cok seyrek gelecek bir insan tipisin, ama bana daha da bir ozelsin,
neden bilmiyorum, bana hayat asiliyorsun... Paylastigimiz ev, bolum, the Endings,
beraber yasadigimiz hersey, kocaman kucaklamalarin icin cok cok tesekkur ederim,
dunyada iyi olan ne varsa seninle olsun. Ozan, yani iyi ki Hollanda’ya master yapmaya
gelmissin, iyi ki senin gibi bir insani tanima serefine ermisim. Tum harika muhabbetler,
tartismalar, yemekler, muzikler icin cok cok sagol! Mark, thank you for introducing
the epic Limburgse life, and the concept of being homies for life. You are a great man,
and you deserve the very best things where Murphy’s got no guts to ruin anything.
Sinan & Ceylan Oncu are greatly acknowledged for making me feel home in every
moment I was with them. Canlarim, n’olur hep goruselim ilerideki yillarda da. Cok gec
buldum ben sizi hayatimda, ama gec olsun guc olmasin! Harika insanlarsiniz ve sizi cok
seviyorum, valla bilmiyorum, sakin eskimeyin, hayatin sizi yormasina izin vermeyin..
167

Acknowledgements
Bole bir korku kaplar ya insanin icini sevdigi insanlari dusununce ya da benim ole oluyo
bilmiyorum, sizi pamuklara sarip saklamak istiyorum..
The people I shared the lab with, Patricia Geleen, Hector Tello Manon, Martin
Ottink, Marie-Claire Hermant, Evgeniy Tkalya, Rutger Knoop, Dogan Gunbas, Albert
Jeyakumar, Julien van Velthoven, and the new joiners Lili and Mischa, thank you for
nice work environment. The special thanks are for Patricia, Hector and Martin who
helped me so much to find my way in the lab. Hector, you are an arsehole, this is
something apart, I will never forget the time that you made me weep like hell, it’s so
special :)) Thanks also go to Judith Canadell, my official labbudy despite the fact that
we never shared the same lab :), thank you for all the effort to help me around. Joris
Salari is thanked for the nice times together both in the Netherlands and South Africa,
finding my nickname, and all the chats and various things we did together. MC, you’re
a special person for me, I wish you all the best.. My colleagues/friends in SA, Rueben
Pfukwa, Aimee Sutherland, Waled Hadasha, Niels & Zaskia Akeroyd and Eric van den
Dungen are greatly acknowledged for their great help around the lab and their sincere
friendship and company making the time I spent in SA very hilarious.
And finally my students, they are the last I thank but they should be the first,
students do the most annoying thing, the crappy lab work. Politeness killed the cat :))
Rik Diepenhorst is many thanked for his interest and diligence in the project we carried
out together, which worked out as his gradution project and the skeleton of Chapter
5. Rik, I wish you all the best for your rest of your life, and thank you for being a
great team-worker. Elif Zengin is many thanked for the nice work she did on thiol-ene
coupling approach in her summer internship. Elif, I wish you good luck and success in
your masters and a happy life ever after, hopefully we see each other in between.
There are so many more names which must be mentioned actually, but it’s so hard
for me to write the time more than four years down (taking ’the last minute personality’
into account). I am happy that I was here, with all of you guys. This PhD time was
a different dimension of my life that I will never get out. I think I can’t get out :)
I am serious that I met so many great people here, thank you all for being yourself
and being just yourself. I hope I will see each one of you somewhere sometime in my
life, preferably in a warmer and less rainy place. After getting this PhD, I hope I will
have enough money and freetime in the future (so hopeful) that I can travel around
the world to meet everyone I have once shared something with.
168

Curriculum Vitae
Gozde Tuzcu was born on 10th April 1983 in Izmit, Turkey. After graduating from
Ankara Science High School in 2001, she started her undergraduate study at the depart-
ment of Chemistry in Middle East Technical University. After obtaining her Bachelor
of Science degree in 2006, she started her postgraduate study at the department of
Polymer Science and Technology in the same university and joined the research project
on concrete admixtures, which was under the supervision of prof.dr. Leyla Aras and
financially supported by the research fund (BAP) of Middle East Technical University
and Baskent Yatirim A.S. She obtained her Master of Science degree in 2008, with a
thesis on the synthesis of polycarboxylate based copolymers with different topologies
and their application as a superplasticizer in concrete. Subsequently, she started her
PhD study on April 2008 at the department of Chemical Engineering and Chemistry in
Eindhoven University of Technology, under the supervision of prof.dr. Bert Klumper-
man. The most important results of this study are presented in this dissertation.
169

Curriculum Vitae
List of Publications
• Tuzcu, G., van Duin, M., Klumperman, B., ”ARGET ATRP as a first step to-
wards ’grafting onto’” NATO Advanced Study Institute Meeting, (2008). (poster
presentation)
• Buyukyagcı, A., Tuzcu, G., Aras, L., ”Synthesis of copolymers of methoxy polyethy-
lene glycol acrylate and 2-acrylamido-2-methyl-1-propanesulfonic acid: Its char-
acterization and application as superplasticizer in concrete” Cement and Concrete
Research 39 (2009), pp. 629 - 635. (article)
• Tuzcu, G., van Duin, M., Klumperman, B., ”Graft thermoplastic elastomers via
polymer-polymer conjugation” IUPAC 9th International Conference on Advanced
Polymers via Macromolecular Engineering, (2011). (oral presentation)
• Tuzcu, G., van Duin M., Klumperman, B., ”Graft thermoplastic elastomers via
polymer-polymer conjugation: 1. Amine-anhydride coupling” (article, in prepa-
ration)
• Tuzcu, G., van Duin M., Klumperman, B., ”Graft thermoplastic elastomers via
polymer-polymer conjugation: 2. Thiol-ene coupling” (article, in preparation)
• Tuzcu, G., van Duin M., Klumperman, B., ”Graft thermoplastic elastomers via
NMP: A ’grafting from approach’” (article, in preparation)
• Tuzcu, G., van Duin M., Klumperman, B., ”Graft thermoplastic elastomers:
Structure-morphology-property relations’” (article, in preparation)
170