Embed Size (px)
Citation preview
1
Project 433/06 R3 (I)
“Sustainable Model for the Brazilian Wood Flooring Production Chain”
Subproject:
“Thermomechanical treatment of tropical wood – Final Report”
Larissa Medeiros Arruda and Cláudio Henrique Soares Del Menezzi
Dept. Forest Engineering, Faculty of Technology, University of Brasília
Summary
Thermomechanical modification is a densification technique that
combines heat treatment with mechanical compression. The aim of this study was to evaluate the physical and mechanical properties of four tropical wood thermomechanically treated for the production of hardwood floors. The following species were selected: cedrinho (Erisma uncinatum Warm.), angelim (Hymenolobium sp.), tachipreto (Tachigali myrmecophila Ducke) and mandioqueira (Qualea paraensis Ducke). Samples measuring 100 mm (width) x 300 mm (length) were thermomechanically treated and afterwards physical, mechanical and colorimetric properties were assessed. The treatment was efficient to reduce the EMC and surface wettability of species. Angelim and mandioqueira had significant increase in apparent density and the highest compression ratio. Color of species became darker, mainly due to reduction of lightness. Values of mechanical properties increased compared with values of reference. 1 Introduction
Thermomechanical modification is a densification technique that combines heat treatment with mechanical compression. In these treatments the densification occurs by cell wall buckling, which reduces void spaces volume (Kutnar et al. 2009). However, in order to ensure suitable properties of the treated wood, it is important that treatment occurs at an ideal temperature, in which the amorphous polymers of wood (lignin and hemicelluloses) pass from the glassy state to the rubbery state (Wolcott et al. 1990; Akerholm and Salmén 2004). It is defined as the glass transition temperature (Tg) and it varies with
2
species and moisture content used. At this point the wood can be compressed without collapse in the cell wall structure.
Studies using thermomechanical modification in wood are recent and scarce especially with tropical wood. The Amazon forest is the largest rainforest of the Earth, which covers 40% of the South American continent and has an enormous biodiversity (Mongabay 2012). For this reason it is extremely important to study species of tropical wood of lesser known and characterize them technologically. The aim of this study was to evaluate the physical and mechanical properties of four tropical wood thermomechanically treated for the production of hardwood floors.
2 Applied methodology
For thermomechanical treatment four tropical species were chosen:
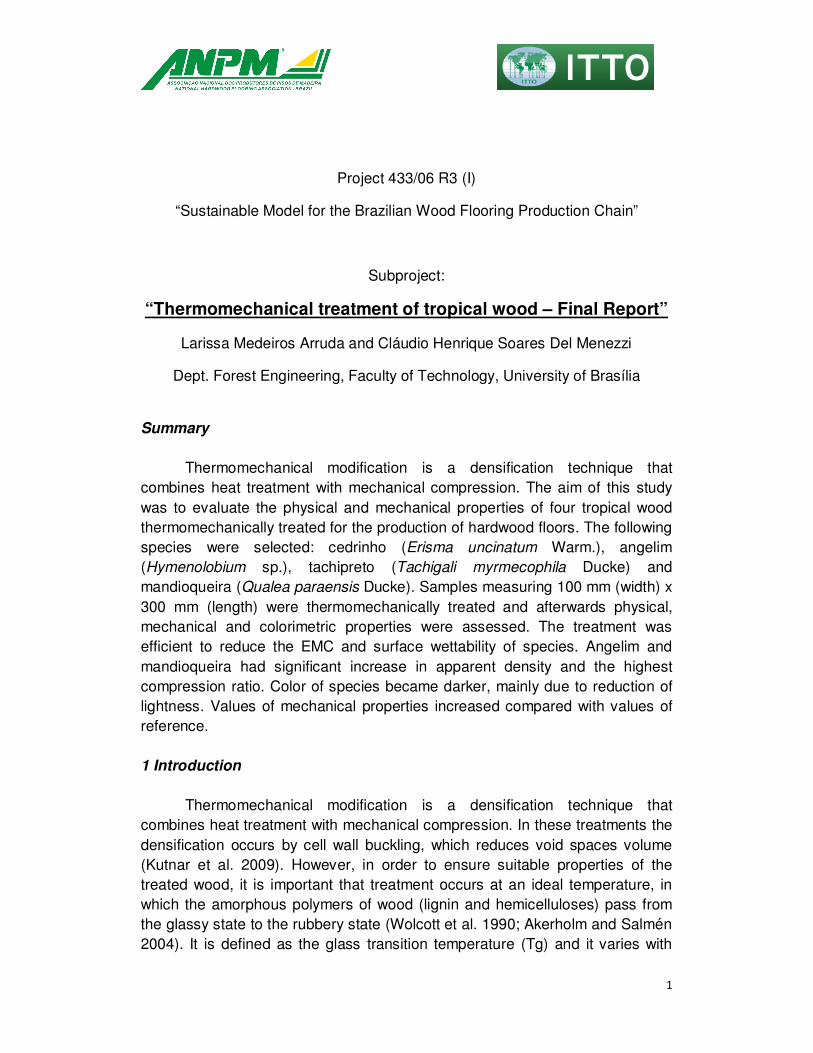
cedrinho (Erisma uncinatum Warm.) angelim (Hymenolobium sp.) tachipreto (Tachigali myrmecophilaDucke) and mandioqueira (Qualea paraensisDucke). The boards were cut in 100 mm (width) x 300 mm (length) with thickness ranging from 20 mm to 25 mm. A square sample measuring 30 mm x 30 mm was to cut from each board to measure previously, apparent density, equilibrium moisture content (EMC), wettability and color variables (Figure 1).
Figure 1.Dimensions of the wood boards and small sample to measure physical properties previously.
Thermomechanical Treatment
Some pre-tests were conducted and the temperature of 145°C was chosen to apply the treatment. Before treatment, were measured the thickness with a caliper rule at four points and the mass in each sample. The nominal pressure was equivalent to 25% of perpendicular compression strength (fc,90º)

3
obtained at Database of Brazilian Woods (http://www.ibama.gov.br/lpf/madeira/foreword.htm), which meant 1.4 MPa for cedrinho, 2.8 MPa for angelim, 2.3 MPa for tachipreto and 3.6 MPa for mandioqueira.
The internal temperature of samples was measured by a thermocouple inserted through a hole in wood (Figure 2). Unfortunately the thermocouple in cedrinho treatment didn’t work correctly and then the curve of temperature was not presented for cedrinho.
Figure 2. A – Hole in the sample of cedrinho. B – Thermocouple
monitoring the temperature during the treatment. The samples were compressed until the internal temperature of wood
reach around 100°C, which is approximately the glass transition temperature (Tg) characterized by the softening behavior of amorphous polymers. When the temperature of the polymer approaches Tg the stiffness of the material decreases rapidly and the compression is facilitated. Each species has a unique behavior when subjected to this treatment. Therefore, the time required to reach 100°C was different for each species.
Another important fact observed during treatment was the automatic adjustment of the press. During pressing, as already mentioned, the heat promotes the softening of wood polymers and in consequence the compression of wood. So while wood is being compressed, the hydraulic press was readjusting pressure to keep it constant. It means that each press adjustment imparted a reduction of thickness in wood and this observation helped to control the pressing time.
When the material reached around 100°C and the press adjusted the pressure about three or four times, 50% of pressure was released. Five minutes after, 100% of pressure was released. The samples remained in press hydraulic for further five minutes without pressure and with constant temperature, characterizing a thermal treatment (Figure 3). This stage was important to help release compression stresses which are inherent to any compressed material. After treatment, board thickness and mass were obtained immediately.
A B

4
Figure 3. Diagram of the thermomechanical treatment. The mass loss (ML, %) and the reduction in thickness (RT, %) were
calculated according to equations 1 and 2. These measurements were done immediately after the treatment and also for three weeks, where the material was kept at conditioning room (20°C ± 3 °C and 65% ± 1% RH).
100.
−=
i
fi
W
WWWL Equation 1
100.
−=
f
fi
T
TTRT Equation 2
Where: Wi and Ti = mass and thickness initial Wfand Tf = mass and thickness final. Physical properties
The EMC and the apparent density were measured before and after the treatment. For apparent density, samples were measured with a digital caliper at four points and the mass was obtained with a digital balance. For the EMC measurement the samples was dried in oven with air circulation at constant temperature of 103±2 °C until constant mass (Equation 3). After treatment, apparent density was monitored at conditioning room and the EMC was measured two months after the treatment.

5
100.
−=
d
dw
W
WWEMC Equation 3
Where: Ww = wet mass (g); Wd= dry mass (g). Thickness and volumetric swelling, and water absorption were also
measured. The swelling samples were measured with digital caliper at four points in thickness and three points in width and length. The water absorption samples were evaluated with digital scale. Samples were kept immersed in distilled water and the measurements were done at two, 24, 96 and 144 hours, after immersion.
Figure 4. A - Samples immersed in water for swelling test. B – Digital
scale used in water absorption test. Wettabillity and color measurement
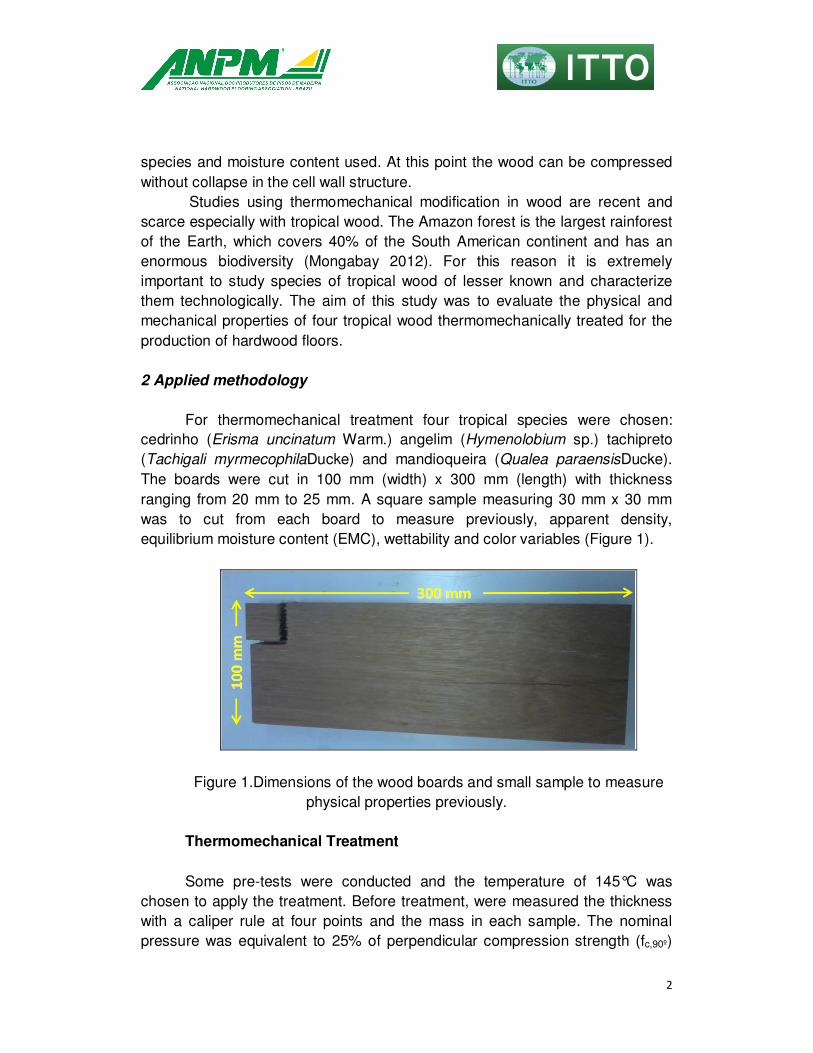
The wettability was evaluated using a goniometer model Krüss DSA30 running DSA3 software (Figure 5). The drop volume used was about 10 µl of distilled water, and the contact angle was measured for two minutes, totaling 120 measurements. Data obtained at 60 seconds was used to run the statistical analyses.
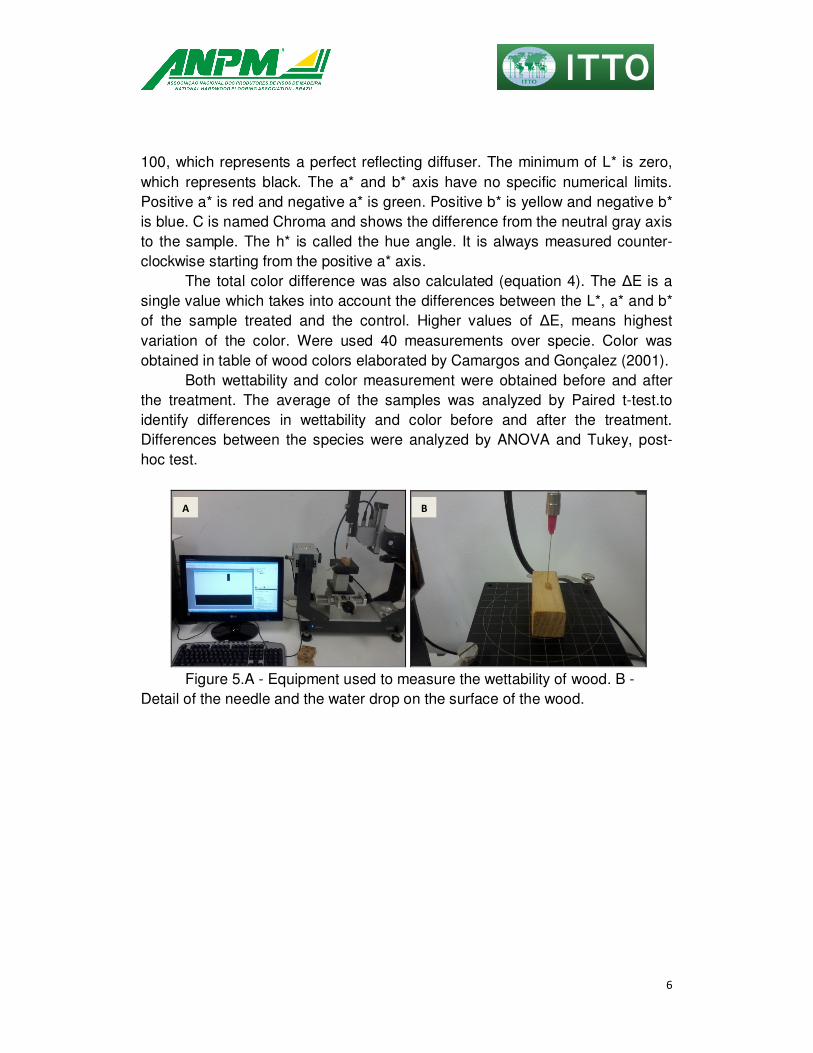
The color measurement was done using the CIEL*a*b* system (L*, a*, b*, C and h*) whose color variables were obtained in a X-Rit espectrophotometer model Color Eye XTH-X, illuminant D65 with angle of 10°, coupled to a microcomputer (Figure 6). The CIELAB color space is organized in a cube form. The L* axis runs from top of bottom and the maximum value is
A B
6
100, which represents a perfect reflecting diffuser. The minimum of L* is zero, which represents black. The a* and b* axis have no specific numerical limits. Positive a* is red and negative a* is green. Positive b* is yellow and negative b* is blue. C is named Chroma and shows the difference from the neutral gray axis to the sample. The h* is called the hue angle. It is always measured counter-clockwise starting from the positive a* axis.
The total color difference was also calculated (equation 4). The ∆E is a single value which takes into account the differences between the L*, a* and b* of the sample treated and the control. Higher values of ∆E, means highest variation of the color. Were used 40 measurements over specie. Color was obtained in table of wood colors elaborated by Camargos and Gonçalez (2001).
Both wettability and color measurement were obtained before and after the treatment. The average of the samples was analyzed by Paired t-test.to identify differences in wettability and color before and after the treatment. Differences between the species were analyzed by ANOVA and Tukey, post-hoc test.
Figure 5.A - Equipment used to measure the wettability of wood. B -
Detail of the needle and the water drop on the surface of the wood.
A B
7
Figure 6.A - Spectrophotometer used to measure the color of wood
samples. B – Diagram that represents the CIELAB color space (Hunterlab 2008)
( ) ( ) ( )²*²*²* baLE ∆+∆+∆+=∆ Equation 4
Where: ∆L*, ∆a*, ∆b* = variation between the treated and untreated samples.
Mechanical properties
The following mechanical properties were assessed, according to the
standard ASTM D-143 (2009): static bending (EM and fm), Janka hardness (H) and parallel compression strength (fc,0°).These properties were conducted at a Universal Testing Machine (EMIC, model DL30000) with a maximum load capacity of 300 kN (Figure 7). For the static bending the samples were cut at dimensions of 35 mm x 300 mm and for hardness the dimensions were 33 mm x 50 mm. For fc,0° the length ranged according the thickness. Using the same width of static bending samples (35 mm) and the same slenderness used at the standard, the length was 90 mm for cedrinho, 70 mm for angelim and mandioqueira and 80 mm for tachipreto.
A B
8
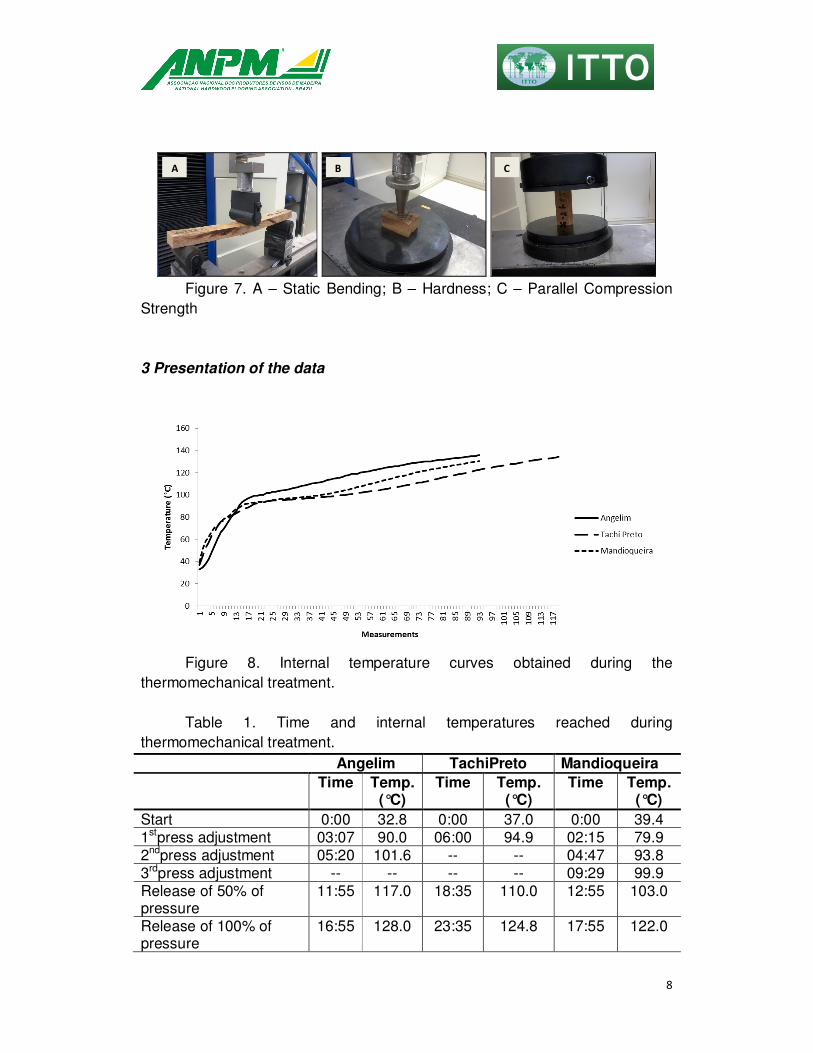
Figure 7. A – Static Bending; B – Hardness; C – Parallel Compression
Strength
3 Presentation of the data
Figure 8. Internal temperature curves obtained during the
thermomechanical treatment. Table 1. Time and internal temperatures reached during
thermomechanical treatment. Angelim TachiPreto Mandioqueira
Time Temp. (°C)
Time Temp. (°C)
Time Temp. (°C)
Start 0:00 32.8 0:00 37.0 0:00 39.4 1stpress adjustment 03:07 90.0 06:00 94.9 02:15 79.9 2ndpress adjustment 05:20 101.6 -- -- 04:47 93.8 3rdpress adjustment -- -- -- -- 09:29 99.9 Release of 50% of pressure
11:55 117.0 18:35 110.0 12:55 103.0
Release of 100% of pressure
16:55 128.0 23:35 124.8 17:55 122.0
A B C
9
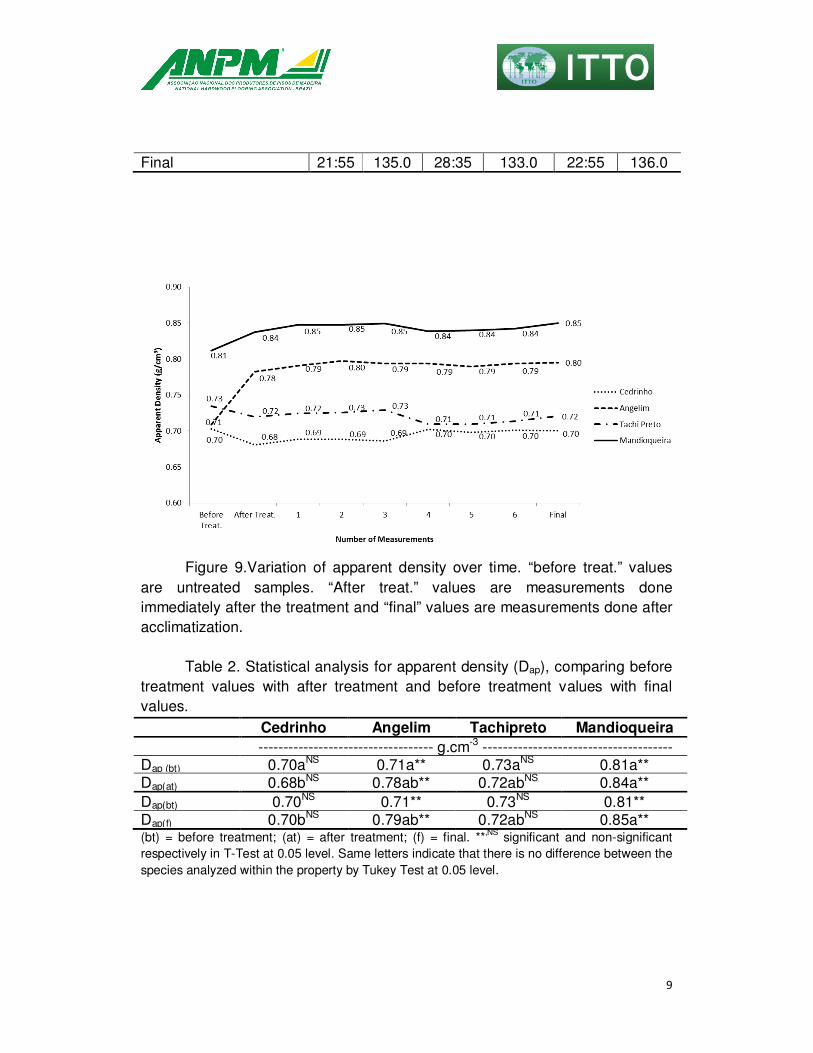
Final 21:55 135.0 28:35 133.0 22:55 136.0
Figure 9.Variation of apparent density over time. “before treat.” values
are untreated samples. “After treat.” values are measurements done immediately after the treatment and “final” values are measurements done after acclimatization.
Table 2. Statistical analysis for apparent density (Dap), comparing before
treatment values with after treatment and before treatment values with final values. Cedrinho Angelim Tachipreto Mandioqueira
----------------------------------- g.cm-3 -------------------------------------- Dap (bt) 0.70aNS 0.71a** 0.73aNS 0.81a** Dap(at) 0.68bNS 0.78ab** 0.72abNS 0.84a** Dap(bt) 0.70NS 0.71** 0.73NS 0.81** Dap(f) 0.70bNS 0.79ab** 0.72abNS 0.85a** (bt) = before treatment; (at) = after treatment; (f) = final. **,NS significant and non-significant respectively in T-Test at 0.05 level. Same letters indicate that there is no difference between the species analyzed within the property by Tukey Test at 0.05 level.

10
Figure 10.Variation of reduction of thickness over time.“ After treat.”
values are measurements done immediately after the treatment and “final” values are measurements done after acclimatization.
Figure 11.Variation of mass loss over time. “After treat.” values are
measurements done immediately after the treatment and “final” values are measurements done after acclimatization.
.

11
Table 3. Statistical analysis for reduction of thickness (RT), mass loss
(ML) and equilibrium moisture content (EMC). Property Cedrinho Angelim TachiPreto Mandioqueira
---------------------------------- % ------------------------------------ RT(at) 8.23cNS 17.42aNS 9.41c** 13.58b** RT(f) 8.12cNS 16.00aNS 8.27c** 12.41b** ML(at) 11.05a** 8.88b** 11.18a** 10.94a** ML(f) 8.98a** 6.40b** 6.67b** 6.17b** EMC(bt) 12.48a** 9.49b** 10.84b** 10.46b** EMC(f) 6.40c** 5.36d** 9.36a** 8.40b**
(bt) = before treatment; (at) = after treatment; (f) = final.**,NS significant and non-significant respectively in T-Test at 0.05 level. Same letters indicate that there is no difference between the species analyzed within the property by Tukey Test at 0.05 level.
Table 4. Results for dimensional stability parameters, thickness swelling (TS), volume swelling (VS) and water absorption (WA).
Property Cedrinho Angelim Tachipreto Mandioqueira
---------------------------------- % ------------------------------------ TS 2h 0.56b 1.76a 2.12a 1.49a VS 2h 0.96b 2.29a 2.88a 2.16a WA 2h 3.23b 3.02b 5.04a 3.77ab TS 24h 1.71b 6.90a 5.63a 5.50a VS 24h 3.25b 8.54a 7.26a 8.26a WA 24h 13.13b 14.35b 19.55a 14.41b TS 96h 2.70b 10.02a 7.22a 8.52a VS 96h 4.96b 12.19a 8.90ab 12.73a WA 96h 27.59b 29.33b 39.86a 30.22b TS 144h 2.99c 10.91a 7.45b 9.02ab VS 144h 5.45b 13.28a 9.23ab 13.53a WA 144h 32.99a 34.54a 45.49a 33.91a
Same letters indicate that there is no difference between the species analyzed within the property by Tukey Test at 0.05 level.

12
Table 5. Results for color measurement analyzing the condition of the
parameter before and after treatment and the total variation of color.
Parameters Cedrinho Angelim Tachipreto Mandioqueira
L* before 51.17** 60.60** 58.18** 58.48** L*after 32.35** 53.42** 51.15** 51.03** a* before 14.07NS 14.45** 9.21NS 13.71** a* after 13.88NS 15.52** 10.16NS 16.47** b* before 25.71** 31.44NS 33.13** 29.88** b* after 22.36** 31.35NS 30.78** 28.20** C before 29.31** 34.62NS 34.41** 32.93NS C after 26.32** 34.99NS 32.44** 32.79NS h* before 61.32** 65.29** 74.61** 65.48** h* after 58.21** 63.61** 71.85** 59.87** ∆E 19.21a 8.37b 10.25b 9.29b
**,NSsignificant and non-significant respectively in T-Test at 0.05 level. Same letters indicate that there is no difference between the species for ∆E by Tukey Test at 0.05 level.
Figure 12. Color of the samples before and after treatment defined
according color table of Camargos and Gonçalez (2001).
13
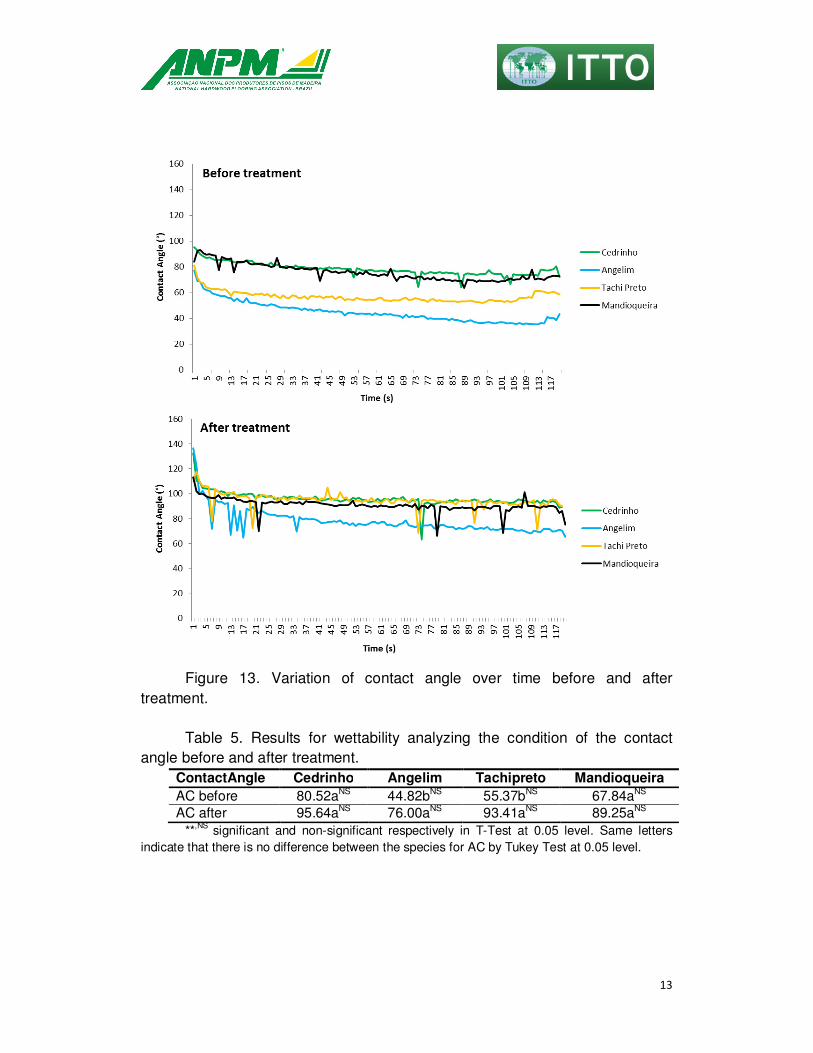
Figure 13. Variation of contact angle over time before and after
treatment.
Table 5. Results for wettability analyzing the condition of the contact angle before and after treatment.
ContactAngle Cedrinho Angelim Tachipreto Mandioqueira
AC before 80.52aNS 44.82bNS 55.37bNS 67.84aNS AC after 95.64aNS 76.00aNS 93.41aNS 89.25aNS
**,NS significant and non-significant respectively in T-Test at 0.05 level. Same letters indicate that there is no difference between the species for AC by Tukey Test at 0.05 level.
14
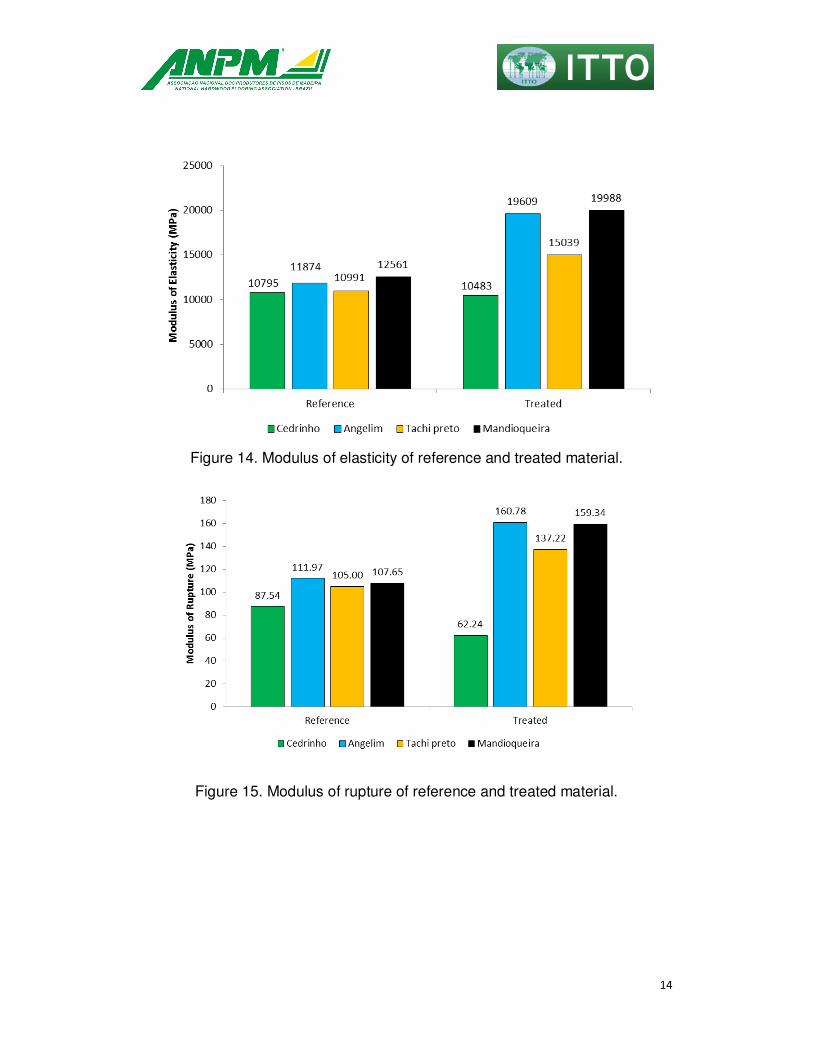
Figure 14. Modulus of elasticity of reference and treated material.
Figure 15. Modulus of rupture of reference and treated material.
15
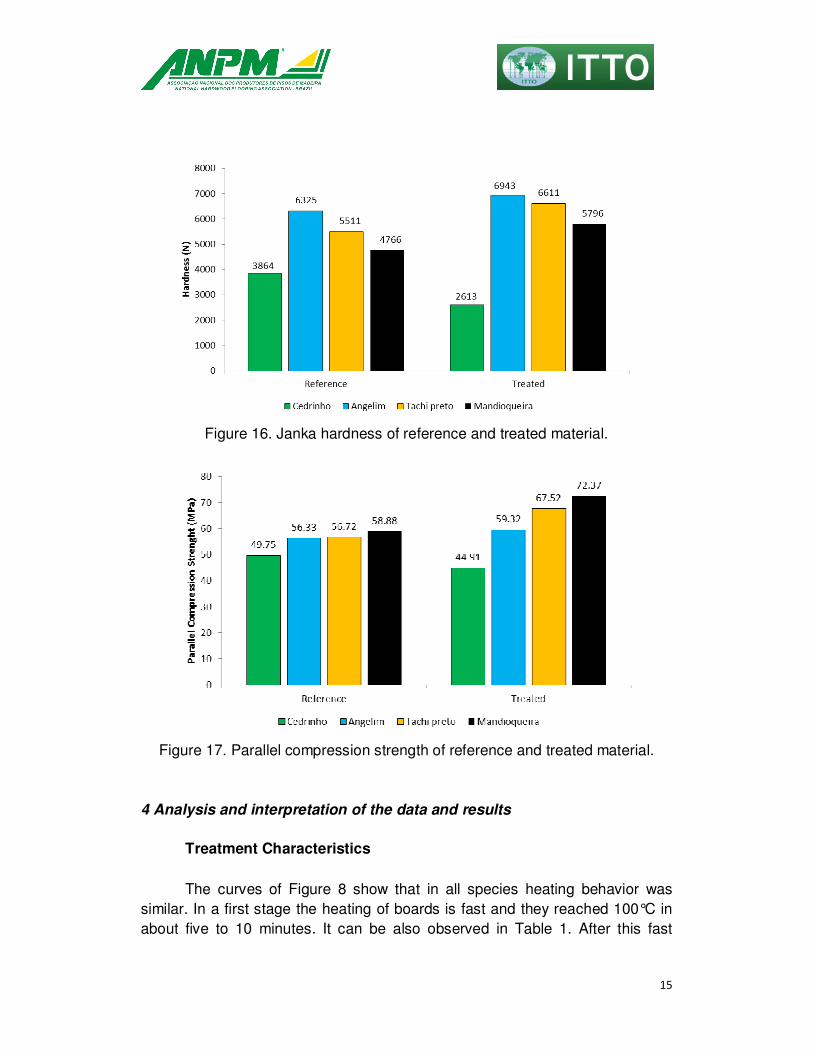
Figure 16. Janka hardness of reference and treated material.
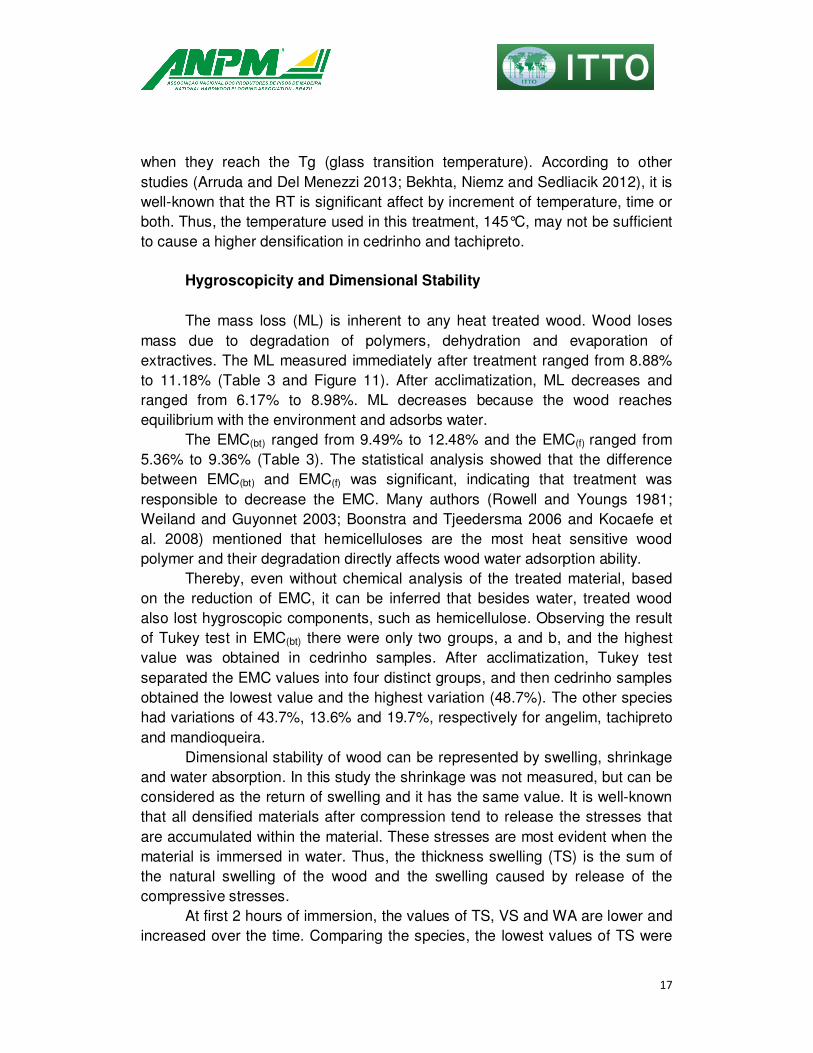
Figure 17. Parallel compression strength of reference and treated material.
4 Analysis and interpretation of the data and results
Treatment Characteristics
The curves of Figure 8 show that in all species heating behavior was
similar. In a first stage the heating of boards is fast and they reached 100°C in about five to 10 minutes. It can be also observed in Table 1. After this fast

16
heating step the internal temperature rose gradually up to reach a maximum of 136°C in mandioqueira samples.
As mentioned earlier, each species has its own unique behavior and Table 1 shows that the time of treatment and automatic press adjustments were different. Nevertheless, it is possible to observe a pattern between the species. The first adjustment of the press occurred between 80°C and 95°C, which indicates the glass transition temperature. From this stage the board is compressed and its thickness began to be reduced.
With respect to time, the longest treatment was 28 minutes and 35 seconds required by tachipreto species. On the other hand, the time required by angelim and mandioqueira was quite similar: 21 minutes and 55 seconds and 22 minutes and 55 seconds, respectively. Therefore, this treatment can be considered fast in comparison to those currently used to treat wood, which require hours of even days.
Densification of Wood
Initially the apparent density of the samples were 0.70 g.cm-3 for
cedrinho, 0.71 g.cm-3 for angelim, 0.73 g.cm-3 for tachipreto and 0.81 g.cm-3 for mandioqueira. From Figure 9 and Table 2 it is clear that only the angelim and mandioqueira samples had a significant increase in apparent density. Density increased from 0.71 g.cm-3 to 0.79 g.cm-3 in angelim and from 0.81 g.cm-3 to 0.85 g.cm-3at mandioqueira. The others species, showed behavior not expected since decrease of density after treatment was observed.
A slight densification can also be seen in the low values of the reduction in thickness (RT). Usually the RT values are close to the percentage of the parallel compression strength that was applied, in this case 25%. The highest value of RT was founded for angelim, 17.42% immediately after treatment and 16% after acclimatization (Table 3 and Figure 10). Mandioqueira reached the second highest value of RT(f), 12.41%. Although these values are smaller than intended, they were sufficient to increase the apparent density significantly in 11.26% and 4.93%.
Moreover, the values measured after acclimatization (RT(f)) are always lowest than the RT(at), due to the gradual increase in thickness, that represents the natural trend of compressed material to return own initial thickness and also due to the absorption of humidity. The difference between RT(at) and RT(f) was significant only in tachipreto and mandioqueira samples, which means that for these species the thickness returned at greater level (Table 3).
The densification of wood may be explained by the viscoelastic behavior of amorphous polymers of wood, which changes drastically to the viscous state
17
when they reach the Tg (glass transition temperature). According to other studies (Arruda and Del Menezzi 2013; Bekhta, Niemz and Sedliacik 2012), it is well-known that the RT is significant affect by increment of temperature, time or both. Thus, the temperature used in this treatment, 145°C, may not be sufficient to cause a higher densification in cedrinho and tachipreto.
Hygroscopicity and Dimensional Stability
The mass loss (ML) is inherent to any heat treated wood. Wood loses mass due to degradation of polymers, dehydration and evaporation of extractives. The ML measured immediately after treatment ranged from 8.88% to 11.18% (Table 3 and Figure 11). After acclimatization, ML decreases and ranged from 6.17% to 8.98%. ML decreases because the wood reaches equilibrium with the environment and adsorbs water.
The EMC(bt) ranged from 9.49% to 12.48% and the EMC(f) ranged from 5.36% to 9.36% (Table 3). The statistical analysis showed that the difference between EMC(bt) and EMC(f) was significant, indicating that treatment was responsible to decrease the EMC. Many authors (Rowell and Youngs 1981; Weiland and Guyonnet 2003; Boonstra and Tjeedersma 2006 and Kocaefe et al. 2008) mentioned that hemicelluloses are the most heat sensitive wood polymer and their degradation directly affects wood water adsorption ability.
Thereby, even without chemical analysis of the treated material, based on the reduction of EMC, it can be inferred that besides water, treated wood also lost hygroscopic components, such as hemicellulose. Observing the result of Tukey test in EMC(bt) there were only two groups, a and b, and the highest value was obtained in cedrinho samples. After acclimatization, Tukey test separated the EMC values into four distinct groups, and then cedrinho samples obtained the lowest value and the highest variation (48.7%). The other species had variations of 43.7%, 13.6% and 19.7%, respectively for angelim, tachipreto and mandioqueira.
Dimensional stability of wood can be represented by swelling, shrinkage and water absorption. In this study the shrinkage was not measured, but can be considered as the return of swelling and it has the same value. It is well-known that all densified materials after compression tend to release the stresses that are accumulated within the material. These stresses are most evident when the material is immersed in water. Thus, the thickness swelling (TS) is the sum of the natural swelling of the wood and the swelling caused by release of the compressive stresses.
At first 2 hours of immersion, the values of TS, VS and WA are lower and increased over the time. Comparing the species, the lowest values of TS were
18
found for cedrinho, until the end of 144 hours. Note that the TS value is directly linked to RT, since one of the components of TS is caused by the compression in the material thickness direction. Thus, Table 3 shows that the lowest value of RT, 8.12% for cedrinho, is connected to the lower TS, 2.99%.
Another way to evaluate the dimensional stability is by the amount of the thickness that was compressed that did not return with the swelling. Thus, the value of RT should be greater than TS to ensure that the form acquired during the compression was not lost with the swelling. The values of RT(f) were 8.12%, 16%, 8.27% and 12.41%, and values of TS 144h were lower, 2.99%, 10.91%, 7.45% and 9.02%, respectively to cedrinho, angelim, tachipreto and mandioqueira.
Volume swelling is compounded by the swelling of the thickness, width and length of the sample and therefore is quantitatively greater than TS. Highest value of VS 144h was found for mandioqueira, 13.53% and lowest was found for cedrinho, 5.45%. The ML 2h ranged from 3.02% for angelim to 5.04% for tachipreto. After 144 hours, ML increased, ranging from 32.99 at cedrinho to 45.49% at tachipreto, but the differences between the means were not statistically significant by Tukey test.
Color Measurement and Wettability
Before treatment the color obtained in samples was reddish-brown, yellow-brownish, olive yellow and olive brown, respectively for cedrinho, angelim, tachipreto and mandioqueira (Figure 12).The name of the color is subjective and only gives an idea of coloring of the wood. According Camargos and Gonçalez (2001) clearer wood presents the L* higher than 56, thus, observing Table 4, the species with greater L* in decreasing order, are: angelim, mandioqueira, tachipreto and cedrinho. Analogously, clearer woods have more yellow pigments, represented by b* and the darkest wood (cedrinho) have the lowest value for b* (Table 4).The red pigment (a*) is in lesser amount in tachipreto wood. The others species have similar values for a*.
After treatment, were observed a significant decrease in L* and b* which causes a reddish and brownish appearance in wood. The reduction of L* in heat treatments in woods was commented by several authors (Charrier et al. 2002; Del Menezzi 2004; Esteves et al. 2008; Lopes 2010; Sundqvist 2010), who attribute the darkening to oxidation of some substances on the surface of wood. Besides, they comment that heat-treated woods have been suggested as substitute for some tropical hardwoods. Except in angelim, b* values were decreased after treatment, corroborating with the darkening.

19
The darkening process includes increasing of a*. This difference was significant only in samples of angelim and mandioqueira, increasing the reddish appearance in these species. In heat-treated woods is also expect the decrease of Chroma (C) that is, the color of the wood becomes less saturated. This occurred only in cedrinho and tachipreto samples. Also confirming the darkening of color, the values of hue (h*) decreased. When the values of h* increase the color nears to yellow and when the h* decreases the color nears to red. So, observing Table 4, in all species the value of h* decreased significantly, confirm the trend of reddish in heat-treated woods.
Cedrinho had the highest variation of color (∆E), 19.21, followed by tachipreto, 10.25. Changes in the names of the colors could only be observed in the wood of cedrinho and mandioqueira. The samples of angelim and tachipreto, continued with the same color, despite significant quantitative changes (Figure 12).
Another very important change in heat-treated wood occurs on its surface. Generally, after heat treatments the surface of wood becomes smoother and less wettable. The wettability, measured by contact angle (CA), is higher when the final AC is lower. The Figure 13 shows the behavior of CA before and after treatment. Before treatment the values of CA were lower than after treatment, indicating that the wood become less wettable.
Analyzing the values of AC at 60 seconds (Table 5) it can observed that CA increased after treatment, despite the difference was not statistically significant. This hydrophobic behavior of wood occurs when this is subjected to thermal treatment above the glass transition temperature where a conformational rearrangement of wood polymers occurs, as a result of the lignin plastification.
Reducing the wettability is important when the product requires that the surface has low interaction with water, as is the case of wood flooring. But this reduction of wettability in excess can hinder the application of sealants, paints and varnishes. Must, therefore, find a sweet spot reduction does not imply that wettability in reducing its workability.
Mechanical Properties
The values of reference for mechanical properties were obtained in in
Database of Brazilian Woods (http://www.ibama.gov.br/lpf/madeira/foreword.htm). These values are only a general reference to the species obtained in previous studies conducted in the Brazilian Forest Products Laboratory, so there is still need to do these tests with the untreated samples of the species.
20
The modulus of elasticity (EM) ranged from 10483 MPa for cedrinho to 19988 MPa for mandioqueira (Figure 14). Only in treated samples of cedrinho the value of EM were lower than reference. The others values increased after treatment. For angelim wood the values increased in 65.14%, in tachipreto increased 36.83% and in mandioqueira the values were 59.12% higher. The modulus of rupture (fm) had similar behavior to EM. Only cedrinho had value of fm lower than reference. Values of fm ranged from 62.24 MPa for cedrinho to 160.78 MPa for angelim (Figure 15). FM increased 43.59% in angelim, 30.68% in tachipreto and 48.02% in mandioqueira.
This result is very important for the strength of treated wood. It is well-known that, usually, in heat treatments, the wood loses strength due to depolymerization reactions, especially hemicelluloses which are less stable than lignin and are more sensitive to temperature. Changes in the composition or loss of hemicelluloses may contribute significantly to changes in the strength properties of the treated wood to high temperatures. Thus, as the temperature used was not very high (145°C) there was no loss of stiffness and mechanical strength of the wood. On the contrary, these properties were slightly improved even though there has not been a great densification of wood.
Hardness (H) measures the resistance to penetration of objects in the wood surface and is an important property for wood flooring. Values ranged from 2659.12 N for cedrinho to 6942.68 N for angelim (Figure 16). Treatment resulted in increased in H of 9.76% for angelim, 19.95% for tachipreto and 21.60% for mandioqueira. Values in cedrinho decreased, as EM and fm.
Figure 17 shows the fc,0° values. Except for cedrinho wood, the values of treated samples were higher than reference. The improvement was about 5.31% for angelim, 19.02% for tachipreto and 22.90% for mandioqueira.
5 Conclusions
The thermomechanical treatment increased significantly the apparent
density for angelim and mandioqueira. Likewise, these species presented the highest values of thickness reduction. The others species were not significantly densified, probably because a relatively low temperature (145ºC) was used.
For all species, thermomechanical treatment ensured good dimensional stability, as perceived by the thickness swelling lower than the compression rate. This meant that the compressed shape was retained in part after immersion in water. Another important factor was the reduction of EMC. The treatment was efficient in decrease the EMC. Cedrinho had the most significant reduction of EMC, 48.7%, followed by angelim with 43.7%.
21
The color of all species became darker, with predominantly reddish and brownish tones. This is ideal for clearer woods when wishes to imitate tones of darker woods. The wettability of woods was reduced and it was represented by the increase in CA after treatment.
Except for cedrinho, all species had increase in mechanical properties after thermomechanical treatment. The property that was the most positively affected by treatment was EM, which had a maximum improvement of 65.14% at angelim samples.
6 Recommendations
This was a preliminary study with this treatment for Brazilian tropical woods. These good results should encourage further work in the area, mainly those regarding utilization of different temperature and duration of treatment with the objective of obtaining better densification. Furthermore, treated wood must be evaluated in machinability tests, since the objective is to use them in the production of wood flooring.
7 Implications for practice
This type of treatment has the main objective of improving the quality of the final product, ie. wood flooring. Thermomechanical treatment can help reduce the instability of wood because it reduces the moisture content of the material and the absorption of liquids on the surface of the wood flooring, since it decreases significantly the wettability. Furthermore, the industry can control the colors of the wood flooring, making a more homogeneous product, with better mechanical properties.
Bibliography
ÅKERHOLM,Margaretha; SALMÉN.Lennart.Softening of Wood Polymers
Induced by Moisture Studied by Dynamic FTIR Spectroscopy.Journal of Applied Polymer Science 94, p. 2032-2040. 2004.
AMERICAN SOCIETY FOR TESTING MATERIALS. ASTM D143: Standard
Test Methods for Small Clear Specimens of Timber. Pennsylvania, EUA, 2009.
22
ARRUDA, Larissa M.; DEL MENEZZI, Cláudio H. S. Effect of
Thermomechanical Treatment on Physical Properties of Wood Veneers. International Wood Products Journal, Online First. 2013.
BEKHTA, Pavlo; NIEMZ, Peter; SEDLIACIK, Jan. Effect of Pre-Pressing of
Veneer on the Glueability and Properties of Veneer-Based Products. European Journal of Wood and Wood Products 70 (1-3), p. 99-106. 2012.
BOONSTRA, Michiel J.; TJEERDSMA, Bôke.Chemical Analysis of Heat
Treated Softwoods. European Journal of Wood and Wood Products 64 (3), p. 204-211. 2006.
CAMARGOS, José A.; GONÇALEZ, Joaquim C. A Colorimetria Aplicada como
Instrumento na Elaboração de uma Tabela de Cores de Madeira. BrasilFlorestal20 (71), p. 30-41. 2001.
CHARRIER, B.; CHARRIER, F.; JANIN, G.; KAMDEM, D. P.; IRMOULI, M.; GONÇALEZ, J. C. Study of Industrial Boiling Process on Walnut Colour:
Experimental Study under Industrial Conditions. EuropeanJournalof Wood and Wood Products 60 (4), p. 259-264. 2002.
DEL MENEZZI, Cláudio H. S. Estabilização Dimensional Por Meio do
Tratamento Térmico e Seus Efeitos Sobre as Propriedades de Painéis de
Partículas Orientadas (OSB). 2004. 226 f. Thesis (Doctoral at Forest Engineering) - Department of Agrarian Sciences, Federal University of Paraná, Curitiba, Brazil. 2004.
ESTEVES, Bruno; MARQUES, António V.; DOMNGOS, Idalina; PEREIRA, Helena. Heat-Induced Colour Changes of Pine (Pinuspinaster) and Eucalypt
(Eucalyptus globulus) Wood.Wood Science and Technology 42 (5), p. 369-384. 2008.
HUNTERLAB.CIEL*a*b* Color Scale. Applications Note 8 (7). 2008.
KOCAEFE, Duygu; PONCSAK, Sandor; DORÉ, Geneviève; YOUNSI, Ramdane.Effect of Heat Treatment on the Wettability of White Ash and Soft
Maple by Water.HolzalsRoh-und Werkstoff 66, p. 335-361. 2008.
KUTNAR,Andreja et al. Density Profile and Morphology of Viscoelastic Thermal
Compressed Wood.Wood Science and Technology 43 (1-2), p. 57-68. 2009.
LOPES, Juliana.Colorimetria da Madeira Termorretificada de Eucalyptusgrandis
Hill ex. Maiden. 2010. 28 f. Graduate (Degree in ForestryEngineering) -

23
InstituteofForestry, Rural Federal Universityof Rio de Janeiro, Seropédica, Rio de Janeiro. 2010.
MONGABAY.The Amazon: The World’s Largest Rainforest. Available on: http://rainforests.mongabay.com/amazon/. Accessed on: 20 dec. 2012.
ROWELL, Roger M.; YOUNGS, Robert L. Dimensional Stabilization of Wood in
Use.Forest Products Laboratory.Madison, WI, 8pp. 1981 (Gen. Tech. Rep. FPL-0243).
SUNDQVIST, B. Color Changes and Acid Formation in Wood During Heating. 2004. 154 f. Thesis (Doctoral) - Division of Wood Material Science, Lulea University of Technology, Skellefta, Sweden. 2004.
WEILAND, J. J.; GUYONNET, R. Study of Chemical Modifications and Fungi
Degradation of Thermally Modified Wood Using DRIFT
Spectroscopy.HolzalsRoh-und Werkstoff61 (3), p. 216-220. 2003.
WOLCOTT, Michael P. et al. Fundamentals of Flakeboard Manufacture:
Viscoelastic Behavior of the Wood Component. Wood and Fiber Science 22 (4), p. 345-361. 1990.


![MEASURING WOOD DENSITY FOR TROPICAL FOREST TREES …1].pdf · Measuring wood density for tropical forest trees field manual ... as well as its exact dbh. ... Measuring wood density](https://img.pdfslide.us/doc/110x75/5a8f0aea7f8b9a085a8d8bee/measuring-wood-density-for-tropical-forest-trees-1pdfmeasuring-wood-density.jpg)


![Thermomechanical Analysis [TMA] [NETZSCH]](https://img.pdfslide.us/doc/110x75/55cf940b550346f57b9f3bd8/thermomechanical-analysis-tma-netzsch.jpg)