Embed Size (px)
Citation preview

University of Illinois at Urbana-Champaign • Metals Processing Simulation Lab • Lance C. Hibbeler 1
Thermomechanical Behavior of the Solidifying Shell and Ideal Taper in a
Funnel Mold
CCC Annual Meeting
12 June 2007
Lance C. Hibbeler (MSME Candidate)
University of Illinois at Urbana-Champaign • Metals Processing Simulation Lab • Lance C. Hibbeler 2
Acknowledgements
• Continuous Casting Consortium Members (Nucor, Postech, LWB Refractories, Algoma, Corus, Labein, Mittal Riverdale, Baosteel, Steel Dynamics)
• Begoña Santillana, Arnoud Kamperman, and ArieHamoen (Corus RD&T, Corus Strip Products)
• Dr. Seid Koric• National Science Foundation
– DMI 05-28668
• National Center for Supercomputing Applications (NCSA) at UIUC
• Dassault Simulia, Inc. (ABAQUS parent company)

University of Illinois at Urbana-Champaign • Metals Processing Simulation Lab • Lance C. Hibbeler 3
Outline
• Problem identification
• Simulation overview
• Model parameters
• Analysis procedures
• Model validation
• Discussion of results
University of Illinois at Urbana-Champaign • Metals Processing Simulation Lab • Lance C. Hibbeler 4
Problem Identification
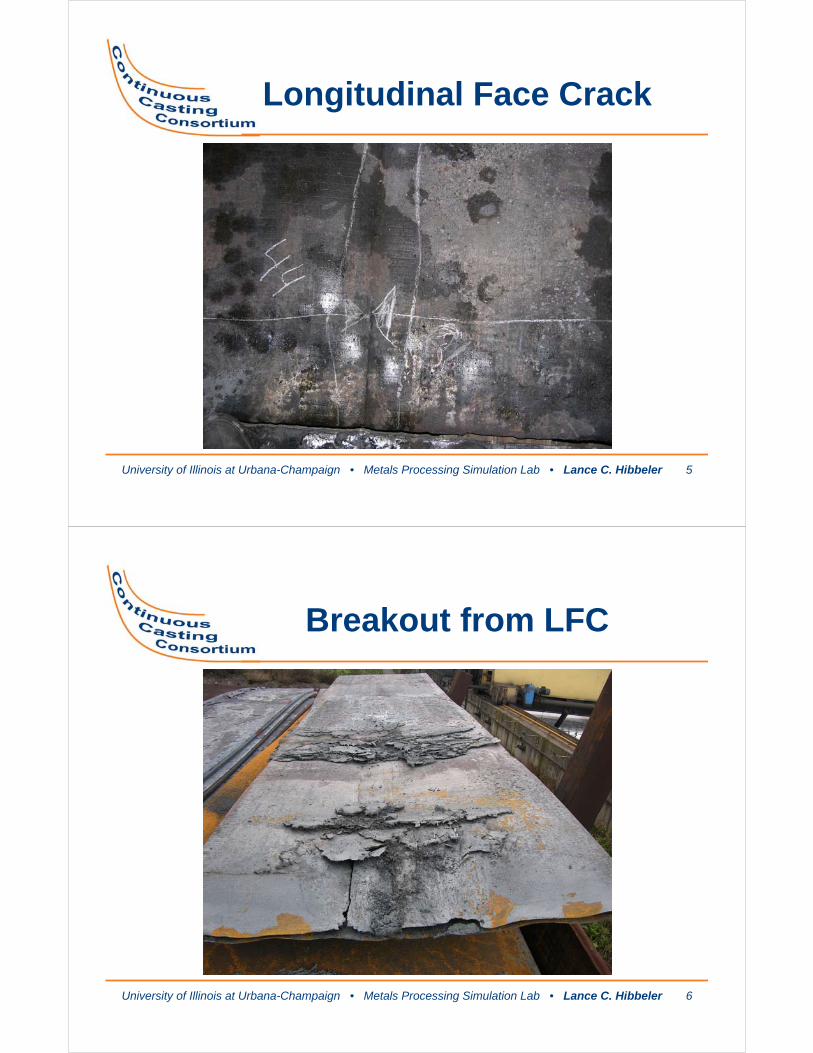
• Approximately 60% of breakouts on the Corus thin slab caster (IJmuiden, The Netherlands) over the past two years have been due to longitudinal face cracks – Mostly occurring in the transition region of the
funnel mold
University of Illinois at Urbana-Champaign • Metals Processing Simulation Lab • Lance C. Hibbeler 5
Longitudinal Face Crack
University of Illinois at Urbana-Champaign • Metals Processing Simulation Lab • Lance C. Hibbeler 6
Breakout from LFC
University of Illinois at Urbana-Champaign • Metals Processing Simulation Lab • Lance C. Hibbeler 7
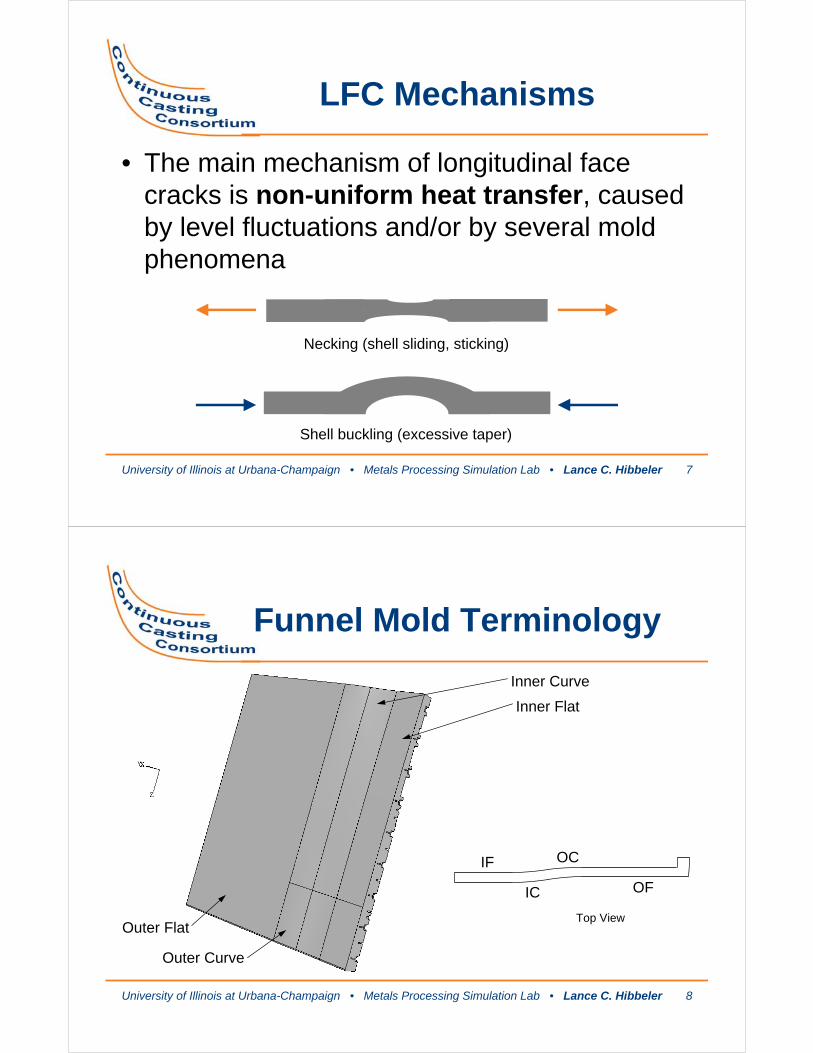
LFC Mechanisms
• The main mechanism of longitudinal face cracks is non-uniform heat transfer, caused by level fluctuations and/or by several mold phenomena
Shell buckling (excessive taper)
Necking (shell sliding, sticking)
University of Illinois at Urbana-Champaign • Metals Processing Simulation Lab • Lance C. Hibbeler 8
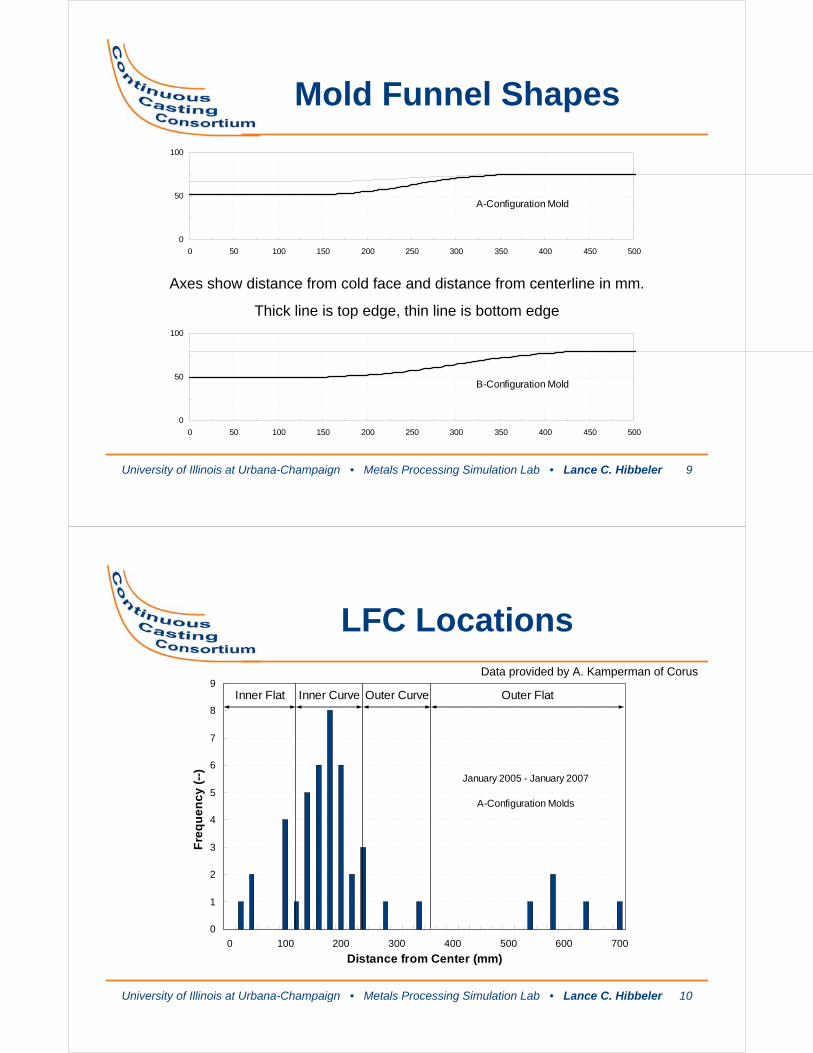
Funnel Mold Terminology
Inner Flat
Inner Curve
Outer Curve
Outer Flat
IF
IC
OC
OF
Top View
University of Illinois at Urbana-Champaign • Metals Processing Simulation Lab • Lance C. Hibbeler 9
Mold Funnel Shapes
0
50
100
0 50 100 150 200 250 300 350 400 450 500
A-Configuration Mold
0
50
100
0 50 100 150 200 250 300 350 400 450 500
B-Configuration Mold
Axes show distance from cold face and distance from centerline in mm.
Thick line is top edge, thin line is bottom edge
University of Illinois at Urbana-Champaign • Metals Processing Simulation Lab • Lance C. Hibbeler 10
LFC Locations
0
1
2
3
4
5
6
7
8
9
0 100 200 300 400 500 600 700
Distance from Center (mm)
Fre
qu
en
cy
(--
)
Inner Flat Inner Curve Outer Curve Outer Flat
January 2005 - January 2007
A-Configuration Molds
Data provided by A. Kamperman of Corus
University of Illinois at Urbana-Champaign • Metals Processing Simulation Lab • Lance C. Hibbeler 11
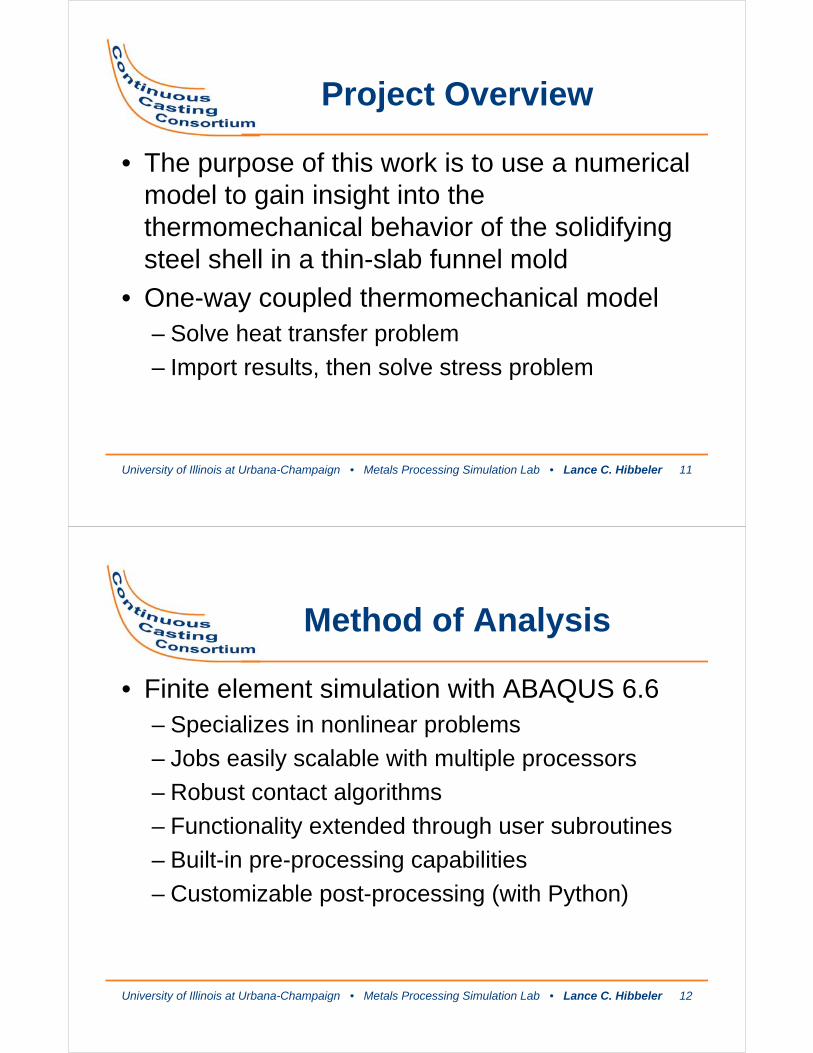
Project Overview
• The purpose of this work is to use a numerical model to gain insight into the thermomechanical behavior of the solidifying steel shell in a thin-slab funnel mold
• One-way coupled thermomechanical model– Solve heat transfer problem
– Import results, then solve stress problem
University of Illinois at Urbana-Champaign • Metals Processing Simulation Lab • Lance C. Hibbeler 12
Method of Analysis
• Finite element simulation with ABAQUS 6.6– Specializes in nonlinear problems
– Jobs easily scalable with multiple processors
– Robust contact algorithms
– Functionality extended through user subroutines
– Built-in pre-processing capabilities
– Customizable post-processing (with Python)

University of Illinois at Urbana-Champaign • Metals Processing Simulation Lab • Lance C. Hibbeler 13
Thermal Analysis
• Uses isotropic, temperature- and phase-dependent thermal properties– Thermal conductivity
– Specific heat capacity
• Constant density
• Analysis includes rate-of-change effects of temperature-dependent properties
22 2
2 2
T T k T T k Tk k k
x x x x x x T x
∂ ∂ ∂ ∂ ∂ ∂ ∂ ∂⎛ ⎞ ⎛ ⎞= + = +⎜ ⎟ ⎜ ⎟∂ ∂ ∂ ∂ ∂ ∂ ∂ ∂⎝ ⎠ ⎝ ⎠( )p
Tc k T
tρ ∂ = ∇⋅ ⋅∇
∂
University of Illinois at Urbana-Champaign • Metals Processing Simulation Lab • Lance C. Hibbeler 14
Thermal Analysis
• Using simple heat flux profile– Numerical stability
• Fixed mesh of standard four-node heat transfer elements– Currently ~14k elements and ~15k nodes
• Implemented via default ABAQUS heat transfer routines
• Requires ~5 hours (2 CPUs)
University of Illinois at Urbana-Champaign • Metals Processing Simulation Lab • Lance C. Hibbeler 15
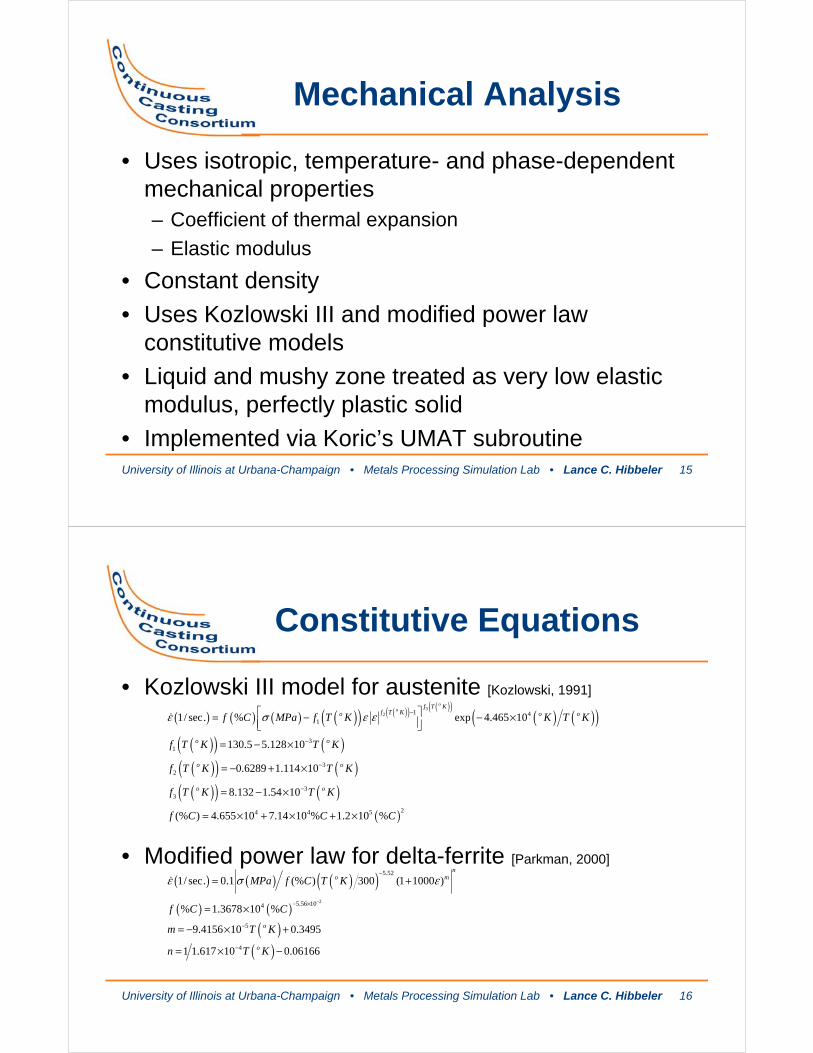
Mechanical Analysis
• Uses isotropic, temperature- and phase-dependent mechanical properties– Coefficient of thermal expansion
– Elastic modulus
• Constant density
• Uses Kozlowski III and modified power law constitutive models
• Liquid and mushy zone treated as very low elastic modulus, perfectly plastic solid
• Implemented via Koric’s UMAT subroutine
University of Illinois at Urbana-Champaign • Metals Processing Simulation Lab • Lance C. Hibbeler 16
• Kozlowski III model for austenite [Kozlowski, 1991]
• Modified power law for delta-ferrite [Parkman, 2000]
Constitutive Equations
( ) ( ) ( ) ( )( ) ( )( ) ( )( )( ) ( )( )
( )( ) ( )( )( ) ( )( )( ) ( )
( )
32 1 4
1
31
32
33
24 4 5
1/ sec. % exp 4.465 10
130.5 5.128 10
0.6289 1.114 10
8.132 1.54 10
(% ) 4.655 10 7.14 10 % 1.2 10 %
oo
f T Kf T Ko o o
o o
o o
o o
f C MPa f T K K T K
f T K T K
f T K T K
f T K T K
f C C C
ε σ ε ε −
−
−
−
⎡ ⎤= − − ×⎢ ⎥⎣ ⎦
= − ×
= − + ×
= − ×
= × + × + ×
( ) ( ) ( )( )( ) ( )
( )( )
2
5.52
5.56 104
5
4
1/ sec. 0.1 (% ) 300 (1 1000 )
% 1.3678 10 %
9.4156 10 0.3495
1 1.617 10 0.06166
no m
o
o
MPa f C T K
f C C
m T K
n T K
ε σ ε−
−
− ×
−
−
= +
= ×
= − × +
= × −

University of Illinois at Urbana-Champaign • Metals Processing Simulation Lab • Lance C. Hibbeler 17
Mechanical Contact
• Uses the ABAQUS surface-to-surface contact algorithm with a “softened” exponentialpressure-overclosure relationship– Mold is the master surface
– Steel shell is the slave surface (softer)
• Tangential friction factor* of µfrict = 0.16
• Uses a vector-based algorithm, so the curved surface of the funnel is easy to handle
* [Meng, Thomas, et. al., CMQ 45-1 p 79-94]
University of Illinois at Urbana-Champaign • Metals Processing Simulation Lab • Lance C. Hibbeler 18
Mechanical Analysis
• Uses the exact same mesh as the thermal analysis, using the hybrid formulation (more stable in the liquid region) of four-node generalized plane strain elements
• Requires ~35 hours (2 CPUs)
• Working to optimize UMAT subroutine, though it is already many times faster than using the ABAQUS-native creep algorithm
University of Illinois at Urbana-Champaign • Metals Processing Simulation Lab • Lance C. Hibbeler 19
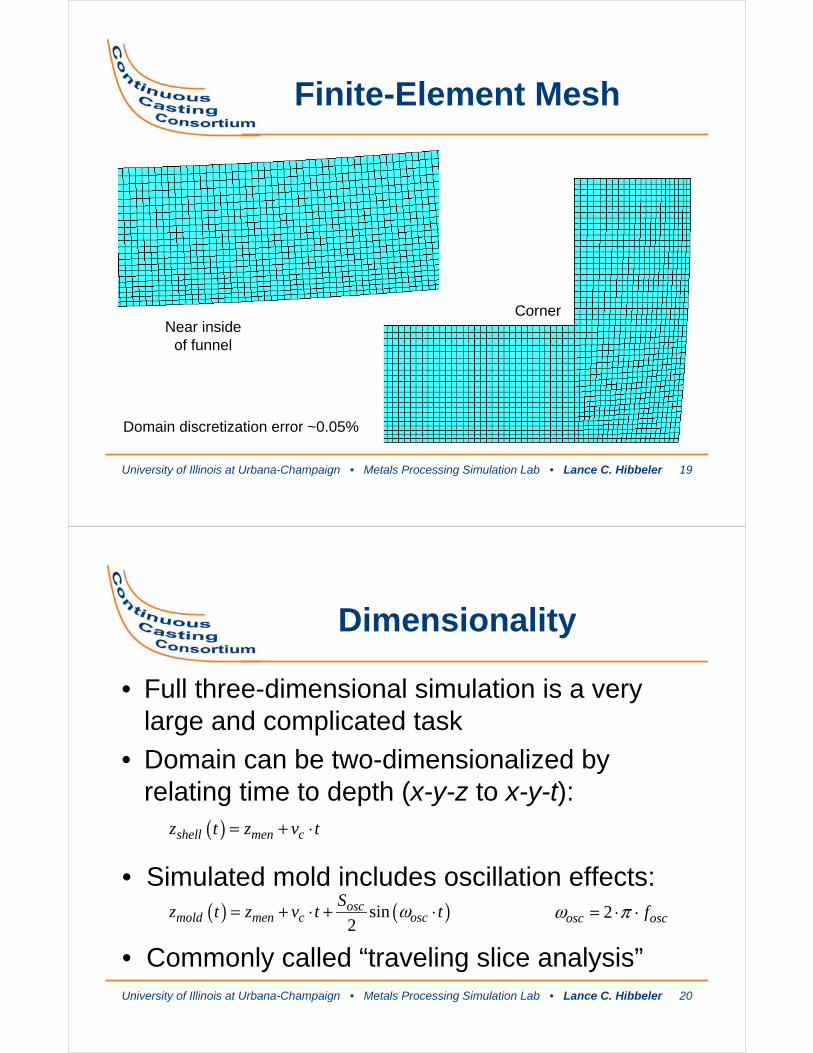
Finite-Element Mesh
CornerNear inside
of funnel
Domain discretization error ~0.05%
University of Illinois at Urbana-Champaign • Metals Processing Simulation Lab • Lance C. Hibbeler 20
Dimensionality
• Full three-dimensional simulation is a very large and complicated task
• Domain can be two-dimensionalized by relating time to depth (x-y-z to x-y-t):
( )shell men cz t z v t= + ⋅
( ) ( )sin2osc
mold men c oscS
z t z v t tω= + ⋅ + ⋅
• Commonly called “traveling slice analysis”
• Simulated mold includes oscillation effects:2osc oscfω π= ⋅ ⋅

University of Illinois at Urbana-Champaign • Metals Processing Simulation Lab • Lance C. Hibbeler 21
Traveling Slice – Half Speed
University of Illinois at Urbana-Champaign • Metals Processing Simulation Lab • Lance C. Hibbeler 22
Dimensionality
• Some losses in simplifying from 3-D to 2-D– Out-of-plane bending
– Not a problem – investigating longitudinal cracks
What actual steel wants to do What the simulated steel does
[Koric, 2006]
University of Illinois at Urbana-Champaign • Metals Processing Simulation Lab • Lance C. Hibbeler 23
Process Parameters
• Casting speed 5.5 m/min• Pour temperature 1545.0 ºC• Oscillation stroke 7.2 mm• Oscillation frequency 331 cycles/min• Strand width 1200 mm• Narrow face taper 1.0 %/m• Meniscus depth 104.2 mm• Time in mold 10.86 s
University of Illinois at Urbana-Champaign • Metals Processing Simulation Lab • Lance C. Hibbeler 24
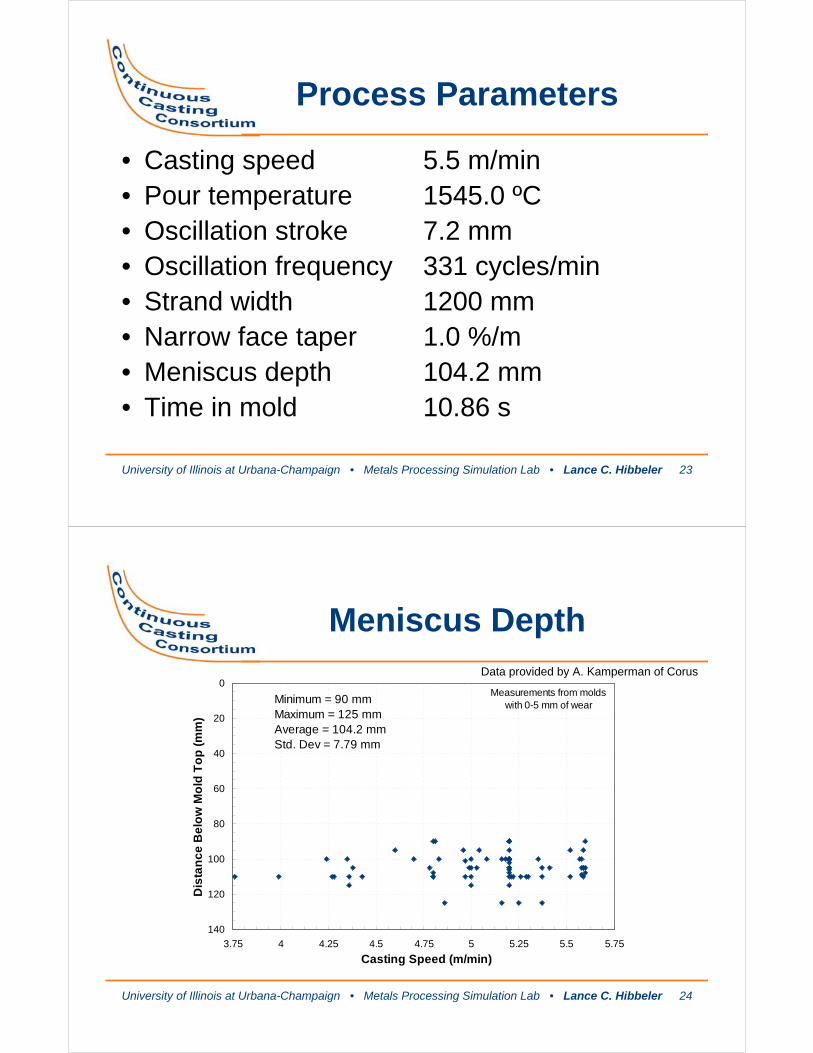
Meniscus Depth
0
20
40
60
80
100
120
140
3.75 4 4.25 4.5 4.75 5 5.25 5.5 5.75
Casting Speed (m/min)
Dis
tan
ce
Be
low
Mo
ld T
op
(m
m)
Minimum = 90 mmMaximum = 125 mmAverage = 104.2 mmStd. Dev = 7.79 mm
Measurements from molds with 0-5 mm of wear
Data provided by A. Kamperman of Corus

University of Illinois at Urbana-Champaign • Metals Processing Simulation Lab • Lance C. Hibbeler 25
Steel Properties
• Properties for Corus grade F12L from CON1D/CON2D models– Carbon content 0.045 %wt
– Solidus temperature 1507.51 ºC
– Liquidus temperature 1530.45 ºC
– Solidus/liquidus based on modified Clyne-Kurzsimple segregation model [Won and Thomas, 2001]
University of Illinois at Urbana-Champaign • Metals Processing Simulation Lab • Lance C. Hibbeler 26
Steel Properties
600
700
800
900
1000
1100
1200
1300
1400
1500
1600
0.0 0.1 0.2 0.3 0.4 0.5 0.6 0.7 0.8 0.9 1.0 1.1 1.2
Percent Weight Carbon
Tem
per
atu
re (
ºC)
0.0
0.1
0.2
0.3
0.4
0.5
0.6
0.7
0.8
0.9
1.0
600 700 800 900 1000 1100 1200 1300 1400 1500 1600
Temperature (ºC)
Ph
ase
Fra
ctio
n (
--)
fa fd
fg fl
[Won and Thomas, MTB, 2001]

University of Illinois at Urbana-Champaign • Metals Processing Simulation Lab • Lance C. Hibbeler 27
Steel Properties
0
200
400
600
800
1000
1200
1400
1600
600 700 800 900 1000 1100 1200 1300 1400 1500 1600
Temperature (ºC)
Sp
ecif
ic H
eat
(J/k
g·K
)
28
30
32
34
36
38
40
42
600 700 800 900 1000 1100 1200 1300 1400 1500 1600
Temperature (ºC)
Th
erm
al C
on
du
ctiv
ity
(W/m
·K)
in liquid259.35
Lf = 247 kJ/kg
[Harste, 1989] [Harste, 1989]
University of Illinois at Urbana-Champaign • Metals Processing Simulation Lab • Lance C. Hibbeler 28
Steel Properties
0
4
8
12
16
20
24
28
600 700 800 900 1000 1100 1200 1300 1400 1500 1600
Temperature (ºC)
Co
effi
cien
t o
f T
her
mal
Exp
ansi
on
(10
-6/º
C)
Tref = 20 ºC
0
25
50
75
100
125
150
600 700 800 900 1000 1100 1200 1300 1400 1500 1600
Temperature (ºC)
Ela
stic
Mo
du
lus
(GP
a)
[Harste, 1989], [Harste and Jablonka, 1988], [Jimbo and Cramb, 1993]
[Mizukami, 1977]

University of Illinois at Urbana-Champaign • Metals Processing Simulation Lab • Lance C. Hibbeler 29
Boundary Conditions
• Two-fold symmetry• Heat flux imposed on the shell surface
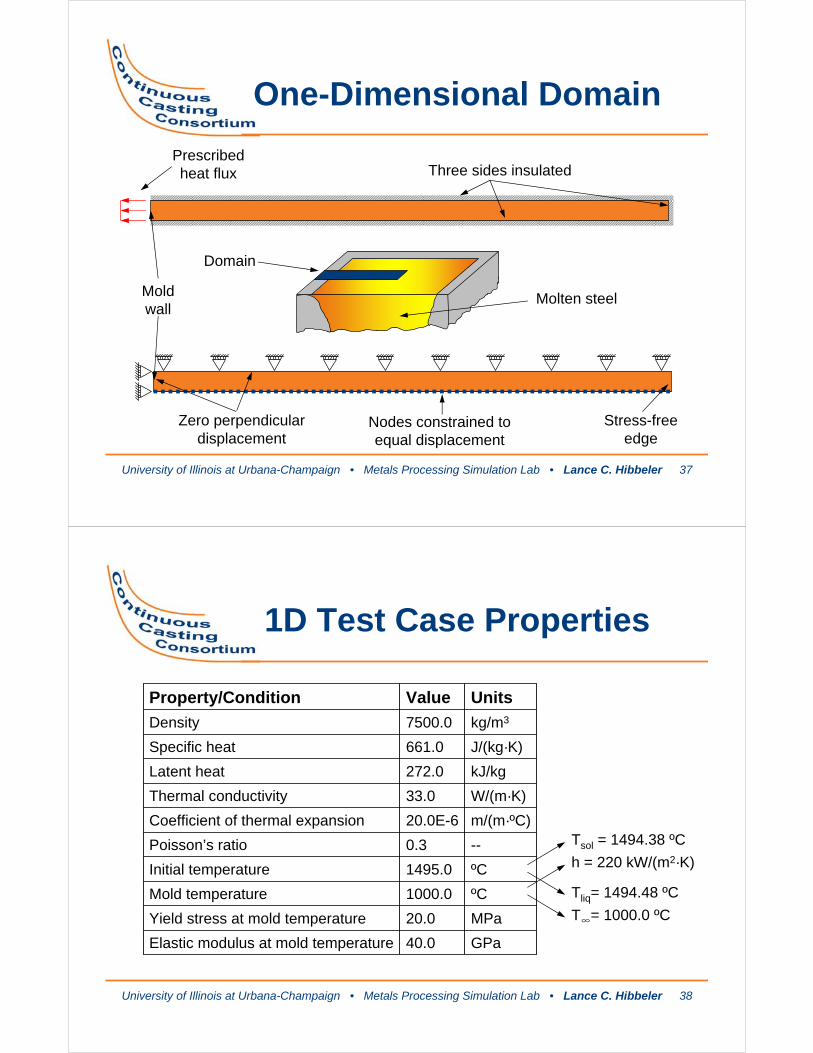
• Ferrostatic pressure applied on the shell surface, pulling the shell towards the mold
• Mold hot face converted to a time-dependent displacement function imposed on the two-dimensional domain
• All other faces stress free and/or insulated
University of Illinois at Urbana-Champaign • Metals Processing Simulation Lab • Lance C. Hibbeler 30
Two-Fold Symmetry
x-symmetry plane y-symmetry plane
x
y

University of Illinois at Urbana-Champaign • Metals Processing Simulation Lab • Lance C. Hibbeler 31
0
1
2
3
4
5
6
7
8
9
0 100 200 300 400 500 600 700 800 900 1000
Distance Below Meniscus (mm)
He
at
Flu
x (
MW
/m2 )
0.0 1.1 2.2 3.3 4.4 5.5 6.6 7.7 8.8 9.9 11.0
Time in Simulation (s)
Q = 6.5*(t(s)+1.0)-0.5
Qavg = 2.72 MW/m2
Heat Flux Profile
University of Illinois at Urbana-Champaign • Metals Processing Simulation Lab • Lance C. Hibbeler 32
2.00
2.25
2.50
2.75
3.00
3.25
3.50
3.50 3.75 4.00 4.25 4.50 4.75 5.00 5.25 5.50 5.75 6.00
Distance Below Meniscus (mm)
He
at
Flu
x (
MW
/m2 )
New Plates Old Plates
CON1D New Plates CON1D Old Plates
Log. (New Plates) Log. (Old Plates)
Heat Flux Measurements
Simple Profile
2.72 MW/m2
[Santillana, et. al., AISTech 2007]
University of Illinois at Urbana-Champaign • Metals Processing Simulation Lab • Lance C. Hibbeler 33
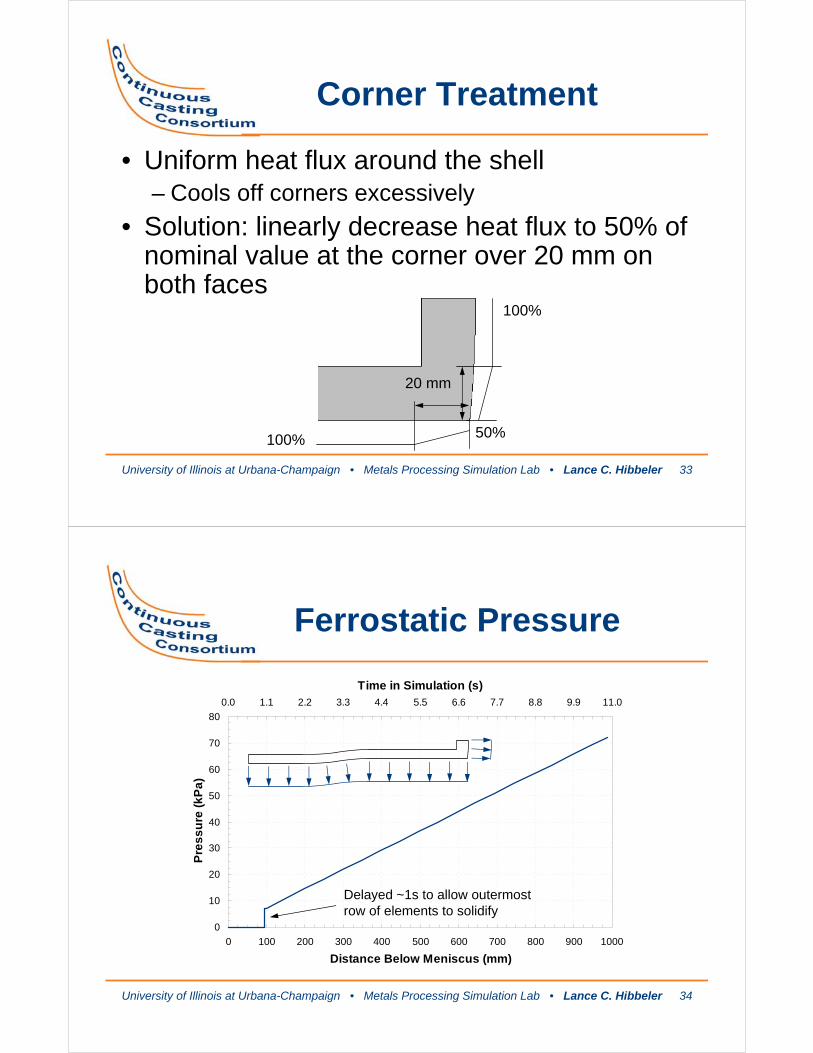
Corner Treatment
• Uniform heat flux around the shell– Cools off corners excessively
• Solution: linearly decrease heat flux to 50% of nominal value at the corner over 20 mm on both faces
100%
100% 50%
20 mm
University of Illinois at Urbana-Champaign • Metals Processing Simulation Lab • Lance C. Hibbeler 34
0
10
20
30
40
50
60
70
80
0 100 200 300 400 500 600 700 800 900 1000
Distance Below Meniscus (mm)
Pre
ss
ure
(k
Pa
)
0.0 1.1 2.2 3.3 4.4 5.5 6.6 7.7 8.8 9.9 11.0
Time in Simulation (s)
Ferrostatic Pressure
Delayed ~1s to allow outermost row of elements to solidify

University of Illinois at Urbana-Champaign • Metals Processing Simulation Lab • Lance C. Hibbeler 35
0
2
4
6
8
10
12
14
0 100 200 300 400 500 600 700 800 900 1000
Distance Below Meniscus (mm)
Dis
pla
ce
me
nt
(mm
)
0.0 1.1 2.2 3.3 4.4 5.5 6.6 7.7 8.8 9.9 11.0
Time in Simulation (s)
Wide Face
Narrow Face
A-Configuration Molds
Mold Hot Face Displacement
University of Illinois at Urbana-Champaign • Metals Processing Simulation Lab • Lance C. Hibbeler 36
Model Validation
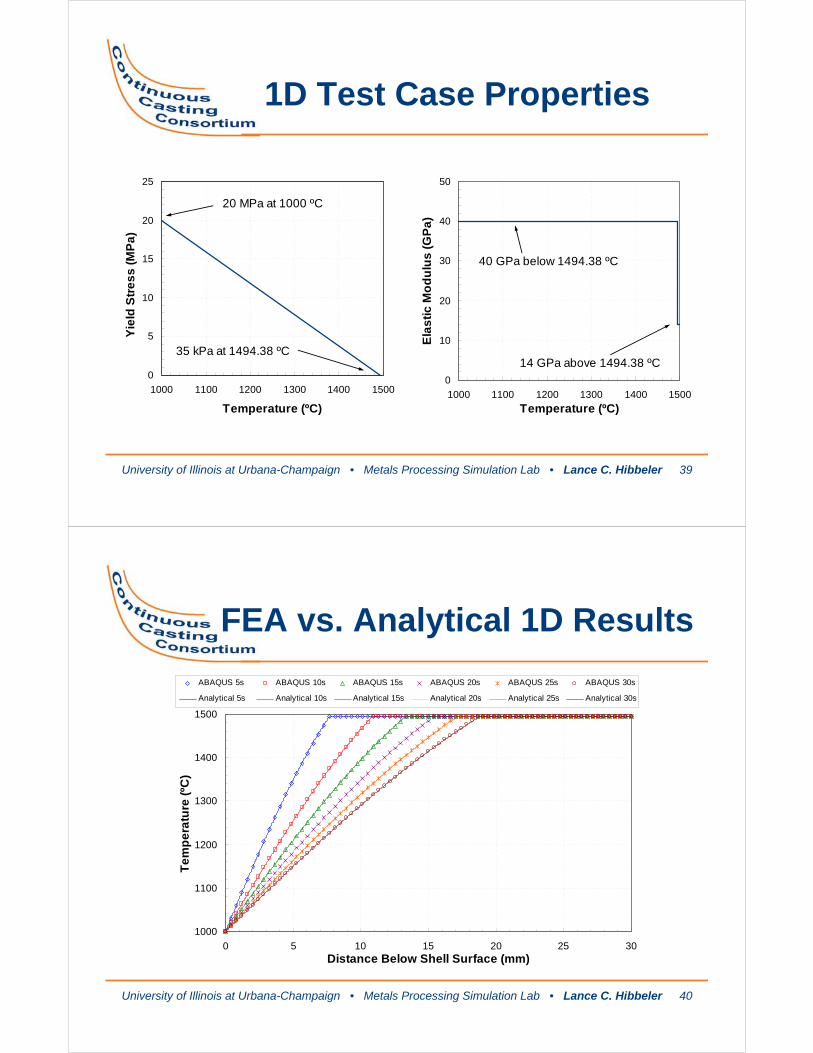
• Compare numerical model to known analytical solution to verify process– Elastoplastic stress model [Boley and Weiner, 1963]
• One-dimensional domain, not including a mold, constrained against bending
• Pure material poured with no superheat into an isothermal mold– Yield stress linearly decreases with temperature
to zero at melting point
University of Illinois at Urbana-Champaign • Metals Processing Simulation Lab • Lance C. Hibbeler 37
One-Dimensional Domain
Prescribed heat flux Three sides insulated
Zero perpendicular displacement
Stress-free edge
Nodes constrained to equal displacement
Domain
Molten steelMold wall
University of Illinois at Urbana-Champaign • Metals Processing Simulation Lab • Lance C. Hibbeler 38
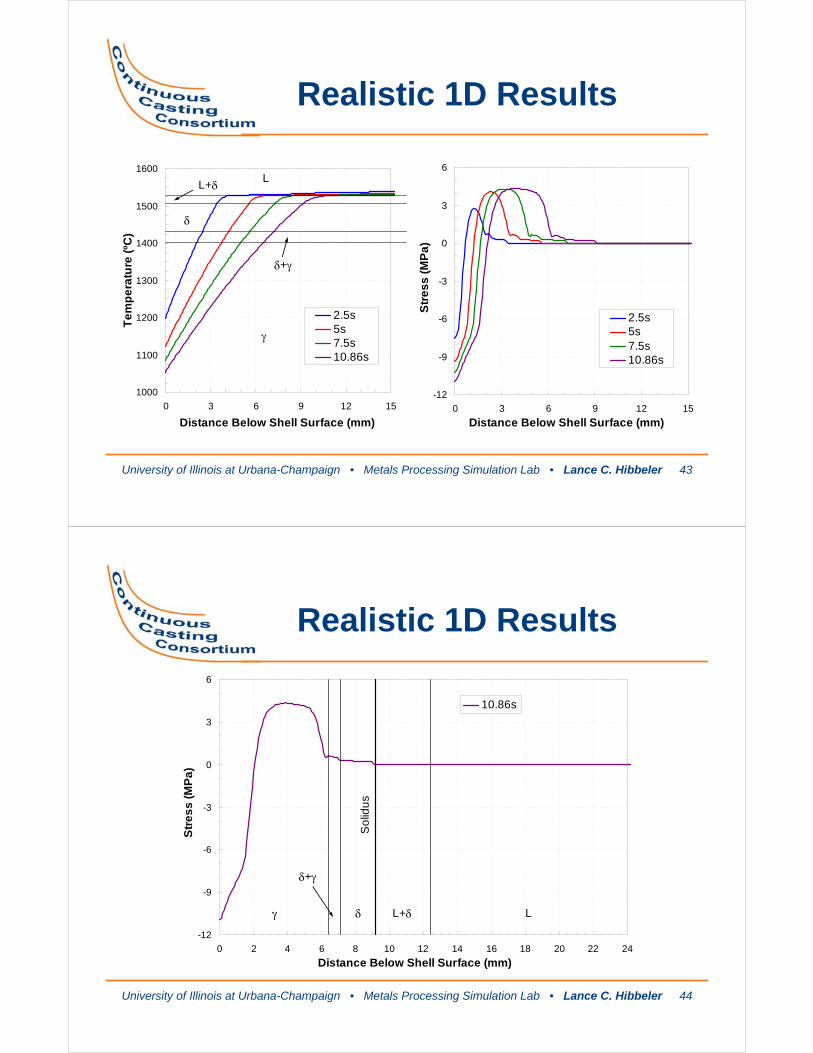
1D Test Case Properties
MPa20.0Yield stress at mold temperature
ºC1495.0Initial temperature
ºC1000.0Mold temperature
GPa40.0Elastic modulus at mold temperature
UnitsValueProperty/Condition
kg/m37500.0Density
--0.3Poisson’s ratio
m/(m·ºC)20.0E-6Coefficient of thermal expansion
W/(m·K)33.0Thermal conductivity
kJ/kg272.0Latent heat
J/(kg·K)661.0Specific heat
Tsol = 1494.38 ºC
Tliq= 1494.48 ºC
h = 220 kW/(m2·K)
T∞= 1000.0 ºC
University of Illinois at Urbana-Champaign • Metals Processing Simulation Lab • Lance C. Hibbeler 39
1D Test Case Properties
0
10
20
30
40
50
1000 1100 1200 1300 1400 1500
Temperature (ºC)
Ela
sti
c M
od
ulu
s (
GP
a)
14 GPa above 1494.38 ºC
40 GPa below 1494.38 ºC
0
5
10
15
20
25
1000 1100 1200 1300 1400 1500
Temperature (ºC)
Yie
ld S
tre
ss
(M
Pa
)
20 MPa at 1000 ºC
35 kPa at 1494.38 ºC
University of Illinois at Urbana-Champaign • Metals Processing Simulation Lab • Lance C. Hibbeler 40
FEA vs. Analytical 1D Results
1000
1100
1200
1300
1400
1500
0 5 10 15 20 25 30Distance Below Shell Surface (mm)
Te
mp
era
ture
(ºC
)
ABAQUS 5s ABAQUS 10s ABAQUS 15s ABAQUS 20s ABAQUS 25s ABAQUS 30s
Analytical 5s Analytical 10s Analytical 15s Analytical 20s Analytical 25s Analytical 30s

University of Illinois at Urbana-Champaign • Metals Processing Simulation Lab • Lance C. Hibbeler 41
FEA vs. Analytical 1D Results
-20
-15
-10
-5
0
5
10
15
0 5 10 15 20 25 30Distance Below Shell Surface (mm)
Str
es
s (
MP
a)
ABAQUS 5s ABAQUS 10s ABAQUS 15s ABAQUS 20s ABAQUS 25s ABAQUS 30s
Analytical 5s Analytical 10s Analytical 15s Analytical 20s Analytical 25s Analytical 30s
University of Illinois at Urbana-Champaign • Metals Processing Simulation Lab • Lance C. Hibbeler 42
Realistic 1D Analysis
• Allow temperature-dependent properties and time-varying boundary conditions for a more realistic simulation, using a finer mesh than what could be used practically (at this point in time) in two dimensions– 300 x 1 row of elements over 30 x 0.1 mm domain
– Typical results away from funnel features
• Very fine mesh provides the ability to determine if an effect is a numerical error
University of Illinois at Urbana-Champaign • Metals Processing Simulation Lab • Lance C. Hibbeler 43
Realistic 1D Results
1000
1100
1200
1300
1400
1500
1600
0 3 6 9 12 15
Distance Below Shell Surface (mm)
Te
mp
era
ture
(ºC
)
2.5s5s7.5s10.86s
γ
δ+γ
LL+δ
δ
-12
-9
-6
-3
0
3
6
0 3 6 9 12 15
Distance Below Shell Surface (mm)S
tre
ss
(M
Pa
)
2.5s5s7.5s10.86s
University of Illinois at Urbana-Champaign • Metals Processing Simulation Lab • Lance C. Hibbeler 44
Realistic 1D Results
-12
-9
-6
-3
0
3
6
0 2 4 6 8 10 12 14 16 18 20 22 24
Distance Below Shell Surface (mm)
Str
es
s (
MP
a)
10.86s
LL+δγ
δ+γ
δ
So
lidu
s
University of Illinois at Urbana-Champaign • Metals Processing Simulation Lab • Lance C. Hibbeler 45
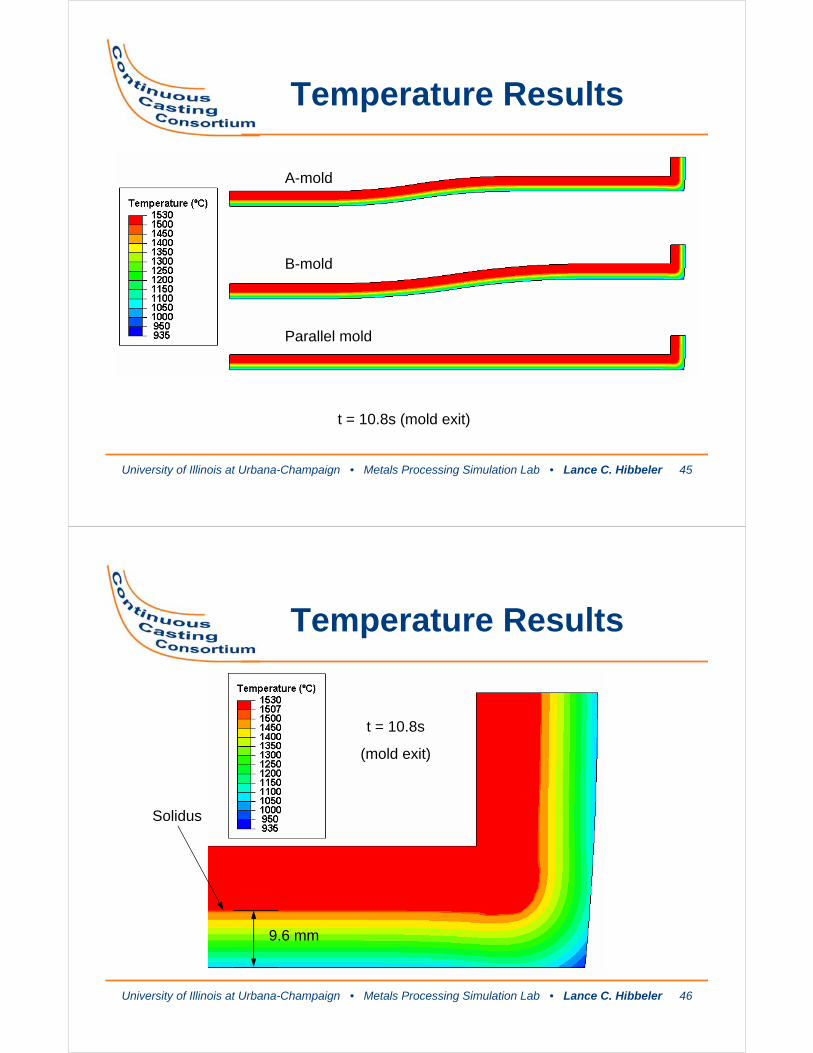
Temperature Results
t = 10.8s (mold exit)
A-mold
B-mold
Parallel mold
University of Illinois at Urbana-Champaign • Metals Processing Simulation Lab • Lance C. Hibbeler 46
Temperature Results
t = 10.8s
(mold exit)
Solidus
9.6 mm

University of Illinois at Urbana-Champaign • Metals Processing Simulation Lab • Lance C. Hibbeler 47
Temperature Results
t = 10.8s (mold exit)
A-mold
Slight two-dimensional heat transfer in funnel transition region
University of Illinois at Urbana-Champaign • Metals Processing Simulation Lab • Lance C. Hibbeler 48
1000
1050
1100
1150
1200
1250
1300
0 50 100 150 200 250 300 350 400 450 500 550 600 650Distance from Center of Funnel (mm)
Te
mp
era
ture
(ºC
)
A-mold, 5s
Inner Flat Outer Curve Outer FlatInner Curve
Surface Temperature
Slight two-dimensional effects

University of Illinois at Urbana-Champaign • Metals Processing Simulation Lab • Lance C. Hibbeler 49
Comparison of Temperature Variations Across Each Funnel
0.0
0.5
1.0
1.5
2.0
2.5
3.0
3.5
0 100 200 300 400 500 600 700 800 900 1000
Distance Below Meniscus (mm)
Ma
x A
bs
olu
te D
ev
iati
on
fro
m P
ara
llel
Mo
ld S
he
ll S
urf
ac
e T
em
pe
ratu
re (
ºC)
0 1.1 2.2 3.3 4.4 5.5 6.6 7.7 8.8 9.9 11
Time in Mold (s)
A-mold B-mold
Wiggles are numerical effect
Effect grows with time, despite decreasing heat flux and increasing funnel radius
University of Illinois at Urbana-Champaign • Metals Processing Simulation Lab • Lance C. Hibbeler 50
Funnel Stress Development
Tension
Compression
Compression
Tension
From Bending/Unbending
University of Illinois at Urbana-Champaign • Metals Processing Simulation Lab • Lance C. Hibbeler 51
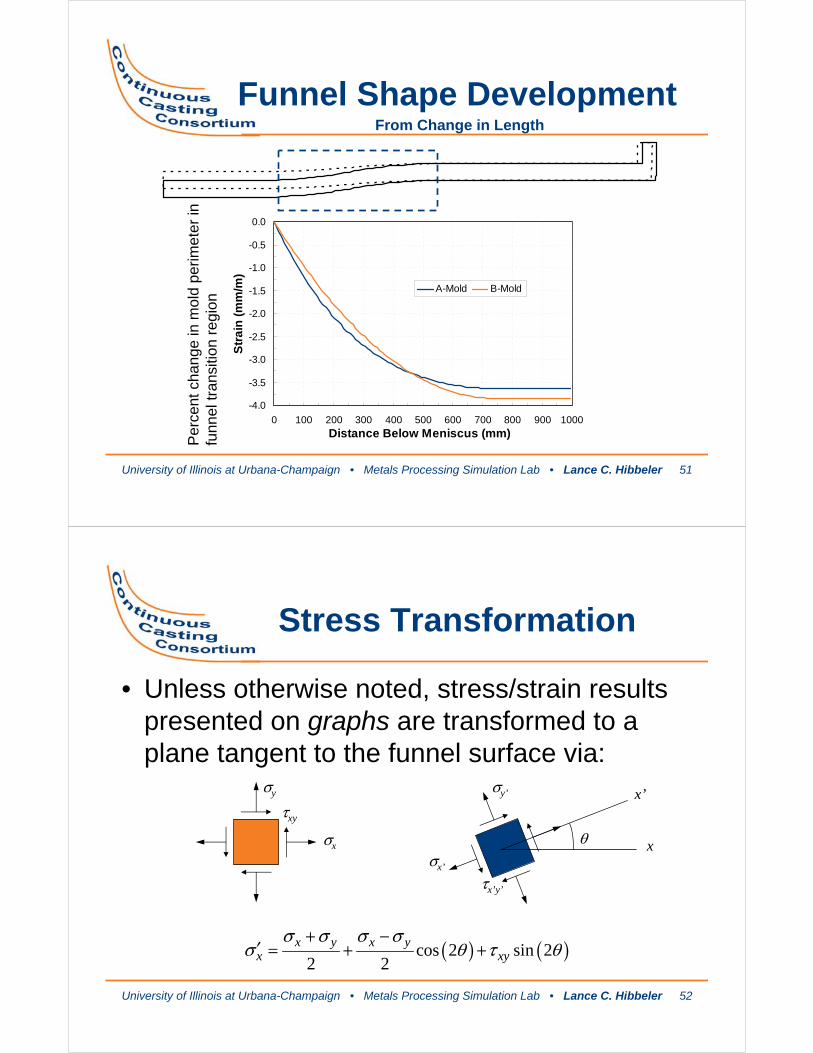
Funnel Shape DevelopmentFrom Change in Length
-4.0
-3.5
-3.0
-2.5
-2.0
-1.5
-1.0
-0.5
0.0
0 100 200 300 400 500 600 700 800 900 1000
Distance Below Meniscus (mm)
Str
ain
(m
m/m
)
A-Mold B-Mold
Per
cent
cha
nge
in m
old
perim
eter
in
funn
el tr
ansi
tion
regi
on
University of Illinois at Urbana-Champaign • Metals Processing Simulation Lab • Lance C. Hibbeler 52
Stress Transformation
• Unless otherwise noted, stress/strain results presented on graphs are transformed to a plane tangent to the funnel surface via:
( ) ( )cos 2 sin 22 2
x y x yx xy
σ σ σ σσ θ τ θ
+ −′ = + +
σx
σy
τxy
σx’
σy’
τx’y’
x’
xθ

University of Illinois at Urbana-Champaign • Metals Processing Simulation Lab • Lance C. Hibbeler 53
WF Surface Stress Profiles
6.00
-4.0
-3.0
-2.0
-1.0
0.0
1.0
2.0
3.0
0 50 100 150 200 250 300 350 400 450 500 550 600 650
Distance from Centerline (mm)
Ta
ng
en
tia
l Str
es
s (
MP
a)
A-mold B-mold
Time = s
University of Illinois at Urbana-Champaign • Metals Processing Simulation Lab • Lance C. Hibbeler 54
WF Strain/Displacement
10.85
-5.0
-4.5
-4.0
-3.5
-3.0
-2.5
-2.0
-1.5
-1.0
-0.5
0.0
0 50 100 150 200 250 300 350 400 450 500 550 600 650
Distance from Centerline (mm)
x-D
isp
lac
em
en
t (m
m)
-20
-18
-16
-14
-12
-10
-8
-6
-4
-2
0
Ta
ng
en
tia
l Str
ain
(m
m/m
)
A-Mold, ux B-Mold, ux
A-Mold, e B-Mold, e
Time = s

University of Illinois at Urbana-Champaign • Metals Processing Simulation Lab • Lance C. Hibbeler 55
Conclusions
• Larger funnel radii provides more uniform heat transfer in the funnel region
• The present antisymmetric funnel design concentrates strains in the funnel region
• Narrow face taper is equal in importance to funnel shape
University of Illinois at Urbana-Champaign • Metals Processing Simulation Lab • Lance C. Hibbeler 56
Upcoming Work
• Apply a more realistic, experimentally validated heat flux profile from CON1D [Santillana, Thomas, Hamoen, Hibbeler, Kamperman, van der Knoop, AISTech 2007]
• Include the thermally distorted mold shape
• Fully coupled thermo-mechanical model
• Study of mechanical effect of oscillations