Embed Size (px)
Citation preview

Polymer Bulletin 37, 229-235 (1996) Polymer Bulletin �9 Springer-Verlag 1996
Thermogravimetric analysis of starch-based biodegradable blends Daniel Vega, Mareelo A. Villar, Marcelo D. Failla, Enrique M. Vall6s *
Planta Piloto de Ingenieria Quimica, 12 de Octubre 1842, 8000 Bahia Blanca, Argentina
Received: 27 February 1996/Revised version: 30 April 1996/Accepted: 1 May 1996
Summary Thermogravimetric analysis (TGA) has been shown to be a useful technique to determine the content of starch and other components that are usually present in blends of starch with synthetic polymers. However, some of these blends are composed of elements with an important superposition in their temperature degradation range. In these cases interpretation of the TGA results becomes quite difficult and usually important errors are committed in the determination of blend composition. We present here a method to improve the accuracy of the interpretation of TGA data. The analysis was developed to study blends containing starch, an ethylene-vinyl alcohol copolymer, and water plus glycerin as plasticizers. Using this procedure it is possible to predict blend composition with an error less than 3 %, even when there is an appreciable superposition between the temperature degradation range of starch and poly(ethylene-co-vinyl alcohol). As the proposed method of analysis is quite general it may be extended to be used with other types of blends that give thermograms with similar characteristics to those described in this paper.
Introduction The development of biodegradable materials has been an important area of research in the last years because of the increasing awareness about environment pollution. Biodegradable polymers are of fi,mdamental importance in those applications where recycling is not appropriate such as trash and composting bags, mulch films, disposable diapers, etc. The use of starch as a biodegradable additive involves an important number of starch- based blend formulations. For several reasons it is usually important to know with certain confidence the amount of the different components in those blends. The present paper proposes a fitting model to analyze TGA data from biodegradable blends containing starch, poly(ethylene-co-vinyl alcohol) (EVOH), glycerin and water. These blends are composed by elements with an important superposition in its temperature degradation range. This complicates considerably the interpretation of the TGA results oriented to the determination of the mass composition of the blends. The procedure proposed in this work allows the use of thermogravimetric analysis as a fast and reliable characterization technique.
Experimental
Materials The blends used in this work were prepared at Novon (Wamer-Lambert, Morris Plains NJ)
* Corresponding author
230
with a 34 mm co-rotating Leistritz twin screw extruder. Dry feed, consisted of starch powder, EVOH pellets, and glycerides which were previously dry blended. Glycerin and water were pumped through a liquid port. After extrusion, the blends were cut into pellets and cooled by air flow on a spiral conveyor (1-2). Native corn (Melojel), possessing approximately 70 % amylopectin and 30 % amy!ose, and EVOH with 44 mole % ethylene (EVAL El05) were the two main components of the blend. EVOH was blended in varying proportions with the starch. Glycerin plasticizer was added in the amount of approximately 15 % of the total weight of the blends. Water was also added during compounding. Finally, naturally occurring emulsifiers, such as glycerides, lipids and fatty acids, were added in small amounts (<1%). After compounding, pellets were conditioned at room temperature (23 ~ and at 65 % relative humidity for at least one week. The water content of the conditioned pellets was then measured by Karl Fisher titration (2).
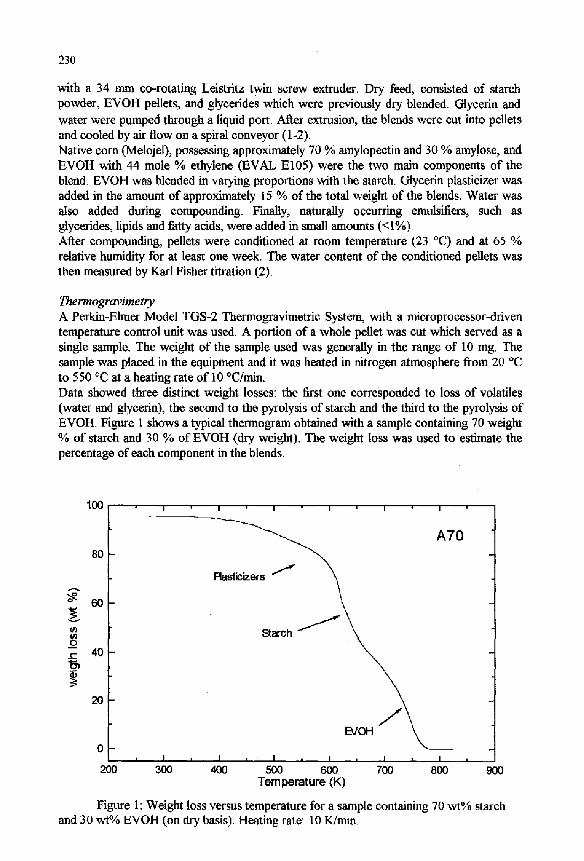
Thermogravimetry A Perkin-Elmer Model TGS-2 Thermogravimetric System, with a microprocessor-driven temperature control unit was used. A portion of a whole pellet was cut which served as a single sample. The weight of the sample used was generally in the range of 10 mg. The sample was placed in the equipment and it was heated in nitrogen atmosphere from 20 ~ to 550 ~ at a heating rate of 10 ~ Data showed three distinct weight losses: the first one corresponded to loss of volatiles (water and glycerin), the second to the pyrolysis of starch and the third to the pyrolysis of EVOH. Figure 1 shows a typical thermogram obtained with a sample containing 70 weight % of starch and 30 % of EVOH (dry weight), The weight loss was used to estimate the percentage of each component in the blends.
c~
0
100
80
60
40
20
0 i I i
200 300 900
I I I I I
A 7 0
Rasticizers /
L:VOH
I = I , I , I = I
400 500 600 700 800 Temperature (K)
Figure 1: Weight loss versus temperature for a sample containing 70 wt% starch and 30 wt% EVOH (on dry basis). Heating rate: 10 K/min.
231
Thermogravimetric data can be used without further analysis for estimating the composition of blends when they contain components for which the temperature range of thermal degradation is not overlapped. Starch-polyethylene blends are a good example of components with well separated temperature ranges of degradation. In this case it is quite simple to obtain the blend composition from the partial weight losses corresponding to starch and polyethylene (3). When substantial overlapping of the weight losses of the different components occurs, a more detailed analysis of the thermograms is required. In these cases the derivative of the weight loss curve (Figure 1) can be used to determine the contribution of each component to the total weight loss (4). However, derivative analysis requires also an integration in order to obtain the amount of each element present in the blends. Such integration usually introduces considerable errors due to uncertainties in the determination of the initial and final temperature of degradation for each element. In the present paper we present a simple model for the fitting of experimental TGA data. The model allows the use of thermogravimetric analysis as a characterization technique even for blends whose elements present an important superposition in the temperature range of thermal degradation. In order to show the principles we applied it first to a single component and then extended it to a multicomponent blend such as the case of water, glycerin, starch and EVOH.
Theory
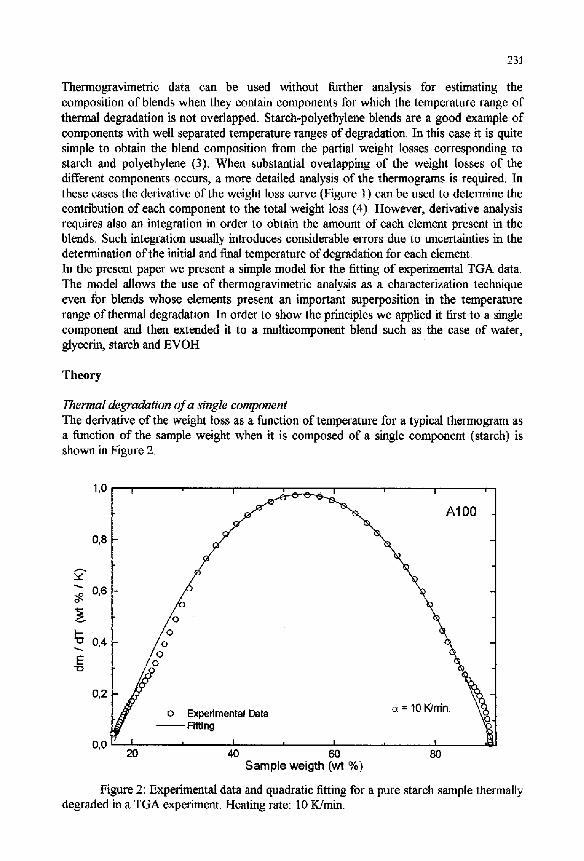
Thermal degradation of a single component The derivative of the weight loss as a function of temperature for a typical thermogram as a function of the sample weight when it is composed of a single component (starch) is shown in Figure 2.
1,0 I ' I ' I ~ I
0
0,8
x.,
0,6
I--- -a 0,4
E
0,2 0 Experimental Data c~ = 10 Wrdn.
- - Fitting
O , O I I I t I I I
20 40 60 80 Sample weigth (wt %)
Figure 2: Experimental data and quadratic fitting for a pure starch sample thermally degraded in a TGA experiment. Heating rate: 10 K/rain.
232
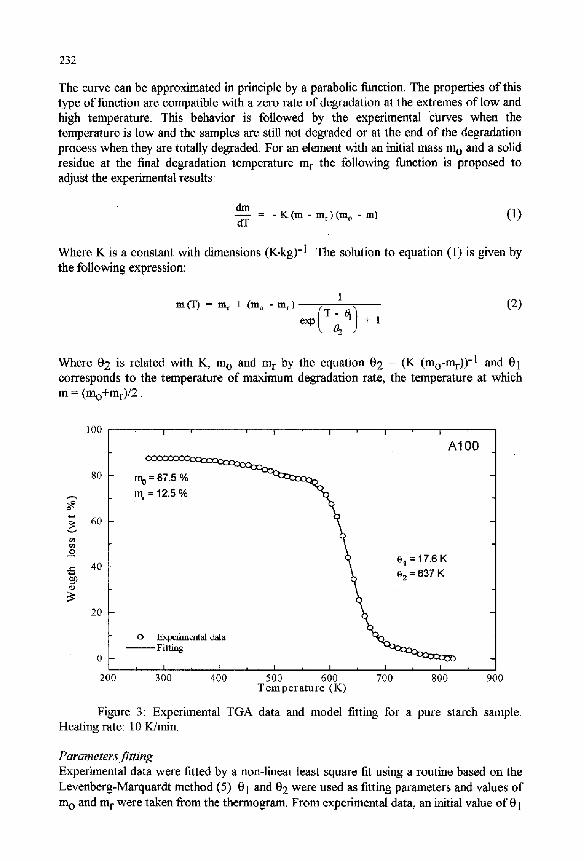
The curve can be approximated in principle by a parabolic function. The properties of this type of function are compatible with a zero rate of degradation at the extremes of low and high temperature. This behavior is followed by the experimental curves when the temperature is low and the samples are still not degraded or at the end of the degradation process when they are totally degraded. For an element with an initial mass m o and a solid residue at the final degradation temperature m r the following function is proposed to adjust the experimental results:
dm - - K ( m - mr) (m o - m ) ( 1 )
dT
Where K is a constant with dimensions (K.kg) "1 . The solution to equation (1) is given by the following expression:
1
m(T) = mr + ( m o - m r ) e x p ( T _ ~ l + l (2)
Where 0 2 is related with K, m o and m r by the equation 0 2 = (K (mo-mr)) -1 and 01 corresponds to the temperature of maximum degradation rate, the temperature at which m = (mo+mr)/2.
100 I I I I I I
A I O 0
80 m0 - ~7~ ~ ~ mr = 12.5 %
; 6O \ ~ 0~ = 17.6 K
4O
o Experimental data ~ _ 0 Fitting
, I , I , I , I , I , I ,
200 300 400 500 600 700 800 900 Temperature (K)
Figure 3: Experimental TGA data and model fitting for a pure starch sample. Heating rate: 10 K/min.
Parameters fitting Experimental data were fitted by a non-linear least square fit using a routine based on the Levenberg-Marquardt method (5). 01 and 02 were used as fitting parameters and values of m o and m r were taken from the thermogram. From experimental data, an initial value of 01
233
was obtained as the value of temperature at maximum weight loss. The initial value of 0 2 can be obtained from an estimation of K using the following expression:
x - 4 aa_~ (3) (m o_mr)2 C/TIT=01
Figure 3 shows experimental data corresponding to a pure starch sample and the non- linear least square fit using equation (2). As can be seen, equation (2) gives a very good fit of experimental values.
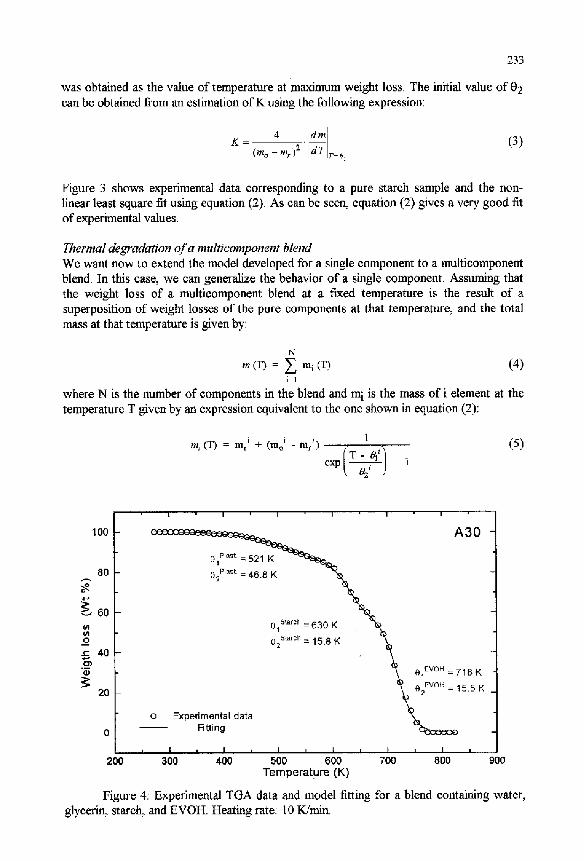
Thermal degradation of a multicomponent blend We want now to extend the model developed for a single component to a multieomponent blend. In this case, we can generalize the behavior of a single component. Assuming that the weight loss of a multicomponent blend at a fixed temperature is the result of a superposition of weight losses of the pure components at that temperature, and the total mass at that temperature is given by:
N m (T) = Z mi (T) (4)
i=l
where N is the number of components in the blend and m i is the mass of i element at the temperature T given by an expression equivalent to the one shown in equation (2):
�9 �9 �9 1
m i(T) = m r ' + (m o' - mr ' ) T - 81 i
e x p ( T / + 1
(5)
I I I I I I
loo ~ A30
80 e~ r'jast = 46.8 K ' ~ ~ ~ 2 . . . .
~ 6o 1 starch = 6 3 0
O 02 Starch = 15.8 K " ~ ~ 4 0 \ "~ ~ 01EVOH = 7 1 8 K
2 0 "~ e2EvOH = 15.5 K
Experimental data " ~ 0 Fitting
I , I , I i I , I , I i
200 300 400 500 600 700 800 900 Temperature (K)
Figure 4: Experimental TGA data and model fitting for a blend containing water, glycerin, starch, and EVOH. Heating rate: 10 K/min.
234
Results and discussion A fitting using the proposed model for a blend containing 19.5 % of plastieizers (glycerin and water), 24.3 % of starch and 56.2 % of EVOH on weight basis is shown in Figure 4. The
Elemen t s Sample lJ A 100
Measured (2) Plasticizers (wt %)
First derivative Fitting model 22 11 23.1
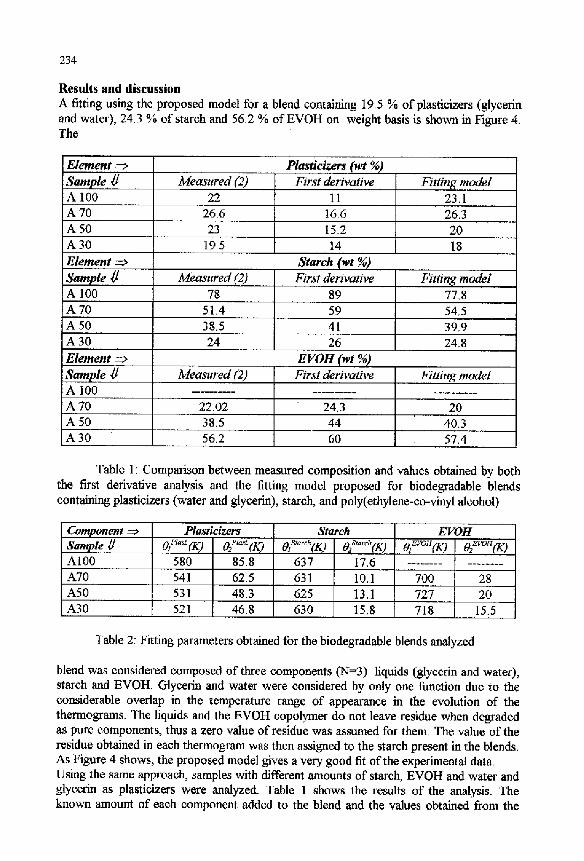
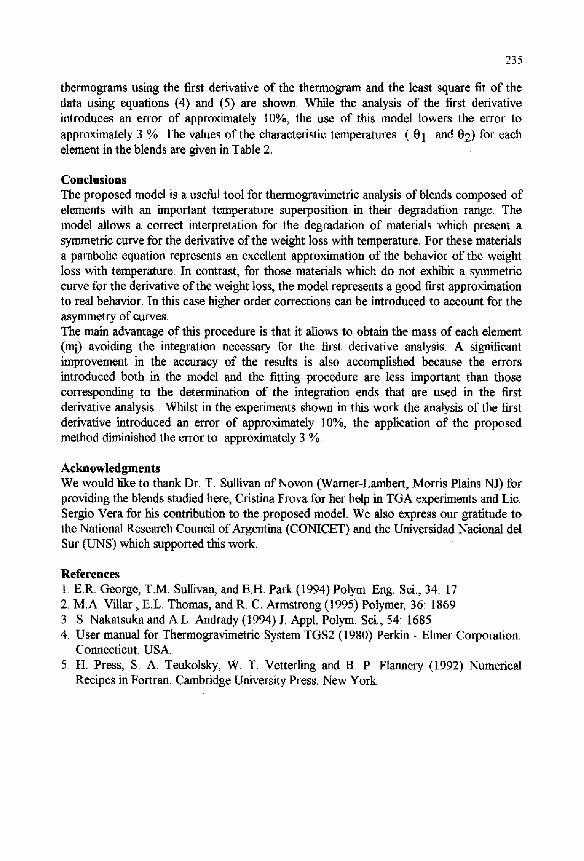
A70 26.6 16.6 26.3 A 50 23 15.2 20 A 30 19.5 14 18 Elemen t s Starch(wt%) Sample ~ Measured(2) Fimtde~va~ve Fit~ngmodel A 100 78 89 77.8 A70 51.4 59 54.5 A50 38.5 41 39.9 A 30 24 26 24.8 Element ~ EVOH (wt %) Sample ~ Measured (2) First derivative Fit~ng model A 100 . . . . . . . . . . . . . . . . . . . . . . . . . . . . . . . . . . A70 22.02 24.3 20 A50 38.5 44 40.3 A30 56.2 60 57.4
Table 1: Comparison between measured composition and values obtained by both the first derivative analysis and the fitting model proposed for biodegradable blends containing plasticizers (water and glycerin), starch, and poly(ethylene-co-vinyl alcohol)
Component Sample ~l A100 A70 A50 A30
Plasticizers Starch EVOH
580 85.8 541 62.5 531 48.3 521 46.8
~Starch(K ) 02~ar~(K) 637 17.6 631 10.1 625 13.1 630 15.8
0l~~ 0 7 ~
700 28 727 20 718 15.5
Table 2: FiRing parameters obtained for the biodegradable blends analyzed
blend was considered composed of three components (N=3): liquids (glycerin and water), starch and EVOH. Glycerin and water were considered by only one function due to the considerable overlap in the temperature range of appearance in the evolution of the thermograms. The liquids and the EVOH copolymer do not leave residue when degraded as pure components, thus a zero value of residue was assumed for them. The value of the residue obtained in each thermogram was then assigned to the starch present in the blends. As Figure 4 shows, the proposed model gives a very good fit of the experimental data. Using the same approach, samples with different amounts of starch, EVOH and water and glycerin as plasticizers were analyzed. Table 1 shows the results of the analysis. The known amount of each component added to the blend and the values obtained from the
235
thermograms using the first derivative of the thermogram and the least square fit of the data using equations (4) and (5) are shown. While the analysis of the first derivative introduces an error of approximately 10%, the use of this model lowers the error to approximately 3 %. The values of the characteristic temperatures ( 01 and 02) for each element in the blends are given in Table 2,
Conclusions The proposed model is a useful tool for thermogravimetric analysis of blends composed of elements with an important temperature superposition in their degradation range. The model allows a correct interpretation for the degradation of materials which present a symmetric curve for the derivative of the weight loss with temperature. For these materials a parabolic equation represents an excellent approximation of the behavior of the weight loss with temperature. In contrast, for those materials which do not exhibit a symmetric curve for the derivative of the weight loss, the model represents a good first approximation to real behavior. In this case higher order corrections can be introduced to account for the asymmetry of curves. The main advantage of this procedure is that it allows to obtain the mass of each element (mi) avoiding the integration necessary for the first derivative analysis. A significant improvement in the accuracy of the results is also accomplished because the errors introduced both in the model and the fitting procedure are less important than those corresponding to the determination of the integration ends that are used in the first derivative analysis. Whilst in the experiments shown in this work the analysis of the first derivative introduced an error of approximately 10%, the application of the proposed method diminished the error to approximately 3 %.
Acknowledgments We would like to thank Dr. T. Sullivan of Novon (Warner-Lambert, Morris Plains NJ) for providing the blends studied here, Cristina Frova for her help in TGA experiments and Lie. Sergio Vera for his contribution to the proposed model. We also express our gratitude to the National Research Council of Argentina (CONICET) and the Universidad Nacional del Sur (UNS) which supported this work.
References 1. ER. George, T.M. Sullivan, and E.H. Park (1994) Polym Eng. Sci., 34:17 2. M.A. Villar, E.L. Thomas, and R. C. Armstrong (1995) Polymer, 36:1869 3. S. Nakatsuka and A.L. Andrady (1994)J. Appl. Polym Sci., 54:1685 4. User manual for Thermogravimetric System TGS2 (1980) Perkin - Elmer Corporation.
Connecticut. USA. 5. H. Press, S. A. Teukolsky, W. T. Vetterling and B. P. Flannery (1992) Numerical
Recipes in Fortran. Cambridge University Press. New York