Embed Size (px)
Citation preview

PAPER www.rsc.org/softmatter | Soft Matter
Thermodynamics of flip-flop and desorption for a systematic series ofphosphatidylcholine lipids†
Nicolas Sapay,‡ W. F. Drew Bennett‡ and D. Peter Tieleman*
Received 4th February 2009, Accepted 6th April 2009
First published as an Advance Article on the web 21st May 2009
DOI: 10.1039/b902376c
We have investigated the thermodynamics of phospholipid flip-flop and desorption. Using a series of
PC (phosphatidylcholine) lipids with different lengths of acyl tails, and number of unsaturated tails, we
calculated potentials of mean force (PMFs) in atomistic molecular dynamics simulations. The PMFs
describe the free energy for moving a single lipid molecule from water to the center of the respective
lipid bilayer. The free energy to move the lipid from equilibrium to the bilayer center is assumed to be
the free energy barrier for lipid flip-flop. We find that the free energy barrier for flip-flop is strongly
dependent on the structure of the bilayer; ranging from 16 kJ mol�1 in the thin DLPC bilayer, to 90 kJ
mol�1 in the DOPC bilayer. There are large deformations in the bilayers’ structure, to accommodate the
charged PC head group in the bilayer interior. We observe pore formation in all the bilayers, except for
POPC and DOPC. The free energy for desorption is equal to the excess chemical potential of the lipid in
the bilayer compared to bulk water. The increased chemical potential for PC lipids with longer acyl tails
is in qualitative agreement with the critical micelle concentrations. We also determined PMFs for
transferring water into the center of the series of lipid bilayers. Water has the same free energy of
transfer to the center of all the bilayers, indicating the lipid PMFs differ due to bilayer deformations.
Lipid bilayers are soft and deformable, allowing large structural changes, which are dependent on the
composition of the bilayer. Our results show that similar PC lipids with only slightly different acyl tails,
can have dramatically different thermodynamic behavior.
Introduction
Cellular membranes are heterogeneous in composition and
structure. For example, endoplasmic reticulum (ER) membranes
have a symmetric distribution of lipids between the two leaflets of
the bilayer, while eukaryotic plasma membranes have an asym-
metric distribution of lipids, with phosphatidylserine (PS) and
phosphatidylethanolamine (PE) enriched on the intracellular
leaflet, and phosphatidylcholine (PC) and sphingomyelin (SM)
enriched on the extracellular leaflet.1 Most phospholipids are
synthesized on the cytoplasmic leaflet of the ER,1 so flip-flop is
required to allow uniform growth of the membrane and for lipids
destined for the extracellular leaflet of the plasma membrane.
Due to the slow rate of passive flip-flop for PC lipids across
model bilayer systems,2–4 it is generally accepted that the process
is protein mediated. For a review of current lipid translocators
see ref. 5. Exposure of PS to the outside of the cell has been
implicated in blood coagulation and apoptosis.5 Specific ami-
nophospholipid flippases have been identified as P4-ATPases5
for the eukaryotic plasma membrane, suggesting passive flip-flop
is a natural process cells must fight against to maintain asym-
metric lipid distributions. No dedicated ER lipid translocator has
been clearly identified in spite of several attempts.6 It has been
University of Calgary, department of biological sciences, 2500 Universitydrive, Calgary AB, T2N 1N4. E-mail: [email protected]
† This paper is part of a Soft Matter themed issue on MembraneBiophysics. Guest editor: Thomas Heimburg.
‡ Nicolas Sapay and W. F. Drew Bennett have equally contributed to themanuscript
This journal is ª The Royal Society of Chemistry 2009
shown that the rate of phospholipid flip-flop can be enhanced by
the presence of model peptides7 and a-helical integral membrane
proteins,8 in an energy independent fashion. It has been postu-
lated that the ER membrane has the intrinsic ability to equili-
brate lipids between leaflets due to the presence of non-specific,
energy independent lipid translocating proteins and the lack of
cholesterol.9 Overall, lipid translocation still remains poorly
understood.
Recent evidence has shown that placing a charged molecule
in the interior of a lipid bilayer causes structural deformations,
which allow water and lipid head groups to enter the hydro-
phobic interior, to prevent the desolvation of the charged
particle.10–13 The formation of water defects (water present only
in one of the bilayer leaflets) and pores (water channel
across the entire bilayer) in lipid bilayers has fundamental
biological importance. Antimicrobial peptides, as well as
cationic penetrating peptides have been shown to induce pore
formation.14,15 Experimentally it was shown that magainin 2
increases the rate of lipid flip-flop, which was correlated to
membrane permeabilization.16 Computer simulations have been
used to calculate the free energy of pore formation.17 By
applying an electrical potential across the bilayer, pores have
been shown to occur.18 Similarly, by creating a chemical
potential difference across a lipid bilayer, pore formation was
observed.19 The rate of DPPC flip-flop was estimated by
calculating the potential of mean force (PMF), and was shown
to occur by a pore-mediated mechanism.10 Computer simula-
tions have provided a unique and relatively consistent view of
membrane pore formation.
Soft Matter, 2009, 5, 3295–3302 | 3295
We seek a molecular level thermodynamic description for PC
lipid flip-flop and desorption. Using molecular dynamics we
calculate the free energy for transferring single di12:0-PC
(DLPC), di14:0-PC (DMPC), di16:0-PC (DPPC), 16:0, 18:1-PC
(POPC), and di18:1-PC (DOPC) lipids from water to the center
of model bilayers composed of the respective lipid. We have
investigated a series of saturated PC lipids with different lengths
of acyl tail, as well as the effect of unsaturated lipid tails. We
determine the free energy barrier for PC lipid flip-flop and pore
formation from the free energy to move the lipid from equilib-
rium to the center of the bilayer. Our calculations also provide
the free energy required for lipid desorption, which is the excess
chemical potential of the phospholipid.
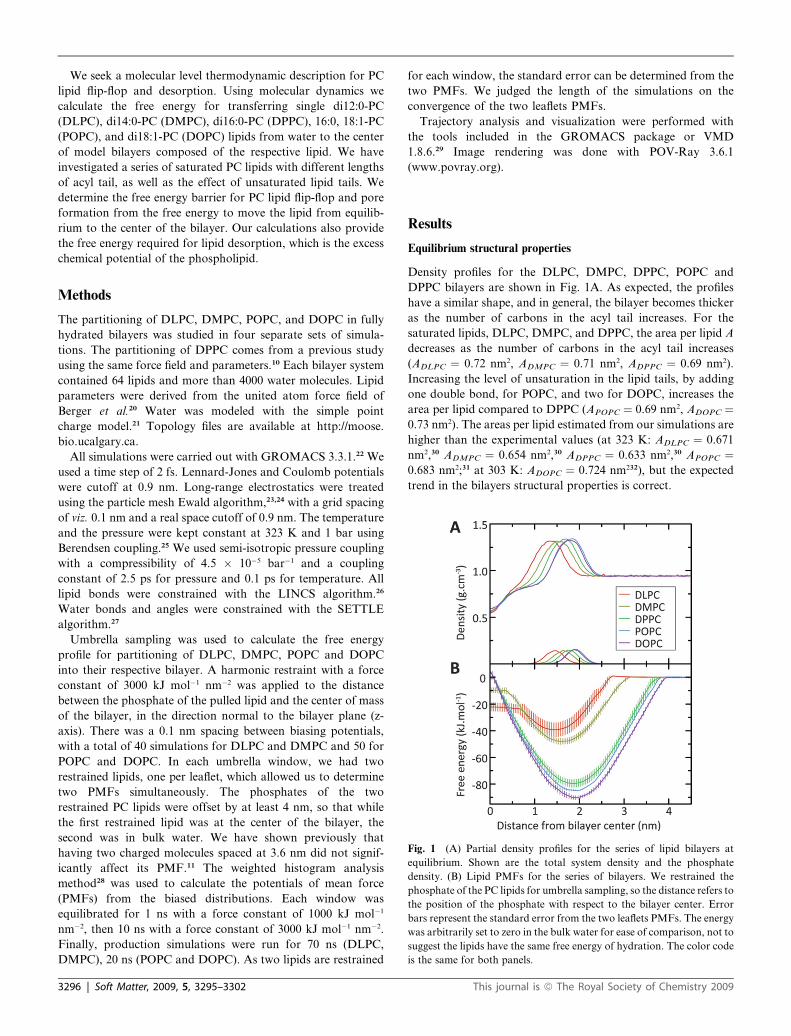
Fig. 1 (A) Partial density profiles for the series of lipid bilayers at
equilibrium. Shown are the total system density and the phosphate
density. (B) Lipid PMFs for the series of bilayers. We restrained the
phosphate of the PC lipids for umbrella sampling, so the distance refers to
the position of the phosphate with respect to the bilayer center. Error
bars represent the standard error from the two leaflets PMFs. The energy
was arbitrarily set to zero in the bulk water for ease of comparison, not to
suggest the lipids have the same free energy of hydration. The color code
is the same for both panels.
Methods
The partitioning of DLPC, DMPC, POPC, and DOPC in fully
hydrated bilayers was studied in four separate sets of simula-
tions. The partitioning of DPPC comes from a previous study
using the same force field and parameters.10 Each bilayer system
contained 64 lipids and more than 4000 water molecules. Lipid
parameters were derived from the united atom force field of
Berger et al.20 Water was modeled with the simple point
charge model.21 Topology files are available at http://moose.
bio.ucalgary.ca.
All simulations were carried out with GROMACS 3.3.1.22 We
used a time step of 2 fs. Lennard-Jones and Coulomb potentials
were cutoff at 0.9 nm. Long-range electrostatics were treated
using the particle mesh Ewald algorithm,23,24 with a grid spacing
of viz. 0.1 nm and a real space cutoff of 0.9 nm. The temperature
and the pressure were kept constant at 323 K and 1 bar using
Berendsen coupling.25 We used semi-isotropic pressure coupling
with a compressibility of 4.5 � 10�5 bar�1 and a coupling
constant of 2.5 ps for pressure and 0.1 ps for temperature. All
lipid bonds were constrained with the LINCS algorithm.26
Water bonds and angles were constrained with the SETTLE
algorithm.27
Umbrella sampling was used to calculate the free energy
profile for partitioning of DLPC, DMPC, POPC and DOPC
into their respective bilayer. A harmonic restraint with a force
constant of 3000 kJ mol�1 nm�2 was applied to the distance
between the phosphate of the pulled lipid and the center of mass
of the bilayer, in the direction normal to the bilayer plane (z-
axis). There was a 0.1 nm spacing between biasing potentials,
with a total of 40 simulations for DLPC and DMPC and 50 for
POPC and DOPC. In each umbrella window, we had two
restrained lipids, one per leaflet, which allowed us to determine
two PMFs simultaneously. The phosphates of the two
restrained PC lipids were offset by at least 4 nm, so that while
the first restrained lipid was at the center of the bilayer, the
second was in bulk water. We have shown previously that
having two charged molecules spaced at 3.6 nm did not signif-
icantly affect its PMF.11 The weighted histogram analysis
method28 was used to calculate the potentials of mean force
(PMFs) from the biased distributions. Each window was
equilibrated for 1 ns with a force constant of 1000 kJ mol�1
nm�2, then 10 ns with a force constant of 3000 kJ mol�1 nm�2.
Finally, production simulations were run for 70 ns (DLPC,
DMPC), 20 ns (POPC and DOPC). As two lipids are restrained
3296 | Soft Matter, 2009, 5, 3295–3302
for each window, the standard error can be determined from the
two PMFs. We judged the length of the simulations on the
convergence of the two leaflets PMFs.
Trajectory analysis and visualization were performed with
the tools included in the GROMACS package or VMD
1.8.6.29 Image rendering was done with POV-Ray 3.6.1
(www.povray.org).
Results
Equilibrium structural properties
Density profiles for the DLPC, DMPC, DPPC, POPC and
DPPC bilayers are shown in Fig. 1A. As expected, the profiles
have a similar shape, and in general, the bilayer becomes thicker
as the number of carbons in the acyl tail increases. For the
saturated lipids, DLPC, DMPC, and DPPC, the area per lipid A
decreases as the number of carbons in the acyl tail increases
(ADLPC ¼ 0.72 nm2, ADMPC ¼ 0.71 nm2, ADPPC ¼ 0.69 nm2).
Increasing the level of unsaturation in the lipid tails, by adding
one double bond, for POPC, and two for DOPC, increases the
area per lipid compared to DPPC (APOPC ¼ 0.69 nm2, ADOPC ¼0.73 nm2). The areas per lipid estimated from our simulations are
higher than the experimental values (at 323 K: ADLPC ¼ 0.671
nm2,30 ADMPC ¼ 0.654 nm2,30 ADPPC ¼ 0.633 nm2,30 APOPC ¼0.683 nm2;31 at 303 K: ADOPC ¼ 0.724 nm232), but the expected
trend in the bilayers structural properties is correct.
This journal is ª The Royal Society of Chemistry 2009

Lipid PMFs
Fig. 1B shows PMFs for transferring a DLPC, DMPC, DPPC,
POPC, and DOPC molecule from water to the center of the
respective bilayer. The PMFs describe the free energy required
for deviations of individual lipids from their equilibrium position
along the normal to the plane of the bilayer. The trough in the
PMF is the equilibrium position of the PC lipid in the bilayer. As
the bilayer gets thicker, the trough of the PMF moves farther
from the bilayer center and corresponds to the position of the
partial density of the phosphate at equilibrium (Fig. 1A). There is
a steep slope in free energy as the phosphate moves toward the
bilayer center, due to the bulky zwitterionic head group of the PC
lipid interacting with the hydrophobic interior of the bilayer. A
similar steep slope is observed when the lipid moves into bulk
water, as expected from the low solubility of phospholipids in
water. A plateau appears when the lipid stops interacting with
the bilayer, and therefore is the free energy of the lipid diffusing
in bulk water.
Fig. 2 Water pores or defects formed when the PC lipid is restrained at
the center of each bilayer. (A) Snapshots of the systems. Water is in light
blue, the restrained lipid is in green, the other lipids are in grey, the
nitrogen atoms are in dark blue and the phosphorus atoms are in orange.
(B) Two-dimensional water density map of each system (in atom nm�3).
(C) Two-dimensional phosphate density map of each system (in atom
nm�3). The pulled lipids, nitrogen and phosphorus atoms are represented
to scale as a white line in both density maps.
Lipid flip-flop
We assume the free energy at the center of the bilayer is the
primary free energy barrier for flip-flop. In general, the free
energy barrier for flip-flop increases as the bilayer becomes
thicker: DGflop for DLPC, DMPC, DPPC, POPC, and DOPC
are equal to 16, 40, 80, 89, and 94 kJ mol�1.
Transferring the PC head group into the hydrophobic interior
of the bilayer causes water defect and pore formation; water and
other PC head groups move into the bilayer core to keep the lipid
solvated. Fig. 2A shows snapshots of the systems when a lipid is
restrained at the center of the bilayer, i.e. when z ¼ 0 nm in the
PMFs. Our series of membranes have different structural prop-
erties, they respond differently to having a PC head group in
there interior.
We observe a large water pore when the phosphate of DLPC is
at the bilayer center (Fig. 2). The plateau near the bilayer center
in the PMF for DLPC corresponds to the location where pore
formation occurs. For example, at z¼ 0.7 nm only a water defect
through one leaflet of the bilayer is present, while at z ¼ 0.5 nm
a water pore forms. We estimate the pore radius for DLPC to be
0.95 nm at the center of the bilayer, from the two-dimensional
density map of water (Fig. 2B).
Examining the DMPC PMF, we observe a similar plateau and
corresponding water pore near the center of the bilayer.
Compared to DLPC, the plateau is shorter, and the free energy
barrier is 2.3 times larger. As well, the pore radius is smaller with
a value of 0.86 nm.
The PMF for DPPC does not contain a plateau (Fig. 1B),
although we do observe pore formation at the bilayer center
(Fig. 2). The pore only appears when z ¼ 0 nm and occasionally
when z ¼ 0.1 nm, but not for larger z coordinates. The pore
radius at the center of the bilayer is 0.55 nm, smaller than for
DMPC and DLPC.
For POPC and DOPC, we do not observe pores (Fig. 2A),
nor do the PMFs display plateaus. This suggests more energy
is required for pore formation and subsequently flip-flop. In
contrast with the saturated lipids, the phosphate density is
null when DOPC is at the center of the bilayer (Fig. 2B),
This journal is ª The Royal Society of Chemistry 2009
while the water density is appreciable (Fig. 2C). This suggests
that the mechanical properties of DOPC make it more
favorable for water to enter the hydrophobic bilayer interior,
in direct contact with the acyl chains, rather than have the
bilayer deform, and allow their phosphates into the bilayer
interior.
Soft Matter, 2009, 5, 3295–3302 | 3297

Water pore characterization
To quantify the water defect and pore formation we have
determined the number of water molecules that penetrate into
the hydrophobic interior of the bilayer, as a function of the
position of the pulled lipid (Fig. 3A). When the lipid is at equi-
librium there are between 5 and 10 water molecules in the bilayer
interior. As we move the lipid toward the bilayer center, there is
an increase in the number of water molecules, corresponding to
the formation of a water defect. DLPC and DMPC display large
increases in the number of water molecules in the interior of the
bilayer as a water pore forms. DLPC has a maximum number of
waters in the bilayer interior at z ¼ 0.25 nm. The maximum for
DMPC is at the bilayer center. For the other lipids, there is
a steady increase in the water within the interior from equilib-
rium to the center of the bilayer. For, POPC and DOPC, the
water defect contains approximately 16 waters, i.e. about 2 times
less than in the DLPC pore.
The number of hydrogen bonds to the pulled lipid as it is
transferred from water into the center of the bilayer was also
determined (Fig. 3B). The maximum number of hydrogen bonds
Fig. 3 Characterization of the water pore or defect formed during lipid
flip-flop. (A) The number of water molecules within the hydrophobic
interior of the bilayers as a function of the distance between the restrained
phosphate and the bilayer center of mass. The interior is defined as the
distance between the ester density peaks. The curves were smoothed with
a Bezier scheme to limit the background noise. The peaks and drops at z
¼ 0 nm for DLPC, DMPC and DPPC are not significant. They are due to
the large fluctuations of the number of water molecules and the
smoothing scheme. (B) The number of hydrogen bonds between the
restrained lipid and water as a function of the distance between the
restrained phosphate and the bilayer center of mass. The definition of
hydrogen bonds is based on geometric criteria (distance <0.35 nm, angle
<30�). The color code is the same for both panels.
3298 | Soft Matter, 2009, 5, 3295–3302
is when the PC lipid is in bulk water. Transferring the lipid from
water into its equilibrium position, there is a decrease in the
number of hydrogen bonds. We do not observe a plateau at the
lipids equilibrium position. The number of hydrogen bonds
decreases as it is moved into the bilayer interior, but never rea-
ches zero, meaning the PC head group is never fully desolvated.
Instead, it is stabilized by between 5 and 6 hydrogen bonds for
DPPC, POPC and DOPC (Fig. 2A). In contrast, for DLPC and
DMPC the number of hydrogen bonds increases to greater than
6 hydrogen bonds, as a water pore forms.
Water PMFs
As we observed large structural deformations of the bilayers for
lipid flip-flop, we wanted to investigate the translocation of
a small polar molecule that did not cause deformations. Without
deformations, the chemical environment of the interior of all the
bilayers should be similar, and therefore a small molecules free
energy of transfer from bulk water to center of the bilayers
should be consistent. As a control, we have determined PMFs for
transferring a single water molecule from bulk solution into the
center of the bilayers (Fig. 4A). As expected, the PMFs are flat in
bulk water, and increase as the water molecule moves into the
interior of the bilayer. The steep slope in the water PMFs plateau
near the bilayer center. Within the standard error, the water
molecule has the same free energy of transfer in the DLPC,
DPPC, POPC, and DOPC bilayers.
We have determined the number of hydrogen bonds formed to
the pulled water as it is transferred into the bilayer interior
(Fig. 4B). Contrary to the PC PMFs, which plateau when a pore
forms, the water PMFs plateau when the water becomes
Fig. 4 (A) PMFs for water partitioning in the series of lipid bilayers.
Error bars are the standard error from the two leaflets individual PMFs.
(B) Hydrogen bonds to the pulled water molecule as it is moved from
bulk water to the bilayer center. The color code is the same for both
panels.
This journal is ª The Royal Society of Chemistry 2009

desolvated; the average number of hydrogen bonds drops to near
zero. Once the water is desolvated it freely diffuse across the
hydrophobic interior of the bilayer.
Desorption
The free energy required for desorption is the free energy
difference between equilibrium and bulk water (Fig. 1B). Once
the lipid stops interacting with the bilayer, the PMF plateaus,
indicating a constant free energy for moving the lipid through
bulk water. The free energy of desorption for DLPC, DMPC,
DPPC, POPC, and DOPC are equal to 39, 48, 80, 85, and 90 kJ
mol�1. In general, as the number of carbons on the acyl tail
increases the free energy for desorption increases.
For all the lipids, we observe a critical distance at which the
tails stop interacting with the bilayer. To quantify this
phenomenon, we measured the head to tail distance for the
pulled lipid in each umbrella window (Fig. 5). As expected, this
distance increases as the acyl chains get longer; the DLPC head-
to-tail distance is shorter than DPPC. At equilibrium, the tails
are extended, resulting in a large head-to-tail distance. As the
lipid is transferred from equilibrium into bulk water, the head-to-
tail distance increases. The lipid becomes extended to prevent the
acyl tails being exposed to bulk water. At a critical distance from
equilibrium, we observed that the PC lipid tails stopped inter-
acting with the bilayer and folded up into bulk water, to mini-
mize exposure of the hydrophobic tails to water. This position
directly corresponds to the plateau of the PMF in bulk water
(Fig. 1B). For POPC, the tail fluctuates between inserted in the
bilayer and folded up in bulk water, in adjacent umbrella
windows.
Discussion
The areas per lipid for all of our bilayers are higher than
experimental values. The simulation parameters have been
shown to affect the area per lipid and the correct area per lipid
can be obtained using any force field with a particular set of
parameters.33 We have shown that a cholesterol PMF in a DPPC
bilayer is not significantly affected by using constant area and at
Fig. 5 Distance between the phosphate and the methyl of the sn-2 acyl
chain for the restrained lipids as a function of the distance between the
phosphate and the bilayer center of mass.
This journal is ª The Royal Society of Chemistry 2009
�10% area per lipid (W. F. D. Bennett, D. P. Tieleman,
unpublished work). This suggests the exact area per lipid is not
crucial for free energies of lipid transfer.
Pores and defects
The lipid PMFs have a steep slope as we transfer the head group
into the interior of the bilayer (Fig. 1B). The increase in free
energy is correlated to the formation of a water defect, which
becomes larger as the lipid is transferred farther into the bilayer.
It is energetically more favorable for the bilayer to deform and
allow a water defect than for the PC lipid head group to become
desolvated. At a critical distance from the center of the DLPC,
DMPC, and DPPC bilayers, the water defect becomes a pore,
with water penetrating into the hydrophobic interior of the
bilayer from both leaflets (Fig. 2). Once a pore forms, the
restrained lipid can freely diffuse across the interior of the bilayer
from one leaflet to the other. Our free energy calculations allow
us to extract the free energy of pore formation in membranes as
well as the free energy barrier for flip-flop. It is interesting that
pore formation is strongly correlated with the plateau in the
PMF. Therefore, the free energy for pore formation might be an
intrinsic property of the bilayer, and largely independent of the
method used to create the pore. Indeed, the structure and
dynamics of our observed water defects and pores are consistent
with many other simulations.17–19,34 Of particular interest with
respect to our current focus, is the work of Wohlert et al. who
investigate the free energy of pore formation with the pore radius
as the reaction coordinate.17 For a DPPC bilayer, the PMF for
pore formation with a radius of <0.3 nm had a quadratic shape,
and a free energy cost of 75–100 kJ mol�1.17
The structure and fluidity of the membrane directly affect
water pore and defect formation. As expected, the shorter lipids
formed pores much easier than the longer lipids. This resulted in
the large increase in DGflop that we observed for DOPC (90 kJ
mol�1) compared to DLPC (16 kJ mol�1). Fig. 2 shows that the
structure of the hydrophobic pore is different for all of the
bilayers. For example, DLPC has a large pore radius, with water
and phosphate density near the bilayer center. The pore in DPPC
is much smaller, with an increased curvature of the pore wall and
little phosphate density at the bilayer center. Although we do not
see pore formation in the DOPC bilayer, the water defect
displays the same trend, with increased defect curvature and
reduced pore radius (i.e. 0 nm). From the structure of the
observed pores and defects, it is clear that the bilayers bend to
accommodate the zwitterionic lipid.
For DPPC, we observed a pore only at the bilayer center. We
have shown previously that adding 40 mol% cholesterol to
a DPPC bilayer, caused the free energy barrier for DPPC flip-flop
to increase to 110 kJ mol�1, and prevented pore formation.35 At
the center of the 40 mol% bilayer, we observed a plateau in the
PMF, which corresponded to cessation of the water defect, and
four or five water molecules forming a solvation ‘bubble’ around
the head group of DPPC. Cholesterol increases the thickness and
reduces the fluidity of lipid bilayers. Therefore, the increased free
energy barrier for DPPC flip-flop in the 40 mol% cholesterol
bilayer follows the same trend as the present results.
The water PMFs served as a control showing that the differ-
ences we observe for the PC lipid PMFs are due to bilayer
Soft Matter, 2009, 5, 3295–3302 | 3299
deformations. The free energy of transfer for a small, polar
molecule, which did not form defects or pores at the bilayer
center, was consistent for the DLPC, POPC, DPPC, and DOPC
bilayers (Fig. 4). In addition, the water PMFs demonstrated that
when a polar molecule becomes desolvated, the PMF plateaus.
We have observed similar behavior in the investigation of the
polar and charged amino acid side chains partitioning in
a DOPC bilayer.11,34 Water defect formation caused the PMFs of
the polar and charged side chains to have a steep slope. The
PMFs flattened when the defect broke, when it was energetically
more favorable to desolvate the side chain than to deform the
bilayer. The slope for all the side chains PMFs was similar, but
the distance the defect broke, and the length of the plateau
depended on the particular side chain. This supports the idea that
defect formation dominates the slope of the PMF for polar and
charged molecules.
Our present results provide new insight into biological
membranes’ function as selective barriers. Lipid bilayers are
extremely flexible and dynamic, which allow them to adjust their
structure to accommodate charged molecules within their
hydrophobic interior. These structural deformations are critical
determinants in the shape of PMFs and the height of free energy
barriers for molecules translocating across lipid membranes.
Once a water defect either breaks, or expands into a pore, the free
energy of transfer across the bilayer becomes zero. The lipid
composition of the respective bilayer would affect the energy
required for water defect and pore formation, and consequently
the permeation of polar and charged molecules.
Flip-flop rates
The rate of passive lipid flip-flop can be estimated from DGflop.
We assume the transition state for flip-flop is when the PC lipid is
at the bilayer center. This assumption is supported by the
correlation of pore formation and the free energy plateau.
Therefore we can estimate the rate of pore formation, kf, using:
kf
kd
¼ e�DG=RT (1)
where kd is the rate of pore dissipation. Due to the large free
energy barrier, we assume that the rate for the phosphate of the
PC lipid to reach the interior of the bilayer will dominate all other
considerations. Obtaining an accurate estimate for the rate of
pore dissipation from simulation is non-trivial. We attempted to
measure kd from 50 independent simulations of a DMPC bilayer
with a pre-formed pore (data not shown). However, this attempt
failed as the phenomenon is largely stochastic, with some pores
remaining after 50 ns and others dissipating in nanoseconds.
Gurtovenko and Vattulainen found similar results using pre-
formed pores in a DMPC bilayer, with metastable pores lasting
from 35 to 200 ns.36 Eqn 1 implies that an increase in the rate of
flip-flop by 1 order of magnitude decreases DGflop by 5.7 kJ
mol�1. This is approximately the same magnitude as the standard
error of the PMFs.
Instead of attempting a more rigorous estimate of the rate, we
have used the same range of kd values (10–100 ns) for all the
bilayers, and the same assumptions as in ref. 10. We find the rates
for DLPC, DMPC, DPPC, POPC and DOPC flip-flop occur on
the microsecond, second, hour, hour, and day timescales,
3300 | Soft Matter, 2009, 5, 3295–3302
respectively. We did not observe pore formation in the POPC
and DOPC bilayers, and therefore we are unsure about their
transition state and free energy barrier for flip-flop.
In general, comparison to experiment is difficult as literature
values span large ranges depending on experimental procedure,
such as the use of fluorescent probes. The difference in temper-
ature used in many of the experiments and our study also
impedes direct comparison. A recent study of DMPC, DPPC,
and DSPC flip-flop in planar supported bilayers, using sum-
frequency vibrational spectroscopy showed Arrhenius behavior
for flip-flop, indicating an exponential dependence of the
temperature on the rate.37 The rate of DMPC flip-flop was found
to be faster than DPPC and DSPC, although all the rates were
determined in gel state bilayers.37 TEMPO labeled DPPC had an
order of magnitude slower rate of flip-flop, compared to DPPC,
showing the use of labeled analogs has a large effect on many
experimental values for lipid flip-flop rates.37 At the main phase
transition temperature of DMPC and DPPC the rate of flip-flop
of NBD-labeled analogs was increased compared to the gel and
liquid-crystalline phases.38 Again, the rate of flip-flop in the
DMPC bilayer was faster than in the DPPC bilayer.38 The rate of
NBD-PE flip-flop was shown to be dependent on the number of
double bonds in the PC lipids acyl tail, with much faster flip-flop
in poly-unsaturated bilayers.39 Of interest to our study, it was
shown that NBD-PE flip-flop was faster in DOPC bilayers
compared to DPPC, but the low temperature used (25 �C), meant
that the DPPC bilayer was in the gel phase.39 Our results show
that flip-flop of DLPC would be orders of magnitude faster than
DPPC flip-flop. Our estimations are crude, but we do not focus
on specific values, other than to note the value for DPPC was
previously shown to be well within the experimental range of
rates (1 to 90 hours).10 The extremely fast flip-flop we predict for
the DLPC and DMPC bilayers does seem somewhat unrealistic,
and may point to possible force field issues. We predict a rate
decrease as we increase the number of double bonds, which
disagrees with the results of39 and the predicted effect of the
increased fluidity caused by double bonds. This may be due to the
double bond parameters we have used, but the difference in
temperature and phases, makes direct comparison with39
impossible. It would be interesting to repeat our calculations on
poly-unsaturated acyl tails or to determine experimental rates of
unlabeled lipids in single component bilayers all at the same
temperature. In retrospect we should have used the same length
of acyl tails, as our unsaturated tails are also longer (18:1C) than
the saturated DPPC bilayer (16:0C).
Biologically, the large discrepancy we observe in the free
energy barriers for flip-flop suggests differential rates of lipid flip-
flop between different cellular organelles. In thin, fluid ER
membranes, flip-flop would be orders of magnitude faster than in
plasma membranes that are more rigid. Much remains unknown
about lipid translocation, which is biologically important.
Chemical potential
The free energy for desorption relies on the equilibrium stability
of the lipid in the bilayer, in addition to the solubility of the lipid
in water. We can equate the free energy of desorption to the
excess chemical potential of the lipid in the bilayer compared to
bulk water. The chemical potential of a lipid is a crucial
This journal is ª The Royal Society of Chemistry 2009

thermodynamic parameter and determines lipid partitioning, and
is therefore important for phase behavior and domain formation
in membranes. For instances, the critical micelle concentration
(CMC) of a lipid is directly related to the excess chemical potential
of the lipid in bulk water compared to a micelle,
m � m0 ¼ RTln(CMC)
The CMC of DLPC, DMPC, and DPPC are 280, 94, and
0.3 nM, which equate to excess chemical potentials of 51, 54, and
69 kJ mol�1.40 Note that CMCs have to be converted to mole
fraction units, i.e. divided by 55.5 M. Our calculated excess
chemical potential for DLPC, DMPC, and DPPC were 39, 48,
and 80 kJ mol�1, which demonstrate the correct qualitative trend.
It is surprising that we underestimate the chemical potential of
DLPC and DMPC, but over estimate DPPC.
Obtaining correct thermodynamic data, such as chemical
potentials, is important for molecular dynamics simulations. Our
results show that current force fields can produce reasonable
results for the chemical potential of PC lipids. For more complex
biological phenomena, such as lateral domain formation, subtle
discrepancies in chemical potentials likely have very large and
unpredictable effects. In the future, a new generation of lipid
force fields might be parameterized to reproduce thermodynamic
phase data.
Conclusion
We have calculated free energy profiles for the movement of
a series of phospholipids normal to the plane of lipid bilayers.
The free energy to move the PC lipid from equilibrium to the
center of the bilayer is the free energy barrier for flip-flop. We
found that the composition of the bilayer and therefore the
structure of the bilayer had a large effect on the free energy
barrier, and therefore on the rate of flip-flop. Thinner bilayers,
such as DLPC, had lower free energy barriers (16 kJ mol�1),
compared to thicker bilayers, like DPPC (80 kJ mol�1). We
observed large water pores for the shorter lipids, which became
smaller as we increased the bilayer thickness. We equated the free
energy difference between the equilibrium position of the PC
lipid, and bulk water to the excess chemical potential of the lipid.
As expected, as we increased the number of carbons in the acyl
tails the chemical potential decreased, i.e. it became more unfa-
vorable to remove the lipid from the bilayer. In general, the
composition of bilayers strongly affects important thermody-
namic properties, which have broad implications on biological
membranes.
List of abbreviations
DLPC
This journal is ª The Royal S
dilauroylphosphatidylcholine
DMPC dimyristoylphosphatidylcholine DPPC dipalmitoylphosphatidylcholine DOPC dioleoylphosphatidylcholine POPC 1-palmitoyl-2-oleoyl-phosphatidylcholine MD molecular dynamics PMF potential of mean force ER endoplasmic reticulumociety of Chemistry 2009
Acknowledgements
WFDB is supported by studentships from the Natural Science
and Engineering Research Council (NSERC, Canada) and the
Alberta Heritage Foundation for Medical Research (AHFMR).
DPT is an AHFMR Senior Scholar and Canadian Institutes for
Health Research New Investigator. This work was supported by
NSERC. Calculations were done in part on WestGrid facilities.
References
1 G. van Meer, D. R. Voelker and G. W. Feigenson, Nat. Rev. Mol. CellBiol., 2008, 9, 112–124.
2 B. De Kruijff and E. J. Van Zoelen, Biochim. Biophys. Acta, 1978, 511,105–115.
3 R. D. Kornberg and H. M. McConnell, Biochemistry, 1971, 10, 1111–1120.
4 W. C. Wimley and T. E. Thompson, Biochemistry, 1990, 29, 1296–1303.
5 D. L. Daleke, J. Lipid Res., 2003, 44, 233–242.6 M. A. Kol, B. de Kruijff and A. I. de Kroon, Semin. Cell Dev. Biol.,
2002, 13, 163–170.7 M. A. Kol, A. I. de Kroon, D. T. Rijkers, J. A. Killian and B. de
Kruijff, Biochemistry, 2001, 40, 10500–10506.8 M. A. Kol, A. van Dalen, A. I. de Kroon and B. de Kruijff, J. Biol.
Chem., 2003, 278, 24586–24593.9 M. A. Kol, A. N. C. van Laak, D. T. S. Rijkers, J. A. Killian,
A. I. P. M. de Kroon and B. de Kruijff, Biochemistry, 2003, 42,231–237.
10 D. P. Tieleman and S. J. Marrink, J. Am. Chem. Soc., 2006, 128,12462–12467.
11 J. L. MacCallum, W. F. D. Bennett and D. P. Tieleman, Biophys. J.,2008.
12 S. Dorairaj and T. W. Allen, Proc. Natl. Acad. Sci. U. S. A., 2007, 104,4943–4948.
13 J. A. Freites, D. J. Tobias, G. von Heijne and S. H. White, Proc. Natl.Acad. Sci. U. S. A., 2005, 102, 15059–15064.
14 H. Leontiadou, A. E. Mark and S. J. Marrink, J. Am. Chem. Soc.,2006, 128, 12156–12161.
15 H. D. Herce and A. E. Garcia, Proc. Natl. Acad. Sci. U. S. A., 2007,104, 20805–20810.
16 K. Matsuzaki, O. Murase, N. Fujii and K. Miyajima, Biochemistry,1996, 35, 11361–11368.
17 J. Wohlert, W. K. den Otter, O. Edholm and W. J. Briels, J. Chem.Phys., 2006, 124, 154905.
18 D. P. Tieleman, BMC Biochem., 2005, 5, 10.19 A. A. Gurtovenko and I. Vattulainen, J. Am. Chem. Soc., 2005, 127,
17570–17571.20 O. Berger, O. Edholm and F. Jahnig, Biophys. J., 1997, 72, 2002–2013.21 H. J. C. Berendsen, J. P. M. Postma, W. F. van Gunsteren and
J. Hermans, Interaction Models for Water in Relation to ProteinHydration., D. Reidel, Dordrecht, The Netherlands, 1981.
22 D. Van der Spoel, E. Lindahl, B. Hess, G. Groenhof, A. E. Mark andH. J. C. Berendsen, J. Comput. Chem., 2005, 26, 1701–1718.
23 T. Darden, D. York and L. Pedersen, J. Chem. Phys., 1993, 98,10089–10092.
24 U. Essmann, L. Perera, M. L. Berkowitz, T. Darden, H. Lee andL. G. Pedersen, J. Chem. Phys., 1995, 103, 8577–8593.
25 H. J. C. Berendsen, J. P. M. Postma, W. F. Vangunsteren, A. Dinolaand J. R. Haak, J. Chem. Phys., 1984, 81, 3684–3690.
26 B. Hess, H. Bekker, H. J. C. Berendsen and J. G. E. M. Fraaije,J. Comput. Chem., 1997, 18, 1463–1472.
27 S. Miyamoto and P. A. Kollman, J. Comput. Chem., 1992, 13, 952–962.
28 S. Kumar, D. Bouzida, R. H. Swendsen, P. A. Kollman andJ. M. Rosenberg, J. Comput. Chem., 1992, 13, 1011–1021.
29 W. Humphrey, A. Dalke and K. Schulten, J. Mol. Graphics, 1996, 14,33.
30 H. I. Petrache, S. W. Dodd and M. F. Brown, Biophys. J., 2000, 79,3172–3192.
Soft Matter, 2009, 5, 3295–3302 | 3301

31 G. Pabst, M. Rappolt, H. Amenitsch and P. Laggner, Phys. Rev. E.,2000, 62, 4000–4009.
32 J. F. Nagle and S. Tristram-Nagle, Biochim. Biophys. Acta-Rev. onBiomem., 2000, 1469, 159–195.
33 C. Anezo, A. H. de Vries, H. D. Holtje, D. P. Tieleman andS. J. Marrink, J. Phys. Chem. B., 2003, 107, 9424–9433.
34 J. L. MacCallum, W. F. D. Bennett and D. P. Tieleman, J. Gen.Physiol., 2007, 129, 371–377.
35 W. F. D. Bennett, J. L. MacCallum and D. P. Tieleman, J. Am. Chem.Soc., 2009, 131, 1972–1978.
3302 | Soft Matter, 2009, 5, 3295–3302
36 A. A. Gurtovenko and I. Vattulainen, J. Phys. Chem. B., 2007, 111,13554–13559.
37 J. Liu and J. C. Conboy, Biophys. J., 2005, 89, 2522–2532.38 K. John, S. Schreiber, J. Kubelt, A. Herrmann and P. Muller,
Biophys. J., 2002, 83, 3315–3323.39 V. T. Armstrong, M. R. Brzustowicz, S. R. Wassall,
L. J. Jenski and W. Stillwell, Arch. Biochem. Biophys., 2003,414, 74–82.
40 G. Cevc and D. Marsh, in Phospholipid Bilayers: Physical Principlesand Models, Wiley, New York, 1987.
This journal is ª The Royal Society of Chemistry 2009


![494 IEEE TRANSACTIONS ON DEVICE AND …...The logic circuit to be modeled is a bistable flip-flop, con-sisting of two cross-coupled inverters (see Fig. 2) [13]. The two inverters](https://img.pdfslide.us/doc/110x75/5fc6fff38f541525ee4cfae8/494-ieee-transactions-on-device-and-the-logic-circuit-to-be-modeled-is-a-bistable.jpg)


![arXiv:1010.0281v1 [hep-ph] 2 Oct 2010 · arXiv:1010.0281v1 [hep-ph] 2 Oct 2010 Tetraquark resonances with the triple flip-flop potential, decays in the cherry in a broken glass](https://img.pdfslide.us/doc/110x75/6000ab2f811bb903a7139a62/arxiv10100281v1-hep-ph-2-oct-2010-arxiv10100281v1-hep-ph-2-oct-2010-tetraquark.jpg)