Embed Size (px)
Citation preview
-i-
Thermodynamic study of oxygen-
enhanced combustion: analysis of
different techniques of oxidant
production
Gaëlle Gosselin
ii
Master of Science Thesis EGI 2012: HT
Thermodynamic study of oxygen-enhanced
combustion: analysis of different techniques
of oxidant production
Gaëlle Gosselin
Approved
Examiner
Reza Fakhraie
Supervisors
KTH: Reza Fakhraie
UFRGS: Paulo Smith Schneider and
Cristiano Frandalozo Maidana
Commissioner
Contact person
Abstract
Thermal energy is an important resource for many industrial processes and is usually produced by
combustion of hydrocarbon fuels with air. These processes could beneficiate from the use of oxygen-
enhanced combustion (OEC), whose benefits (pollutants emissions reduction, fuel savings, productivity
increase and volumes reduction) are already known. However, low costs oxygen production is still a
challenge as the currently most used technique, cryogenics, is very energy consuming and costly. So, the
present work proposes the thermodynamic analysis of two different techniques for production of oxidant
required for the OEC process, the first one including air separation by polymeric membrane and the
second one by PSA. Both systems were simulated on the software EES. Results show an increase of the
energetic efficiency in both of the systems (from 22% to 58% in the membrane case and 66% in the PSA
case) and of the exergetic efficiencies (from 18% to 48.5% and 54% respectively). A reduction of more
than 60% of specific pollutants emissions was shown. The assessed techniques were shown to be
energetically more attractive than cryogenics for small plants, the size limit depending on operating
conditions.
iii
Table of Contents
Abstract ........................................................................................................................................................................... ii
Index of figures .............................................................................................................................................................. v
Index of tables.............................................................................................................................................................. vii
1 Introduction .......................................................................................................................................................... 1
1.1 Motivation .................................................................................................................................................... 1
1.2 Literature review .......................................................................................................................................... 1
1.3 Scope and objectives ................................................................................................................................... 2
2 Oxygen-enhanced combustion .......................................................................................................................... 3
2.1 Principle ........................................................................................................................................................ 3
2.1.1 Enrichment levels .............................................................................................................................. 3
2.1.2 Combustion reaction ......................................................................................................................... 3
2.2 Advantages and drawbacks ........................................................................................................................ 4
2.2.1 Advantages .......................................................................................................................................... 4
2.2.2 Drawbacks ........................................................................................................................................... 5
3 Oxygen production .............................................................................................................................................. 6
3.1 Cryogenic processes .................................................................................................................................... 6
3.2 Membranes ................................................................................................................................................... 6
3.2.1 Definition ............................................................................................................................................ 6
3.2.2 Membranes for air separation .......................................................................................................... 6
3.2.3 Membrane choice ............................................................................................................................... 7
3.2.4 Membrane elements........................................................................................................................... 8
3.2.5 Advantages and drawbacks............................................................................................................... 8
3.3 Pressure/Vacuum swing adsorption (PSA/VSA).................................................................................. 9
3.3.1 Operation principle ............................................................................................................................ 9
3.3.2 Analytical solution of equilibrium model .....................................................................................10
4 Methodology .......................................................................................................................................................12
4.1 Thermodynamic cycles .............................................................................................................................12
4.1.1 Cycle including membrane .............................................................................................................12
4.1.2 Cycle including PSA ........................................................................................................................12
4.2 Components modeling .............................................................................................................................13
4.2.1 Feed ....................................................................................................................................................13
4.2.2 Compressor .......................................................................................................................................13
4.2.3 Cooler ................................................................................................................................................14
4.2.4 Membrane .........................................................................................................................................14
4.2.5 Pressure Swing Adsorption columns ............................................................................................15
4.2.6 Turbine ..............................................................................................................................................15
iv
4.2.7 Mixer ..................................................................................................................................................16
4.2.8 Combustion chamber ......................................................................................................................16
4.3 Indicators for results analysis ..................................................................................................................17
4.3.1 Fuel savings .......................................................................................................................................17
4.3.2 Energetic analysis .............................................................................................................................17
4.3.3 Exergetic analysis .............................................................................................................................17
4.3.4 Emissions ..........................................................................................................................................18
4.4 Parameters and variables ..........................................................................................................................19
5 Results and discussion .......................................................................................................................................21
5.1 Base case .....................................................................................................................................................21
5.2 Combustion under stoichiometric conditions and constant fuel feed..............................................21
5.2.1 Energy flows, volume and fuel savings ........................................................................................21
5.2.2 Emissions ..........................................................................................................................................23
5.3 Case study 1: Oxygen production by membrane .................................................................................24
5.3.1 Energetic analysis .............................................................................................................................24
5.3.2 Exergetic analysis .............................................................................................................................27
5.3.3 Energy transfers and efficiencies ...................................................................................................29
5.4 Case study 2: oxygen production by PSA .............................................................................................30
5.4.1 Model results.....................................................................................................................................30
5.4.2 Energetic analysis and efficiency ...................................................................................................31
5.4.3 Exergetic analysis .............................................................................................................................31
5.5 Pollutant emissions: comparison of the two systems ..........................................................................35
5.6 Energy requirements: comparison with cryogenics .............................................................................36
6 Conclusion ...........................................................................................................................................................38
7 List of symbols....................................................................................................................................................39
References .....................................................................................................................................................................40
Appendix A: Combustion model validation ...........................................................................................................42
Appendix B: Definition of parameters for solving the PSA equilibrium model ...............................................44
Appendix C: Results variation with temperature in the PSA system ..................................................................45
Annex I: Natural gas data ...........................................................................................................................................46
Annex II: Detailed calculations for the PSA equilibrium model ................................................................... - 47 -
v
Index of figures
Figure 1 Major species concentrations vs oxidizer composition, for an adiabatic equilibrium stoichiometric
CH4 flame (Baukal 1998) .............................................................................................................................................. 4
Figure 2 Unit operations for a cryogenic air separation process (Smith and Klosek 2001) .............................. 6
Figure 3 Upper bound correlation for O2/N2 separation (Robeson 2008) ......................................................... 7
Figure 4 Flows in membrane separation process ..................................................................................................... 8
Figure 5 Scheme of a spiral-wounded membrane element ..................................................................................... 8
Figure 6 Scheme of a hollow-fiber membrane element .......................................................................................... 8
Figure 7 Scheme of a two fixed-bed PSA system (Cruz, et al. 2003) .................................................................... 9
Figure 8 Thermodynamic system 1, including oxygen production by membrane separation ........................12
Figure 9 Thermodynamic system 2, including oxygen production by a two-bed PSA process......................13
Figure 10 Molar flow rates of oxidant. Total (black line), O2 (red line) and N2 (blue line). ............................22
Figure 11 Heat released during combustion as a function of oxygen enrichment under stoichiometric
conditions for various temperature at the combustion chamber outlet (T8) .....................................................22
Figure 12 Volume of exhaust gases as a function of O2 enrichment .................................................................23
Figure 13 Fuel savings for various levels of enrichment .......................................................................................23
Figure 14 Specific emissions of CO2 .......................................................................................................................24
Figure 15 Specific emissions of NO .........................................................................................................................24
Figure 16 Specific emissions of CO .........................................................................................................................24
Figure 17 Compressor power as a function of area for various membrane selectivities and for a 26% O2
enrichment ....................................................................................................................................................................25
Figure 18 Turbine power as a function of area for various membrane selectivities and for a 26% O2
enrichment ....................................................................................................................................................................25
Figure 19 Compressor power as a function of enrichment level for membranes with various selectivities 25
Figure 20 Optimun membrane area as a function of enrichment level ..............................................................26
Figure 21 System efficiency for various selectivities as a function of enrichment ............................................26
Figure 22 System exergetic efficiency for various selectivities as a function of enrichment ...........................27
Figure 23 Destroyed exergy and exergy transfer in the combustion chamber as a function of enrichment 28
Figure 24 Destroyed exergy in the membrane as a function of enrichment ......................................................28
Figure 25 Destroyed exergy in the mixer as a function of enrichment ..............................................................28
Figure 26 Exergy loss by heat transfer in the cooler as a function of enrichment ...........................................28
Figure 27 Exergetic efficiencies of mixer, membrane and combustion chamber (for alpha = 8) .................28
Figure 28 Compressor power, turbine power and heat retreived from the combustion chamber as a
function of enrichment for a membrane of selecivity 8 ........................................................................................29
Figure 29 System energetic and exergetic efficiencies as a function of enrichment for a membrane of
selecivity 8 .....................................................................................................................................................................30
vi
Figure 30 Total system efficiency as a function of the compressor pressure ratio for production of oxidant
with PSA .......................................................................................................................................................................31
Figure 31 Physical and chemical exergy in the membrane system from point 0 to 5 ......................................32
Figure 32 Physical and chemical exergy in the membrane system from point 6 to 8 ......................................32
Figure 33 Physical and chemical exergy in the PSA system from point 0 to 5 .................................................32
Figure 34 Physical and chemical exergy in the PSA system from point 6 to 8 .................................................32
Figure 35 Destroyed exergy of the various components for different modes of operation ...........................33
Figure 36 Exergy transfer by heat in the various components for different modes of operation .................34
Figure 37 Exergetic efficiency of various components for different modes of operation ..............................34
Figure 38 Relative specific CO2 emissions ignoring the energy consumed by the compressor (eCO2) and
with total energy by the system (eCO2,total) for a membrane of selectivity 8 as a function of enrichment. .....35
Figure 39 Relative specific CO emissions for a membrane of selectivity 8 as a function of enrichment .....35
Figure 40 Relative specific NO emissions for a membrane of selectivity 8 as a function of enrichment ....36
Figure 41 Energy consumption for the production of 1MWh of heat as a function of the production per
day, for various techniques of oxidant production: cryogenics, membrane of selectivity 8 and PSA. Data
for cryogenics came from (Kauranen 2008)............................................................................................................37
Figure 42 Adiabatic flame temperature from (Baukal 1998) and from simulations .........................................42
Figure 43 Comparison of components of combustion gases between experimental results and calculations
under the pressure of 4.1 MPa. Solid lines mean the results obtained by the theoretical calculations in
equilibrium state. Keys are the results by the experiments (Yamamoto, et al. 1997). ......................................43
Figure 44 Natural gas proved reserves in Brazil from 1980 until 2012 (US Energy Information
Administration 2012) ..................................................................................................................................................46
Figure 45 Natural gas production in Brazil from 1980 until 2011.......................................................................46
Figure 46 Natural gas consumption in Brazil from 1980 until 2011 ...................................................................46
Figure 47 Average implied CO2 emission factors in the EU (g CO2/MJ) (European Environment Agency
2012) ..............................................................................................................................................................................46
vii
Index of tables
Table 1 Operating conditions in the PSA system ..................................................................................................10
Table 2 Conditions at membrane inlet and outlets ................................................................................................14
Table 3 Conditions at PSA inlet and outlets ...........................................................................................................15
Table 4 Definition of the components exergetic efficiencies ...............................................................................18
Table 5 Simulations main parameters ......................................................................................................................19
Table 6 Simulation main variables ............................................................................................................................20
Table 7 PSA energetic analysis results......................................................................................................................31
Table 8 Comparison of quantity of species formed during combustion between Baukal and the simulation
........................................................................................................................................................................................42
Table 9 Equilibrium data (Kayser and Knaebel 1986) ..........................................................................................44
Table 10 Comparison of the results of PSA for two temperatures of operation (30°C and 60°C). Values
were retrieved for the pressure that gave the system maximum efficiency ........................................................45
-1-
1 Introduction
1.1 Motivation
Heat for industrial processes is usually generated from combustion with air of hydrocarbon fuels as
natural gas or oil. However, the Oxygen-Enhanced Combustion (OEC), which consists in combustion
with an oxygen-enriched oxidant, can bring a series of advantages compared with conventional
combustion. These improvements can be an increase of the process thermal efficiency, a reduction of fuel
consumption, a reduction of flue gases volumes and/or a reduction of pollutant emissions (Baukal 1998).
However, one of the major costs of operating an oxygen-enhanced combustion system lies in oxygen
generation. OEC could be economically viable only if oxygen generation can be done at lower cost than
with cryogenic distillation, which is currently the most used method. In this way, technologies such as
membrane separation and/or pressure swing adsorption are promising (Baukal 1998).
Besides, natural gas being a type of fuel with lower emissions than coal and petroleum products, there is a
global trend towards increased consumption of natural gas in the near future (EIA 2012) . In the case of
Brazil, natural gas is a fuel of major interest as the number of proved reserves on land with natural gas
potential has increased drastically (see Annex I). According to the Brazilian National Petroleum Agency
(ANP), that could lead to an increase in natural gas consumption of more than two-fold by 2020, going
from 86 million cubic meters presently to 200 million (MercoPress 2012). Furthermore, in Brazil, natural
gas and biomass are the two largest sources of thermal generation and power generation from natural gas
more than doubled in 2010 (EIA 2012).
For these reasons and given the importance of integrating oxygen generation into the system, the present
work proposes to study an OEC process coupled with oxygen generation, first by polymeric membrane
separation and second by pressure swing adsorption, in order to evaluate the viability and benefits of
those processes.
1.2 Literature review
Oxygen-enhanced combustion including oxygen separation from air by polymeric membranes has already
been studied, but mostly experimentally, and for specific applications. As a consequence, these studies do
not consider revalorization of “waste” flows such as the nitrogen-enriched flow resulting from membrane
separation or the exhaust gases.
In 1986, Kimura et al. studied natural gas combustion with oxygen-enriched fuel from a membrane. They
showed that membrane is a potentially attractive process but requires a costs study and a trade-off must be
found between capital costs and operating costs. A silicone-based membrane was studied experimentally
and results showed a reduction in natural gas consumption, due to enrichment (Kimura and Browall
1986).
In 1994, Rigby et al. studied enriched combustion in diesel engines. They showed a significant reduction
of particulate emissions (up to 80%) and an increased thermal efficiency under certain conditions. The
experiment used a prototype flat sheet polymeric membrane module and was the first to identify a
possible role for polymeric membrane in the area of diesel engines (Rigby and Watson 1994).
In 2007, Coombe et al. studied experimentally a polymeric membrane separation for combustion in
portable liquid fuel burners. They showed that the power required for the membrane to operate is
relatively low and can be justified in front of the benefices of oxygen-enhanced combustion (Coombe and
Nieh 2007).
2
In 2009, Qiu et al. studied the effect of oxygen-enrichment on radiant burners and used a polymeric
membrane for oxygen separation. They showed that enrichment of 28% O2 could lead to 22 to 28%
potential natural gas savings (Qiu and Hayden 2009).
Although pressure swing adsorption (PSA) has already been presented as an option for oxygen separation
for OEC (Baukal 1998), this application has not been studied yet. However, PSA has been widely studied
for application to separation of various gases mixtures, including O2/N2 (Cruz, et al. 2003).
Two models are mainly used. The first one is the equilibrium model (Knaebel and Hill 1985) for which
analytical solutions have been proposed (Banerjee, Narayankhedkar and Sukhatme 1989), (Chiang 1996).
The second one is the linear driving force model (LDF) which takes into account a more accurate
description of the adsorption effect (Cruz, et al. 2003) (Mendes, Costa and Rodrigues 2001).
Some authors proposed models between the analytical solution and a numerical simulation. Jain et al.
proposed an heuristic model of PSA to provide easy rules for design of PSA and dimensioning of the
most important parameters: adsorbent selection, particle and bed size, purge volume (Jain, et al. 2003).
Serberzov et al. proposed a semi-analytical model, which allows finding some of the parameters
analytically and only a range of possibility for the others (Serberzov and Sotirchos 2003).
1.3 Scope and objectives
The present work is based on a previous work about oxygen-enhanced combustion applied to gas turbine
(Maidana, Carotenuto and Schneider, Analysis of oxygen-enhanced combustion of gas power cycle 2010).
In the previous work was developed an EES (Engineering Equation Solver) code to model a gas turbine
cycle. Pure oxygen was injected at high pressure in the compressed air feed before the combustion
chamber, thus creating an oxygen-enriched oxidant. It was shown that using OEC could increase the
system energetic efficiency or reduce the pollutants emissions, and bring many other advantages that
depend on the application (see section 2).
This work intends to study OEC coupled with oxygen generation as a thermodynamic system. The
respective processes were simulated with a code developed in EES, as did Maidana et al., that made a first
analysis on EES of membrane separation applied to OEC, comparing three different types of membranes
and performing an energetic analysis of the system (Maidana and Schneider, Energetic analysis of oxygen-
enhanced combustion with air separation by polymeric membranes 2012).
The major difference of this work with previous studies is that the analysis will focus on the whole system
including oxygen production and all the outlet flows, and that an exergetic analysis will be performed.
First, the OEC system was implemented and the model validated according to available data. Then,
membrane separation was modeled and process simulations were realized. A PSA system was also
modeled. Next, the two systems (separation system and combustion system) were coupled and the
simulation results compared to conventional system. The feasibility and viability of the process was
analyzed. Analysis of energetic efficiency, fuel consumption, pollutant emissions and exergetics were made
in order to assess the sustainability of such a system. The systems were then compared to cryogenics.
-3-
2 Oxygen-enhanced combustion
2.1 Principle
2.1.1 Enrichment levels
Oxygen-enhanced combustion consists basically in increasing the oxygen concentration in the
atmospheric air in order to create an oxidant enriched in oxygen, which is the species of interest for
combustion applications. Atmospheric air can be approximated as composed of 21% of oxygen and 79%
of nitrogen, in volume. In principle, OEC can be applied to any thermal process that implies burning of
fuel. However, in a report for the Gas Research Institute, several applications were pointed out that could
potentially beneficiate from OEC. They are processes with high flue gas temperatures, processes of low
thermal efficiency, processes that have high level of emissions (especially NOx) or flue gas volume
limitations (Baukal 1998).
The major difference of traditional combustion and OEC resides in adiabatic flame temperature after
combustion. Increasing O2 level leads to a substantially higher temperature (up to 3000 K).
The O2 mole fraction in the oxidant is defined as:
(2.1)
Three levels of enrichment are defined (Baukal 1998):
- Low-level enrichment ( : this is normally used for retrofit applications. In this case, only
a few changes to an existing application need to be made in order to operate in OEC and bring
various improvements to the process.
- Medium-level enrichment ( ): the interest of this type of combustion has grown
only recently, and this operating mode requires specially designed burners. Membrane levels of
enrichment are included in this region (see section 3.2).
- High-level enrichment ( ): it is currently used when the need for high temperature or
high purity of oxygen justifies the added cost of producing high purity oxygen, which is presently
produced by cryogenics (see section 3.1). PSA would be integrated into this category, but would
be justified only if lower costs are achievable.
2.1.2 Combustion reaction
The stoichiometric reaction of methane with air is represented by the following equation:
(2.2)
In the case of oxygen-enhanced combustion, the stoichiometric reaction becomes:
(
)
(2.3)
Where is the molar fraction of O2 in the oxidant. By increasing the enrichment of oxidant, the
nitrogen is in fact removed from the oxidant.
The equivalence coefficient for oxygen-enhanced combustion is defined as:
4
(
)
(
)
(
)
(2.4)
Combustion will be rich in oxidant if and rich in fuel if .
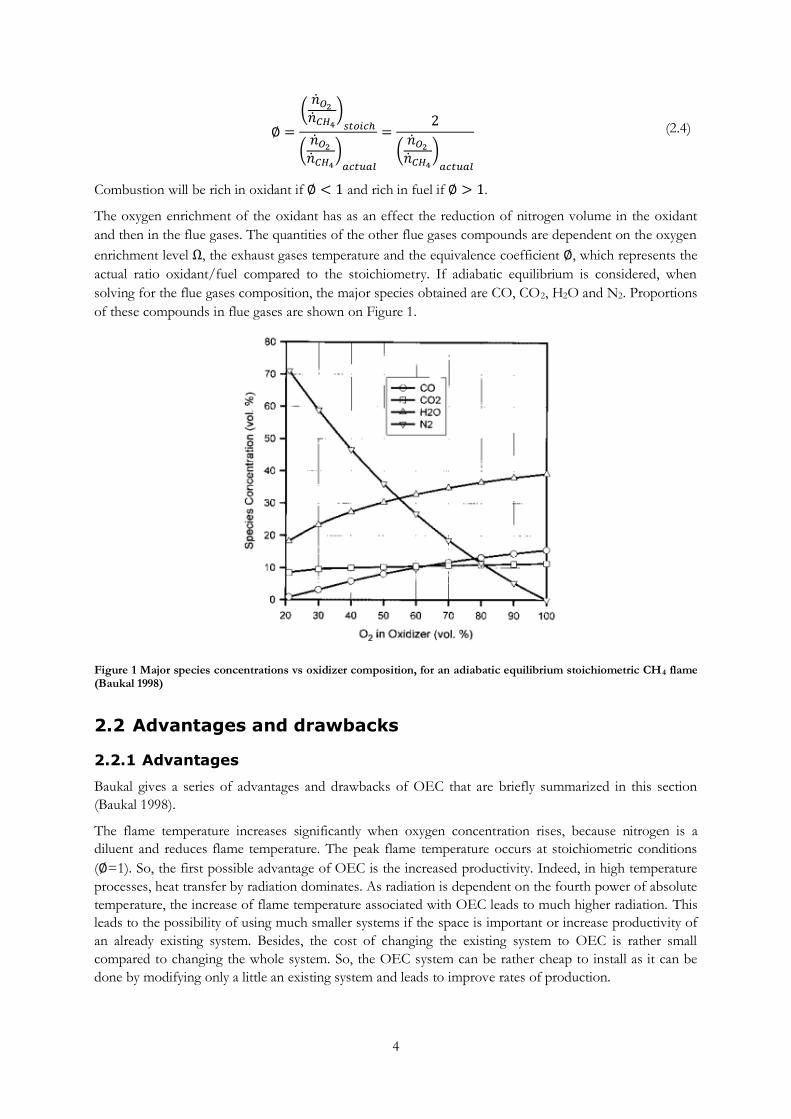
The oxygen enrichment of the oxidant has as an effect the reduction of nitrogen volume in the oxidant
and then in the flue gases. The quantities of the other flue gases compounds are dependent on the oxygen
enrichment level , the exhaust gases temperature and the equivalence coefficient , which represents the
actual ratio oxidant/fuel compared to the stoichiometry. If adiabatic equilibrium is considered, when
solving for the flue gases composition, the major species obtained are CO, CO2, H2O and N2. Proportions
of these compounds in flue gases are shown on Figure 1.
Figure 1 Major species concentrations vs oxidizer composition, for an adiabatic equilibrium stoichiometric CH4 flame (Baukal 1998)
2.2 Advantages and drawbacks
2.2.1 Advantages
Baukal gives a series of advantages and drawbacks of OEC that are briefly summarized in this section
(Baukal 1998).
The flame temperature increases significantly when oxygen concentration rises, because nitrogen is a
diluent and reduces flame temperature. The peak flame temperature occurs at stoichiometric conditions
( =1). So, the first possible advantage of OEC is the increased productivity. Indeed, in high temperature
processes, heat transfer by radiation dominates. As radiation is dependent on the fourth power of absolute
temperature, the increase of flame temperature associated with OEC leads to much higher radiation. This
leads to the possibility of using much smaller systems if the space is important or increase productivity of
an already existing system. Besides, the cost of changing the existing system to OEC is rather small
compared to changing the whole system. So, the OEC system can be rather cheap to install as it can be
done by modifying only a little an existing system and leads to improve rates of production.
5
OEC also leads to higher thermal efficiencies. Indeed, available heat increases when increasing oxygen
concentration, because there is less nitrogen. Thus, the increase in efficiency is very significant when using
an oxygen-enriched air. As a consequence, for a same amount of heat retrieved from combustion, less fuel
is required. Some systems already achieved fuel savings of up to 60%.
Flame characteristics are improved with OEC. Indeed, the upper flammability limits almost increases
linearly with the O2 concentration, whereas the lower one remains more or less constant. So, the
flammability range is broader, thus enabling the flame to exist under a wider range of conditions (this
includes a wider range of ).
Another possible advantage is in the volume of exhaust gases, that also induces reduction of particulate
emissions due to lower gas velocities at the system outlet. The reduction in the system size also inherently
induces lower construction costs and less space requirement.
Besides, OEC can have many different advantages that are specific to the process which is being
considered. For instance, in the glass industry, using higher temperatures allows for the product quality to
be improved.
2.2.2 Drawbacks
However, OEC can also present some drawbacks: there is the risk for overheating as temperatures are
generally higher and material should be adapted to these temperatures. Due to higher temperature
gradients, hot spots are more easily created and should be avoided. Besides, corrosive particulates can
create problems with the materials.
Furthermore, as a consequence of exhaust gases volume reduction, the convective heat transfer to the
load from exhaust gases can be reduced. NOx emissions can become higher as the temperature increases
thus enabling the production of more thermal NOx (produced at high temperatures from N2 in feed air).
There is also a potential risk of flashback. Indeed, as the flame velocity increases, the velocity of gases
should be higher in order to prevent flashbacks.
6
3 Oxygen production
3.1 Cryogenic processes
Presently, cryogenic air separation is the most efficient technology to produce large quantities of oxygen at
lowest costs (Smith and Klosek 2001). It can produce amounts of oxygen up to 3000t/day with purity
between 90 and 99.9% (Baukal 1998).
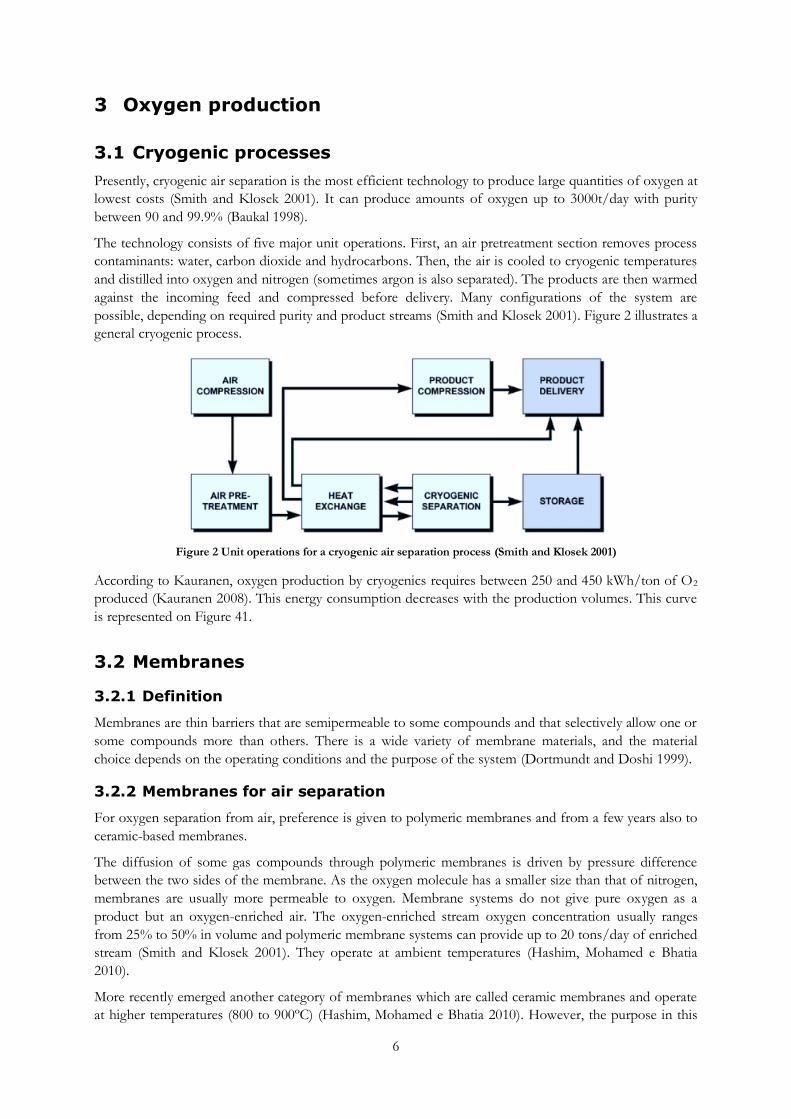
The technology consists of five major unit operations. First, an air pretreatment section removes process
contaminants: water, carbon dioxide and hydrocarbons. Then, the air is cooled to cryogenic temperatures
and distilled into oxygen and nitrogen (sometimes argon is also separated). The products are then warmed
against the incoming feed and compressed before delivery. Many configurations of the system are
possible, depending on required purity and product streams (Smith and Klosek 2001). Figure 2 illustrates a
general cryogenic process.
Figure 2 Unit operations for a cryogenic air separation process (Smith and Klosek 2001)
According to Kauranen, oxygen production by cryogenics requires between 250 and 450 kWh/ton of O2
produced (Kauranen 2008). This energy consumption decreases with the production volumes. This curve
is represented on Figure 41.
3.2 Membranes
3.2.1 Definition
Membranes are thin barriers that are semipermeable to some compounds and that selectively allow one or
some compounds more than others. There is a wide variety of membrane materials, and the material
choice depends on the operating conditions and the purpose of the system (Dortmundt and Doshi 1999).
3.2.2 Membranes for air separation
For oxygen separation from air, preference is given to polymeric membranes and from a few years also to
ceramic-based membranes.
The diffusion of some gas compounds through polymeric membranes is driven by pressure difference
between the two sides of the membrane. As the oxygen molecule has a smaller size than that of nitrogen,
membranes are usually more permeable to oxygen. Membrane systems do not give pure oxygen as a
product but an oxygen-enriched air. The oxygen-enriched stream oxygen concentration usually ranges
from 25% to 50% in volume and polymeric membrane systems can provide up to 20 tons/day of enriched
stream (Smith and Klosek 2001). They operate at ambient temperatures (Hashim, Mohamed e Bhatia
2010).
More recently emerged another category of membranes which are called ceramic membranes and operate
at higher temperatures (800 to 900ºC) (Hashim, Mohamed e Bhatia 2010). However, the purpose in this
7
study is to focus on polymeric membranes as they are more widely studied and already used in industrial
processes (Dortmundt and Doshi 1999).
3.2.3 Membrane choice
Two parameters that indicate the behavior of a membrane and that are thus important when selecting a
membrane are permeability (P) and selectivity (α). Permeability is related to the quantity of gas that can
pass through the membrane. As a consequence, for a given required mass flow of one gas compound
through the membrane, the higher the permeability will be, the lower the membrane area requirement.
Membrane area requirement has a cost, and tendency is to try to lower it. Permeability is commonly given
in Barrers (1 Barrer = 0.33 x 10⁻¹⁵ mol m/m² s Pa).
Membrane selectivity represents how much the membrane will let go through one compound over
another. In the process of oxygen separation from air, the membrane selectivity of O2 over N2 is defined
by:
⁄ (3.1)
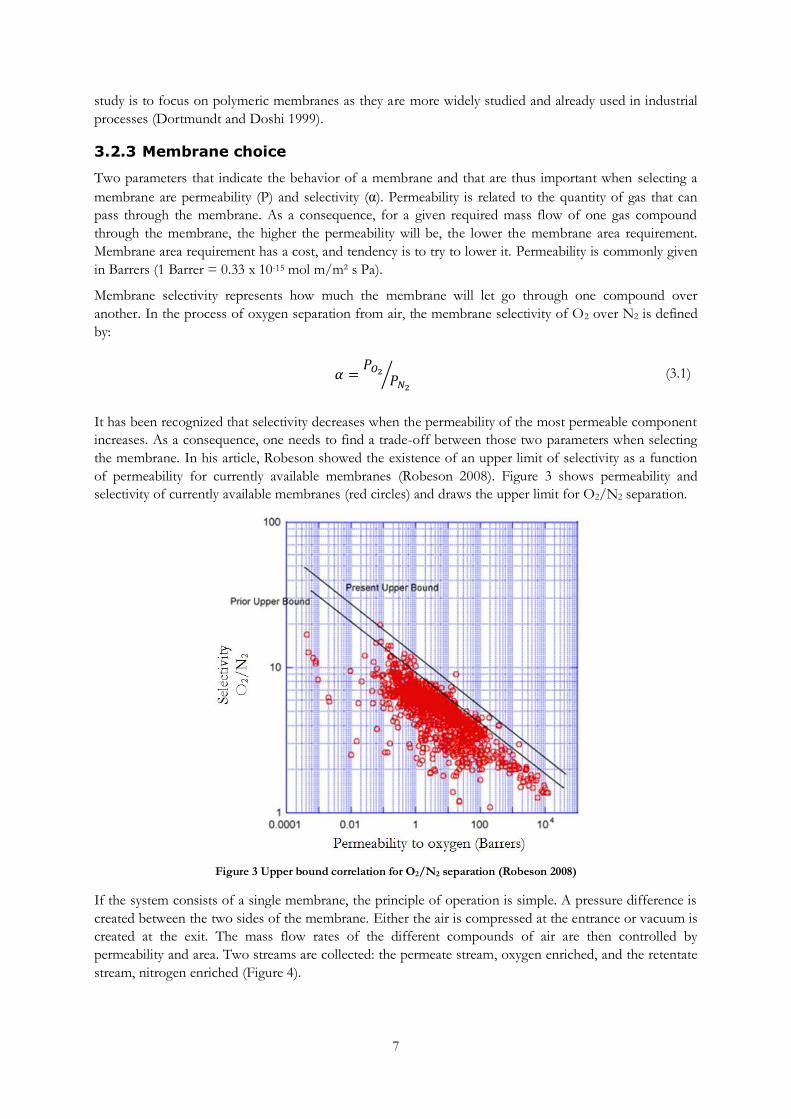
It has been recognized that selectivity decreases when the permeability of the most permeable component
increases. As a consequence, one needs to find a trade-off between those two parameters when selecting
the membrane. In his article, Robeson showed the existence of an upper limit of selectivity as a function
of permeability for currently available membranes (Robeson 2008). Figure 3 shows permeability and
selectivity of currently available membranes (red circles) and draws the upper limit for O2/N2 separation.
Figure 3 Upper bound correlation for O2/N2 separation (Robeson 2008)
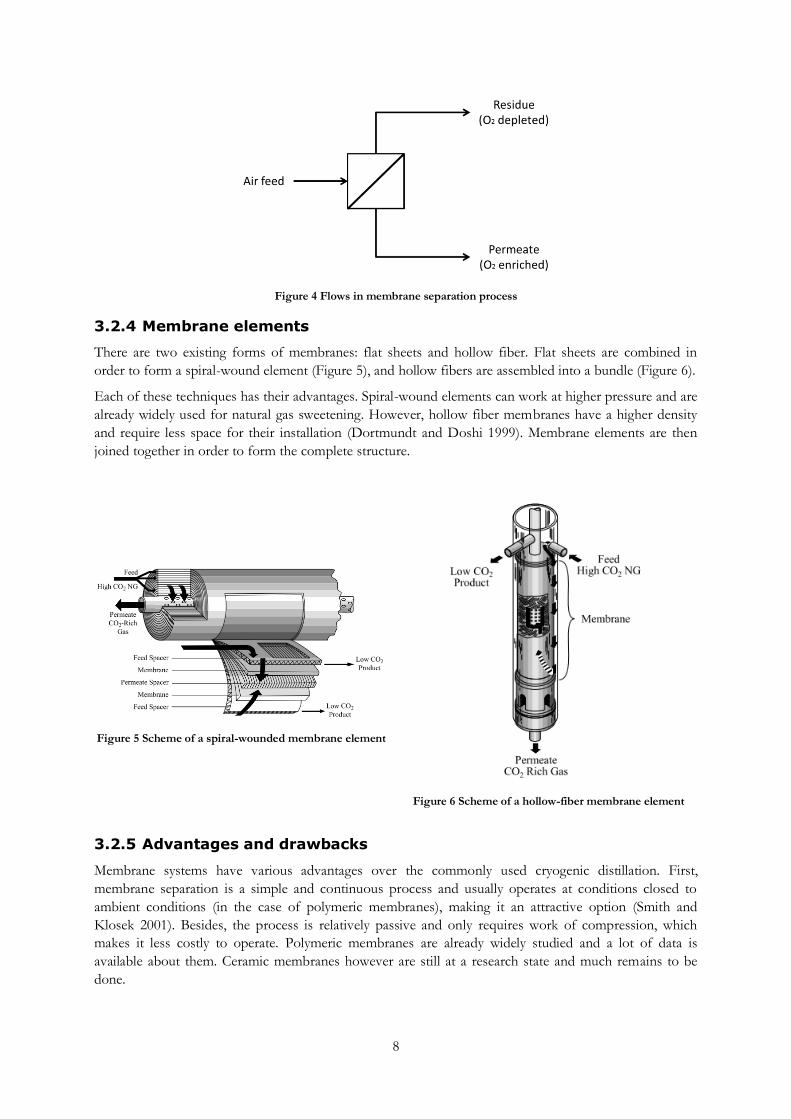
If the system consists of a single membrane, the principle of operation is simple. A pressure difference is
created between the two sides of the membrane. Either the air is compressed at the entrance or vacuum is
created at the exit. The mass flow rates of the different compounds of air are then controlled by
permeability and area. Two streams are collected: the permeate stream, oxygen enriched, and the retentate
stream, nitrogen enriched (Figure 4).
8
Figure 4 Flows in membrane separation process
3.2.4 Membrane elements
There are two existing forms of membranes: flat sheets and hollow fiber. Flat sheets are combined in
order to form a spiral-wound element (Figure 5), and hollow fibers are assembled into a bundle (Figure 6).
Each of these techniques has their advantages. Spiral-wound elements can work at higher pressure and are
already widely used for natural gas sweetening. However, hollow fiber membranes have a higher density
and require less space for their installation (Dortmundt and Doshi 1999). Membrane elements are then
joined together in order to form the complete structure.
Figure 5 Scheme of a spiral-wounded membrane element
Figure 6 Scheme of a hollow-fiber membrane element
3.2.5 Advantages and drawbacks
Membrane systems have various advantages over the commonly used cryogenic distillation. First,
membrane separation is a simple and continuous process and usually operates at conditions closed to
ambient conditions (in the case of polymeric membranes), making it an attractive option (Smith and
Klosek 2001). Besides, the process is relatively passive and only requires work of compression, which
makes it less costly to operate. Polymeric membranes are already widely studied and a lot of data is
available about them. Ceramic membranes however are still at a research state and much remains to be
done.
9
However, membrane requires high initial investments compared to existing processes (Robeson 2008) and
can only produce oxygen-enriched air and not pure oxygen. They also produce at lower flow rates than
cryogenic separation, but with ongoing research, membrane processes will improve in cost and energy
efficiency and could challenge cryogenic technology for smaller flow rates and when lower enrichment
levels are required.
3.3 Pressure/Vacuum swing adsorption (PSA/VSA)
3.3.1 Operation principle
PSA and VSA processes are based on adsorption of one or more components of a gas mixture on a bed.
Some synthetic or natural materials preferentially adsorb nitrogen. This is the case of zeolites for instance,
where non-uniform electric fields cause nitrogen to be preferentially adsorbed, and when a mixture of
oxygen/nitrogen goes through a zeolite bed, an oxygen-enriched stream is created at the outlet. Zeolites
are a typical material used for oxygen separation by adsorption (Smith and Klosek 2001).
After being saturated with nitrogen, the bed is regenerated using total or partial pressure decrease. The
difference between PSA and VSA is only the range of pressures that are used. PSA usually works between
the ambient pressure and a higher one and VSA between ambient pressure and a lower one (vacuum).
They have been used as a cheap and efficient alternative to conventional processes of separation of gases.
The first PSA system used for the separation of oxygen from air was implemented in 1964 (Cruz, et al.
2003).
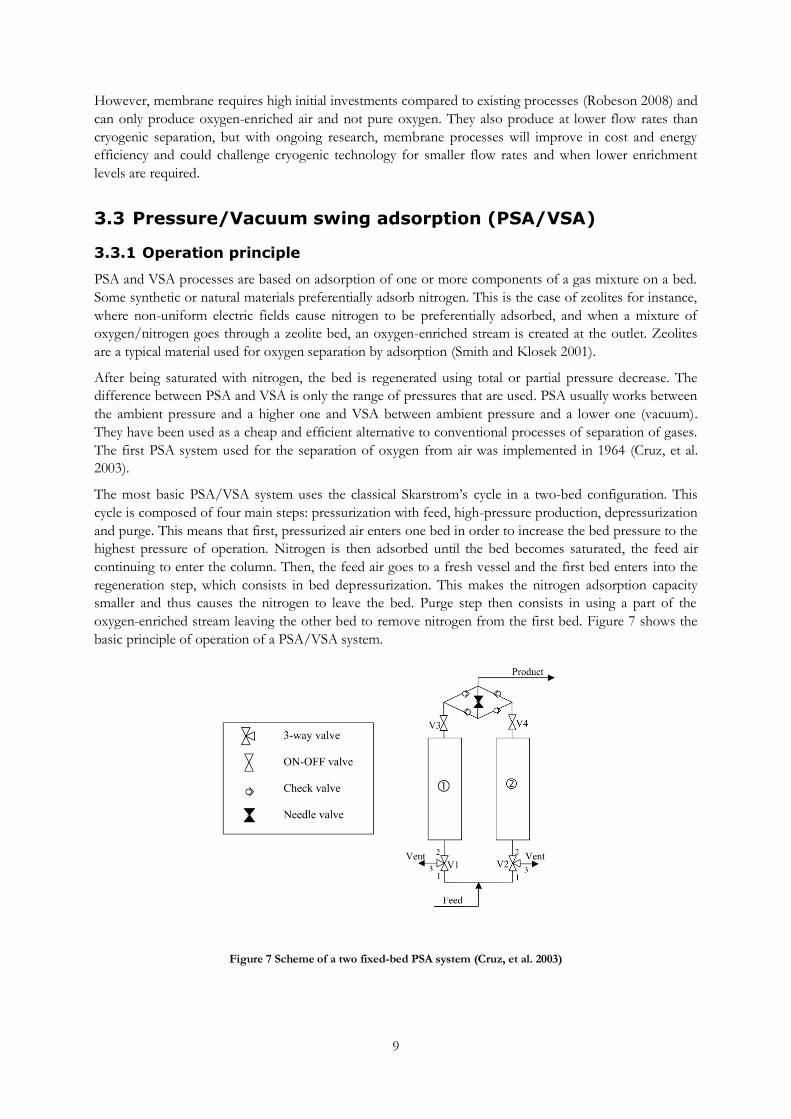
The most basic PSA/VSA system uses the classical Skarstrom’s cycle in a two-bed configuration. This
cycle is composed of four main steps: pressurization with feed, high-pressure production, depressurization
and purge. This means that first, pressurized air enters one bed in order to increase the bed pressure to the
highest pressure of operation. Nitrogen is then adsorbed until the bed becomes saturated, the feed air
continuing to enter the column. Then, the feed air goes to a fresh vessel and the first bed enters into the
regeneration step, which consists in bed depressurization. This makes the nitrogen adsorption capacity
smaller and thus causes the nitrogen to leave the bed. Purge step then consists in using a part of the
oxygen-enriched stream leaving the other bed to remove nitrogen from the first bed. Figure 7 shows the
basic principle of operation of a PSA/VSA system.
Figure 7 Scheme of a two fixed-bed PSA system (Cruz, et al. 2003)
10
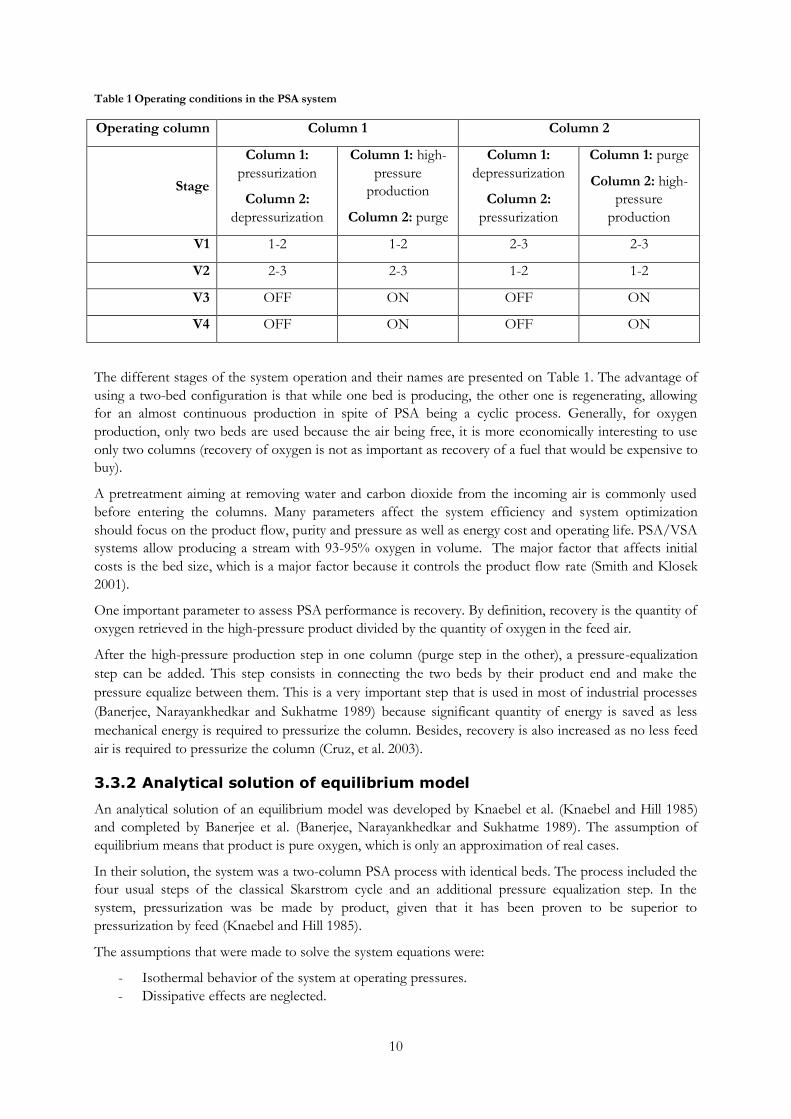
Table 1 Operating conditions in the PSA system
Operating column Column 1 Column 2
Stage
Column 1:
pressurization
Column 2:
depressurization
Column 1: high-
pressure
production
Column 2: purge
Column 1:
depressurization
Column 2:
pressurization
Column 1: purge
Column 2: high-
pressure
production
V1 1-2 1-2 2-3 2-3
V2 2-3 2-3 1-2 1-2
V3 OFF ON OFF ON
V4 OFF ON OFF ON
The different stages of the system operation and their names are presented on Table 1. The advantage of
using a two-bed configuration is that while one bed is producing, the other one is regenerating, allowing
for an almost continuous production in spite of PSA being a cyclic process. Generally, for oxygen
production, only two beds are used because the air being free, it is more economically interesting to use
only two columns (recovery of oxygen is not as important as recovery of a fuel that would be expensive to
buy).
A pretreatment aiming at removing water and carbon dioxide from the incoming air is commonly used
before entering the columns. Many parameters affect the system efficiency and system optimization
should focus on the product flow, purity and pressure as well as energy cost and operating life. PSA/VSA
systems allow producing a stream with 93-95% oxygen in volume. The major factor that affects initial
costs is the bed size, which is a major factor because it controls the product flow rate (Smith and Klosek
2001).
One important parameter to assess PSA performance is recovery. By definition, recovery is the quantity of
oxygen retrieved in the high-pressure product divided by the quantity of oxygen in the feed air.
After the high-pressure production step in one column (purge step in the other), a pressure-equalization
step can be added. This step consists in connecting the two beds by their product end and make the
pressure equalize between them. This is a very important step that is used in most of industrial processes
(Banerjee, Narayankhedkar and Sukhatme 1989) because significant quantity of energy is saved as less
mechanical energy is required to pressurize the column. Besides, recovery is also increased as no less feed
air is required to pressurize the column (Cruz, et al. 2003).
3.3.2 Analytical solution of equilibrium model
An analytical solution of an equilibrium model was developed by Knaebel et al. (Knaebel and Hill 1985)
and completed by Banerjee et al. (Banerjee, Narayankhedkar and Sukhatme 1989). The assumption of
equilibrium means that product is pure oxygen, which is only an approximation of real cases.
In their solution, the system was a two-column PSA process with identical beds. The process included the
four usual steps of the classical Skarstrom cycle and an additional pressure equalization step. In the
system, pressurization was be made by product, given that it has been proven to be superior to
pressurization by feed (Knaebel and Hill 1985).
The assumptions that were made to solve the system equations were:
- Isothermal behavior of the system at operating pressures.
- Dissipative effects are neglected.
11
Most important equations are described in this section, and for more detailed resolution, see Annex II. A
mass balance equation in one column can be written, for the total mass and for nitrogen respectively:
(3.2)
( )
(3.3)
To assess the number of moles absorbed per unit volume n, equilibrium isotherm are used. The simplest
model is the Henry’s law which states that:
(3.4)
Ci being the molar concentration of species i in the fluid phase and the Henry’s law coefficient. This
concentration can be written (using the ideal gas law):
(3.5)
As a result:
(
)
(3.6)
Solving these equations for each step leads to the number of moles entering and leaving the columns in
each step:
√ (3.7)
(3.8)
(3.9)
(3.10)
The product recovery can then be defined as:
(3.11)
-12-
4 Methodology
4.1 Thermodynamic cycles
Two thermodynamic cycles were defined, that consist in:
A cycle including oxygen separation by polymeric membrane and oxygen-enhanced combustion.
A cycle including oxygen separation by PSA and oxygen-enhanced combustion.
4.1.1 Cycle including membrane
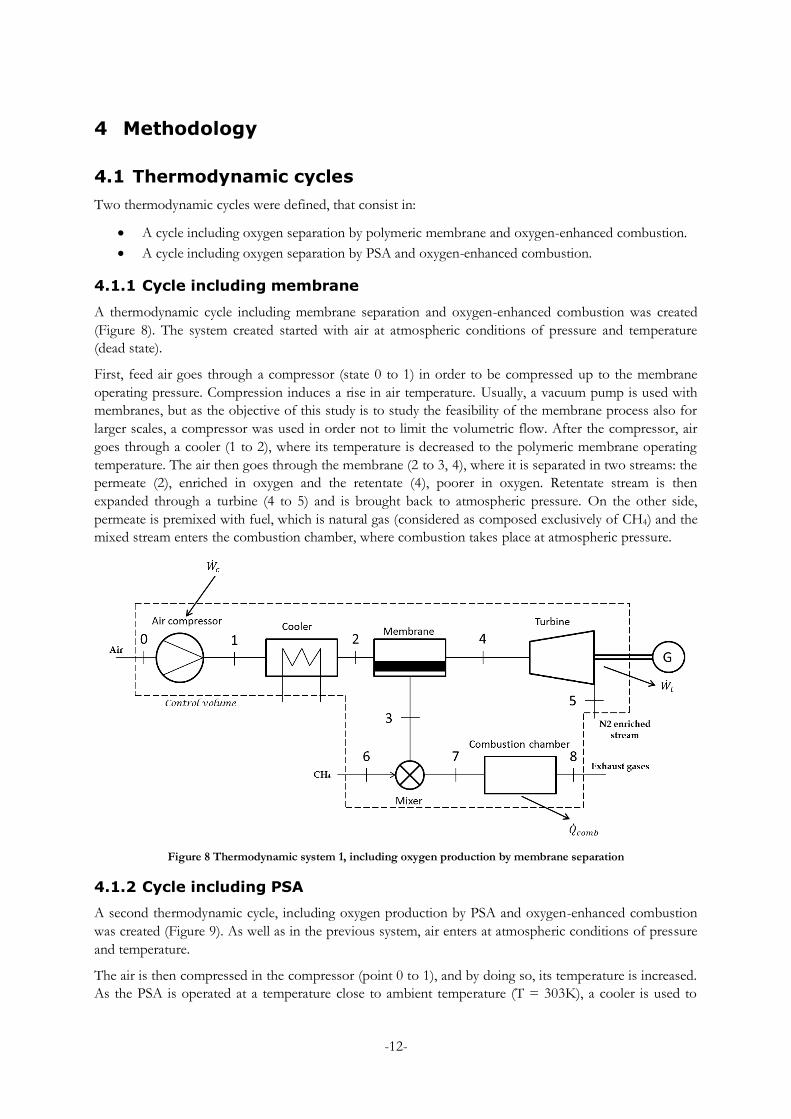
A thermodynamic cycle including membrane separation and oxygen-enhanced combustion was created
(Figure 8). The system created started with air at atmospheric conditions of pressure and temperature
(dead state).
First, feed air goes through a compressor (state 0 to 1) in order to be compressed up to the membrane
operating pressure. Compression induces a rise in air temperature. Usually, a vacuum pump is used with
membranes, but as the objective of this study is to study the feasibility of the membrane process also for
larger scales, a compressor was used in order not to limit the volumetric flow. After the compressor, air
goes through a cooler (1 to 2), where its temperature is decreased to the polymeric membrane operating
temperature. The air then goes through the membrane (2 to 3, 4), where it is separated in two streams: the
permeate (2), enriched in oxygen and the retentate (4), poorer in oxygen. Retentate stream is then
expanded through a turbine (4 to 5) and is brought back to atmospheric pressure. On the other side,
permeate is premixed with fuel, which is natural gas (considered as composed exclusively of CH4) and the
mixed stream enters the combustion chamber, where combustion takes place at atmospheric pressure.
Figure 8 Thermodynamic system 1, including oxygen production by membrane separation
4.1.2 Cycle including PSA
A second thermodynamic cycle, including oxygen production by PSA and oxygen-enhanced combustion
was created (Figure 9). As well as in the previous system, air enters at atmospheric conditions of pressure
and temperature.
The air is then compressed in the compressor (point 0 to 1), and by doing so, its temperature is increased.
As the PSA is operated at a temperature close to ambient temperature (T = 303K), a cooler is used to
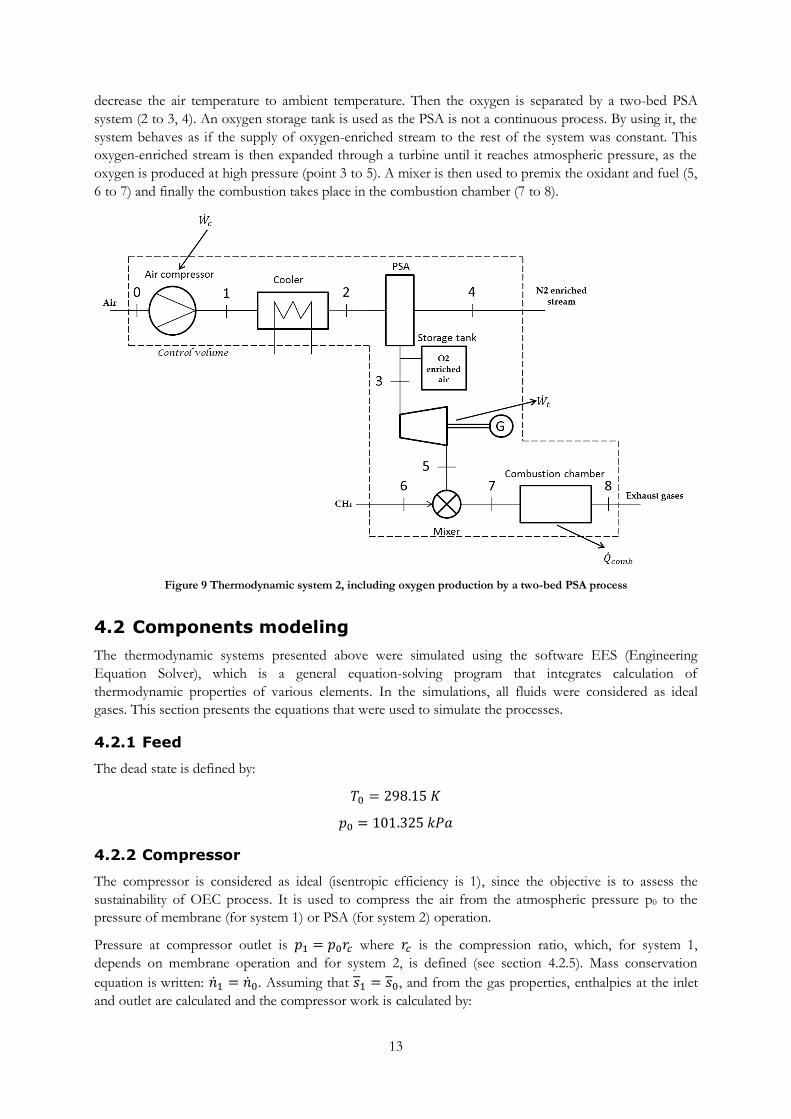
13
decrease the air temperature to ambient temperature. Then the oxygen is separated by a two-bed PSA
system (2 to 3, 4). An oxygen storage tank is used as the PSA is not a continuous process. By using it, the
system behaves as if the supply of oxygen-enriched stream to the rest of the system was constant. This
oxygen-enriched stream is then expanded through a turbine until it reaches atmospheric pressure, as the
oxygen is produced at high pressure (point 3 to 5). A mixer is then used to premix the oxidant and fuel (5,
6 to 7) and finally the combustion takes place in the combustion chamber (7 to 8).
Figure 9 Thermodynamic system 2, including oxygen production by a two-bed PSA process
4.2 Components modeling
The thermodynamic systems presented above were simulated using the software EES (Engineering
Equation Solver), which is a general equation-solving program that integrates calculation of
thermodynamic properties of various elements. In the simulations, all fluids were considered as ideal
gases. This section presents the equations that were used to simulate the processes.
4.2.1 Feed
The dead state is defined by:
4.2.2 Compressor
The compressor is considered as ideal (isentropic efficiency is 1), since the objective is to assess the
sustainability of OEC process. It is used to compress the air from the atmospheric pressure p0 to the
pressure of membrane (for system 1) or PSA (for system 2) operation.
Pressure at compressor outlet is where is the compression ratio, which, for system 1,
depends on membrane operation and for system 2, is defined (see section 4.2.5). Mass conservation
equation is written: . Assuming that , and from the gas properties, enthalpies at the inlet
and outlet are calculated and the compressor work is calculated by:
14
( ) (4.1)
4.2.3 Cooler
Cooler is needed between the compressor and the membrane in order for the gas to be decreased to
membrane/PSA operating temperature ( ). The cooler is simulated as an infinite heat exchanger.
Pressure remains constant: . In the cooler, molar flow is conserved: and the composition
of gases remains the same. The heat delivered to atmosphere from the heat exchanger is:
( ) (4.2)
The enthalpies are calculated from the gases properties at given temperatures.
4.2.4 Membrane
Only the two species nitrogen (79%) and oxygen (21%) were considered in the simulations. Table 2 shows
the membrane operating parameters.
Table 2 Conditions at membrane inlet and outlets
Pressure Feed
Permeate
Retentate
Temperature
The molar flow rate of any compound i that crosses the membrane is given by:
(
)
(4.3)
In this equation, is the molar flow rate of compound i, A is the membrane area, the permeability of
the membrane to component i, L the membrane thickness and the difference of partial pressure of
component i on the two sides of the membrane.
It was considered that the partial pressure difference is taken from the permeate and retentate streams
compositions (Tessendorf, Gani and Michelsen 1999). Using the notations as given on Figure 8, the
equation for the molar flow rate becomes:
(
) ( ) { }
(4.4)
The second equation which is necessary is the mass conservation for each species:
{ } (4.5)
Which in terms of total molar flow rates becomes:
{ } (4.6)
Equations of the composition of each stream are needed:
(4.7)
(4.8)
Finally, the energy equation is written:
15
(4.9)
Membrane selectivity and permeability are calculated for an optimal membrane which corresponds to a
membrane on the upper bound defined by Robeson (Robeson 2008). From this graph (Figure 3), an
equation for the present upper bound is found:
(4.10)
(4.11)
4.2.5 Pressure Swing Adsorption columns
The pressure swing adsorption columns were modeled using the analytical solution described in section
3.3.2. The modeled system is a two-column PSA process with identical beds of zeolite 5A, which is the
most used material for oxygen separation (Sircar, Rao and Golden 1998).
Table 3 shows the PSA thermodynamic conditions. The PSA operates between a low pressure which is
the atmospheric pressure and a high pressure which is equal to the pressure after the compressor.
Table 3 Conditions at PSA inlet and outlets
Pressure Feed
Permeate
Retentate
Temperature
The equations that are necessary for the simulations are:
- Mass balance equation:
{ } (4.12)
- Streams composition:
{
(4.13)
- Recovery calculation:
(4.14)
- Recovery definition:
(4.15)
- The energy equation which is exactly the same as for the membrane system (5.9).
The values of the different parameters were retrieved from data from the literature (see Appendix B).
4.2.6 Turbine
The turbine is considered as ideal, as well as the compressor (isentropic efficiency equal to 1, mechanical
and electrical efficiencies are also 1). At the turbine inlet, temperature is equal to the temperature of
isothermal operation of membrane or PSA: and pressure is the pressure of compressed air from
16
air compressor: . As for the compressor, enthalpies at the inlet and outlet are calculated
assuming that and that the turbine outlet pressure is the atmospheric pressure: .
The turbine work output is then given by:
( ) (4.16)
The definitions for the PSA cycle are the same except that point 4 is replaced by point 3.
4.2.7 Mixer
The mixer is used to premix fuel (natural gas) and oxidant. Natural gas is considered to be composed of
100% methane for simplification of the analysis. The equations for this mixer are the mass balance
equation which is, in the case of the membrane cycle:
(4.17)
And the energy conservation:
(4.18)
For the PSA cycle, there is the same set of equations where the subscript 3 is replaced by 5.
4.2.8 Combustion chamber
In order to solve the equations of combustion, the model explained by Maidana et al. was used (Maidana,
Carotenuto and Schneider, Analysis of oxygen-enhanced combustion of gas power cycle 2010). This
model was developed as an EES code, assuming that all the species are in chemical equilibrium after
combustion at the adiabatic flame temperature. It applies for the combustion of air and oxygen-enriched
air with natural gas (considering that natural gas is only CH4) and includes the production of NO, CO,
CO2, which are the three major pollutants created from the combustion of air with natural gas and H2,
OH, O and H that are created in smaller quantities (Maidana, Carotenuto and Schneider, Analysis of
oxygen-enhanced combustion of gas power cycle 2010).
The model is based on the minimization of the Gibbs function of the system composed by the gaseous
species in the combustion chamber. The most important chemical reactions that can occur within the
combustion chamber are written, and for each reaction of the type the
equilibrium constant is defined as:
(
)
(4.19)
This constant is related to the Gibbs energy variation in the reaction by:
⁄ (4.20)
(Maidana, Carotenuto and Schneider, Analysis of oxygen-enhanced combustion of gas power cycle 2010)
As in the present case, the objective of the combustion chamber is to transfer heat to the load by
convection and radiation, the temperature out of the combustion chamber is desirably lower than the
adiabatic flame temperature (for which the heat transfer is zero) and this temperature determines the
exhaust gases chemical composition. In the present study, the outlet temperature was fixed as:
.
And the pressure in the combustion chamber is the atmospheric pressure, .
These equations were implemented in EES, to determine the exhaust gases composition. To determine
the heat transferred to the load, an energy balance equation is written:
17
(4.21)
The combustion model was compared to data from the literature and was shown to be an accurate model
(see Appendix A).
4.3 Indicators for results analysis
4.3.1 Fuel savings
Fuel savings correspond to the percentage of fuel that is saved when producing the same quantity of heat,
with enriched and atmospheric air. Fuel savings are defined as:
[ ( )
( )
] (4. 22)
4.3.2 Energetic analysis
There are three main energy flows in the system:
- The compressor power
- The turbine power
- The heat transfer to the load in the combustion chamber
Our study focus mainly on these flows, so the system total efficiency was defined as:
(4.23)
4.3.3 Exergetic analysis
Availability and exergy balance 4.3.3.1
The exergy, which is equal to the availability, at one point j of the system is composed of two parts:
physical exergy and chemical exergy. The standard molar chemical exergy was considered to be the
one given by the Model II in the book from Bejan et al. (Bejan, Tsatsaronis and Moran 1996).
The destroyed exergy in one component (represented by the controle volume cv) is given by:
∑(
) ∑ ∑ (4.24)
The term ∑(
) represents the exergy transferred by heat. In the case of a heat exchanger for
instance, this can represent the exergy which is transferred from one flow to the other. This term will be
used later as:
∑(
) (4.25)
Exergetic efficiencies 4.3.3.2
For each component, an exergetic efficiency can be defined, depending on the utilization of this
component (Bejan, Tsatsaronis and Moran 1996). Definitions are summarized in Table 4.
18
Table 4 Definition of the components exergetic efficiencies
Membrane system PSA system
Component Position in the system Exergetic efficiency Position in the system Exergetic efficiency
Compressor
Cooler
Membrane
Turbine
Mixer
Combustion
chamber
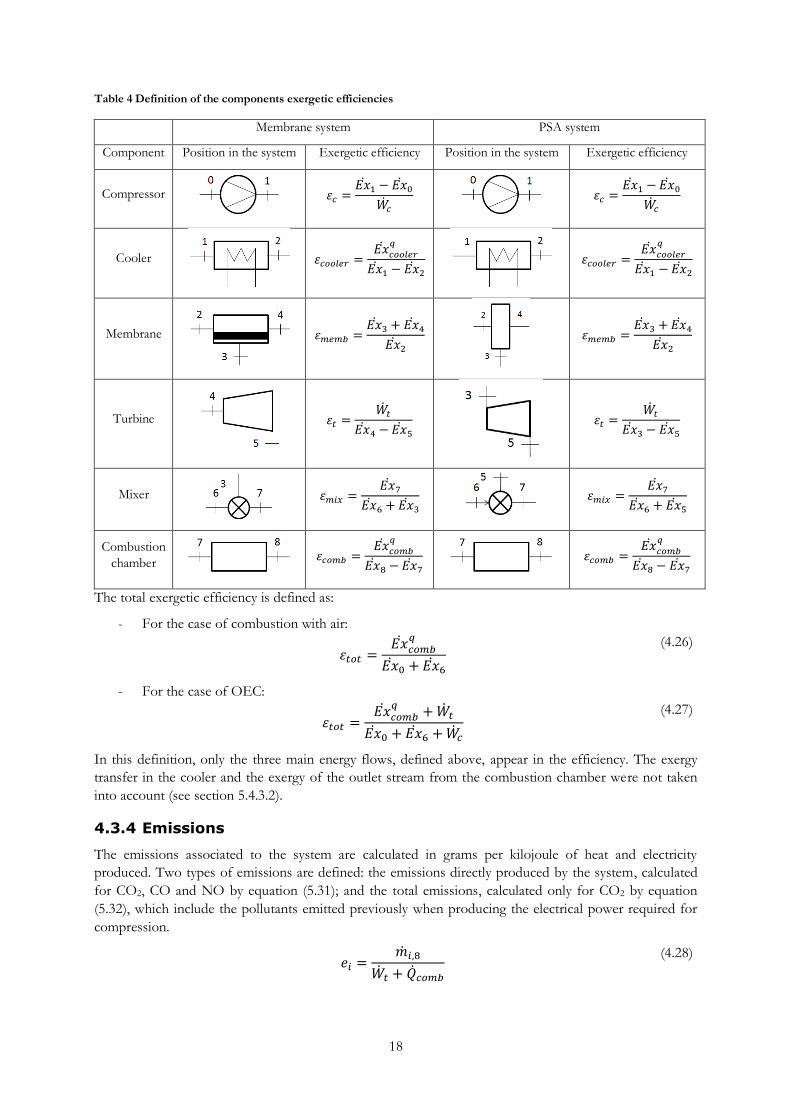
The total exergetic efficiency is defined as:
- For the case of combustion with air:
(4.26)
- For the case of OEC:
(4.27)
In this definition, only the three main energy flows, defined above, appear in the efficiency. The exergy
transfer in the cooler and the exergy of the outlet stream from the combustion chamber were not taken
into account (see section 5.4.3.2).
4.3.4 Emissions
The emissions associated to the system are calculated in grams per kilojoule of heat and electricity
produced. Two types of emissions are defined: the emissions directly produced by the system, calculated
for CO2, CO and NO by equation (5.31); and the total emissions, calculated only for CO2 by equation
(5.32), which include the pollutants emitted previously when producing the electrical power required for
compression.
(4.28)
19
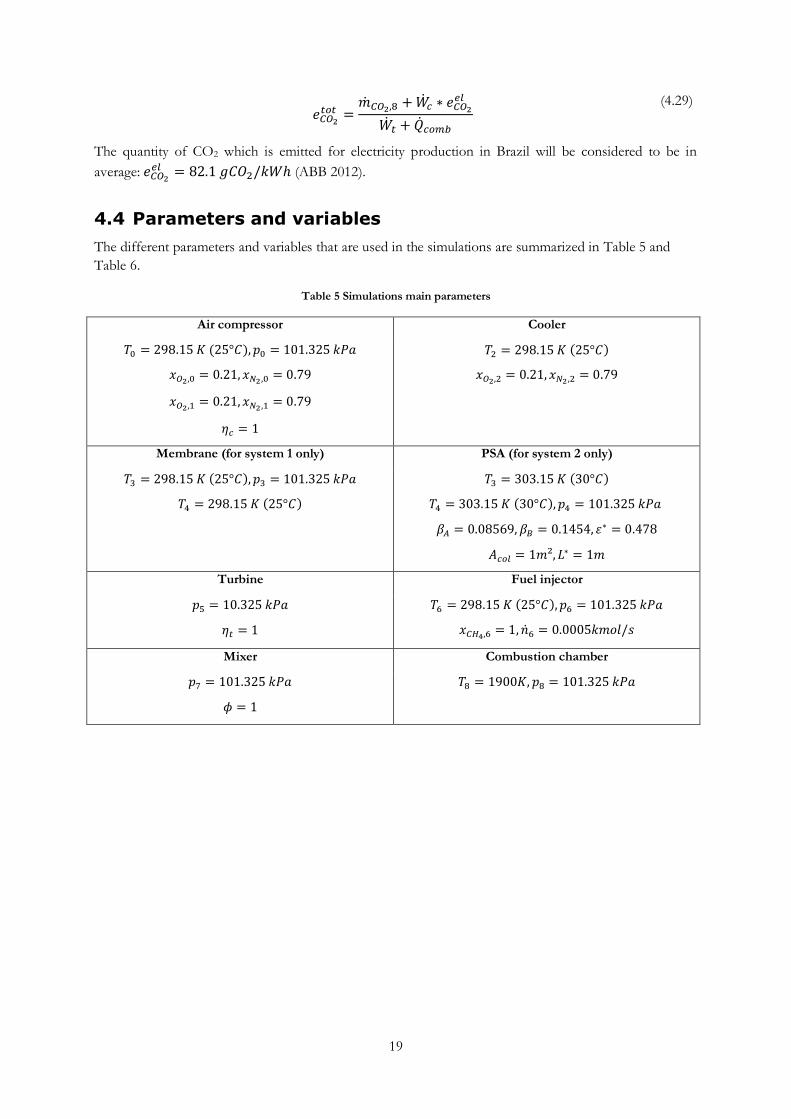
(4.29)
The quantity of CO2 which is emitted for electricity production in Brazil will be considered to be in
average:
(ABB 2012).
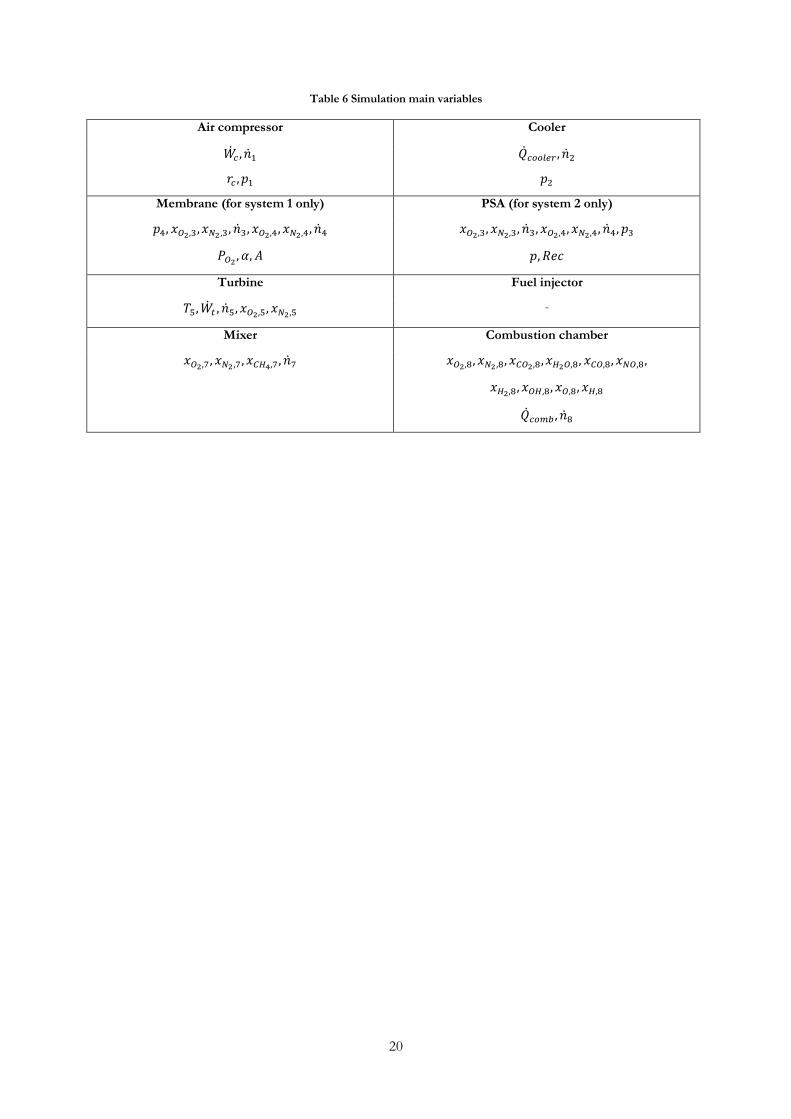
4.4 Parameters and variables
The different parameters and variables that are used in the simulations are summarized in Table 5 and
Table 6.
Table 5 Simulations main parameters
Air compressor Cooler
Membrane (for system 1 only) PSA (for system 2 only)
Turbine Fuel injector
Mixer Combustion chamber
20
Table 6 Simulation main variables
Air compressor Cooler
Membrane (for system 1 only) PSA (for system 2 only)
Turbine Fuel injector
-
Mixer Combustion chamber
-21-
5 Results and discussion
5.1 Base case
For the simulations, a base case is defined, based on a fixed molar flow rate of CH4 (this value was taken
from the previous work by Maidana et al.):
In this base case, combustion occurs without air enrichment. For the stoichiometric combustion of this
quantity of natural gas in air, is required the quantity of air:
In the stoichiometric case, the adiabatic flame temperature is 2223K. The temperature after the
combustion chamber was fixed:
In this case, the heat exchanged in the combustion chamber is:
Emissions of the three major pollutants, given on the basis of heat released during combustion , are:
It was proven that, when making the fuel molar flow vary, the results are the same for the emissions and
efficiencies and are proportional to the fuel flow rate for the area, compressor and turbine powers, heat
from combustion.
5.2 Combustion under stoichiometric conditions and constant
fuel feed
5.2.1 Energy flows, volume and fuel savings
The case studied considered combustion of natural gas with enriched air at stoichiometric conditions
( =1). The feed stream of fuel is maintained constant and equal to 0.0005 kmol/s (as in the base case).
Under these conditions, the molar flow rate of the oxygen into the combustion chamber is constant, as
required to ensure stoichiometry, but the total oxidant flow rate is reduced as the oxidant is enriched
(enrichment in this case means removing nitrogen from the feed) (Figure 10).
22
Figure 10 Molar flow rates of oxidant. Total (black line), O2 (red line) and N2 (blue line).
For practical reasons, only the second subsystem (composed of 3, 6, 7, 8) is considered in this section,
which allows concentrations of O2 up to 100%. Then, the membrane/PSA will be coupled to this system.
Results are presented as a function of the O2 volume fraction in the oxidant.
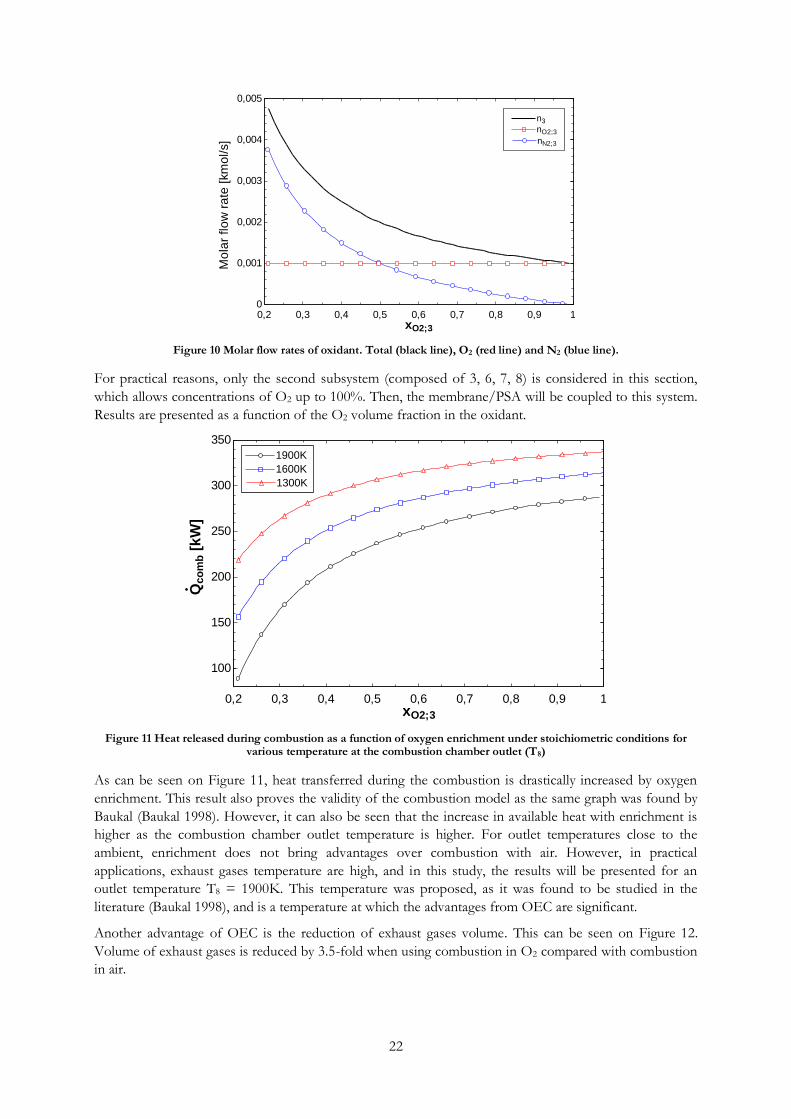
Figure 11 Heat released during combustion as a function of oxygen enrichment under stoichiometric conditions for various temperature at the combustion chamber outlet (T8)
As can be seen on Figure 11, heat transferred during the combustion is drastically increased by oxygen
enrichment. This result also proves the validity of the combustion model as the same graph was found by
Baukal (Baukal 1998). However, it can also be seen that the increase in available heat with enrichment is
higher as the combustion chamber outlet temperature is higher. For outlet temperatures close to the
ambient, enrichment does not bring advantages over combustion with air. However, in practical
applications, exhaust gases temperature are high, and in this study, the results will be presented for an
outlet temperature T8 = 1900K. This temperature was proposed, as it was found to be studied in the
literature (Baukal 1998), and is a temperature at which the advantages from OEC are significant.
Another advantage of OEC is the reduction of exhaust gases volume. This can be seen on Figure 12.
Volume of exhaust gases is reduced by 3.5-fold when using combustion in O2 compared with combustion
in air.
0,2 0,3 0,4 0,5 0,6 0,7 0,8 0,9 10
0,001
0,002
0,003
0,004
0,005
xO2;3
Mo
lar
flo
w r
ate
[km
ol/s]
n3n3
nO2;3nO2;3
nN2;3nN2;3
0,2 0,3 0,4 0,5 0,6 0,7 0,8 0,9 1
100
150
200
250
300
350
xO2;3
Qco
mb [
kW
]
1900K1900K
1600K1600K
1300K1300K
23
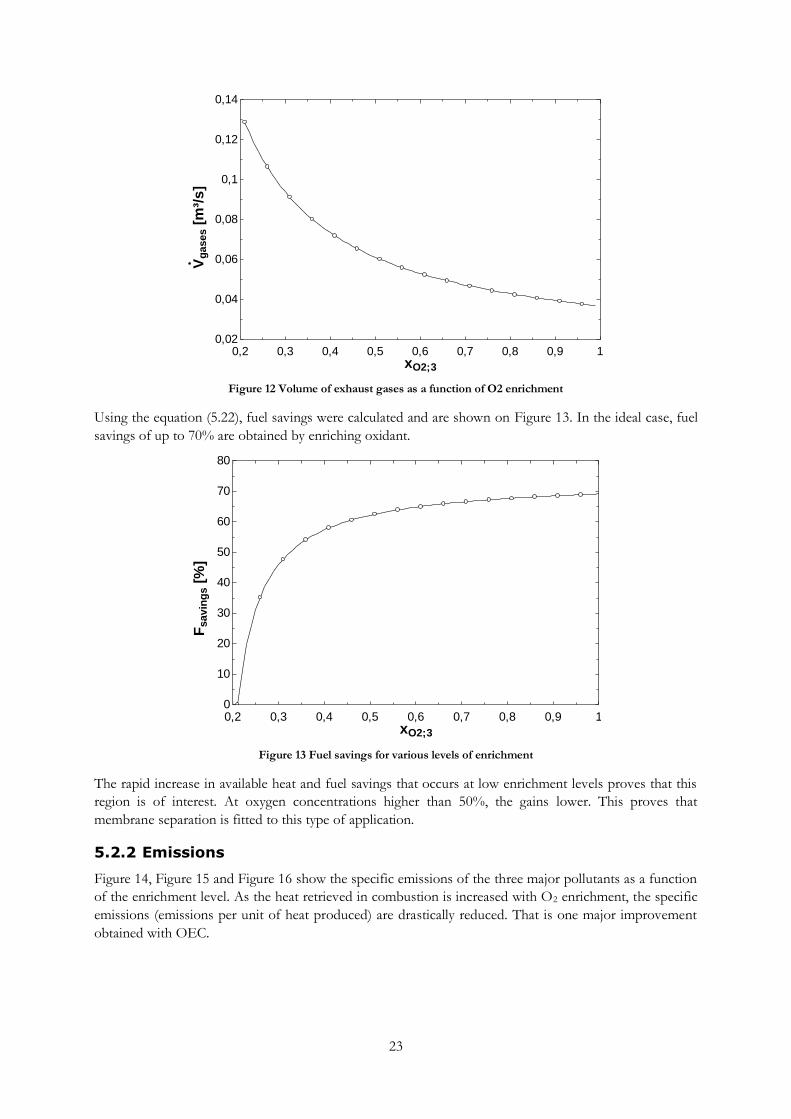
Figure 12 Volume of exhaust gases as a function of O2 enrichment
Using the equation (5.22), fuel savings were calculated and are shown on Figure 13. In the ideal case, fuel
savings of up to 70% are obtained by enriching oxidant.
Figure 13 Fuel savings for various levels of enrichment
The rapid increase in available heat and fuel savings that occurs at low enrichment levels proves that this
region is of interest. At oxygen concentrations higher than 50%, the gains lower. This proves that
membrane separation is fitted to this type of application.
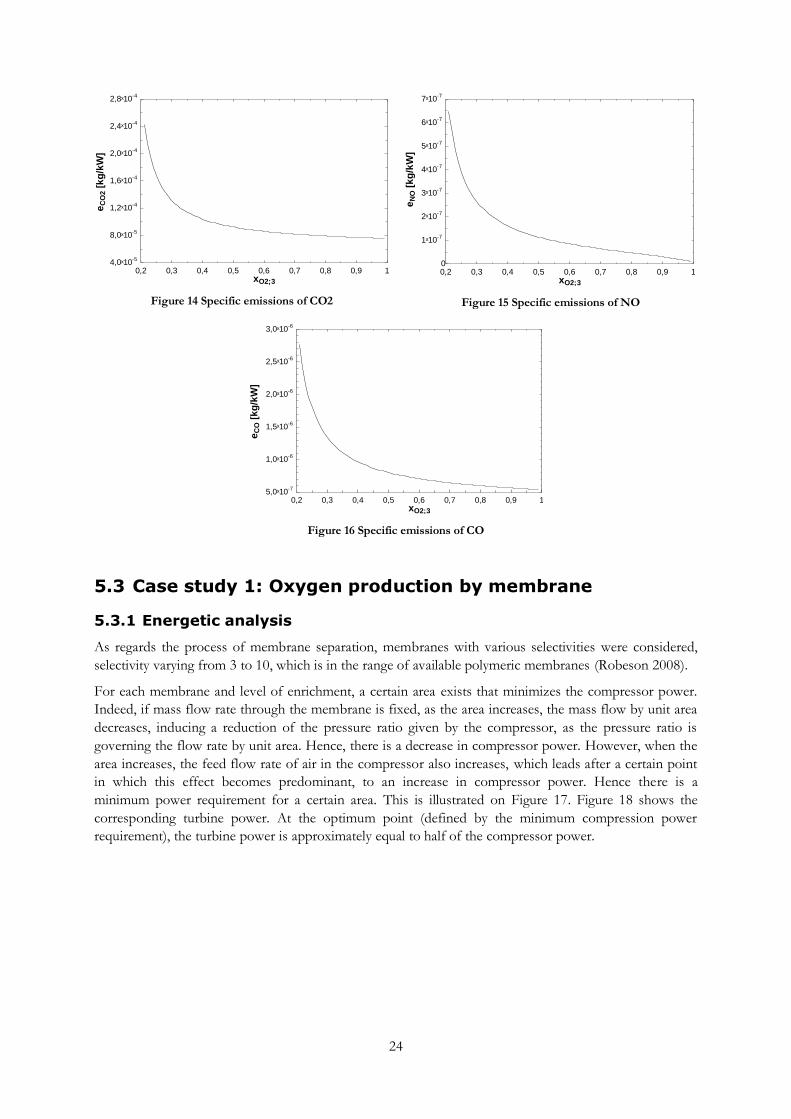
5.2.2 Emissions
Figure 14, Figure 15 and Figure 16 show the specific emissions of the three major pollutants as a function
of the enrichment level. As the heat retrieved in combustion is increased with O2 enrichment, the specific
emissions (emissions per unit of heat produced) are drastically reduced. That is one major improvement
obtained with OEC.
0,2 0,3 0,4 0,5 0,6 0,7 0,8 0,9 10,02
0,04
0,06
0,08
0,1
0,12
0,14
xO2;3
Vg
ases [
m³/
s]
0,2 0,3 0,4 0,5 0,6 0,7 0,8 0,9 10
10
20
30
40
50
60
70
80
xO2;3
Fsavin
gs [
%]
24
Figure 14 Specific emissions of CO2
Figure 15 Specific emissions of NO
Figure 16 Specific emissions of CO
5.3 Case study 1: Oxygen production by membrane
5.3.1 Energetic analysis
As regards the process of membrane separation, membranes with various selectivities were considered,
selectivity varying from 3 to 10, which is in the range of available polymeric membranes (Robeson 2008).
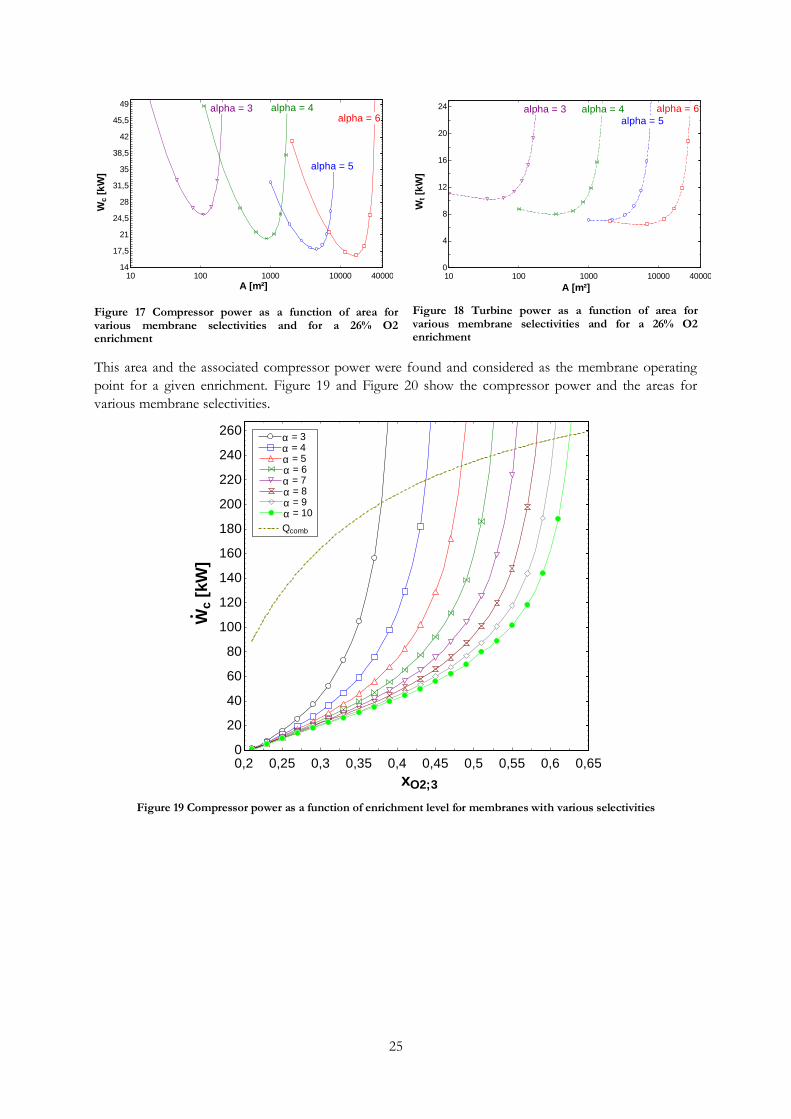
For each membrane and level of enrichment, a certain area exists that minimizes the compressor power.
Indeed, if mass flow rate through the membrane is fixed, as the area increases, the mass flow by unit area
decreases, inducing a reduction of the pressure ratio given by the compressor, as the pressure ratio is
governing the flow rate by unit area. Hence, there is a decrease in compressor power. However, when the
area increases, the feed flow rate of air in the compressor also increases, which leads after a certain point
in which this effect becomes predominant, to an increase in compressor power. Hence there is a
minimum power requirement for a certain area. This is illustrated on Figure 17. Figure 18 shows the
corresponding turbine power. At the optimum point (defined by the minimum compression power
requirement), the turbine power is approximately equal to half of the compressor power.
0,2 0,3 0,4 0,5 0,6 0,7 0,8 0,9 14,0x10
-5
8,0x10⁻⁵
1,2x10⁻⁴
1,6x10⁻⁴
2,0x10⁻⁴
2,4x10⁻⁴
2,8x10⁻⁴
xO2;3
eC
O2 [
kg
/kW
]
0,2 0,3 0,4 0,5 0,6 0,7 0,8 0,9 10
1x10⁻⁷
2x10⁻⁷
3x10⁻⁷
4x10⁻⁷
5x10⁻⁷
6x10⁻⁷
7x10⁻⁷
xO2;3
eN
O [
kg
/kW
]
0,2 0,3 0,4 0,5 0,6 0,7 0,8 0,9 15,0x10
-7
1,0x10⁻⁶
1,5x10⁻⁶
2,0x10⁻⁶
2,5x10⁻⁶
3,0x10⁻⁶
xO2;3
eC
O [
kg
/kW
]
25
Figure 17 Compressor power as a function of area for various membrane selectivities and for a 26% O2 enrichment
Figure 18 Turbine power as a function of area for various membrane selectivities and for a 26% O2 enrichment
This area and the associated compressor power were found and considered as the membrane operating
point for a given enrichment. Figure 19 and Figure 20 show the compressor power and the areas for
various membrane selectivities.
Figure 19 Compressor power as a function of enrichment level for membranes with various selectivities
10 100 1000 10000 4000014
17,5
21
24,5
28
31,5
35
38,5
42
45,5
49
A [m²]
Wc [
kW
]
alpha = 5
alpha = 6alpha = 4alpha = 3
10 100 1000 10000 400000
4
8
12
16
20
24
A [m²]
Wt [k
W]
alpha = 5
alpha = 6alpha = 4alpha = 3
0,2 0,25 0,3 0,35 0,4 0,45 0,5 0,55 0,6 0,650
20
40
60
80
100
120
140
160
180
200
220
240
260
xO2;3
Wc [
kW
]
a = 3a = 3
a = 4a = 4
a = 5a = 5
a = 6a = 6
a = 7a = 7
a = 8a = 8
a = 9a = 9
a = 10a = 10
QcombQcomb
26
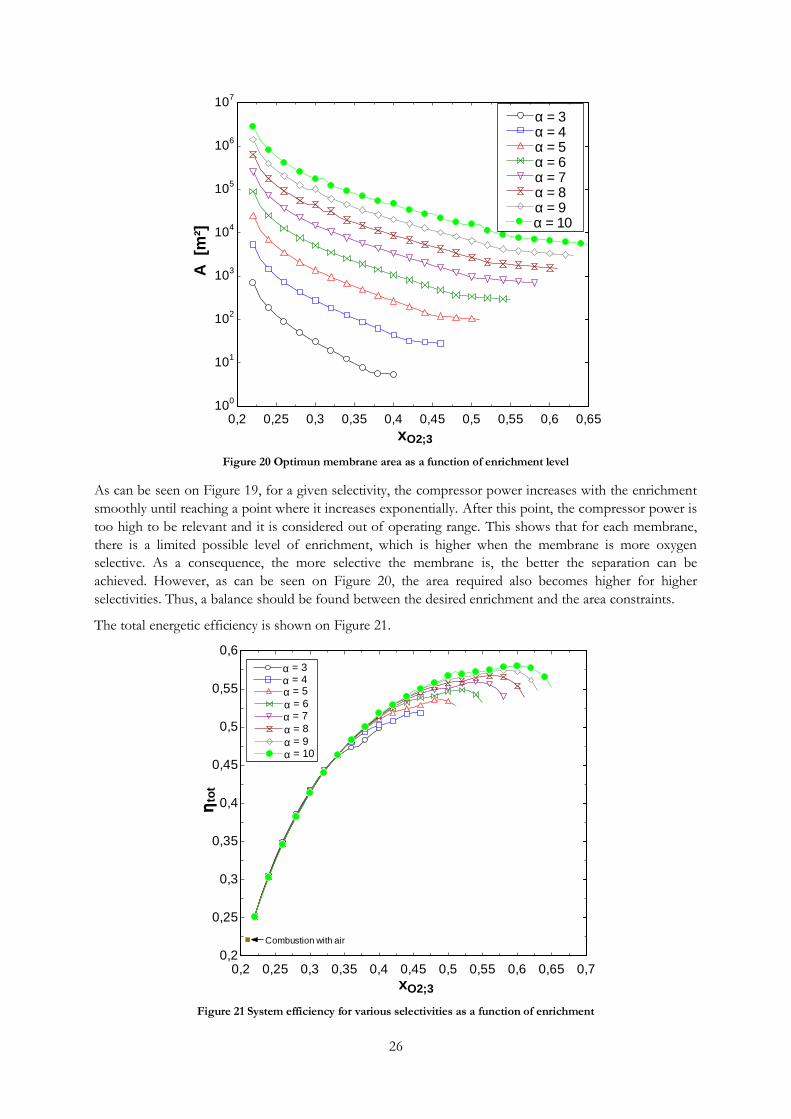
Figure 20 Optimun membrane area as a function of enrichment level
As can be seen on Figure 19, for a given selectivity, the compressor power increases with the enrichment
smoothly until reaching a point where it increases exponentially. After this point, the compressor power is
too high to be relevant and it is considered out of operating range. This shows that for each membrane,
there is a limited possible level of enrichment, which is higher when the membrane is more oxygen
selective. As a consequence, the more selective the membrane is, the better the separation can be
achieved. However, as can be seen on Figure 20, the area required also becomes higher for higher
selectivities. Thus, a balance should be found between the desired enrichment and the area constraints.
The total energetic efficiency is shown on Figure 21.
Figure 21 System efficiency for various selectivities as a function of enrichment
0,2 0,25 0,3 0,35 0,4 0,45 0,5 0,55 0,6 0,6510
0
101
102
103
104
105
106
107
xO2;3
A
[m²]
a = 3a = 3a = 4a = 4a = 5a = 5a = 6a = 6a = 7a = 7a = 8a = 8a = 9a = 9a = 10a = 10
0,2 0,25 0,3 0,35 0,4 0,45 0,5 0,55 0,6 0,65 0,70,2
0,25
0,3
0,35
0,4
0,45
0,5
0,55
0,6
xO2;3
hto
t
Combustion with air
a = 3a = 3
a = 4a = 4
a = 5a = 5
a = 6a = 6
a = 7a = 7
a = 8a = 8
a = 9a = 9
a = 10a = 10
27
As can be seen on Figure 21, the higher the membrane selectivity is, the higher the maximum efficiency.
Compared with combustion with air, the increase in efficiency achievable is significant (from 22% up to
58%). Even for low levels of enrichment, the system efficiency increases rapidly, which makes the
membrane process interesting.
5.3.2 Exergetic analysis
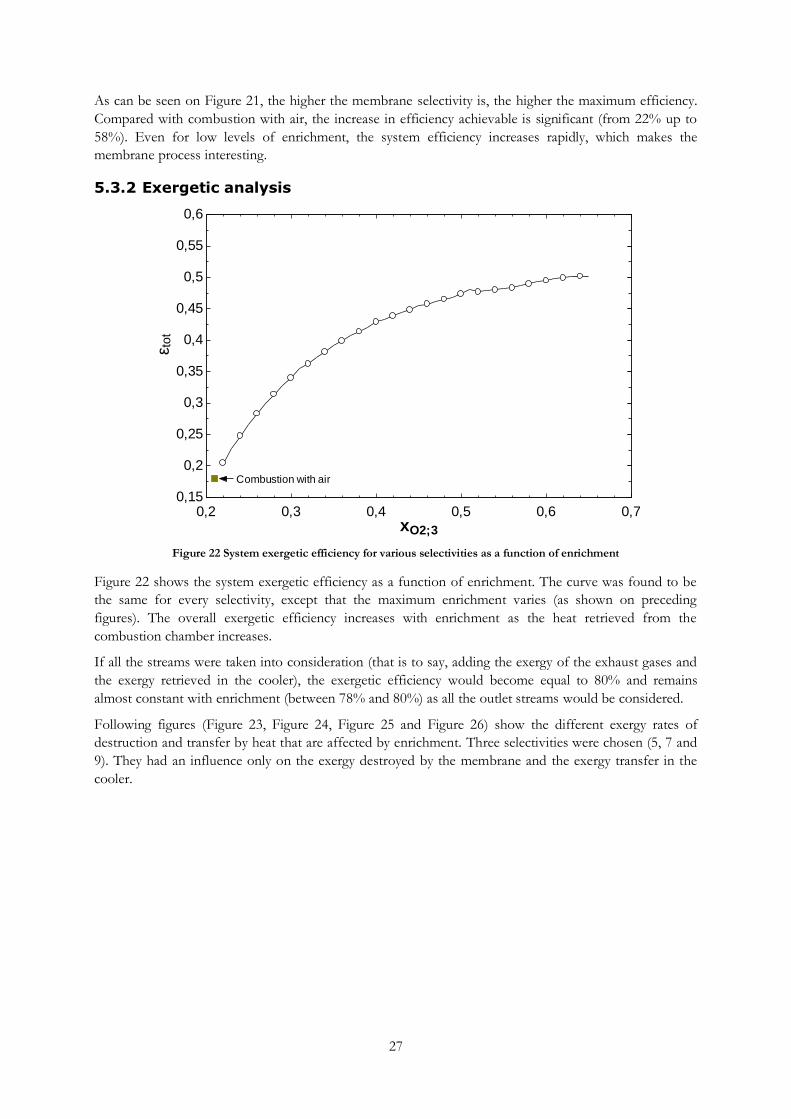
Figure 22 System exergetic efficiency for various selectivities as a function of enrichment
Figure 22 shows the system exergetic efficiency as a function of enrichment. The curve was found to be
the same for every selectivity, except that the maximum enrichment varies (as shown on preceding
figures). The overall exergetic efficiency increases with enrichment as the heat retrieved from the
combustion chamber increases.
If all the streams were taken into consideration (that is to say, adding the exergy of the exhaust gases and
the exergy retrieved in the cooler), the exergetic efficiency would become equal to 80% and remains
almost constant with enrichment (between 78% and 80%) as all the outlet streams would be considered.
Following figures (Figure 23, Figure 24, Figure 25 and Figure 26) show the different exergy rates of
destruction and transfer by heat that are affected by enrichment. Three selectivities were chosen (5, 7 and
9). They had an influence only on the exergy destroyed by the membrane and the exergy transfer in the
cooler.
0,2 0,3 0,4 0,5 0,6 0,70,15
0,2
0,25
0,3
0,35
0,4
0,45
0,5
0,55
0,6
xO2;3
e tot
Combustion with air
28
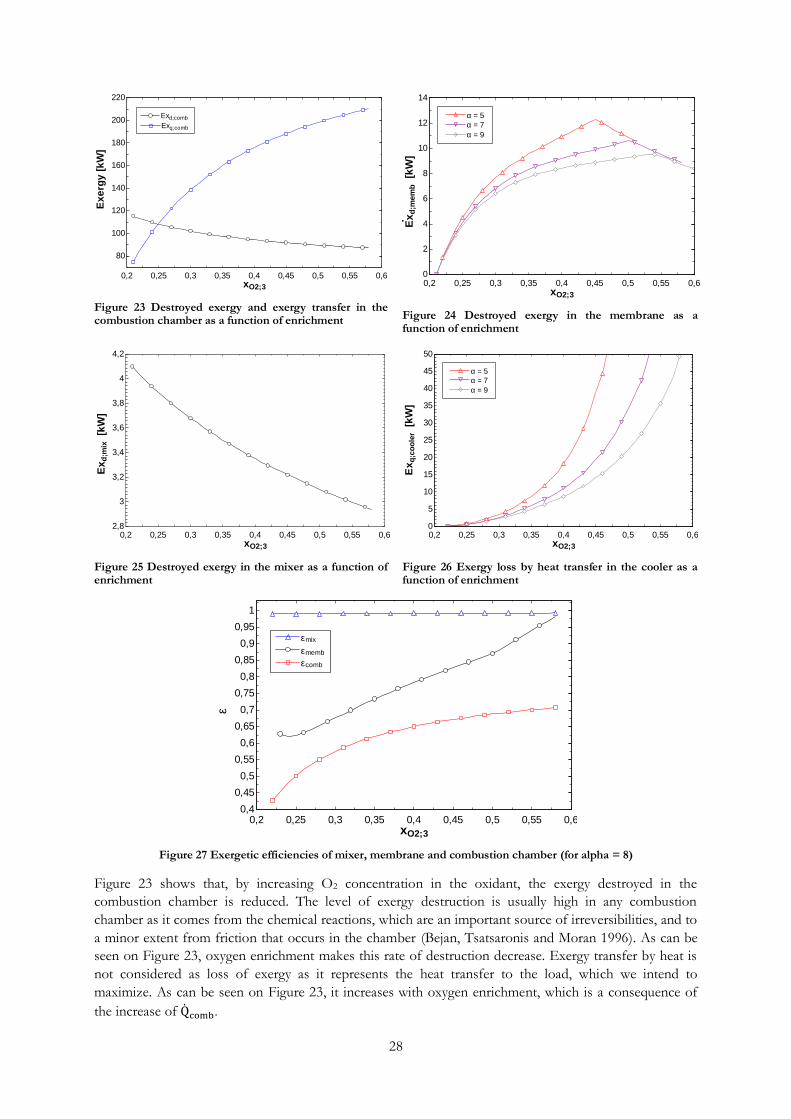
Figure 23 Destroyed exergy and exergy transfer in the combustion chamber as a function of enrichment
Figure 24 Destroyed exergy in the membrane as a function of enrichment
Figure 25 Destroyed exergy in the mixer as a function of enrichment
Figure 26 Exergy loss by heat transfer in the cooler as a function of enrichment
Figure 27 Exergetic efficiencies of mixer, membrane and combustion chamber (for alpha = 8)
Figure 23 shows that, by increasing O2 concentration in the oxidant, the exergy destroyed in the
combustion chamber is reduced. The level of exergy destruction is usually high in any combustion
chamber as it comes from the chemical reactions, which are an important source of irreversibilities, and to
a minor extent from friction that occurs in the chamber (Bejan, Tsatsaronis and Moran 1996). As can be
seen on Figure 23, oxygen enrichment makes this rate of destruction decrease. Exergy transfer by heat is
not considered as loss of exergy as it represents the heat transfer to the load, which we intend to
maximize. As can be seen on Figure 23, it increases with oxygen enrichment, which is a consequence of
the increase of .
0,2 0,25 0,3 0,35 0,4 0,45 0,5 0,55 0,6
80
100
120
140
160
180
200
220
xO2;3
Ex
erg
y [
kW
]
Exd;combExd;comb
Exq;combExq;comb
0,2 0,25 0,3 0,35 0,4 0,45 0,5 0,55 0,60
2
4
6
8
10
12
14
xO2;3
Ex
d;m
em
b
[kW
]
a = 7a = 7
a = 9a = 9
a = 5a = 5
0,2 0,25 0,3 0,35 0,4 0,45 0,5 0,55 0,62,8
3
3,2
3,4
3,6
3,8
4
4,2
xO2;3
Ex
d;m
ix
[kW
]
0,2 0,25 0,3 0,35 0,4 0,45 0,5 0,55 0,60
5
10
15
20
25
30
35
40
45
50
xO2;3
Ex
q;c
oo
ler
[k
W]
a = 7a = 7
a = 9a = 9
a = 5a = 5
0,2 0,25 0,3 0,35 0,4 0,45 0,5 0,55 0,60,4
0,45
0,5
0,55
0,6
0,65
0,7
0,75
0,8
0,85
0,9
0,95
1
xO2;3
e
emixemix
emembememb
ecombecomb
29
As regards the membrane, there is an increase of destroyed exergy as the feed air is enriched. Despite of
this, the exergetic efficiency of the membrane is increased (see Figure 27) as the higher degree of
separation provides a proportionally higher availability to the exit streams.
The mixer destroys less exergy as the oxidant is enriched but the proportion of exergy losses is relatively
low compared to the other components (around 3-4 kW whereas combustion chamber exergy destruction
represents 90 to 115 kW).
Finally, the exergy transferred in the form of heat in the cooler becomes much higher with enrichment.
This comes from the fact that higher enrichment requires a higher pressure ratio in the compressor,
leading to higher temperatures. When cooling the air to ambient temperatures, all the exergy induced by
temperature is destroyed. This term of exergy can be considered as an exergy loss if nothing is done with
it. However, it is not considered as a destroyed exergy as it does not come from entropy generation and it
could be used in order to preheat another stream for instance.
As regards the turbine and the compressor, their exergetic efficiency is 1, which is the direct consequence
of the assumption that the isentropic efficiency is 1. As they are considered as ideal, no exergy is
destroyed.
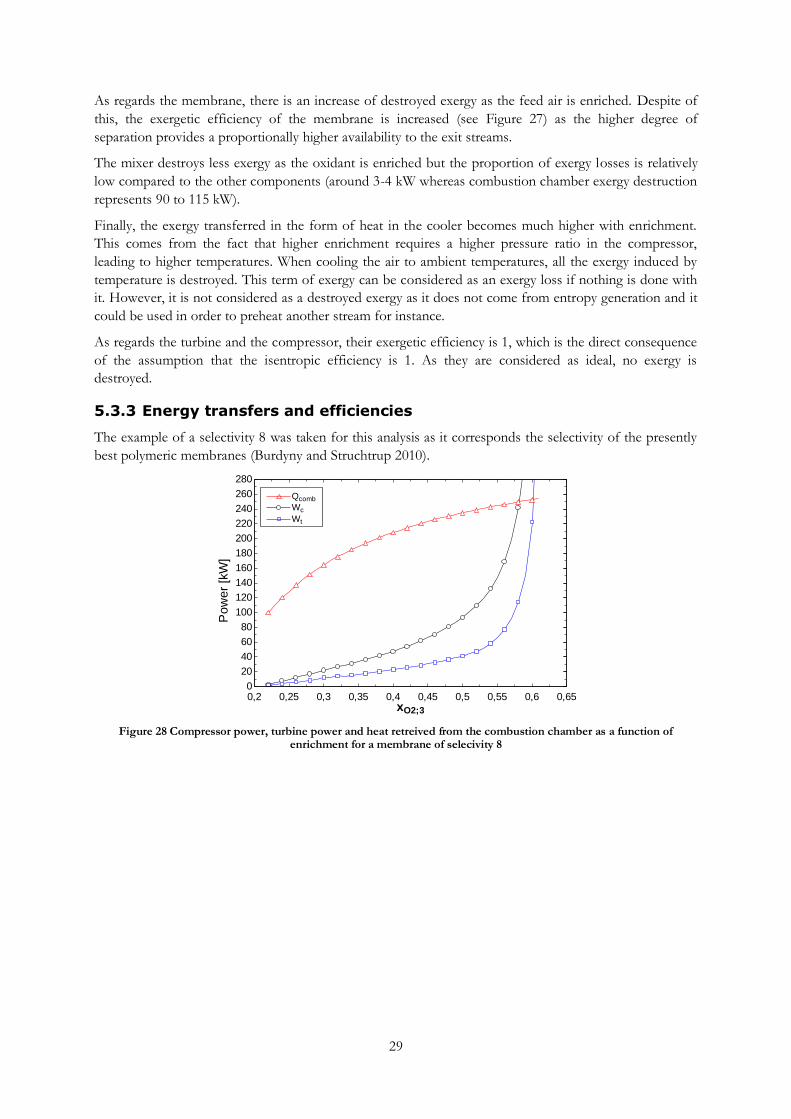
5.3.3 Energy transfers and efficiencies
The example of a selectivity 8 was taken for this analysis as it corresponds the selectivity of the presently
best polymeric membranes (Burdyny and Struchtrup 2010).
Figure 28 Compressor power, turbine power and heat retreived from the combustion chamber as a function of enrichment for a membrane of selecivity 8
0,2 0,25 0,3 0,35 0,4 0,45 0,5 0,55 0,6 0,650
20
40
60
80
100
120
140
160
180
200
220
240
260
280
xO2;3
Po
we
r [k
W]
QcombQcomb
WcWc
WtWt
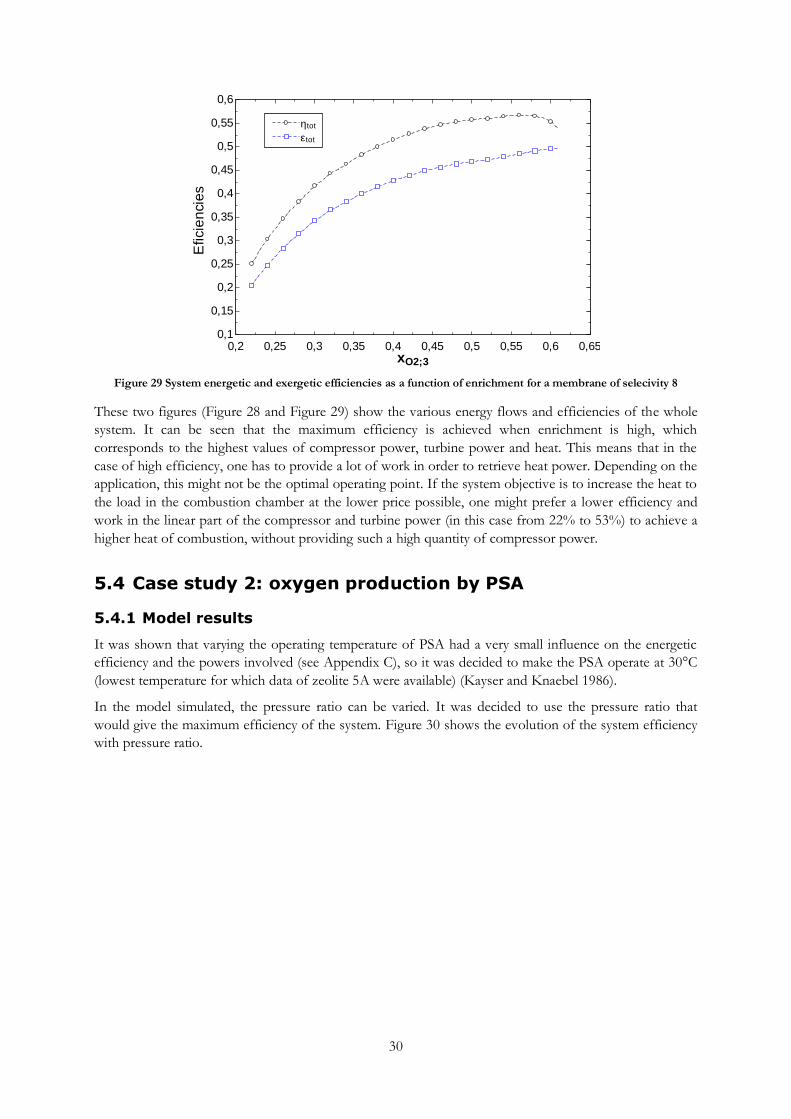
30
Figure 29 System energetic and exergetic efficiencies as a function of enrichment for a membrane of selecivity 8
These two figures (Figure 28 and Figure 29) show the various energy flows and efficiencies of the whole
system. It can be seen that the maximum efficiency is achieved when enrichment is high, which
corresponds to the highest values of compressor power, turbine power and heat. This means that in the
case of high efficiency, one has to provide a lot of work in order to retrieve heat power. Depending on the
application, this might not be the optimal operating point. If the system objective is to increase the heat to
the load in the combustion chamber at the lower price possible, one might prefer a lower efficiency and
work in the linear part of the compressor and turbine power (in this case from 22% to 53%) to achieve a
higher heat of combustion, without providing such a high quantity of compressor power.
5.4 Case study 2: oxygen production by PSA
5.4.1 Model results
It was shown that varying the operating temperature of PSA had a very small influence on the energetic
efficiency and the powers involved (see Appendix C), so it was decided to make the PSA operate at 30°C
(lowest temperature for which data of zeolite 5A were available) (Kayser and Knaebel 1986).
In the model simulated, the pressure ratio can be varied. It was decided to use the pressure ratio that
would give the maximum efficiency of the system. Figure 30 shows the evolution of the system efficiency
with pressure ratio.
0,2 0,25 0,3 0,35 0,4 0,45 0,5 0,55 0,6 0,650,1
0,15
0,2
0,25
0,3
0,35
0,4
0,45
0,5
0,55
0,6
xO2;3
Eficie
ncie
s
htothtot
etotetot
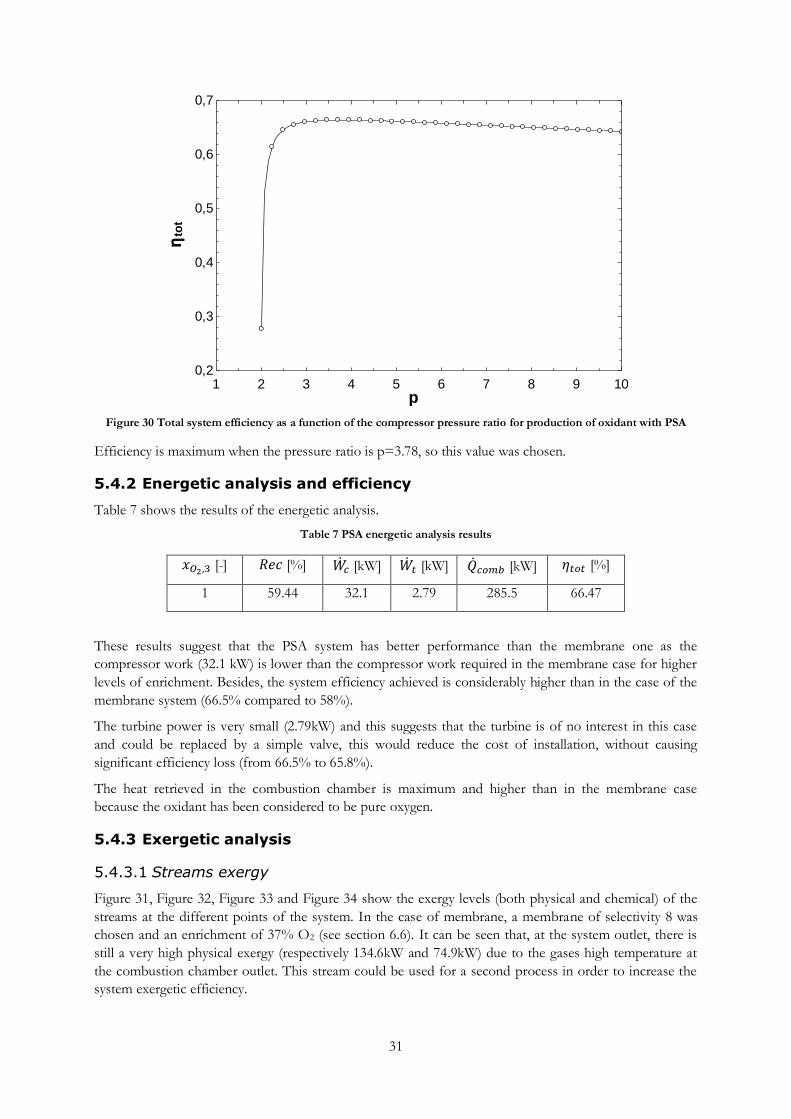
31
Figure 30 Total system efficiency as a function of the compressor pressure ratio for production of oxidant with PSA
Efficiency is maximum when the pressure ratio is p=3.78, so this value was chosen.
5.4.2 Energetic analysis and efficiency
Table 7 shows the results of the energetic analysis.
Table 7 PSA energetic analysis results
[-] [%] [kW] [kW] [kW] [%]
1 59.44 32.1 2.79 285.5 66.47
These results suggest that the PSA system has better performance than the membrane one as the
compressor work (32.1 kW) is lower than the compressor work required in the membrane case for higher
levels of enrichment. Besides, the system efficiency achieved is considerably higher than in the case of the
membrane system (66.5% compared to 58%).
The turbine power is very small (2.79kW) and this suggests that the turbine is of no interest in this case
and could be replaced by a simple valve, this would reduce the cost of installation, without causing
significant efficiency loss (from 66.5% to 65.8%).
The heat retrieved in the combustion chamber is maximum and higher than in the membrane case
because the oxidant has been considered to be pure oxygen.
5.4.3 Exergetic analysis
Streams exergy 5.4.3.1
Figure 31, Figure 32, Figure 33 and Figure 34 show the exergy levels (both physical and chemical) of the
streams at the different points of the system. In the case of membrane, a membrane of selectivity 8 was
chosen and an enrichment of 37% O2 (see section 6.6). It can be seen that, at the system outlet, there is
still a very high physical exergy (respectively 134.6kW and 74.9kW) due to the gases high temperature at
the combustion chamber outlet. This stream could be used for a second process in order to increase the
system exergetic efficiency.
1 2 3 4 5 6 7 8 9 100,2
0,3
0,4
0,5
0,6
0,7
p
hto
t
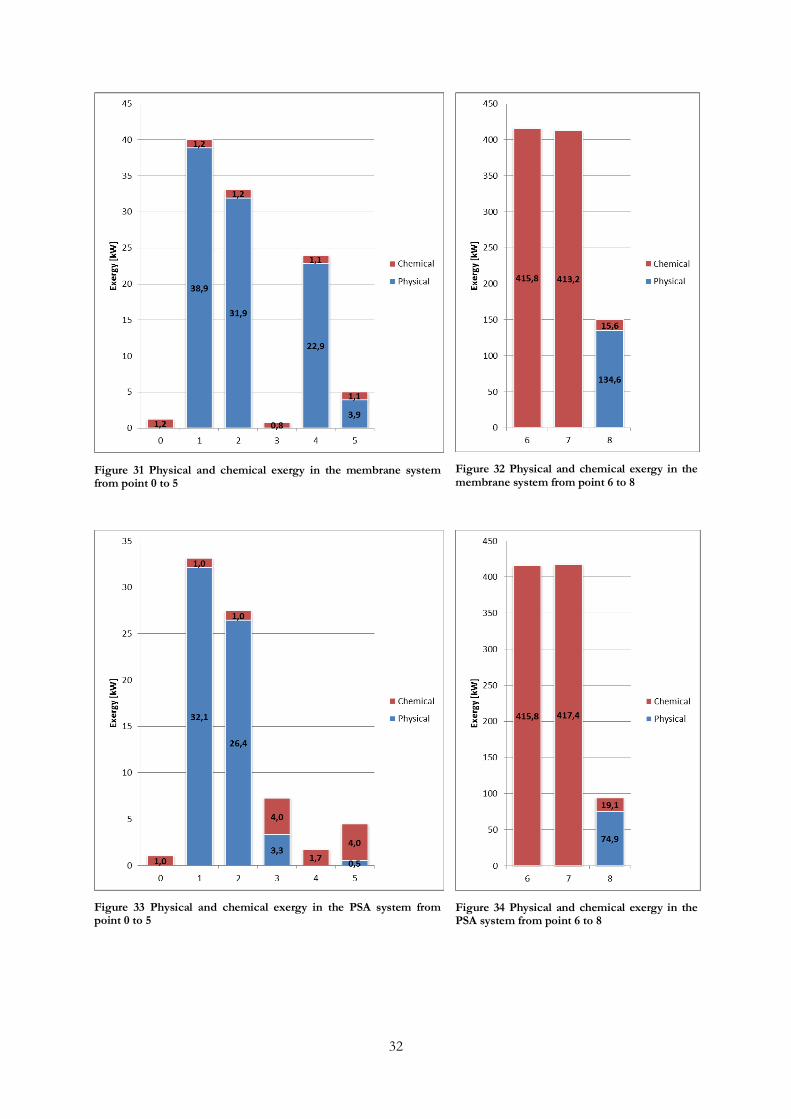
32
Figure 31 Physical and chemical exergy in the membrane system from point 0 to 5
Figure 32 Physical and chemical exergy in the membrane system from point 6 to 8
Figure 33 Physical and chemical exergy in the PSA system from point 0 to 5
Figure 34 Physical and chemical exergy in the PSA system from point 6 to 8
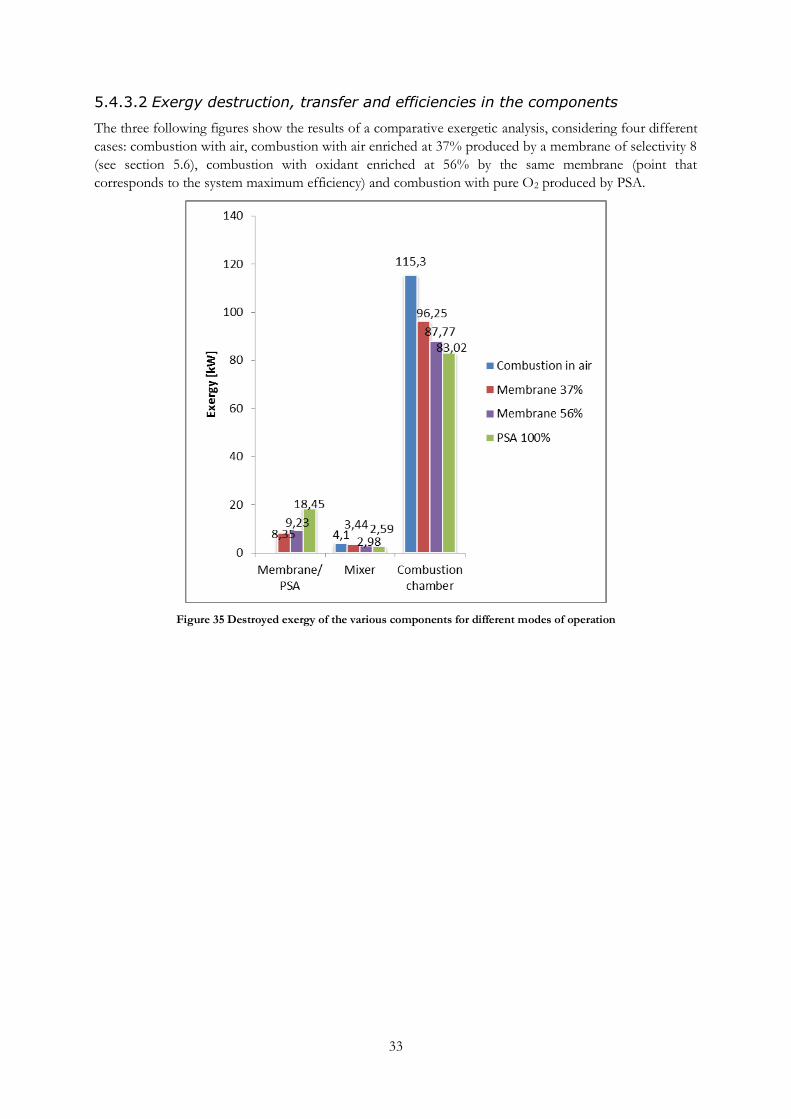
33
Exergy destruction, transfer and efficiencies in the components 5.4.3.2
The three following figures show the results of a comparative exergetic analysis, considering four different
cases: combustion with air, combustion with air enriched at 37% produced by a membrane of selectivity 8
(see section 5.6), combustion with oxidant enriched at 56% by the same membrane (point that
corresponds to the system maximum efficiency) and combustion with pure O2 produced by PSA.
Figure 35 Destroyed exergy of the various components for different modes of operation
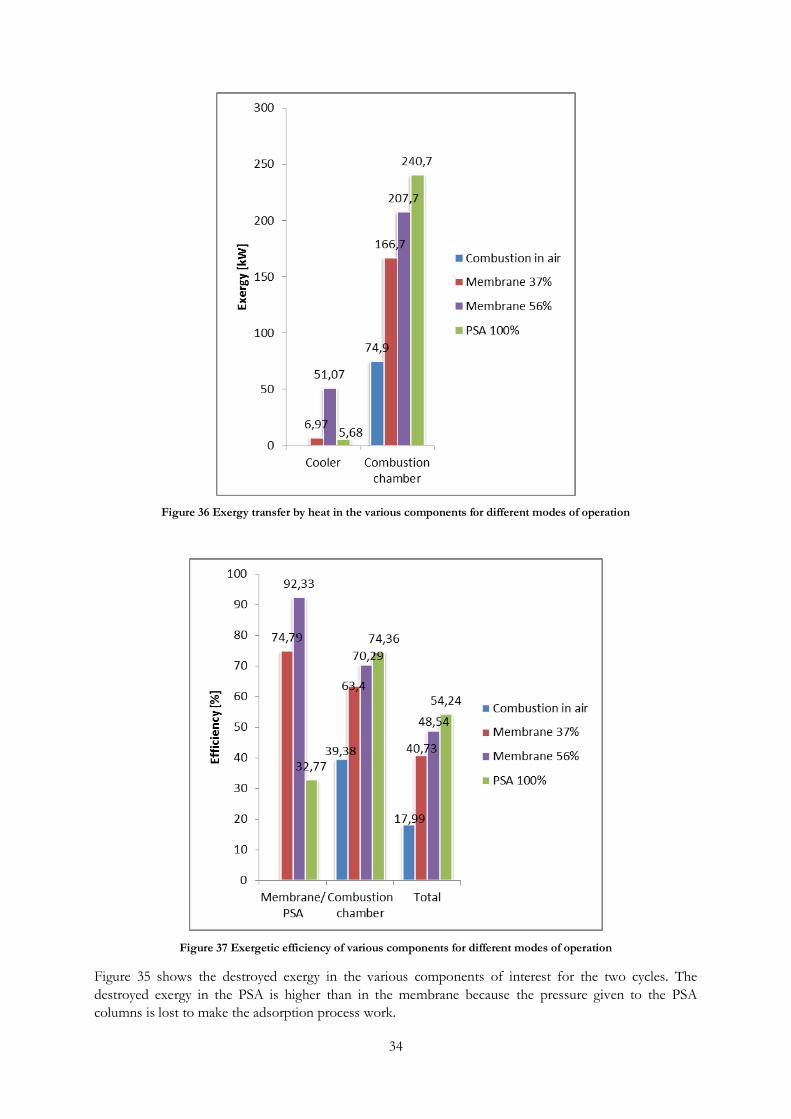
34
Figure 36 Exergy transfer by heat in the various components for different modes of operation
Figure 37 Exergetic efficiency of various components for different modes of operation
Figure 35 shows the destroyed exergy in the various components of interest for the two cycles. The
destroyed exergy in the PSA is higher than in the membrane because the pressure given to the PSA
columns is lost to make the adsorption process work.
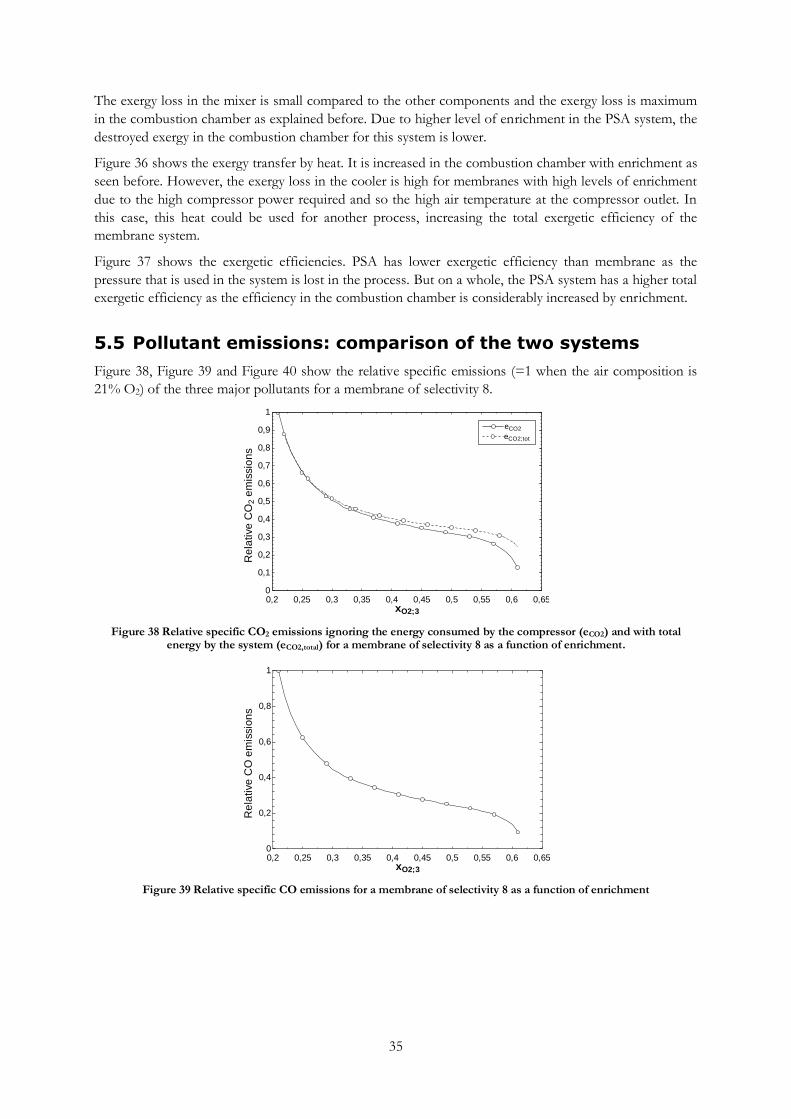
35
The exergy loss in the mixer is small compared to the other components and the exergy loss is maximum
in the combustion chamber as explained before. Due to higher level of enrichment in the PSA system, the
destroyed exergy in the combustion chamber for this system is lower.
Figure 36 shows the exergy transfer by heat. It is increased in the combustion chamber with enrichment as
seen before. However, the exergy loss in the cooler is high for membranes with high levels of enrichment
due to the high compressor power required and so the high air temperature at the compressor outlet. In
this case, this heat could be used for another process, increasing the total exergetic efficiency of the
membrane system.
Figure 37 shows the exergetic efficiencies. PSA has lower exergetic efficiency than membrane as the
pressure that is used in the system is lost in the process. But on a whole, the PSA system has a higher total
exergetic efficiency as the efficiency in the combustion chamber is considerably increased by enrichment.
5.5 Pollutant emissions: comparison of the two systems
Figure 38, Figure 39 and Figure 40 show the relative specific emissions (=1 when the air composition is
21% O2) of the three major pollutants for a membrane of selectivity 8.
Figure 38 Relative specific CO2 emissions ignoring the energy consumed by the compressor (eCO2) and with total energy by the system (eCO2,total) for a membrane of selectivity 8 as a function of enrichment.
Figure 39 Relative specific CO emissions for a membrane of selectivity 8 as a function of enrichment
0,2 0,25 0,3 0,35 0,4 0,45 0,5 0,55 0,6 0,650
0,1
0,2
0,3
0,4
0,5
0,6
0,7
0,8
0,9
1
xO2;3
Re
lative
CO
2 e
mis
sio
ns
eCO2eCO2
eCO2;toteCO2;tot
0,2 0,25 0,3 0,35 0,4 0,45 0,5 0,55 0,6 0,650
0,2
0,4
0,6
0,8
1
xO2;3
Re
lative
CO
em
issio
ns
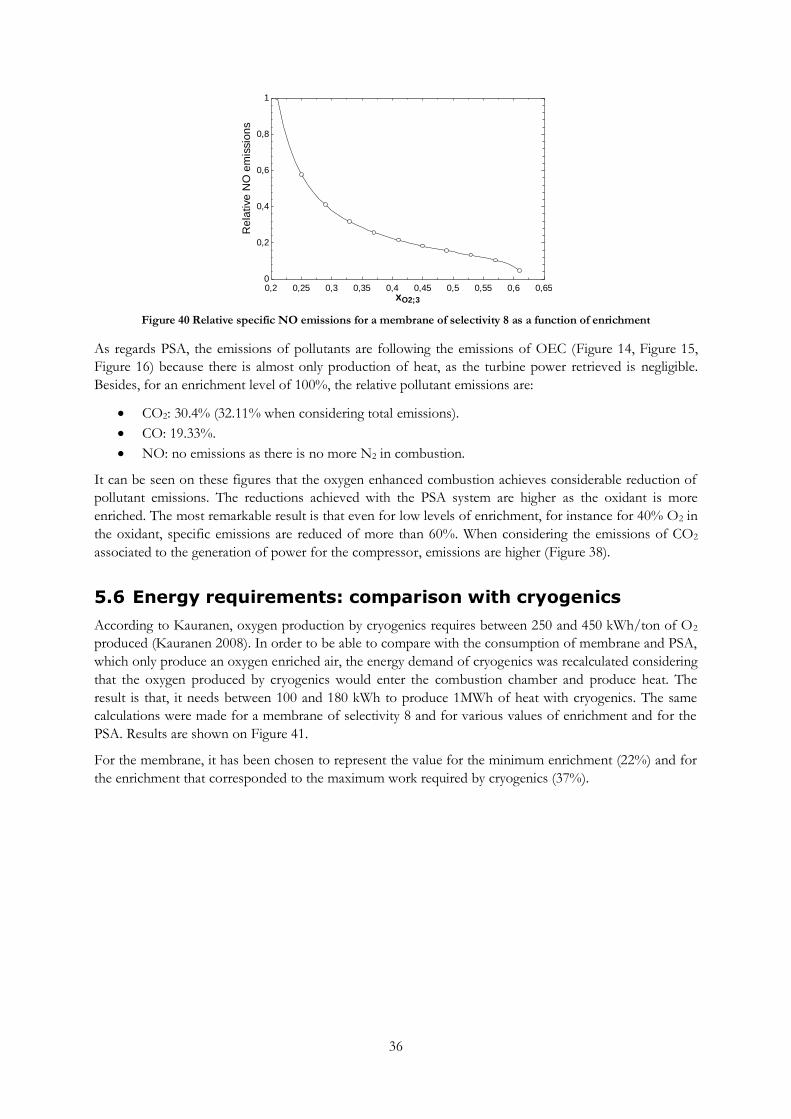
36
Figure 40 Relative specific NO emissions for a membrane of selectivity 8 as a function of enrichment
As regards PSA, the emissions of pollutants are following the emissions of OEC (Figure 14, Figure 15,
Figure 16) because there is almost only production of heat, as the turbine power retrieved is negligible.
Besides, for an enrichment level of 100%, the relative pollutant emissions are:
CO2: 30.4% (32.11% when considering total emissions).
CO: 19.33%.
NO: no emissions as there is no more N2 in combustion.
It can be seen on these figures that the oxygen enhanced combustion achieves considerable reduction of
pollutant emissions. The reductions achieved with the PSA system are higher as the oxidant is more
enriched. The most remarkable result is that even for low levels of enrichment, for instance for 40% O2 in
the oxidant, specific emissions are reduced of more than 60%. When considering the emissions of CO2
associated to the generation of power for the compressor, emissions are higher (Figure 38).
5.6 Energy requirements: comparison with cryogenics
According to Kauranen, oxygen production by cryogenics requires between 250 and 450 kWh/ton of O2
produced (Kauranen 2008). In order to be able to compare with the consumption of membrane and PSA,
which only produce an oxygen enriched air, the energy demand of cryogenics was recalculated considering
that the oxygen produced by cryogenics would enter the combustion chamber and produce heat. The
result is that, it needs between 100 and 180 kWh to produce 1MWh of heat with cryogenics. The same
calculations were made for a membrane of selectivity 8 and for various values of enrichment and for the
PSA. Results are shown on Figure 41.
For the membrane, it has been chosen to represent the value for the minimum enrichment (22%) and for
the enrichment that corresponded to the maximum work required by cryogenics (37%).
0,2 0,25 0,3 0,35 0,4 0,45 0,5 0,55 0,6 0,650
0,2
0,4
0,6
0,8
1
xO2;3
Re
lative
NO
em
issio
ns
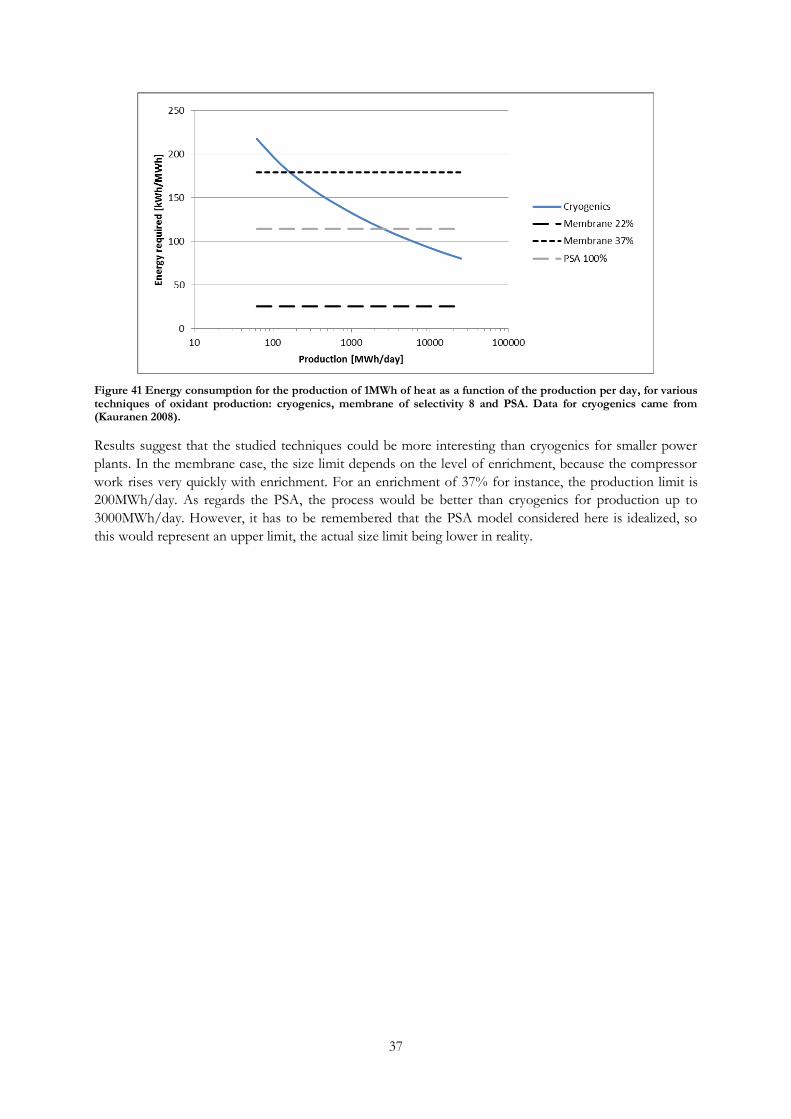
37
Figure 41 Energy consumption for the production of 1MWh of heat as a function of the production per day, for various techniques of oxidant production: cryogenics, membrane of selectivity 8 and PSA. Data for cryogenics came from (Kauranen 2008).
Results suggest that the studied techniques could be more interesting than cryogenics for smaller power
plants. In the membrane case, the size limit depends on the level of enrichment, because the compressor
work rises very quickly with enrichment. For an enrichment of 37% for instance, the production limit is
200MWh/day. As regards the PSA, the process would be better than cryogenics for production up to
3000MWh/day. However, it has to be remembered that the PSA model considered here is idealized, so
this would represent an upper limit, the actual size limit being lower in reality.
-38-
6 Conclusion
This work has been a proof of concept of two separation systems, polymeric membrane and PSA, applied
to oxygen-enhanced combustion. A model for the system and for both processes was developed.
Operating curves were found for a polymeric membrane as a function of its selectivity, showing that a
high selectivity allows a higher level of separation and so, a higher efficiency of the whole combustion
system. This is promising as ongoing research on polymeric membranes tends to increase always more
their selectivity. However, it has to be mentioned that the area required could be a limiting factor, as the
selectivity increase makes permeability decrease, thus increasing the area required.
Separation by Pressure Swing Adsorption was modeled using an analytical solution to the equilibrium
model and was shown to be a potentially interesting solution, because energetic and exergetic efficiencies
of the whole system increased substantially.
The two systems showed a reduction of specific pollutants emissions, which is one of the major
improvements induced by oxygen-enhanced combustion.
The exergetic analysis showed an improvement with enrichment as the destroyed exergy in the
combustion chamber was reduced and the exergy transfer by heat increased. As regards exergetic
efficiency, the membrane showed to have a higher efficiency than the PSA, this last representing a source
of exergetic loss in the system. The two processes were shown to be more interesting energetically than
cryogenics for small scale production.
Finally, the two systems assessment was based on an energetic and exergetic study, but for a more detailed
analysis, an economic analysis should also be done, comparing the two solutions. Besides, the PSA model
that was used in this work was based on an equilibrium model, which is an idealized model, as the purity
of oxygen out of a PSA system is generally lower (93-95%) with a two-column system. So, the results
presented in this work were able to show a limit of PSA performances that could be obtained with a two-
bed PSA system working according to the Skarstrom cycle with pressure equalization, but the actual
performance would be a bit lower. As a consequence, in a future work, it would be interesting to work on
a more accurate model, for instance a model using the linear driving force.
39
7 List of symbols
A membrane area (m²)
bed height (m)
molar concentration of compound i
in the fluid phase (kmol/m³)
specific emissions of compound i
(kg/kJ)
molar exergy at point j (kJ/kmol)
standard chemical exergy of
compound i (kJ/kmol)
exergy at point j (kW)
destroyed exergy at component k
(kW)
exergy transfer by heat at component
k (kW)
fuel savings (%)
molar enthalpy of the mixture at
point j (kJ/kmol)
equilibrium coefficient for
compound i (-)
membrane thickness (µm)
bed length (m)
low heating value of CH4
mass flow rate of compound i at
point j (kg/s)
number of moles entering or leaving
the bed in step S (mol)
number of moles of compound i
absorbed per unit volume (kmol/m³)
molar flow rate of compound i at
point j (kmol/s)
pressure (Pa)
, ,
pressure after equalization, high
pressure and low pressure (Pa)
permeability to compound i (kmol
µm kPa-1 m-2 s-1)
partial pressure of compound i (kPa)
total pressure at point j (kPa)
heat power (MW)
ideal gas constant (kJ/kmol.K)
compression ratio (-)
Rec recuperação
molar entropy of the mixture at
point j (J/kmol.K)
generated entropy (kW/K)
temperature at point j (K)
duration of step S (s)
velocity in step S (m/s)
velocity (m/s)
total volume (m3)
volume flow rate (m3/s)
electrical power from component k
(MW)
molar fraction of compound i at
point j (-)
destroyed exergy fraction (-)
nitrogen fraction in feed air (-)
z altitude in the bed (m)
Greek symbols
α membrane selectivity (-)
adsorption characteristic constant (-)
exergetic efficiency (-)
bed void fraction (-)
energetic efficiency (-)
enrichment (-)
pressure ratio (-)
bed characteristic constant
equivalence coefficient (-)
Subscripts
40
actual real case
c compressor
cooler cooler
comb combustion chamber
cv control volume
el electrical
F feed
gases exhaust gases
in inlet
memb membrane
mix mixer
out outlet
PO product output
PR pressurization step
PU purge
stoich stoichiometric
t turbine
tot entire system
Superscripts
CH chemical
el electrical
PH physical
tot total
References
ABB. "Download Center." ABB. February 2012.
http://www05.abb.com/global/scot/scot266.nsf/veritydisplay/57cf69809410f362c12579e60036
dc52/$file/Brazil%20Energy%20efficiency%20Report.pdf (accessed November 2012).
Banerjee, R., K.G. Narayankhedkar, and S.P. Sukhatme. "Exergy analysis of pressure swing adsorption
processes for air separation." Chemical Engineering Science 45, 1989: 467-475.
Baukal, Charles E. Oxygen-enhanced combustion. Boca Raton, Florida: CRC Press LLC, 1998.
Bejan, Adrian, George Tsatsaronis, and Michael Moran. Thermal design and optimization. USA: John Wiley &
Sons, Inc., 1996.
Burdyny, Thomas, and Henning Struchtrup. "Hybrid membrane/cryogenic separation of oxygen from air
for use in the oxy-fuel process." Energy 35, 2010: 1884-1897.
Chiang, Anthony S.T. "An analytical solution to equilibrium PSA cycles." Chemical Engineering Science 51,
1996: 207-216.
Coombe, H. Scott, and Sen Nieh. "Polymer membrane air separation performance for portable oxygen
enriched combustion applications." Energy Conversion and Management 48, 2007: 1499-1505.
Cruz, P., J.P. Santos, F.D. Magalhães, and A. Mendes. "Cuclic adsorption separation processes: analysis
strategy and optimization procedure." Chemical Engineering Science 58, 2003: 3143-3158.
Dortmundt, David, and Kishore Doshi. "Recent develoments in CO2 removal membrane technology."
(UOP LLC) 1999.
EIA. Brazil: Country Analysis Briefs. February 28, 2012. http://www.eia.gov/cabs/brazil/Full.html (accessed
November 21, 2012).
European Environment Agency. Structure of CO2 emissions from thermal power plants in EU-27, 2009. January
31, 2012. http://www.eea.europa.eu/data-and-maps/figures/structure-of-co2-emissions-from-2
(accessed November 23, 2012).
Hashim, S.M., A.R. Mohamed, and Subhash Bhatia. "Current status of ceramic-based membranes for
oxygen separation." Advances in Colloid and Interface Science 160, 2010: 88-100.
41
Jain, S., A.S. Moharir, P. Li, and G. Wozny. "Heuristic design of pressure swing adsorption: a preliminary
study." Separation and Purification Technology 33, 2003: 25-43.
Kauranen, Pertti. "Oxygen carriers for energy efficiency." Spinverse. 04 17, 2008.
http://www.spinverse.com/pastevents/nmpfinland2008/files/presentations/thursday_2008-04-
17/Kauranen_NMPFinland2008.pdf (accessed 12 01, 2012).
Kayser, John C., and Kent S. Knaebel. "Pressure swing adsorption: experimental study of an equilibrium
theory." Chemical Engineering Science 41, 1986: 2931-2938.
Kimura, S.G, and W.R Browall. "Membrane oxygen enrichment: demonstration of membrane oxygen
enrichment for natural gas combustion." Journal of Membrane Science 29, 1986: 69-77.
Knaebel, Kent S., and Frank B. Hill. "Pressure swing adsorption: development of an equilibrium theory
for gas separations." Chemical Engineering Science 40, 1985: 2351-2360.
Maidana, Cristiano Frandalozo, Adriano Carotenuto, and Paulo Smith Schneider. "Analysis of oxygen-
enhanced combustion of gas power cycle." Uberlandia MG, Brazil: 13th Congress of Thermal
Sciences and Engineering, December 2010.
Maidana, Cristiano Frandalozo, and Paulo Smith Schneider. "Energetic analysis of oxygen-enhanced
combustion with air separation by polymeric membranes." Rio de Janeiro RJ, Brazil: 14th
Brazilian Congress of Thermal Sciences and Engineering, October 2012.
Mendes, Adélio M.M., Carlos A.V. Costa, and Alírio E. Rodrigues. "Oxygen separation from air by PSA:
modelling and experimental results." Separation and Purification Technology 24, 2001: 173-188.
MercoPress. "Brazil ready to live a natural gas golden era" with self sufficiency in five years. April 30, 2012.
http://en.mercopress.com/2012/04/30/brazil-ready-to-live-a-natural-gas-golden-era-with-self-
sufficiency-in-five-years (accessed November 21, 2012).
Qiu, K, and A.C.S Hayden. "Increasing the efficiency of radiant burners by using polymer membranes."
Applied Energy 86, 2009: 349-354.
Rigby, Geoff R., and Harry C. Watson. "Application of membrane gas separation to oxygen enrichment of
diesel engines." Journal of Membrane Science 87, 1994: 159-169.
Robeson, Lloyd M. "The upper bound revisited." Journal of Membrane Science 320, 2008: 390-400.
Serberzov, Atanas, and Stratis V. Sotirchos. "Semianalytical solution for multicomponent PSA: application
to PSA process design." Separation and Purification Technology 31, 2003: 203-223.
Sircar, S, M.B Rao, and T.C Golden. "Fractionation of air by zeolites." Studies in Surface Science and Catalysis
120, 1998: 398-423.
Smith, A.R., and J. Klosek. "A review of air separation technologies and their integration with energy
conversion processes." Fuel Processing Technology 70, 2001: 115-134.
Tessendorf, Stefan, Rafiqul Gani, and Michael L. Michelsen. "Modeling, simulation and optimization of
membrane-based gas separtion systems." Chemical Engineering Science 54, 1999: 943-955.
Union Gas. Chemical Composition of Natural Gas. 2012.
http://www.uniongas.com/aboutus/aboutng/composition.asp (accessed November 23, 2012).
US Energy Information Administration. Brazil: Country analysis brief. October 16, 2012.
http://www.eia.gov/countries/country-data.cfm?fips=BR#ng (accessed November 21, 2012).
Yamamoto, Tsuyoshi, Noriyuki Kobayashi, Norio Arai, and Tadashi Tanaka. "Effects of pressure on fuel-
rich combustion of methane-air under high pressure." Energy Conversion Management 38, 1997:
1093-1100.
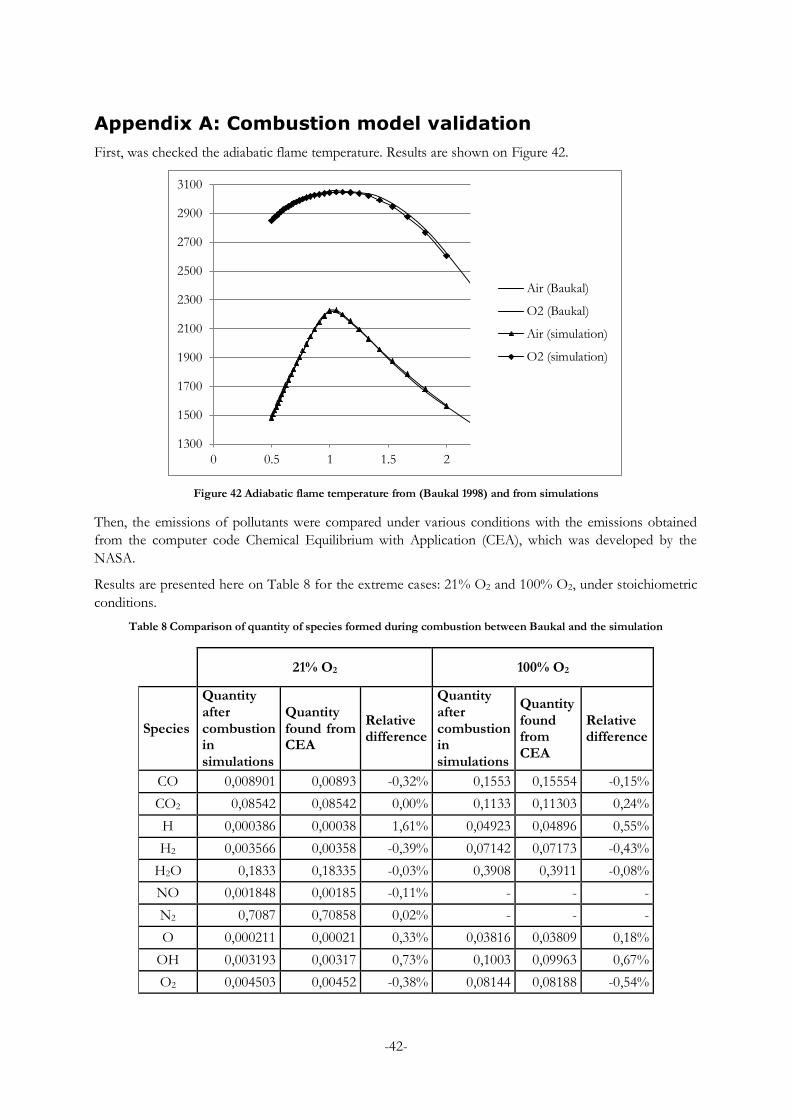
-42-
Appendix A: Combustion model validation
First, was checked the adiabatic flame temperature. Results are shown on Figure 42.
Figure 42 Adiabatic flame temperature from (Baukal 1998) and from simulations
Then, the emissions of pollutants were compared under various conditions with the emissions obtained
from the computer code Chemical Equilibrium with Application (CEA), which was developed by the
NASA.
Results are presented here on Table 8 for the extreme cases: 21% O2 and 100% O2, under stoichiometric
conditions.
Table 8 Comparison of quantity of species formed during combustion between Baukal and the simulation
21% O2 100% O2
Species
Quantity after combustion in simulations
Quantity found from CEA
Relative difference
Quantity after combustion in simulations
Quantity found from CEA
Relative difference
CO 0,008901 0,00893 -0,32% 0,1553 0,15554 -0,15%
CO2 0,08542 0,08542 0,00% 0,1133 0,11303 0,24%
H 0,000386 0,00038 1,61% 0,04923 0,04896 0,55%
H2 0,003566 0,00358 -0,39% 0,07142 0,07173 -0,43%
H2O 0,1833 0,18335 -0,03% 0,3908 0,3911 -0,08%
NO 0,001848 0,00185 -0,11% - - -
N2 0,7087 0,70858 0,02% - - -
O 0,000211 0,00021 0,33% 0,03816 0,03809 0,18%
OH 0,003193 0,00317 0,73% 0,1003 0,09963 0,67%
O2 0,004503 0,00452 -0,38% 0,08144 0,08188 -0,54%
1300
1500
1700
1900
2100
2300
2500
2700
2900
3100
0 0.5 1 1.5 2
Air (Baukal)
O2 (Baukal)
Air (simulation)
O2 (simulation)
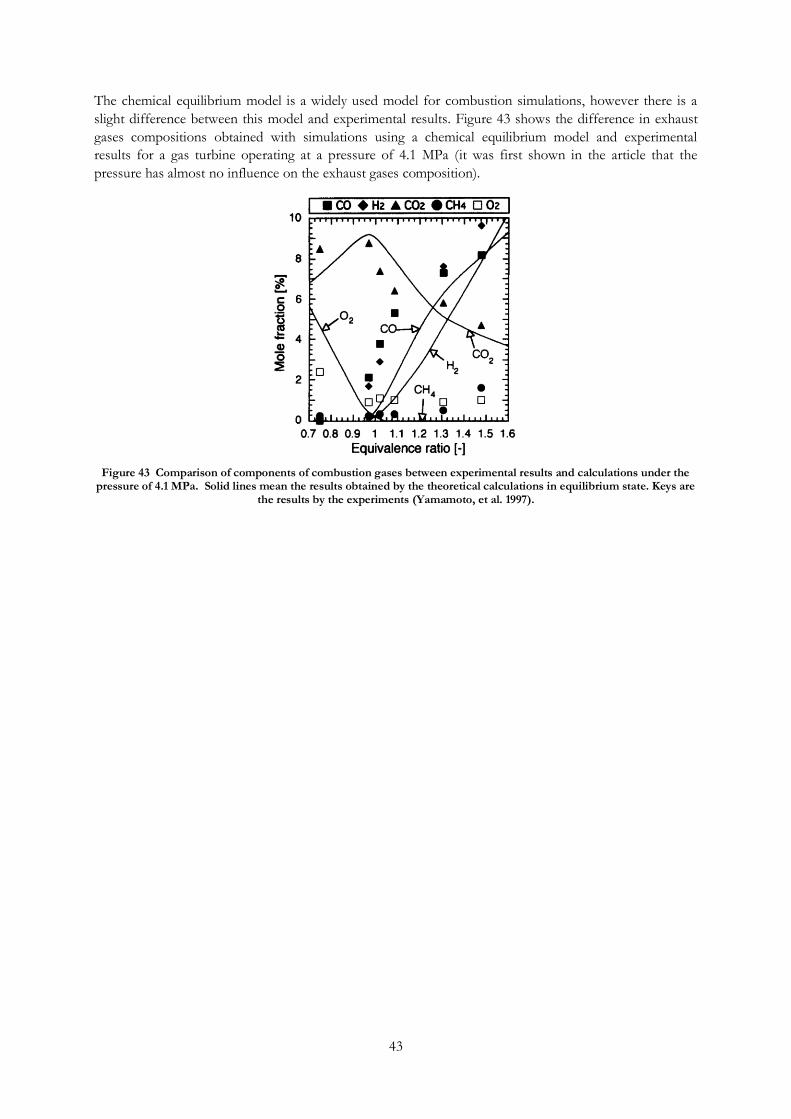
43
The chemical equilibrium model is a widely used model for combustion simulations, however there is a
slight difference between this model and experimental results. Figure 43 shows the difference in exhaust
gases compositions obtained with simulations using a chemical equilibrium model and experimental
results for a gas turbine operating at a pressure of 4.1 MPa (it was first shown in the article that the
pressure has almost no influence on the exhaust gases composition).
Figure 43 Comparison of components of combustion gases between experimental results and calculations under the pressure of 4.1 MPa. Solid lines mean the results obtained by the theoretical calculations in equilibrium state. Keys are
the results by the experiments (Yamamoto, et al. 1997).
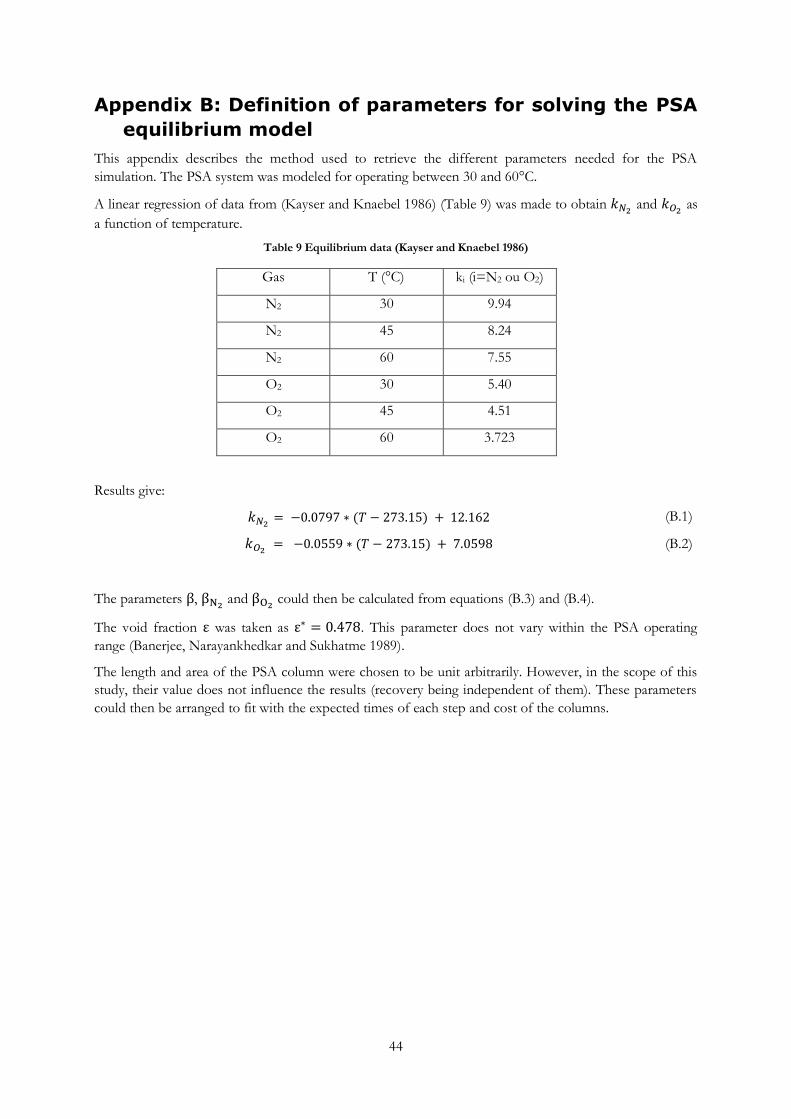
44
Appendix B: Definition of parameters for solving the PSA
equilibrium model
This appendix describes the method used to retrieve the different parameters needed for the PSA
simulation. The PSA system was modeled for operating between 30 and 60°C.
A linear regression of data from (Kayser and Knaebel 1986) (Table 9) was made to obtain and
as
a function of temperature.
Table 9 Equilibrium data (Kayser and Knaebel 1986)
Gas T (°C) ki (i=N2 ou O2)
N2 30 9.94
N2 45 8.24
N2 60 7.55
O2 30 5.40
O2 45 4.51
O2 60 3.723
Results give:
(B.1)
(B.2)
The parameters , and
could then be calculated from equations (B.3) and (B.4).
The void fraction was taken as . This parameter does not vary within the PSA operating
range (Banerjee, Narayankhedkar and Sukhatme 1989).
The length and area of the PSA column were chosen to be unit arbitrarily. However, in the scope of this
study, their value does not influence the results (recovery being independent of them). These parameters
could then be arranged to fit with the expected times of each step and cost of the columns.
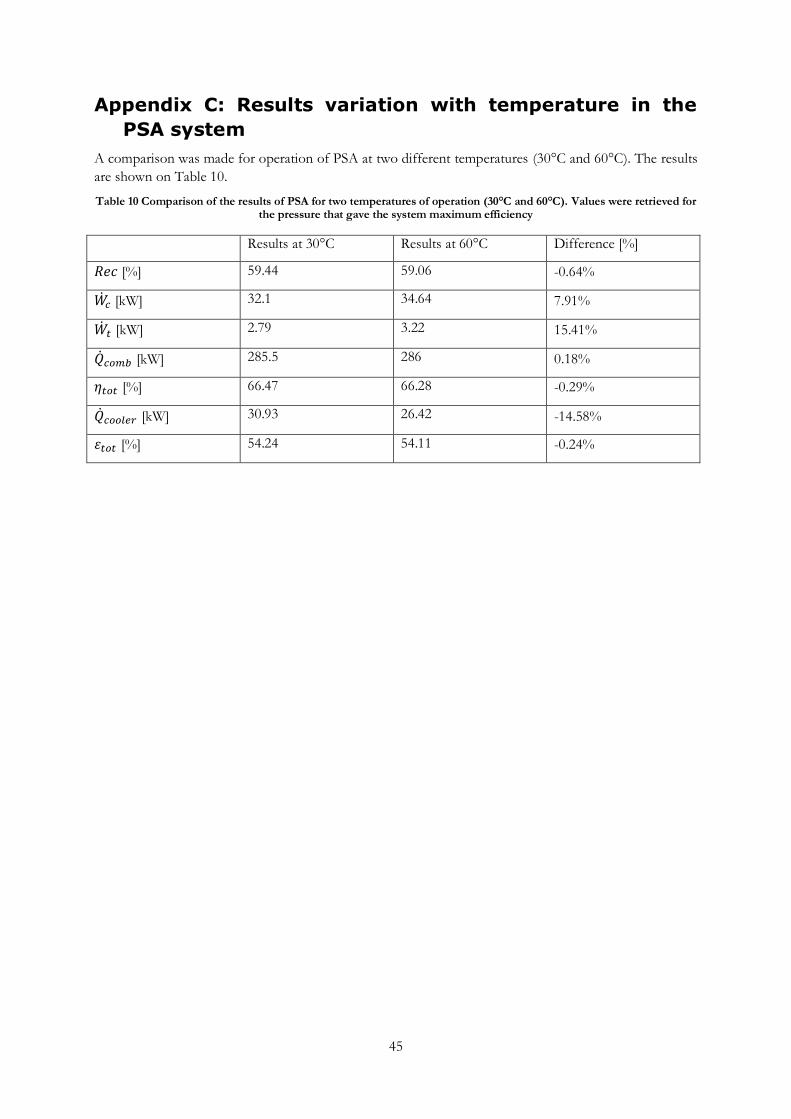
45
Appendix C: Results variation with temperature in the
PSA system
A comparison was made for operation of PSA at two different temperatures (30°C and 60°C). The results
are shown on Table 10.
Table 10 Comparison of the results of PSA for two temperatures of operation (30°C and 60°C). Values were retrieved for the pressure that gave the system maximum efficiency
Results at 30°C Results at 60°C Difference [%]
[%] 59.44 59.06 -0.64%
[kW] 32.1 34.64 7.91%
[kW] 2.79 3.22 15.41%
[kW] 285.5 286 0.18%
[%] 66.47 66.28 -0.29%
[kW] 30.93 26.42 -14.58%
[%] 54.24 54.11 -0.24%
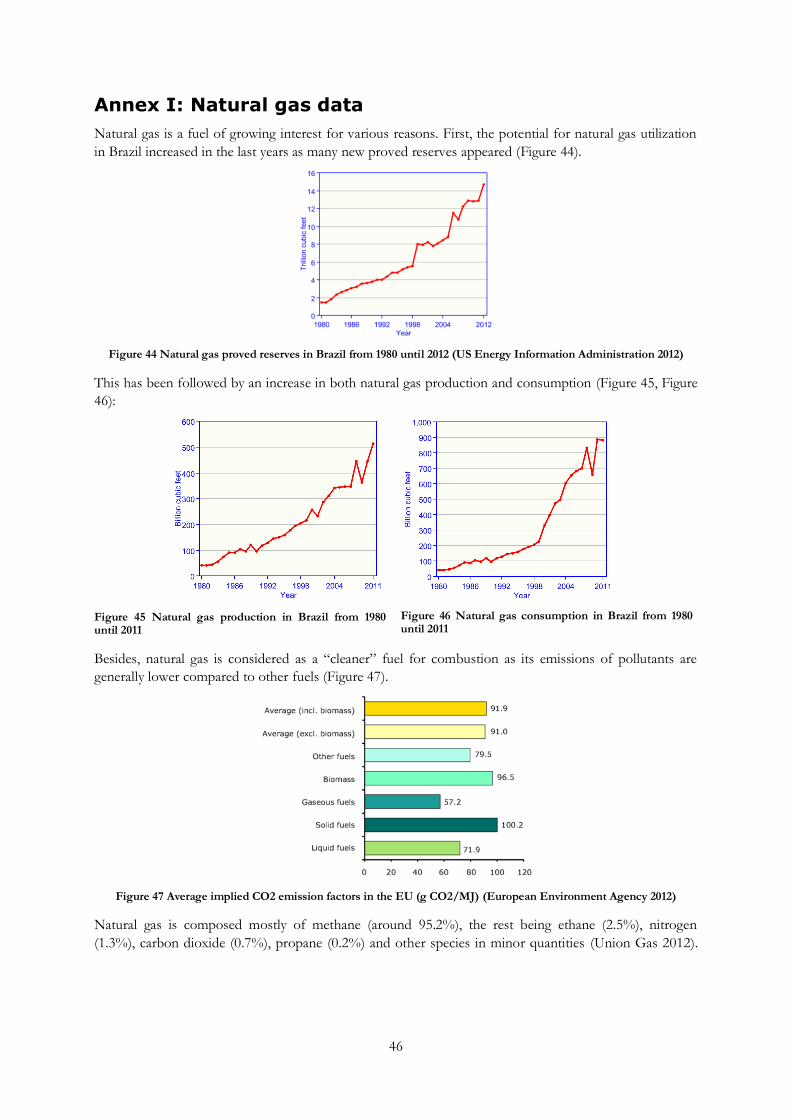
46
Annex I: Natural gas data
Natural gas is a fuel of growing interest for various reasons. First, the potential for natural gas utilization
in Brazil increased in the last years as many new proved reserves appeared (Figure 44).
Figure 44 Natural gas proved reserves in Brazil from 1980 until 2012 (US Energy Information Administration 2012)
This has been followed by an increase in both natural gas production and consumption (Figure 45, Figure
46):
Figure 45 Natural gas production in Brazil from 1980 until 2011
Figure 46 Natural gas consumption in Brazil from 1980 until 2011
Besides, natural gas is considered as a “cleaner” fuel for combustion as its emissions of pollutants are
generally lower compared to other fuels (Figure 47).
Figure 47 Average implied CO2 emission factors in the EU (g CO2/MJ) (European Environment Agency 2012)
Natural gas is composed mostly of methane (around 95.2%), the rest being ethane (2.5%), nitrogen
(1.3%), carbon dioxide (0.7%), propane (0.2%) and other species in minor quantities (Union Gas 2012).
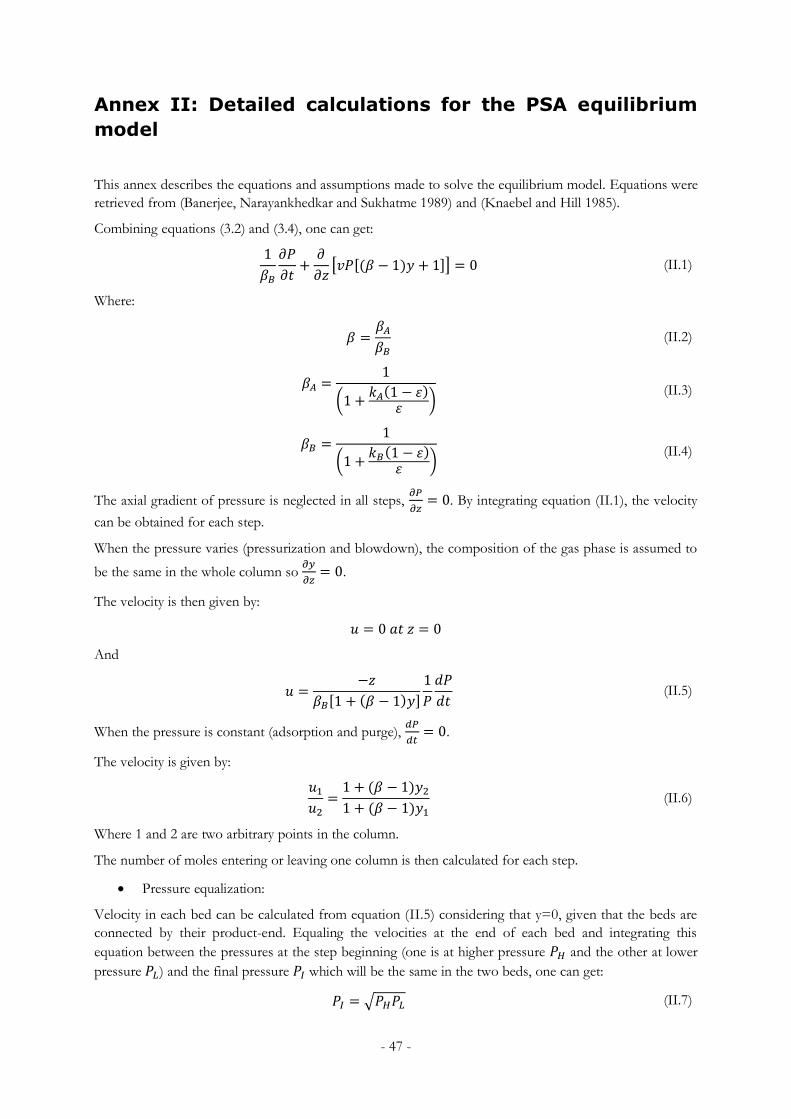
- 47 -
Annex II: Detailed calculations for the PSA equilibrium
model
This annex describes the equations and assumptions made to solve the equilibrium model. Equations were
retrieved from (Banerjee, Narayankhedkar and Sukhatme 1989) and (Knaebel and Hill 1985).
Combining equations (3.2) and (3.4), one can get:
[ [ ]] (II.1)
Where:
(II.2)
(
) (II.3)
(
)
(II.4)
The axial gradient of pressure is neglected in all steps,
. By integrating equation (II.1), the velocity
can be obtained for each step.
When the pressure varies (pressurization and blowdown), the composition of the gas phase is assumed to
be the same in the whole column so
.
The velocity is then given by:
And
[ ]
(II.5)
When the pressure is constant (adsorption and purge),
.
The velocity is given by:
(II.6)
Where 1 and 2 are two arbitrary points in the column.
The number of moles entering or leaving one column is then calculated for each step.
Pressure equalization:
Velocity in each bed can be calculated from equation (II.5) considering that y=0, given that the beds are
connected by their product-end. Equaling the velocities at the end of each bed and integrating this
equation between the pressures at the step beginning (one is at higher pressure and the other at lower
pressure ) and the final pressure which will be the same in the two beds, one can get:
√ (II.7)
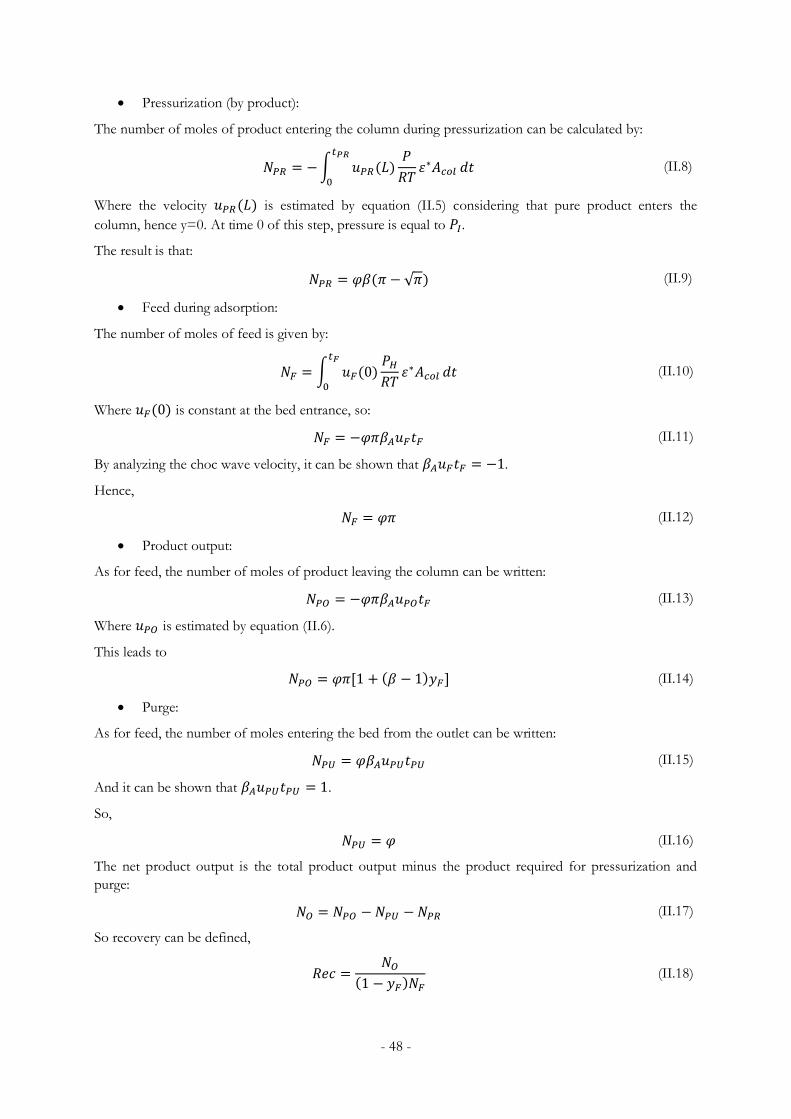
- 48 -
Pressurization (by product):
The number of moles of product entering the column during pressurization can be calculated by:
∫
(II.8)
Where the velocity is estimated by equation (II.5) considering that pure product enters the
column, hence y=0. At time 0 of this step, pressure is equal to .
The result is that:
√ (II.9)
Feed during adsorption:
The number of moles of feed is given by:
∫
(II.10)
Where is constant at the bed entrance, so:
(II.11)
By analyzing the choc wave velocity, it can be shown that .
Hence,
(II.12)
Product output:
As for feed, the number of moles of product leaving the column can be written:
(II.13)
Where is estimated by equation (II.6).
This leads to
[ ] (II.14)
Purge:
As for feed, the number of moles entering the bed from the outlet can be written:
(II.15)
And it can be shown that .
So,
(II.16)
The net product output is the total product output minus the product required for pressurization and
purge:
(II.17)
So recovery can be defined,
(II.18)