Embed Size (px)
Citation preview
Thermodynamic simulation of a multi-step externally1
fired gas turbine powered by biomass2
A. Durantea, G. Pena-Vergaraa, P.L. Curto-Rissoa, A. Medinab, A. Calvo3
Hernandezb4
aDepartamento de Termodinamica Aplicada, Universidad de la Republica, Montevideo,5
Uruguay6
bDepartment of Applied Physics, University of Salamanca, 37008 Salamanca, Spain7
Abstract8
A thermodynamic model for a realistic Brayton cycle, working as an ex-ternally fired gas turbine fueled with biomass is presented. The use of anexternal combustion chamber, allows to burn dirty fuels to preheat pure air,which is the working fluid for the turbine. It also avoids direct contact ofashes with the turbine blades, resulting in a higher life cycle for the turbine.The model incorporates a high temperature heat exchanger and an arbitrarynumber of turbines and compressors, with the corresponding number of in-tercoolers and reheaters. It considers irreversibilities such as non-isentropiccompressions and expansions, and pressure losses in heat input and release.The composition and temperature of the combustion gases, as well as thevariable flow rate of air and combustion gases, are calculated for specificbiomasses. The numerical model for a single stage configuration has beenvalidated by comparing its predictions with the data sheets of two commer-cial turbines. Results are in good agreement. Curves on the dependenceof thermal efficiency and power output with the overall pressure ratio willbe shown for several plant configurations with variable number of compres-sion/expansion stages. Also the influence of different types of biomasses andtheir moisture will be analyzed on parameters such as fuel consumption andexhaust gases temperature.
Keywords: Externally fired gas turbine, Open Brayton cycle, Solid9
biomass fuel, High temperature heat exchanger10
PACS: 05.70.Ln, 07.20.Pe, 84.60.-h11
Email addresses: [email protected] (A. Durante), [email protected] (G.Pena-Vergara), [email protected] (P.L. Curto-Risso), [email protected] (A. Medina),[email protected] (A. Calvo Hernandez)Preprint submitted to Energy Conversion and Management December 7, 2016
Nomenclature12
Main model variables13
Cmin: minimum heat capacity rate14
Cr: heat capacity ratio15
ha: enthalpy of air16
hfgH2O: vaporization enthalpy of water17
hg: enthalpy of exhaust gases18
K: coefficient depending on HTHE construction materials and geometry19
ma: air mass flow rate20
mf : fuel mass flow rate21
mg: exhaust gases mass flow rate22
Nc: number of compressors23
Nt: number of turbines24
p: cycle pressures25
P : power output26
rc: compressors pressure ratio27
rt: turbines pressure ratio28
T1: ambient temperature29
T2: temperature after each compression step30
T3: turbines inlet temperature31
T4: temperature at turbines outlet32
Tad: adiabatic flame temperature33
Te,1: exhaust temperature at the main combustion chamber34
2

Te,2: exhaust temperature at the intermediate reheaters35
Tf : fuel temperature at inlet36
xi: mole fractions37
∆pH : pressure decay at heat input38
∆pL: pressure decay in the cold side of the cycle39
ε: effectiveness of the HTHE40
εc: compressors isentropic efficiency41
εt: turbines isentropic efficiency42
γ12: mean adiabatic coefficient in compression43
γ34: mean adiabatic coefficient in expansion44
φ1: fuel-air equivalence ratio in the main combustion chamber45
φ2: fuel-air equivalence ratio in the reheaters46
η: fuel conversion efficiency47
Acronyms48
d.b.: dry basis49
EFGT: externally fired gas turbine50
LHV : lower heating value51
HTHE: high temperature heat exchanger52
NTU : number of heat transfer units53
UA: global exchange coefficient54
3
1. Introduction55
From the viewpoint of environmental concerns, sustainable development56
depends among other efforts on the reduction of greenhouse gases and the57
conservation of soil and water. These points require a rational use of fossil58
fuels and the utilization of renewable resources. Among human activities,59
energy production is one of the most intensively demanding natural resources.60
Simultaneously, it is by far the largest source of pollutant emissions. It could61
be stated with certainty that the future world energy supply will necessarily62
rely on a wide variety of energy resources, especially including renewable ones.63
Moreover, energy production should be adapted to the particular conditions64
and resources of countries or regions. Future technologies should combine65
high conversion efficiencies with low pollutant and greenhouse emissions.66
Biomass is getting more attention because it is considered to have zero67
net CO2 cycle [1, 2], as emitted CO2 is consumed by the growing plants.68
Biomass is available in different forms, as it comes from forestry and agricul-69
ture, but also from animal and biodegradable urban wastes [3]. Because we70
are dealing with a natural resource spread out over geographically large areas,71
transportation and processing costs make it interesting for medium or small72
scale decentralized power plants. These scales are smaller than what is usu-73
ally considered economically and thermodynamically advantageous for steam74
Rankine cycles [4]. Nevertheless, the use of gas turbines is advantageous due75
to their flexibility and scalability. Overall efficiencies of these plants usually76
is ranged between 15% for small plants to 30% for the largest ones. Anyway,77
these records are small compared for instance with standard combined cycle78
natural gas plants, but have the environmental benefits commented above.79
Gas turbines are machines that require very clean gas for reliable oper-80
ation. The externally fired gas turbine (EFGT) is a technology under de-81
velopment that tries to avoid the problem of burning dirty fuels to produce82
electricity through gas turbines. Since the working fluid through the turbine83
is separated from the combustion gases, the thermal power from combus-84
tion has to be transferred to the working fluid through a high temperature85
heat exchanger (HTHE). These heat exchangers are capable to operate at86
temperatures above 900°C. Ceramic materials are in the basis of their con-87
struction [5, 6]. EFGTs can be used in combined cycles such as Brayton88
(topping cycle) Rankine (bottoming) plants [7], heat and power (CHP) ap-89
plications [8], and also hybridized with other renewable resources as ther-90
mosolar [9, 10]. Datta et al. [11], Vera et al. [12], Soltani et al. [2] have91
4
reported energy and exergy analysis of EFGT plants in the kW range includ-92
ing gasification units for distributed power generation. A recent work by M.93
Bdour et al. [13] gives a thorough overview on previous studies on biomass94
fueled EFGTs.95
The aim of this work is to present and validate a thermodynamic model96
for an EFGT burning biomass. The model is stated in terms of the basic97
principles of thermodynamics and includes the main irreversibility sources98
existing in real installations. The model depends on a relatively low number99
of parameters, all of them with a clear physical interpretation. Key points in100
this kind of plants are considered in detail: the chemical reactions leading to101
the heat input in the cycle and the actual heat transfer in the HTHE. One102
of the main novelties of the model is that allows to consider an arbitrary103
number of compression steps with intermediate intercooling processes and104
also an arbitrary number of expansions with reheating between turbines.105
This strategy is devoted to search for plant configurations with increased106
overall efficiency, that the market is demanding. The model is validated in107
the case of a single stage configuration by comparing with real plants and108
then some results are obtained in relation to the influence of different types109
of biomass and their moisture on the plant performance. Also explicit curves110
on the dependence of power output and efficiency with the overall pressure111
ratio are shown. For instance, it will be demonstrated that power output of112
a plant with two compressors and one turbine is increased about 30% with113
respect to a single stage cycle without a large increasing of overall pressure114
ratio. Optimum pressure ratios to obtain maximum efficiency and power115
output are obtained for several plant configurations. Fuel consumption will116
be analyzed for different types of biomasses and also the influence of fuel117
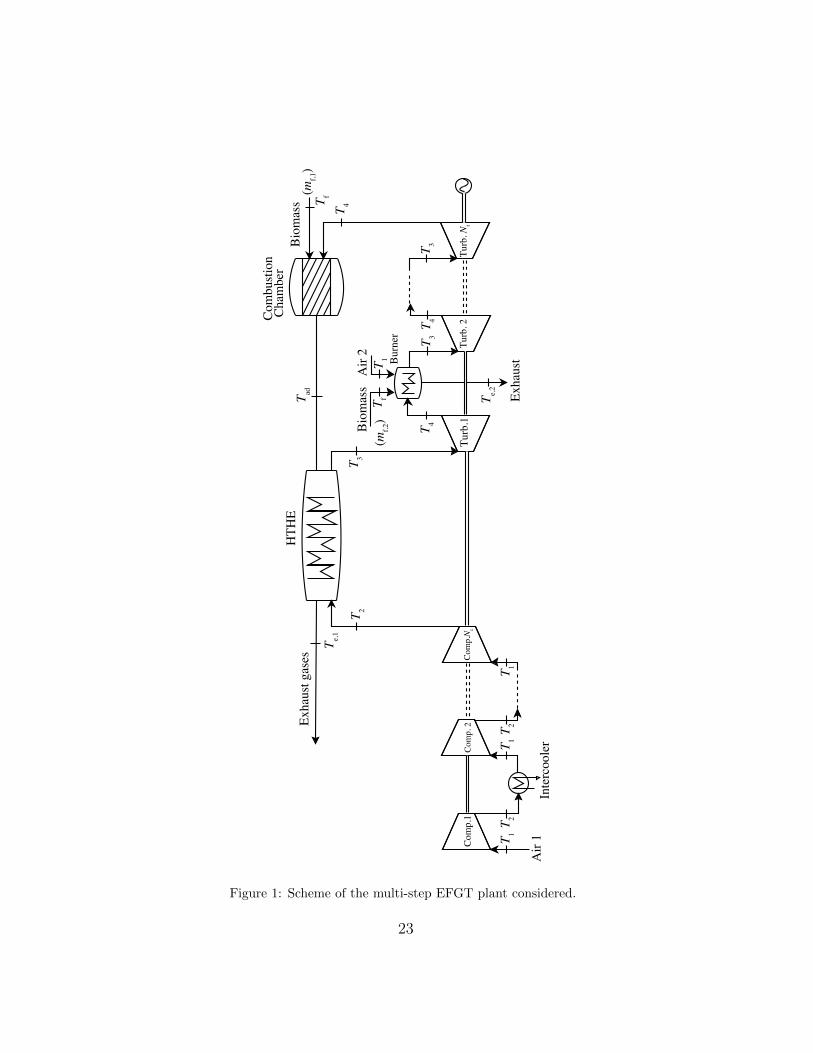
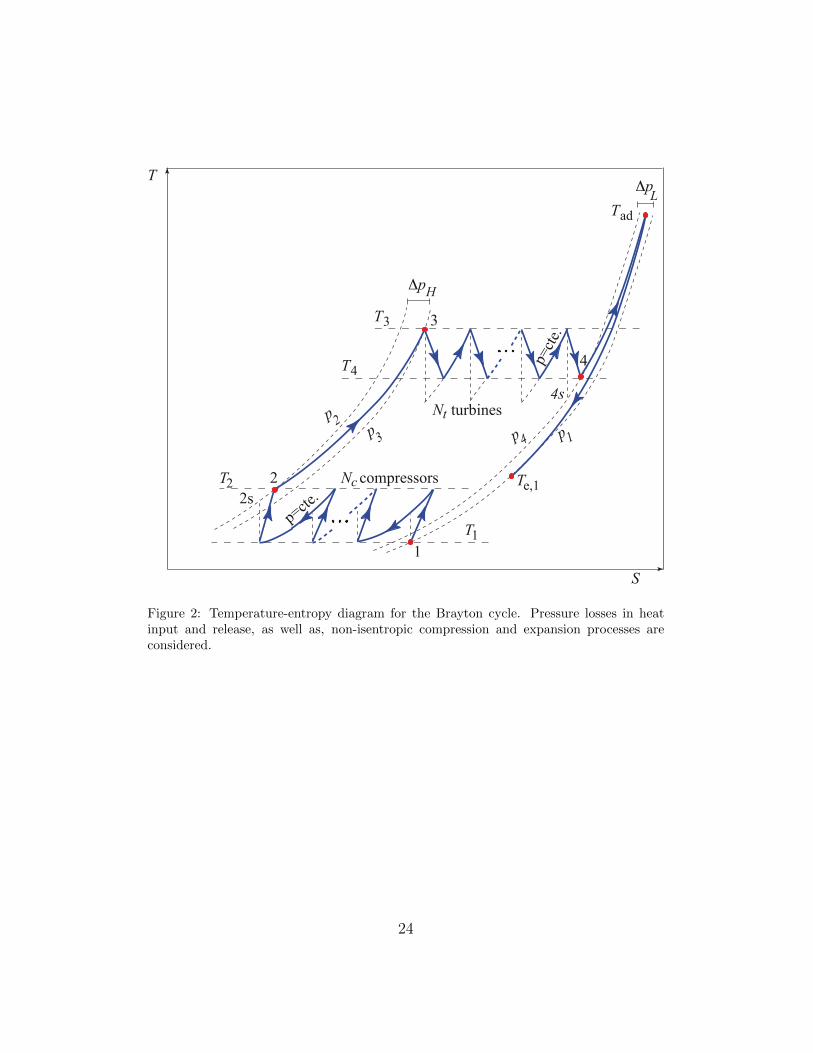
moisture on parameters as fuel consumption and exhaust gases temperature118
will be surveyed.119
2. Thermodynamic model120
The model considers an arbitrary number of turbines, Nt, and compres-121
sors, Nc, with the corresponding Nc− 1 intercoolers and Nt− 1 intermediate122
burners complemented with a combustion chamber fueled by biomass and123
a ceramic HTHE (see Fig. 1 for a layout of the EFGT and Fig. 2 for the124
corresponding T − S cycle).125
The working fluid entering the first compressor is air at pressure P1 and126
temperature T1. It is compressed by Nc non-adiabatic compressors to pres-127
5
sure P2 and temperature T2, taken as identical for all of them. Between128
each pair of compressors, heat is extracted by an intercooler in order to de-129
crease the temperature at each compressor inlet to T1. After compression130
processes the air increases its temperature up to T3 in the ceramic HTHE.131
The turbines inlet temperature T3, is fixed according to constructive and132
metallurgical limits. Then, air is expanded by Nt non-adiabatic turbines up133
to pressure P4 and temperature T4. In the main combustion chamber the134
biomass is burned with clean air coming from the last turbine at tempera-135
ture T4. The equivalence ratio, φ1, of this combustion is calculated so that136
the adiabatic flame temperature Tad allows the air to reach T3 at the exit of137
the HTHE. Exhaust gases leave the HTHE at a temperature Te,1. After each138
expansion process, heat is supplied by the intermediate burners in order to139
increase the temperature at each turbine inlet to T3. These burned gases are140
released to the ambient at temperature Te,2. The combustion in the burners,141
which allows to heat the clean air from T4 to T3 in a separate circuit, uses142
air from the ambient at T1. The equivalence ratio of this combustion, φ2, is143
calculated so that the adiabatic flame temperature obtained matches with144
the one reached in the main combustion chamber. As a design criterion, a145
pinch point of 100 K on the exhaust gases temperature, Te,2, is considered.146
The thermodynamic cycle is based on previous results reported by some147
of us for a closed multistep and recuperative Brayton gas turbine suitable for148
an arbitrary number of turbines and compressors [14, 15] and the correspond-149
ing reheating and intercooling processes. Such model was latter applied to150
the thermodynamic modeling of a solar-driven and a hybrid solar gas-turbine151
power plant [16, 17, 18]. The present work adapts the model, for external152
combustion, explicitly considering the chemical reactions in the combustion153
of solid biomass. Next, we detail the main assumptions and definitions for154
each stage of the EFGT starting from the ideal Brayton-like cycle and intro-155
ducing irreversibilities in real installations as pressure drops, non-ideal heat156
exchangers, and non-isentropic compressors and turbines.157
2.1. Compression and expansion processes158
In previous works it was demonstrated that in order to minimize power159
losses in the compression steps and maximize power output in the expansions,160
the pressure ratios of compressors should be identical, as well as, those for161
turbines [15, 19]. Under these conditions and assuming a mean isentropic162
6
coefficient for the air in each process, it is obtained that163
T2 = T1
[1 +
(ac − 1
εc
)](1)
where164
ac =T2sT1
= rγ12−1γ12
c (2)
and rc = (p2/p1)1/Nc is the pressure ratio of each compressor, γ12 the mean165
adiabatic coefficient in the 1→ 2 process, and εc the isentropic efficiency of166
each compressor defined as167
εc =T2s − T1T2 − T1
(3)
where T2s represents the working fluid temperature after isentropic compres-168
sion. Similarly, for the expansion we obtain:169
T4 = T3
[1− εt
(1− 1
at
)](4)
where170
at =T3T4s
= rγ34−1γ34
t (5)
and rt = (p3/p4)1/Nt is the pressure ratio of each turbine, γ34 the mean air171
adiabatic coefficient in the 3 → 4 process, and εt represents the isentropic172
efficiency of each turbine defined as173
εt =T3 − T4T3 − T4s
. (6)
where T4s represents the temperature at the turbines exit after an ideal isen-174
tropic expansion. Note in Fig.2 that the pressure ratio of each turbine and175
of each compressor are related by the pressure drops in the hot, ∆pH , and176
cold ∆pL sides of the heat exchangers as177
p3p4
=p2 −∆pHp1 + ∆pL
(7)
These equations allow to obtain the temperature after the compression pro-178
cess, T2, and after expansion, T4, in terms of the pressure ratios, air temper-179
ature before the first compressor, T1, and the turbine inlet temperature, T3.180
The latter will be taken as an input design parameter in the plant model.181
7
2.2. Combustion model182
In order to solve the chemistry and the energetics of combustion, weassume a solid wet fuel with a particular chemical composition and humidity.For any kind of biomass, the considered chemical reaction can be writtenas [20]:
Ca/12Hb/1Oc/16Nd/14+f H2O +αqφ
(O2 + 3.76N2) −→
βCO2 + γH2O + εCO + θH2 + νO2 + µN2 (8)
where Ca/12Hb/1Oc/16Nd/14 represents one mole of dry fuel and a, b, c, and d is183
the amount of each element in mass percentage. The coefficient f represents184
the moles of water per mole of dry fuel, αq the stoichiometric amount of185
O2 in air, and φ the fuel-air equivalence ratio. It is noteworthy that this186
model does not take into account the possible presence of sulphur in the187
fuel. This is assumed because the presence of sulphur on biomass is usually188
not significant. Particularly, the biomasses considered in this work contain189
less than 0.1% sulphur. The combustion reaction is solved following the190
procedure described by Medina et al. [21].191
2.3. Adiabatic flame temperature192
It will be assumed that all the energy released from combustion is trans-193
ferred to exhaust gases without losses, so Tad is the temperature of exhaust194
gases assuming an adiabatic combustion. Thus, it can be calculated through195
an enthalpy balance in this way:196
mfhf (Tf ) + maha(Tair) = mghg(Tad) (9)
where mf , ma, and mg are the mass flows of fuel, air, and burned gases197
respectively. The latter is obtained through a mass balance. It is assumed198
that the water in the fuel is in the liquid state at the fuel temperature, Tf .199
The specific enthalpy of air, ha, is evaluated at the temperature, Tair, that is200
T4 for the main combustion chamber and T1 for the intermediate burners.201
The enthalpies of the fuel and burned gases are calculated as follows.Once the composition of burned gases is obtained by solving the chemistryof the combustion reaction, its enthalpy is given by:
hg(T ) = xCO2hCO2(T ) + xH2OhH2O(T ) + xO2hO2(T ) + xN2hN2(T )+
xCO [hCO(T ) + LHVCO] + xH2 [hH2(T ) + LHVH2 ] + xashcp,ash(T − Tref)(10)
8
where xi stands for the moles of each chemical component per mass flow202
rate of combustion gases, LHVj is the lower heating value at reference tem-203
perature, Tref, of specie j, and cp,ash is the specific heat of ashes, taken as204
temperature independent. The enthalpy of the fuel at Tf is given by:205
hf (Tf ) = cp,f (Tf − Tref) + LHVf − f [hfgH2O − cp,H2O(Tf − Tref)] (11)
where hfgH2O is the enthalpy of vaporization of water at the reference tem-206
perature and cp,H2O is liquid water specific heat. In numerical calculations it207
will be taken Tf = Tref in order to overcome the specific heat of biomasses.208
Once Tad is calculated, the fuel ratio is estimated to meet the desired turbine209
inlet temperature, T3.210
2.4. HTHE effectiveness211
The effectiveness of the HTHE is defined as:212
ε =T3 − T2Tad − T2
(12)
This effectiveness depends, among other factors, on the mass flow rates,213
fluid properties and temperatures, and design criteria. An estimation cal-214
culated from the NTU method will be considered [22]. From this method,215
the effectiveness of any heat exchanger is a function depending on two pa-216
rameters: ε = ε(NTU,Cr) where NTU is the number of heat transfer units,217
NTU = UA/Cmin, UA is the global exchange coefficient, Cmin, the minimum218
heat capacity rate, and Cr = Cmin/Cmax, the heat capacity ratio. Considering219
a counter-flow scheme to model the HTHE [6, 22]:220
ε =1− e−NTU(1−Cr)
1− Cre−NTU(1−Cr)(13)
Taking the correlations of the Nusselt number for internal flow [22] and as-221
suming that the thermodynamic properties of the working fluids do not con-222
siderably change for the temperature intervals of the cycle, the convection223
coefficient for air and exhaust gases only depends on the mass rates of air224
and exhaust gases. Thus, considering an internal flow for air and an external225
staggered tube bank for burned gases, NTU can be expressed as [22]:226
NTU =K
Cmin
[m−0.8a + m−0.6
g
] (14)
9
where the coefficient K depends on the design of the heat exchanger (geom-227
etry and construction materials) and the thermodynamic properties of the228
working fluids. In the validation section will be detailed the type of HTHE229
taken for numerical computations. Once, the HTHE has been characterized,230
the energy and mass balances of the main flux read as:231
ma,1 [ha(T3)− ha(T2)] = mg,1 [hg,1(Tad)− hg,1(Te,1)] (15)
and mg,1 = ma,1 + mf,1 where ma,1 is the air mass flow rate through the232
compressors, mf,1 is the fuel rate in the main combustion chamber, and mg,1233
the mass flow rate of exhaust gases going through the main HTHE. The234
subscript 1 was included in all flow rates to distinguish the main flow from235
those in the intermediate burners as will be shown next.236
As depicted in Fig. 1, Nt − 1 intermediate burners ensure that the tem-237
perature at any turbine in the multi-step expansion is always the same, T3.238
With this aim the fuel-ratio is fitted in order to increase the temperature239
from T4 to T3 after each partial expansion. Thus, the enthalpy balance for240
each intermediate burner reads as:241
ma,1 [ha(T3)− ha(T4)] = mf,2hf (Tf ) + ma,2ha(T1)− mg,2(Te,2) (16)
In this equation, the subscript 2 applies for fuel and air mass flow rates at242
the intermediate burners. Te,2 is the temperature at the exhaust of these243
burners. It is noteworthy that the exhaust composition in this burners is244
different that in the main combustion chamber.245
2.5. Power and efficiency246
Once all the temperatures in the cycle were solved, the power output is247
calculated from:248
P = Ntma,1 [ha(T3)− ha(T4)]−Ncma,1 [ha(T2)− ha(T1)] (17)
The fuel conversion efficiency of the cycle gives the ratio between the actual249
power output and the available energy in the fuel flow rate [23], i.e.,250
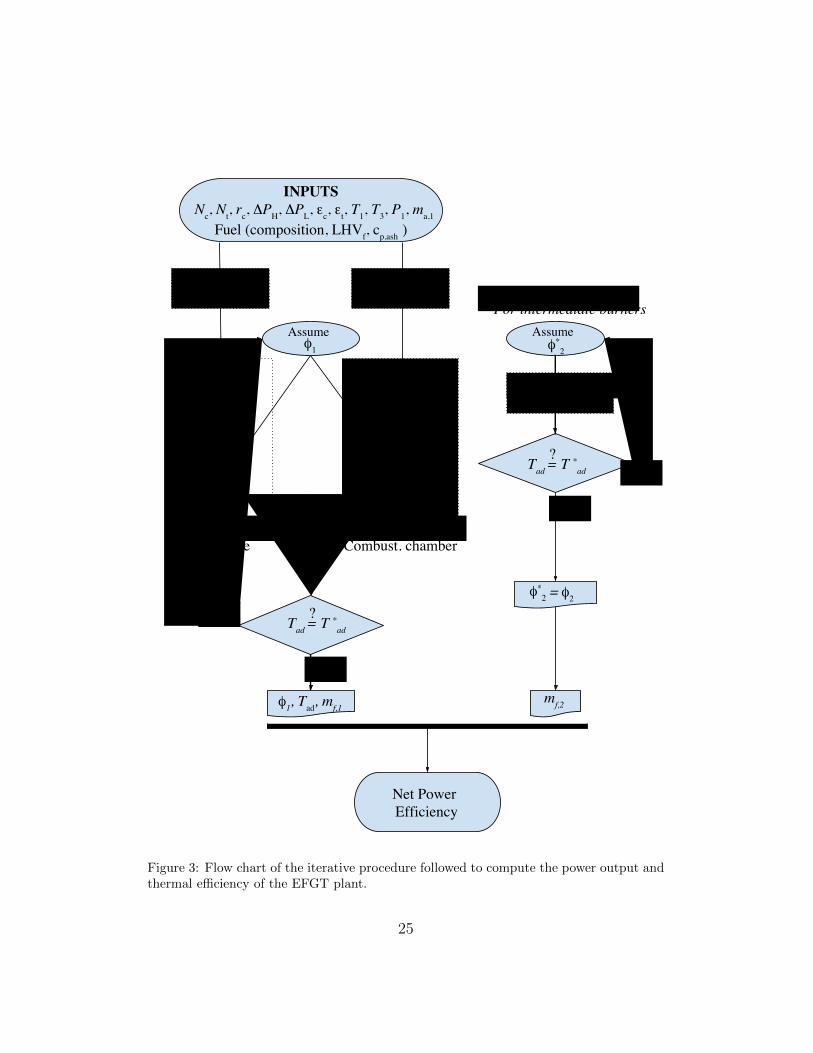
η =P
mf LHV(18)
where mf is the total fuel mass flow rate, that in the main combustion251
chamber and those in the intermediate burners, mf = mf,1 + mf,2. Figure 3252
is a flow chart showing how the submodels are linked in order to obtain the253
output records of the EFGT.254
10
3. Model validation and numerical computations255
It is difficult to find open and complete data sources for commercial EFGT256
turbines and still more complicated results for particular biomasses to com-257
pare with. We have applied the model developed in the previous sections258
to a particular one, AE-T100E micro turbine externally fired [24]. It is a259
single-shaft micro turbine with a centrifugal single stage compressor and a260
radial single stage turbine. Its performance records depend on the external261
heat source. With validation purposes, instead of using biomass, we obtained262
the parameters for that turbine fueled with methane. According to the man-263
ufacturer, the maximum turbine inlet temperature is 1123 K, the air mass264
flow rate 0.80 kg/s, the pressure ratio 4.5, and the electrical power output265
85 kW. Our model predicts a power output of 86.3 kW that only differs266
1.53% of the experimental one and an electrical efficiency of 23%, which is267
a reasonable value (the manufacturer gives an electrical efficiency of 30% for268
the same turbine with internal combustion and burning natural gas). For269
the calculations, the coefficient K in Eq. (14) was taken to match the maxi-270
mum effectiveness of a ceramic high temperature heat exchanger of the type271
developed in the work by de Mello and Monteiro [6].272
In order to complete the validation of the model, we have compared its273
predictions with a directly fired commercial gas turbine, for which detailed274
data are available. This is the one-shaft Turbec T100 micro turbine fueled275
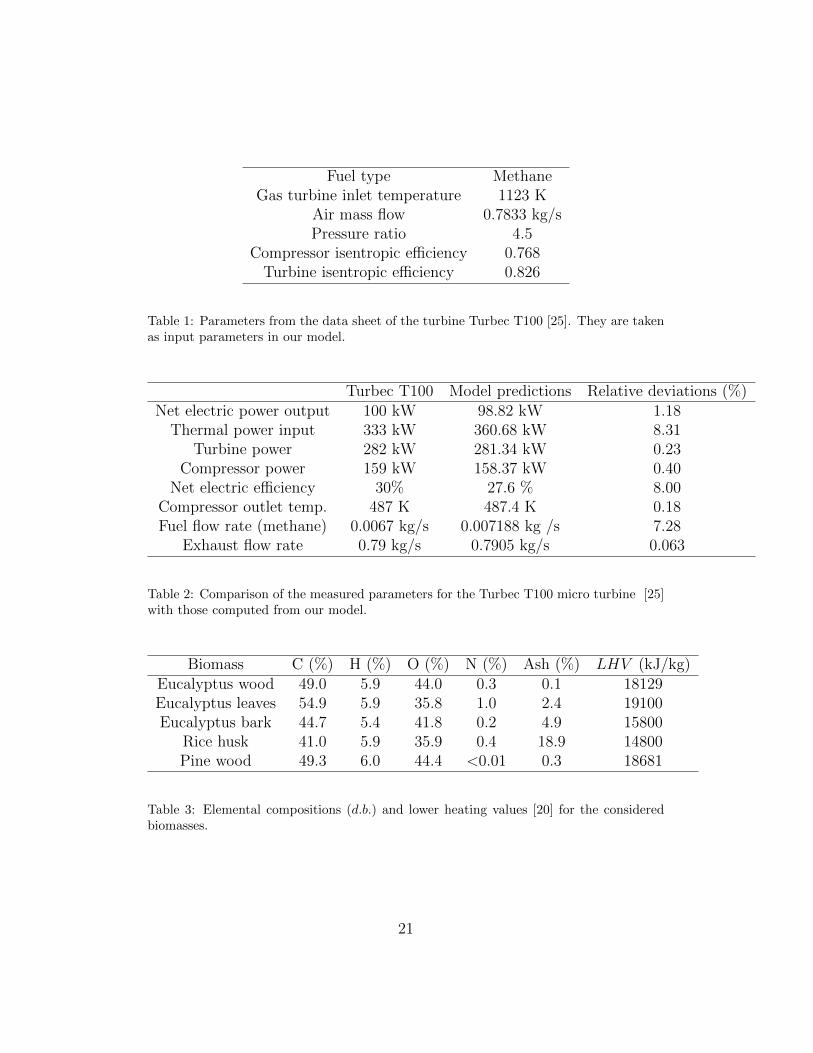
with natural gas [25]. Table 1 contains some parameters taken from the tur-276
bine data sheet and implemented in the model, and Table 2 the comparison277
of measured and model predicted data. As shown in Table 2, in spite of the278
differences in combustion (direct or external) model predictions are in good279
agreement with measured data.280
Eucalyptus wood is taken as the primary fuel for the numerical calcula-281
tions. Composition details in dry basis (d.b.) and lower heating value are282
collected in Table 3 [20]. Other biomasses (eucalyptus leaves and bark, rice283
husk, and pine wood) are additionally considered in order to analyze the in-284
fluence of fuel compositions and different heating values (see below). Ashes285
heat capacities were estimated by using the Neumann-Kropp rule [22] and286
their elemental composition [20]. It was found that ashes heat capacity for287
any type of biomass is between 0.74 and 0.80 kJ/(K kg), thus an effective288
value of 0.77 kJ/(K kg) was used in computations for all samples.289
11
3.1. Influence of pressure ratio290
The pressure ratio is one of the basic design parameters influencing Bray-291
ton cycle performance. The EFGT plant performance was computed as a292
function of pressure ratio, rc, for different configurations. Following Hor-293
lock’s notation [26]: CT, single step plant with one compressor and one294
turbine; CICT, two compressors, one intercooler, and one turbine; CTBT,295
one compressor and two turbines with an intermediate burner; and CICTBT,296
two compressors with intercooling, and two turbines with reheating. Pres-297
sure ratio was varied from 2 to 16 and eucalyptus wood was taken as fuel298
with 25% moisture on dry basis. The air mass flow is set to 1.0 kg/s, the299
ambient temperature to 300 K and the turbine inlet temperature to 1273 K.300
All other parameters, as compressors and turbines isentropic efficiencies are301
the same that for the Turbec T100 turbine, Table 1.302
Power output is depicted in Fig. 4. For the simplest one-step configu-303
ration, CT, power output presents a maximum at a relatively small value304
of the pressure ratio and afterwards it decays when pressure ratio increases.305
As indicated in Table 4 maximum power is found at about rc,maxP = 5.5,306
and leads to Pmax = 136 kW. As seen in Fig. 4, the inclusion of another307
compressor with the corresponding intercooler, configuration CICT is able308
to increase power output about 39% at a higher global pressure ratio, that309
now is rc,maxP = 9.5. The effect of adding a turbine with an intermediate310
reheater, CTBT, with respect to the basic CT layout provokes a similar effect311
in power output. It increases about 29% at the expense to take a pressure312
ratio about 10. In both configurations, the decrease of power output when rc313
is over its maximum value is very slow, which means that with pressure ratios314
above approximately 8 power output yield is good and quite insensitive to315
rc. Oppositely, to take advantage of the most complex layout, that with two316
compressors and two turbines, CICTBT, it is imperative to consider much317
higher values of pressure ratio. Just as a guide, the model predicts that this318
configuration is capable to increase P over the simplest layout at rc = 10,319
about 84%.320
Fuel conversion efficiency (see Fig. 5) presents a maximum in terms of the321
pressure ratio at not too high values of rc for all checked configurations except322
for CICTBT, where the maximum is over 16. For each case, the pressure ratio323
leading to maximum efficiency, rmax,η, is smaller than that corresponding to324
maximum power output, rc,maxP (see table 4). Maximum efficiency is found325
for the configuration CICT, 25%, closely followed by CT, 23%. In the case326
of more than one turbine, efficiency is penalized by the heat released by327
12
intermediate burners. Soltani et al. [1] have found a value of about 3.8 for328
the pressure ratio leading to maximum thermal efficiency for a CT plant329
with biomass gasification (taking as biomass wood with 20% moisture) and330
turbine inlet temperature of 1400 K. This value is very close to the predicted331
by our model, in spite that no gasification process is considered. In the case332
reported by Soltani et al. [1] maximum thermal efficiency was found to be333
32% for the Brayton cycle. When combining it with a bottoming Rankine334
efficiency increases to approximately 47%. Similarly, Kautz and Hansen [9]335
found a pressure ratio leading to maximum electrical efficiency at 2.9 for a336
recuperated CT configuration with turbine parameters from Turbec T100.337
In this case methane was taken as fuel and the turbine inlet temperature338
was set to 1223 K. The electric efficiency was raised from 16% to 30% by339
incorporating recuperation.340
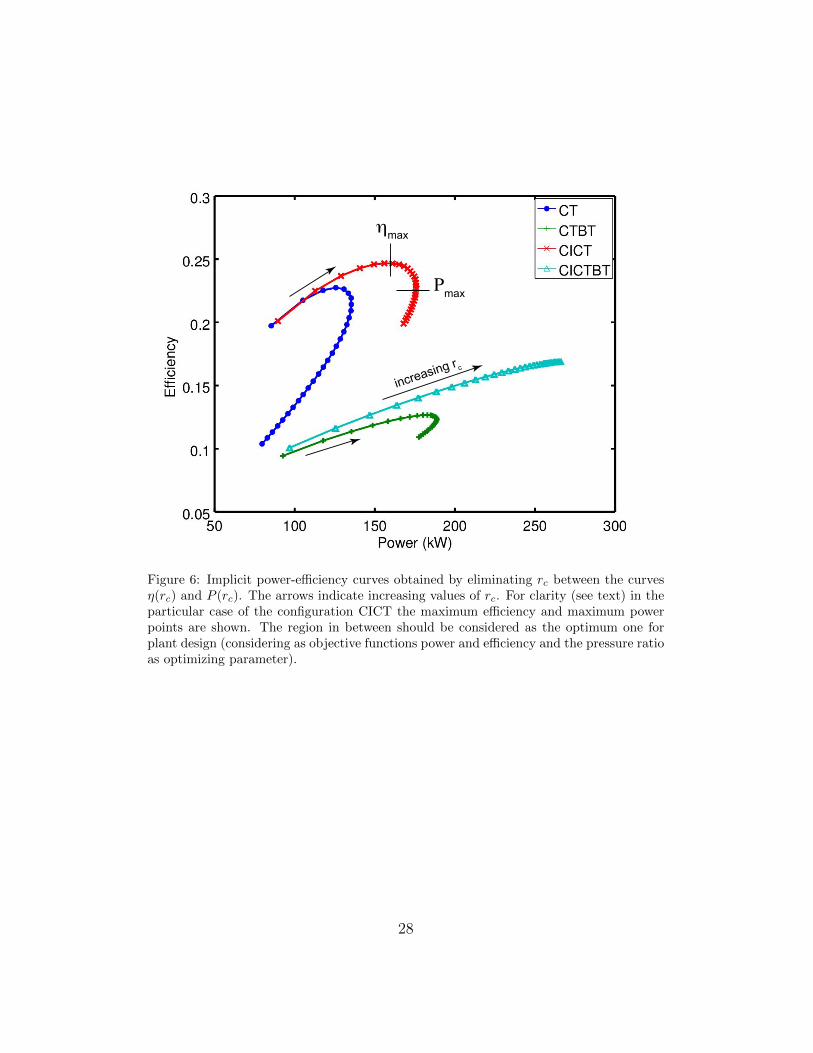
An alternative way to analyze the optimum range of parameters for the341
design of the system is by plotting the parametric power-efficiency curves.342
In the case shown in Fig. 6 the pressure ratio was taken as a parametric343
variable. The pressure ratio increases clockwise in the curves. The optimum344
range of rc is that corresponding to the interval between rc,maxη (that always345
is smaller than rc,maxP ) and rc,maxP . In the curves this is the interval between346
the highest point (maximum efficiency) and maximum power output (right-347
most point). Other configurations outside that region are not convenient in348
the sense that there exist other pressure ratios giving simultaneously more349
power and more efficiency. So, the optimal pressure ratio for plant design350
(at least in which respect to the optimization of efficiency and power out-351
put) should be a compromise between those ones. In the figure the curves352
corresponding to the configurations CT and CTBT are the narrowest. This353
means that the interval of pressure ratios leading to maximum efficiency or354
power is relatively narrow in these configurations and so, it is possible to355
attain reasonable good values of both output records simultaneously. This356
is reflected in Table 4, where it can be seen that this interval is between357
rc = 3.5 (maximum efficiency) and rc = 5.5 (maximum power output) for358
CT and between rc = 6.0 (maximum efficiency) and rc = 9.5 (maximum359
power output) for CTBT. On the other side, the maximum power output360
for the configuration CICTBT is reached for quite large values of rc, so the361
corresponding power efficiency curves is open (taking as plotting the interval362
for rc the same that for the other configurations). In any case the efficiency363
of the configurations with more than one turbine is small because the heat364
released by the intermediate burners is not efficiently profited in the cycle365
13
itself.366
The temperature of exhaust gases after the HTHE, Te,1 (see Fig. 1), is367
plotted in Fig. 7 against the pressure ratio. Exhaust temperature has a strong368
dependence on rc. In the model developed this is associated to the coupling369
between Eqs. (1) and (15). In the figure it is seen that there are two levels370
of exhaust temperatures. A higher one for the simplest configuration, CT,371
and that one with two turbines and an intermediate burner. And a lower one372
for the configurations with two compressors and intercooling between them,373
CICT and CICTBT. Roughly speaking, difference between these two levels374
is around 100 K for rc = 5. For all ayouts, exhaust temperatures are high, so375
it is feasible and advisable from the viewpoint of overall efficiency to couple376
the EFGT to a combined heat and power system or directly to include a377
bottoming steam Rankine cycle [27, 28].378
3.2. Analysis of different biomasses379
Numerical computations were performed for different biomasses, always380
considering an air flow mass of 1.0 kg/s, T1 = 300 K, T3 = 1173 K, and381
25% moisture on d.b. Pressure ratio was set to 4.5. Biomasses chemical382
composition is contained in Table 3 and fuel consumptions and efficiencies in383
Table 5. Eucalyptus wood was taken as reference biomass. From the table384
it is apparent that there are two levels of fuel consumption for eucalyptus385
wood, those corresponding to layouts with one turbine and those with two386
stage expansion. In the former fuel consumption is between 0.033 and 0.035387
kg/s and in the later about twice due to the consumption on the intermediate388
burner. This affects efficiency, that for the configurations CT and CICT is389
between 0.22 and 0.25 and for CTBT and CICTBT between 0.12 and 0.14.390
Comparing eucalyptus wood with other biomasses, eucalyptus leaves and391
pine wood result in reduced consumption for any plant layout (about 5.5%392
for eucalyptus leaves and 3.2% for pine wood) and so increased efficiency393
(between 0.42 and 0.84 for eucalyptus leaves and between 0.18 and 0.48 for394
pine wood). Due to the lower heating values of eucalyptus bark and rice husk,395
fuel consumption increase for these biomasses (about 17% for eucalyptus bark396
and about 25% for rice husk). In consequence, efficiency decreases between397
1.24% and 3.36%. Although they are not shown in the table other two types398
of biomasses were investigated, eucalyptus branches and eucalyptus tips. In399
both cases LHV is quite similar to eucalyptus leaves and so, fuel consumption400
and efficiencies are similar to eucalyptus wood.401
14
3.3. Influence of fuel moisture402
The influence of fuel moisture was analyzed in the case of eucalyptus403
wood biomass. All parameters were taken as in the preceding section except404
T3 that was taken as 1273 K. Cycle net power output is independent of fuel405
moisture if ambient and turbine inlet temperatures, and the air mass flow406
rates are fixed. On the contrary, fuel consumption and efficiency are sensitive407
to moisture. With increasing moisture a larger fuel mass rate is required to408
keep the turbine inlet temperature at the desired value, because less useful409
energy is contained in the fuel per unit mass. Figure 8 represents the behavior410
of fuel consumption in terms of moisture as a percentage on dry basis. Fuel411
consumption is of course larger for plant configurations with more than one412
turbine. For all configurations the shape of the increase of consumption413
with moisture is similar. It is not completely linear, but parabolic and to414
have a rough idea the increase amounts about 35 % in the whole interval,415
from 0 to 100% moisture. This increase in fuel consumption is reflected in416
efficiency as depicted in Fig. 9. The decrease in efficiency is almost linear for417
all layouts and has a higher slope for the cases CT and CICT. In the latter,418
the drop in the whole interval is very substantial, about 37 %. Al-Attab et419
al. [3] comment that 10% efficiency can be achieved by biomass pre-drying420
with fuel moisture content from 50% to 80%. From our calculations, it is421
predicted an increase between 8% and 14%, depending on the configuration,422
from 50% to 0% moisture.423
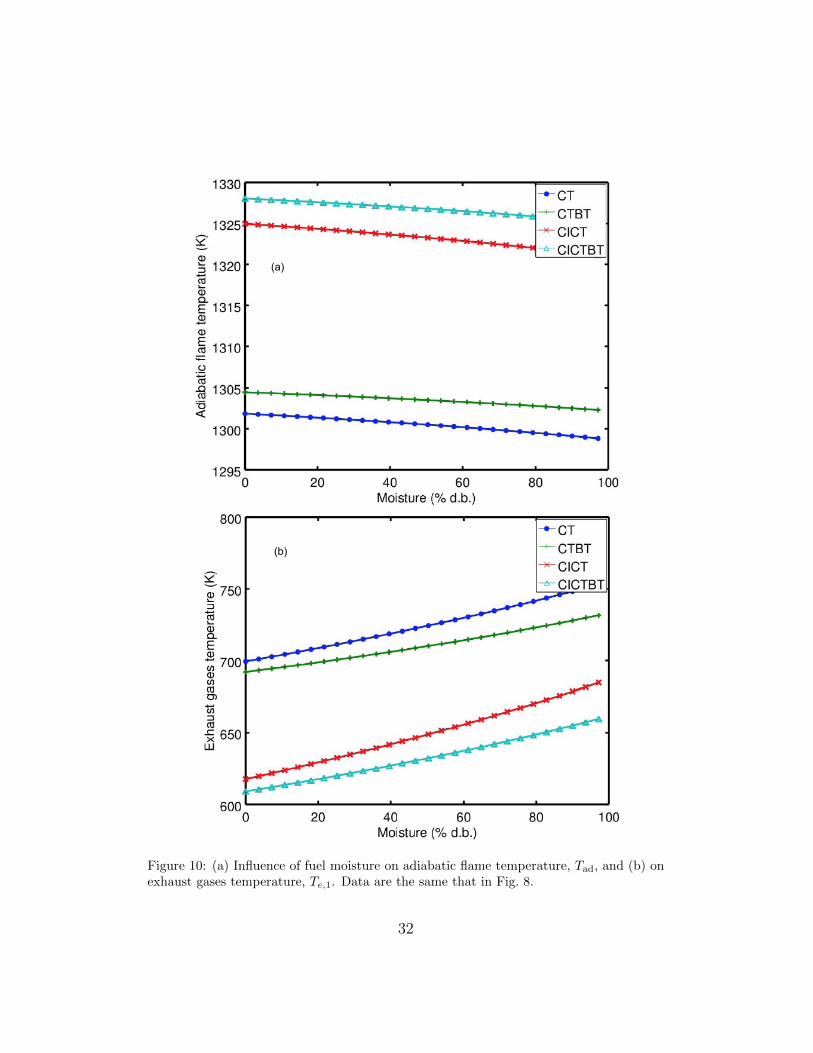
Adiabatic flame temperature in the main combustion chamber and the424
exhaust gases after the HTHE are plotted in Fig. 10. Provided that fuel425
consumption increases with the fuel moisture, the gas mass flow increases in426
order to keep constant the turbine inlet temperature. This makes larger the427
heat exchange at the HTHE and in consequence the adiabatic flame temper-428
ature in the main combustion chamber slightly decreases with increasing fuel429
moisture (see Fig. 10(a)). However, exhaust gases temperature appreciably430
increases with moisture (see Fig. 10(b)). For instance, for the configuration431
CICT, from about 893 K for 0% moisture to 953 K for 100%. This represents432
an increase of about 7%. This also influences the decline on efficiency curves433
in terms of moisture in the fuel.434
4. Summary and conclusions435
An original model for a plant producing electricity by means of a biomass436
externally fired gas turbine scheme has been developed, implemented, and437
15
validated. From the thermodynamic viewpoint, the model incorporates the438
possibility to analyze several plant configurations. An arbitrary number of439
compressors with intermediate intercooling and also an arbitrary number of440
turbines with in-between reheaters is considered. The model accounts for441
the main thermal losses in these kind of installations: non-ideal compres-442
sors and turbines and pressure losses in heat absorption and heat release. It443
is remarkable that the model includes detailed chemistry of combustion for444
several types of biomass and their moisture. The fuel-air ratios, both in the445
main combustion chamber as well as in the intermediate reheaters are explic-446
itly considered. Furthermore, specific calculations for the HTHE, assumed447
ceramic heat exchanger are included. So, the dependence of variable temper-448
ature ranges and working fluid mass rates are incorporated in the calculation449
of heat transfer and so, plant output records. The model allows to analyze450
all the most significant parameters in plant design and operation.451
A validation process has been followed, by comparing model predictions452
with a commercial mono-step EFGT fueled with methane. Deviations among453
model predictions and the real turbine are small. Also, a qualitative valida-454
tion by comparing with a directly fired gas turbine was performed. In all455
cases comparisons were satisfactory.456
With respect to the analysis of model predictions the work was focused457
on the power output scale of about one hundred kW and on two particu-458
lar points: on one hand, on the effects of pressure ratios on fuel conversion459
efficiency and power output, and on the other hand, on the influence of mois-460
ture in the fuel. Efficiency and power output curves when plotted against461
pressure ratio display a maximum. The curve of efficiency for the configura-462
tion CICT is, for any value of pressure ratio, above all other configurations463
checked. Pressure ratio leading to maximum efficiency is always lower than464
that corresponding to maximum power output. The incorporation of a sec-465
ond compressor over a basic one step configuration allows an important power466
output increase (about 30% for a pressure ratio giving maximum power) and467
an slight increase on maximum efficiency (that increases from 23% to 24.5%).468
The configurations with more than one turbine are not convenient except if469
some kind of recuperation mechanism is considered, because of the heat re-470
leased by intermediate reheaters to the ambient. Even in the more efficient471
configurations it would be possible to use a bottoming Rankine cycle to take472
advantage of the high temperatures of exhaust. The moisture of biomass has473
a clear influence on fuel consumption, efficiency, and exhaust gases temper-474
ature. For all these variables explicit curves were shown in all the moisture475
16
interval and for all the plant configurations analyzed. For instance a decrease476
of moisture from 50% d.b. to 0% will lead to increase efficiency between 8%477
and 14%, depending on the particular plant layout. Open for future work478
along this line is the search of plant schemes including recuperation from479
the main combustion chamber exhaust and in the case of multiple turbines480
from intermediate reheaters. Also, to enhance overall plant efficiency by cou-481
pling heat release to a bottoming cycle by means of a heat recovery steam482
generator.483
Acknowledgements484
A. Durante, G. Pena-Vergara, and P.L. Curto-Risso acknowledge sup-485
port from Agencia Nacional de Investigacion e Innovacion (ANII, Uruguay),486
grant FSE-1-2014-1-102079 and from the SNI program that supports their487
research. The authors from University of Salamanca are grateful for financial488
support from MINECO of Spain, Grant ENE2013-40644-R and University of489
Salamanca.490
17
[1] S. Soltani, S. M. S. Mahmoudi, M. Yari, M. A. Rosen, Thermodynamic491
analyses of an externally fired gas turbine combined cycle integrated492
with a biomass gasification plant, Ener. Conv. Manage. 70 (2013) 107–493
115.494
[2] S. Soltani, M. Yari, S. M. S. Mahmoudi, T. Morosuk, M. A. Rosen,495
Advanced exergy analysis applied to an externally-fired combined-cycle496
power plant integrated with a biomass gasification unit, Energy 59497
(2013) 775–780.498
[3] K. Al-Attab, Z. Zainal, Externally fired gas turbine technology, Appl.499
Energ. 138 (2015) 474–487.500
[4] B. Elmegaard, E. B. Qvale, G. Carapelli, P. de Faveri Tron, Open-cycle501
indirectly fired gas turbine for wet biomass fuels, in: Proceedings of Ef-502
ficiency, Cost, Optimization, Simulation, and Environmental Impact of503
Energy Systems (ECOS 2001), International Center for Applied Ther-504
modynamics, Istanbul, 2001, pp. 361–367.505
[5] B. Sunden, High temperature heat exchangers (HTHE), in: Proceed-506
ings of the Fifth International Conference on Enhanced, Compact and507
Ultra-Compact Heat Exchangers: Science, Engineering and Technology,508
Hoboken, NJ, USA, 2005.509
[6] P. E. B. de Mello, D. B. Monteiro, Thermodynamic study of an EFGT510
(Externally Fired Gas-Turbine) cycle with one detailed model for the511
ceramic heat exchanger, Energy 45 (2012) 497–502.512
[7] S. M. Camporeale, A. M. Pantaleo, P. D. Ciliberti, B. Fortunato, Cycle513
configuration analysis and techno-economic sensitivity of biomass exter-514
nally fired gas turbine with bottoming ORC, Ener. Conv. Manage. 105515
(2015) 1239–1250.516
[8] I. W. Eames, K. Evans, S. Pickering, A comparative study of open and517
closed heat-engines for small scale CHP applications, Energies 9 (2016)518
130.519
[9] M. Kautz, U. Hansen, The externally fired gas turbine (EFGT-cycle)520
for decentralized use of biomass, Appl. Energ. 84 (2007) 795–805.521
18
[10] Q. Liu, Z. Bai, X. Wang, J. Lei, H. Jin, Investigation of thermody-522
namic performances for two solar-biomass hybrid combined cycle power523
generation systems, Ener. Conv. Manage. 122 (2016) 252–262.524
[11] A. Datta, R. Ganguly, L. Sarkar, Energy and exergy analyses of an525
externally fired gas turbine (EFGT) cycle with biomass gasifier for dis-526
tributed power generation, Energy 35 (2010) 341–350.527
[12] D. Vera, F. Jurado, B. de Mena, G. Schories, Comparison between ex-528
ternally fired gas turbine and gasifier-gas turbine system for the olive oil529
industry, Energy 36 (2011) 6720–6730.530
[13] M. Bdour, M. Al-Addous, M. Nelles, A. Ortwein, Determination of op-531
timized parameters of the flexible operation of a biomass-fueled, mi-532
croscale externally fired gas turbine (EFGT), Energies 9 (2016) 856.533
[14] A. Calvo Hernandez, A. Medina, J. M. M. Roco, Power and efficiency in534
a regenerative gas turbine, J. Phys. D: Appl. Phys. 28 (1995) 2020–23.535
[15] A. Calvo Hernandez, J. M. M. Roco, A. Medina, Power and efficiency536
in a regenerative gas-turbine with multiple reheating and intercooling537
stages, J. Phys. D: Appl. Phys. 29 (1996) 1462–68.538
[16] S. Sanchez-Orgaz, A. Medina, A. Calvo Hernandez, Thermodynamic539
model and optimization of a multi-step irreversible Brayton cycle, Energ.540
Convers. Manage. 51 (2010) 2134–43.541
[17] S. Sanchez-Orgaz, A. Medina, A. Calvo Hernandez, Recuperative solar-542
driven multi-step gas turbine power plants, Energ. Convers. Manage. 67543
(2013) 171–178.544
[18] D. Olivenza-Leon, A. Medina, A. Calvo Hernandez, Thermodynamic545
modeling of a hybrid solar gas-turbine power plant, Energ. Convers.546
Manage. 93 (2015) 435–447.547
[19] B. D. Joshi, Thermodynamic work for n-step isothermal processes in-548
volving an ideal gas, J. Chem. Educ. 63 (1986) 24–25.549
[20] L. Barbosa, E. Silva, E. Olivares, Biomassa para energia, Editora Uni-550
camp, 2008.551
19
[21] A. Medina, P. L. Curto-Risso, A. Calvo Hernandez, L. Guzman-Vargas,552
F. Angulo-Brown, A. K. Sen, Quasi-dimensional simulation of spark553
ignition engines, Springer, 2014, Appendix E.554
[22] T. Bergman, A. Lavine, F. Incropera, D. Dewitt, Fundamentals of heat555
and mass transfer, 7th Edition, Wiley, 2012.556
[23] J. Heywood, Internal Combustion Engine Fundamentals, McGraw-Hill,557
1988.558
[24] [link].559
URL http://www.atetsrl.it/Content/Atet/Images/Partner/Ansaldo/allegato%20(3).pdf560
[25] [link].561
URL http://people.unica.it/danielecocco/files/2012/07/Microturbina T100 Detailed Specifications1.pdf562
[26] J. Horlock, Advanced Gas Turbine Cycles, Pergamon, Oxford, 2003.563
[27] R. Carapellucci, A unified approach to assess performance of different564
techniques for recovering exhaust heat from gas turbines, Ener. Conv.565
Manage. 50 (2016) 1218–1226.566
[28] Y. Cao, Y. Gao, Y. Zheng, Y. Dai, Optimum design and thermodynamic567
analysis of a gas turbine and ORC combined cycle with recuperators,568
Ener. Conv. Manage. 116 (2016) 32–41.569
20
Fuel type MethaneGas turbine inlet temperature 1123 K
Air mass flow 0.7833 kg/sPressure ratio 4.5
Compressor isentropic efficiency 0.768Turbine isentropic efficiency 0.826
Table 1: Parameters from the data sheet of the turbine Turbec T100 [25]. They are takenas input parameters in our model.
Turbec T100 Model predictions Relative deviations (%)Net electric power output 100 kW 98.82 kW 1.18
Thermal power input 333 kW 360.68 kW 8.31Turbine power 282 kW 281.34 kW 0.23
Compressor power 159 kW 158.37 kW 0.40Net electric efficiency 30% 27.6 % 8.00
Compressor outlet temp. 487 K 487.4 K 0.18Fuel flow rate (methane) 0.0067 kg/s 0.007188 kg /s 7.28
Exhaust flow rate 0.79 kg/s 0.7905 kg/s 0.063
Table 2: Comparison of the measured parameters for the Turbec T100 micro turbine [25]with those computed from our model.
Biomass C (%) H (%) O (%) N (%) Ash (%) LHV (kJ/kg)Eucalyptus wood 49.0 5.9 44.0 0.3 0.1 18129Eucalyptus leaves 54.9 5.9 35.8 1.0 2.4 19100Eucalyptus bark 44.7 5.4 41.8 0.2 4.9 15800
Rice husk 41.0 5.9 35.9 0.4 18.9 14800Pine wood 49.3 6.0 44.4 <0.01 0.3 18681
Table 3: Elemental compositions (d.b.) and lower heating values [20] for the consideredbiomasses.
21
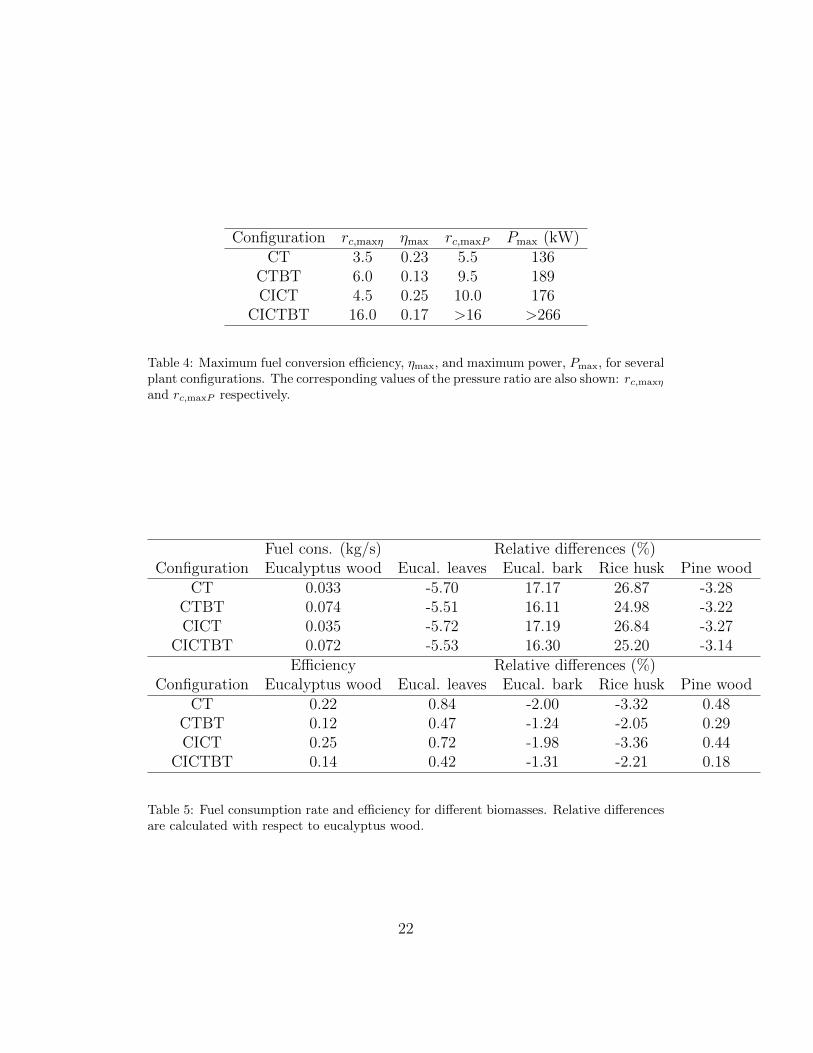
Configuration rc,maxη ηmax rc,maxP Pmax (kW)CT 3.5 0.23 5.5 136
CTBT 6.0 0.13 9.5 189CICT 4.5 0.25 10.0 176
CICTBT 16.0 0.17 >16 >266
Table 4: Maximum fuel conversion efficiency, ηmax, and maximum power, Pmax, for severalplant configurations. The corresponding values of the pressure ratio are also shown: rc,maxη
and rc,maxP respectively.
Fuel cons. (kg/s) Relative differences (%)Configuration Eucalyptus wood Eucal. leaves Eucal. bark Rice husk Pine wood
CT 0.033 -5.70 17.17 26.87 -3.28CTBT 0.074 -5.51 16.11 24.98 -3.22CICT 0.035 -5.72 17.19 26.84 -3.27
CICTBT 0.072 -5.53 16.30 25.20 -3.14Efficiency Relative differences (%)
Configuration Eucalyptus wood Eucal. leaves Eucal. bark Rice husk Pine woodCT 0.22 0.84 -2.00 -3.32 0.48
CTBT 0.12 0.47 -1.24 -2.05 0.29CICT 0.25 0.72 -1.98 -3.36 0.44
CICTBT 0.14 0.42 -1.31 -2.21 0.18
Table 5: Fuel consumption rate and efficiency for different biomasses. Relative differencesare calculated with respect to eucalyptus wood.
22
Com
p.1
Com
p. 2
Com
p.N
cTu
rb.1
Turb
. 2Tu
rb. N
t
Bio
mas
s
Air
1
HTH
E
Inte
rcoo
ler
Bur
ner
Exha
ust g
ases
Exh
aust
Com
bust
ion
Cha
mbe
r
T ad
T 4T 3
T 4T 3
T 4T f
Bio
mas
sA
ir 2
T 1T f
(mf,1
)
(mf,2
)
T e,2
T 3T 2
T e,1
T 2T 2
T 1T 1
T 1
Figure 1: Scheme of the multi-step EFGT plant considered.
23
N turbinest
N compressorsc
T
S
ΔpH
ΔpL
. . .
. . .
1
22s
3
4
4sp 2
p 1
T3
T1p=cte
.
p=cte
.
T4
T2
p 3 p 4
Te,1
Tad
Figure 2: Temperature-entropy diagram for the Brayton cycle. Pressure losses in heatinput and release, as well as, non-isentropic compression and expansion processes areconsidered.
24
T2
Assume
T4
INPUTS
YES
NO
Assume
For intermediate burners
NO
YES
Net PowerEfficiency
Heat exchangertransference
Energy balanceCombust. chamber
Compressor parameters
Turbine parameters
Energy balanceon burners
Nc, Nt, rc, ΔPH, ΔPL, εc, εt, T1, T3, P1, ma,1
Fuel (composition, LHVf, cp,ash )
φ1
Tad = T *ad
φ1, Tad, mf,1
?
Tad = T *ad
?
Tad T *ad
φ*2
φ*2 = φ2
mf,2
Figure 3: Flow chart of the iterative procedure followed to compute the power output andthermal efficiency of the EFGT plant.
25
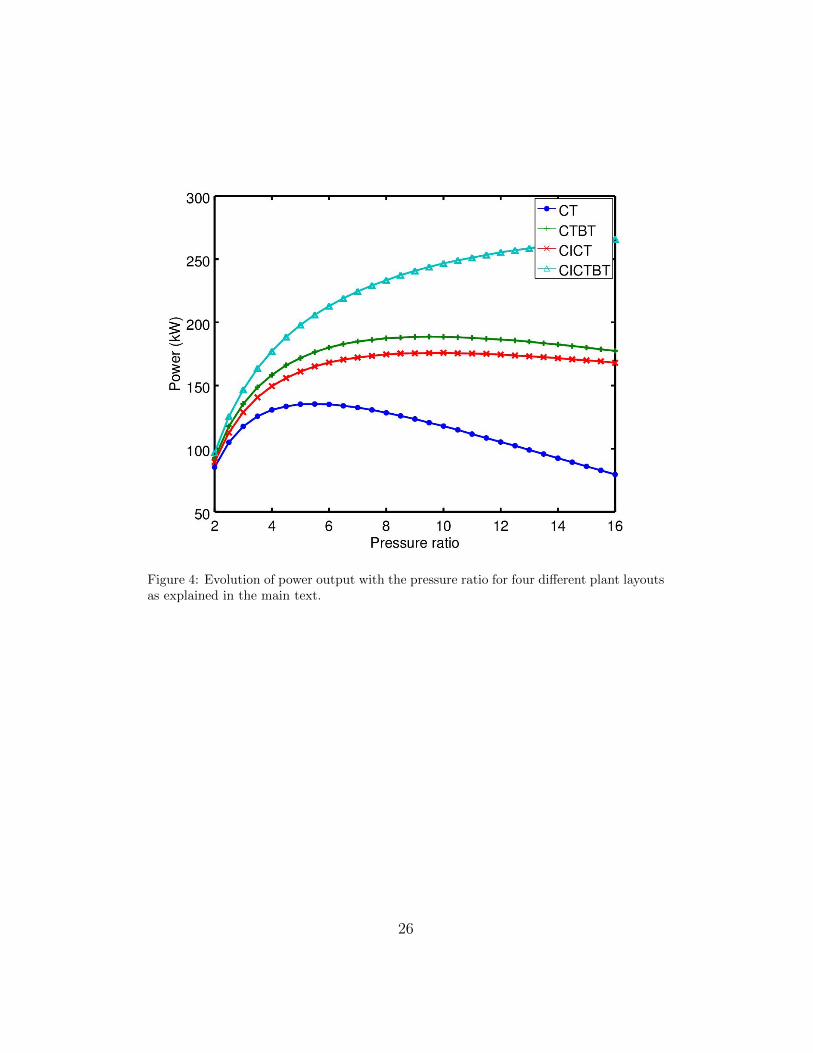
Figure 4: Evolution of power output with the pressure ratio for four different plant layoutsas explained in the main text.
26
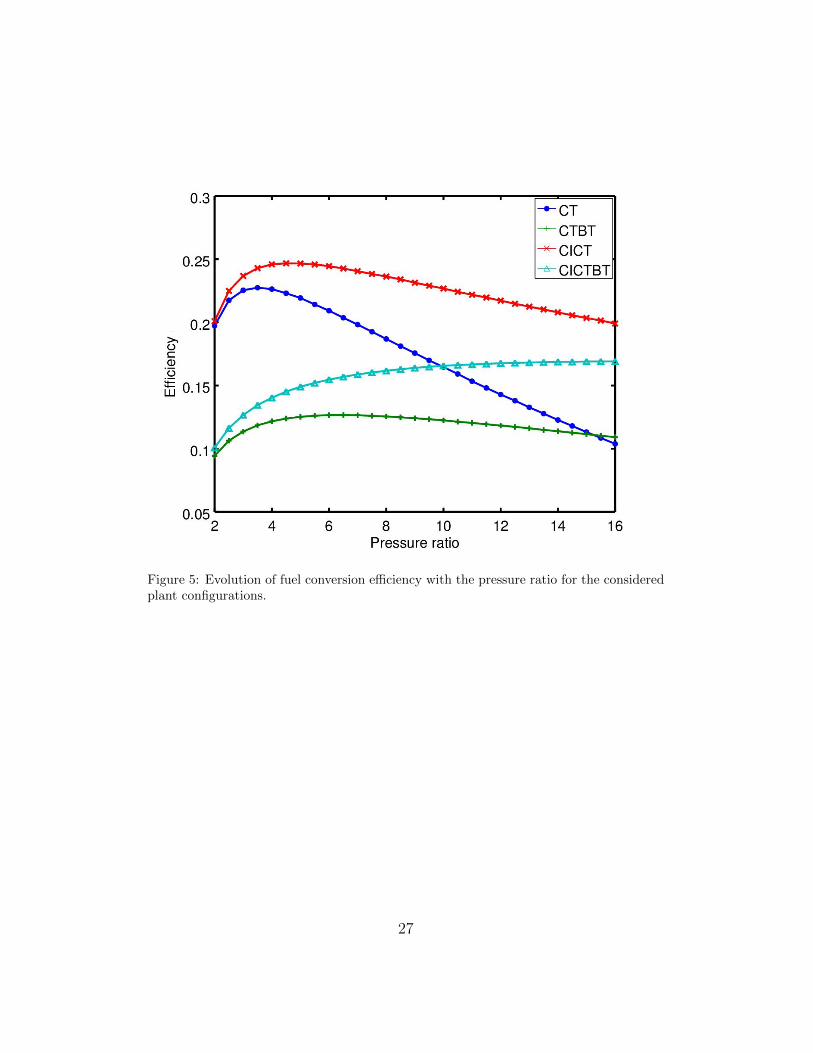
Figure 5: Evolution of fuel conversion efficiency with the pressure ratio for the consideredplant configurations.
27
increasing r c
ηmax
Pmax
Figure 6: Implicit power-efficiency curves obtained by eliminating rc between the curvesη(rc) and P (rc). The arrows indicate increasing values of rc. For clarity (see text) in theparticular case of the configuration CICT the maximum efficiency and maximum powerpoints are shown. The region in between should be considered as the optimum one forplant design (considering as objective functions power and efficiency and the pressure ratioas optimizing parameter).
28
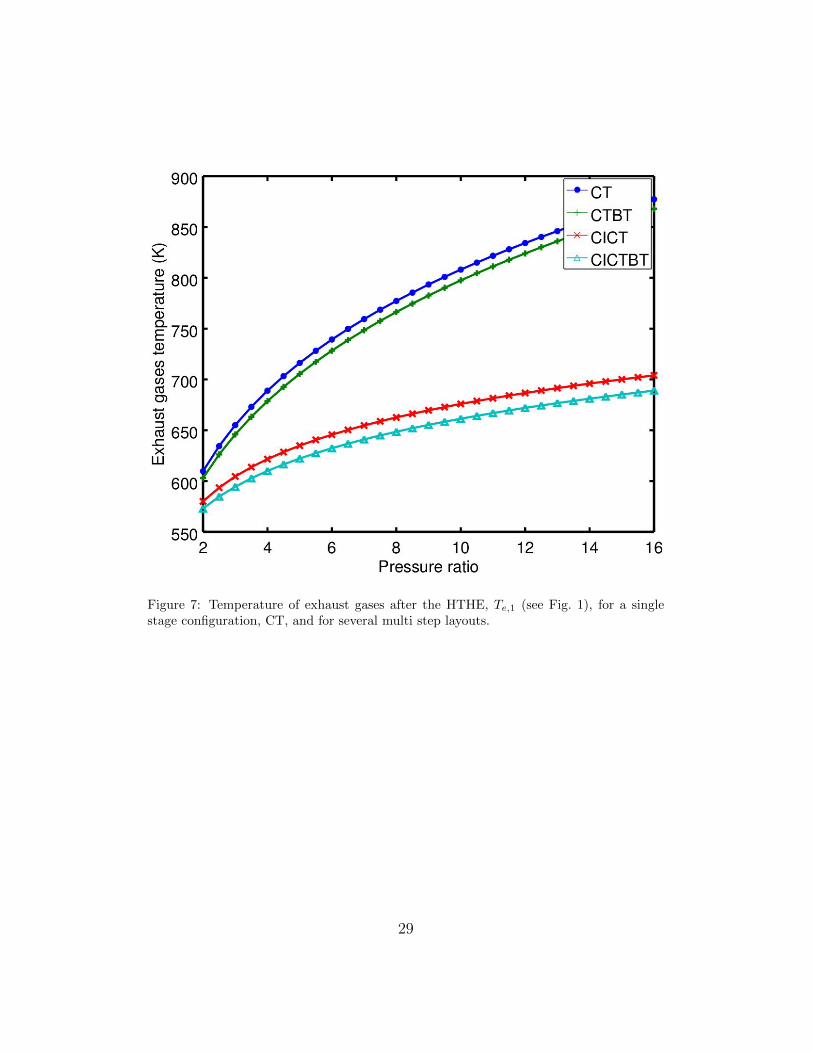
Figure 7: Temperature of exhaust gases after the HTHE, Te,1 (see Fig. 1), for a singlestage configuration, CT, and for several multi step layouts.
29

Figure 8: Dependence of fuel consumption with fuel moisture in the case of burning euca-lyptus wood. Pressure ratio was fixed at 4.5 and the plant layout includes two compressorsand one turbine, CICT configuration. The air mass flow in the combustion chamber wasset to 1.0 kg/s, the ambient temperature at 300 K, and the turbine inlet temperature at1273 K.
30
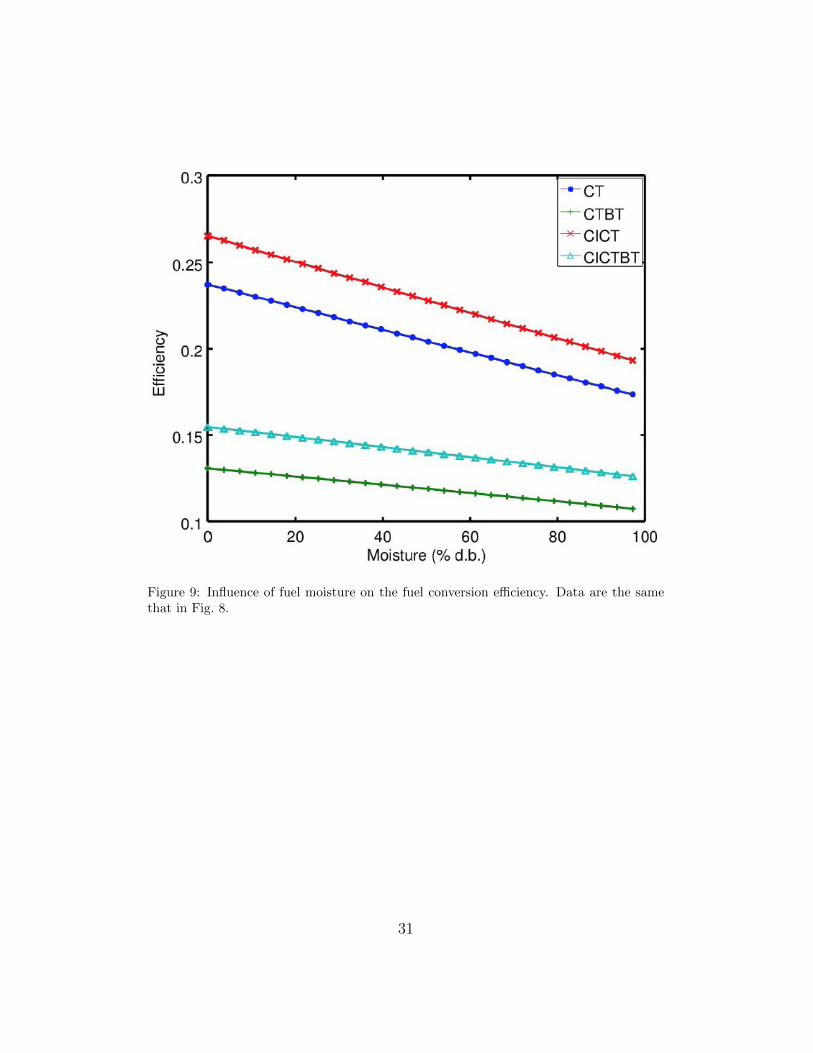
Figure 9: Influence of fuel moisture on the fuel conversion efficiency. Data are the samethat in Fig. 8.
31
(a)
(b)
Figure 10: (a) Influence of fuel moisture on adiabatic flame temperature, Tad, and (b) onexhaust gases temperature, Te,1. Data are the same that in Fig. 8.
32