Embed Size (px)
Citation preview
J. Chem. Thermodynamics 1996, 28, 819–841
Thermodynamic properties of pyridine
II. Comparisons of new recommended values with
the literature a, b
R. D. Chirico and W. V. Steele
BDM-Oklahoma Inc., National Institute for Petroleum and Energy Research,P.O. Box 2565, Bartlesville, OK 74005-2565, U.S.A.
Thermodynamic properties of pyridine (Chemical Abstracts registry number 110-86-1) arereviewed, and detailed comparisons between literature values and new recommended values ofthis research are provided. Properties reviewed are condensed- and gas-phase molar heatcapacities, the molar enthalpy of combustion, vapor pressures, densities, critical properties,virial coefficients, molar enthalpies of vaporization, and molar thermodynamic propertiesderived from assigned vibrational spectra. In a companion paper to this review, new vaporpressures, high-temperature molar heat capacities, and densities are reported which show thatpreviously assessed values for pyridine require revision. Recommendations are made for valuesof all properties reviewed. Thermodynamic consistency between properties is emphasized.7 1996 Academic Press Limited
1. Introduction
This review was completed as part of a research program, funded by the Departmentof Energy (DOE) Office of Fossil Energy, Advanced Oil Recovery (AOR) program,to provide thermochemical and thermophysical properties for ‘‘key’’ compoundsrelated to the upgrading of fossil fuels. In the experimental portion of this research,(1)
new vapor pressures, high-temperature molar heat capacities, and densities arereported which show that previously assessed values for pyridine require revision.The thermodynamic properties of pyridine were reviewed recently by Das et al.(2) aspart of a review of organic nitrogen compounds completed at the Thermodynamics
a Contribution number 358 from the Thermodynamics Research Group at the National lnstitute forPetroleum and Energy Research.
b By acceptance of this article for publication, the publisher recognizes the Government’s (license) rightsin any copyright and the Government and its authorized representatives have unrestricted right toreproduce in whole or in part said article under any copyright secured by the publisher. This report wasprepared as an account of work sponsored by an agency of the United States Government. Neither theUnited States Government nor any agency thereof, nor any of their employees, makes any warranty,expressed or implied, or assumes any legal liability or responsibility for the accuracy, completeness, orusefulness of any information, apparatus, product or process disclosed, or represents that its use wouldnot infringe privately owned rights. References herein to any specific commercial product, process, orservice by trade name trademark, manufacturer, or otherwise, does not necessarily constitute or implyits endorsement, recommendation, or favoring by the United States Government or any agency thereof.The views and opinions of authors expressed herein do not necessarily state or reflect those of the UnitedStates Government or any agency thereof.
0021–9614/96/080819+23 $18.00/0 7 1996 Academic Press Limited
R. D. Chirico and W. V. Steele820
Research Center (TRC) of Texas A&M University for the National Institute ofStandards and Technology (NIST). The new vapor-pressure results show significantdeviations from the values selected by Das et al.(2) Also, the new density andheat-capacity results span a much larger range of temperature than those availablepreviously.
Properties reviewed are condensed and gas-phase molar heat capacities, molarenthalpies of combustion, vapor pressures, densities, critical properties, virialcoefficients, molar enthalpies of vaporization, and molar thermodynamic propertiesderived from assigned vibrational spectra. In part I of this research,(1) severalexamples of the use of consistent thermodynamic data in the test and developmentof structure–property correlations are demonstrated. Thermodynamic consistencybetween properties is emphasized in this review.
2. Summary of the literature and selected values
ENTHALPIES OF COMBUSTION
The massic energy of combustion of pyridine has been reported five times in theliterature(3–7) with excellent agreement between the modern measurements by Coxet al.(6) and Hubbard et al.(7) The standard molar enthalpy of formation DfH°mfor the liquid phase at T=298.15 K derived from the measurements by Cox et al.(6)
is (100.423.0) kJ·mol−1 for a sample estimated to be (0.998520.0007) mole fractionof pyridine. The corresponding value derived from the measurements by Hubbardet al.(7) is (100.220.5) kJ·mol−1 for a sample determined by fractional melting as partof heat-capacity studies by adiabatic calorimetry(8) to be 0.9993 mole fraction ofpyridine. The value reported by Hubbard et al.(7) was chosen because of the higherprecision of the measurements and greater purity of the sample.
HEAT CAPACITIES FOR CONDENSED PHASES
Numerous heat capacities at a single temperature or for narrow temperature intervalsin the liquid phase have been reported for pyridine.(9) These studies are of littlevalue for checks of thermodynamic consistency and are not considered here.
Saturation molar heat capacities Csat for pyridine in the liquid phase forthe temperatures 320Q(T/K)Q560 are reported in part I of this research.(1)
These are the first reported values for temperatures higher than T=353 K. Fourheat-capacity studies spanning a temperature range of q50 K have been reportedin the literature.(8,10–12) Of these, three report molar entropies relative to T 4 0.(8,10,11)
However, only the heat-capacity study by McCullough et al.,(8) for the temperaturerange 13.1Q(T/K)Q346.7, extends to temperatures sufficiently low to allow areliable calculation of entropies relative to T 4 0. Heat-capacity studies by Parkset al.(10) and Pearce and Bakke(11) span the temperature range from approximately90 K to 300 K. Rastorguev and Ganiev(12) reported values for the liquid phase forthe temperature range 293Q(T/K)Q353.
Pyridine properties review 821
The experimental saturation molar heat capacities Csat published in 1957by McCullough et al.(8) were converted to ITS-90(13,14) in this research with thetemperature increments provided. Two additional modifications to the calculationsby McCullough et al.(8) are included here. In the analysis of their fractional-meltingstudy, McCullough et al. chose to use only the temperature values correspondingto liquid-phase fractions of 0.7 and 0.9. Observed temperatures at lower fractionswere ignored. In recent research at The National Institute for Petroleum andEnergy Research (NIPER), it has been observed that equilibration is often too slowto obtain reliable equilibrium temperatures for liquid-phase fractions greater than0.85.
The triple-point temperature and sample purity for pyridine were recalculatedusing standard methods(15) with the complete results of the fractional-melting studyreported by McCullough et al.(8) The triple-point temperature Ttp, rounded to thenearest 0.01 K (Ttp=231.51 K), was unchanged, and the calculated sample purityincreased from 0.9992 to 0.9993 mole fraction of pyridine. Pre-melting corrections(16)
were calculated on the basis of the new higher purity, and applied to the experimentalheat capacities.(8)
McCullough et al.(8) chose not to apply pre-melting corrections for temperaturesmore than 25 K below Ttp. At temperatures 25 K below Ttp, the pre-meltingcorrections remain much larger (approximately 0.006·Csat) than the experimentaluncertainty (approximately 0.001·Csat). In the present research, pre-meltingcorrections were extended to T=100 K, where they become insignificant. Thecalculated molar enthalpy of fusion is increased slightly from the value reported byMcCullough et al. {Dl
crHm = (827823) J·mol−1} to {DlcrHm = (828823) J·mol−1}.
The uncertainty represents the experimental imprecision only.The newly adjusted molar heat capacities were smoothed with cubic-spline
functions by least-squares fits to six points at a time and by requiring continuityin value, slope, and curvature at the junction of successive cubic functions. Dueto limitations in the spline-function procedure, some heat capacities were notincluded in the fit, while in other regions graphical values were introduced to ensurethat the second derivative of the heat capacity with respect to temperature was asmooth function of temperature. The derived condensed-phase molar heat capacities,and molar entropies and enthalpies relative to that of the crystals at T 4 0for the solid and liquid phases under vapor-saturation pressure, are given intable 6 of part I of this research.(1) These recommended values were extended toT=0.90·Tc (i.e., T=560 K) by integration of the Csat,m values derived frommeasurements with a differential-scanning calorimeter in the experimental portion ofthis research.(1)
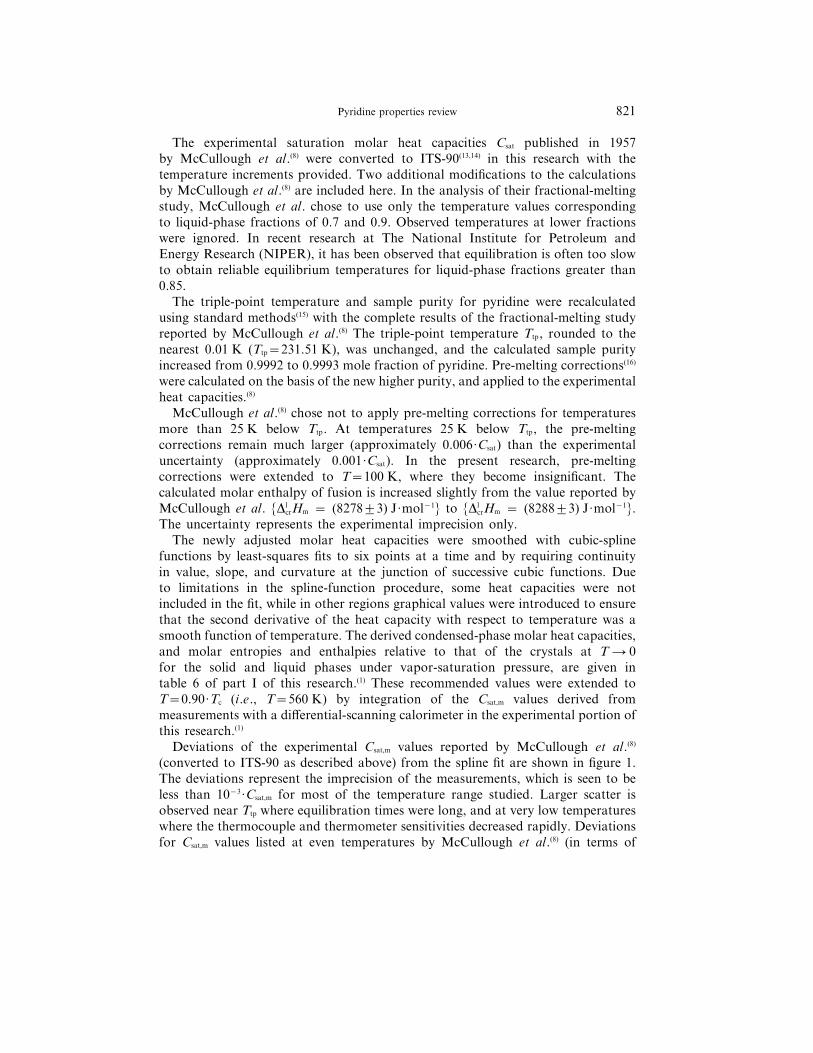
Deviations of the experimental Csat,m values reported by McCullough et al.(8)
(converted to ITS-90 as described above) from the spline fit are shown in figure 1.The deviations represent the imprecision of the measurements, which is seen to beless than 10−3·Csat,m for most of the temperature range studied. Larger scatter isobserved near Ttp where equilibration times were long, and at very low temperatureswhere the thermocouple and thermometer sensitivities decreased rapidly. Deviationsfor Csat,m values listed at even temperatures by McCullough et al.(8) (in terms of
R. D. Chirico and W. V. Steele822
FIGURE 1. Deviation plot for molar heat capacities of pyridine, where Csat,m(select) are the heatcapacities(8,1) selected in this research. Values of Csat,m(lit) are: w, experimental values listed by McCulloughet al.(8) converted to ITS-90, as described in the text; W, smoothed values listed by McCullough et al.(8)
in terms of IPTS-48. The vertical line indicates the triple-point temperature Ttp.(8) The dashed linesrepresent deviations of 210−3·Csat,m.
IPTS-1948) are also shown in figure 1. The systematic deviations between T=100 Kand Ttp are caused primarily by the different treatments of pre-melting correctionsused by McCullough et al.(8) and used in the derivation of the selected values of thisresearch. Other differences result from changes in the temperature scale from IPTS-48to ITS-90.
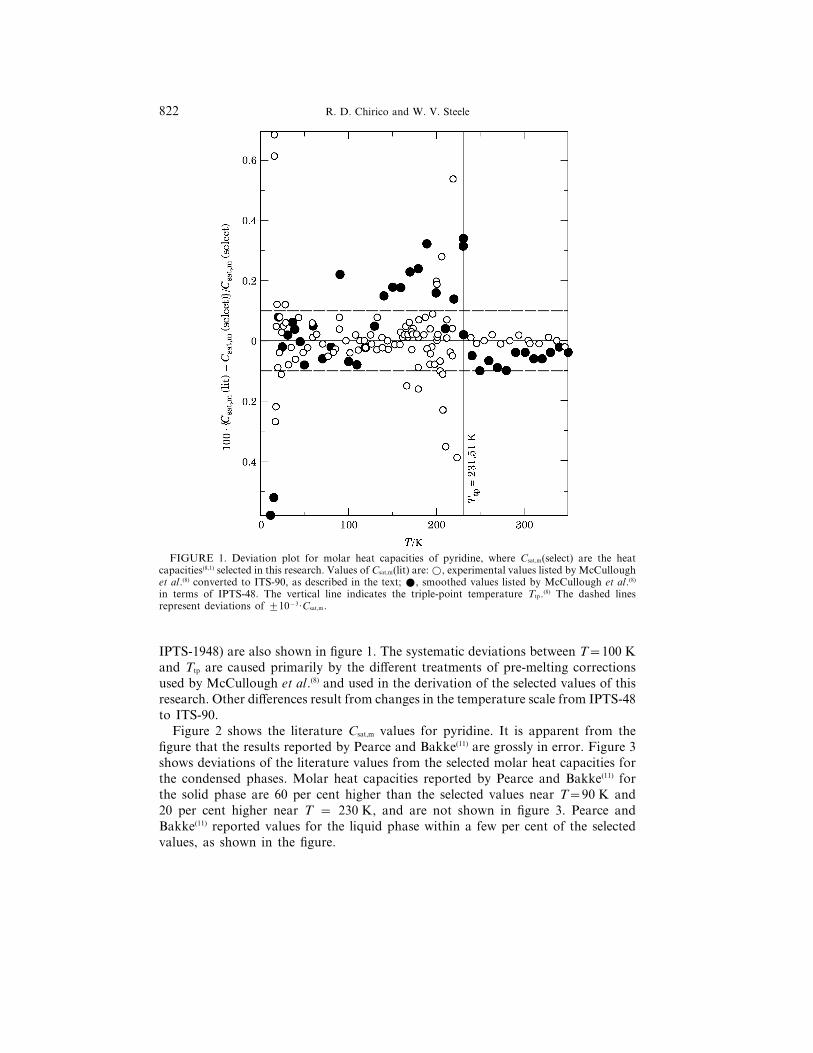
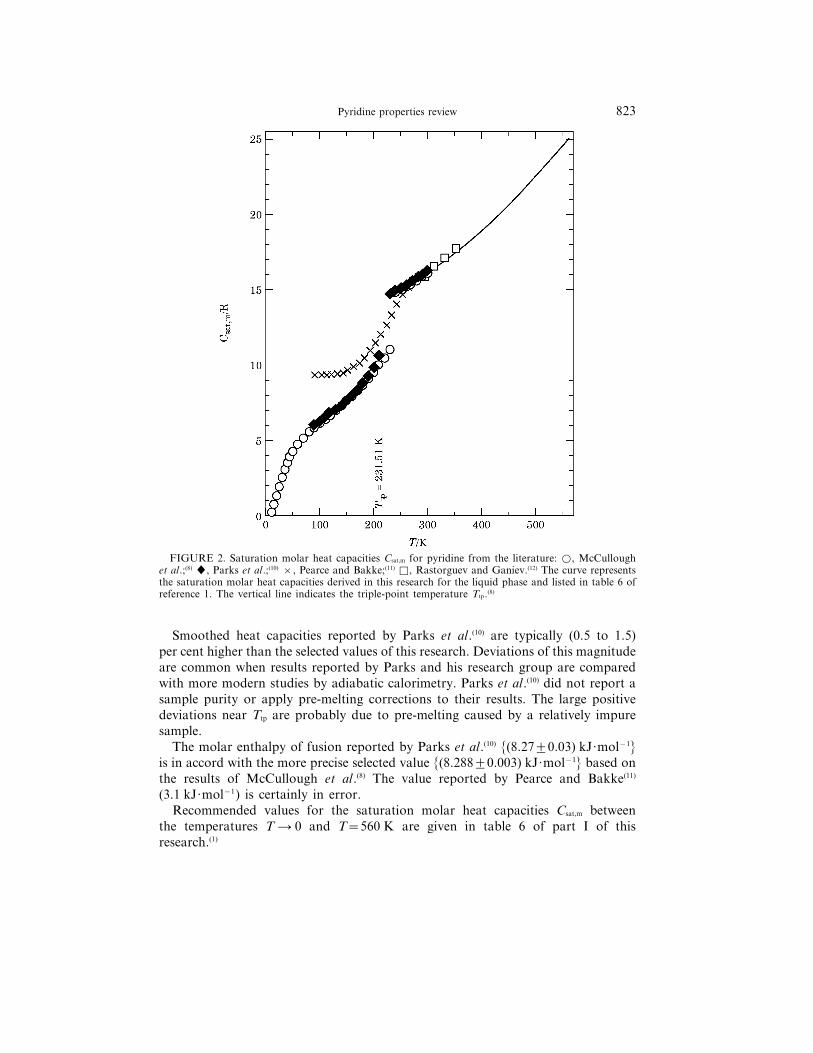
Figure 2 shows the literature Csat,m values for pyridine. It is apparent from thefigure that the results reported by Pearce and Bakke(11) are grossly in error. Figure 3shows deviations of the literature values from the selected molar heat capacities forthe condensed phases. Molar heat capacities reported by Pearce and Bakke(11) forthe solid phase are 60 per cent higher than the selected values near T=90 K and20 per cent higher near T = 230 K, and are not shown in figure 3. Pearce andBakke(11) reported values for the liquid phase within a few per cent of the selectedvalues, as shown in the figure.
Pyridine properties review 823
FIGURE 2. Saturation molar heat capacities Csat,m for pyridine from the literature: w, McCulloughet al.;(8) R, Parks et al.;(10) ×, Pearce and Bakke;(11) q, Rastorguev and Ganiev.(12) The curve representsthe saturation molar heat capacities derived in this research for the liquid phase and listed in table 6 ofreference 1. The vertical line indicates the triple-point temperature Ttp.(8)
Smoothed heat capacities reported by Parks et al.(10) are typically (0.5 to 1.5)per cent higher than the selected values of this research. Deviations of this magnitudeare common when results reported by Parks and his research group are comparedwith more modern studies by adiabatic calorimetry. Parks et al.(10) did not report asample purity or apply pre-melting corrections to their results. The large positivedeviations near Ttp are probably due to pre-melting caused by a relatively impuresample.
The molar enthalpy of fusion reported by Parks et al.(10) {(8.2720.03) kJ·mol−1}is in accord with the more precise selected value {(8.28820.003) kJ·mol−1} based onthe results of McCullough et al.(8) The value reported by Pearce and Bakke(11)
(3.1 kJ·mol−1) is certainly in error.Recommended values for the saturation molar heat capacities Csat,m between
the temperatures T 4 0 and T=560 K are given in table 6 of part I of thisresearch.(1)
R. D. Chirico and W. V. Steele824
FIGURE 3. Deviation plot for molar heat capacities of pyridine, where Csat,m(select) are the heatcapacities(8,1) selected in this research. Values of Csat,m(lit) are: R, Parks et al.;(10) ×, Pearce and Bakke;(11)
Q, Rastorguev and Ganiev.(12) The vertical line indicates the triple-point temperature Ttp.(8)
VAPOR PRESSURES
Numerous vapor pressures for pyridine have been published. Many were obtainedfor narrow temperature ranges as part of (vapor+liquid) equilibria studies and areof low precision. The most precise measurements for pyridine have been obtainedwith comparative ebulliometry.(1,8,17–19) Derivation of recommended values for thesaturation vapor pressures of pyridine between the temperatures Ttp=231.51 Kand Tc=620 K is described in part I of this research.(1) These values are basedon new ebulliometric vapor-pressure measurements and checks of thermodynamicconsistency between calorimetric and spectroscopically derived standardentropies.(1) The recommended values are calculated with the (2, 4) form of theWagner equation:
ln(p/pc)=(1/Tr){A(1−Tr)+B(1−Tr)1.5+C(1−Tr)2+D(1−Tr)4}. (1)
The equation parameters are listed in table 5 of reference 1.
420
0.2
–0.4
300
T/Κ340 380
–0.2
0
/p(c
alc)
p(c
alc)
}p
(lit
) –
{10
0.
Pyridine properties review 825
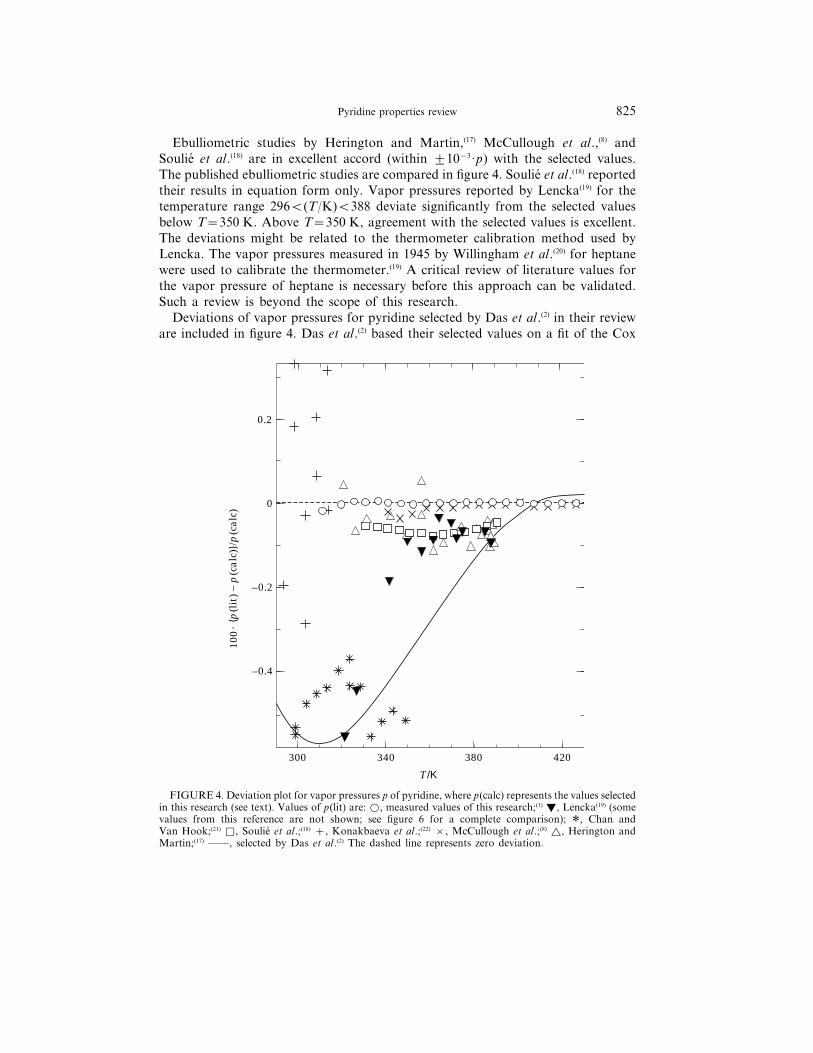
Ebulliometric studies by Herington and Martin,(17) McCullough et al.,(8) andSoulie et al.(18) are in excellent accord (within 210−3·p) with the selected values.The published ebulliometric studies are compared in figure 4. Soulie et al.(18) reportedtheir results in equation form only. Vapor pressures reported by Lencka(19) for thetemperature range 296Q(T/K)Q388 deviate significantly from the selected valuesbelow T=350 K. Above T=350 K, agreement with the selected values is excellent.The deviations might be related to the thermometer calibration method used byLencka. The vapor pressures measured in 1945 by Willingham et al.(20) for heptanewere used to calibrate the thermometer.(19) A critical review of literature values forthe vapor pressure of heptane is necessary before this approach can be validated.Such a review is beyond the scope of this research.
Deviations of vapor pressures for pyridine selected by Das et al.(2) in their revieware included in figure 4. Das et al.(2) based their selected values on a fit of the Cox
FIGURE 4. Deviation plot for vapor pressures p of pyridine, where p(calc) represents the values selectedin this research (see text). Values of p(lit) are: w, measured values of this research;(1) T, Lencka(19) (somevalues from this reference are not shown; see figure 6 for a complete comparison); *, Chan andVan Hook;(21) q, Soulie et al.;(18) +, Konakbaeva et al.;(22) ×, McCullough et al.;(8) r, Herington andMartin;(17) ——, selected by Das et al.(2) The dashed line represents zero deviation.
R. D. Chirico and W. V. Steele826
equation to vapor pressures reported by McCullough et al.,(8) Chan and Van Hook,(21)
Herington and Martin,(17) and Konakbaeva et al.(22) Measurement results by Kobeet al.(23) were used for pressures above 0.3 MPa. The fitted Cox equation was notconstrained for temperatures outside the experimental ranges. It is apparent fromfigure 4 that the values reported by Chan and Van Hook(21) were weighted heavilyin the Cox equation fit by Das et al.(2) The results of Chan and Van Hook(21)
are approximately 0.5 per cent lower than those of Herington and Martin,(17)
McCullough et al.,(8) Soulie et al.,(18) and the new NIPER values.(1) Enthalpies ofvaporization calculated with the vapor pressures selected by Das et al.(2) were shownto be inconsistent with the entropies of the condensed phases and the vibrationalassignment for pyridine.(1) Vapor pressures reported by Lencka(19) show much largerdeviations from the new selected values than do those of Das et al.(2)
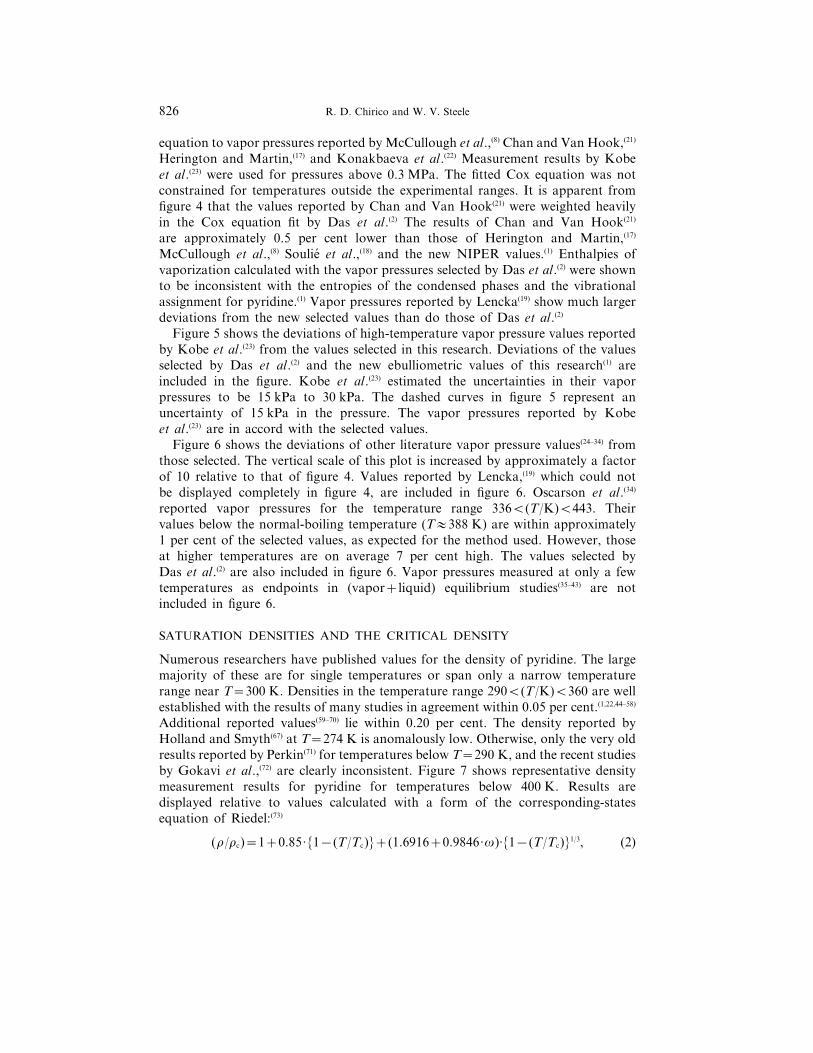
Figure 5 shows the deviations of high-temperature vapor pressure values reportedby Kobe et al.(23) from the values selected in this research. Deviations of the valuesselected by Das et al.(2) and the new ebulliometric values of this research(1) areincluded in the figure. Kobe et al.(23) estimated the uncertainties in their vaporpressures to be 15 kPa to 30 kPa. The dashed curves in figure 5 represent anuncertainty of 15 kPa in the pressure. The vapor pressures reported by Kobeet al.(23) are in accord with the selected values.
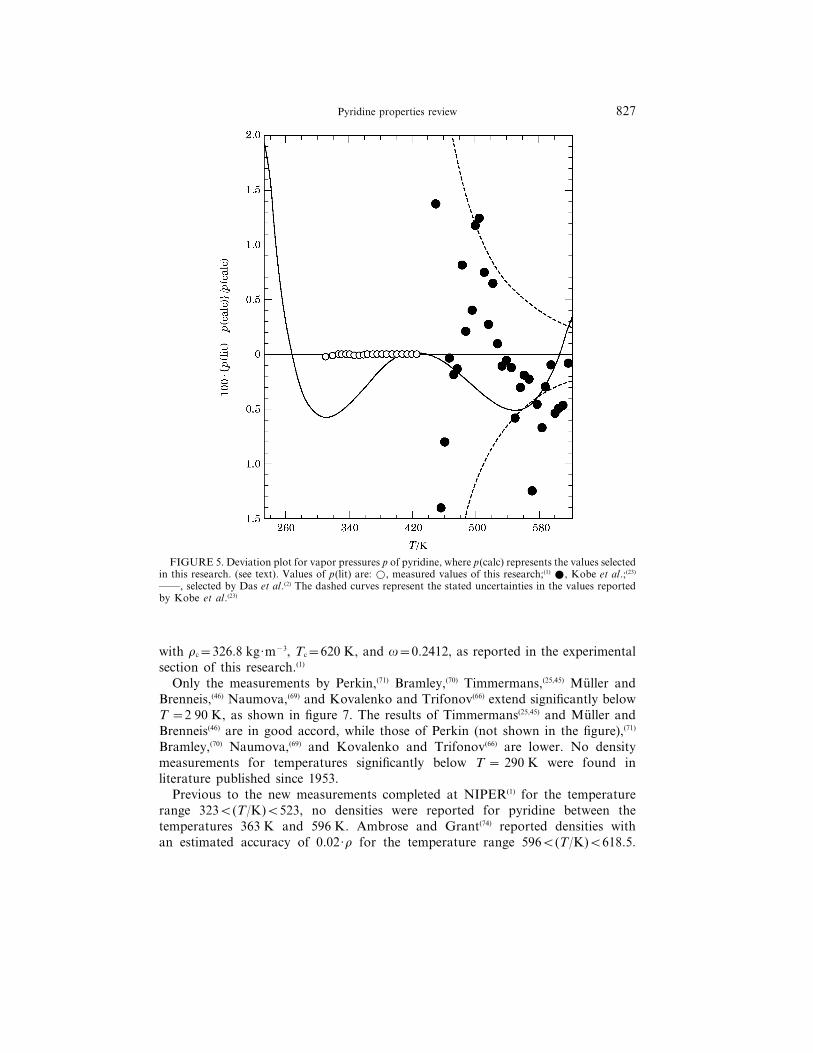
Figure 6 shows the deviations of other literature vapor pressure values(24–34) fromthose selected. The vertical scale of this plot is increased by approximately a factorof 10 relative to that of figure 4. Values reported by Lencka,(19) which could notbe displayed completely in figure 4, are included in figure 6. Oscarson et al.(34)
reported vapor pressures for the temperature range 336Q(T/K)Q443. Theirvalues below the normal-boiling temperature (T1388 K) are within approximately1 per cent of the selected values, as expected for the method used. However, thoseat higher temperatures are on average 7 per cent high. The values selected byDas et al.(2) are also included in figure 6. Vapor pressures measured at only a fewtemperatures as endpoints in (vapor+liquid) equilibrium studies(35–43) are notincluded in figure 6.
SATURATION DENSITIES AND THE CRITICAL DENSITY
Numerous researchers have published values for the density of pyridine. The largemajority of these are for single temperatures or span only a narrow temperaturerange near T=300 K. Densities in the temperature range 290Q(T/K)Q360 are wellestablished with the results of many studies in agreement within 0.05 per cent.(1,22,44–58)
Additional reported values(59–70) lie within 0.20 per cent. The density reported byHolland and Smyth(67) at T=274 K is anomalously low. Otherwise, only the very oldresults reported by Perkin(71) for temperatures below T=290 K, and the recent studiesby Gokavi et al.,(72) are clearly inconsistent. Figure 7 shows representative densitymeasurement results for pyridine for temperatures below 400 K. Results aredisplayed relative to values calculated with a form of the corresponding-statesequation of Riedel:(73)
(r/rc)=1+0.85·{1−(T/Tc)}+(1.6916+0.9846·v)·{1−(T/Tc)}1/3, (2)
Pyridine properties review 827
FIGURE 5. Deviation plot for vapor pressures p of pyridine, where p(calc) represents the values selectedin this research. (see text). Values of p(lit) are: w, measured values of this research;(1) W, Kobe et al.;(23)
——, selected by Das et al.(2) The dashed curves represent the stated uncertainties in the values reportedby Kobe et al.(23)
with rc=326.8 kg·m−3, Tc=620 K, and v=0.2412, as reported in the experimentalsection of this research.(1)
Only the measurements by Perkin,(71) Bramley,(70) Timmermans,(25,45) Muller andBrenneis,(46) Naumova,(69) and Kovalenko and Trifonov(66) extend significantly belowT =2 90 K, as shown in figure 7. The results of Timmermans(25,45) and Muller andBrenneis(46) are in good accord, while those of Perkin (not shown in the figure),(71)
Bramley,(70) Naumova,(69) and Kovalenko and Trifonov(66) are lower. No densitymeasurements for temperatures significantly below T = 290 K were found inliterature published since 1953.
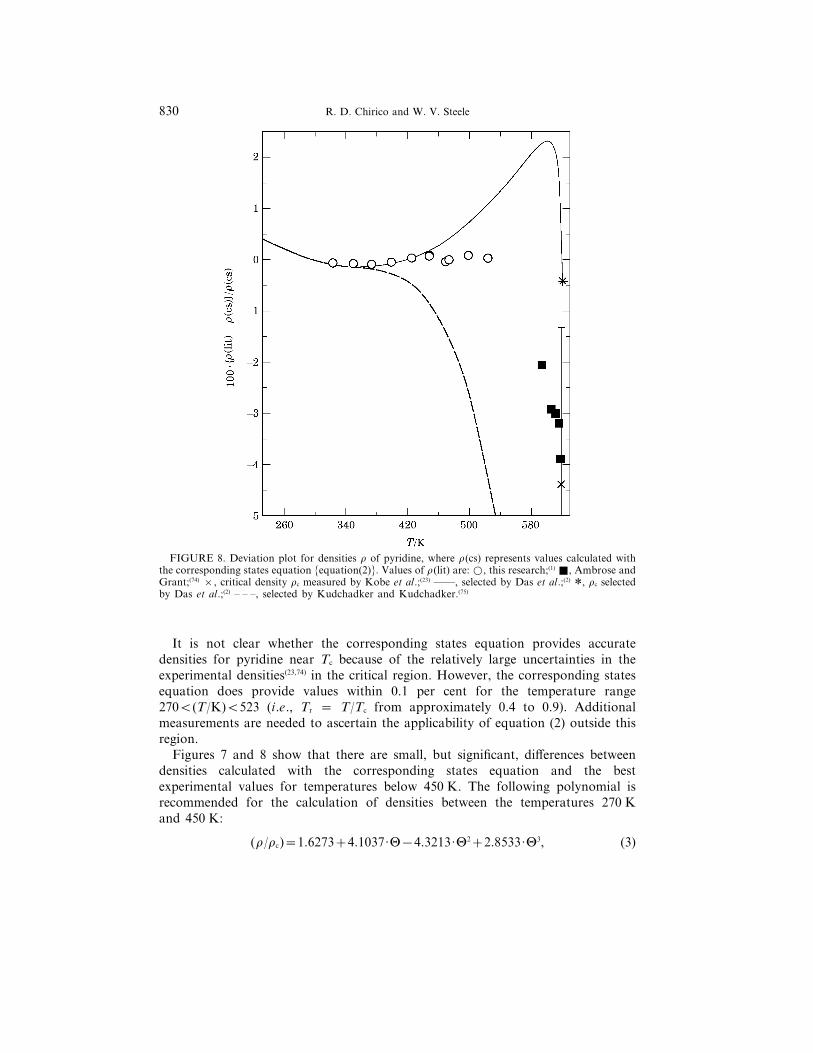
Previous to the new measurements completed at NIPER(1) for the temperaturerange 323Q(T/K)Q523, no densities were reported for pyridine between thetemperatures 363 K and 596 K. Ambrose and Grant(74) reported densities withan estimated accuracy of 0.02·r for the temperature range 596Q(T/K)Q618.5.
R. D. Chirico and W. V. Steele828
FIGURE 6. Deviation plot for vapor pressures p of pyridine, where p(calc) represents the values selectedin this research (see text). Values of p(lit) are: q, Blanco et al.;(33) W, Lencka;(19) T, Oscarson et al.(34)
{values from this reference for the temperatures 400Q(T/K)Q444 are not shown; deviations forthese values average approximately 7 per cent}; r, Gardner and Day;(32) ×, Weclawski and Bylicki;(31)
+, Arnett and Chawla;(30) R, Hisamura et al.(29) {values for the temperatures 296Q(T/K)Q314 exceed6 per cent, and are not shown}; Q, Brown and Barbaras;(28) w, Hieber and Woerner(26) {values for thetemperatures 290Q(T/K)Q316 are low by up to 14 per cent, and are not shown}; r, Meulen and Mann(27)
{values for the temperatures 253Q(T/K)Q273 are low by up to 14 per cent, and are not shown}; t, Rileyand Bailey(24) {values for the temperatures 279Q(T/K)Q287 are low by up to 11 per cent, and are notshown}; ——, selected by Das et al.;(2) – – –, zero deviation.
The results of the studies by Ambrose and Grant(74) and those of this research(1) areshown relative to values calculated with corresponding states {equation (2)} infigure 8. Values estimated by Das et al.(2) in their recent review and by Kudchadkerand Kudchadker(75) in an earlier review, are also shown.
Figures 7 and 8 show that equation (2) represents the experimental density valuesfor the temperature range 270Q(T/K)Q523 within approximately 0.1 per cent.Below T=270 K, the only available values, published by Timmermans(45) in 1907,show deviations increasing to 0.5 per cent near T=230 K. (Timmermans’ originalpublication(45) listed results in the form of a linear equation only. Values listed in
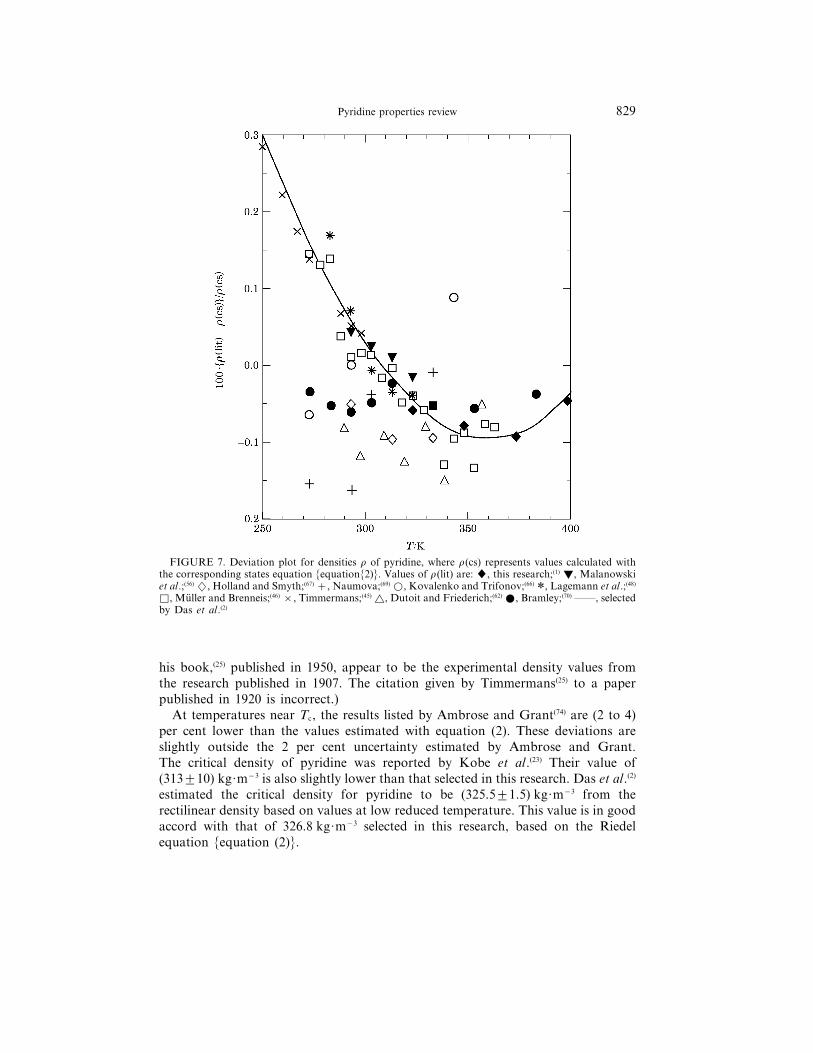
Pyridine properties review 829
FIGURE 7. Deviation plot for densities r of pyridine, where r(cs) represents values calculated withthe corresponding states equation {equation{2)}. Values of r(lit) are: R, this research;(1) T, Malanowskiet al.;(56) r, Holland and Smyth;(67) +, Naumova;(69) w, Kovalenko and Trifonov;(66) *, Lagemann et al.;(48)
q, Muller and Brenneis;(46) ×, Timmermans;(45) r, Dutoit and Friederich;(62) W, Bramley;(70) ——, selectedby Das et al.(2)
his book,(25) published in 1950, appear to be the experimental density values fromthe research published in 1907. The citation given by Timmermans(25) to a paperpublished in 1920 is incorrect.)
At temperatures near Tc, the results listed by Ambrose and Grant(74) are (2 to 4)per cent lower than the values estimated with equation (2). These deviations areslightly outside the 2 per cent uncertainty estimated by Ambrose and Grant.The critical density of pyridine was reported by Kobe et al.(23) Their value of(313210) kg·m−3 is also slightly lower than that selected in this research. Das et al.(2)
estimated the critical density for pyridine to be (325.521.5) kg·m−3 from therectilinear density based on values at low reduced temperature. This value is in goodaccord with that of 326.8 kg·m−3 selected in this research, based on the Riedelequation {equation (2)}.
R. D. Chirico and W. V. Steele830
FIGURE 8. Deviation plot for densities r of pyridine, where r(cs) represents values calculated withthe corresponding states equation {equation(2)}. Values of r(lit) are: w, this research;(1) Q, Ambrose andGrant;(74) ×, critical density rc measured by Kobe et al.;(23) ——, selected by Das et al.;(2) *, rc selectedby Das et al.;(2) – – –, selected by Kudchadker and Kudchadker.(75)
It is not clear whether the corresponding states equation provides accuratedensities for pyridine near Tc because of the relatively large uncertainties in theexperimental densities(23,74) in the critical region. However, the corresponding statesequation does provide values within 0.1 per cent for the temperature range270Q(T/K)Q523 (i.e., Tr = T/Tc from approximately 0.4 to 0.9). Additionalmeasurements are needed to ascertain the applicability of equation (2) outside thisregion.
Figures 7 and 8 show that there are small, but significant, differences betweendensities calculated with the corresponding states equation and the bestexperimental values for temperatures below 450 K. The following polynomial isrecommended for the calculation of densities between the temperatures 270 Kand 450 K:
(r/rc)=1.6273+4.1037·U−4.3213·U2+2.8533·U3, (3)
Pyridine properties review 831
TABLE 1. Critical properties for pyridine from the literature
Tc/K pc/MPa rc/(kg·m−3) Reference
617.4 Radice(76)
6.1 von Herz and Neukirch(77)
618.2020.05 Swietos<awski and Kreg<ewski(78)
62022 5.6320.10 313210 Kobe et al.(23)
620.0020.05 31526 Ambrose and Grant(74)
620.220.3 5.6620.02 Brunner(79)
62021 5.6520.03 326.8 a Chirico et al.(1)
620.020.1 5.6520.03 326.826 a Selected values from this research
a Selected to minimize deviations between the values measured in this research(1) and those calculatedwith corresponding states {equation (2)}.
where rc=326.8 kg·m−3, and U={1−(T/Tc)}. The coefficients were derived withselected experimental densities.(1,46,47,49,52,56,58) Values calculated with correspondingstates {equation (2)} were included for temperatures above 400 K to ensure smoothcontinuity between equation (2) and equation (3). Equation (2) is recommended forthe calculation of densities for Tq450 K.
CRITICAL PROPERTIES
Available critical properties for pyridine are summarized in table 1. The criticaltemperature is well established and the three determinations of the critical pressureare in good accord. The selected values of this research are included in the table.The selected critical density is given to more significant figures than is justified bythe available experimental results to eliminate round-off errors in the use of equations(2) and (3).
ENTHALPIES OF VAPORIZATION
Molar enthalpies of vaporization are related directly to the saturation vapor pressurethrough the Clapeyron equation:
dp/dT=Dgl Hm/(T ·Dg
lVm), (4)
where DglVm is the difference between the molar volumes of the liquid and the real
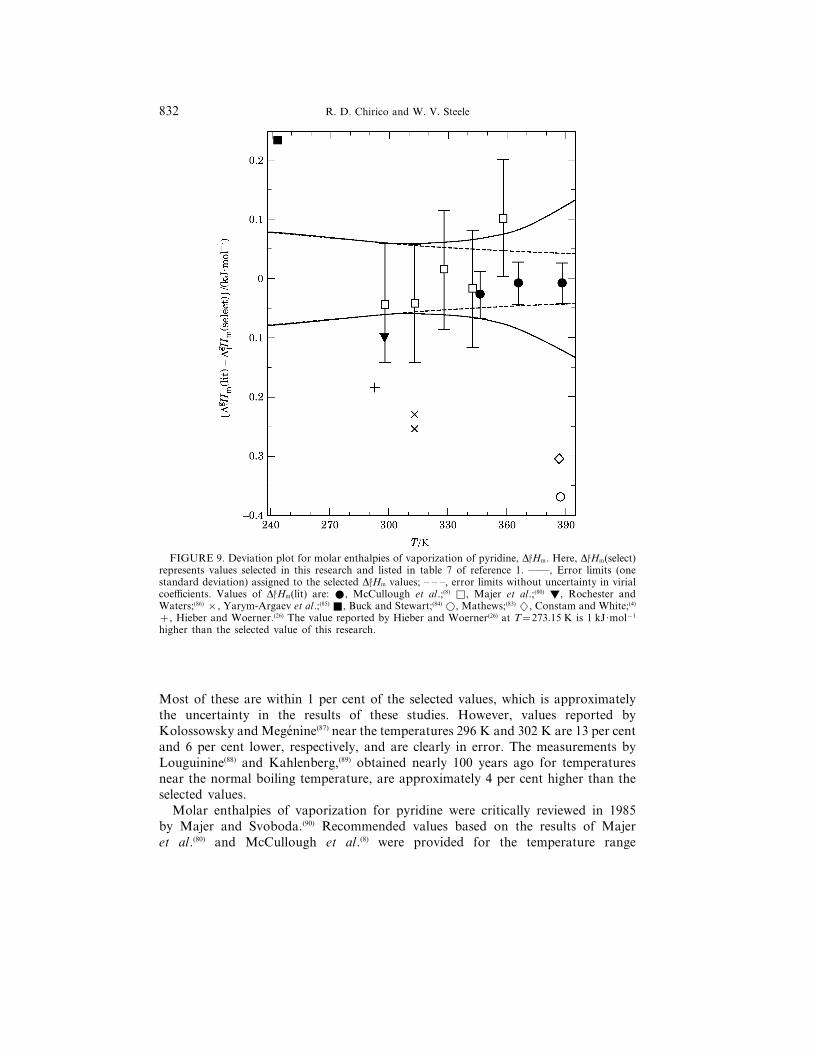
vapor. Enthalpies of vaporization for pyridine have been measured with highprecision by Majer et al.(80) for the temperature range 298Q(T/K)Q358, and byMcCullough et al.(8) for the temperature range 347Q(T/K)Q388. These experimentalvalues are compared in figure 9 with the selected values listed in table 7 of part Iof this research.(1) The selected values were derived from a Wagner equation fit(1) tothe selected vapor pressures, with second and third virial coefficients estimated withcorresponding states methods.(81,82) Agreement between the selected values(1) and theexperimental values(8,80) is excellent.
Enthalpies of vaporization for narrow temperature ranges or at singletemperatures reported by various research groups(4,83–89) are also shown in figure 9.
R. D. Chirico and W. V. Steele832
FIGURE 9. Deviation plot for molar enthalpies of vaporization of pyridine, DglHm. Here, Dg
lHm(select)represents values selected in this research and listed in table 7 of reference 1. ——, Error limits (onestandard deviation) assigned to the selected Dg
lHm values; – – –, error limits without uncertainty in virialcoefficients. Values of Dg
l Hm(lit) are: W, McCullough et al.;(8) q, Majer et al.;(80) T, Rochester andWaters;(86) ×, Yarym-Argaev et al.;(85) Q, Buck and Stewart;(84) w, Mathews;(83) r, Constam and White;(4)
+, Hieber and Woerner.(26) The value reported by Hieber and Woerner(26) at T=273.15 K is 1 kJ·mol−1
higher than the selected value of this research.
Most of these are within 1 per cent of the selected values, which is approximatelythe uncertainty in the results of these studies. However, values reported byKolossowsky and Megenine(87) near the temperatures 296 K and 302 K are 13 per centand 6 per cent lower, respectively, and are clearly in error. The measurements byLouguinine(88) and Kahlenberg,(89) obtained nearly 100 years ago for temperaturesnear the normal boiling temperature, are approximately 4 per cent higher than theselected values.
Molar enthalpies of vaporization for pyridine were critically reviewed in 1985by Majer and Svoboda.(90) Recommended values based on the results of Majeret al.(80) and McCullough et al.(8) were provided for the temperature range
Pyridine properties review 833
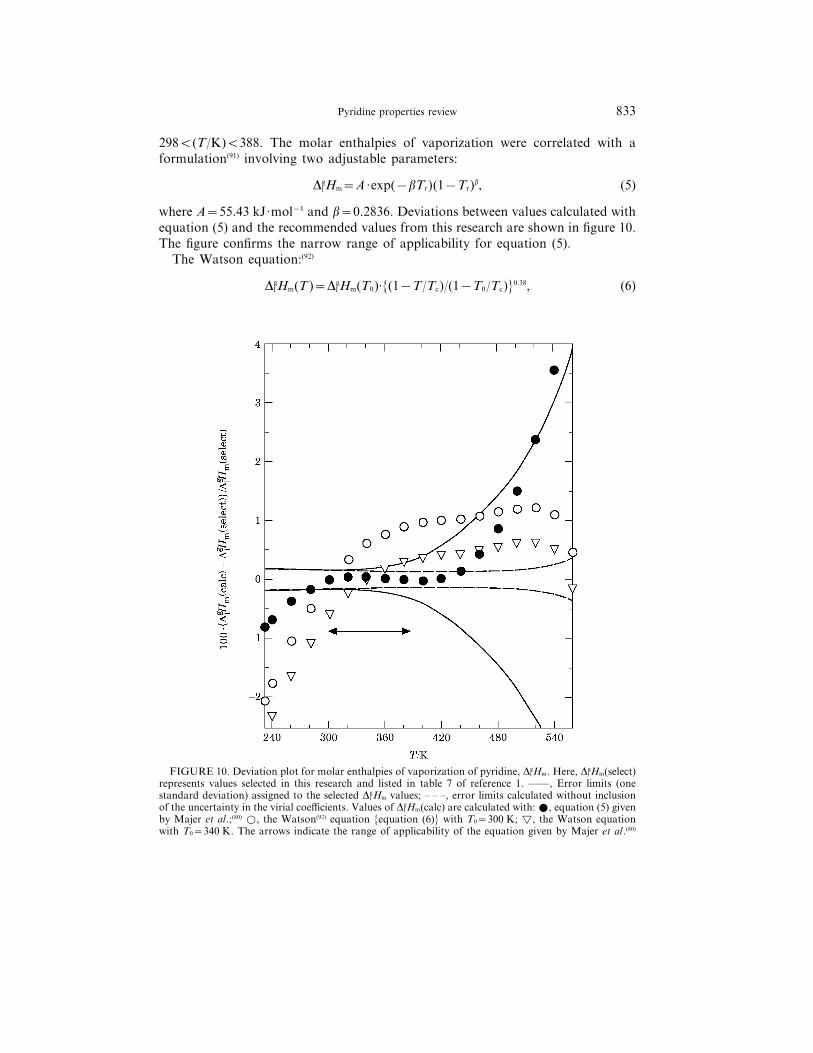
298Q(T/K)Q388. The molar enthalpies of vaporization were correlated with aformulation(91) involving two adjustable parameters:
DglHm=A ·exp(−bTr)(1−Tr)b, (5)
where A=55.43 kJ·mol−1 and b=0.2836. Deviations between values calculated withequation (5) and the recommended values from this research are shown in figure 10.The figure confirms the narrow range of applicability for equation (5).
The Watson equation:(92)
DglHm(T )=Dg
lHm(T0)·{(1−T/Tc)/(1−T0/Tc)}0.38, (6)
FIGURE 10. Deviation plot for molar enthalpies of vaporization of pyridine, DglHm. Here, Dg
lHm(select)represents values selected in this research and listed in table 7 of reference 1. ——, Error limits (onestandard deviation) assigned to the selected Dg
l Hm values; – – –, error limits calculated without inclusionof the uncertainty in the virial coefficients. Values of Dg
lHm(calc) are calculated with: W, equation (5) givenby Majer et al.;(80) w, the Watson(92) equation {equation (6)} with T0=300 K; t, the Watson equationwith T0=340 K. The arrows indicate the range of applicability of the equation given by Majer et al.(80)
R. D. Chirico and W. V. Steele834
is often used for the estimation of molar enthalpies of vaporization as a functionof temperature when only a single molar enthalpy of vaporization value isavailable. Differences between the recommended values from this research andvalues calculated with the Watson equation are shown in figure 10. The referencetemperature T0 was 300 K. The Watson equation provides values withinapproximately 1 per cent of the recommended values for the entire temperaturerange. The agreement between T=320 K and T=520 K is improved if the referencetemperature T0=340 K is used, as shown in figure 10.
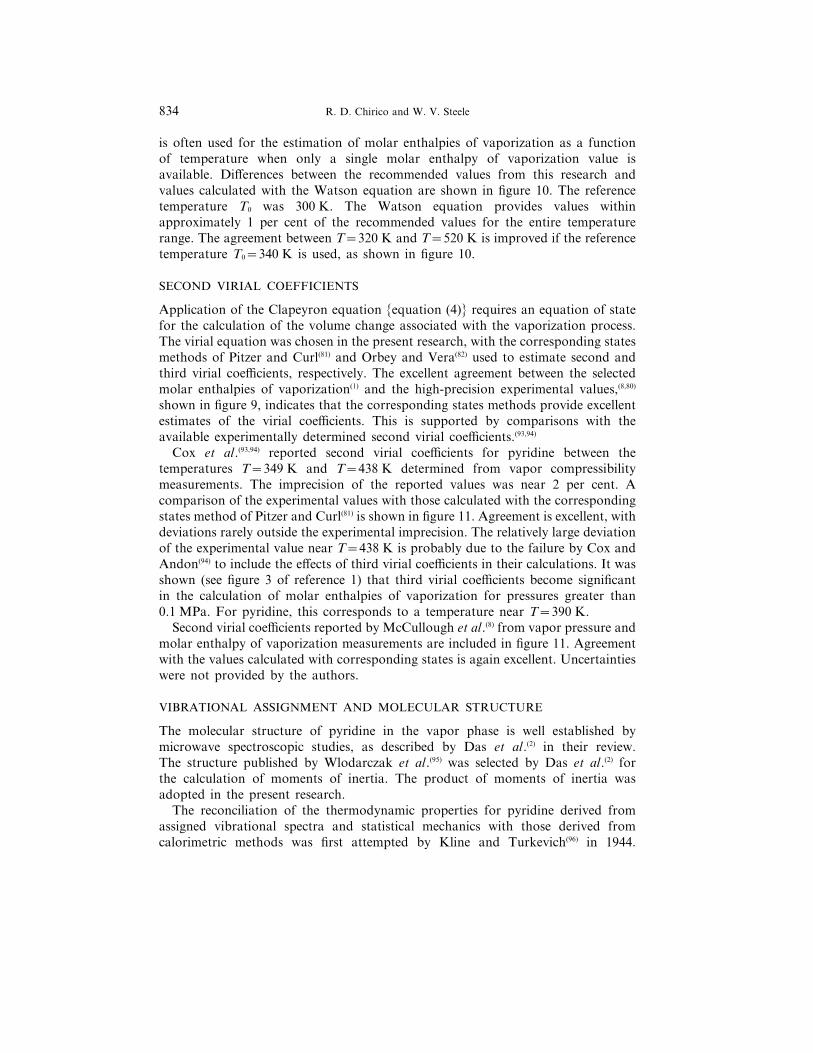
SECOND VIRIAL COEFFICIENTS
Application of the Clapeyron equation {equation (4)} requires an equation of statefor the calculation of the volume change associated with the vaporization process.The virial equation was chosen in the present research, with the corresponding statesmethods of Pitzer and Curl(81) and Orbey and Vera(82) used to estimate second andthird virial coefficients, respectively. The excellent agreement between the selectedmolar enthalpies of vaporization(1) and the high-precision experimental values,(8,80)
shown in figure 9, indicates that the corresponding states methods provide excellentestimates of the virial coefficients. This is supported by comparisons with theavailable experimentally determined second virial coefficients.(93,94)
Cox et al.(93,94) reported second virial coefficients for pyridine between thetemperatures T=349 K and T=438 K determined from vapor compressibilitymeasurements. The imprecision of the reported values was near 2 per cent. Acomparison of the experimental values with those calculated with the correspondingstates method of Pitzer and Curl(81) is shown in figure 11. Agreement is excellent, withdeviations rarely outside the experimental imprecision. The relatively large deviationof the experimental value near T=438 K is probably due to the failure by Cox andAndon(94) to include the effects of third virial coefficients in their calculations. It wasshown (see figure 3 of reference 1) that third virial coefficients become significantin the calculation of molar enthalpies of vaporization for pressures greater than0.1 MPa. For pyridine, this corresponds to a temperature near T=390 K.
Second virial coefficients reported by McCullough et al.(8) from vapor pressure andmolar enthalpy of vaporization measurements are included in figure 11. Agreementwith the values calculated with corresponding states is again excellent. Uncertaintieswere not provided by the authors.
VIBRATIONAL ASSIGNMENT AND MOLECULAR STRUCTURE
The molecular structure of pyridine in the vapor phase is well established bymicrowave spectroscopic studies, as described by Das et al.(2) in their review.The structure published by Wlodarczak et al.(95) was selected by Das et al.(2) forthe calculation of moments of inertia. The product of moments of inertia wasadopted in the present research.
The reconciliation of the thermodynamic properties for pyridine derived fromassigned vibrational spectra and statistical mechanics with those derived fromcalorimetric methods was first attempted by Kline and Turkevich(96) in 1944.
Pyridine properties review 835
FIGURE 11. Comparison of second virial coefficients B for pyridine: – – –, values estimated withthe corresponding states correlation of Pitzer and Curl;(81) ——, spans 210 per cent of these values;W, Cox et al.;(93,94) q, McCullough et al.(8)
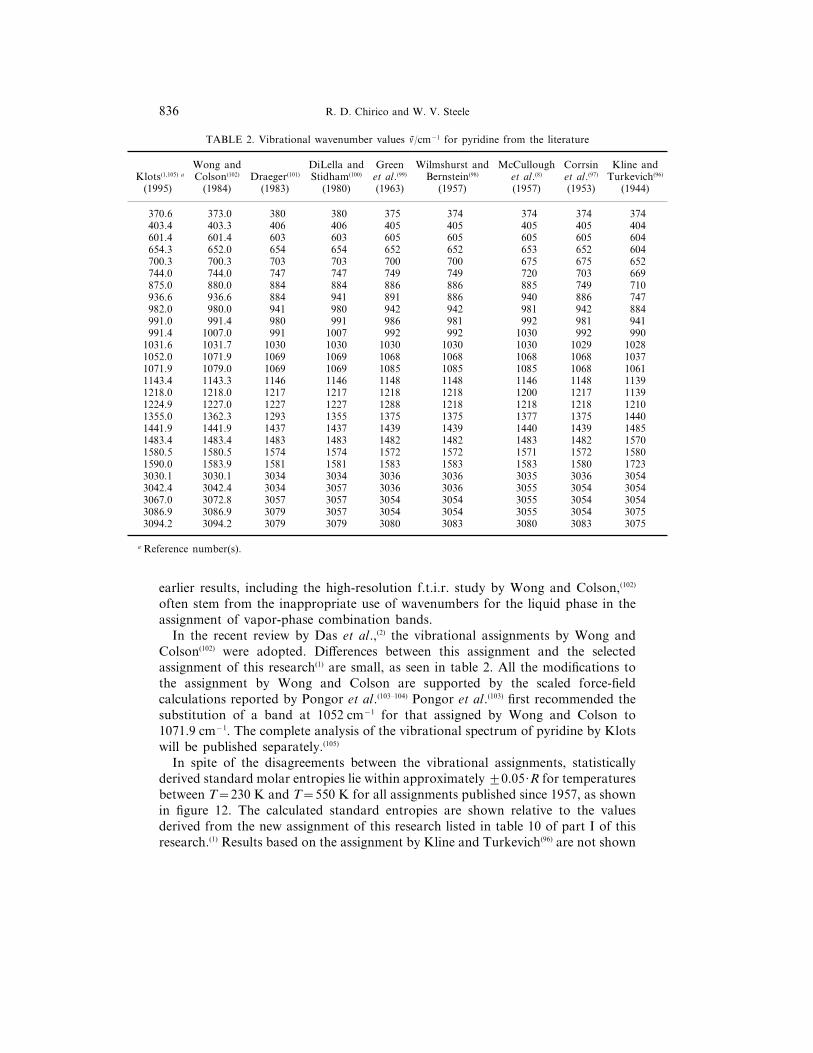
Vibrational assignments for pyridine have appeared regularly in the literaturesince then.(1,8,97–104) Table 2 lists the various complete vibrational assignments inchronological order. The assignment of the fundamental vibrations to specificmolecular motions, although of high importance to the development of force fieldrepresentations, does not influence the statistical thermodynamic calculations.
Table 2 shows that researchers have been in agreement on the wavenumber valuesfor the three lowest fundamentals since 1944, while the seven lowest fundamentalswere established in 1957 by Wilmshurst and Bernstein.(98) Similarly, publishedwavenumber values for fundamentals above 1400 cm−1 have remained essentiallyunaltered since the work of Corrsin et al.(97) in 1953. Disagreements betweenresearchers concerning assignments of fundamentals between 900 cm−1 and1400 cm−1 remain to the present day. The presence of numerous combination andovertone bands in this region of the spectra is the primary cause for thedisagreements. Differences between the new assignment of this research(1,105) and
R. D. Chirico and W. V. Steele836
TABLE 2. Vibrational wavenumber values n/cm−1 for pyridine from the literature
Wong and DiLella and Green Wilmshurst and McCullough Corrsin Kline andKlots(1,105) a Colson(102) Draeger(101) Stidham(100) et al.(99) Bernstein(98) et al.(8) et al.(97) Turkevich(96)
(1995) (1984) (1983) (1980) (1963) (1957) (1957) (1953) (1944)
370.6 373.0 380 380 375 374 374 374 374403.4 403.3 406 406 405 405 405 405 404601.4 601.4 603 603 605 605 605 605 604654.3 652.0 654 654 652 652 653 652 604700.3 700.3 703 703 700 700 675 675 652744.0 744.0 747 747 749 749 720 703 669875.0 880.0 884 884 886 886 885 749 710936.6 936.6 884 941 891 886 940 886 747982.0 980.0 941 980 942 942 981 942 884991.0 991.4 980 991 986 981 992 981 941991.4 1007.0 991 1007 992 992 1030 992 990
1031.6 1031.7 1030 1030 1030 1030 1030 1029 10281052.0 1071.9 1069 1069 1068 1068 1068 1068 10371071.9 1079.0 1069 1069 1085 1085 1085 1068 10611143.4 1143.3 1146 1146 1148 1148 1146 1148 11391218.0 1218.0 1217 1217 1218 1218 1200 1217 11391224.9 1227.0 1227 1227 1288 1218 1218 1218 12101355.0 1362.3 1293 1355 1375 1375 1377 1375 14401441.9 1441.9 1437 1437 1439 1439 1440 1439 14851483.4 1483.4 1483 1483 1482 1482 1483 1482 15701580.5 1580.5 1574 1574 1572 1572 1571 1572 15801590.0 1583.9 1581 1581 1583 1583 1583 1580 17233030.1 3030.1 3034 3034 3036 3036 3035 3036 30543042.4 3042.4 3034 3057 3036 3036 3055 3054 30543067.0 3072.8 3057 3057 3054 3054 3055 3054 30543086.9 3086.9 3079 3057 3054 3054 3055 3054 30753094.2 3094.2 3079 3079 3080 3083 3080 3083 3075
a Reference number(s).
earlier results, including the high-resolution f.t.i.r. study by Wong and Colson,(102)
often stem from the inappropriate use of wavenumbers for the liquid phase in theassignment of vapor-phase combination bands.
In the recent review by Das et al.,(2) the vibrational assignments by Wong andColson(102) were adopted. Differences between this assignment and the selectedassignment of this research(1) are small, as seen in table 2. All the modifications tothe assignment by Wong and Colson are supported by the scaled force-fieldcalculations reported by Pongor et al.(103–104) Pongor et al.(103) first recommended thesubstitution of a band at 1052 cm−1 for that assigned by Wong and Colson to1071.9 cm−1. The complete analysis of the vibrational spectrum of pyridine by Klotswill be published separately.(105)
In spite of the disagreements between the vibrational assignments, statisticallyderived standard molar entropies lie within approximately 20.05·R for temperaturesbetween T=230 K and T=550 K for all assignments published since 1957, as shownin figure 12. The calculated standard entropies are shown relative to the valuesderived from the new assignment of this research listed in table 10 of part I of thisresearch.(1) Results based on the assignment by Kline and Turkevich(96) are not shown
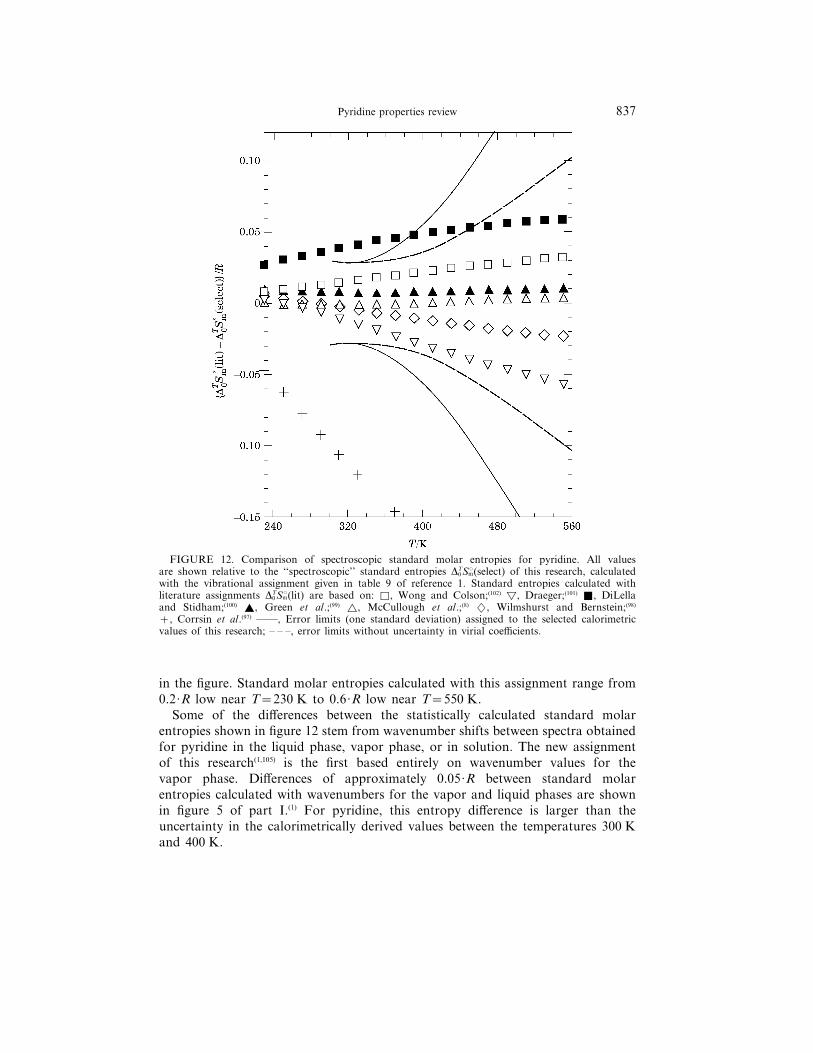
Pyridine properties review 837
FIGURE 12. Comparison of spectroscopic standard molar entropies for pyridine. All valuesare shown relative to the ‘‘spectroscopic’’ standard entropies DT
0S°m(select) of this research, calculatedwith the vibrational assignment given in table 9 of reference 1. Standard entropies calculated withliterature assignments DT
0S°m(lit) are based on: q, Wong and Colson;(102) t, Draeger;(101) Q, DiLellaand Stidham;(100) R, Green et al.;(99) r, McCullough et al.;(8) r, Wilmshurst and Bernstein;(98)
+, Corrsin et al.(97) ——, Error limits (one standard deviation) assigned to the selected calorimetricvalues of this research; – – –, error limits without uncertainty in virial coefficients.
in the figure. Standard molar entropies calculated with this assignment range from0.2·R low near T=230 K to 0.6·R low near T=550 K.
Some of the differences between the statistically calculated standard molarentropies shown in figure 12 stem from wavenumber shifts between spectra obtainedfor pyridine in the liquid phase, vapor phase, or in solution. The new assignmentof this research(1,105) is the first based entirely on wavenumber values for thevapor phase. Differences of approximately 0.05·R between standard molarentropies calculated with wavenumbers for the vapor and liquid phases are shownin figure 5 of part I.(1) For pyridine, this entropy difference is larger than theuncertainty in the calorimetrically derived values between the temperatures 300 Kand 400 K.
R. D. Chirico and W. V. Steele838
Selected ideal-gas thermodynamic functions for the temperature range 200 K to1000 K calculated with the new vibrational assignment of this research(1,105) and theassessed molar energy of combustion(7) are listed in table 10 of reference 1. Anuncertainty of 0.1 per cent was assumed in the statistically derived entropies andenthalpy increments.
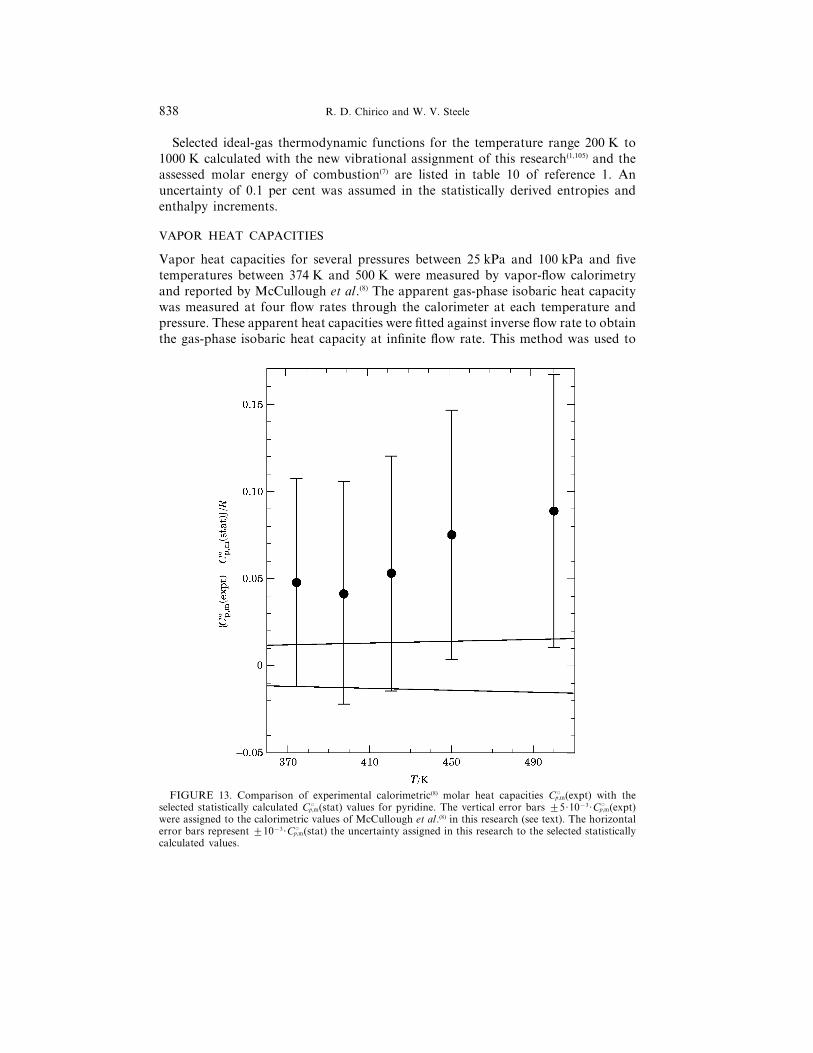
VAPOR HEAT CAPACITIES
Vapor heat capacities for several pressures between 25 kPa and 100 kPa and fivetemperatures between 374 K and 500 K were measured by vapor-flow calorimetryand reported by McCullough et al.(8) The apparent gas-phase isobaric heat capacitywas measured at four flow rates through the calorimeter at each temperature andpressure. These apparent heat capacities were fitted against inverse flow rate to obtainthe gas-phase isobaric heat capacity at infinite flow rate. This method was used to
FIGURE 13. Comparison of experimental calorimetric(8) molar heat capacities C°p,m(expt) with theselected statistically calculated C°p,m(stat) values for pyridine. The vertical error bars 25·10−3·C°p,m(expt)were assigned to the calorimetric values of McCullough et al.(8) in this research (see text). The horizontalerror bars represent 210−3·C°p,m(stat) the uncertainty assigned in this research to the selected statisticallycalculated values.
Pyridine properties review 839
correct for energy losses in the calorimeter.(106) Heat capacities for the ideal-gas stateC°p,m were then calculated by linear extrapolation of the isobaric heat capacities at eachtemperature to p=0. These derived ‘‘experimental’’ ideal-gas heat capacities arecompared in figure 13 with values calculated statistically with the selected vibrationalassignment of this research.(1,105)
The ‘‘experimental’’ C°p,m values reported by McCullough et al.(8) are (0.3 to 0.6)per cent higher than those calculated statistically in this research.(1) McCulloughet al.(8) estimated the uncertainty in the experimental C°p,m values to be 20.2 per cent.Their assessment appears to have been overly optimistic. There is a 20.2 per centuncertainty associated with the extrapolation of the isobaric heat capacities to p=0.There is an additional uncertainty associated with the extrapolation to infiniteflow rate used in the calculation of the isobaric heat capacities. A review of theoriginal data(107) showed this uncertainty to be at least as large as that associated withthe extrapolation to p=0. Consequently, the differences seen in figure 13 are inaccord with the overall uncertainties in the C°p,m values, which are estimated here tobe 20.5 per cent.
McCullough et al.(8) forced agreement between the experimental and calculatedideal-gas heat capacities based on their vibrational assignment with an empirical‘‘anharmonicity correction.’’ This correction is not justified and was not applied inthe present research. Recommended heat capacities for the ideal-gas state are thosecalculated statistically, based on the vibrational assignment of this research.(1,105)
Representative values are listed in table 10 of reference 1.
The authors acknowledge the financial support of the Office of Fossil Energyof the U.S. Department of Energy. This research was funded within the Processingand Downstream Operations section of the Advanced Oil Recovery (AOR)program. The research was completed under Management and Operation ContractDE-AC22-94PC91008.
REFERENCES
1. Chirico, R. D.; Steele, W. V.; Nguyen, A.; Klots, T. D.; Knipmeyer, S. E. J. Chem. Thermodynamics1996 28, 797–818.
2. Das, A.; Frenkel, M.; Gadalla, N. A. M.; Kudchadker, S.; Marsh, K. N.; Rodgers, A. S.;Wilhoit, R. C. J. Phys. Chem. Ref. Data 1993, 22, 659–782.
3. Delepine, M. C. R. Acad. Sci. 1898, 126, 964. As cited in reference 2.4. Constam, E. J.; White, J. Am. Chem. J. 1903, 29, 1–49.5. Swietoslawski, W. Zh. Russ. Fiz. Khim. Ova. Chast. Khim. 1909, 41, 387–429.6. Cox, J. D.; Challoner, A. R.; Meetham, A. R. J. Chem. Soc. 1954, 265–271.7. Hubbard, W. N.; Frow, F. R.; Waddington, G. J. Phys. Chem. 1961, 65, 1326–1328.8. McCullough, J. P.; Douslin, D. R.; Messerly, J. F.; Hossenlopp, I. A.; Kincheloe, T. C.; Waddington,
G. J. Am. Chem. Soc. 1957, 79, 4289–4295.9. Domalski, E. S.; Evans, W. H.; Hearing E. D. J. Phys. Chem. Ref. Data 1984, 13. Suppl. No. 1.
10. Parks, G. S.; Todd, S. S.; Moore, W. A. J. Am. Chem. Soc. 1936, 58, 398–401.11. Pearce, J. N.; Bakke, H. M. Proc. Iowa Acad. Sci. 1936, 43, 171–174.12. Rastorguev, Yu. L.; Ganiev, Yu. A. Izv. Vyssh. Ucheb. Zaved., Neft. Gaz 1967, 10, 79–82.13. Proces-verbaux du Comite International des Poids et Mesures. Bureau International des Poids et
Mesures: Pavillion de Breteuil, Sevres, France. 1990.14. Goldberg, R. N.; Weir, R. D. Pure Appl. Chem. 1992, 64, 1545.15. McCullough, J. P.; Waddington, G. Anal. Chim. Acta 1957, 17, 80.
R. D. Chirico and W. V. Steele840
16. Westrum, E. F., Jr.; Furukawa, G. T.; McCullough, J. P. Experimental Thermodynamics. Vol. 1,Chap. 5. McCullough, J. P.; Scott, D. W.: editors. Butterworths: London. 1968.
17. Herington, E. F. G.; Martin, J. F. Trans. Faraday Soc. 1953, 49, 154–162.18. Soulie, M.; Bares, D.; Metzger, J. C. R. Acad. Sci. Paris, Ser. C 1975, 281, 341–342.19. Lencka, M. J. Chem. Thermodynamics 1990, 22, 473–480.20. Willingham, C. B.; Taylor, W. J.; Pignocco, J. M.; Rossini, F. D. J. Res. Natl. Bur. Stand. (U.S.)
1945, 35, 219–244.21. Chan, T. C.; Van Hook, W. A. Trans. Faraday Soc. 1976, 72, 583–600.22. Konakbaeva, E. G.; Anisimova, Z. K.; Shakhparanov, M. I. Moscow Univ. Chem. Bull. 1974, 29,
20–24.23. Kobe, K. A.; Ravicz, A. E.; Vohra, S. P. J. Chem. Eng. Data 1956, 1, 50–56.24. Riley, F. T.; Bailey, K. C. Proc. R. Irish Acad. 1929, B38, 450–453. Values listed in reference 25
are incomplete.25. Timmermans, J. Physico-Chemical Constants of Pure Organic Compounds. Elsevier: New York. 1950.26. Hieber, W.; Woerner, A. Z. Elektrochem. 1934, 40, 252–256.27. Meulen, P. A. v.; Mann, R. F. J. Am. Chem. Soc. 1931, 53, 451–453.28. Brown, H. C.; Barbaras, G. K. J. Am. Chem. Soc. 1947, 69, 1137–1144.29. Hisamura, M.; Okazaki, T.; Matsuyama, A. Coal Tar (J. Japan Tar Ind. Assoc.) 1950, 2, 132–139.30. Arnett, E. M.; Chawla, B. J. Am. Chem. Soc. 1979, 101, 7141–7146.31. Weclawski, J.; Bylicki, A. Fluid Phase Equilib. 1983, 12, 143–153.32. Gardner, C. L.; Day, R. W. Can. J. Chem. 1984, 62, 986–989.33. Blanco, B.; Beltran, S.; Cabezas, J. L. J. Chem. Eng. Data 1994, 39, 23–26.34. Oscarson, J. L.; Lundell, S. O.; Cunningham, J. R. AIChE Symp. Ser. 1987, 83(256), 1–17.35. Bratton, A. C. J.; Felsing, W. A.; Bailey, J. R. Ind. Eng. Chem. 1936, 28, 424–430.36. Ibl, v. N.; Dandliker, G.; Trumpler, G. Helv. Chim. Acta 1954, 37, 1661–1672.37. Ibl, v. N.; Dandliker, G.; Trumpler, G. Chem. Eng. Sci. 1956, 5, 193–197.38. Andon, R. J. L.; Cox, J. D.; Herington, E. F. G. Trans. Faraday Soc. 1957, 53, 410–426.39. Maczynska, Z. Bull. Acad. Pol. Sci. Ser. Sci. Chim. 1963, 11, 225–229.40. Findlay, T. J. V.; Copp, J. L. Trans. Faraday Soc. 1969, 65, 1463–1469.41. Findlay, T. J. V.; Kenyon, R. S. Aust. J. Chem. 1969, 22, 865–869.42. Nakanishi, K.; Ashitani, K.; Touhara, H. J. Chem. Thermodynamics 1976, 8, 121–126.43. Warycha, S. J. Chem. Thermodynamics 1977, 9, 813–820.44. Abe, J.; Nakanishi, K.; Touhara, H. J. Chem. Thermodynamics 1978, 10, 483–494.45. Timmermans, J. Bull. Soc. Chim. Belg. 1907, 21, 395–402.46. Muller, R.; Brenneis, H. Z. Elektrochem. 1932, 38, 450–451.47. Timmermans, J.; Hennaut-Roland J. Chim. Phys. 1937, 34, 693–739.48. Lagemann, R. T.; McMillan, D. R.; Woolf, W. E. J. Chem. Phys. 1949, 17, 369–373.49. Biddiscombe, D. P.; Coulson, E. A.; Handley, R.; Herington, E. F. G. J. Chem. Soc. 1954,
1957–1967.50. Toropov, A. P. J. Gen. Chem. (Russian) 1956, 26, 3635–3638.51. Helm, R. V.; Lanum, W. J.; Cook, G. L.; Ball, J. S. J. Phys. Chem. 1958, 62, 858–862.52. Mato, F.; Sanchez, M. An. R. Soc. Esp. Fıs. Quım. Ser. B 1967, 63, 971–980.53. Meyer, R.; Barlatier, A.; Metzger, J. J. Chim. Phys. Phys. Biol. 1971, 68, 417–422.54. Deshpande, D. D.; Laxminarayan, G. B.; Oswal, S.; Prabhu, C. S. J. Chem. Eng. Data 1971, 16,
469–473.55. Rao, M. V. P.; Naidu, P. R. Proc. Indian Acad. Sci. Sect. A 1973, 78, 65–71.56. Malanowski, S.; Patz, R.; Ratzsch, M. T.; Wohlfarth, C. Fluid Phase Equilib. 1979, 3, 291–312.57. Pikkarainen, L. Finn. Chem. Lett. 1980, 185–188.58. Singh, J.; Bakshi, M. S. J. Chem. Soc. Miniprint 1992, 7, 1701–1739.59. Leis, D. G.; Curran, B. C. J. Am. Chem. Soc. 1956, 67, 79–81.60. Hatem, S. Bull. Soc. Chim. Fr. 1949, 599–600.61. Bruhl, J. W. Z. Phys. Chem. Stoechiom. Verwandschaftsl. 1895, 16, 193–225.62. Dutoit, P.; Friederich, L. Arch. Sci. Geneva 1900, 9, 105–132.63. Livingston, J.; Morgan, R.; Higgins, E. Z. Phys. Chem. Stoechiom. Verwandschaftsl. 1908, 64,
170–186.64. Arndt, F.; Nachtwey, P. Chem. Ber. Ges. B 1926, 59, 448–455.65. Huckel, W.; Salinger, C. M. Chem. Ber. 1944, 77, 810–816.66. Kovalenko, K. N.; Trifonov, N. A. J. Gen. Chem. U.S.S.R. 1950, 20, 1175–1182.67. Holland, R. S.; Smyth, C. P. J. Phys. Chem. 1955, 59, 1088–1092.68. Korosi, G.; Kovats, E. sz. J. Chem. Eng. Data 1981, 26, 323–332.
Pyridine properties review 841
69. Naumova, A. C. Sb. Statei Obshch. Khim. Acad. Nauk. SSSR 1953, 2, 778–787.70. Bramley, A. J. Chem. Soc. 1916, 109, 10–45, 434–469.71. Perkin, W. H. J. Chem. Soc. 1896, 69, 1025–1257.72. Gokavi, G. S.; Raju, J. R.; Aminabhavi, T. M.; Balundgi, R. H.; Muddapur, M. V. J. Chem. Eng.
Data 1986, 31, 15–18.73. Riedel, L. Chem.-Ing.-Tech. 1954, 26, 259–264.74. Ambrose, D.; Grant, D. G. Trans. Faraday Soc. 1957, 53, 771–778.75. Kudchadker, A. P.; Kudchadker, S. A. Pyridine and Phenylpyridines. API Monograph Series
Publication 710. American Petroleum Institute: Washington, D.C. 1979.76. Radice: Doctoral thesis. Geneve. 1899. As cited in Kobe; K. A.; Lynn, R. E., Jr. Chem. Rev. 1953,
52, 117–236.77. Herz, W. von; Neukirch, E. Z. Phys. Chem. 1923, 104, 433–450.78. Swietos<awski, W.; Kreg<ewski, A. Bull. Acad. Polon. Sci., Classe III 1954, 2, 77–80.79. Brunner, E. J. Chem. Thermodynamics 1987, 19, 823–835.80. Majer, V.; Svoboda, V.; Lencka, M. J. Chem. Thermodynamics 1984, 16, 1019–1024.81. Pitzer, K. S.; Curl, R. F., Jr. J. Am. Chem. Soc. 1957, 79, 2369–2370.82. Orbey, H.; Vera, J. H. AIChE J. 1983, 29, 107–113.83. Mathews, J. H. J. Am. Chem. Soc. 1926, 48, 562–576.84. Buck, K. R.; Stewart, H. N. M. Chem. Ind. 1961, 586–587.85. Yarym-Argaev, N. L.; Kogan, E. A.; Rudin, V. Y.; Titova, V. A. Russ. J. Phys. Chem. 1963, 37,
777–779.86. Rochester, C. H.; Waters, J. A. J. Chem. Soc., Faraday Trans. I 1982, 78, 631–640.87. Kolossowsky, N.; Megenine, I. S. Bull. Soc. Chim. Fr. 1931, 49, 1461–1465.88. Louguinine, W. C. R. Hebd. Seances Acad. Sci. 1899, 128, 366–371.89. Kahlenberg, L. J. Phys. Chem. 1901, 5, 215–232.90. Majer, V.; Svoboda, V. Enthalpies of Vaporization of Organic Compounds. A Critical Review and Data
Compilation. International Union of Pure and Applied Chemistry Chemical Data Series No. 32.Blackwell: Oxford. 1985.
91. Tekac, V.; Majer, V.; Svoboda, V.; Hynek, V. J. Chem. Thermodynamics 1981, 13, 659–662.92. Watson, K. M. Ind. Eng. Chem. 1943, 35, 398–406.93. Andon, R. J. L.; Cox, J. D.; Herington, E. F. G.; Martin, J. F. Trans. Faraday Soc. 1957, 53,
1074–1082.94. Cox, J. D.; Andon, R. J. L. Trans. Faraday Soc. 1958, 54, 1622–1629.95. Wlodarczak, G.; Martinache, L.; Demaison, J.; Van Eijck, B. P. J. Mol. Spectrosc. 1988, 127,
200–208.96. Kline, C. H.; Turkevich, J. J. Chem. Phys. 1944, 12, 300–309.97. Corrsin, L.; Fax, B. J.; Lord, R. C. J. Chem. Phys. 1953, 21, 1170–1176.98. Wilmshurst, J. K.; Bernstein, H. J. Can. J. Chem. 1957, 35, 1183–1194.99. Green, J. H. S.; Kynaston, W.; Paisley, H. M. Spectrochim. Acta 1963, 19, 549–564.
100. DiLella, D. P.; Stidham, H. D. J. Raman Spectrosc. 1980, 9, 90–106.101. Draeger, J. A. Spectrochim. Acta 1983, 39A, 809–825.102. Wong, K. N.; Colson, S. D. J. Mol. Spectrosc. 1984, 104, 129–151.103. Pongor, G.; Pulay, P.; Fogarasi, G.; Boggs, J. E. J. Am. Chem. Soc. 1984, 106, 2765–2769.104. Pongor, G.; Fogarasi, G.; Boggs, J. E.; Pulay, P. J. Mol. Spectrosc. 1985, 114, 445–453.105. Klots, T. D. to be published.106. McCullough, J. P.; Waddington, G. Experimental Thermodynamics. Vol. 1. Chap. 10. Butterworths:
London. 1968.107. Unpublished. Notebooks listing all the ‘‘raw’’ experimental results on all compounds studied in the
Thermodynamics Research Laboratory since 1945 are available for consultation at NIPER.
(Received 14 November 1995; in final form 12 February 1996)
O-613