Embed Size (px)
Citation preview

Thermodynamic, Economic, and Environmental Modeling of Hydrogen (H2) Co‐Production Integrated with Stationary Fuel Cell Systems (FCS)
Whitney Colella,1 Aerel Rankin,1 Amy Sun,1
Pere Margalef,2 Jack Brouwer,2
Sandia National Laboratories,1 Department of Mechanical and Aerospace Engineering, University of
California at Irvine2
May 18th 2009 Project ID # ANP‐03 anp_03_colella
This presentation does not contain any proprietary, confidential, or otherwise restricted information

• Project start date: Jan 2009• Project end date: Sept 2010• Percent complete: 12%
• Barriers addressedA. Future Market Behavior [developing economic &
thermodynamic models of advanced H2 -FCS to describe future H2 supply]
B. Stove-piped/Siloed Analytical Capability [building cross-disciplinary engineering & business models; teaming with national labs (TSPI team) to jointly integrate H2 -FCS into models]
D. Suite of Models and Tools [improving models with optimization, thermodynamic analyses of theoretical limits, novel FCS design and control]
• Total project funding– 100% DOE funded
• Funding received in FY08: – $5K Sandia NL
• Expenditures for FY09 (to-date): – $56K Sandia NL– $11K UC Irvine– $1K other contracts
• Total available funding for FY09: – $163K shared by all parties
Timeline
Budget
Barriers
• Interactions/ collaborations:– UC Irvine [H2 separation thermodynamic models]– Transportation and Stationary Power Integration
(TSPI) team: SNL, NREL, LANL, ORNL, BNL, ANL [jointly integrating H2 co-production models]
– Fuel Cell Energy, Inc. [MCFC expertise]– Technology Management, Inc. [SOFC expertise]– Fuels Pathways Integration Technology Team
(FPITT): SNL, NREL, ANL, LLNL [developing models]; ExxonMobil, Shell, ConocoPhillips, Chevron [evaluating models]
Partners
Overview

H2-FCS Concept:• A conventional distributed fuel cell system can provide clean electricity and
recoverable heat to nearby buildings. This system can be re-designed to alsoprovide excess hydrogen (H2) for supplying H2 vehicles or industry (merchant H2).
• H2-FCS can provide H2 with lower costs, fuel use, & emissions.Advantages of this Approach:• H2-FCS can supply H2 locally, without the added H2 transport infrastructure and
related capital costs, energy use, and emissions seen with centralized production.• H2-FCS can supply H2 in response to H2 demand, and as a H2 vehicle fleet grows.
When H2 demand is low, H2-FCS can sell more electricity and heat instead, andthereby retain high system capacity utilization and lower costs.
• H2-FCS can address the “chicken-or-egg” problem associated with a lack of H2refueling stations for initial H2 fleets.
• H2-FCS can improve fuel security by relying on local, widely-available feedstock.• H2-FCS can make H2 with less additional fuel than distributed steam methane
reforming (SMR) by reusing high temperature fuel cell waste heat to warm theendothermic steam reforming process to make excess H2.
• Synergistic benefits include that a lower fuel utilization increases overall efficiency(i.e., higher Nernst Voltage, lower mass transport losses, lower cooling requirementand associated air blower parasitic load.)
• Less energy is needed to make and to transport H2 to vehicles using H2-FCScompared with centralized electrolysis, distributed electrolysis, or centralized SMR.
RelevanceHydrogen Co-Production Integrated with Stationary Fuel Cell Systems (H2-FCS) can provide H2 with lower costs, fuel use, & emissions than other H2 supply chains.

0
10
20
30
40
50
60
70
80
350 bar
700 bar
350 bar
700 bar
350 bar
700 bar
350 bar
700 bar
Energy Consumption (kWh/kg of H2)
Energy requirements for providing H2 to refuel vehicles via various supply chains, based on life cycle assessment
Compression
Transport of hydrogen to the point of useLiquefaction
Non‐feedstock energy consumed by the systemFeedstock energy
CentralizedElectrolysis
Centralized SMR
H2‐FCSDistributedElectrolysisAssumptions:
• Centralized electrolysis plant is located in Palm Springs, CA. 100% of electricity used is wind power. H2 is transported by diesel-fueled truck to Los Angeles (LA).
• Distributed electrolyzer is located at fueling station & consumes100% wind power. • Steam methane reforming (SMR) plant is located in Long Beach, CA; H2 is
transported by a diesel-fueled truck to LA.
RelevanceH2-FCS consumes less energy to make and to transport H2 compared with other H2 supply chains.

Relevance – Project ObjectivesWe analyze the potential for H2 co-production within high temperature stationary fuel cell systems (H2-FCS) and identify novel designs with minimum 1) CO2 and 2) cost.# Objectives # Progress Notes Comments
Percent Complete
1
Develop novel H2-FCS designs that release low greenhouse gas emissions.
1.1
We derive the theoretical limit of excess H2 from fuel cellelectrochemical waste heatalone, without added feedstockfuel use or CO2 emissions.
We developed analytical and chemical engineering process flowsheet models to show that an idealized 1 megawatt electric fuelcell operating between 800 and 1000ºC could make ~150 to 450kg H2 /day, without added fuel use or CO2 emissions.
12%
1.2
We identify optimal cycledesigns for thermally integratingthe hydrogen separation unit(HSU) & the fuel cell, to reuseanode-off gas waste heat, consume less work, & increaseH2 yield with no added fuel orCO2.
We built chemical engineering process flow sheet models toidentify an optimal HSU cycle design that meets pressure swingabsorption (PSA) unit inlet requirements, recovers 73% ofavailable anode-off gas waste heat, consumes 11% of grosselectricity, & increases H2 yield by 132%, without any addedfeedstock fuel use or CO2 emissions. Our approach minimizesfuel consumption and CO2 emissions by re-using available wasteheat and minimizing losses.
12%
1.3
We show minimum CO2
emissions for designs with ourapproach using heat & H2 loadfollowing, operating at anyelectrical output.
We advanced optimization models that show that, for a given setof assumptions, the designs with the lowest CO2 emissions tendedto combine a) electrical and thermal networking, b) a variable heat-to-electric power ratio, c) a variable H2-to-heat ratio, d) first loadfollowing heat demand as the primary control, and e) then loadfollowing H2 demand as the secondary control.
12%
2Develop novel H2-FCS designs with low H2 production cost.
2.1We show that cost optimizationfavors designs operating atmaximum electrical output, withheat & H2 load following.
We advanced optimization models that show that, for theassumptions and options investigated, the designs with the lowestenergy costs tended to combine a) electrical and thermalnetworking, b) a variable heat-to-electric power ratio, c) a variableH2-to-heat ratio, with d) maximum electrical output, e) heat loadfollowing, and e) H2 load following.
12%

We reduce energy to make H2 by using fuel cell heat for endothermic reforming. We derive the theoretical limit of excess H2 from electrochemical waste heat alone.
222 HCOOHfuel cba +→+
FUEL CELLREFA
REFB
nCH4,A
nH2O,A
nH2,A
nO2,A
nCH4,B
nH2O,B
QFC
QREFA
QREFB
nH2,B
Welec
nH2O, FC
nCO2,A
nCO2,B
nCO2,A
nH2,O2,unreacted
FUEL CELLREFA
REFB
nCH4,A
nH2O,A
nH2,A
nO2,A
nCH4,B
nH2O,B
QFC
QREFA
QREFB
nH2,B
Welec
nH2O, FC
nCO2,A
nCO2,B
nCO2,A
nH2,O2,unreacted
carrierCO:MCFC
carrierO:SOFC
OHOH
23
2
2221
2
−
−
→+
( )
BA
A
AB
REFREFFC
srrxn
REFelecfcrxn
srrxn
excessexcess
elecfcrxnFC
REFFCREFexcess
TTTh
QWHh
Qn
WHQ
QQQQ
==Δ
−−Δ=
Δ=
−Δ=
−==
,
,
,
,
We derive the quantity of excess H2 available (nexcess) from electrochemical waste heat (QFC). The steam reforming reactions can provide H2 (A) for the fuel cell’s anode or (B) for excess H2 production. For benchmarking a H2 co-producing system against a standard system, we analytically separate the two processes – (A) and (B) -- in two “virtually” separate steam reformers – REFA and REFB. REFA produces enough H2 for the fuel cell to provide electric power. REFB produces excess H2 (for vehicles, etc.)
Approach; Objective 1.1

We model SOFC polarization from 600 to 1000°C.Includes constants published by Shaffer, B., M. Hunsuck, and J. Brouwer, 2008.
concohmact
eelecidealVV
FVnW
ηηη −−−=
=
⎟⎟⎠
⎞⎜⎜⎝
⎛−⎟⎟
⎠
⎞⎜⎜⎝
⎛=
⎟⎟⎠
⎞⎜⎜⎝
⎛−⎟
⎟⎠
⎞⎜⎜⎝
⎛⎟⎟⎠
⎞⎜⎜⎝
⎛=
⎟⎟⎠
⎞⎜⎜⎝
⎛= −
TRE
p
pj
TRE
p
p
p
pj
jj
FnTR
u
cathodeact
amb
Ocathodecathodeo
u
anodeact
amb
OH
amb
Hanodeanodeo
oe
outuact
,25.0
,
,,
,*
1
exp
exp
2sinh
2
22
γ
γ
η
( )
⎟⎟⎠
⎞⎜⎜⎝
⎛−−=
+++×=
Le
outuconc
eelectrolytICcathodeanodeohm
jj
FnTR
RRRRi
1lnη
η
Approach; Objective 1.1
0.00
0.10
0.20
0.30
0.40
0.50
0.60
0.70
0.80
0.90
1.00
0 100 200 300 400 500 600 700 800 900
Current Density (mA/cm^2)
Volta
ge (V
olt)
0
100
200
300
400
500
600
Pow
er D
ensi
ty (m
W/c
m^2
)
peak power@ 600 oC
peak power@ 1000 oC
600 oC
power density, 1000 oC
800 oC
700 oC
Voltage, 1000 oC
800 oC
700 oC
600 oC
analysispoint
analysispoint
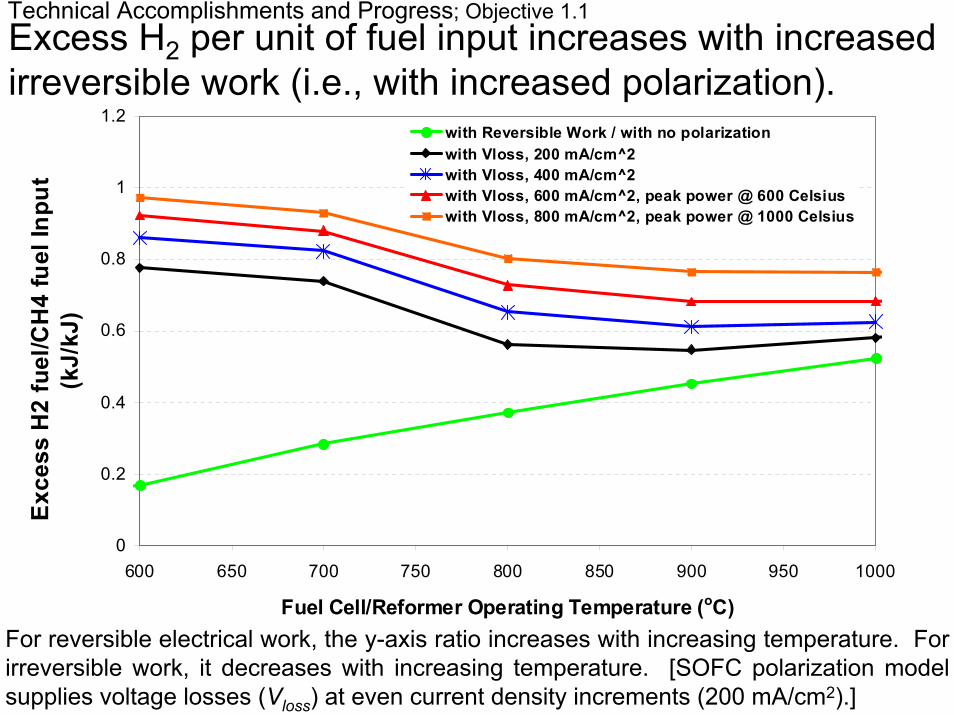
Excess H2 per unit of fuel input increases with increased irreversible work (i.e., with increased polarization).
Technical Accomplishments and Progress; Objective 1.1
For reversible electrical work, the y-axis ratio increases with increasing temperature. For irreversible work, it decreases with increasing temperature. [SOFC polarization model supplies voltage losses (Vloss) at even current density increments (200 mA/cm2).]
0
0.2
0.4
0.6
0.8
1
1.2
600 650 700 750 800 850 900 950 1000
Fuel Cell/Reformer Operating Temperature (oC)
with Reversible Work / with no polarizationwith Vloss, 200 mA/cm^2with Vloss, 400 mA/cm^2with Vloss, 600 mA/cm^2, peak power @ 600 Celsiuswith Vloss, 800 mA/cm^2, peak power @ 1000 Celsius
Exc
ess
H2
fuel
/CH
4 fu
el In
put
(kJ/
kJ)

Excess H2 per unit of electrical work (Welec) increases with higher irreversibilities (more Vloss).
Technical Accomplishments and Progress; Objective 1.1
This trend occurs to a greater extent as temperature decreases, because as the temperature decreases in the range of 600-1000C, the polarization increases.
0
0.5
1
1.5
2
2.5
3
600 650 700 750 800 850 900 950 1000
Fuel Cell/Reformer Operating Temperature (oC)
with Reversible Work / with no polarization
with Vloss, 200 mA/cm^2
with Vloss, 400 mA/cm^2
with Vloss, 600 mA/cm^2, peak power @ 600 Celsius
with Vloss, 800 mA/cm^2, peak power @ 1000 Celsius
Exc
ess
H2
fuel
/Wel
ec (k
J/kJ
)

Technical Accomplishments and Progress; Objective 1.1
Excess H2 is greater with (A) ideal heat transfer between hot fuel cell system exhaust gases (CO2, H2O, H2) and cold inlet gases (O2, CH4, H2O) compared with (B) no heat transfer between hot exhaust and cold inlet streams. Excess H2 depends upon the efficiency of heat exchange in preheating anode and cathode inlet gases.
Excess H2 is greater with more internal reuse of heat between hot outlet and cold inlet gases.
0
0.1
0.2
0.3
0.4
0.5
0.6
0.7
0.8
0.9
1
1.1
1.2
600 650 700 750 800 850 900 950 1000
Fuel Cell/Reformer Operating Temperature (oC)
with Reversible Work / with no polarizationwith Vloss, 200 mA/cm^2with Vloss, 400 mA/cm^2with Vloss, 600 mA/cm^2, peak power @ 600 Celsiuswith Vloss, 800 mA/cm^2, peak power @ 1000 Celsius
Incr
ease
in a
vaila
ble
H2
[ H
2/C
H4]
with
id
eal h
eat t
rans
fer
com
pare
d to
no
heat
tr
ansf
er b
etw
een
hot e
xhau
st a
nd c
old
inle
t str
eam
s, (
kJ/k
J)
Δ

REFA
REFB
Fuel Cell
heat stream QREFB = Qexcess
heat stream: QREFA
Work stream Welec
fuel inlet, A
fuel inlet, B
steamrecycle
steammake-up
nexcess
Our AspenPlusTM chemical engineering processflowsheet simulations verify our analytical models.
Approach; Objective 1.1
AspenPlusTM model emulates schematic of analytical model with REFA and REFBdistinction, ideal heat transfer, high fuel and oxidant utilization within fuel cell, and reuseof fuel cell electrochemical waste heat alone. It calculates excess H2 available (nexcess).

Technical Accomplishments and Progress; Objective 1.1
Our AspenPlusTM model results agree with our analytical model calculations.
Results concur for reversible and non-reversible work, for different polarization levels (Vloss), and for different operating temperatures.
0
0.2
0.4
0.6
0.8
1
1.2
600 650 700 750 800 850 900 950 1000
Fuel Cell/Reformer Operating Temperature (oC)
with Reversible Work / with no polarizationwith Vloss, 200 mA/cm^2with Vloss, 400 mA/cm^2with Vloss, 600 mA/cm^2, peak power @ 600 Celsiuswith Vloss, 800 mA/cm^2, peak power @ 1000 CelsiusAspenPlus, Reversible Work @ 700 CelsiusAspenPlus, 400 mA/cm^2 @ 900 Celsius
Exc
ess
H2
fuel
/CH
4 fu
el In
put
(kJ/
kJ)

CH4-A CH4-B H2-FEED H2EXTRA H2O-A H2O-B H2OB-REC
Mole Flow (kmol/hr) CH4 0.25 0.22 0 0 0 0 0 H2O 0 0 0 0.56 0.5 1 0.5 CO 0 0 0 0 0 0 0 CO2 0 0 0.25 0.22 0 0 0 H2 0 0 1 0.874 0 0 0 O2 0 0 0 0 0 0 0 N2 0 0 0 0 0 0 0
Total Flow kmol/hr 0.25 0.22 1.25 1.66 0.5 1 0.5total Flow kg/hr 4.01 3.51 13.02 21.52 9.01 18.02 9.01
Total Flow cum/hr 24.38 21.31 121.94 161.47 48.77 97.54 48.77Temperature, K 1173.15 1173.15 1173.29 1173.15 1173.15 1173.15 1173.15Pressure, bar 1 1 1 1 1 1 1Vapor Frac 1 1 1 1 1 1 1Liquid Frac 0 0 0 0 0 0 0
Molar Enthalpy, kJ/kmol -22855.56 -22855.56 -49352.94 -103436.06 -208462.8 -208462.8 -208462.8Mass Enthalpy, kJ/kg -1424.9102 -1432.5422 -4738.1855 -7978.8039 -11568.4129 -11568.4129 -11568.4129
Enthalpy Flow, kW 1.5872 1.3967 17.1364 47.6955 28.9532 57.9063 28.9532Excess H2 fuel/total CH4
fuel Input 0 0 0 0.62175 0 0 0Molar Entropy, J/mol-K -6.65256 -6.65256 49.9988 40.50112 6.40152 6.40152 6.40152Mass Entropy, J/gm-K -0.4184 -0.4184 4.8116 3.09616 0.37656 0.37656 0.37656
Molar Density, kmol/cum 0.01 0.01 0.01 0.01 0.01 0.01 0.01Mass Density, kg/cum 0.16 0.16 0.11 0.13 0.18 0.18 0.18
Average MW 16.04 16.04 10.41 13 18.02 18.02 18.02
nexcess
Table shows example data for a power density of 400 mA/cm^2 and a fuel cell/reformer operating temperature of 900 oC
Excess H2 fuel/CH4 fuel input (kJ/kJ)
AspenPlusTM model fluid stream table shows results for excess H2 moles from REFB, and excess H2/CH4, which agree with analytical model.
Technical Accomplishments and Progress; Objective 1.1

A 1 megawatt electric (MWe) fuel cell operating between 800 and 1000ºC could make ~150 to 450 kg H2 /day without added fuel consumption or CO2 emissions.
Technical Accomplishments and Progress; Objective 1.1
This equates to fueling between ~ 220 and 660 H2 fuel cell cars per day. Based on a fuel economy of 60 miles/kg H2
[1] and an average annual mileage of 15,000.
0
200
400
600
800
1000
1200
600 650 700 750 800 850 900 950 1000
Fuel Cell/Reformer Operating Temperature (oC)
0
200
400
600
800
1000
1200
1400
1600
1800with Reversible Work / with no polarizationwith Vloss, 200 mA/cm^2with Vloss, 400 mA/cm^2with Vloss, 600 mA/cm^2, peak power @ 600 Celsiuswith Vloss, 800 mA/cm^2, peak power @ 800 Celsius
Dai
ly H
2 ou
tput
for a
1 M
We
fuel
cel
l sys
tem
(kg
H2/
day)
Num
ber o
f hyd
roge
n fu
el c
ell v
ehic
les
refu
eled
per
day
(car
s/da
y)
[1] http://www.fueleconomy.gov/feg/fcv_sbs.shtml

REFA
REFB
SOFC - anode
fuel inlet, A
fuel inlet, B
steam recycle
steammake-up
air inlet SOFC-cathode
burner
Work stream Welec
We introduce increasing complexity into AspenPlusTM
models to analyze excess H2/ fuel input.
We enhance model fidelity to better analyze (A) preheating anode and cathode inletgases, (B) reduced air compressor parasitic power for fuel cell stack cooling, (C) loweranodic fuel and cathode O2 utilization rates, (D) ancillary loads (pumps, etc.), (E) heatexchanger loop designs, (F) recycle streams, (G) external and internal reforming, (H)thermodynamic cycle designs, and (I) operating conditions (steam-to-carbon ratio, etc.)
Technical Accomplishments and Progress; Objective 1.1

MCFC - anode
We model the integration of Molten Carbonate Fuel Cell (MCFC) systems with H2 Separation Units (HSU).
Approach; Objective 1.2
REFA
REFB
fuel inlet, A
fuel inlet, B
steam recycle
steammake-up
air inlet
MCFC-cathode
H2 Separation Unit
The HSU uses Pressure Swing Absorption (PSA) beds, based on 80% H2 recovery andQuestAir H-3200 specifications. The 1 MWe MCFC operates with 60% H2 utilization.

Approach; Objective 1.2
H2 yield for vehicle fueling (shown in green) increases when less anode off-gas H2 (red)is burned for internal heat generation (orange). Heat from H2 combustion can bedisplaced by internal reuse of available heat. The anode off-gas (red) must be cooledand compressed to reach the required PSA inlet temperature (~323 K) and pressure(~20 bar). We evaluate configurations where this available heat warms incoming water(blue), air (light blue), & fuel (purple), and displaces H2 combustion at the burner (orange).
We evaluate cycle design configurations for thermallyintegrating HSU & fuel cell, with these goals: achieverequired inlet temperature & pressure for PSA, reuse allheat (Q), consume less work (W), & increase H2 yield.
H2 for vehicles (not at dispensing
pressure)
BurnerAnodeMCFCCathode
Fuel
Air
Balance of Plant (BoP)
(heat exchangers,
pre-reformer,…)e-
Anode off-gas H2 CO CO2 H2O
Exhaust gasesCO2hot airsteam
H2 CO CH4 steam
Hydrogen Separation Unit (PSA)
H2 CO CO2 H2O
AirWater
W~ - 114 kilowatts of electricity (kWe)
Gross Power ~1 MWe
Q~ - 600 kilowatts of thermal energy (kWt)

Approach; Objective 1.2We identify HSU cycle designs with heat recovery & water gas shift (WGS) that increase H2 yield by 132%.
1 MWe system makes 254 kg H2/day (green). In this cycle, the anode off-gas (red) is cooled & compressed in series twice, cooled again, undergoes WGS to convert CO to H2, & is cooled again before the PSA. Recovered heat makes BoP required steam (blue).
12
31
5
32
7
3
W
18
4
W
29
35
W
14
1
17
9
2
10
11
16 13
15
30W
19
22
20 27
W
21
24
6
W
33
B17
B4
B5
B6
B12
B1
B7
B2
B3
B8
B9
B10
B11
B13
Adiabatic water-gas shift reactor
Anode-off gasT=923K
P=0.131kPa[H2]=17.4%
[CO2]=31.2%[H2O]=44%[CO]=6.2%CH4=0.3%
Steam produced for the BoP
Pressure Swing AdsorptionRequirements based on QuestAir H-320085% of H2 recovered
Catalytic Combustor
Rich H2 product gas
AIR INLET
Comp# 3
Shell &Tube HEX
Evap# 2
Make-up steam for WGS
Evap# 1
Comp #1
Comp# 234
H2O Condensate
H2O CondH2O
Condensate
H2 gas storage (536 bar)

Heat Recovery Devices
Technical Accomplishments and Progress; Objective 1.2
CompressorOutlet Pressure (bar)
Work Required (kW)
Comment
1 4 69 for PSA inlet2 22 45 for PSA inlet
Subtotal 1143 537 32 for H2 storage
Total 146
Heat ExchangerHeat Recovered
(kWt)Evaporator #1 207Evaporator #2 178Post‐WGS Heat Exchanger
51
Total 436
This HSU design recovers 73% of the available thermal energy, with a compressor load of 11% of gross power.
The anode off-gas has 600 kilowatts of thermal energy (kWt) available to recoverbetween the anode outlet and the PSA inlet temperatures. The HSU cycle design shownhere recovers 436 kWt of this heat (73%), which provides 91% of system-wide requiredsteam. It requires 114 kW of compressor work (~11% of gross electric power) fromcompressors 1 & 2 to reach the required PSA inlet pressure (~21 bar.) This HSU designreduces compressor work by lowering compressor inlet gas temperatures. The H2delivery sub-system needs an additional 32 kW of compressor work to pressurize H2 upto 537 bar for H2 storage, to later dispense H2 at 350 bar to vehicles. Total compressorload for the HSU and H2 storage is about 15% of gross electric power.
Compression Work Devices

The marginal increase in H2 yield due to 1) displaced H2combustion alone is 102% (Case 2); 2) WGS alone is 15% (Case 3); & 3) both combined is 132% (Case 4.)
Without any HSU heat recovery (Case 1), the fuel cell system has a deficit of 123 kWt ofrequired heat for the BoP. Heat released from the exothermic anodic reactions isconsumed by reforming extra fuel. Consequently, to supply this deficit of heat, anodeoff-gas H2 is burned, and H2 yield for merchant H2 or vehicles is only 110 kg H2/day.
Technical Accomplishments and Progress; Objective 1.2
1 MWe Molten Carbonate Fuel Cell CASE 1 CASE 2 CASE 3 CASE 4
H2 Co‐production Yes Yes Yes YesHeat Recovery from the Hydrogen Separation Unit (HSU) No Yes No Yes
Water‐Gas Shift No No Yes YesFuel in @60% Utilization Factor [kgmol/s] 0.00312 0.00312 0.00312 0.00312
Methane LHV [kJ/kgmol] 800,800 800,800 800,800 800,800 Ein [kW] 2,500 2,500 2,500 2,500
Generated Gross Power [kW] 1000 1000 1000 1000Thermal energy penalty to reach PSA levels [kW] 600 600 600 600
Heat recovered from HSU by steam production [kW] 0 435 0 435Hydrogen potential before PSA [kgmol/s] 0.00151 0.00151 0.00173 0.00173
Hydrogen produced [kgmol/s] 0.00063 0.00128 0.00073 0.00147Hydrogen potential before PSA [kg/s] 0.00302 0.00302 0.00346 0.00346
Hydrogen produced [kg/s] 0.00127 0.00257 0.00145 0.00294Hydrogen produced [kg/h] 4.56624 9.2412 5.23152 10.5876Hydrogen Produced [kg/day] 109.59 221.78 125.56 254.10
Marginal increase in H2 compared with base case (kg H2/day) Basecase 112.19 15.96 144.51
H2 production increase (reference CASE 1: NO heat recv; NO WGS) Basecase 102% 15% 132%

Technical Accomplishments and Progress; Objective 1.2Case 4 meets PSA inlet needs, recovers 73% of heat, uses 11% of electricity, & increases H2 yield by 132%.
AspenTM Flowsheet Fluid Stream Name and Number
ThermodynamicCharacteristic of Stream
HSU IN Anode‐off gas WGS IN WGS OUT PSA IN PSA OUT
Burner OUT / Cathode Inlet Gas
1 12 5 2 10 13Mole Flow kgmol/sec
O2 0 0 0 0 0.00E+00 0.00279H2O 0.003894 0.00046 0.000244 3.50E‐05 0 0.00036CO 0.000541 0.000541 0.000325 0.000325 0 0CO2 0.002715 0.002715 0.002931 0.002931 0 0.00328H2 0.001518 0.001518 0.001734 0.001734 1.47E‐03 0CH4 3.25E‐05 3.25E‐05 3.25E‐05 3.25E‐05 0 0N2 0 0 0 0 0 0.01185
Mole FractionO2 0 0 0 0 0 0.15267H2O 0.44755 0.087298 0.046295 0.006912 0 0.01968CO 0.06216 0.102695 0.061692 0.064239 0 0CO2 0.31205 0.515538 0.55654 0.579522 0 0.17976H2 0.17451 0.288308 0.329311 0.342909 1 0CH4 0.00373 0.006162 0.006162 0.006417 0 0N2 0 0 0 0 0 0.64787
Total Flow kgmol/sec 0.0087 0.005266 0.005266 0.005057 0.001474 0.01829Total Flow kg/sec 0.208354 0.14649 0.14649 0.142728 0.002971 0.57251Temperature K 923.15 606.4986 527.5944 323.0022 333.0022 640.54Pressure N/sqm 106799.8 2221836 2152888 2152888 2118414 101283
Vapor Frac 1 1 1 1 1 1Liquid Frac 0 0 0 0 0 0
Enthalpy J/kgmol ‐2.1E+08 ‐2.2E+08 ‐2.3E+08 ‐2.4E+08 1006438 ‐64421960Enthalpy J/kg ‐8948283 ‐8071116 ‐8240865 ‐8390823 499254.7 ‐2058156.6Enthalpy Watt ‐1864412 ‐1182339 ‐1207206 ‐1197605 1483.524 ‐1178320.3

• Examines novel operating strategies not common in commercial industry• Novel approaches include thermal and electrical networking (N); variable heat-
to-power ratio (V); variable heat-to-H2 ratio (Y); and H2, electricity, or heat load following (P,E, or H).
• Optimizes the percentage installation of H2-FCS for • minimum CO2 emissions, or • maximum combined energy cost savings both for building owners in using both
electricity and heat and for H2 consumers (H2 vehicle owners, merchant H2, etc.) in using H2 compared with competing technologies.
• Optimizes FCS installation for • a particular location• climatic region• building load curves• FCS type, and • competitive environment.
• Shows trade-offs amongst competing goals:• cost savings to building owners and H2 consumers, CO2 reductions, FCS
installed capacity and manufacturer sales.
We model the economics and environmental impacts of H2-FCS using novel operating strategies. The model
Approach; Objectives 1.3 & 2.1

Model tests H2-FCS against demand data for electricity& steam measured in real-time from 20 buildings & forprojected vehicular H2 demand, each hour in a year.
Approach; Objectives 1.3 & 2.1

networking Networks have energy distribution channels. Fuel cells can convey excess heat or electricity into the distribution grid to reach other buildings, and sell back electricity to the grid. Transmission Loss: Electrical ~0%, Thermal ~8%.
Novel approaches include networking (N) and variable heat-to-power ratio (V).
0200400600800
1000120014001600
880 900 920 940 960 980 1000Use
ful T
herm
al P
ow
er
Reco
vere
d (
kW
)
Net System Electrical Power Output (kW)
Thermal Energy Recovered (kW) with a Fixed Heat-to-Power Ratio ~ 0.7Maximum Thermal Energy Recovered (kW) with a Variable Heat-to-Power Ratio ~ 1.3
Fixed (F) vs. Variable (V) Heat-to-Power Ratio
Variable heat-to-power ratio increases system operating range.
ElectricityHeat
FC Fuel cell system
Approach; Objectives 1.3 & 2.1

0
200
400
600
800
1000
1200
1400
0
200
400
600
800
1000
1200
1400
0 0.05 0.1
Use
ful H
yd
rog
en
Pow
er
Reco
vere
d (
kW
)
Use
ful T
herm
al P
ow
er
Reco
vere
d (
kW
)
Ratio of Hydrogen to Heat Produced
Variable Hydrogen to Heat Ratio
Maximum Useful Thermal Energy Recovered (kW) with 1000kW Electrical OutputMaximum Useful Hydrogen Energy Recovered (kW) with 1000kW Electrical Output
Approach; Objectives 1.3 & 2.1
Novel approaches include variable heat-to-H2 ratio (Y).
A FCS with a variable heat-to-hydrogen ratio can convert thermal energy into H2 energy over a certain range of ratios. This ratio reflects the conversion efficiency of using FCS waste heat to warm endothermic steam reforming reactions to make H2. Each 1 kW of FCS waste heat can make up to 1 kW of H2 energy (ideal heat transfer).

Dorm
Fuel Cell
Electricity *
HeatDorm
Fuel Cell
Heat *
Electricity
Fuel Cell
Electricity (C2)
Heat(C3) *
Heat Following (H)Electricity Following (E)No Load Following – at
Electrical Maximum (EX)
Novel approaches also include H2, electricity, or heat load following; in contrast to no load following
Load following the electrical demand results in byproduct heat, and vice versa. No load following is output independent of demand, generally constant. Load following is physically constrained by the system’s energy output range and ramp rate.
Hydrogen * Hydrogen * Hydrogen(C1) *
Fuel Cell
Electricity*
Heat *
Hydrogen
H2 Following (P)
0510152025303540
9 99 189
279
369
459
550
640
730
Freq
uency
Hydrogen Demand (kg H2/hr)
Hydrogen Load Following
Hydrogen Demand
Hydrogen SupplyHistogram of H2 demand and supply under load following conditions
Approach; Objectives 1.3 & 2.1
Note: * distinguishes byproducts

Strategies i to xiii are all electrically and thermally networked (N), with a variable heat-to-H2 ratio. A number of novel operating strategies are investigated with primary, secondary and tertiary controls for H2, electricity, and heat load following. Most FCS are now installed as [SFEXHN].
Model investigates 13 novel operating strategies.Approach; Objectives 1.3 & 2.1
Primary Control Secondary Control Tertiary Control
Strategy
Electrically and
Thermally Networked
(N) or Stand Alone (S)?
Variable Heat-to-Power Ratio (V),
Fixed Heat-to-Power Ratio
(F)?
Variable Heat-to-Hydrogen
Ratio (Y)
Electricity Power Load Following (E), Heat Load Following (H), Hydrogen Load Following (P), or No
Electricity Load Following (EX)?
Electricity Power Load Following (E), Heat Load Following (H), Hydrogen Load Following (P), No
Heat Load Following (HN, HX), or No Electricity Load
Following (EN, EX)?
Electricity Power Load Following (E), Heat Load Following (H), Hydrogen Load Following (P), No
Heat Load Following (HN, HX), or No Electricity Load
Following (EN, EX)?i N F Y E HN Pii N V Y E P HXiii N F Y EX HN Piv N V Y EX P HXv N V Y H P ENvi N V Y H P Evii N V Y E H Pviii N V Y H P EXix N V Y EX H Px N V Y EX P Hxi N V Y P H ENxii N V Y P H EXxiii N V Y P H E

• The model optimizes for the minimum total electricity, heating, and H2 yearly costs by altering the installed fuel cell system capacity.
• The total yearly costs include, but are not limited to, the fuel cell system capital, maintenance, and fueling costs and the competing generators’ electricity, heating, and H2 costs.
• All demand not supplied by fuel cells is purchased from the competing generators.• A fuel cell system load following controls will match the hourly demand if it is
within the physical constraints of the system.• Results are compared to a base case of no fuel cells installed. In the base case,
all energy demands are supplied by competing electricity, heat, and H2generators.
• H2 production is included in the fuel cell system operation in a manner similar to steam methane reforming (SMR). Waste heat from the high temperature fuel cell system supplies the energy needed for the endothermic steam reforming process for converting natural gas fuel to H2.
Model tests FCS against competing H2 generators.FCS waste heat is reused for steam reforming to H2.
Approach; Objectives 1.3 & 2.1

Case study: We show example results based on realistic input assumptions.• The competing H2 generator is assumed to be a stand-alone steam methane
reformer (SMR) with a fixed CO2 to H2 production ratio of 7.49 kg CO2/kg H2. • The fuel cell systems can sell back electricity to the grid at the same price as the
competing electricity generator charges (similar to net-metering but without a constraint on the total quantity of electricity sold back to the grid in one year).
• Each 1 kWt of fuel cell system waste heat can produce 1 kW of H2 energy, up to a maximum. Heat is transferred with 100% efficiency between the fuel cell waste heat and endothermic steam reforming to produce additional H2.
• The H2 production rate is limited to 5% of the total fuel energy entering the system resulting in maximum H2 production of about 17% of total recoverable heat produced.
• The total increase in fixed costs for the H2 production, compression, and dispensing equipment and installation is estimated at 25% of the total capital and installation cost of the standard fuel cell system (not including warranty or shipping costs).
• H2 is produced on demand just-in-time, with no H2 storage.• No tax on carbon dioxide (CO2) emissions exists, but all California state and U.S.
federal incentives are available.• Case study results are shown for optimizing for both cost & CO2 emission reductions.
Sensitivity study results are shown for three different commercial H2 prices.
Approach; Objectives 1.3 & 2.1

Case study: We realistically describe the engineering performance characteristics of novel H2-FCS.
1 MWe MCFC system performance is based on system currently in production at Fuel Cell Energy, Inc. Baseline heat recovery efficiency is 30% up to 35%. Baseline H2recovery efficiency is 5% down to 0%.
Fuel Cell System Operating Data Quantity UnitsMaximum Electrical Output 1000 kilowatts (kw)Minimum Electrical Output 880 kilowatts (kw)Maximum Heat-to-Electric Power Ratio 1.35Minimum Heat-to-Electric Power Ratio 0.7Baseline Heat-to-Electric Power Ratio for Fixed Heat-to-Power Ratio Operation 0.7
Natural Gas Fuel Consumption (in Units of Energy) Per Unit of Electric Power Output 6,824British Thermal Units (BTU) of natural gas /kwh of recovered heat
Marginal Increase in Natural Gas Fuel Consumption (in Units of Energy) Per Unit of Additional Heat Demanded (Variable Heat to Power Ratio Scenarios Only) 3,791
British Thermal Units (BTU) of natural gas /kwh of recovered heat
Baseline System Electrical Efficiency 50%Baseline System Heat Recovery Efficiency 30 to 35%Baseline Hydrogen Recovery Efficiency 5% to 0%Baseline System Heat Losses (Percent) 15%Baseline System Combined Electrical, Heat and Hydrogen Recovery Efficiency 85%Heat Recovery Efficiency of Burner-Heater for Marginal Heating (Variable Heat to Power Ratio Scenarios Only) 90%Fuel Cell System Lifetime 5 years
Approach; Objectives 1.3 & 2.1

Case study: We realistically describe financial operating data for H2-FCS and competing generators.
1 MWe MCFC system costs are based on Fuel Cell Energy‘s system. The MCFC is tested against a CHP combined cycle gas turbine (CCGT) and a SMR H2 generator.
Fuel Cell System and H2 Co-Production Cost -- Fixed Cost per yearAmount Borrowed (or Credited) at
Time t = zero [P] ($) Annuity [A] ($)Capital Costs of 1000 kW Fuel Cell System and H2 Generator 4,000,000$ 986,446$ Installation Costs Including H2 Generator 1,250,000$ 308,264$ Commissioning Costs (Start-up, Testing, Tutorials for Operators) -$ Shipping 100,000$ 24,661$ Premium Service Contract (Maintenance and Replacement) -- Annuity Payments 400,000$ Fuel Cell System Incentives -- Federal and StateCalifornia Self-Generation Incentive Program (CA SGIP) at $2500/kWe 2,500,000$ 616,529$ Federal Investment Tax Credit (FITC) at $3,000/kWe or 30% of Capitol Costs 1,605,000$ 395,811$
Fuel Cell System Fixed Costs -- Total Yearly Fixed Costs 707,031
Competing Generator: Natural Gas Combined Cycle Gas Turbine Plant Quantity UnitsPrice of steam for heating including carbon tax impact 0.056 $/kWh steamPrice of electricity including carbon tax impact 0.085 $/kWh electricityBaseline System Heat Recovery Efficiency 0.22Baseline System Electrical Efficiency 0.40Baseline System Heat Losses 0.38Competing Generator: Distributed Steam Methane Reforming Hydrogen Generator Quantity UnitsH2 Price 2.00 or 4.00 or 23.64 $/kg H2
CO2 Emission 7.49 kg CO2/kg H2 produced
Approach; Objectives 1.3 & 2.1
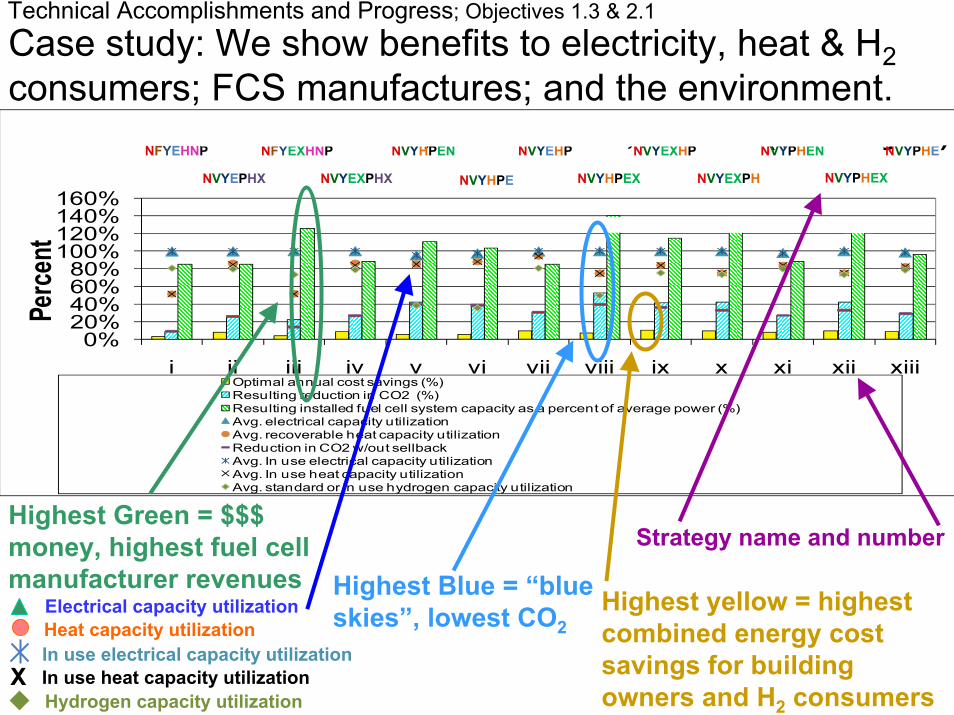
Technical Accomplishments and Progress; Objectives 1.3 & 2.1
Case study: We show benefits to electricity, heat & H2consumers; FCS manufactures; and the environment.
Highest yellow = highest combined energy cost savings for building owners and H2 consumers
In use heat capacity utilizationHydrogen capacity utilization
In use electrical capacity utilizationX
0%20%40%60%80%
100%120%140%160%
i ii iii iv v vi vii viii ix x xi xii xiii
Perc
ent
Strategy
Full incentives,no carbon tax,$.12/kwh ($4.00/kg H2)
Optimal annual cost savings (%)Resulting reduction in CO2 (%)Resulting installed fuel cell system capacity as a percent of average power (%)Avg. electrical capacity utilizationAvg. recoverable heat capacity utilizationReduction in CO2 w/out sellbackAvg. In use electrical capacity utilizationAvg. In use heat capacity utilizationAvg. standard or in use hydrogen capacity utilization
Highest Blue = “blue skies”, lowest CO2
Highest Green = $$$ money, highest fuel cell manufacturer revenues
Heat capacity utilizationElectrical capacity utilization
Strategy name and number
NFYEHNP
NVYEPHX NVYEXPHX NVYHPE NVYHPEX NVYEXPH NVYPHEX
NVYEXHP NVYPHEN NFYEXHNP NVYHPEN NVYEHP NVYPHE

Strategies with the lowest CO2 emissions are v [NVYHPEN], vi [NVYHPE], and viii [NVYHPEX]. These strategies first follow heat demand [H] as the primary control, and then load follow H2 demand [P] as the secondary control. Less fuel is wasted.
Technical Accomplishments and Progress; Objective 1.3CO2 emissions are lowest with our approach of networking, variable heat-to-power & H2-to-heat ratios, first load following heat & then load following H2.
0%40%80%
120%160%200%
i ii iii iv v vi vii viii ix x xi xii xiii
Perc
ent
Strategy
Full incentive,no carbon tax,$.12/kwh ($4.00/kg H2)
Optimal annual cost savings (%)Resulting reduction in CO2 (%)Resulting installed fuel cell system capacity as a percent of average power (%)Avg. electrical capacity utilizationAvg. recoverable heat capacity utilizationReduction in CO2 w/out sellbackAvg. In use electrical capacity utilizationAvg. In use heat capacity utilizationAvg. standard or in use hydrogen capacity utilization
NFYEHNP
NVYEPHX NVYEXPHX NVYHPE NVYHPEX NVYEXPH NVYPHEX
NVYEXHP NVYPHEN NFYEXHNP NVYHPEN NVYEHP NVYPHE

Energy costs are lowest with our approach of maximum FCS electrical output, with heat & then H2 load following.
Technical Accomplishments and Progress; Objective 2.1
0%20%40%60%80%
100%120%
i ii iii iv v vi vii viii ix x xi xii xiii
Perc
ent
Strategy
Full incentives,no carbon tax,$.06/kwh ($2.00/kg H2)
Optimal annual cost savings (%)Resulting reduction in CO2 (%)Resulting installed fuel cell system capacity as a percent of average power (%)Avg. electrical capacity utilizationAvg. recoverable heat capacity utilizationReduction in CO2 w/out sellbackAvg. In use electrical capacity utilizationAvg. In use heat capacity utilizationAvg. standard or in use hydrogen capacity utilization
NFYEHNP
NVYEPHX NVYEXPHX NVYHPE NVYHPEX NVYEXPH NVYPHEX
NVYEXHP NVYPHEN NFYEXHNP NVYHPEN NVYEHP NVYPHE
When the competing H2 generator’s price is $2/kg H2, the most economical strategy is ix [NVYEXHP]. The second best strategy is vii [NVYEHP]. In this scenario, the electrical load following (E) is close to the maximum and therefore mimics EX.

Technical Accomplishments and Progress; Objective 2.1Energy costs are lowest with our approach: H2-FCS make the most electricity, sell any excess back to the grid, and locally make heat and H2 with load following.
When the competing H2 generator’s price is $2 or $4/kg H2, the most economical strategies are ix [NVYEXHP] (1st) & vii [NVYEHP] (2nd). Grid-connected systems can sell excess electricity to the grid. By contrast, heat and H2 demand are locally constrained; less fuel is wasted when they are made via load following, yielding higher cost savings.
0%20%40%60%80%
100%120%140%160%
i ii iii iv v vi vii viii ix x xi xii xiii
Perc
ent
Strategy
Full incentives,no carbon tax,$.12/kwh ($4.00/kg H2)
Optimal annual cost savings (%)Resulting reduction in CO2 (%)Resulting installed fuel cell system capacity as a percent of average power (%)Avg. electrical capacity utilizationAvg. recoverable heat capacity utilizationReduction in CO2 w/out sellbackAvg. In use electrical capacity utilizationAvg. In use heat capacity utilizationAvg. standard or in use hydrogen capacity utilization
NFYEHNP
NVYEPHX NVYEXPHX NVYHPE NVYHPEX NVYEXPH NVYPHEX
NVYEXHP NVYPHEN NFYEXHNP NVYHPEN NVYEHP NVYPHE

Technical Accomplishments and Progress; Objective 2.1
For a competing generator H2 price of $23.64/kg H2, the most economical strategy changes to x [NVYEXPH]. The second best strategy is again xii [NVYPHEX].
0%50%
100%150%200%250%300%
i ii iii iv v vi vii viii ix x xi xii xiii
Perc
ent
Strategy
Full incentives,no carbon tax,$.71/kwh ($23.64/kg H2)
Optimal annual cost savings (%)Resulting reduction in CO2 (%)Resulting installed fuel cell system capacity as a percent of average power (%)Avg. electrical capacity utilizationAvg. recoverable heat capacity utilizationReduction in CO2 w/out sellbackAvg. In use electrical capacity utilizationAvg. In use heat capacity utilizationAvg. standard or in use hydrogen capacity utilization
NFYEHNP
NVYEPHX NVYEXPHX NVYHPE NVYHPEX NVYEXPH NVYPHEX
NVYEXHP NVYPHEN NFYEXHNP NVYHPEN NVYEHP NVYPHE
Energy costs are lowest with our approach of maximum electricity, heat & H2 load following, but in a different control order depending on the competitive H2 price.

The most economical strategies investigated tended to combine a) electrical andthermal networking (N), b) a variable heat-to-electric power ratio (V), and c) a variableheat-to-H2 ratio (Y) with these three characteristics 1) maximum electrical output (EX),2) heat load following (H), and 3) H2 load following (P).
• As long as systems are grid-connected with a competitive electricity sell-back price, they can sell excess electricity not used in the local area for revenue.
• By contrast, both heat and H2 demand are locally constrained, without storage in these models. Less fuel is wasted when they are produced in load following mode, yielding higher energy cost savings.
As the competing generator H2 price changes, the strategies with the highest costsavings change.
• As the competing generator H2 price changes, the optimal order changes forprimary, secondary, and tertiary control of 1) maximum electrical output, 2)heat load following, and 3) H2 load following.
• For example, as the H2 price increases from $4/kg to $23.64/kg, the mosteconomical strategy changes from [NVYEXHP] with H2 load following as thetertiary control to [NVYEXPH] with H2 load following as the secondary control.
• In other words, as the competing generator H2 price increases, it becomesmore important to operate fuel cells with H2 load following.
Cost optimization favors maximum electrical output, andheat & H2 load following.
Technical Accomplishments and Progress; Objective 2.1

• Develop more intricate AspenPlusTM models to analyze co-produced H2 available under different operating conditions with no added fuel use or CO2 emissions.
• Enhance AspenPlusTM model fidelity to better analyze available H2 in the context of • higher heat exchanger efficiency for preheating anode and cathode inlet gases,• different anodic fuel and cathode oxidant utilization rates, • the synergistic benefits of a lower fuel utilization increasing overall efficiency
(i.e., via a higher Nernst Voltage, lower mass transport losses, lower cooling needs for the fuel cell stack & lower associated air compressor parasitic load.)
• Both theoretical and practical ancillary loads (pumps, compressors, etc.), • more optimal heat exchanger loop designs through Pinch Point Analysis,• recycling more streams (such as steam) to lower reactant demand & heat loss, • trade-offs between external and internal reforming, • more complex thermodynamic cycle designs,• more cycle design configurations for thermally integrating the hydrogen
separation unit (HSU) and fuel cell system, • additional hydrogen separation technologies, including not only PSA, but also
electrochemical hydrogen separation pumps, • a greater variety of operating conditions (steam-to-carbon ratio, operating
pressure, H2 recovery methods, etc.), and• a greater variety of low or zero carbon, and renewable fuels (biofuels, etc.).
• Publish analytical models and equations describing the quantities of co-produced H2 available under different conditions.
Future Work; Objective 1We intensify thermodynamic models to analyze themaximum H2 available with no added CO2 emissions.

• Evaluate the “low hanging fruit” markets, such as the current industrial market for H2 demand in petroleum and chemical processing plants, and test H2-FCS against these plants’ time-dependent H2 demand curves.
• Study the transition from low H2 vehicle fleet penetration levels to high.• Investigate more innovative H2-FCS design, operating, and control strategies.• Re-work the model to determine optimal operating strategies at each time-step.• Analyze a larger range of viable efficiencies for H2-FCS electricity, heat, and H2.• Model advanced H2 & energy storage, compression, and dispensing concepts. • Delineate the engineering, economic, and environmental benefits of
• avoided long-distance H2 transport associated with centralized H2 production,• avoided transmission losses association with centralized electricity productionincluding reduced capital costs for infrastructure.
• Quantify the benefits of relying on a secure fuel supply by using local feedstock.• Examine a greater variety of low carbon, renewable fuels (biofuels, etc.).• Standardize key model input parameters across DOE H2 program models (in
collaboration with fellow DOE Lab researchers and industry experts)
Future Work; Objectives 1 & 2We strengthen techno-economic-environmental modelsto optimize more H2 co-production cases.

CollaborationsWe collaborate with academia, industry, & federalentities to greatly advance R&D and technology transfer.

CollaborationsWe actively collaborate with many entities to speed theevaluation and development of H2-FCS.
Leading international research organizations also advise us on our model development:École Polytechnique Fédérale de Lausanne (EPFL), Laboratoire d’énergétiqueindustrielle (Swiss academia); E4Tech (European industry); and the Fraunhofer Institutefor Solar Energy (ISE) Systems (German federal & industry).

A 1 MWe fuel cell can make enough H2 to fuel ~220 to 660 H2 fuel cell cars/day, with no added CO2 emissions. (Objective 1.1)
Daily H2 output can increase by > 132% with no added CO2emissions, if the fuel cell reuses waste heat internally. (Objective 1.2)
Global CO2 emissions from H2, electricity, and heat are lowest when H2-FCS are electrically and thermally networked, use variable heat-to-power & H2-to-heat ratios, and load follow heat and H2 demands.(Objective 1.3)
Global energy costs from H2, electricity, and heat are lowest when H2-FCS are networked, use variable heat-to-power & H2-to-heat ratios, produce at their maximum electrical output continuously, and load follow heat and H2 demands. (Objective 2.1)
Summary – Key take-away points
Our novel H2-FCS designs have the lowest CO2emissions & costs of any H2 production method to-date.