Embed Size (px)
Citation preview

face Science 122 (2006) 3–33www.elsevier.com/locate/cis
Advances in Colloid and Inter
Thermodynamic and kinetic aspects of fat crystallization
C. Himawan, V.M. Starov, A.G.F. Stapley ⁎
Department of Chemical Engineering, Loughborough University, Ashby Road, Loughborough, Leicestershire, LE11 3TU, United Kingdom
Available online 14 August 2006
Abstract
Naturally occurring fats are multi-component mixtures of triacylglycerols (TAGs), which are triesters of fatty acids with glycerol, and of whichthere are many chemically distinct compounds. Due to the importance of fats to the food and consumer products industries, fat crystallization hasbeen studied for many years and many intricate features of TAG interactions, complicated by polymorphism, have been identified. The meltingand crystallization properties of triacylglycerols are very sensitive to even small differences in fatty acid composition and position within the TAGmolecule which cause steric hindrance. Differences of fatty acid chain length within a TAG lead to packing imperfections, and differences in chainlengths between different TAG molecules lead to a loss of intersolubility in the solid phase. The degree of saturation is hugely important as thepresence of a double bond in a fatty acid chain causes rigid kinks in the fatty acid chains that produce huge disruption to packing structures withthe result that TAGs containing double bonds have much lower melting points than completely saturated TAGs. All of these effects are morepronounced in the most stable polymorphic forms, which require the most efficient molecular packing. The crystallization of fats is complicatednot just by polymorphism, but also because it usually occurs from a multi-component melt rather than from a solvent which is more common inother industrial crystallizations. This renders the conventional treatment of crystallization as a result of supersaturation somewhat meaningless.Most studies in the literature consequently quantify crystallization driving forces using the concept of supercooling below a distinct melting point.However whilst this is theoretically valid for a single component system, it can only at best represent a rough approximation for natural fatsystems, which display a range of melting points. This paper reviews the latest attempts to describe the sometimes complex phase equilibria of fatsusing fundamental relationships for chemical potential that have so far been applied to individual species in melts of unary, binary and ternarysystems. These can then be used to provide a framework for quantifying the true crystallization driving forces of individual components within amulti-component melt. These are directly related to nucleation and growth rates, and are also important in the prediction of polymorphicoccurrence, crystal morphology and surface roughness. The methods currently used to evaluate induction time, nucleation rate and overallcrystallization rate data are also briefly described. However, mechanistic explanations for much of the observed crystallization behaviour of TAGmixtures remain unresolved.© 2006 Elsevier B.V. All rights reserved.
Keywords: Nucleation; Crystal growth; Triacylglycerol; Melts; Polymorphism; Crystal morphology
Contents
1. Introduction. . . . . . . . . . . . . . . . . . . . . . . . . . . . . . . . . . . . . . . . . . . . . . . . . . . . . . . . . . . . . . . . 41.1. Molecular structure and composition of fats. . . . . . . . . . . . . . . . . . . . . . . . . . . . . . . . . . . . . . . . . . . . 51.2. Basic polymorphism of TAGs . . . . . . . . . . . . . . . . . . . . . . . . . . . . . . . . . . . . . . . . . . . . . . . . . . . 61.3. Scope of this review. . . . . . . . . . . . . . . . . . . . . . . . . . . . . . . . . . . . . . . . . . . . . . . . . . . . . . . . 7
2. Thermodynamic aspects of the melt crystallization of fats . . . . . . . . . . . . . . . . . . . . . . . . . . . . . . . . . . . . . . . . 82.1. Free energy diagrams and polymorph stability . . . . . . . . . . . . . . . . . . . . . . . . . . . . . . . . . . . . . . . . . . 82.2. Correlating and predicting the melting temperature and enthalpy of pure TAGs . . . . . . . . . . . . . . . . . . . . . . . . . 92.3. The polymorphic behaviour of pure TAGs . . . . . . . . . . . . . . . . . . . . . . . . . . . . . . . . . . . . . . . . . . . 11
2.3.1. Monoacid saturated TAGs . . . . . . . . . . . . . . . . . . . . . . . . . . . . . . . . . . . . . . . . . . . . . . . 11
⁎ Corresponding author. Tel.: +44 1509 222525; fax: +44 1509 223923.E-mail address: [email protected] (A.G.F. Stapley).
0001-8686/$ - see front matter © 2006 Elsevier B.V. All rights reserved.doi:10.1016/j.cis.2006.06.016

4 C. Himawan et al. / Advances in Colloid and Interface Science 122 (2006) 3–33
2.3.2. Mixed-acid saturated TAGs . . . . . . . . . . . . . . . . . . . . . . . . . . . . . . . . . . . . . . . . . . . . . . 122.3.3. Mixed-acid saturated/unsaturated TAGs. . . . . . . . . . . . . . . . . . . . . . . . . . . . . . . . . . . . . . . . 13
2.4. Phase behaviour of binary mixtures of TAGs . . . . . . . . . . . . . . . . . . . . . . . . . . . . . . . . . . . . . . . . . 142.4.1. Phase diagrams . . . . . . . . . . . . . . . . . . . . . . . . . . . . . . . . . . . . . . . . . . . . . . . . . . . . 142.4.2. Modelling the solid–liquid equilibria of TAGs . . . . . . . . . . . . . . . . . . . . . . . . . . . . . . . . . . . . 16
3. Kinetic aspects of the melt crystallization of fats . . . . . . . . . . . . . . . . . . . . . . . . . . . . . . . . . . . . . . . . . . . 183.1. Nucleation and crystal growth rates — theoretical aspects. . . . . . . . . . . . . . . . . . . . . . . . . . . . . . . . . . . 20
3.1.1. Thermodynamic driving force. . . . . . . . . . . . . . . . . . . . . . . . . . . . . . . . . . . . . . . . . . . . . 203.1.2. Nucleation thermodynamics, kinetics and mechanisms . . . . . . . . . . . . . . . . . . . . . . . . . . . . . . . . 213.1.3. Polymorphic-dependent nucleation . . . . . . . . . . . . . . . . . . . . . . . . . . . . . . . . . . . . . . . . . . 223.1.4. Induction time. . . . . . . . . . . . . . . . . . . . . . . . . . . . . . . . . . . . . . . . . . . . . . . . . . . . . 223.1.5. Growth rate and mechanisms . . . . . . . . . . . . . . . . . . . . . . . . . . . . . . . . . . . . . . . . . . . . . 223.1.6. Morphology of TAG crystals . . . . . . . . . . . . . . . . . . . . . . . . . . . . . . . . . . . . . . . . . . . . . 253.1.7. Spherulitic growth. . . . . . . . . . . . . . . . . . . . . . . . . . . . . . . . . . . . . . . . . . . . . . . . . . . 253.1.8. Polymorphic transformation . . . . . . . . . . . . . . . . . . . . . . . . . . . . . . . . . . . . . . . . . . . . . . 26
3.2. Measurement of fat crystallization kinetics. . . . . . . . . . . . . . . . . . . . . . . . . . . . . . . . . . . . . . . . . . . 273.2.1. Induction time and nucleation rate . . . . . . . . . . . . . . . . . . . . . . . . . . . . . . . . . . . . . . . . . . 273.2.2. Overall crystallization rates . . . . . . . . . . . . . . . . . . . . . . . . . . . . . . . . . . . . . . . . . . . . . . 28
4. Concluding remarks . . . . . . . . . . . . . . . . . . . . . . . . . . . . . . . . . . . . . . . . . . . . . . . . . . . . . . . . . . 29Nomenclature . . . . . . . . . . . . . . . . . . . . . . . . . . . . . . . . . . . . . . . . . . . . . . . . . . . . . . . . . . . . . . . . 30Acknowledgements . . . . . . . . . . . . . . . . . . . . . . . . . . . . . . . . . . . . . . . . . . . . . . . . . . . . . . . . . . . . . 31References . . . . . . . . . . . . . . . . . . . . . . . . . . . . . . . . . . . . . . . . . . . . . . . . . . . . . . . . . . . . . . . . . 31
1. Introduction
Fats are highly abundant compounds in nature and arewidely used in food and other consumer products [1]. Theirbehaviour heavily influences the microstructure and physicalproperties of these products. The development of solid fat
Fig. 1. Schematic presentation of processes involved in c
microstructure from a liquid melt to create commercial fatproducts such as margarine or chocolate is schematicallypresented in Fig. 1 [2], which illustrates how both theinitial processing (within the factory) and subsequentstorage conditions (in the warehouse, shop or home)ultimately affect final product structure, texture and quality.
rystallization and storage of fats (adapted from [2]).
5C. Himawan et al. / Advances in Colloid and Interface Science 122 (2006) 3–33
A number of factors, including crystallization conditions,are important.
Crystallization occurs in the initial processing stage, andthe relative rates of nucleation and growth determine the initialcrystal size distribution. This is a key parameter for texture ascrystals greater than a few tens of microns in size aredetectable on the tongue, and are thus undesirable in productswhich require a smooth texture. As the solid fractionincreases, individual crystals begin to touch each otherwhich slows crystal growth (growth impingement). Interac-tions between crystals then start to dominate the process.Depending on the nature of the fat substances, gel formationmay also occur [3].
During storage, a number of post crystallization processesoccur, which can affect properties such as hardness, which oftennoticeably increases [4]. This is due to sintering, i.e. theformation of solid bridges between crystals to form a network[2,4,5]. Polymorphic transformation (see Section 1.2) towardsmore stable phases and changes in size distribution via Ostwaldripening may occur [6].
The above events are not necessarily chronological oncenucleation occurs. It is possible, even usual, in processing fats,that after primary nucleation and subsequent growth thatsecondary nucleation, defined as nucleation occurring due tothe presence of the growing crystals [7], can take placesimultaneously along with crystal growth and ripening.Furthermore, polymorphic transformations may occur in theprocessing stage. Transformation into the desirable poly-morphic forms that deliver favourable properties is often forcedvia manipulating conditions. For example, shearing andtempering have been applied in cocoa butter crystallizationfor controlling its polymorphism [8–12].
The characterization of microstructure and the relation to themechanical properties of the final product is a difficult (and stilllargely unresolved) field of study in its own right, and readersare suggested to consult the reviews by Walstra et al. [2],
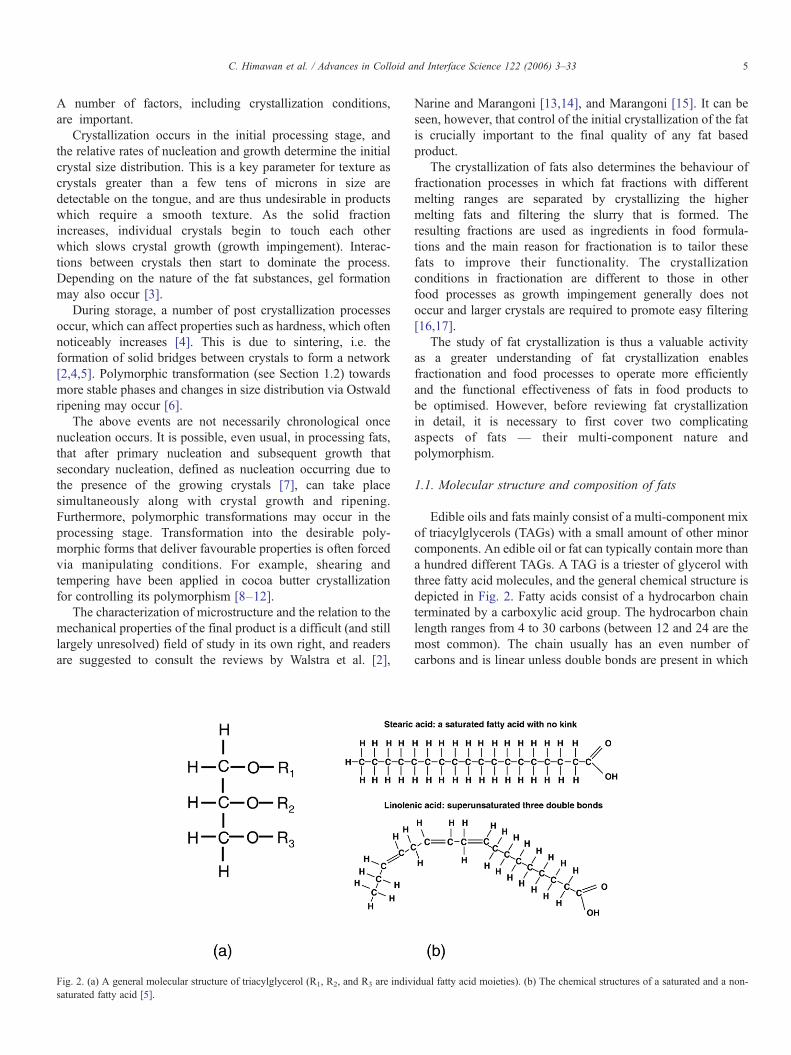
Fig. 2. (a) A general molecular structure of triacylglycerol (R1, R2, and R3 are indivsaturated fatty acid [5].
Narine and Marangoni [13,14], and Marangoni [15]. It can beseen, however, that control of the initial crystallization of the fatis crucially important to the final quality of any fat basedproduct.
The crystallization of fats also determines the behaviour offractionation processes in which fat fractions with differentmelting ranges are separated by crystallizing the highermelting fats and filtering the slurry that is formed. Theresulting fractions are used as ingredients in food formula-tions and the main reason for fractionation is to tailor thesefats to improve their functionality. The crystallizationconditions in fractionation are different to those in otherfood processes as growth impingement generally does notoccur and larger crystals are required to promote easy filtering[16,17].
The study of fat crystallization is thus a valuable activityas a greater understanding of fat crystallization enablesfractionation and food processes to operate more efficientlyand the functional effectiveness of fats in food products tobe optimised. However, before reviewing fat crystallizationin detail, it is necessary to first cover two complicatingaspects of fats — their multi-component nature andpolymorphism.
1.1. Molecular structure and composition of fats
Edible oils and fats mainly consist of a multi-component mixof triacylglycerols (TAGs) with a small amount of other minorcomponents. An edible oil or fat can typically contain more thana hundred different TAGs. A TAG is a triester of glycerol withthree fatty acid molecules, and the general chemical structure isdepicted in Fig. 2. Fatty acids consist of a hydrocarbon chainterminated by a carboxylic acid group. The hydrocarbon chainlength ranges from 4 to 30 carbons (between 12 and 24 are themost common). The chain usually has an even number ofcarbons and is linear unless double bonds are present in which
idual fatty acid moieties). (b) The chemical structures of a saturated and a non-

Table 1Nomenclature of commonly occurring fatty acids
Code Fatty acid Chain length Double bonds Code Fatty acid Chain length Double bonds
2 acetic acid (ethanoic acid) 2 none P palmitic acid (hexadecanoic acid) 16 none4 butyric acid (butanoic acid) 4 none S stearic acid (octadecanoic acid) 18 none6 caproic acid (hexanoic acid) 6 none O oleic acid (cis-9-octadecanoic acid) 18 18 caprilic acid (octanoic acid) 8 none E elaidic acid (trans-9-octadecanoic acid) 18 1C capric acid (decanoic acid) 10 none l linoleic acid (cis-cis-9,12-octadecadienoic acid) 18 2L lauric acid (dodecanoic acid) 12 none R ricinoleic acid (12-hydroxy-9-octadecenoic acid) 18 1M myristic acid (tetradecanoic acid) 14 none A arachidic acid (eicosanoic acid) 20 none
B behenic acid (docosanoic acid) 22 none
6 C. Himawan et al. / Advances in Colloid and Interface Science 122 (2006) 3–33
case the chain becomes kinked. The carbon atoms of these“linear” chains are arranged in a zigzag fashion, which hasimplications for crystal packing (see next section). The physicalproperties of TAGs heavily depend upon the fatty acidcomposition [18].
For convenience, TAGs are usually identified by a 3-lettercode. Each of the characters in the code represents a fatty acidwith the middle character always indicating the fatty acid that ison the 2-position of the glycerol. For example, PSP representsglycerol-1,3-dipalmitate-2-stearate. If the three fatty acids arethe same, the TAG is monoacid; otherwise it is called mixed-acid. ATAG is unsaturated if a CfC double bond is present in atleast one of the fatty acid moieties, otherwise it is referred to assaturated. The characters used to represent fatty acids are givenin Table 1 and will be used throughout this paper.
1.2. Basic polymorphism of TAGs
TAG molecules are inherently able to pack in differentcrystalline arrangements or polymorphs, which exhibit sig-nificantly different melting temperatures [19,20]. The poly-morphism of most fats is based around three main forms: α, β′,and β; the nomenclature scheme following Larsson [21] asreviewed in Hagemann [20], Hernqvist [22], Wesdorp [23],Sato [24], and Gothra [5]. However, some fats display morepolymorphs than this.
TAG molecules are “three legged” molecules that can packwith the acyl chains (“legs”) in one of two configurations,neither of which involves all three chains packing alongsideeach other. They can pack in a “chair” configuration where theacyl chain in the 2 position is alongside the chain on either the 1or 3 positions. Alternatively, a “tuning fork” configuration can
Fig. 3. (a) Chain-length packing structures in TAGs, and (b) the subcell structures oplanes) [24]. Reprinted with permission.
be adopted where the acyl chain in the 2 position is alone andthe chains in the 1 and 3 positions pack alongside each other.Either configuration naturally packs in a chair-like manner. Thestacking of these chairs can be in either a double of triple chainlength structure (see Fig. 3a), and these stack side by side incrystal planes, sometimes at an angle. The differences betweenpolymorphs are most apparent from a top view of these planeswhich shows the subcell structure (Fig. 3b). These structurescan be identified by powder X-ray diffraction patterns [22,24],where long spacings give information on the repeat distancebetween crystal planes (chain length packing) and shortspacings give information on subcell structure (interchaindistances). These interchain distances depend on how thechains pack together and this is complicated by the “zigzag”arrangement of successive carbon atoms in aliphatic chains.Closer packing is achieved when the zigzags of adjacent chainsare in step with each other (“parallel”) as opposed to out of step(“perpendicular”).
• The α-form is characterized by one strong short spacing linein the XRD pattern near 0.42 nm. The chains are arranged ina hexagonal structure (H), with no angle of tilt and are farenough apart for the zigzag nature of the chains to notinfluence packing.
• The β′-form is characterized by two strong short spacinglines at 0.37–0.40 nm and at 0.42–0.43 nm. The chainpacking is orthorhombic and perpendicular (O⊥), that isadjacent chains are out of step with each other so they cannotpack closely. The chains have an angle of tilt between 50°and 70°.
• The β-form is characterized by a strong lattice spacing line atnear 0.46 nm and a number of other strong lines around
f the three most common polymorphs in TAGs (viewed from above the crystal

7C. Himawan et al. / Advances in Colloid and Interface Science 122 (2006) 3–33
0.36–0.39 nm. This is the densest polymorphic form havinga triclinic chain packing, in which adjacent chains are in step(“parallel”), and thus pack snugly together. The chains alsohave an angle of tilt between 50° and 70°.
The β and β′ polymorphs can exist as either double chain-length or triple chain length structures. A double chain lengthstructure normally occurs when the chemical nature of the threefatty acid moieties are the same or very similar. Conversely, ifthe moieties are quite different to each other (for instance in amixed saturated-unsaturated TAG), a triple chain-lengthstructure is formed. The α form is normally only found toexist in a double chain length structure.
1.3. Scope of this review
Many efforts have been performed to unravel the complexbehaviour of fat systems. Crystallization studies are regularlycarried out for natural fats and these are classified by theirorigins, e.g. palm oil and related oils [11,12,25–33], milk fats[11,34–43] and cocoa butter [11,12,44–49]; just to mention afew of the most recent contributions. Further reviews can be
Table 2Literature on polymorphic and phase behaviour of pure and binary mixtures of TAG
Author Systems
(A) Polymorphic occurrence and transformation of pure TAGsMiura et al. [168] PPP, SSS, POP, SOS, POS, POS/SOS mixturesUeno et al. [167] PPP, LLLHigaki et al. [48] Pure and impure PPPSmith et al. [213] Different TAGsSprunt et al. [214] SOSBoubekri et al. [111] SRSUeno et al. [110] SOSDibildox-Alvarado et al. [215] PPP in sesame oilToro-Vazquez et al. [216] PPP in sesame oilUeno et al. [66] SOSRousset et al. [197] POP, POS, SOSYano et al. [109] SOS, POP, POSKellens et al. [95] PPPArishima et al. [107] POSKellens et al. [94] PPP, SSSKellens et al. [93] PPPArishima et al. [97] POP, SOSKoyano et al. [105] POP, SOS
(B) Phase behaviour and polymorphic transformation of binary TAG mixturesMiura et al. [168] POS/SOSTakeuchi et al. [125] LLL/MMM, LLL/PPP, LLL/SSSTakeuchi et al. [124] SOS/SLSTakeuchi et al. [123] SOS/SSORousset et al. [146] SOS/POSMinato et al. [121] POP/PPOMinato et al. [122] POP/OPOMinato et al. [120] PPP/POPEngstrom et al. [128] SOS/SSOKellens et al. [181] PPP/SSSKoyano et al. [119] SOS/OSOKellens et al. [192] PPP/SSSWesdorp [23] Binary TAGsCebula and Smith [194] PPP/SSS
DSC=Differential scanning calorimetry. SR XRD=synchrotron radiation X-ray diff
found in Smith [50] for palm oil, in Hartel and Kaylegian [51]for milk fat, and in Sato and Koyano [52] for cocoa butter. Manyother studies have investigated the blending of natural fats asmeans of tailoring the physical and thermal properties of fats[53–58].
The disadvantage of the above approach is the empirical andcase by case nature of the information obtained. This can causedifficulties when coping with the compositional variations innatural fats that originate from geographical, climatic, orseasonal factors. A more fundamental approach is to study thecrystallization of fats by considering them as multi-componentsystems. This is a huge challenge but has already givenextended insights on the behaviour observed in natural fats asexcellently reviewed by Sato [24,59]. This is necessarily abottom-up exercise, whereby an understanding of pure TAGand binary systems must first be obtained.
This review seeks to provide an overview of the currentfundamental understanding of fat crystallization approachedfrom the thermodynamic and kinetic behaviour of pure TAGsand binary mixtures of pure TAGs. Fat crystallization differsfrom most industrial crystallization processes in that crystal-lization is seldom from a “solvent”, and thus traditional
s
Measurement techniques Remarks
DSC, XRD Effect of ultrasoundDSC, SR XRD Effect of ultrasoundDSC, XRD Effect of magnetic fieldsLight microscopy, DSC, XRD Effect of phospholipids additivesFT Raman spectroscopy, DSCFTIR, SR XRDSR XRDDSC, light microscopy, XRDDSC, light microscopy, XRDDSC, SR XRD Intermediate structured liquidsLight microscopy, DSCFTIR Molecular structure and interactionsLight microscopy, DSC Variability of morphologyDSC, XRDSR XRDSRXRDDSC, XRDDSC, light microscopy, XRD
DSC, XRD Effect of ultrasoundSR XRD Effect of the difference of molecule lengthDSC, SR XRDDSC, SR XRD Existence of molecular compoundsDSC, SR XRD Phase diagram of metastable phasesDSC, SR XRD Existence of molecular compoundsDSC, SR XRD Existence of molecular compoundsDSC, SR XRD Immiscibility of the least unstable polymorphDSC, XRD Existence of molecular compoundsDSC, XRDDSC, XRD Existence of molecular compoundsDSC, SR XRDDSC Mixing propertiesSR XRD Confirmation of the intermediate phase (β′)
raction.

Table 3Literature on crystallization kinetics of pure and binary mixtures of TAGs
Reference Systems Measurement techniques Kinetic aspects
(A) Crystallization kinetics of pure TAGsHollander et al. [178] Different TAGs Light microscopy Crystal growth rate and morphologyMeekes et al. [217] Different TAGs Simulation of morphologyHollander et al. [149] Different TAGs Light microscopy Crystal growth rate and morphologyHigaki et al. [48] Pure PPP, impure PPP DSC, XRD Induction time, effect of ultrasoundSmith et al. [213] Different TAGs Light microscopy, SEM and DSC Crystal growth rate and morphology (effect of additives)Dibildox-Alvarado et al. [215] PPP in sesame oil DSC, XRD Using Avrami model for kinetic analysisToro-Vazquez et al. [216] PPP in sesame oil DSC, XRD Using Avrami model for kinetic analysisRousset et al. [146] POP, POS, SOS DSC, light microscopy Nucleation and growth rates. Mapping of crystal morphologyKellens et al. [95] PPP DSC, light microscopy, XRD Induction time, nucleation, and growth rateKellens et al. [218] SSS DSC, light microscopy, XRD Induction time and nucleationKoyano et al. [199] POS Light microscopy Induction time. Direct melt and melt mediated crystallizationKoyano et al. [106] POP, SOS Light microscopy Induction time. Direct melt and melt mediated crystallizationSato and Kuroda [92] PPP DSC, light microscopy Induction timeZhao et al. [219] PPP, LLL, SSS DSC Bulk and emulsified samples
(B) Crystallization kinetics of binary TAG mixturesRousset et al. [146] SOS/POS DSC, light microscopy Nucleation and growth rates. Mapping of crystal morphologyMacNaughtan et al. [127] PPP/SSS DSC Induction time and half time of crystallizationHimawan et al. [150,182,193] PPP/SSS DSC, light microscopy Nucleation and growth rates. Spherulite morphology
8 C. Himawan et al. / Advances in Colloid and Interface Science 122 (2006) 3–33
concepts of supersaturation are not helpful. A more detailedexamination of thermodynamic driving forces based uponchemical potential relationships is needed. The thermody-namics of fats systems are thus first discussed in Section 2,and subsequently extended in Section 3 to quantify crystal-lization driving forces and to examine the kinetic aspects offat crystallization. Tables 2 and 3 list the current literature onthe polymorphic and kinetic behaviour of pure and binarymixtures of TAGs, on which much of this review is based.
2. Thermodynamic aspects of the melt crystallization of fats
Traditionally, a solid fat mixture is characterized by its solidfraction content (SFC), i.e. the mass fraction of solid present at acertain temperature. The SFC is then normally used as a basis topredict and determine the many physical properties of thematerial [60].
The typical melting temperature (i.e. normally defined as thetemperature at which the SFC is zero) and SFC characteristicsof some natural fats are shown in Table 4 [61–63]. These aredetermined most importantly by the composition of the fat. Forinstance, the main TAGs in palm oil are POP (22%), POO(22%), PPO (5%), PPP (5%), POS (5%), PlP (7%), PlO (7%),
Table 4Melting temperatures and SFC values of natural fats in their most stable polymorph
Fat Meltingtemperature (°C)
SFC (%) at temperature
10 °C 15 °C
Butter 36 55 37Cocoa butter 34 – –Lard 42 27 –Palm oil 40 54 40Palm kernel oil 28 68 56Tallow 50 58 –
OOO (5%), and POl (3%) [50]; meanwhile those in coconutbutter are POS (46%), SOS (29%), POP (13%), PlS (3%), SOO(2%), and SlS (2%) [52].
In this section the thermodynamic aspects of fat systems areaddressed. This begins with a general outline of polymorphism,before focussing on individual systems. The inherently complexnature of fats dictates that the discussion of phase equilibria isbest tackled starting with the simplest systems first, namely pureTAGs of a single saturated fatty acid moiety (e.g. PPP, see Table1 for the nomenclature). Increasing complexity can then beadded by the presence of double bonds and mixing differentfatty acid moieties within a TAG molecule whilst stillmaintaining a single component system. Finally, the phasebehaviour of binary mixtures of different TAG molecules isintroduced.
2.1. Free energy diagrams and polymorph stability
Two types of polymorphism generally exist in lipids andorganic compounds [20,23,64]. Enantiotropic polymorphismoccurs when each polymorphic form is thermodynamically themost stable in a particular range of temperature and pressure.Changing the temperature or pressure to outside this range will
Data sources
20 °C 25 °C 30 °C 35 °C
19 11 5 1 Bockisch [61]76 70 45 1 Gunstone [62]20 – 3 – Bockisch [61]26 16 11 8 Gunstone [63]40 17 – – Gunstone [63]45 – 25 15 Bockisch [61]
9C. Himawan et al. / Advances in Colloid and Interface Science 122 (2006) 3–33
favour the transformation into a different polymorph (that whichis most stable under the new conditions) [6,65]. Long chain oddcarbon number alkanes exhibit such behaviour [23]. Inmonotropic polymorphism, on the other hand, one polymorphicform is always the most thermodynamically stable. Transforma-tions occur from the less stable polymorphs to the more stableones given sufficient time [6,65].
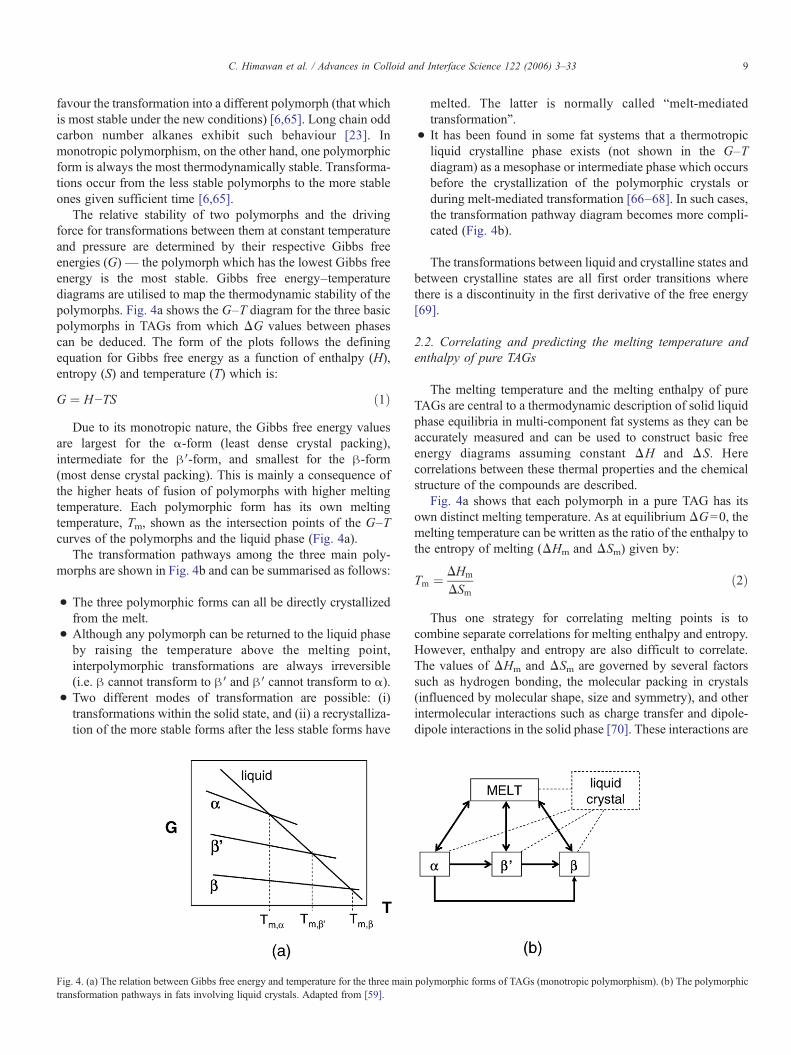
The relative stability of two polymorphs and the drivingforce for transformations between them at constant temperatureand pressure are determined by their respective Gibbs freeenergies (G)— the polymorph which has the lowest Gibbs freeenergy is the most stable. Gibbs free energy–temperaturediagrams are utilised to map the thermodynamic stability of thepolymorphs. Fig. 4a shows the G–T diagram for the three basicpolymorphs in TAGs from which ΔG values between phasescan be deduced. The form of the plots follows the definingequation for Gibbs free energy as a function of enthalpy (H),entropy (S) and temperature (T) which is:
G ¼ H−TS ð1ÞDue to its monotropic nature, the Gibbs free energy values
are largest for the α-form (least dense crystal packing),intermediate for the β′-form, and smallest for the β-form(most dense crystal packing). This is mainly a consequence ofthe higher heats of fusion of polymorphs with higher meltingtemperature. Each polymorphic form has its own meltingtemperature, Tm, shown as the intersection points of the G–Tcurves of the polymorphs and the liquid phase (Fig. 4a).
The transformation pathways among the three main poly-morphs are shown in Fig. 4b and can be summarised as follows:
• The three polymorphic forms can all be directly crystallizedfrom the melt.
• Although any polymorph can be returned to the liquid phaseby raising the temperature above the melting point,interpolymorphic transformations are always irreversible(i.e. β cannot transform to β′ and β′ cannot transform to α).
• Two different modes of transformation are possible: (i)transformations within the solid state, and (ii) a recrystalliza-tion of the more stable forms after the less stable forms have
Fig. 4. (a) The relation between Gibbs free energy and temperature for the three maintransformation pathways in fats involving liquid crystals. Adapted from [59].
melted. The latter is normally called “melt-mediatedtransformation”.
• It has been found in some fat systems that a thermotropicliquid crystalline phase exists (not shown in the G–Tdiagram) as a mesophase or intermediate phase which occursbefore the crystallization of the polymorphic crystals orduring melt-mediated transformation [66–68]. In such cases,the transformation pathway diagram becomes more compli-cated (Fig. 4b).
The transformations between liquid and crystalline states andbetween crystalline states are all first order transitions wherethere is a discontinuity in the first derivative of the free energy[69].
2.2. Correlating and predicting the melting temperature andenthalpy of pure TAGs
The melting temperature and the melting enthalpy of pureTAGs are central to a thermodynamic description of solid liquidphase equilibria in multi-component fat systems as they can beaccurately measured and can be used to construct basic freeenergy diagrams assuming constant ΔH and ΔS. Herecorrelations between these thermal properties and the chemicalstructure of the compounds are described.
Fig. 4a shows that each polymorph in a pure TAG has itsown distinct melting temperature. As at equilibrium ΔG=0, themelting temperature can be written as the ratio of the enthalpy tothe entropy of melting (ΔHm and ΔSm) given by:
Tm ¼ DHm
DSmð2Þ
Thus one strategy for correlating melting points is tocombine separate correlations for melting enthalpy and entropy.However, enthalpy and entropy are also difficult to correlate.The values of ΔHm and ΔSm are governed by several factorssuch as hydrogen bonding, the molecular packing in crystals(influenced by molecular shape, size and symmetry), and otherintermolecular interactions such as charge transfer and dipole-dipole interactions in the solid phase [70]. These interactions are
polymorphic forms of TAGs (monotropic polymorphism). (b) The polymorphic

10 C. Himawan et al. / Advances in Colloid and Interface Science 122 (2006) 3–33
complex and it is difficult to predict them (and thusΔH andΔS)with confidence. Due to such complex interactions, only limitedguidelines exist for describing the relationship between themelting temperature of an organic compound and its chemicalstructure despite the enormous amount of available meltingtemperature data.
Several recent studies on the estimation of the meltingtemperature and melting enthalpy of organic compounds havebeen reported covering a wide variety of classes of organiccompounds. A review on this subject was given by Katritzky[70] who classified existing correlations into three categories:
• Models utilising physicochemical and structural parameters,such as bulkiness, cohesiveness, hydrogen-bonding para-meters, and geometric factors [71–73].
• Group contribution methods in which a molecular break-down scheme is generally employed and multiple regressionanalysis is performed to determine the contribution of a largenumber of molecular groups to the melting temperature [74–78]. Usually, melting enthalpy is calculated from groupcontribution methods while melting entropy consists of agroup contribution value as well as non-additive molecularparameters. The latter represents rotational and conforma-tional entropies [77,78].
• Estimations from Monte Carlo or molecular dynamicscomputer simulations for the phase transitions and relatedproperties of compounds including the melting temperature[79–82].
In the case of TAGs, saturated fatty acids are relatively linearmolecules (Fig. 2b) and thus TAGs containing only saturatedfatty acids can easily align themselves to form a compact mass.On the other hand, unsaturated fatty acids in TAGs have kinksin their aliphatic chains (Fig. 2b). The disrupted packing of theunsaturated TAGs hinders the formation of crystals and causesunsaturated TAGs to have a lower melting temperature thansaturated TAGs with the same chain length.
Molecular symmetry [83,84] and crystal packing [70,74] areconsidered to be the most influential factors governing thethermal properties of TAGs. The many different combinationsof arranging fatty acid moieties in TAGs, along withpolymorphism, means that the estimation of melting tempera-ture of TAGs is more difficult compared to that of most organiccompounds.
The methods used for general organic compounds can,nevertheless, be applied to TAGs. Normally, the meltingenthalpy and entropy are expressed as the sum of a contributionof the hydrocarbon chains (depending linearly on the chainlength) and a contribution of the end and head groups(independent of chain length) [23].
DHm ¼ hnþ h0 ð3Þ
DSm ¼ snþ s0 ð4ÞHere, n is the length of hydrocarbon chains, h and s are
constants that do not depend on the nature of the compound but
only on the way hydrocarbon chains are packed, thus they areuniversal constants that only depend on the polymorphic form.The other constants h0 and s0 that account for the end-groupcontributions (the structure of fatty acid moieties) are specific toeach class of lipid.
Combining Eqs. (2)–(4), gives:
Tm ¼ DHm
DSm¼ hnþ h0
snþ s0¼ Tl 1þ A
nþ B
� �ð5aÞ
with:
Tl ¼ hs; A ¼ h0
h−s0s; B ¼ s0
sð5bÞ
This implies that if the melting temperatures of a class oflipids have been correlated, only one data point for the enthalpyof fusion is in principle sufficient to obtain a correlation for theenthalpy of fusion of the complete class of lipids. However, thisis an oversimplification, as differences in chain lengths ofindividual moieties need to be accounted for.
Timms [85] compiled Tm and ΔHm data of β′- and β-formsof selected TAGs and gave regressed correlations for eachpolymorphic form. Zacharis [86] used Eq. (3) to represent thethermal data of monoacid TAGs. Perron [87,88] updated thework of Timms [85] and published correlations for the threepolymorphic forms for saturated TAGs. Furthermore, Perronmodelled the lower melting enthalpy of unsaturated TAGs(ΔHm,unsat) by comparing them with the correspondingsaturated TAG (ΔHm,sat) and then making an adjustmentaccording to the following equation:
DHm;unsat ¼ DHm;sat−115ð1−e−0:706dÞ ð6Þwhere d is the number of double bonds in the unsaturated TAG.Won [89] followed the approach of Zacharis [86] but applied theequations to saturated TAGs with mono and mixed acyl groups.However, data were only correlated with the total number ofcarbon atoms and the effects of position were not considered.Thus the fitted values were identical for different TAGs with thesame total number of carbon atoms.
Zeberg-Mikkelsen and Stenby [90] developed empiricalcorrelations based upon a group-contribution method whichtook into account the position of the acyl groups. Thecorrelations were only valid for saturated TAGs which had aneven number of carbon atoms (between 10 and 22) in each acylgroup. Chickos and Nichols [74] developed simple relation-ships for homologous series and showed that they wereapplicable to the three polymorphic forms of symmetricallysubstituted TAGs. Anomalous behaviour, which was revealed insome cases, was argued to be caused by different packingbetween members of a series. Molecular modelling has alsorecently been applied to estimate the thermal and transportproperties of TAGs with reasonable predictive capability [91].
Wesdorp [23] developed a model to estimate Tm and ΔHm
for different polymorphic forms of saturated and unsaturatedTAGs from a large database. He improved the method of Eqs.(5a) and (5b) to account for the effect of position and chainlength of the three acyl groups in TAGs (symbolised by pqr).

11C. Himawan et al. / Advances in Colloid and Interface Science 122 (2006) 3–33
Two parameters were introduced x=q−p and y= r−p, where qis the chain length of the acyl group in position 2 of the TAGand p is the shortest chain length of the acyl group in positions 1or 3. From many regression trials, Wesdorp [23] identifiedseveral factors to be important in order to successfully estimateTm and ΔHm values of TAGs. These were (1) the length of eachchain, (2) whether the chain has an even or odd number ofcarbon atoms, (3) whether the chain is saturated or unsaturated,and (4) the molecular symmetry. It was also found that themelting enthalpy of the β-form depended on whether it wasdouble chain length or triple chain length packed. Correlationsobtained for unsaturated TAGs in the study were found to beless reliable due to the limited data available compared to thosefor saturated TAGs. Although aimed at the development of anempirical model, the work of Wesdorp [23] indicated that thethermal behaviour of TAGs directly follows from theirmolecular structure.
2.3. The polymorphic behaviour of pure TAGs
The polymorphic nature of TAGs is well established. It isalso well known that mixing different fatty acid moieties in aTAG produces more complex polymorphic behaviour (princi-pally the number of observable polymorphs). Thus saturatedmonoacid TAGs are simplest, followed by mixed acid saturated,with mixed acid saturated/unsaturated being the most complex[18,59].
2.3.1. Monoacid saturated TAGsThis group of TAGs has been examined by thermal
techniques (such as DTA and DSC) more than any othergroup and shows the basic α, β′, and β polymorphic forms [20].Melting temperature and enthalpy data for the three poly-morphic forms with fatty acid chain lengths ranging from 8 to
Fig. 5. (a) Typical thermograms of monoacid saturated TAGs represented by tristearinby heating at 2.5 °C/min (solid line). Intermediate forms (β1′ and β2′) are observed aftstructural model of molecular packing of the α, β′ and β; the different between the strfrom [22].
30 have been compiled by Hagemann [20], Wesdorp [23], andby Zelberg-Mikkelsen and Stenby [90].
Generally, the polymorphic behaviour of TAGs with an evencarbon number are well represented by the behaviour of PPP[67,92–95] and SSS [20,94,96] and summarised as follows (seeFig. 5 for the SSS thermal behaviour and the structural model ofthe molecular packing of each polymorph):
• The α-form is crystallized upon cooling from the melt atmoderate to high cooling rates. Remelting the α-forminduces an endotherm at a slightly higher temperature thanthe cooling exotherm, but this is soon followed by anexotherm associated with the formation of the stable β-form[20,94].
• The β′-form crystallizes if the temperature is maintainedslightly above the melting temperature of the α-form (about30 min induction time for SSS). Several endotherms may beobserved upon remelting caused by submodifications of theβ′-form [20,94].
• The β-form can be crystallized directly using a solvent[20,97] or by tempering/holding (about 60 min inductiontime for SSS) slightly above the melting temperature of β′-form [94]. Only CCC (tricaprin) was reported to revealmultiple β-forms [98].
The chain length of fatty acid moieties has a significantinfluence on the polymorphic behaviour. Of particular note isthat the crystal packing of β′ and β forms also depends onwhether the number of carbons in the chain is even or odd[22].
• For TAGs of C22 and longer, rapid cooling exhibits a singleexotherm associated with the formation of the α-form.However, Hagemann [20] showed that tempering can lead to
. Adapted from [20]: cooling from the melt at 20 °C/min (dashed line), followeder holding 30 min slightly above the melting point of the α-form. (b) Side-viewucture of the β′- and the β-form is in their subcell structure (see Fig. 2). Adapted

Fig. 6. Melting temperatures plotted against fatty acid chain lengths of α-, β′-,and β-forms of monoacid saturated TAGs [99]. Reprinted with permission fromthe American Oil Chemists' Society.
12 C. Himawan et al. / Advances in Colloid and Interface Science 122 (2006) 3–33
two submodifications of the α-form with greater separationbetween the two peaks as the chain length increases.
• Three different submodifications of the β′-form werereported in even carbon numbers shorter than C16. Thethird modification melted close to the β-form, the differencein melting points decreasing wth increasing chain length[20].
• The β′-form of odd carbon number monoacid TAGs is morestable compared to even number TAGs [20]. X-raydiffraction analysis indicates this is due to a closer similarityof the crystal structure of the β′- and β-forms with odd TAGsthan is the case with even TAGs [98].
• The melting points of the α-form increase monotonicallywith fatty acid chain length but those of the β′- and β-formsshow fluctuations due to the odd–even chain length effect(see Fig. 6) as reported in hydrocarbon type materials[20,23,99]. The trend of melting temperature versus chainlength for odd numbered TAGs is generally lower than thatfor even numbered TAGs. The effect is most pronounced atlower chain lengths and is maintained for the β polymorph athigher chain lengths. This reflects the less packed crystal
Fig. 7. Long spacing values (open squares) and melting temperatures (closed circlesUeno [59].
structure due to steric hindrance of the molecular structure ofodd number TAGs and the more precise packing of the βpolymorph.
2.3.2. Mixed-acid saturated TAGsMixed-acid saturated TAGs, mainly those with acids with
even carbon number chain lengths in the range 12–20, arewidely prevalent in natural fats. Modifications of polymorphicbehaviour from that of monoacid saturated TAGs result fromdifferences in chain length between the fatty acid moieties, andthis is also influenced by their relative positions [20,59]. Thiswas best described by Sato [59] when analysing thepolymorphic and thermal behaviour of the asymmetric PPnTAGs [24,100–102] the symmetric CnCn+ 2Cn TAGs [103,104].Here n represents even chain lengths varying from 0 to 16 inPPn and from 10 to 16 in CnCn+2Cn.
Sato and Ueno [59] observed that heterogeneity in the chainlengths of the three acyl groups tends to reduce the gap instability of the β′-form and β-form such that the β-form is notobserved. This is illustrated by the behaviour of asymmetricPPn TAGs, where β′ was the most stable form of PP6, PP8, andPPM, while β was most stable in PP2, PP4, and PPC. Thechain-length structure of the most stable forms also varied withincreasing n from double (PP2, PP4) to triple (PP6, PP8, PPC)and back to double again (PPL, PPM). The irregular trend of themelting temperatures of the PPn, shown in Fig. 7a, reflects thevariation in the chain length structures.
In CnCn+2Cn TAGs, β′ was always found to be the moststable form as no β form was observed [103]. The meltingtemperatures and long spacings of the CnCn+2Cn seriesincreased monotonically with increasing n (Fig. 7b) as wouldbe expected.
The complexity of polymorphs of mixed acid TAGs isillustrated by Fig. 8 which shows the polymorph structures ofPPC [101]. The most notable aspect is that there are varioussubmodifications of the β′-form of this molecule. The α-formoccurs by rapid cooling from the melt which further transformsto β3′ (O⊥ subcell). Upon remelting, the β3′-form transforms tothe β2′-form with the same subcell type. All α-, β2′- and β3′-forms are double chain length structures. A transformation from
) of (a) PPn TAGs [100] and (b) CnCn+2Cn TAGs [103]. Adapted from Sato and

Fig. 8. Polymorphic transformations in PP10 [59,101,220].
13C. Himawan et al. / Advances in Colloid and Interface Science 122 (2006) 3–33
the β2′-form to the triple chain length β-form proceeds at highertemperatures. Additionally, rapid melting of the α-form inducesanother β′-form showing a hexa-layered structure (β1′-6).
Many issues regarding the polymorphic behaviour inasymmetric mixed-acid saturated TAGs remain unresolved[59], due to the various interchain interactions of the methyl endgroups, aliphatic chains and glycerol groups [24].
2.3.3. Mixed-acid saturated/unsaturated TAGsTAGs with unsaturated fatty acids at the sn-2 position and
saturated acids at the other positions (Sat-U-Sat) are the maincomponents of a number of widely used vegetable fats such aspalm oil and cocoa butter. These will be considered here toillustrate the complexities of unsaturated systems. Particularlycommonplace are those containing oleic acid at the sn-2position. The presence of the double bond (with the inflexible“kink”) gives greater steric hindrance than found in completelysaturated TAGs, which forces specific structures to be formed toenable the saturated and unsaturated fatty acid moieties to be
Fig. 9. Representation of the olefinic conformations of fatty acids in TAGs containingand S–C–S when the two chains are normal to each other [113].
packed together in the same lamella leaflet. Consequently, thisTAG group exhibits still more complicated polymorphicbehaviour as observed in the systems of SOS, POP, POS,SRS, and SlS [66,105–112].
Kaneko et al. [113] and Sato [24] expressed this complexityby highlighting the importance of olefinic conformations (seeFig. 9) in addition to the molecular chain packing (subcellpacking) and the chain-length structure. These relate to how thealiphatic chains on either side of the double bond are twistedwith respect to the plane of the double bond. Information onthese structures can be obtained from XRD, Fourier TransformInfra Red (FTIR) [109,114,115] and Nuclear MagneticResonance (NMR) [116,117].
The polymorphic structures of all Sat-O-Sat TAGs (with Satbeing saturated fatty acid and O being oleic acid) are similar,with the exception of POP [24,59]. Fig. 10 shows the structuresof both POP and SOS (which can be taken to be representativeof the other Sat-O-Sat TAGs) [109]. Particularly noteworthy forthis TAG group are:
• Another intermediate phase, γ can occur which has a triplechain-length structure. The saturated and oleic acid chains ofthis form are disordered with oleic acid chains packing in ahexagonal subcell (as in the α-form) whilst the saturatedchain leaflet shows a parallel packing.
• The β′-form is a triple chain-length structure, whereby thesaturated chain leaflets form an ordered O⊥ subcell whilst theoleic acid chain leaflets remain in a disordered hexagonalsubcell.
• In the case of the two β-forms the saturated and oleic acidleaflets both pack in an ordered manner. There is a slightdifference in the length of the triple chain-length structure ofthese two forms, and a small difference in meltingtemperature of 1.5–2.0 °C.
The presence of a double bond in Sat-O-Sat TAGs generallyforces the β′- and β-forms to adopt a triple chain-length
oleic acid moieties; S–C–S′ whenω- andΔ-chains are placed in the same plane
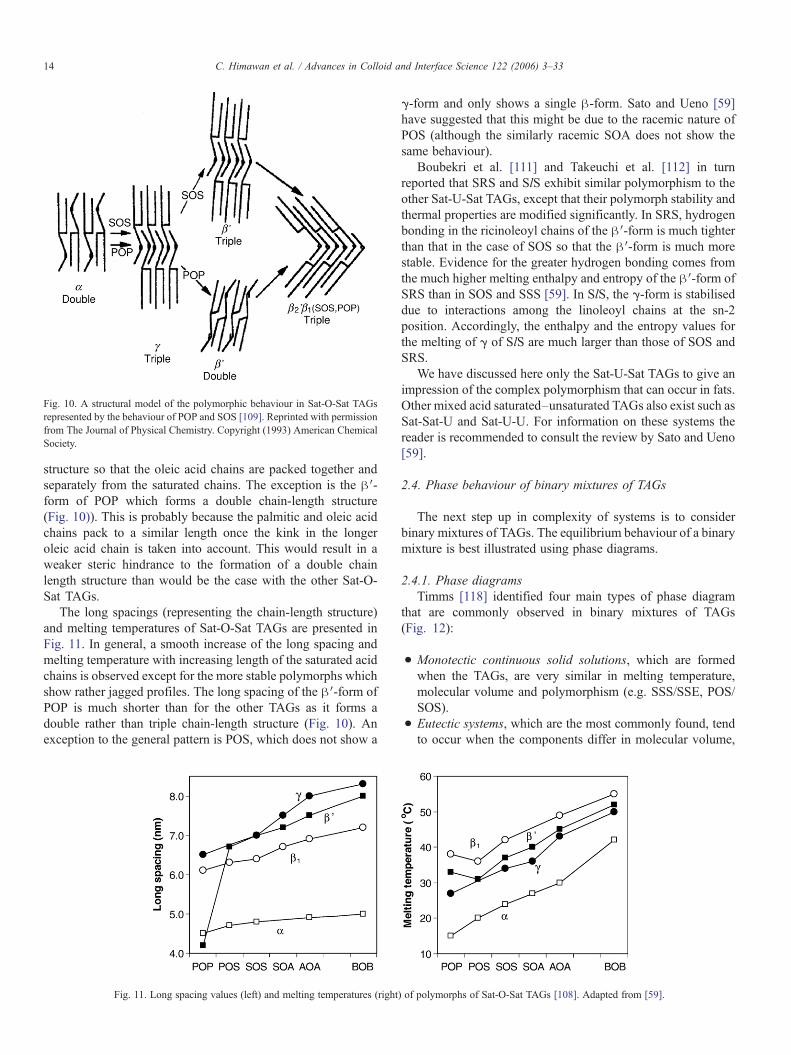
Fig. 10. A structural model of the polymorphic behaviour in Sat-O-Sat TAGsrepresented by the behaviour of POP and SOS [109]. Reprinted with permissionfrom The Journal of Physical Chemistry. Copyright (1993) American ChemicalSociety.
14 C. Himawan et al. / Advances in Colloid and Interface Science 122 (2006) 3–33
structure so that the oleic acid chains are packed together andseparately from the saturated chains. The exception is the β′-form of POP which forms a double chain-length structure(Fig. 10)). This is probably because the palmitic and oleic acidchains pack to a similar length once the kink in the longeroleic acid chain is taken into account. This would result in aweaker steric hindrance to the formation of a double chainlength structure than would be the case with the other Sat-O-Sat TAGs.
The long spacings (representing the chain-length structure)and melting temperatures of Sat-O-Sat TAGs are presented inFig. 11. In general, a smooth increase of the long spacing andmelting temperature with increasing length of the saturated acidchains is observed except for the more stable polymorphs whichshow rather jagged profiles. The long spacing of the β′-form ofPOP is much shorter than for the other TAGs as it forms adouble rather than triple chain-length structure (Fig. 10). Anexception to the general pattern is POS, which does not show a
Fig. 11. Long spacing values (left) and melting temperatures (right
γ-form and only shows a single β-form. Sato and Ueno [59]have suggested that this might be due to the racemic nature ofPOS (although the similarly racemic SOA does not show thesame behaviour).
Boubekri et al. [111] and Takeuchi et al. [112] in turnreported that SRS and SlS exhibit similar polymorphism to theother Sat-U-Sat TAGs, except that their polymorph stability andthermal properties are modified significantly. In SRS, hydrogenbonding in the ricinoleoyl chains of the β′-form is much tighterthan that in the case of SOS so that the β′-form is much morestable. Evidence for the greater hydrogen bonding comes fromthe much higher melting enthalpy and entropy of the β′-form ofSRS than in SOS and SSS [59]. In SlS, the γ-form is stabiliseddue to interactions among the linoleoyl chains at the sn-2position. Accordingly, the enthalpy and the entropy values forthe melting of γ of SlS are much larger than those of SOS andSRS.
We have discussed here only the Sat-U-Sat TAGs to give animpression of the complex polymorphism that can occur in fats.Other mixed acid saturated–unsaturated TAGs also exist such asSat-Sat-U and Sat-U-U. For information on these systems thereader is recommended to consult the review by Sato and Ueno[59].
2.4. Phase behaviour of binary mixtures of TAGs
The next step up in complexity of systems is to considerbinary mixtures of TAGs. The equilibrium behaviour of a binarymixture is best illustrated using phase diagrams.
2.4.1. Phase diagramsTimms [118] identified four main types of phase diagram
that are commonly observed in binary mixtures of TAGs(Fig. 12):
• Monotectic continuous solid solutions, which are formedwhen the TAGs, are very similar in melting temperature,molecular volume and polymorphism (e.g. SSS/SSE, POS/SOS).
• Eutectic systems, which are the most commonly found, tendto occur when the components differ in molecular volume,
) of polymorphs of Sat-O-Sat TAGs [108]. Adapted from [59].
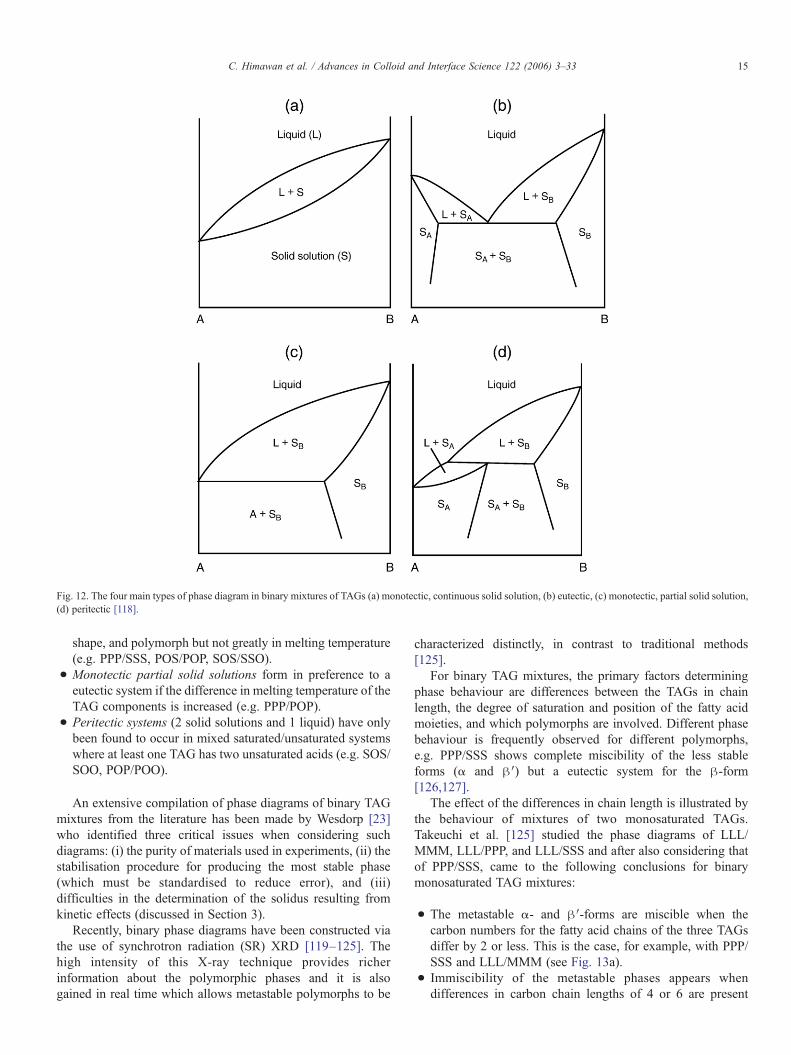
Fig. 12. The four main types of phase diagram in binary mixtures of TAGs (a) monotectic, continuous solid solution, (b) eutectic, (c) monotectic, partial solid solution,(d) peritectic [118].
15C. Himawan et al. / Advances in Colloid and Interface Science 122 (2006) 3–33
shape, and polymorph but not greatly in melting temperature(e.g. PPP/SSS, POS/POP, SOS/SSO).
• Monotectic partial solid solutions form in preference to aeutectic system if the difference in melting temperature of theTAG components is increased (e.g. PPP/POP).
• Peritectic systems (2 solid solutions and 1 liquid) have onlybeen found to occur in mixed saturated/unsaturated systemswhere at least one TAG has two unsaturated acids (e.g. SOS/SOO, POP/POO).
An extensive compilation of phase diagrams of binary TAGmixtures from the literature has been made by Wesdorp [23]who identified three critical issues when considering suchdiagrams: (i) the purity of materials used in experiments, (ii) thestabilisation procedure for producing the most stable phase(which must be standardised to reduce error), and (iii)difficulties in the determination of the solidus resulting fromkinetic effects (discussed in Section 3).
Recently, binary phase diagrams have been constructed viathe use of synchrotron radiation (SR) XRD [119–125]. Thehigh intensity of this X-ray technique provides richerinformation about the polymorphic phases and it is alsogained in real time which allows metastable polymorphs to be
characterized distinctly, in contrast to traditional methods[125].
For binary TAG mixtures, the primary factors determiningphase behaviour are differences between the TAGs in chainlength, the degree of saturation and position of the fatty acidmoieties, and which polymorphs are involved. Different phasebehaviour is frequently observed for different polymorphs,e.g. PPP/SSS shows complete miscibility of the less stableforms (α and β′) but a eutectic system for the β-form[126,127].
The effect of the differences in chain length is illustrated bythe behaviour of mixtures of two monosaturated TAGs.Takeuchi et al. [125] studied the phase diagrams of LLL/MMM, LLL/PPP, and LLL/SSS and after also considering thatof PPP/SSS, came to the following conclusions for binarymonosaturated TAG mixtures:
• The metastable α- and β′-forms are miscible when thecarbon numbers for the fatty acid chains of the three TAGsdiffer by 2 or less. This is the case, for example, with PPP/SSS and LLL/MMM (see Fig. 13a).
• Immiscibility of the metastable phases appears whendifferences in carbon chain lengths of 4 or 6 are present
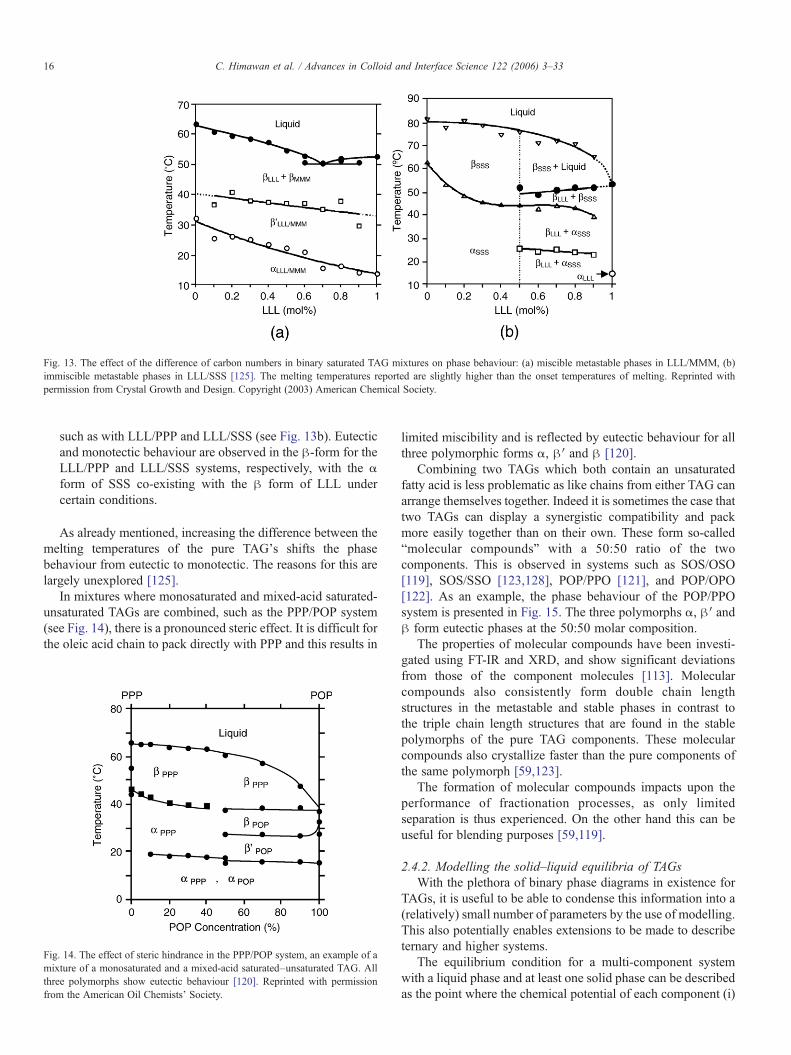
Fig. 13. The effect of the difference of carbon numbers in binary saturated TAG mixtures on phase behaviour: (a) miscible metastable phases in LLL/MMM, (b)immiscible metastable phases in LLL/SSS [125]. The melting temperatures reported are slightly higher than the onset temperatures of melting. Reprinted withpermission from Crystal Growth and Design. Copyright (2003) American Chemical Society.
16 C. Himawan et al. / Advances in Colloid and Interface Science 122 (2006) 3–33
such as with LLL/PPP and LLL/SSS (see Fig. 13b). Eutecticand monotectic behaviour are observed in the β-form for theLLL/PPP and LLL/SSS systems, respectively, with the αform of SSS co-existing with the β form of LLL undercertain conditions.
As already mentioned, increasing the difference between themelting temperatures of the pure TAG's shifts the phasebehaviour from eutectic to monotectic. The reasons for this arelargely unexplored [125].
In mixtures where monosaturated and mixed-acid saturated-unsaturated TAGs are combined, such as the PPP/POP system(see Fig. 14), there is a pronounced steric effect. It is difficult forthe oleic acid chain to pack directly with PPP and this results in
Fig. 14. The effect of steric hindrance in the PPP/POP system, an example of amixture of a monosaturated and a mixed-acid saturated–unsaturated TAG. Allthree polymorphs show eutectic behaviour [120]. Reprinted with permissionfrom the American Oil Chemists' Society.
limited miscibility and is reflected by eutectic behaviour for allthree polymorphic forms α, β′ and β [120].
Combining two TAGs which both contain an unsaturatedfatty acid is less problematic as like chains from either TAG canarrange themselves together. Indeed it is sometimes the case thattwo TAGs can display a synergistic compatibility and packmore easily together than on their own. These form so-called“molecular compounds” with a 50:50 ratio of the twocomponents. This is observed in systems such as SOS/OSO[119], SOS/SSO [123,128], POP/PPO [121], and POP/OPO[122]. As an example, the phase behaviour of the POP/PPOsystem is presented in Fig. 15. The three polymorphs α, β′ andβ form eutectic phases at the 50:50 molar composition.
The properties of molecular compounds have been investi-gated using FT-IR and XRD, and show significant deviationsfrom those of the component molecules [113]. Molecularcompounds also consistently form double chain lengthstructures in the metastable and stable phases in contrast tothe triple chain length structures that are found in the stablepolymorphs of the pure TAG components. These molecularcompounds also crystallize faster than the pure components ofthe same polymorph [59,123].
The formation of molecular compounds impacts upon theperformance of fractionation processes, as only limitedseparation is thus experienced. On the other hand this can beuseful for blending purposes [59,119].
2.4.2. Modelling the solid–liquid equilibria of TAGsWith the plethora of binary phase diagrams in existence for
TAGs, it is useful to be able to condense this information into a(relatively) small number of parameters by the use of modelling.This also potentially enables extensions to be made to describeternary and higher systems.
The equilibrium condition for a multi-component systemwith a liquid phase and at least one solid phase can be describedas the point where the chemical potential of each component (i)

Fig. 15. Formation of molecular compounds in the mixture of unsaturated TAGs (PPO/POP): (a) the most stable phase and (b) metastable phases; C representsmolecular compounds [121]. Reprinted with permission from The Journal of Physical Chemistry B. Copyright (1997) American Chemical Society.
17C. Himawan et al. / Advances in Colloid and Interface Science 122 (2006) 3–33
in each phase is equal to that in any other phases present [129],i.e.:
lLi ¼ lSji ð7Þwhere μi
L and μiSj are the chemical potentials of each component
i in the liquid and the jth solid phase, respectively. The chemicalpotential of component i in a mixed phase p (solid or liquid) isgiven by:
lpi ¼ lpi;0 þ RT lnðgpi xpi Þ ð8Þwhere μi,0
p is the chemical potential of the pure component i inthe respective phase, xi
p is the mole fraction of component i andγip is the activity coefficient for component i.Substitution of Eq. (8) into Eq. (7) results in the equilibrium
condition for component i:
lngSji x
Sji
gLi xLi
!¼ lLi;0−l
Sji;0
RTð9Þ
To evaluate the right hand side of Eq. (9), let dμi,0p =−Si,0p dT
+Vi,0p dP (where Si,0
p and Vi,0p are the pure component molar
entropy and molar volume of the p phase for component i,respectively, P is pressure) and ΔSi,0=ΔHi,0/T (where ΔHi,0 isthe change of molar enthalpy upon melting of pure componenti). Using these definitions we obtain:
d Dli;0� � ¼ −DSi;0dT þ DVi;0dP
¼ −DHi;0
TdT þ DVi;0dP ð10aÞ
or
dðDli;0ÞRT
¼ −DHi;0
RT 2dT þ DVi;0
RTdP ð10bÞ
A simplification of Eq. (10b) can be made by assuming thefollowing:
• The reference temperature is the melting temperature of thepure component i at the system pressure, Tm,i(P). Thus the
effect of pressure does not need to be considered further(dP=0).
• The change in molar enthalpy can be represented byΔHi,0≅ΔHm,i,0 +ΔCpi,0(T−Tm,i), where ΔHm,i,0 is themolar enthalpy of melting of pure component i at thereference temperature Tm,i and ΔCpi,0 is the molar heatcapacity difference between the liquid and solid for the purecomponent i (assumed to be independent of temperature).
Integration of Eq. (10b) and substitution into Eq. (9) resultsin [60,130]:
lngSji x
Sji
gLi xLi
!¼ Dli;0
RT¼ DHm;i;0DT
RTm;i;0T−DCpi;0DT
RT
þ DCpi;0R
lnTm;i;0
T
� �ð11Þ
where ΔT=Tm,i−T.Eq. (11) relates the equilibrium compositions in the two
phases (left hand side) to the system temperature (right handside). These equilibrium compositions are heavily dependent onthe activity coefficients, and to describe the equilibriumconditions, the effect of composition and temperature on theactivity coefficients (in Eq. (11)) must be appropriatelymodelled. This is usually only required for the solid phaseactivity coefficients as the liquid phase can generally beassumed to be ideal. Prausnitz [129] elaborately describes theexisting thermodynamic models for such a purpose.
The simplest case is where there is a large difference inmelting points. The high melting component essentially forms apure crystal (xi
S =1). Both liquid and solid activity coefficientsare unity and Eq. (11) is rearranged and reduced to the so-calledHildebrand equation (where xi in Eq. (12) is the mole fractionof the high melting component in the liquid phase):
lnxi ¼ DHmDTRTmT
¼ DHm
R1Tm
−1T
� �ð12Þ
Of course, the activity coefficients also dictate the mixingbehaviour of the system in both the liquid and solid phases. If itis possible for the overall system Gibbs free energy to be
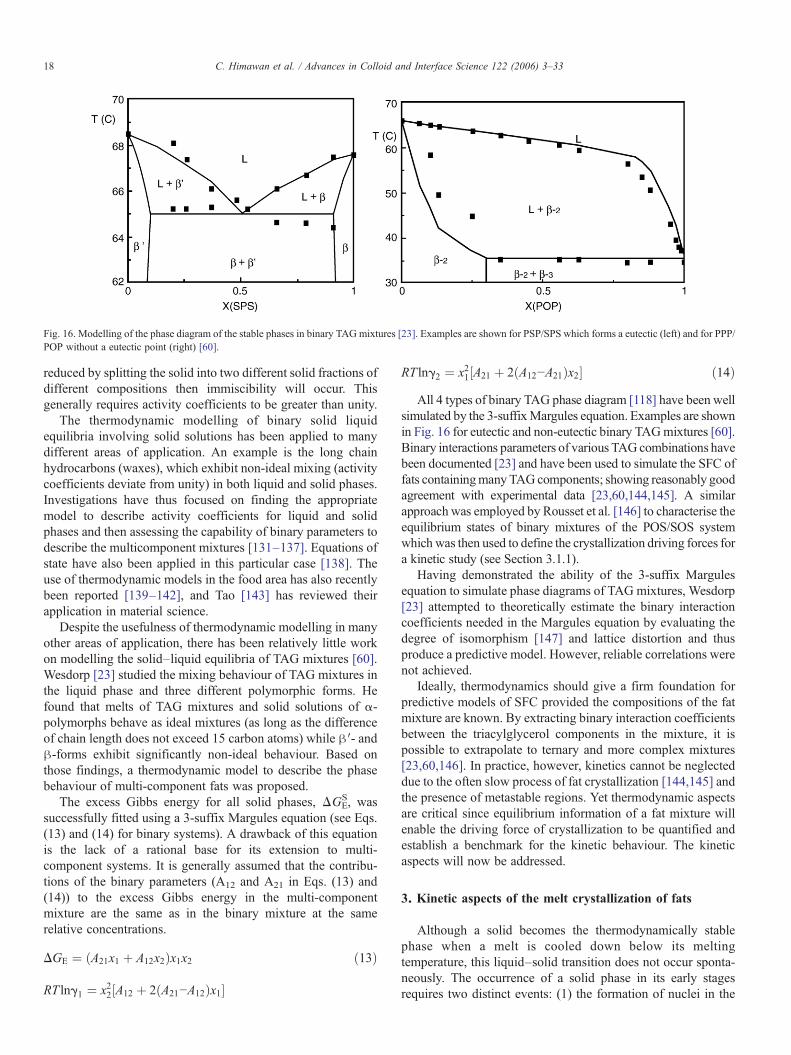
Fig. 16. Modelling of the phase diagram of the stable phases in binary TAGmixtures [23]. Examples are shown for PSP/SPS which forms a eutectic (left) and for PPP/POP without a eutectic point (right) [60].
18 C. Himawan et al. / Advances in Colloid and Interface Science 122 (2006) 3–33
reduced by splitting the solid into two different solid fractions ofdifferent compositions then immiscibility will occur. Thisgenerally requires activity coefficients to be greater than unity.
The thermodynamic modelling of binary solid liquidequilibria involving solid solutions has been applied to manydifferent areas of application. An example is the long chainhydrocarbons (waxes), which exhibit non-ideal mixing (activitycoefficients deviate from unity) in both liquid and solid phases.Investigations have thus focused on finding the appropriatemodel to describe activity coefficients for liquid and solidphases and then assessing the capability of binary parameters todescribe the multicomponent mixtures [131–137]. Equations ofstate have also been applied in this particular case [138]. Theuse of thermodynamic models in the food area has also recentlybeen reported [139–142], and Tao [143] has reviewed theirapplication in material science.
Despite the usefulness of thermodynamic modelling in manyother areas of application, there has been relatively little workon modelling the solid–liquid equilibria of TAG mixtures [60].Wesdorp [23] studied the mixing behaviour of TAG mixtures inthe liquid phase and three different polymorphic forms. Hefound that melts of TAG mixtures and solid solutions of α-polymorphs behave as ideal mixtures (as long as the differenceof chain length does not exceed 15 carbon atoms) while β′- andβ-forms exhibit significantly non-ideal behaviour. Based onthose findings, a thermodynamic model to describe the phasebehaviour of multi-component fats was proposed.
The excess Gibbs energy for all solid phases, ΔGES, was
successfully fitted using a 3-suffix Margules equation (see Eqs.(13) and (14) for binary systems). A drawback of this equationis the lack of a rational base for its extension to multi-component systems. It is generally assumed that the contribu-tions of the binary parameters (A12 and A21 in Eqs. (13) and(14)) to the excess Gibbs energy in the multi-componentmixture are the same as in the binary mixture at the samerelative concentrations.
DGE ¼ ðA21x1 þ A12x2Þx1x2 ð13Þ
RT lng1 ¼ x22½A12 þ 2ðA21−A12Þx1�
RT lng2 ¼ x21½A21 þ 2ðA12−A21Þx2� ð14ÞAll 4 types of binary TAG phase diagram [118] have been well
simulated by the 3-suffixMargules equation. Examples are shownin Fig. 16 for eutectic and non-eutectic binary TAGmixtures [60].Binary interactions parameters of various TAGcombinations havebeen documented [23] and have been used to simulate the SFC offats containingmany TAGcomponents; showing reasonably goodagreement with experimental data [23,60,144,145]. A similarapproach was employed by Rousset et al. [146] to characterise theequilibrium states of binary mixtures of the POS/SOS systemwhich was then used to define the crystallization driving forces fora kinetic study (see Section 3.1.1).
Having demonstrated the ability of the 3-suffix Margulesequation to simulate phase diagrams of TAG mixtures, Wesdorp[23] attempted to theoretically estimate the binary interactioncoefficients needed in the Margules equation by evaluating thedegree of isomorphism [147] and lattice distortion and thusproduce a predictive model. However, reliable correlations werenot achieved.
Ideally, thermodynamics should give a firm foundation forpredictive models of SFC provided the compositions of the fatmixture are known. By extracting binary interaction coefficientsbetween the triacylglycerol components in the mixture, it ispossible to extrapolate to ternary and more complex mixtures[23,60,146]. In practice, however, kinetics cannot be neglecteddue to the often slow process of fat crystallization [144,145] andthe presence of metastable regions. Yet thermodynamic aspectsare critical since equilibrium information of a fat mixture willenable the driving force of crystallization to be quantified andestablish a benchmark for the kinetic behaviour. The kineticaspects will now be addressed.
3. Kinetic aspects of the melt crystallization of fats
Although a solid becomes the thermodynamically stablephase when a melt is cooled down below its meltingtemperature, this liquid–solid transition does not occur sponta-neously. The occurrence of a solid phase in its early stagesrequires two distinct events: (1) the formation of nuclei in the

Fig. 18. Effect of kinetics on the polymorphic occurrence in the binary PPP/SSSsystem at a number of cooling rates [150]. Tm,α is the equilibrium temperature ofthe α-form. The β′-form crystallised at 0.5 and 1 K min−1 in PPP-rich mixtures(shown as open symbols).
19C. Himawan et al. / Advances in Colloid and Interface Science 122 (2006) 3–33
mother phase followed by (2) the advancement of the faces of thenuclei resulting in crystal growth. In fat systems, it has beenproposed that an ordering process of molecules into lamellaeacts as a precursor to the formation of a crystalline solid phase[24,51] (see Fig. 17a). This process follows a path throughtransitory states that requires energy barriers to be overcome asshown in Fig. 17b for different polymorphic forms [148].
The finite diffusion rates of molecules in the liquid and solidphases and the arrangement and subsequent attachment ofmolecules onto the surface of growing crystals all contribute tothe kinetics of the overall process [149]. Consequently, kineticfactors are as important as thermodynamic ones in determiningwhich polymorph will form from the melt and the amount,composition and properties of the crystalline phase. Examplesof these kinetic effects are described below.
(a) Polymorphic occurrenceUsually fats crystallize first in the least stable polymorph
with the lowest energy barrier (α) and later transform orrecrystallize to more stable polymorphs (β′ or β). Directcrystallization of β′- or β-forms from melts tends to occur onlywhen no supercooling, or sometimes little, of the less stableforms is present. Fig. 18 shows the kinetic phase diagram ofPPP/SSS [150] upon linear cooling at different cooling rates.Depending on the cooling rates applied, either α- or β′-formscrystallize. This illustrates the strong influence of kinetics onpolymorphic occurrence in fats.
(b) Composition gradients within crystalsDifferences in composition between the outer and inner
regions of a crystal are thought to occur during a slow coolingcrystallization as described in Wesdorp [23] and Los et al.[144,145]. This would be due to the higher melting componentspreferentially solidifying during the early stages of crystalgrowth which are then depleted from the liquid melt. The low
Fig. 17. (a) Simplified schematic representation of ordering in the liquid state of TApermission). (b) Energy barrier diagrams for the three main polymorphic forms of a T
diffusion rate in the solid phase hampers the inner part of thegrowing crystals to reach equilibrium with the liquid phase asthe composition of the liquid phase changes, whereas thesurface composition is much closer to equilibrium. The crystalsare ultimately inhomogeneous in composition having aconcentration gradient between the centre and the surface ofthe crystal. However, although the concept of a compositiongradient within crystals is plausible, as far as we know noexperimental proof has been published.
(c) Crystal perfection
Gs preceding the formation of a crystalline solid phase [24,51] (reprinted withAG at a given conditions below their melting temperatures. Adapted from [148].

20 C. Himawan et al. / Advances in Colloid and Interface Science 122 (2006) 3–33
Poorly packed crystals can result from rapid crystallization[67,151,152]. The thermal properties of such imperfect crystalsdeviate significantly from those of well-ordered ones. Imperfectcrystals may persist for years in the absence of a liquid phase[20] but can easily recrystallize into well packed crystals via theliquid phase if a liquid phase is present [22].
Los et al. [130,144,145] extended the work of Wesdorp [23]by implementing a simple kinetic expression into the “flash”calculation of multi-component TAG mixtures. They showed,via simulation using thermodynamic parameters from Wesdorp[23], that the effect of kinetics on the prediction of the SFC offat mixtures is substantial. However, comparisons with experi-mental data were not presented.
It is clear that kinetic factors should be considered in order todescribe properly the crystallization behaviour of fats. In thefollowing sections aspects characterising the dynamics of fatscrystallization are examined.
3.1. Nucleation and crystal growth rates — theoretical aspects
3.1.1. Thermodynamic driving forceThe fundamental thermodynamic driving force for the crys-
tallization of a component i is the difference in chemical po-tential of i (Δμi) between the liquid (μi
L) and solid (μiS) phases.
The chemical potentials are formulated as in Eq. (8), and thus:
Dli ¼ lLi −lSi ¼ Dli;0 þ RT ln
gLi xLi
gSi xSi
ð14aÞ
Substituting in the expression for (Δμi,0) from Eq. (11)yields:
DliRT
¼ DHm;iðTm;i−TÞRTm;iT
−DCpiðTm;i−TÞ
RT
þ DCpiR
lnTm;i
T
� �þ ln
gLi xLi
gSi xSi
� �ð14bÞ
However, in almost all cases in the literature, one of twosimplified approaches is used [148,153].
(a) Liquid-solution approachThe first approach represents the fat blend as a mixture of
two pseudo-components that are immiscible in the solid state.The pseudo-component with the higher melting temperature isconsidered to be the solute, while the one with lower meltingtemperature is the solvent. This is normally applied when fatscontain two families of distinctly different TAGs [2,31,154].
The approach is similar to most studies of industrialcrystallization, where the crystallization driving force ismodelled as the result of supersaturation. Thus for a liquidphase of a defined concentration of solute, the differencebetween the saturation concentration is evaluated (at the sametemperature). The saturation composition (xi
L,eq) is that which isin equilibrium with the forming solid phase (xi
S), which canrelated by Eq. (9) thus:
lngSi x
Si
gL;eqi xL;eqi
!¼ Dli;0
RTð15Þ
Combining Eqs. (14a) and (15) and eliminating (Δμi,0)results in:
Dli ¼ RT lngSi x
Si
gL;eqi xL;eqi
!þ RT ln
gLi xLi
gSi xSi
¼ RT lngLi x
Li
gL;eqi xL;eqi
!
ð16ÞIn many cases, the liquid phase of multi-component fats is
nearly ideal due to the relatively similar size and structure of thecomponent molecules [23], i.e. γi
L,eq≈γiL≈1. Eq. (16) is thus
further simplified to:
DliiRT lnxLixL;eqi
ð17Þ
For small supersaturations (xiL/xi,eq
L <1.1) a further approxima-tion via a Taylor expansion yields Δμi≅RT[(xiL−xiL,eq)/ xiL,eq].Frequently, s≡ (xiL−xiL,eq)/xiL,eq is used as an approximation to thecrystallization driving force, particularly at low supersaturations,considering that concentrations are relatively easy to measure.Sometimes, (xi
L−xiL,eq) is also used [155,156]. For high super-saturations (xi
L/xiL,eq>1.1), Eq. (16) should be used.
A limitation of this method is that it is reliant on theavailability of an equilibrium liquid concentration for the solidphase. This cannot be evaluated if the sample temperature isbelow the solidus, in which case a different approach is calledfor.
(b) Liquid-melt approachWhen fats are composed of relatively similar component
TAGs, it is often assumed that crystallization can be describedas occurring from a pure melt. Thus the last term in Eq. (14b) isneglected. A further simplication can also be made byneglecting the second and third terms on the right-hand sideof Eq. (14b), which for fats are at least two orders of magnitudesmaller than the first term, where ΔT=Tm,i−T is not larger than10 K [130]. This gives:
DliiDHm;iTm;i−TTm;i
� �ð18Þ
According to the latter equation, the driving force is thusproportional to the difference between the actual temperatureand the melting temperature.
Note, however, that for very complex systems such as naturalfats which have many different TAG components, the definitionof the above crystallization driving force becomes ambiguous asmelting typically occurs over a broad range [51] and a singlerepresentative melting point is difficult to establish in a way thatcan be consistently reliable under different conditions. Differentpolymorphic forms can also crystallize concomitantly tohamper accurate melting temperature identification. A reason-able strategy in some circumstances is to apply a globalsupercooling approximation [5]. The global melting tempera-ture of the complex melt mixture is defined to be the highesttemperature at which solid phases can exist and are about todisappear. The difference between the crystallization tempera-ture and this global melting temperature is regarded as the
21C. Himawan et al. / Advances in Colloid and Interface Science 122 (2006) 3–33
driving force of crystallization [28]. If this does not appear towork satisfactorily then recourse should be made to Eq. (14b).
3.1.2. Nucleation thermodynamics, kinetics and mechanismsThe formation of nuclei is an early stage of solid phase
formation. Theoretical models are well known for nucleationfrom a solution [157,158], and from a melt [159,160]. Classicalnucleation theory visualises the event as bimolecular reactionsof growth units. The Gibbs free energy of the system, ΔGhom,changes due to the decrease of free energy per unit volumearising from the enthalpy of fusion, −ΔGV, and the increase ofthe surface energy due to the surface tension, ΔGS. Forspherical nuclei of isotropic pure substances undergoinghomogeneous nucleation this yields the familiar equation:
DGhom ¼ −DGVV þ DGSS ¼ −43pr3DGV þ 4pr2r ð19Þ
where V, S and r are the volume, surface and radius of thecluster respectively; σ is the surface energy. ΔGhom increaseswith r until a critical (maximum) value ΔGhom⁎ is reached at acritical size r⁎, i.e. when dΔGhom/dr=0. Any clusters largerthan r⁎=−2σ/ΔGV decrease the free energy when they growand hence become more stable. Eq. (17) gives for ΔGV≅−ΔH(ΔT/TmVm), where Vm is the molar volume of the clusters, andΔT=Tm−T is the supercooling. The critical free energy, theactivation energy barrier, of nucleation can thus be written as:
DGhom⁎ ¼ 163
pr3V 2mT
2m
ðDHmDTÞ2ð20Þ
Thermodynamic considerations yield the energy barrier fornucleation and the critical nucleus size, but not the nucleationrate (the number of nuclei formed per unit volume per unittime). It is normally postulated that for a particular value ofΔμ (=ΔGhom) a cluster size distribution arises which followsthe Boltzmann distribution and thus the density of the criticalsize clusters (Chom⁎) can be expressed as Chom⁎=Noexp(−ΔGhom⁎/kT), where No is the number of molecules perunit volume, and k is the Boltzmann constant [6,153]. Asonly clusters greater than the critical size are able to growinto a stable crystal, the frequency of nuclei formation (Jhom)turns out to be proportional to Chom⁎, as well as the maximummolecular frequency of collision, given by kT/h where h isPlanck's constant:
Jhom ¼ NAkTh
exp−DGhom⁎
kT
� �ð21Þ
and where NA is the Avogadro number.Note, however, that there are other barriers to nucleation as
molecules must diffuse to the nucleus site and adopt theappropriate configuration to the surface of the growing nuclei.These barriers lead to additional diffusive and entropy terms[159]. The diffusive term reflects the fact that as thetemperature is lowered the diffusion rate falls caused by anincrease in the viscosity of the melt or solution. The entropyterm can be significant for long and flexible TAG molecules.
The loss of entropy due to the incorporation of molecules intoa nucleus is given by ΔSm=ΔHm/Tm. The probability of thefraction, αS, of molecules in the melt with suitable conformationto incorporate to the surface of nuclei is exp(−αSΔS/R).However, one often assumes this conformation barrier isincluded in the expression for the diffusion barrier (−ΔGdiff⁎ ),hence Eq. (21) becomes:
Jhom ¼ NkTh
exp−DGdiff⁎
kT
� �exp
−DGhom⁎kT
� �ð22Þ
In real solutions, nucleation is substantially accelerated dueto the presence of impurities which act as catalytic nucleationsites [6,148,153]. In fat processes these can be the vessel wall,impellers, mono- or diglycerides and other minor lipids, as wellas dust particles.
TAGs thus almost always undergo heterogeneous nucleationsince they are normally impure [5]. The activation energy islower than that of homogeneous type (a result of the catalyticaction of foreign substances). Consequently, the supercoolingrequired is also reduced. The activation energy for hetero-geneous nucleation can be related to that for homogeneousnucleation asΔGhet⁎=ΔGhom⁎f(θ), with θ represents the wettingcharacteristics of foreign solid impurities by the supercooledmelts [6]; thus a similar expression to Eq. (22) applies.
Another nucleation mechanism is secondary nucleationwhich is caused from (1) fragments of growing crystals thatare mechanically chipped off and which act as new nuclei, (2)the generation of small crystals due to collisions of crystals withother crystals as well as with parts of the crystallizer, and (3) thedisturbance of the (pseudo) static condition of the liquidlamellae by the presence of crystal lattices leading to a lamellaealignment which enhances the nucleation event [7,151,161].These mechanisms are more likely to be important in industrialscale crystallizers.
A potential tool to control the polymorphic crystallizationof fats is to provide “ready made” crystal nuclei via theaddition of crystal seeding. The polymorphic forms of theseeds must be in the same forms of the targeted forms tonucleate from the mother phase which are mostly the β′- or β-forms [24]. Additionally, at molecular level, the chemicalstructure of the seed TAGs is also of paramount importance.Takiguchi et al. [162] suggested, postulating from the templateeffects of fatty acid thin films on the crystallization of longchain n-alcohols, that the chain length of the fatty acidmoieties should not differ by more than 4 carbon numbers.Sato [24] found that in order to crystallize TAGs whichcontain unsaturated fatty acids, the seed material should alsohave an unsaturated fatty acid moiety to be effective. Thisreflects the immiscibility of those TAGs which are fullysaturated with those which contain unsaturated fatty acidmoieties, as discussed in Section 2.4.1 (Fig. 14). Lastly, andperhaps this is obvious, the melting temperature of the seedmaterial must be such that it does not itself melt when addedto the liquid phase of the crystallizing material. BOB and SOShave been shown to be quite effective for controlling thepolymorphic nucleation of cocoa butter [163–166].

22 C. Himawan et al. / Advances in Colloid and Interface Science 122 (2006) 3–33
3.1.3. Polymorphic-dependent nucleationIn monotropic polymorphism, as is the case with TAGs, there
is only one truly stable solid polymorph below the meltingtemperature, the others being only meta-stable. However, ifmore than one polymorph possesses a positive driving force forcrystallization then nucleation and growth rates are decisive indetermining polymorphic occurrence (see Fig. 18). Empirically,this is described by Ostwald's rule of stages [6], which statesthat the thermodynamically less stable phase is always formedfirst and a step-by-step phase change may then occur towardsthe most stable one.
Three main factors influence the polymorphic-dependentnucleation of TAGs:
• Supercooling (ΔT), which if increased leads to highernucleation rates (Eq. (20))
• The interfacial free energy of the crystals (σ) which isnormally smaller for the less stable forms (α<β′<β)
• The ordering dynamics from a random conformation ofliquid TAG molecules to a densely packed conformation ofthe crystalline state [6,123].
ΔT must be positive for a polymorph to form but of thosepolymorphs which possess a positive ΔT it is the interfacial freeenergy term that is usually decisive. Lower melting polymorphshave lower values of σ and so they will form if they can.Ostwald's rule of stages is thus explained by the competition tonucleate among the polymorphic forms; the phase with thehighest nucleation rate will form preferentially [6].
The Ostwald rule of stages in TAGs, however, can beoverridden if external influences are present such as localpressure and temperature fluctuations (e.g. by ultrasonicstimulation), template and seeding [24]. These are used inindustry to manipulate the crystallization of fats.
Tempering, which applies certain temperature-time protocolsand frequently involves shear, is often employed in order toinduce the nucleation of the more stable polymorphs. As themore stable phases are too slow to crystallize from the meltdirectly, a tempering protocol (e.g. thermal annealing) allowsthe formation of the less stable form followed by itstransformation to the desired form either by direct transforma-tion or via melting of the less stable phase. Additionally, if amixture of unstable and stable polymorphs occurs, then raisingthe temperature will melt out unstable polymorphs and leaveseed crystals of the stable polymorph. This procedure is themost common technique for controlling polymorphic fatcrystallization in chocolate confectionery.
The introduction of shearing has been found to significantlyaccelerate the formation of certain polymorphic forms[8,9,10,11,12,45]. Mazzanti et al. [11] argued that macroscopicshearing can provoke the alignment of less stable polymorphcrystals that in turn will induce a higher transformation rate intoa more stable phase. Mazzanti et al. [12] then reported thatincreasing the shearing rate does not influence the nucleationrate of the less stable phase but it does affect the rate of theformation of the more stable phase which is transformed fromthe less stable phase. So far, only limited explanations have
been made of the effect of shearing on fat crystallization kinetics[24]. Most studies on the effect of shearing have been conductedon natural fats. A better understanding might be obtained byconducting a systematic study on pure or well-defined TAGmixtures.
Recently, ultrasound and magnetic fields have beenexamined as other potential candidates to control the poly-morphic nucleation of fats [48,167,168]. The creation of localpressure and thus higher local supersaturation may induce fasternucleation rates.
3.1.4. Induction timeAccording to nucleation theory (see Section 3.1.2), a critical
cluster size distribution must be established before nucleationstarts. It can be imagined that when the melt is cooled downrapidly from well above its melting temperature, the number ofclusters will barely have exceeded zero by the time thecrystallization temperature is reached [169]. An induction orincubation time, tind, is required to develop such a cluster sizedistribution [170]. This induction time can be long (hours) forrelatively large TAG molecules [148]. In many nucleationstudies, including those involving TAGs, researchers havetended to correlate tind as inversely proportional to thetheoretical homogeneous/heterogeneous nucleation rate[7,171], although induction time and nucleation rate representdistinctly different physical phenomena. From Eq. (22), thisyields:
tindi1=J ¼ hNAkT
exp−DGdiff⁎
kT
� �exp
−DGhom⁎f ðhÞkT
� �:
ð23Þ
3.1.5. Growth rate and mechanismsThe growth rate from melts can be controlled by either the
attachment rate of growing units at the crystal surface (surfacekinetics) or by the transport of mass to or heat from the growingsurface [161].
The factors affecting the growth of TAGs can be groupedinto two main categories, namely factors that are governed bythe bulk crystal structure and those which are dictated by thenature of the mother phase [6]. Fig. 19 shows these relationshipsschematically.
In fat systems it is regularly presumed that surface kineticsare rate controlling [2]. The primary evidence for this is thatdissolution or melting rates (which are heat and mass transferlimited, but not surface kinetics limited) can often be ordersof magnitude faster than the growth rate for the same drivingforce. There are also mechanistic arguments that surfacekinetics are important as a great number of conformationalchanges are needed before a molecule can properly fit into thecrystal lattice, and this also allows a chance for detachment tooccur in the meantime. This conformational hindrance ofTAG molecules causes relatively slow crystal growth rates ofthe order of 0.01–0.1 μm/s at Δμ/RT values between 0.5 and1.5 [2]. It has been observed using AFM that theadvancement of a smooth crystal front in TAGs progresses

Fig. 20. Growth rates of monosaturated TAGs with different chain lengths. Thegrowth rates of tricaprin (CCC) and trilaurin (LLL) were collected from [212]and those of tripalmitin (PPP) and tristearin (SSS) (β′-form) from [182]. Thegrowth rate of 30% SSS in PPP/SSS system is also shown [182].
Fig. 19. Flow chart showing the interrelationships of factors affecting the morphology and growth rate of TAG crystals.
23C. Himawan et al. / Advances in Colloid and Interface Science 122 (2006) 3–33
via the creation of two-dimensional nuclei on the surface[172].
The effect of chain length on the growth rate of TAGs issignificant. Fig. 20 shows that the linear growth rates ofmonosaturated TAGs (CCC, LLL, PPP, and SSS) reduce as thechain length increases. This might be attributed to the timeneeded for the ordering of the methyl chains — the longer thechain, the longer the ordering time.
The crystallization of fats does also release a considerablequantity of latent heat (as much as 200 kJ kg−1) [2]. At amicroscopic level, the transport of this heat away from thecrystal surface into the bulk liquid can be of importance. Losand Mitovic [173] recently showed from computer simulationsthat heat transport in molecular systems, such as in fat mixtures,may be more important than mass transport, as opposed toatomic systems such as the solidification of alloys. Kloek et al.[31] roughly estimated that heat transfer may increase theinterfacial temperature by about 1 K at the half crystallizationtime (i.e. when the solid content has reached 0.5), which is asignificant amount.
Mass transport can reduce the overall growth rate if, forinstance, a significant increase in viscosity occurs leading to adecrease in diffusivity [5,174]. Walstra et al. [2] argued that thisis unlikely in fat system as only moderate supercoolings arenormally applied in fat crystallization. Hollander et al. [149],however, showed that at high supercooling, the solution and
melt crystallization of pure and binary mixtures of TAGs istransport limited. An interesting example is shown in Fig. 21.The growth of pure CLC at low Δμ shows a non-linear
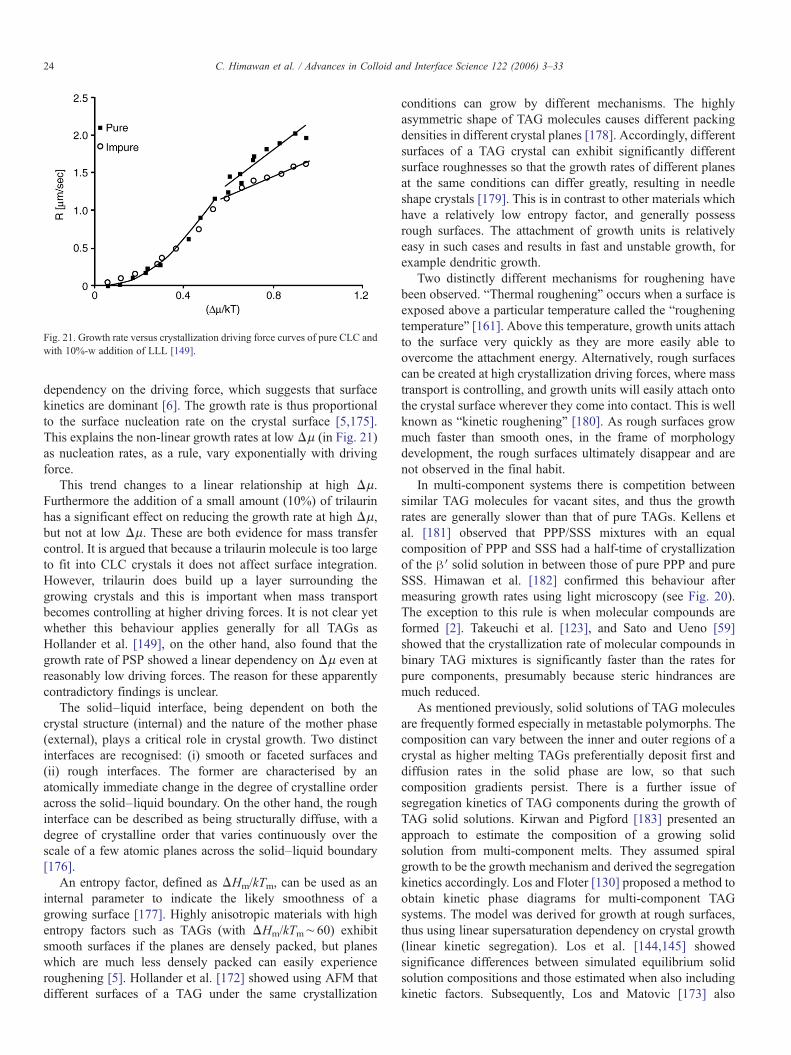
Fig. 21. Growth rate versus crystallization driving force curves of pure CLC andwith 10%-w addition of LLL [149].
24 C. Himawan et al. / Advances in Colloid and Interface Science 122 (2006) 3–33
dependency on the driving force, which suggests that surfacekinetics are dominant [6]. The growth rate is thus proportionalto the surface nucleation rate on the crystal surface [5,175].This explains the non-linear growth rates at low Δμ (in Fig. 21)as nucleation rates, as a rule, vary exponentially with drivingforce.
This trend changes to a linear relationship at high Δμ.Furthermore the addition of a small amount (10%) of trilaurinhas a significant effect on reducing the growth rate at high Δμ,but not at low Δμ. These are both evidence for mass transfercontrol. It is argued that because a trilaurin molecule is too largeto fit into CLC crystals it does not affect surface integration.However, trilaurin does build up a layer surrounding thegrowing crystals and this is important when mass transportbecomes controlling at higher driving forces. It is not clear yetwhether this behaviour applies generally for all TAGs asHollander et al. [149], on the other hand, also found that thegrowth rate of PSP showed a linear dependency on Δμ even atreasonably low driving forces. The reason for these apparentlycontradictory findings is unclear.
The solid–liquid interface, being dependent on both thecrystal structure (internal) and the nature of the mother phase(external), plays a critical role in crystal growth. Two distinctinterfaces are recognised: (i) smooth or faceted surfaces and(ii) rough interfaces. The former are characterised by anatomically immediate change in the degree of crystalline orderacross the solid–liquid boundary. On the other hand, the roughinterface can be described as being structurally diffuse, with adegree of crystalline order that varies continuously over thescale of a few atomic planes across the solid–liquid boundary[176].
An entropy factor, defined as ΔHm/kTm, can be used as aninternal parameter to indicate the likely smoothness of agrowing surface [177]. Highly anisotropic materials with highentropy factors such as TAGs (with ΔHm/kTm∼60) exhibitsmooth surfaces if the planes are densely packed, but planeswhich are much less densely packed can easily experienceroughening [5]. Hollander et al. [172] showed using AFM thatdifferent surfaces of a TAG under the same crystallization
conditions can grow by different mechanisms. The highlyasymmetric shape of TAG molecules causes different packingdensities in different crystal planes [178]. Accordingly, differentsurfaces of a TAG crystal can exhibit significantly differentsurface roughnesses so that the growth rates of different planesat the same conditions can differ greatly, resulting in needleshape crystals [179]. This is in contrast to other materials whichhave a relatively low entropy factor, and generally possessrough surfaces. The attachment of growth units is relativelyeasy in such cases and results in fast and unstable growth, forexample dendritic growth.
Two distinctly different mechanisms for roughening havebeen observed. “Thermal roughening” occurs when a surface isexposed above a particular temperature called the “rougheningtemperature” [161]. Above this temperature, growth units attachto the surface very quickly as they are more easily able toovercome the attachment energy. Alternatively, rough surfacescan be created at high crystallization driving forces, where masstransport is controlling, and growth units will easily attach ontothe crystal surface wherever they come into contact. This is wellknown as “kinetic roughening” [180]. As rough surfaces growmuch faster than smooth ones, in the frame of morphologydevelopment, the rough surfaces ultimately disappear and arenot observed in the final habit.
In multi-component systems there is competition betweensimilar TAG molecules for vacant sites, and thus the growthrates are generally slower than that of pure TAGs. Kellens etal. [181] observed that PPP/SSS mixtures with an equalcomposition of PPP and SSS had a half-time of crystallizationof the β′ solid solution in between those of pure PPP and pureSSS. Himawan et al. [182] confirmed this behaviour aftermeasuring growth rates using light microscopy (see Fig. 20).The exception to this rule is when molecular compounds areformed [2]. Takeuchi et al. [123], and Sato and Ueno [59]showed that the crystallization rate of molecular compounds inbinary TAG mixtures is significantly faster than the rates forpure components, presumably because steric hindrances aremuch reduced.
As mentioned previously, solid solutions of TAG moleculesare frequently formed especially in metastable polymorphs. Thecomposition can vary between the inner and outer regions of acrystal as higher melting TAGs preferentially deposit first anddiffusion rates in the solid phase are low, so that suchcomposition gradients persist. There is a further issue ofsegregation kinetics of TAG components during the growth ofTAG solid solutions. Kirwan and Pigford [183] presented anapproach to estimate the composition of a growing solidsolution from multi-component melts. They assumed spiralgrowth to be the growth mechanism and derived the segregationkinetics accordingly. Los and Floter [130] proposed a method toobtain kinetic phase diagrams for multi-component TAGsystems. The model was derived for growth at rough surfaces,thus using linear supersaturation dependency on crystal growth(linear kinetic segregation). Los et al. [144,145] showedsignificance differences between simulated equilibrium solidsolution compositions and those estimated when also includingkinetic factors. Subsequently, Los and Matovic [173] also

Fig. 22. A map of volume fractions of the various crystal morphologies uponisothermal crystallization of the POS/SOS system with different compositions(a) 75/25, (b) 50/50, (c) 25/75 [146]. Reprinted with permission from theAmerican Oil Chemists' Society.
25C. Himawan et al. / Advances in Colloid and Interface Science 122 (2006) 3–33
included the transport mechanisms into the kinetic expressionsand estimated the importance of mass and heat transfer ondifferent systems. However, experimental validation of thisprocedure has not been carried out.
The segregation issue, however, has been tackled inmetallurgy regarding the solidification of alloys. The definitionof thermodynamic driving forces and the segregation kineticshave been well developed in this field [184–186]. The challengeto apply such approaches to fat systems is still open.
3.1.6. Morphology of TAG crystalsThe overall morphology (shape) of a crystal is funda-
mentally determined by the relative growth rates of differentcrystal surfaces. The slower the advancement rate of acrystal surface, the higher the probability that the surfacewill have a large surface area in the final crystal habit. Asmentioned in the previous section, the anisotropic nature ofTAG crystals results in large differences in growth ratebetween surfaces.
TAG crystals of different polymorphs, as the term suggests,exhibit various morphologies. Under the microscope the α-formproduces an amorphous mass of very tiny crystals, the β′-formis generally a bulky shape or spherulitic, while the β-form isusually a needle shape [59]. Although it is often found that fatcrystals grow as spherulites, enormous variations can occurdepending on the crystallization conditions, even for the sameTAG system [95]. Fig. 22 shows morphology-maps depictingthe habit variations during the isothermal crystallization ofbinary TAG mixtures (POS/SOS) as functions of TAGcomposition and temperature [146].
Traditionally, the morphology of a crystal is estimated byemploying surface energy theories such as the Bravais-Friedel-Donnay-Harker (BFDH) theory [161,180], which assume thatthe crystal faces advance at rates proportional to their surfaceenergies. The equilibrium shape of a crystal is ultimatelyachieved when the total surface free energy of existing crystalsurfaces is minimised. The free energy of a surface can thus berelated to the distance between the face and the central point ofthe crystal body [6,187].
Alternatively, morphology can be predicted using theattachment energy as the growth-controlling parameter, as inthe Hartman-Perdok (HP) theory [180,188]. The attachmentenergy here represents the amount of energy that is lost when acrystal is cut along the plane of a crystallographic orientation.The growth rate of the plane of that orientation is assumed to beproportional to its attachment energy.
However, the surface energy and the attachment energymethods, which are solely based on thermodynamics (knowl-edge of crystal structure), have not been able to completelyexplain experimentally observed TAG crystal morphologies[178,189]. Hollander et al. [149,178] showed that the aspectratio of the needle β- and β′-forms of different saturated TAGsmodel systems was underestimated by the morphologyestimation procedure using the attachment energy.
Therefore in order to reproduce the experimentally observedmorphology of TAG crystals, the growth mechanism (kinetics)and roughness of each crystal surface must be taken into
account [149,178–180,190]. Fig. 23 shows a comparisonbetween experimental TAG morphologies and those estimatedfrom the surface energy theory (BFDH), the attachment energyalgorithm (HP), and the attachment energy algorithm combinedwith the Burton-Cabrera-Frank screw dislocation theory (HP-BCF) [161] for the β′-form of PSP and for the β-form of PPP.Clearly, kinetic factors are predominant since the experimentalmorphologies are much better predicted by the latest methods.The application of this approach for multi-component fats,however, is a challenge.
3.1.7. Spherulitic growthIn most cases, pure TAGs and mixtures of TAGs grow as
spherulites. A spherulite is an aggregate made up of manycrystalline ribbons that grow radially from the same centralnucleus (Fig. 24) [148,149]. The ribbons that build up the

Fig. 23. Morphology of the β-form of PPP and the β′-form of PSP as (i)calculated using the surface energy theory (BFDH), (ii) calculated using theattachment energy theory (HP), (iii) calculated by means of the attachmentenergy combined with screw dislocation growth mechanism (HP-BCF), and (iv)observed from experiments [172].
26 C. Himawan et al. / Advances in Colloid and Interface Science 122 (2006) 3–33
spherulite are in many cases needle-like (Fig. 24a). The reasonsfor this morphology to exist in TAGs have been discussedearlier. Often irregular structures are observed where somedistortions are possible and the interface with the liquid may bediffuse (see Fig. 24b).
The difference between the morphologies of the TAGspherulites shown in Fig. 24 is due to differences in themagnitude of the driving force, which causes changes to themechanism of the secondary nucleation of crystal layers. At lowto moderate driving force the progression of the front is layer bylayer. This means secondary nucleation is slow enough toensure that one layer is completed before the next layer iscreated (Fig. 24a). Higher driving forces can induce rougher
Fig. 24. Spherulites of β′-polymorph crystallized from 30%-w SSS of PPP/SSS binaacross [182].
surfaces where the completion of a layer is not necessary, thussecondary nucleation can occur simultaneously in differentlayers resulting in more diffuse structures (Fig. 24b).
The spherulitic growth of TAGs can be described by theHoffman-Lauritsen or surface nucleation theory that has beenwidely applied to polymer crystallization [191]. The modelassumes that the progression of the spherulite front is controlledby secondary nucleation at the frontal surfaces of thespherulites. The relation between the spherulitic growth rateand the driving force is given by:
Rspherulite ¼ R0exp −U⁎
RðT−TlÞ� �
exp −KR
TðTm−TÞ� �
ð24Þ
where Rspherulite is the linear growth rate of the spherulite, R0
is the pre-exponential factor, U⁎ is the activation energyrelated to entropy and diffusion barriers (equivalent to ΔGdiff
in Fisher-Turnbull equation, see Eq. (22)), T∞ is a hypotheticaltemperature where the motion associated with viscous flowceases, and KR is the kinetic parameter. A linear correlation isobtained when plotting lnRspherulite versus 1/T(Tm−T), whichassumes a relatively constant value of [lnRo−U⁎/R(T−T∞)].Both Rousset et al. [146,148] and Himawan et al. [182] haveused this equation to model TAG spherulitic growth. Fig. 25shows the equation applied to the PPP/SSS system showingtwo different correlating fits arising from the differentnucleation mechanisms (and morphologies) at different drivingforces.
3.1.8. Polymorphic transformationTransformations between phases (liquid, α, β′, and β) are an
important factor in the processing and storage of fats (seeIntroduction). As fats exhibit monotropic polymorphism, thetransformation among polymorphs is irreversible in thedirection of less stable to more stable phases. This can proceedvia a solid–solid or a melt-mediated transformation.
The solid–solid transformation mechanism in fat systems isstill poorly understood. Hagemman [20] suggested that thechange from the vertical α-form to the tilted β′-form issuspected to occur via a collapse of hydrocarbon chains or from
ry mixture at (a) 52.5 °C, (b) 49 °C. The field of view of the pictures is 200 μm

Fig. 25. The application of the Hoffman-Lauritzen theory to model spherulitegrowth in 30/70 PPP/SSS mixtures. The units of Rspherulite are 10−3 μm s−1
[182]. Two different fits are possible depending on morphology, resulting fromdifferent nucleation mechanisms at different driving forces.
27C. Himawan et al. / Advances in Colloid and Interface Science 122 (2006) 3–33
a bending of each molecule in the glycerol region. Dafler [152]interpreted his DSC data to suggest a two step mechanismduring the β′- to β-form transformation. The first part, which isfast, may be regarded as a thermally activated process; thesecond, slower, process is speculated to be dependent on theconcentration of the β-form already present. Due to the morerestricted molecular arrangement in the solid state the rate ofthis transformation mode is much slower than that of melt-mediated transformations.
Melt-mediated crystallization can be viewed as the meltingof the less stable form followed by the subsequent nucleationand growth of the more stable forms. Mass transfer occurs in theliquid formed by the melting of the less stable form [24]. Theseevents most probably occur concurrently within a sample whichmakes it difficult to measure them separately.
Traditionally, DSC is used for characterising polymorphictransformations, but recently synchrotron radiation (SR) XRDhas been applied to pure TAG systems [66,93,94,110], binaryTAG mixtures [120–122,192], and natural fats [12,44–46].This has been able to provide molecular-level insights of thepolymorphic transformation of fats. A review on this subjectcan be found in Sato and Ueno [59].
Kellens et al. [93,192] presented SR-XRD spectra of the meltmediated polymorphic transformation from the α-form into theβ-form in a pure PPP system. During the α→β transformation,the β′-form could be seen for a very short time. This is barelydetectable by DSC, although this is more obvious in mixtures ofPPP and SSS [181,193]. SR-XRD was also able to show thesequential ordering in the β-form subcell arrangement fromtime lags between the appearance of the three XRD spacingsassociated with the β-form.
Ueno et al. [66,110] studied the melt-mediated transforma-tion of SOS, and found out that the presence of the double bond
in SOS significantly increased the complexity of the transfor-mation. Of particular interest was that:
• During the transformation from the α-form into the γ- or β′-forms, the SR-XRD long spacing spectra occurred earlierthan the short spacing spectra. This indicated that theformation of lamellar ordering occurred more rapidly thanthat of subcell packing. The time lags between the spectrabecame shorter for the less stable polymorphs (for instancefor the γ-form compared to the β′-form).
• Liquid crystal phases were observed if a very rapid melt-mediated transformation occurred from the α-form to theβ′-form.
It is implied from observations in the PPP and SOS systemsthat there are potentially enormous variations of mechanismduring the melt-mediated polymorphic transformation of fats.
A number of researchers have reported that the crystal-lization rate, for instance, of the β′-form, from the melt of theα-form (the α-melt) is much faster than that from thesupercooled melt. The explanations, however, vary. Someworkers argued that this is due to a molecular arrangement inthe liquid phase [20,194]. Hagemman [20] reported that thetuning-fork conformation of TAGs associated with the lamellararrangement already exists above the melting temperature.Relaxation data on primary glycerol carbons of a rapidlyheated α-form were different from those from an undercooledliquid at the same temperature. Another possibility is that non-melted high melting TAGs may act as seed materials,accelerating the crystallization rate of the more stable phase[195]. For some fats involving unsaturated moieties, it has alsobeen suggested that liquid crystalline phases might be involved[66–68,110,196].
3.2. Measurement of fat crystallization kinetics
In order to characterise crystallization kinetics, nucleationand crystal growth rates should ideally be measuredseparately. Neither nucleation nor growth rate measurementsare straightforward in TAGs. Only a few attempts to directlymeasure nucleation and growth rates have been reported[31,146,154,197]. Inadequate resolution of existing instru-ments to identify solid particles at the length scale of nucleilimits nucleation rate measurements, whilst the irregularityand aggregative form of TAG crystal morphologies hampersaccurate crystal growth rate characterization. This remains amajor challenge in the characterization of lipid crystallization[198].
3.2.1. Induction time and nucleation rateThe induction time, tind, has been regularly chosen as a
mean of characterising the crystallization kinetics of TAGs andfats in general [55,92,198–200]. A diverse range of measure-ment techniques have been employed to measure tind rangingfrom DSC [28], light transmittance [201], turbidimetry [198],pulsed nuclear magnetic resonance [198], laser-polarised lightturbidimetry [33,202], polarised light microscopy (PLM)

Fig. 26. Inverse induction times for the crystallization of PPP polymorphs. Themelting temperatures of the polymorphs are indicated (αm, βm′, βm) [92].Reprinted with permission from the American Oil Chemists' Society.
28 C. Himawan et al. / Advances in Colloid and Interface Science 122 (2006) 3–33
[171,200,203], viscometry [27], PLM supplemented by a CdSphoto sensor [106,199], and diffusive light scattering (DLS)[30]. PLM and DLS are considered to be the most sensitive.This does not guarantee, however, that the measured tindreflects the real induction time since, for instance, the smallestidentifiable crystal by PLM is approximately 0.2 μm [200],while Timms [151] has estimated that the nuclei critical size isabout 0.01 and 0.001 μm at 3 and 7 °C supercooling,respectively.
Measured tind values thus depend on the instrumentemployed. They have also been interpreted in one of twoways. Some investigators regard tind to contain both nucleationand growth information: tind≅ tnucl+ tgrowth. In this sense, tind isthe total time needed to form the nuclei and then to grow to asize, which is observable by the instruments used, and as suchis often used as a representative measure of the overallcrystallization kinetics. Example data are shown in Fig. 26from Sato and Kuroda [92] who used PLM with a CdS sensorto measure induction times for PPP at various isothermaltemperatures. This shows fast, intermediate, and slow kineticsfor α, β′, and β polymorphs, respectively, and reflectsOstwald's rule whereby nucleation favours the least stablepolymorphs. Similar findings were obtained for POP and SOS[106], and in POS [199]. The induction time has also beenutilized for comparing the rates of melt and melt-mediatedcrystallizations.
Other researchers assume that tind predominantly representsthe nucleation rate. Takeuchi et al. [123] for instance interpretedtind as nucleation dominated and used it to qualitatively showthe faster nucleation of the α-form of the SOS/SSO molecularcompound compared to pure αSOS and αSSO. Frequently, tind iscorrelated inversely with the expression for nucleation rate, J,from the Fisher-Turnbull relation (see Eq. (22)). CombiningEqs. (20) and (23) results in:
tind ¼ hNAkT
expDGdiff⁎kT
� �exp
163
pr3V 2mT
2m
kTðDHmDTÞ2f hð Þ
!
ð25ÞA further assumption for TAG systems is that the main barrier
to diffusion is entropic and arises from molecular conformationissues (i.e. ΔT is moderate or even low, but the flexibility of thethree fatty acid chains is enormous) leading to ΔGdiff⁎/kT=α-SΔS/R. Rearranging Eq. (25) results in:
Ttind ¼ hNAk
expaSDSR
� �exp
163
pr3V 2mT
2m
kTðDHmDTÞ2f hð Þ
!ð26Þ
Thus from a plot of ln(Ttind) against 1/T(ΔT)2, a slope, sind,can be obtained which allows the estimation of the activationenergy of nucleation from ΔGnucl=ΔGhom⁎ f (θ)= simdk/(ΔT)2.However, this approach has weak theoretical and practicalfoundations when considering that (i) the Fisher-Turnbullequation was derived for pure systems and (ii) the inductiontime is a physically distinct phenomenon from nucleation rate.Nevertheless, it is commonly applied to characterize the
nucleation kinetics of natural fats such as palm and othervegetable oils [26–30,171,203], cocoa butter [46,49], and milkfat [37,39,40,43,53]. Using this approach, ΔGnucl values wereestimated and used to illuminate the significant differences innucleation energy barriers between polymorphic forms. Sur-prisingly, there have been few attempts to apply such a methodto pure TAGs or well-defined TAG mixtures. We recentlyperformed such an attempt for the PPP/SSS mixtures as shownin Fig. 27, which resulted in a much larger value of energybarrier for the β form compared to the β′ form [127].
It should be noted that the use of tind for kineticcharacterization is also limited to a certain range of isothermalcrystallization temperatures, as below a certain temperature thetind value becomes so short that isothermal conditions cannot beestablished in the sample before nucleation begins [200]. This isespecially true for the α-form crystallization [127]. Non-isothermal crystallization methods have been introduced to tryto characterize the crystallization kinetics of this polymorph[150,193,204].
3.2.2. Overall crystallization ratesA plot of total solid content versus time during an isothermal
crystallization of fats exhibits a sigmoidal shape [205]. This is aresult of simultaneous nucleation, growth and the so-calledimpingement effect, i.e. the colliding of growing crystal faces ofneighbouring crystals that slows down growth and thus theoverall crystallization process. Nucleation is the predominantevent at the initial stage, growth in the following stage, butimpingement is the predominant factor towards the end of thecrystallization process [155].
In order to describe properly the whole crystallizationprocess, each event must be well-characterised. However, it isdifficult to measure these overlapping events separately. Theoverall sigmoidal curve is reasonably quantifiable using variousmeasurement techniques such as DSC, pulsed NMR, turbidity,time resolved XRD, viscosity change, and ultrasound velocitymeasurements (see reviews in Foubert et al. [205] andMarangoni [15]). Hence, the characterisation of crystallization
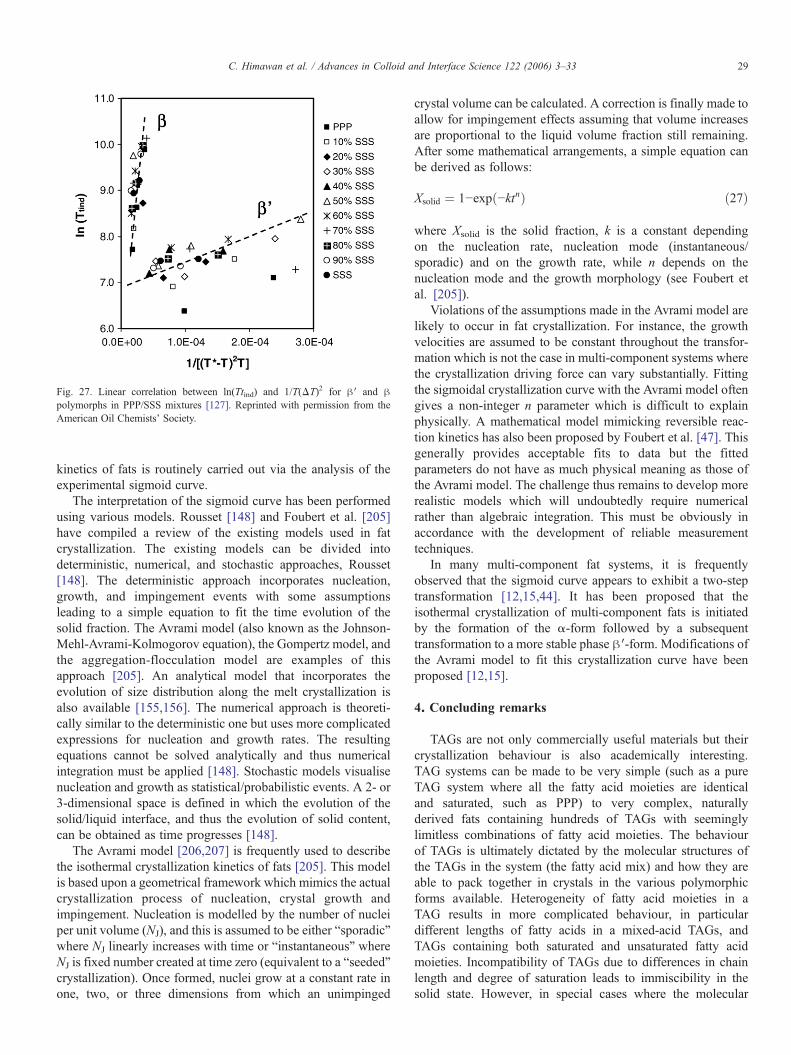
Fig. 27. Linear correlation between ln(Ttind) and 1/T(ΔT)2 for β′ and βpolymorphs in PPP/SSS mixtures [127]. Reprinted with permission from theAmerican Oil Chemists' Society.
29C. Himawan et al. / Advances in Colloid and Interface Science 122 (2006) 3–33
kinetics of fats is routinely carried out via the analysis of theexperimental sigmoid curve.
The interpretation of the sigmoid curve has been performedusing various models. Rousset [148] and Foubert et al. [205]have compiled a review of the existing models used in fatcrystallization. The existing models can be divided intodeterministic, numerical, and stochastic approaches, Rousset[148]. The deterministic approach incorporates nucleation,growth, and impingement events with some assumptionsleading to a simple equation to fit the time evolution of thesolid fraction. The Avrami model (also known as the Johnson-Mehl-Avrami-Kolmogorov equation), the Gompertz model, andthe aggregation-flocculation model are examples of thisapproach [205]. An analytical model that incorporates theevolution of size distribution along the melt crystallization isalso available [155,156]. The numerical approach is theoreti-cally similar to the deterministic one but uses more complicatedexpressions for nucleation and growth rates. The resultingequations cannot be solved analytically and thus numericalintegration must be applied [148]. Stochastic models visualisenucleation and growth as statistical/probabilistic events. A 2- or3-dimensional space is defined in which the evolution of thesolid/liquid interface, and thus the evolution of solid content,can be obtained as time progresses [148].
The Avrami model [206,207] is frequently used to describethe isothermal crystallization kinetics of fats [205]. This modelis based upon a geometrical framework which mimics the actualcrystallization process of nucleation, crystal growth andimpingement. Nucleation is modelled by the number of nucleiper unit volume (NJ), and this is assumed to be either “sporadic”where NJ linearly increases with time or “instantaneous” whereNJ is fixed number created at time zero (equivalent to a “seeded”crystallization). Once formed, nuclei grow at a constant rate inone, two, or three dimensions from which an unimpinged
crystal volume can be calculated. A correction is finally made toallow for impingement effects assuming that volume increasesare proportional to the liquid volume fraction still remaining.After some mathematical arrangements, a simple equation canbe derived as follows:
Xsolid ¼ 1−expð−ktnÞ ð27Þ
where Xsolid is the solid fraction, k is a constant dependingon the nucleation rate, nucleation mode (instantaneous/sporadic) and on the growth rate, while n depends on thenucleation mode and the growth morphology (see Foubert etal. [205]).
Violations of the assumptions made in the Avrami model arelikely to occur in fat crystallization. For instance, the growthvelocities are assumed to be constant throughout the transfor-mation which is not the case in multi-component systems wherethe crystallization driving force can vary substantially. Fittingthe sigmoidal crystallization curve with the Avrami model oftengives a non-integer n parameter which is difficult to explainphysically. A mathematical model mimicking reversible reac-tion kinetics has also been proposed by Foubert et al. [47]. Thisgenerally provides acceptable fits to data but the fittedparameters do not have as much physical meaning as those ofthe Avrami model. The challenge thus remains to develop morerealistic models which will undoubtedly require numericalrather than algebraic integration. This must be obviously inaccordance with the development of reliable measurementtechniques.
In many multi-component fat systems, it is frequentlyobserved that the sigmoid curve appears to exhibit a two-steptransformation [12,15,44]. It has been proposed that theisothermal crystallization of multi-component fats is initiatedby the formation of the α-form followed by a subsequenttransformation to a more stable phase β′-form. Modifications ofthe Avrami model to fit this crystallization curve have beenproposed [12,15].
4. Concluding remarks
TAGs are not only commercially useful materials but theircrystallization behaviour is also academically interesting.TAG systems can be made to be very simple (such as a pureTAG system where all the fatty acid moieties are identicaland saturated, such as PPP) to very complex, naturallyderived fats containing hundreds of TAGs with seeminglylimitless combinations of fatty acid moieties. The behaviourof TAGs is ultimately dictated by the molecular structures ofthe TAGs in the system (the fatty acid mix) and how they areable to pack together in crystals in the various polymorphicforms available. Heterogeneity of fatty acid moieties in aTAG results in more complicated behaviour, in particulardifferent lengths of fatty acids in a mixed-acid TAGs, andTAGs containing both saturated and unsaturated fatty acidmoieties. Incompatibility of TAGs due to differences in chainlength and degree of saturation leads to immiscibility in thesolid state. However, in special cases where the molecular

30 C. Himawan et al. / Advances in Colloid and Interface Science 122 (2006) 3–33
shape of TAG components is compatible to each other, chain-chain interactions can provoke the formation of molecularcompounds at a composition of 50/50.
Both thermodynamic and kinetic aspects need to beconsidered to gain a full understanding of fat crystallizationbehaviour, and it is useful to be able to classify behaviouraccording to whether they are caused by thermodynamics,kinetics or both.
Thermodynamics is able to establish the stability (or meta-stability) of different polymorphs, and the miscibility orimmiscibility of different TAGs in mixed crystals. It alsoenables the driving force for crystallization to be quantified,which provides a benchmark for the modelling of nucleationand growth rates and the surface roughness of crystals. To dateeither supersaturation or supercooling has generally been usedfor this purpose, but for fat systems which display an almostcontinuous spectrum of melting points a definition based uponthe rigorous expression for chemical potential differences(using pure component melting data and activity coefficients)is required to model individual driving forces for eachcomponent. Only a very limited number of studies can befound regarding the description of solid–liquid equilibria ofpolymorphic systems via activity coefficient expressions. Thisis largely also due to the lack of reliable experimental data forthe estimation of thermodynamic parameters.
Kinetics is however required to explain many otherphenomena, apart from the obvious practical consideration ofthe timescale over which crystallization proceeds. Polymorphicoccurrence, for example, cannot be explained by thermody-namics which would always predict the most stable polymorphto be formed. Instead it is governed by the kinetics of thepolymorph which is able to nucleate first. Kinetics factors alsodictate the relative advancement rates of different crystalsurfaces and thus the overall crystal morphology.
Although our understanding of fat crystallization is extensivethere remain many gaps in our knowledge. Much of this is dueto our inability of make precise measurements of the nucleationand crystal growth rates of TAGs. This is partially solved by thedetermination of overall crystallization kinetics and the use ofmodels such as the Avrami equation, but the assumption that thedriving force, nucleation and crystal growth rates do not vary isoften too simplistic. It is additionally worth stating that in anumber of industrial applications fat crystallization occurs indispersions (emulsions) which introduces its own complications[208–211].
In nucleation studies, induction time measurements arecommonly made, whereas nucleation rates (the number ofnuclei appearing per unit time and per unit volume) are seldommeasured. It is often assumed that induction times represent thereciprocal of the nucleation rate despite the fact that they aredistinctly different physical phenomena.
Spherulitic growth is common in TAGs but crystal growthmechanisms are not well understood. Most of the work in thepast has assumed that surface integration kinetics aredominant, yet more recent data have shown the importanceof transport processes. A general theory is not yet currentlyavailable.
The segregation of components during the growth ofTAGs solid solutions needs to be investigated in order todescribe properly the growth and overall crystallizationkinetics of TAGs. This requires some method of followingthe crystallization of individual components in fats. This isdifficult as TAGs are chemically very similar to one another.Other than retrospective analyses of fractionation experi-ments few studies have investigated this aspect of fatcrystallization.
A great deal has been learned about the crystallizationbehaviour of fats in the past half century, but it is clear that muchremains to be achieved. For example, food engineers do nothave access to the sort of simulation software which designersof distillation columns are now routinely able to turn to,whereby merely entering the composition of an input streamand a choice of processing parameters allows a completesimulation of a process to be made via vapour–liquidequilibrium calculations. A similar tool to predict solid–liquidequilibria in fat crystallization processes, in which TAGcomposition of a fat blend is entered in a similar fashionalong with process conditions, is still a long way off. Although,the theoretical framework for the equilibrium phase behaviourof binary systems is now well established, this still needs to beextended and properly validated for multi-component systems.These solid–liquid equilibria can (in theory) be handled in ananalogous manner to vapour–liquid equilibria in distillationcolumn simulators, and it is quite feasible (again, in theory) toextend the database to cover the various different fat interactionparameters required.
However, as already mentioned, a proper model of fatcrystallization will need to extend beyond that of solelypredicting phase equilibria if it is to be a truly useful tool, asthe kinetic aspects of nucleation and growth also need to betaken into account. An additional consideration is how manyof the hundreds of different TAG and non-TAG componentspresent in natural fats need to be included in a workingmodel, or can one make do with grouping many of the lessabundant components into “pseudo-components” withoutcausing problems? Trace components can cause problems innucleation, for example, which is liable to be heavilyinfluenced by small quantities of high melting fats whichact as seed crystals and it may be difficult to establish theirpresence by analytical techniques. The surface integration ofmolecules into growing crystals can similarly be upset bysmall quantities of impurities. Add to that the need to predictpolymorphic occurrence, inter-polymorphic transformations (ifany), crystal morphology and size distribution and one canreadily conclude that such a model would need to be highlysophisticated.
Nomenclature
AbbreviationsAFM Atomic Force MicroscopyBCF Burton-Cabrera-FrankBFDH Bravais-Friedel-Donnay-HarkerDLS Diffusive Light Scattering

31C. Himawan et al. / Advances in Colloid and Interface Science 122 (2006) 3–33
DSC Differential Scanning CalorimetryFTIR Fourier Transform Infra RedHP Hartman-PerdokNMR Nuclear Magnetic ResonancePLM Polarised Light MicroscopySFC Solid Fraction ContentSR-XRD Synchrotron Radiation X-ray DiffractionTAGs TriacylglycerolsXRD X-ray diffraction
Symbols
Aij Binary parameters in the 3-suffix Margules equation – G Gibbs free energy J mol−1H
Enthalpy J mol−1h
Planck constant J s Jhom Homogeneous nucleation rate # m−3 s−1k
Boltzmann constant J K−1KR
Kinetic parameter in the Lauritsen-Hoffmanequation of spherulite growth rateJ mol−1
NA
Avogadro number # mol−1NJ
Number of nuclei per unit volume # m−3P
Pressure kPa R Universal gas constant, (8.314 J mol−1K−1) J mol−1 K−1r
Cluster radius m r⁎ Critical radius m Ro Pre-exponential factor in Lauritsen-Hoffmanequation of spherulite growth rate
–Rspherulite
Linear growth rate of spherulite m s−1S
Entropy J mol−1 K−1sind
Slope in the determination of ΔGnuclT
Temperature K tind Induction time s Tm Melting temperature K U⁎ Activation energy related to entropy and diffusionbarriers in the Lauritsen-Hoffman equation
J mol−1V
Volume m3Vm
Molar volume of clusters in the nucleation theory m3xip
Mole fraction of component i in phase p – Xsolid Solid fraction –Greeks
αS Fraction of molecules in the melt withsuitable conformation to incorporate to the surfaceof a growing nuclei
–
γip
Activity coefficient of component i in phase p –μip
Chemical potential of component i in phase p J mol−1σ
Surface energy J mol−1 m−2θ
Wetting characteristics of foreign solid impuritiesby the supercooled melts–
ΔCpi
Molar heat capacity difference between liquid andsolid for component iJ mol−1 K−1
ΔG
Free energy difference J mol−1ΔGdiff
Activation energy related to diffusion barriers J ΔGE Excess free energy difference J mol−1ΔGhet⁎
The critical free energy (the activation free energy)of heterogeneous nucleationJ
ΔGhom⁎
The critical free energy (the activation free energy)of homogeneous nucleationJ
ΔGnucl
The activation energy of nucleation J mol−1ΔGS
The surface free energy J m−2ΔGV
The volume free energy J m−3ΔH
Enthalpy difference J mol−1ΔHm
Melting enthalpy J mol−1ΔS
Entropy difference J mol−1 K−1ΔSm
Melting entropy J mol−1 K−1ΔT
Supercooling, Tm−T KAcknowledgements
The authors wish to acknowledge and thank the BBSRC(UK) for funding this work (grant reference D20450).
References
[1] Gunstone FD, Padley FB. Lipid technologies and applications. NewYork: Marcel Dekker; 1997.
[2] Walstra P, Kloek W, van Vliet T. In: Sato K, Garti N, editors.Crystallization processes in fats and lipid systems. New York: MarcelDekker; 2001. p. 289.
[3] Higaki K, Koyano T, Hachiya I, Sato K. Food Res Int 2004;37:2.[4] de Man JM, de Man L. In: Widlak N, Hartel R, Narine SS, editors.
Crystallization and solidification properties of lipids. Illinois: AOCSPress; 2001. p. 225.
[5] Ghotra BS, Dyal SD, Narine SS. Food Res Int 2002;35:1015.[6] Aquilano D, Sgualdino G. In: Sato K, Garti N, editors. Crystallization
processes in fats and lipid systems. New York: Marcel Dekker; 2001. p. 1.[7] Myerson AS. Handbook of industrial crystallization. Boston: Butter-
worth-Heinemann; 2002.[8] Stapley AGF, Tewkesbury H, Fryer PJ. J Am Oil Chem Soc 1999;76:677.[9] Bolliger S, Breitschuh B, Stranzinger M, Wagner T, Windhab EJ. J Food
Eng 1998;35:281.[10] Bolliger S, Zeng YT, Windhab EJ. J Am Oil Chem Soc 1999;76:659.[11] Mazzanti G, Guthrie SE, Sirota EB, Marangoni AG, Idziak SHJ. Cryst
Growth Des 2003;3:721.[12] Mazzanti G, Marangoni AG, Idziak SHJ. Phys Rev, E 2005;71:041607.[13] Narine SS, Marangoni AG. Food Res Int 1999;32:227.[14] Marangoni AG, Narine SS. Food Res Int 2002;35:957.[15] Marangoni AG. Fat crystal networks. New York: Marcel Dekker; 2004.[16] Timms RE. Eur J Lipid Sci Technol 2005;107:48.[17] Hamm W. Fette Seifen Anstrichm 1986;88:533.[18] Small DM. In: Hanahan DJ, editor. The physical chemistry of lipids, from
alkanes to phospholipids, handbook of lipid research series. New York:Plenum Press; 1986. p. 475.
[19] Chapman D. Chem Rev 1962;62:433.[20] Hagemann JW. In: Garti N, Sato K, editors. Crystallization and
polymorphism of fats and fatty acids. New York: Marcel Dekker; 1988.p. 9.
[21] Larsson K. Acta Chem Scand 1966;20:2255.[22] Hernqvist L. In: Garti N, Sato K, editors. Crystallization and
polymorhism of fats and fatty acids. New York: Marcel Dekker; 1988.p. 97.
[23] Wesdorp LH, Liquid-Multiple Solid Phase Equilibria in Fats, PhDdissertation, Delft University of Technology; 1990.
[24] Sato K. Fett-Lipid 1999;101:467.[25] Singh AP, Bertoli C, Rousset PR, Marangoni AG. J Agric Food Chem
2004;52:1551.[26] Litwinenko JW, Rojas AM, Gerschenson LN, Marangoni AG. J Am Oil
Chem Soc 2002;79:647.[27] Chen CW, Lai OM, Ghazali HM, Chong CL. J Am Oil Chem Soc
2002;79:403.[28] Toro-Vazquez JE, Briceno-Montelongo M, Dibildox-Alvarado E, Charo-
Alonso M, Reyes-Hernandez J. J Am Oil Chem Soc 2000;77:297.[29] Toro-Vazquez JE, Dibildox-Alvarado E, Charo-Alonso M, Herrera-
Coronado V, Gomez-Aldapa CA. J Am Oil Chem Soc 2002;79:855.[30] Toro-Vazquez J, Herrera-Coronado V, Dibildox-Alvarado E, Charo-
Alonso M, Gomez-Aldapa C. J Food Sci 2002;67:1057.[31] Kloek W, Walstra P, van Vliet T. J Am Oil Chem Soc 2000;77:389.[32] Siew WL, Ng WL. J Sci Food Agric 1999;79:722.[33] Herrera ML, Falabella C, Melgarejo M, Anon MC. J Am Oil Chem Soc
1998;75:1273.[34] Litwinenko JW, Singh AP, Marangoni AG. Cryst Growth Des
2004;4:161.[35] Mazzanti G, Guthrie SE, Sirota EB, Marangoni AG, Idziak SHJ. Cryst
Growth Des 2004;4:1303.
32 C. Himawan et al. / Advances in Colloid and Interface Science 122 (2006) 3–33
[36] Liang BM, Shi YP, Hartel RW. J Am Oil Chem Soc 2003;80:301.[37] Breitschuh B, Floter E. Eur J Lipid Sci Technol 2002;104:713.[38] Shi Y, Smith CM, Hartel RW. J Dairy Sci 2001;84:2392.[39] Herrera ML, Gatti MD, Hartel RW. Food Res Int 1999;32:289.[40] Herrera ML, Hartel RW. J Am Oil Chem Soc 2000;77:1177.[41] Herrera ML, Hartel RW. J Am Oil Chem Soc 2000;77:1197.[42] Wright AJ, Hartel RW, Narine SS, Marangoni AG. J Am Oil Chem Soc
2000;77:463.[43] Wright AJ, Marangoni AG. J Am Oil Chem Soc 2002;79:395.[44] Dewettinck K, Foubert I, Basiura M, Goderis B. Cryst Growth Des
2004;4:1295.[45] MacMillan SD, Roberts KJ, Rossi A, Wells MA, PolgreenMC, Smith IH.
Cryst Growth Des 2002;2:221.[46] MacMillan SD, Roberts KJ, Wells MA, Polgreen MC, Smith IH. Cryst
Growth Des 2003;3:117.[47] Foubert I, Vanrolleghem PA, Vanhoutte B, Dewettinck K. Food Res Int
2002;35:945.[48] Higaki K, Ueno S, Koyano T, Sato K. J Am Oil Chem Soc 2001;78:513.[49] Marangoni AG, McGauley SE. Cryst Growth Des 2003;3:95.[50] Smith KW. In: Garti N, Sato K, editors. Crystallization processes in fats
and lipid systems. New York: Marcel Dekker; 2001. p. 357.[51] Hartel RW, Kaylegian KE. In: Garti N, Sato K, editors. Crystallization
processes in fats and lipid systems. New York: Marcel Dekker; 2001. p.381.
[52] Sato K, Koyano T. In: Garti N, Sato K, editors. Crystallization processesin fats and lipid systems. New York: Marcel Dekker; 2001. p. 429.
[53] Cerdeira M, Martini S, Hartel RW, Herrera ML. J Agric Food Chem2003;51:6550.
[54] Puppo MC, Martini S, Hartel RW, Herrera ML. J Food Sci 2002;67:3419.[55] Martini S, Herrera ML, Hartel RW. J Agric Food Chem 2001;49:3223.[56] Martini S, Herrera ML, Hartel RW. J Am Oil Chem Soc 2002;79:1063.[57] Tietz RA, Hartel RW. J Am Oil Chem Soc 2000;77:763.[58] Metin S, Hartel RW. J Am Oil Chem Soc 1998;75:1617.[59] Sato K, Ueno S. In: Garti N, Sato K, editors. Crystallization processes in
fats and lipid systems. New York: Marcel Dekker; 2001. p. 177.[60] Bruin S. Fluid Phase Equilib 1999;160:657.[61] Bockisch M. Fats and oils handbook. Champaign, Illinois: AOCS Press;
1998.[62] Gunstone FD. The chemistry of oils and fats. Oxford: Blackwell; 2004.[63] Gunstone FD. Vegetable oils in food technology: composition, properties
and uses. Oxford: Blackwell; 2002.[64] Sato K. In: Garti N, Sato K, editors. Crystallization and polymorphism of
fats and fatty acids. New York: Marcel Dekker; 1988. p. 227.[65] Avramov I, Russel C, Avramova K. J Non-Cryst Solids 2004;337:220.[66] Ueno S, Minato A, Seto H, Amemiya Y, Sato K. J Phys Chem, B
1997;101:6847.[67] Gibon V, Durant F, Deroanne C. J Am Oil Chem Soc 1986;63:1047.[68] Lavigne F, Bourgaux C, Ollivon M. J Phys (Paris) 1993;3:137.[69] Rodriguez-Spong B, Price CP, Jayasankar A, Matzger AJ, Rodriguez-
Hornedo N. Adv Drug Deliv Rev 2004;56:241.[70] Katritzky AR, Jain R, Lomaka A, Petrukhin R, Maran U, Karelson M.
Cryst Growth Des 2001;1:261.[71] Abramowitz R, Yalkowsky SH. Pharm Res 1990;7:942.[72] Charton M, Charton B. J Phys Org Chem 1994;7:196.[73] Katritzky AR, Gordeeva EV. J Chem Inf Comput Sci 1993;33:835.[74] Chickos JS, Nichols G. J Chem Eng Data 2001;46:562.[75] Dannenfelser RM, Yalkowsky SH. Ind Eng Chem Res 1996;35:1483.[76] Zhao LW, Yalkowsky SH. Ind Eng Chem Res 1999;38:3581.[77] Jain A, Yang G, Yalkowsky SH. Ind Eng Chem Res 2004;43:4376.[78] Jain A, Yang G, Yalkowsky SH. Ind Eng Chem Res 2004;43:7618.[79] Vladimirov PV, Borodin VA. J Non-Cryst Solids 1999;252:591.[80] Tsuchiya Y, Hasegawa H, Iwatsubo T. J Chem Phys 2001;114:2484.[81] Herwig KW, Wu Z, Dai P, Taub H, Hansen FY. J Chem Phys
1997;107:5186.[82] March NH. Phys, B Condens Matter 1999;265:24.[83] Pinal R. Org Biomol Chem 2004;2:2692.[84] Wei J. Ind Eng Chem Res 1999;38:5019.[85] Timms RE. Chem Phys Lipids 1978;21:113.
[86] Zacharis HM. Chem Phys Lipids 1977;18:221.[87] Perron R. Rev Fr Corps Gras 1982;29:3.[88] Perron RR. Rev Fr Corps Gras 1986;33:195.[89] Won KW. Fluid Phase Equilib 1993;82:251.[90] Zeberg-Mikkelsen CK, Stenby EH. Fluid Phase Equilib 1999;162:7.[91] Sum AK, Biddy MJ, de Pablo JJ, Tupy MJ. J Phys Chem, B
2003;107:14443.[92] Sato K, Kuroda T. J Am Oil Chem Soc 1987;64:124.[93] Kellens M, Meeussen W, Riekel C, Reynaers H. Chem Phys Lipids
1990;52:79.[94] Kellens M, Meeussen W, Gehrke R, Reynaers H. Chem Phys Lipids
1991;58:131.[95] Kellens M, Meeussen W, Reynaers H. J Am Oil Chem Soc 1992;69:906.[96] Desmedt A, Culot C, Deroanne C, Durant F, Gibon V. J Am Oil Chem
Soc 1990;67:653.[97] Arishima T, Sato K. J Am Oil Chem Soc 1989;66:1614.[98] Lutton ES, Stewart CB. Lipids 1970;5:545.[99] Hagemann JW, Rothfus JA. J Am Oil Chem Soc 1983;60:1123.[100] Kodali DR, Atkinson D, Redgrave TG, Small DM. J Am Oil Chem Soc
1984;61:1078.[101] Kodali DR, Atkinson D, Small DM. J Phys Chem 1989;93:4683.[102] Kodali DR, Atkinson D, Small DM. J Lipid Res 1990;31:1853.[103] van Langevelde A, van Malssen K, Sonneveld E, Peschar R, Schenk H.
J Am Oil Chem Soc 1999;76:603.[104] van de Streek J, Verwer P, de Gelder R, Hollander F. J Am Oil Chem Soc
1999;76:1333.[105] Koyano T, Hachiya I, Mori H, Arishima T, Sato K. J Am Oil Chem Soc
1988;65:475.[106] Koyano T, Hachiya I, Arishima T, Sato K, Sagi N. J Am Oil Chem Soc
1989;66:675.[107] Arishima T, Sagi N, Mori H, Sato K. J Am Oil Chem Soc 1991;68:710.[108] Sato K, Arishima T, Wang ZH, Ojima K, Sagi N, Mori H. J Am Oil Chem
Soc 1989;66:664.[109] Yano J, Ueno S, Sato K, Arishima T, Sagi N, Kaneko F, et al. J Phys
Chem 1993;97:12967.[110] Ueno S, Minato A, Yano J, Sato K. J Cryst Growth 1999;199:1326.[111] Boubekri K, Yano J, Ueno S, Sato K. J Am Oil Chem Soc 1999;76:949.[112] Takeuchi M, Ueno S, Yano J, Floter E, Sato K. J Am Oil Chem Soc
2000;77:1243.[113] Kaneko F, Yano J, Sato K. Curr Opin Struct Biol 1998;8:417.[114] Kobayashi M, Kaneko F. J Dispers Sci Technol 1989;10:319.[115] Yano J, Sato K. Food Res Int 1999;32:249.[116] Eads TM, Blaurock AE, Bryant RG, Roy DJ, Croasmun WR. J Am Oil
Chem Soc 1992;69:1057.[117] Arishima T, Sugimoto K, Kiwata R, Mori H, Sato K. J Am Oil Chem Soc
1996;73:1231.[118] Timms RE. Prog Lipid Res 1984;23:1.[119] Koyano T, Hachiya I, Sato K. J Phys Chem 1992;96:10514.[120] Minato A, Ueno S, Yano J, Wang ZH, Seto H, Amemiya Y, et al. J AmOil
Chem Soc 1996;73:1567.[121] Minato A, Ueno S, Smith K, Amemiya Y, Sato K. J Phys Chem, B
1997;101:3498.[122] Minato A, Ueno S, Yano J, Smith K, Seto H, Amemiya Y, et al. J Am Oil
Chem Soc 1997;74:1213.[123] Takeuchi M, Ueno S, Sato K. Food Res Int 2002;35:919.[124] Takeuchi M, Ueno S, Floter E, Sato K. J Am Oil Chem Soc 2002;79:627.[125] Takeuchi M, Ueno S, Sato K. Cryst Growth Des 2003;3:369.[126] Lutton ES. J Am Chem Soc 1955;77:2646.[127] MacNaughtan W, Farhat IA, Himawan C, Starov VM, Stapley AGF. J
Am Chem Soc 2006;83:1.[128] Engstrom L. Fett Wiss Technol -Fat Sci Technol 1992;94:173.[129] Prausnitz JW. Molecular thermodynamics of fluid phase equilibria. New
York: Prentice-Hall; 1998.[130] Los J, Floter E. Phys Chem Chem Phys 1999;1:4251.[131] Won KW. Fluid Phase Equilib 1986;30:265.[132] Won KW. Fluid Phase Equilib 1989;53:377.[133] Hansen JH, Fredenslund A, Pedersen KS, Ronningsen HP. AICHE J
1988;34:1937.

33C. Himawan et al. / Advances in Colloid and Interface Science 122 (2006) 3–33
[134] Pedersen KS, Skovborg P, Ronningsen HP. Energy Fuels 1991;5:924.[135] LiraGaleana C, Firoozabadi A, Prausnitz JM. AICHE J 1996;42:239.[136] Coutinho JAP, Knudsen K, Andersen SI, Stenby EH. Chem Eng Sci
1996;51:3273.[137] Coutinho JAP. Ind Eng Chem Res 1998;37:4870.[138] Ji HY, Tohidi B, Danesh A, Todd AC. Fluid Phase Equilib 2004;
216:201.[139] Lin HM, Chou YH, Wu FL, Lee MJ. Fluid Phase Equilib 2004;220:71.[140] Inoue T, Hisatsugu Y, Yamamoto R, Suzuki M. Chem Phys Lipids
2004;127:143.[141] Inoue T, Hisatsugu Y, Suzuki M, Wang ZN, Zheng LQ. Chem Phys
Lipids 2004;132:225.[142] Inoue T, Hisatsugu Y, Ishikawa R, Suzuki M. Chem Phys Lipids
2004;127:161.[143] Tao DP. Mater Sci Eng, A Struct Mater: Prop Microstruct Process
2004;366:239.[144] Los JH, van Enckevort WJP, Vlieg E, Floter E. J Phys Chem, B
2002;106:7321.[145] Los JH, van Enckevort WJP, Vlieg E, Floter E, Gandolfo FG. J Phys
Chem, B 2002;106:7331.[146] Rousset P, Rappaz M, Minner E. J Am Oil Chem Soc 1998;75:857.[147] Kitaigorodsky IA. Molecular crystals and molecules. New York:
Academic Press; 1973.[148] Rousset P. In: Narine SS, editor. Physical properties of lipids. New York:
Marcel Dekker; 2002. p. 1.[149] Hollander FFA, Kaminski D, Duret D, van Enckevort WJP, Meekes H,
Bennema P. Food Res Int 2002;35:909.[150] Himawan C, MacNaughtan W, Farhat IA, and Stapley AGF. Eur J Lipid
Sci Tech (submitted for publication).[151] Timms R. Chem Ind 1991:342.[152] Dafler JR. J Am Oil Chem Soc 1977;54:249.[153] Boistelle R. In: Garti N, Sato K, editors. Crystallization and polymorph-
ism of fats and fatty acids. New York: Marcel Dekker; 1988. p. 189.[154] Vanputte KPAM, Bakker BH. J Am Oil Chem Soc 1987;64:1138.[155] Chiang CY, Starov VM, Lloyd DR. Colloid J 1995;57:715.[156] Chiang CY, Starov VM, Hall MS, Lloyd DR. Colloid J 1997;59:236.[157] Becker R. Ann Phys (Leipz) 1935;24:719.[158] Volmer M. Kinetik der Phasenbildung; 1939. p. 103.[159] Turnbull D, Fisher JC. J Chem Phys 1949;17:71.[160] Turnbull D. J Chem Phys 1950;18:198.[161] Mullin JW. Crystallization. Oxford: Butterworth-Heinemann; 2001.[162] Takiguchi H, Iida K, Ueno S, Yano J, Sato K. J Cryst Growth
1998;193:641.[163] Hachiya I, Koyano T, Sato K. J Am Oil Chem Soc 1989;66:1757.[164] Koyano T, Hachiya I, Sato K. Food Struct 1990;9:231.[165] Chaiseri S, Dimick PS. J Am Oil Chem Soc 1995;72:1491.[166] Chaiseri S, Dimick PS. J Am Oil Chem Soc 1995;72:1497.[167] Ueno S, Ristic RI, Higaki K, Sato K. J Phys Chem, B 2003;107:4927.[168] Miura A, Kusanagi A, Kobayashi S, Tokairin S, Jin Z. IEEE Trans Appl
Supercond 2004;14:1588.[169] Frisch HL. J Chem Phys 1957;27:90.[170] Kenny JM, Maffezzoli A, Nicolais L. Thermochim Acta 1993;227:83.[171] Ng WL. J Am Oil Chem Soc 1990;67:879.[172] Hollander FFA, Plomp M, van de Streek J, van Enckevort WJP. Surf Sci
2001;471:101.[173] Los JH, Matovic M. J Phys Chem, B 2005;109:14632.[174] Taran AL, Nosov GA, Myasnikov SK, Kholin AY. Theor Found Chem
Eng 2004;38:164.[175] Kashchiev D. J Cryst Growth 2004;267:685.[176] Asta M, Spaepen F, van der Veen JF. MRS Bull 2004;29:920.[177] Sloan GJ, McGhie AR. Techniques of melt crystallization. New York:
Wiley; 1988.[178] Hollander FFA, Boerrigter SXM, de Streek JV, Bennema P, Meekes H,
Yano J, et al. J Phys Chem, B 2003;107:5680.
[179] Boerrigter SXM, Hollander FFA, van de Streek J, Bennema P, Meekes H.Cryst Growth Des 2002;2:51.
[180] Bennema P, Meekes H, Boerrigter SXM, Cuppen HM, Deij MA, vanEupent J, et al. Cryst Growth Des 2004;4:905.
[181] Kellens M, Reynaers H. Fett Wiss Technol -Fat Sci Technol 1992;94:286.[182] Himawan C, MacNaughtan W, Farhat IA, Starov VM, and Stapley AGF.
manuscript in preparation.[183] Kirwan DJ, Pigford RL. AICHE J 1969;15:442.[184] Jackson KA. Interface Sci 2002;10:159.[185] Jackson KA. J Cryst Growth 2004;264:519.[186] Anestiev L, Malakhov D. J Cryst Growth 2005;276:643.[187] Kern R. In: Sunagawa I, editor. Morphology of crystals. Tokyo: Terra
Science; 1987. p. 77.[188] Hartman P, Bennema P. J Cryst Growth 1980;49:145.[189] Hollander FFA, Boerrigter SXM, van de Streek J, Grimbergen RFP,
Meekes H, Bennema P. J Phys Chem, B 1999;103:8301.[190] Boerrigter SXM, Josten GPH, van de Streek J, Hollander FFA, Cuppen
JLHM, Bennema P, et al. J Phys Chem, A 2004;108:5894.[191] Hoffman JD, Davis GT, Lauritzen JI. In: Hannay NB, editor. Treatise of
solid chemistry. Vol. 3 crystalline and non crystalline solids. New York:Plenum Press; 1976. p. 497.
[192] Kellens M, MeeussenW, Hammersley A, Reynaers H. Chem Phys Lipids1991;58:145.
[193] Himawan C, MacNaughtan W, Farhat IA, Starov VM, and Stapley AGF.manuscript in preparation.
[194] Cebula DJ, Smith PR. J Am Oil Chem Soc 1990;67:811.[195] van Malssen K, Peschar R, Brito C, Schenk H. J Am Oil Chem Soc
1996;73:1225.[196] Loisel C, Lecq G, Keller G, Ollivon M. J Food Sci 1998;63:73.[197] Rousset P, Rappaz M. J Am Oil Chem Soc 1996;73:1051.[198] Wright AJ, Narine SS, Marangoni AG. J Am Oil Chem Soc
2000;77:1239.[199] Koyano T, Hachiya I, Arishima T, Sagi N, Sato K. J Am Oil Chem Soc
1991;68:716.[200] Martini S, Herrera ML. J Am Oil Chem Soc 2002;79:411.[201] Liu H, Biliaderis CG, Przybylski R, Eskin NAM. J Am Oil Chem Soc
1993;70:441.[202] Cerdeira M, Candal RJ, Herrera ML. J Food Sci 2004;69:R185.[203] Ng WI. J Am Oil Chem Soc 1989;66:1103.[204] Smith KW, Cain FW, Talbot G. J Agric Food Chem 2005;53:3031.[205] Foubert I, Dewettinck K, Vanrolleghem PA. Trends Food Sci Technol
2003;14:79.[206] Avrami M. J Chem Phys 1939;7:1103.[207] Avrami M. J Chem Phys 1939;8:212.[208] Coupland JN. Curr Opin Colloid Interface Sci 2002;7:445.[209] Garti N, Yano J. In: Garti N, Sato K, editors. Crystallization processes in
fats and lipid systems. New York: Marcel Dekker; 2001. p. 211.[210] Povey MJW. In: Garti N, Sato K, editors. Crystallization processes in fats
and lipid systems. New York: Marcel Dekker; 2001. p. 251.[211] Sonoda T, Takata Y, Ueno S, Sato K. Cryst Growth Des 2006;6:306.[212] Yokoyama C, Tamura Y, Nishiyama Y. J Cryst Growth 1998;191:827.[213] Smith PR. Eur J Lipid Sci Technol 2000;102:122.[214] Sprunt JC, Jayasooriya UA, Wilson RH. Phys Chem Chem Phys
2000;2:4299.[215] Dibildox-Alvarado E, Toro-Vazquez JF. J Am Oil Chem Soc 1998;75:73.[216] Toro-Vazquez JF, Dibildox-Alvarado E. J Food Lipids 1997;4:269.[217] Meekes H, Boerrigter SXM, Hollander FFA, Bennema P. Chem Eng
Technol 2003;26:256.[218] Kellens M, Reynaers H. Fett Wiss Technol -Fat Sci Technol 1992;94:94.[219] Zhao J, Reid DS. Thermochim Acta 1994;246:405.[220] Sato K, Ueno S, and Yano J. Prog Lipid Res, 38 (1999/1) 91.