Embed Size (px)
Citation preview
NASA Technical Memorandum 4579
William L. KoDryden Flight Research CenterEdwards, California
National Aeronautics andSpace Administration
Office of Management
Scientific and TechnicalInformation Program
1994
Thermocryogenic Buckling andStress Analyses of a PartiallyFilled Cryogenic Tank Subjectedto Cylindrical Strip Heating
iii
CONTENTS
ABSTRACT 1
NOMENCLATURE 1
INTRODUCTION 2
DESCRIPTION OF PROBLEM 3
FINITE ELEMENT MODELS 4
THERMOCRYOGENIC BUCKLING ANALYSIS 4
THERMOCRYOGENIC AND MECHANICAL STRESS ANALYSES 5
NUMERICAL RESULTS 6Thermocryogenic Buckling . . . . . . . . . . . . . . . . . . . . . . . . . . . . . . . . . . . . . . . . . . . . . . . . . . . . . . . . . 6Induced Stresses and Deformations . . . . . . . . . . . . . . . . . . . . . . . . . . . . . . . . . . . . . . . . . . . . . . . . . . . 8
Thermocryogenic Loading . . . . . . . . . . . . . . . . . . . . . . . . . . . . . . . . . . . . . . . . . . . . . . . . . . . . . . . . 8Cryogenic Liquid Pressure Loading . . . . . . . . . . . . . . . . . . . . . . . . . . . . . . . . . . . . . . . . . . . . . . . . 10Internal Pressure Loading . . . . . . . . . . . . . . . . . . . . . . . . . . . . . . . . . . . . . . . . . . . . . . . . . . . . . . . . 10Tank-Wall Inertia Loading . . . . . . . . . . . . . . . . . . . . . . . . . . . . . . . . . . . . . . . . . . . . . . . . . . . . . . . 11High-Stress Domains . . . . . . . . . . . . . . . . . . . . . . . . . . . . . . . . . . . . . . . . . . . . . . . . . . . . . . . . . . . 12
CONCLUDING REMARKS 12
FIGURES 14
APPENDIX 63
REFERENCES 66
ABSTRACT
Thermocryogenic buckling and stress analyses were conducted on a horizontally oriented cryogenictank using the finite element method. The tank is a finite-length circular cylindrical shell with its two endscapped with hemispherical shells. The tank is subjected to cylindrical strip heating in the region above theliquid-cryogen fill level and to cryogenic cooling below the fill level (i.e., under thermocryogenic loading).The effects of cryogen fill level on the buckling temperature and thermocryogenic stress field were inves-tigated in detail. Both the buckling temperature and stress magnitudes were relatively insensitive to thecryogen fill level. The buckling temperature, however, was quite sensitive to the radius-to-thickness ratio.A mechanical stress analysis of the tank also was conducted when the tank was under (1) cryogen liquidpressure loading, (2) internal pressure loading and (3) tank-wall inertia loading. Deformed shapes of thecryogenic tanks under different loading conditions were shown, and high-stress domains were mapped onthe tank wall for the strain-gage installations. The accuracies of solutions from different finite elementmodels were compared.
NOMENCLATURE
c shift factor in “shifted” eigenvalue extractions
CPU central processing unit
E Young's modulus of tank material, lb/in2
E33 triangular combined membrane and bending element
E43 quadrilateral combined membrane and bending element
g gravitational constant, 32.2 ft/sec2
i index,i = 1, 2, 3, …
JLOC joint location (figures 2, 3)
K system stiffness matrix
system initial-stress stiffness matrix corresponding to a particular applied force condition
l length of circular cylindrical segment of cryogenic tank, in.
p internal pressure, lb/in2
R radius of circular cylindrical segment, or radius of hemispherical bulkheads of cryogenictank, in.
T temperature,°F
t thickness of cryogenic tank, in.
X displacement vector
x, y, z global rectangular coordinates
local rectangular coordinates
coefficient of thermal expansion of tank-wall material, in/in-°F
radial displacement of circular cylinder, in.
Kg
x', y', z'
α
∆Rc
2
radial displacement of sphere, in.
temperature differential,°F
critical buckling temperature,°F
difference in ,°Fpolar angle, deg
eigenvalue of thei-th buckling mode
Poisson ratio of tank material
density of tank-wall material, lb/in3
density of liquid hydrogen, lb/in3
stress inz-direction, lb/in2
stress in -direction, lb/in2
stress in -direction, lb/in2
shear stress, lb/in2
meridional angle, deg
INTRODUCTION
A finite-length circular cylindrical shell with its two ends capped with hemispherical shells or hemi-spheroidal shells of revolution is a popular geometry for pressure vessels. These shapes of vessels also areused commonly as cryogenic fuel tanks for liquid-propellant rockets. A pressure vessel is loaded underuniform internal pressure, and the stress field generated in the tank wall is axisymmetric and can be cal-culated relatively easily (ref. 1). When used as a cryogenic fuel tank for a liquid-propellant rocket motorfor vertical lift-off, the tank axis is oriented vertically; therefore, the stress field generated in the tank wallis also axisymmetric, but the induced stresses vary with axial location (governed by the fill level and theend effect). When used as a cryogenic fuel tank for a hypersonic flight vehicle for horizontal takeoff (e.g.,space plane for single-stage horizontal takeoff to space), the insulated tank is carried inside the fuselageof the vehicle (or could form part of the fuselage of the vehicle), and its axis is oriented horizontally.
During one mission, the liquid-cryogen fill level starts from empty to full (at takeoff), then graduallycomes down as the fuel is consumed during flight, and finally reaches empty at the end of the mission.Thus, the tank wall goes through a history of being cooled longitudinally below the liquid-cryogen fill lev-el (which is constantly decreasing during the mission), and also being heated longitudinally (as the resultof aerodynamic heating, even through insulations) in the region above the fill level. During a flight, thetank is subjected to the fill-level-dependent thermocryogenic loading, and the thermocryogenic stress fieldinduced in the tank wall is no longer axisymmetric. The stress in the tank wall then changes with both thefill level and the axial location because of the end effect, which is magnified by the shortness of the tank.Because of simultaneous heating and cryogenic cooling (changing with fill level) in different regions ofthe horizontally oriented cryogenic tank, thermocryogenic buckling could take place in certain high-compression zones of the heated zone if the thermal loading is too severe.
∆Rs
∆T
∆Tcr
∆ ∆Tcr( ) ∆Tcr
θ
λi
ν
ρ
ρH
σz
σθ θ
σφ φ
τθz
φ
3
In addition to the thermocryogenic loading, the tank also is subjected to cryogen liquid pressure load-ing, internal pressure loading, and tank-wall inertia loading. Severe liquid sloshing inside a large fuel tank(dynamic loading) could disturb the control of the flight vehicle.
A circular cylindrical shell with hemispherical bulkheads has been considered as a potential candidatecryogenic tank geometry for future hypersonic flight vehicles. Thus, studies on the thermocryogenic per-formance of this type of tank are required. Some results of the thermal response of this horizontally ori-ented cryogenic tank subjected to simulated aerodynamic heating profiles were reported by Stephens andHanna (refs. 2–3). The results of their studies could be used as the basis to conduct thermocryogenic buck-ling and stress analyses of a cryogenic tank of this geometry.
Some existing closed-form solutions were obtained by Hill et al. (refs. 4–6) for calculating thermalbuckling temperatures and thermal stresses in a thin circular cylindrical shell heated along a narrow axialstrip. These solution equations, however, might not give accurate results for the case of a finite-length cir-cular cylindrical tank with hemispherical bulkheads, because the cylindrical shell considered by thoseinvestigators was long enough so that the end effect could be neglected.
This report concerns thermocryogenic buckling and stress analyses of a horizontally oriented cryogen-ic tank subjected to cylindrical strip heating. The tank is of relatively short circular cylindrical shell withits two ends capped with hemispherical shells. Because the cryogenic tank under consideration is relativelyshort, the end effect could be felt in most of the cylindrical section area. Therefore, the finite element meth-od is used in the present thermocryogenic buckling and stress analyses. The results presented show howthe thermocryogenic buckling temperatures and stress field in the tank wall change with the liquid-cryogenfill level and also with tank-wall thickness.
Furthermore, additional stress analyses were conducted to find the levels of contributions of stressesarising from cryogenic liquid pressure loading (liquid sloshing not considered), internal pressure loading,and tank-wall inertia loading (from flight maneuvers). The studies established the critical stress domainsfor strain-gage instrumentations for obtaining experimental stress data.
DESCRIPTION OF PROBLEM
Figure 1 shows the geometry of the cryogenic fuel tank and the coordinate systems. The circular cy-lindrical section of length,l, and the hemispherical bulkheads have radius,R, and wall thickness,t. Thexyz-system is the global coordinate system for the tank, and the -system is the local coordinate sys-tem used in the finite element mesh generation of a hemispherical bulkhead.
The cryogenic fuel tank was partially filled and subjected to four different loading conditions describedbelow (cf. fig. 2).
1. Thermocryogenic loading.–The hot region will be heated under constant temperaturedifferential of = 1°F (i.e., temperature of hot region minus temperature of coldregion), except the end regions of the temperature profile where the temperature de-creases linearly over a 12° arc down to zero at the liquid-cryogen fill level. The rampzone of the temperature profile is about 15° according to the heat transfer analysis(refs. 2 and 3). Because of the finite element sizing chosen, however, a 12° temperatureramp was used.
x'y'z'
∆T
4
2. Cryogenic liquid pressure loading.
3. Internal pressure loading.
4. Tank wall inertia loading.
The loading conditions 2 and 4 are flight maneuverg-dependent loadings.
The main purpose of this report is to perform thermocryogenic buckling and stress analyses of the cyo-genic tank subjected to thermocryogenic loading (condition 1). The stress levels resulting from loadingconditions 2–4 are secondary in nature, and they are calculated to show the levels of their stress contribu-tions in comparison with the stress fields induced by thermocryogenic loading. For both thermocryogenicbuckling and stress analyses, the cryogenic tank was supported at two end points. One end point is fixed,and the other end point can move freely only in thez-direction.
FINITE ELEMENT MODELS
The structural performance and resizing (SPAR) finite element program was used in setting up twofinite element models. Because of the symmetry with respect to thexy- andxz-planes, only a quarter of thetank lying in the region , was modeled (fig. 1). The SPAR commands SYMMETRYPLANE = 2 and SYMMETRY PLANE = 3 then were used in the CONSTRAINT definition to generatethe whole tank for the stress computations. Figures 3 and 4, respectively, show the finer model named3°ELD and a coarser model named 6°ELD setups for the tank. In these graphical displays, the SPAR com-mand SYMMETRY PLANE = 3 was used in generating the model's mirror image with respect to thexy-plane. The elements in the circular cylindrical section were generated based on thexyz-coordinate sys-tem. In the mesh generation of the hemispherical bulkhead, the -coordinate system was used so thatthe horizontal grid lines would match the fuel fill levels. The purpose of using two models was to studythe finite element solution convergency and to define mesh density required to obtain adequate bucklingand stress solutions. The finer model 3°ELD was needed for obtaining satisfactory buckling solutions andsmooth buckling mode shapes. For the buckling analysis, past experience showed that the element length-to-thickness ratio must be about 5 to 1. The 3°ELD model was set up according to this criterion. Table 1compares the sizes of the two finite element models. As will be seen later, the 3°ELD model requiresroughly 10 times the computational central processing unit (CPU) time needed to run the 6°ELD model inthe eigenvalue extractions.
Table 1. Sizes of finite element models.
Item 3°ELD model 6°ELD modelJoint locations 4271 1086
E43 elements 4160 1020
E33 elements 60 30
0 θ 180¡ ,z 0≥≤ ≤
x'y'z'
5
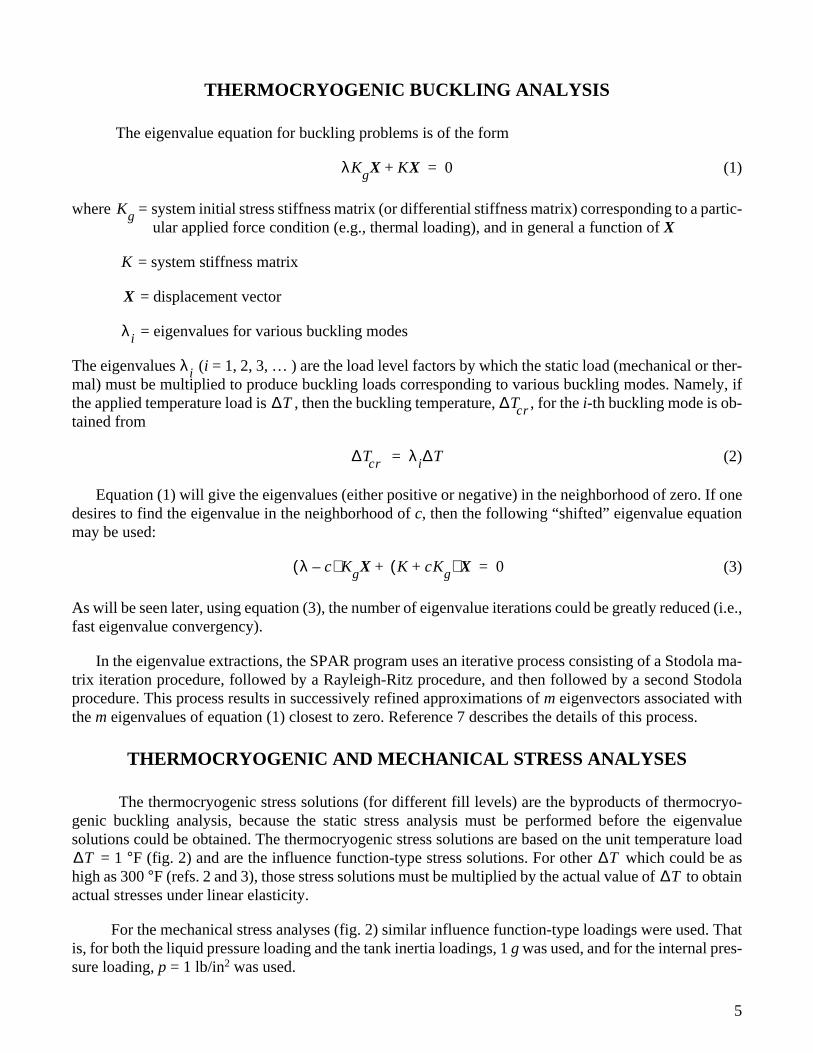
THERMOCRYOGENIC BUCKLING ANALYSIS
The eigenvalue equation for buckling problems is of the form
(1)
where = system initial stress stiffness matrix (or differential stiffness matrix) corresponding to a partic-ular applied force condition (e.g., thermal loading), and in general a function ofX
= system stiffness matrix
= displacement vector
= eigenvalues for various buckling modes
The eigenvalues (i = 1, 2, 3, … ) are the load level factors by which the static load (mechanical or ther-mal) must be multiplied to produce buckling loads corresponding to various buckling modes. Namely, ifthe applied temperature load is , then the buckling temperature, , for thei-th buckling mode is ob-tained from
(2)
Equation (1) will give the eigenvalues (either positive or negative) in the neighborhood of zero. If onedesires to find the eigenvalue in the neighborhood ofc, then the following “shifted” eigenvalue equationmay be used:
(3)
As will be seen later, using equation (3), the number of eigenvalue iterations could be greatly reduced (i.e.,fast eigenvalue convergency).
In the eigenvalue extractions, the SPAR program uses an iterative process consisting of a Stodola ma-trix iteration procedure, followed by a Rayleigh-Ritz procedure, and then followed by a second Stodolaprocedure. This process results in successively refined approximations ofm eigenvectors associated withthem eigenvalues of equation (1) closest to zero. Reference 7 describes the details of this process.
THERMOCRYOGENIC AND MECHANICAL STRESS ANALYSES
The thermocryogenic stress solutions (for different fill levels) are the byproducts of thermocryo-genic buckling analysis, because the static stress analysis must be performed before the eigenvaluesolutions could be obtained. The thermocryogenic stress solutions are based on the unit temperature load
= 1 °F (fig. 2) and are the influence function-type stress solutions. For other which could be ashigh as 300°F (refs. 2 and 3), those stress solutions must be multiplied by the actual value of to obtainactual stresses under linear elasticity.
For the mechanical stress analyses (fig. 2) similar influence function-type loadings were used. Thatis, for both the liquid pressure loading and the tank inertia loadings, 1g was used, and for the internal pres-sure loading,p = 1 lb/in2 was used.
λKgX K+ X 0=
Kg
K
X
λi
λi
∆T ∆Tcr
∆Tcr λi∆T=
λ c–( ) KgX K cKg+( ) X+ 0=
∆T ∆T∆T
6
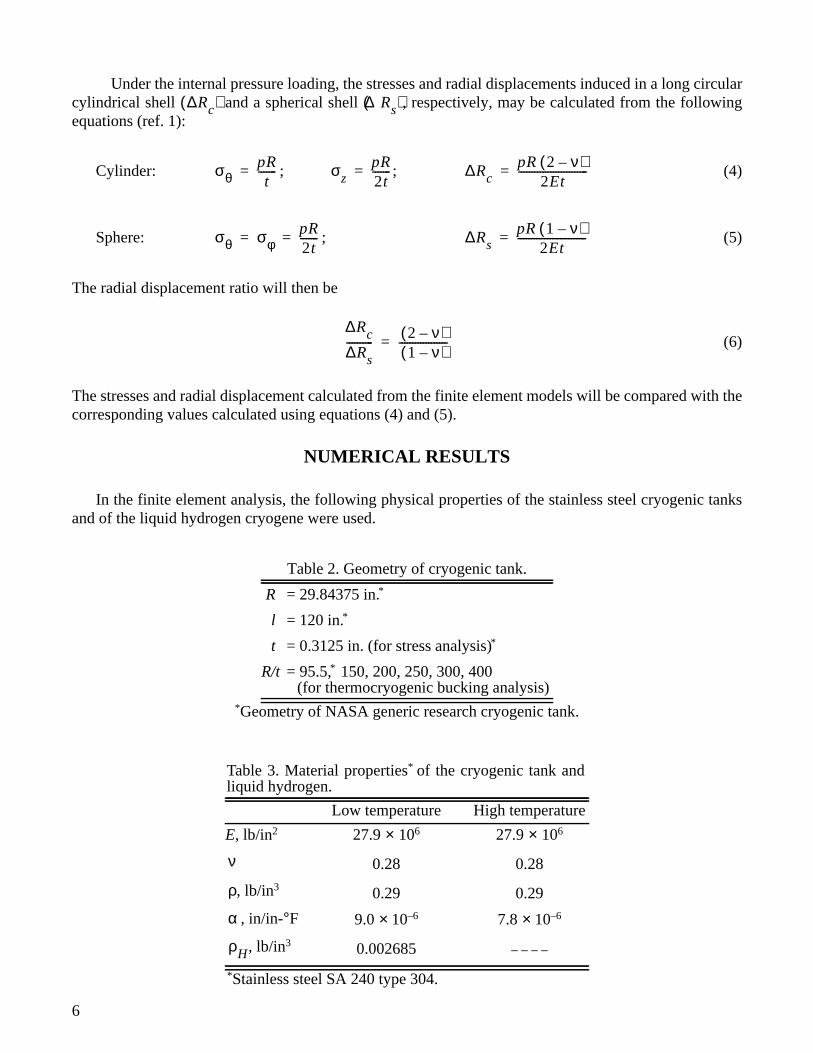
Under the internal pressure loading, the stresses and radial displacements induced in a long circularcylindrical shell and a spherical shell , respectively, may be calculated from the followingequations (ref. 1):
Cylinder: ; ; (4)
Sphere: ; (5)
The radial displacement ratio will then be
(6)
The stresses and radial displacement calculated from the finite element models will be compared with thecorresponding values calculated using equations (4) and (5).
NUMERICAL RESULTS
In the finite element analysis, the following physical properties of the stainless steel cryogenic tanksand of the liquid hydrogen cryogene were used.
*Geometry of NASA generic research cryogenic tank.
*Stainless steel SA 240 type 304.
Table 2. Geometry of cryogenic tank.
R = 29.84375 in.*
l = 120 in.*
t = 0.3125 in. (for stress analysis)*
R/t = 95.5,* 150, 200, 250, 300, 400(for thermocryogenic bucking analysis)
Table 3. Material properties* of the cryogenic tank andliquid hydrogen.
Low temperature High temperature
E, lb/in2 27.9 106 27.9 106
0.28 0.28
, lb/in3 0.29 0.29
, in/in-°F 9.0 10–6 7.8 10–6
, lb/in3 0.002685 – – – –
∆Rc( ) ∆Rs( )
σθpRt
-------= σzpR2t-------= ∆Rc
pR 2 ν–( )2Et
--------------------------=
σθ σφpR2t-------= = ∆Rs
pR 1 ν–( )2Et
--------------------------=
∆Rc
∆Rs---------- 2 ν–( )
1 ν–( )------------------=
× ×
ν
ρ
α × ×
ρH
7
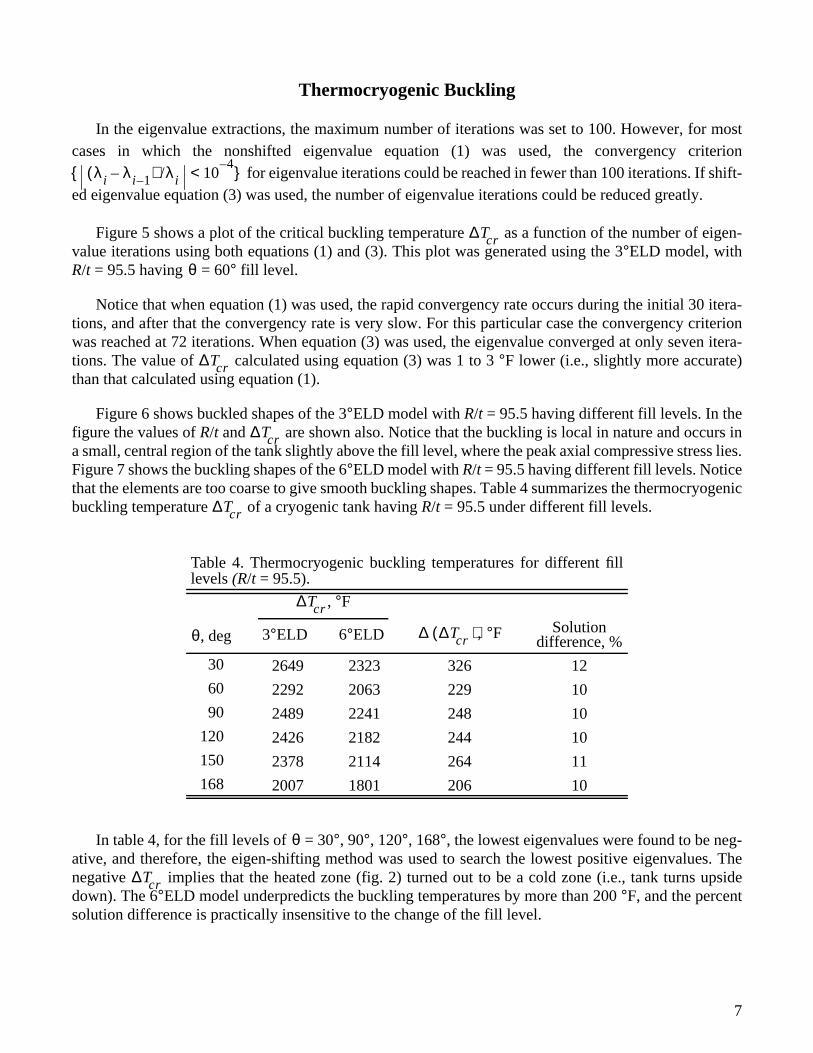
Thermocryogenic Buckling
In the eigenvalue extractions, the maximum number of iterations was set to 100. However, for mostcases in which the nonshifted eigenvalue equation (1) was used, the convergency criterion
for eigenvalue iterations could be reached in fewer than 100 iterations. If shift-ed eigenvalue equation (3) was used, the number of eigenvalue iterations could be reduced greatly.
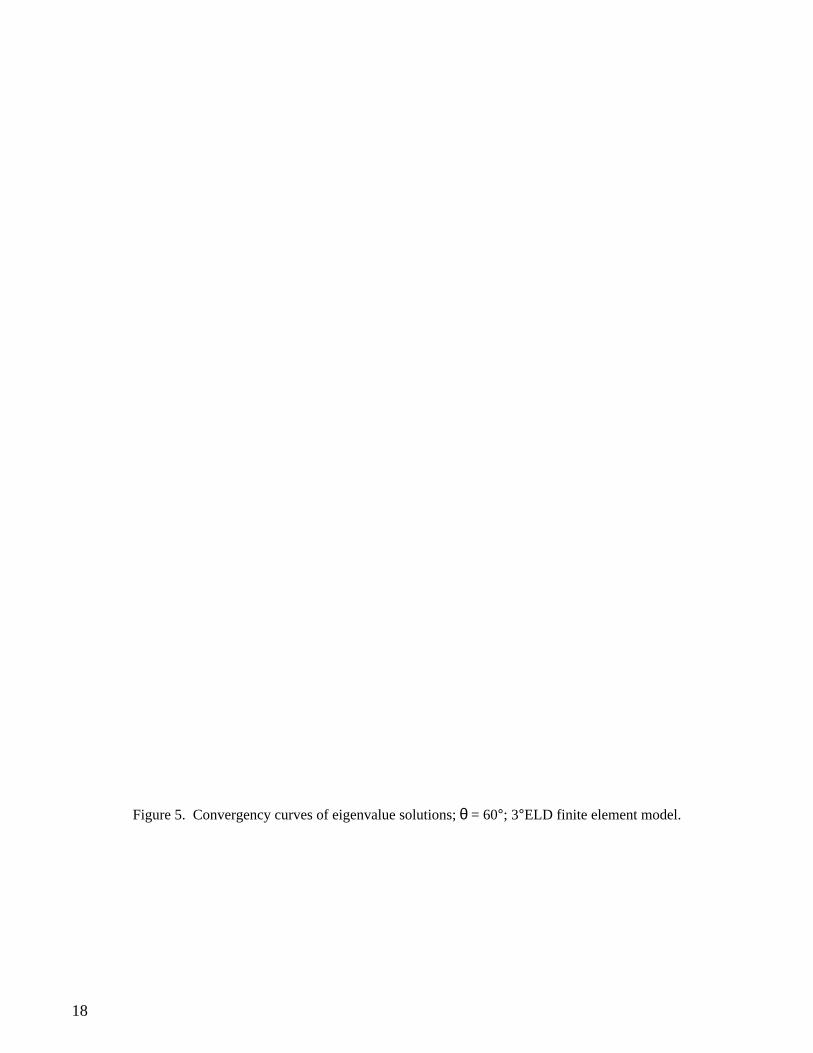
Figure 5 shows a plot of the critical buckling temperature as a function of the number of eigen-value iterations using both equations (1) and (3). This plot was generated using the 3°ELD model, withR/t = 95.5 having = 60° fill level.
Notice that when equation (1) was used, the rapid convergency rate occurs during the initial 30 itera-tions, and after that the convergency rate is very slow. For this particular case the convergency criterionwas reached at 72 iterations. When equation (3) was used, the eigenvalue converged at only seven itera-tions. The value of calculated using equation (3) was 1 to 3°F lower (i.e., slightly more accurate)than that calculated using equation (1).
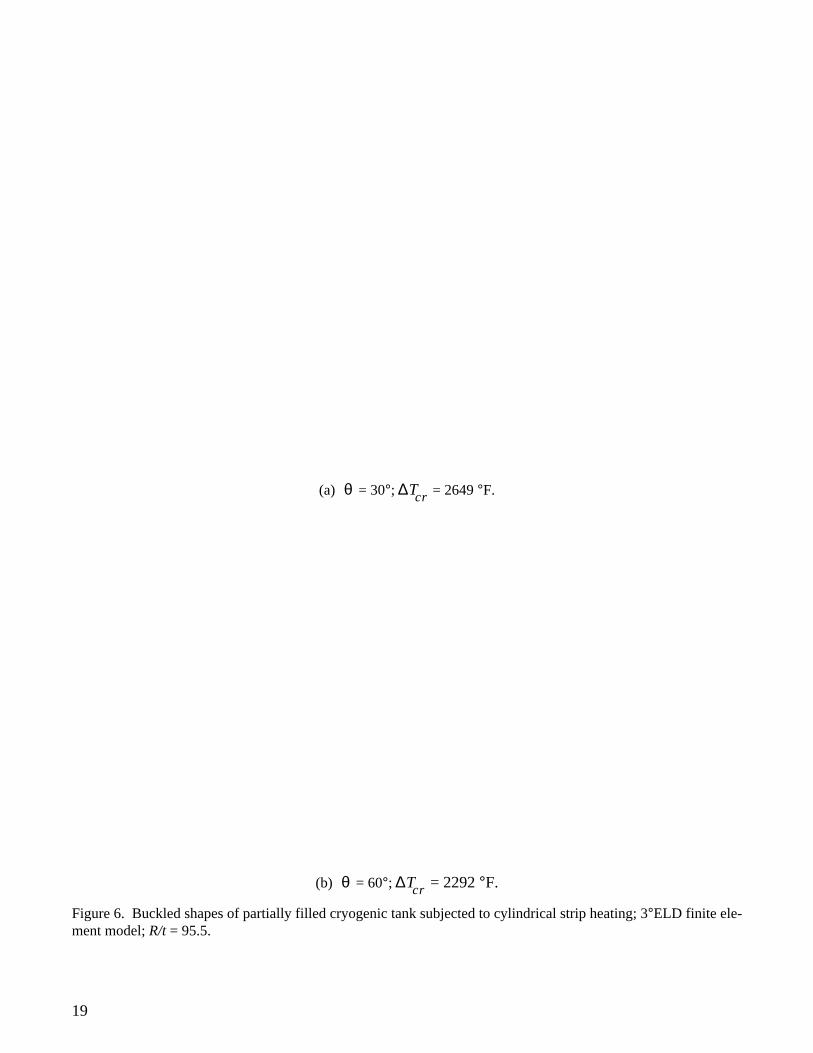
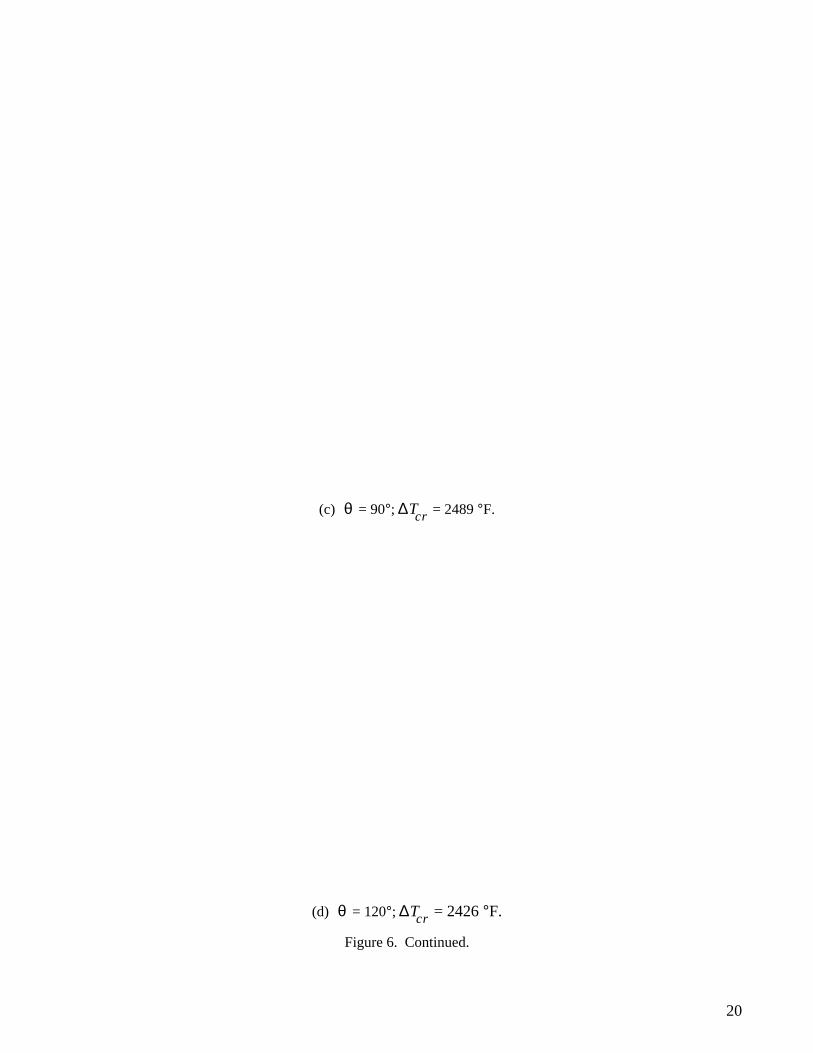
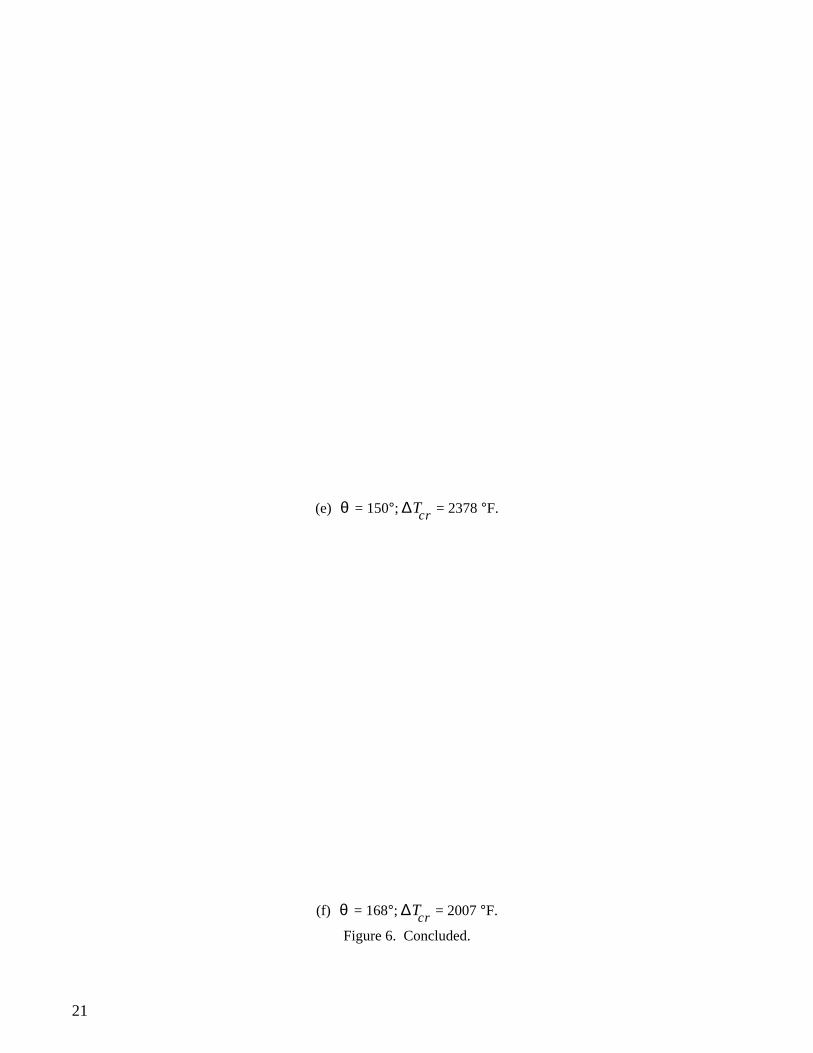
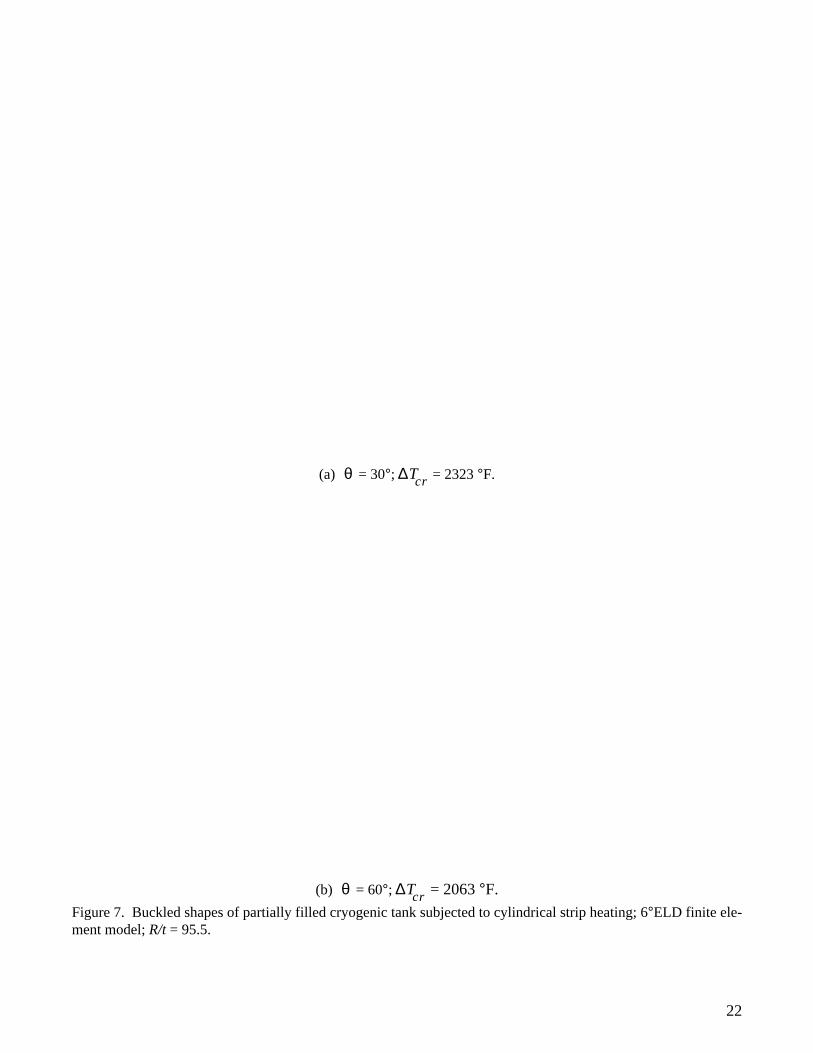
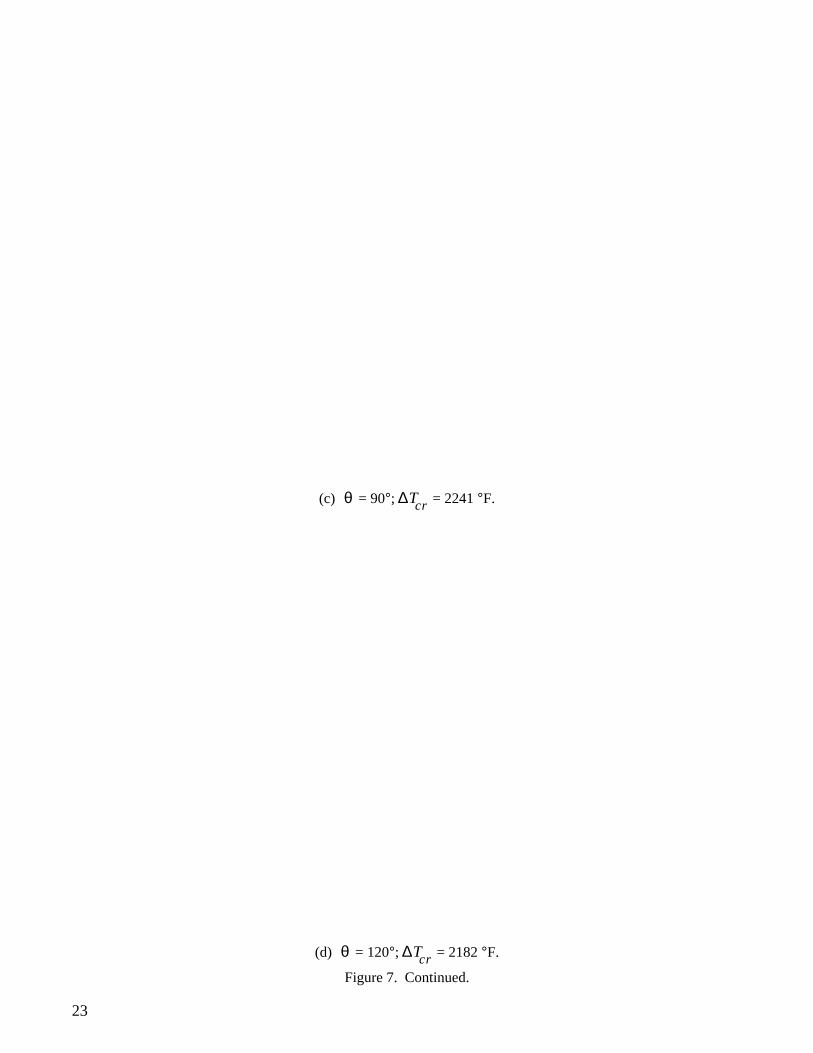
Figure 6 shows buckled shapes of the 3°ELD model withR/t = 95.5 having different fill levels. In thefigure the values ofR/t and are shown also. Notice that the buckling is local in nature and occurs ina small, central region of the tank slightly above the fill level, where the peak axial compressive stress lies.Figure 7 shows the buckling shapes of the 6°ELD model withR/t = 95.5 having different fill levels. Noticethat the elements are too coarse to give smooth buckling shapes. Table 4 summarizes the thermocryogenicbuckling temperature of a cryogenic tank havingR/t = 95.5 under different fill levels.
In table 4, for the fill levels of = 30°, 90°, 120°, 168°, the lowest eigenvalues were found to be neg-ative, and therefore, the eigen-shifting method was used to search the lowest positive eigenvalues. Thenegative implies that the heated zone (fig. 2) turned out to be a cold zone (i.e., tank turns upsidedown). The 6°ELD model underpredicts the buckling temperatures by more than 200°F, and the percentsolution difference is practically insensitive to the change of the fill level.
Table 4. Thermocryogenic buckling temperatures for different filllevels(R/t = 95.5).
, °F
, deg 3°ELD 6°ELD °F Solutiondifference, %
30 2649 2323 326 12
60 2292 2063 229 10
90 2489 2241 248 10
120 2426 2182 244 10
150 2378 2114 264 11
168 2007 1801 206 10
λi λi 1––( ) /λi 104–<{ }
∆Tcr
θ
∆Tcr
∆Tcr
∆Tcr
∆Tcr
θ ∆ ∆Tcr( ),
θ
∆Tcr
8
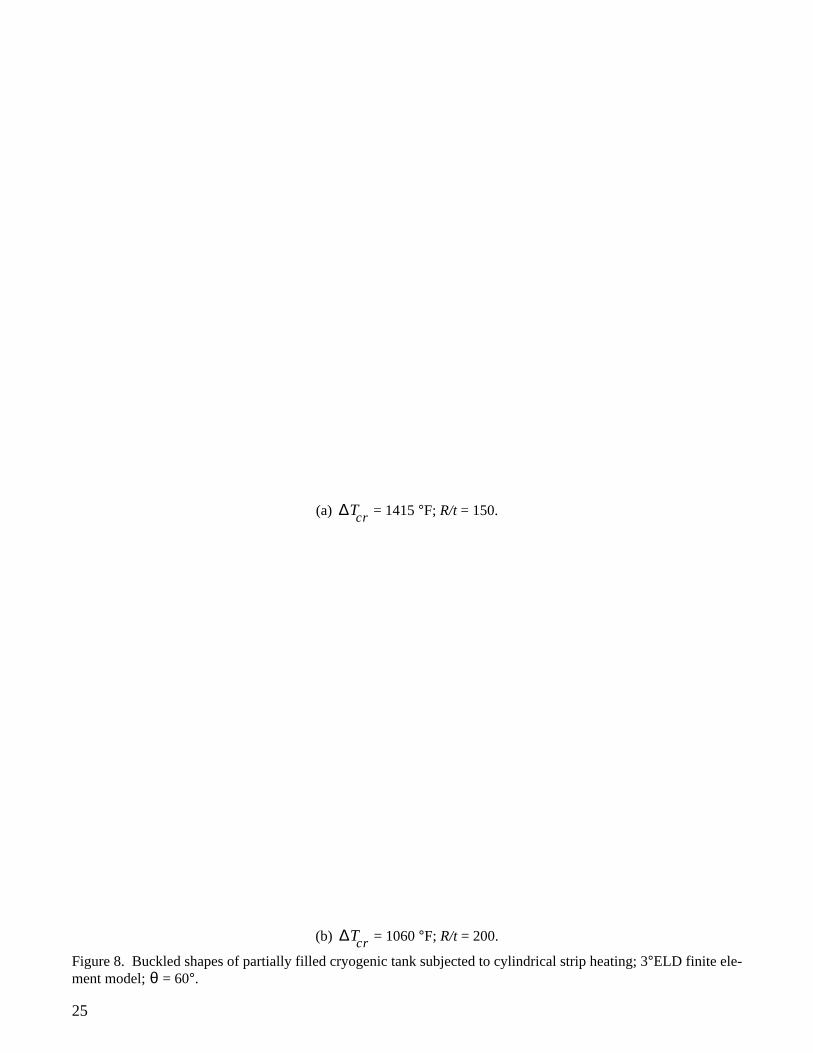
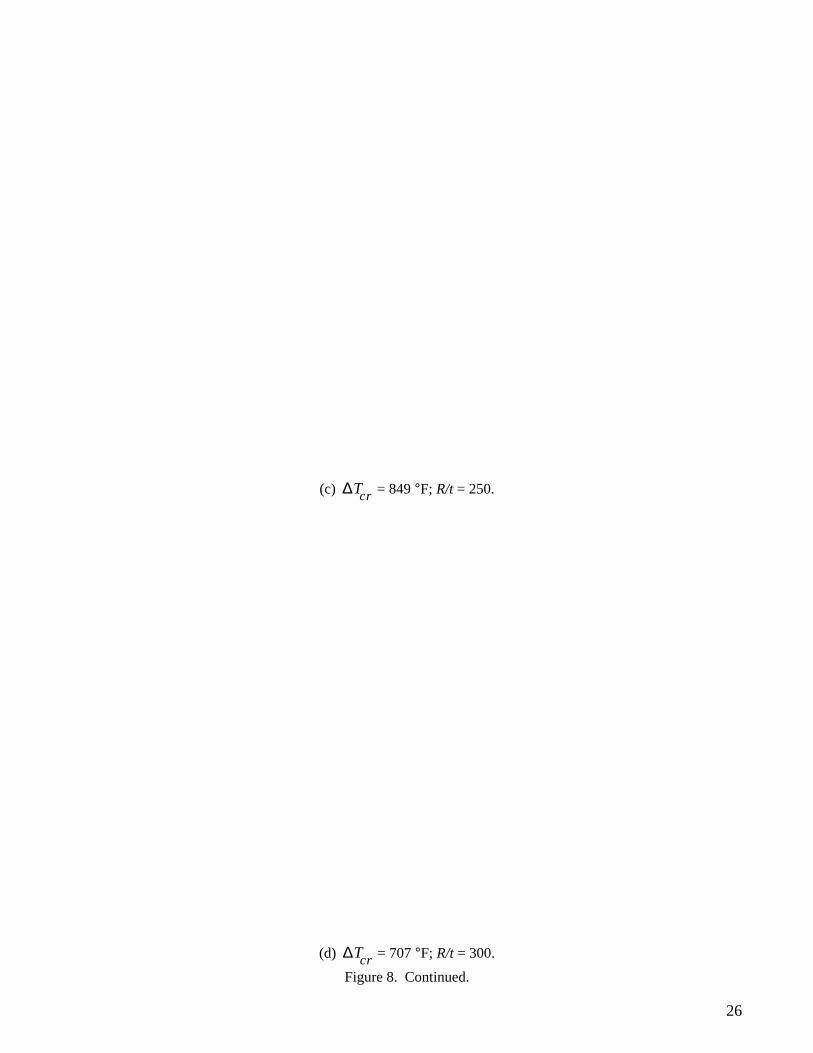
Figures 8 and 9, respectively, show the buckled shapes of 3°ELD and 6°ELD with = 60° fill levelbut differentR/t. The number of buckles increases slightly as the value ofR/t increases. In those figuresthe values of andR/t are indicated.
Table 5 summarizes the thermocryogenic buckling temperature of cryogenic tanks with differentR/t ratios having identical fill levels of = 60°.
*Geometry of NASA generic research cryogenic tank.
Notice from table 5 that the 6°ELD model gives lower values of than those calculated using the3°ELD model. The discrepancy of the eigenvalue solutions between the two models averages slightlymore than 200°F. The present study confirmed that to obtain satisfactory buckling solutions with smoothbuckling shapes, the element density of the finite element model must be such that the length-to-thicknessratio is about 5. Thus, for thinner tanks, finer mesh may be required. However, because of excessive CPUtime problems, finer mesh was not used for highR/t tanks.
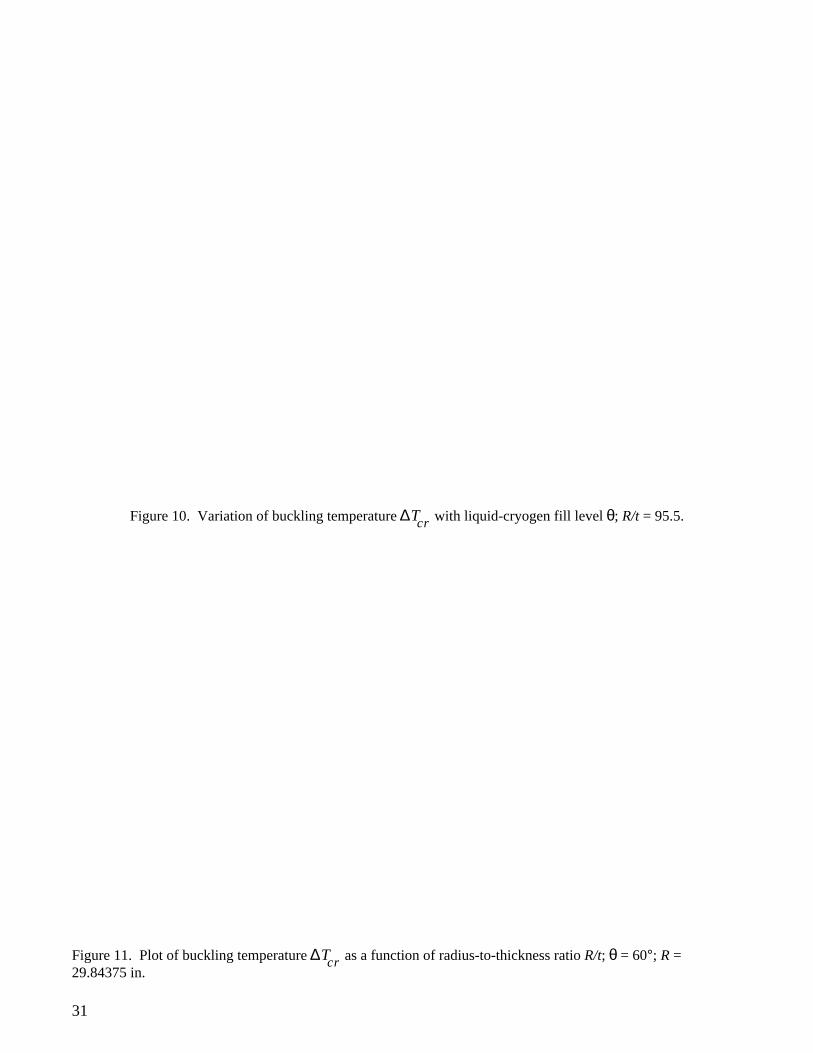
Figure 10 shows plots of as a function of the fill level for the two finite element models using datashown in table 4. The buckling temperature is seen to be relatively insensitive to the change of the fill level.
Figure 11 shows plots of as a function ofR/t for the = 60° fill level case using data presentedin table 5. The buckling temperature is quite sensitive to the change ofR/t. The rate of decrease of isfaster in the lowerR/t region and becomes slower asR/t increases.
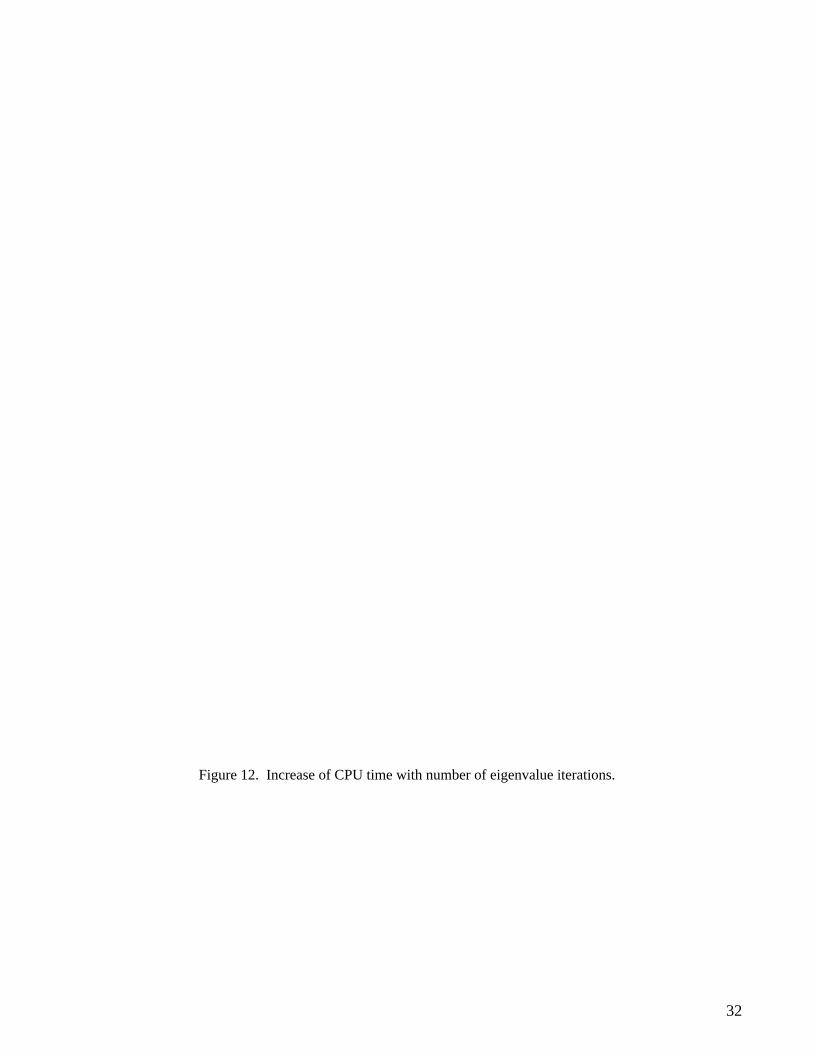
Figure 12 shows the computational CPU time plotted as a function of the number of eigenvalue itera-tions required until convergencies for the two cases of finite element models. The CPU time increases al-most linearly with the number of iterations for both models. The CPU time required to extract eigenvaluesusing the 3°ELD model is almost 10 times that required when using the 6°ELD model. For each eigenvalueiteration, the 3°ELD and 6°ELD models required about 5.23 and 0.69 CPU min, respectively. As will beseen later, for the stress analysis, the 6°ELD model, which requires much shorter CPU time, gave fairlygood stress solutions.
Induced Stresses and Deformations
The stresses induced and the resulting deformations of the cryogenic tank under the four loading con-ditions are presented below.
Table 5. Thermocryogenic buckling temperatures for differentR/t ( = 60° fill level).
R/t
95.5* 150 200 250 300 350 400
, °F 3°ELD 2292 1415 1060 849 707 604 525
6°ELD 2063 1198 832 609 451 347 286
°F 229 217 228 240 256 257 239
Solutiondifference, % 10 15 22 28 36 43 46
θ
∆Tcr
∆Tcrθ
θ
∆Tcr
∆ ∆Tcr( ),
∆Tcr
∆Tcr
∆Tcr θ∆Tcr
}
9
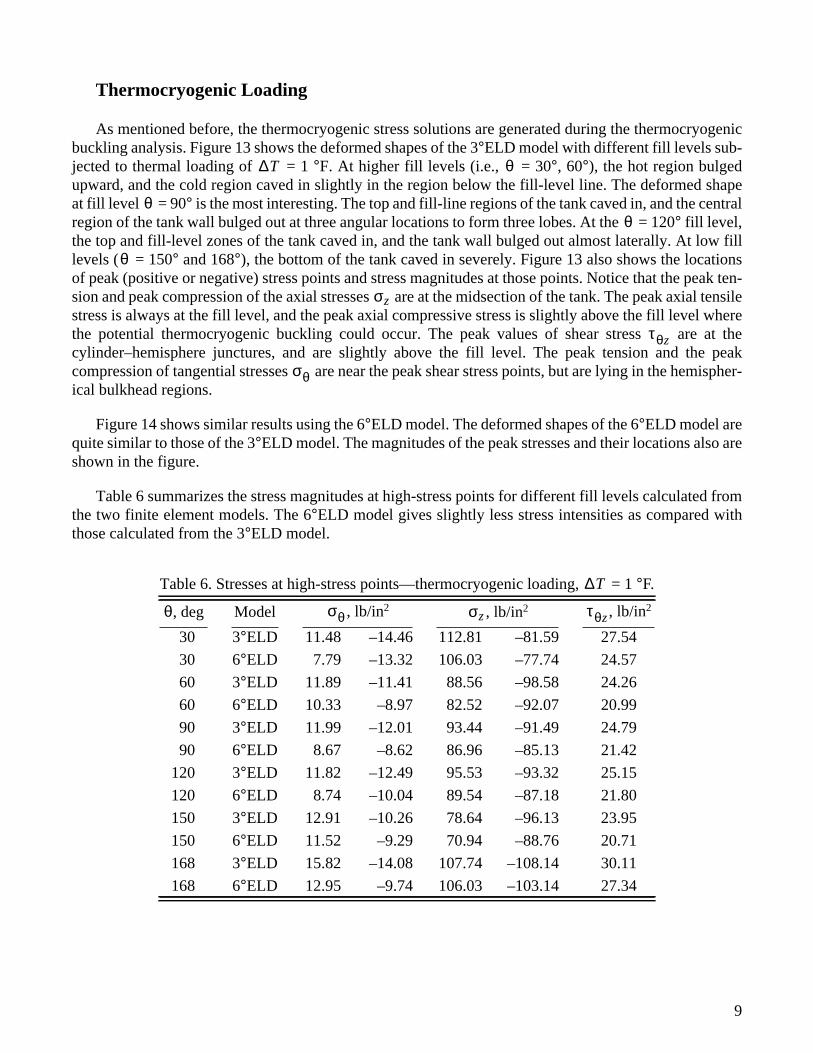
Thermocryogenic Loading
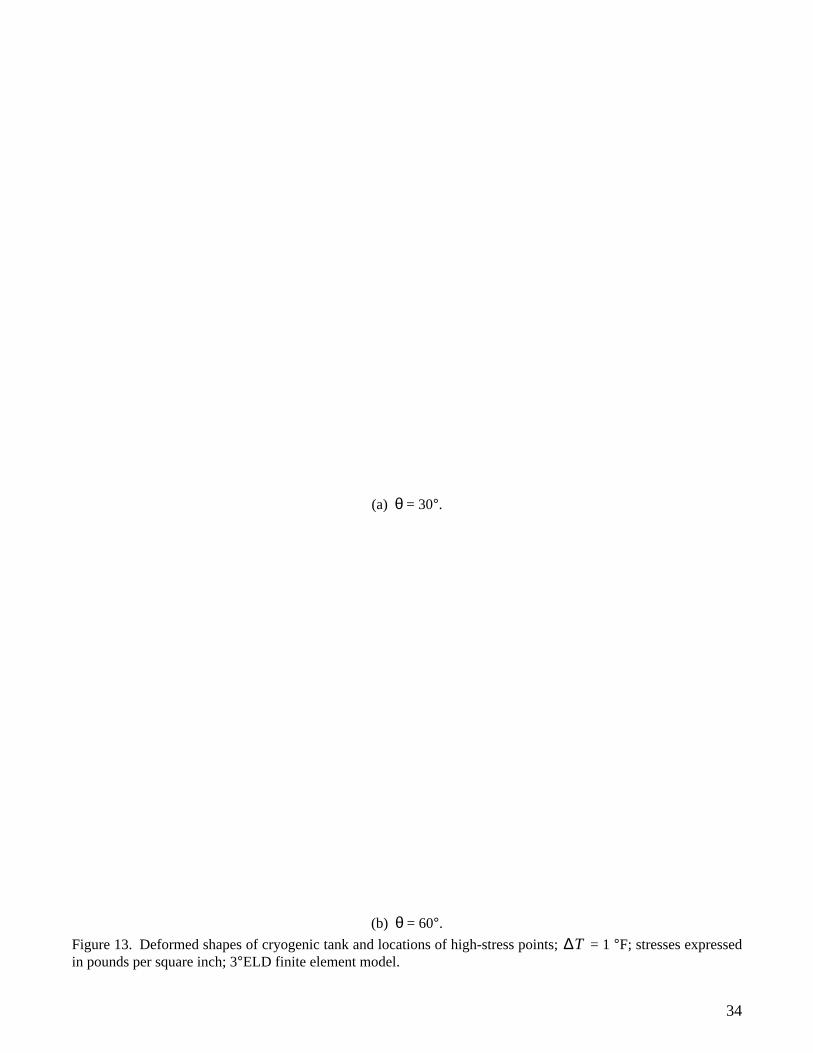
As mentioned before, the thermocryogenic stress solutions are generated during the thermocryogenicbuckling analysis. Figure 13 shows the deformed shapes of the 3°ELD model with different fill levels sub-jected to thermal loading of = 1°F. At higher fill levels (i.e., = 30°, 60°), the hot region bulgedupward, and the cold region caved in slightly in the region below the fill-level line. The deformed shapeat fill level = 90° is the most interesting. The top and fill-line regions of the tank caved in, and the centralregion of the tank wall bulged out at three angular locations to form three lobes. At the = 120° fill level,the top and fill-level zones of the tank caved in, and the tank wall bulged out almost laterally. At low filllevels ( = 150° and 168°), the bottom of the tank caved in severely. Figure 13 also shows the locationsof peak (positive or negative) stress points and stress magnitudes at those points. Notice that the peak ten-sion and peak compression of the axial stresses are at the midsection of the tank. The peak axial tensilestress is always at the fill level, and the peak axial compressive stress is slightly above the fill level wherethe potential thermocryogenic buckling could occur. The peak values of shear stress are at thecylinder–hemisphere junctures, and are slightly above the fill level. The peak tension and the peakcompression of tangential stresses are near the peak shear stress points, but are lying in the hemispher-ical bulkhead regions.
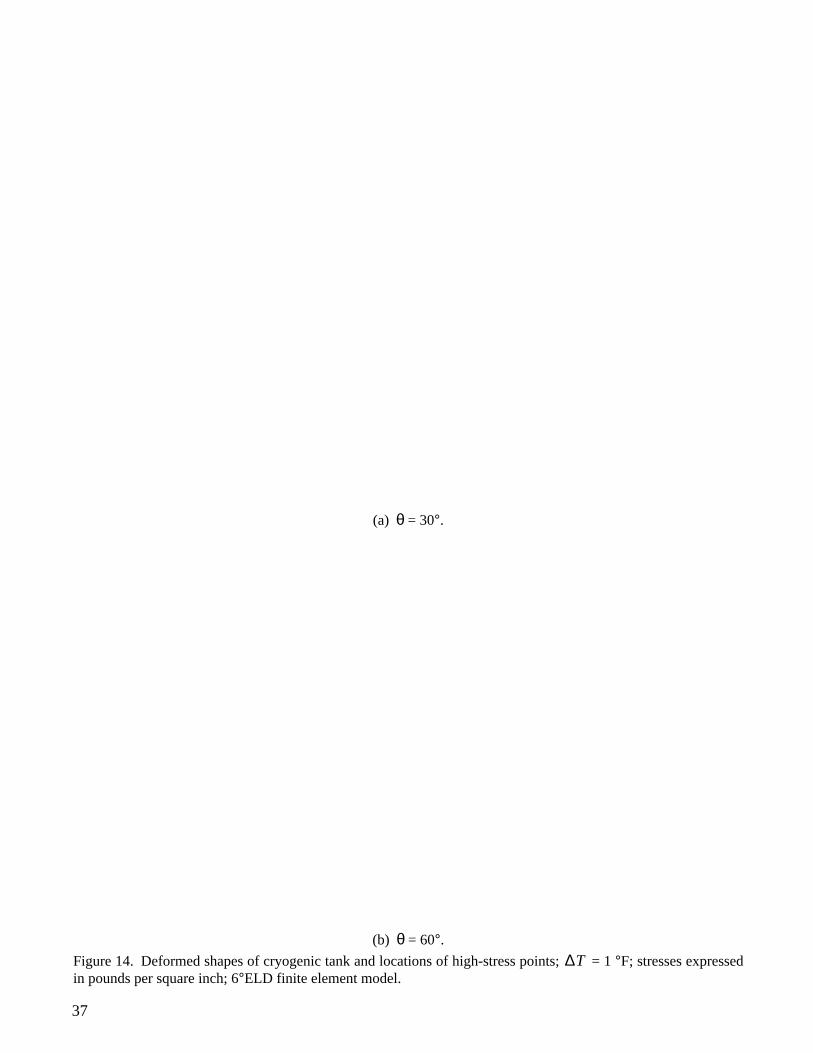
Figure 14 shows similar results using the 6°ELD model. The deformed shapes of the 6°ELD model arequite similar to those of the 3°ELD model. The magnitudes of the peak stresses and their locations also areshown in the figure.
Table 6 summarizes the stress magnitudes at high-stress points for different fill levels calculated fromthe two finite element models. The 6°ELD model gives slightly less stress intensities as compared withthose calculated from the 3°ELD model.
Table 6. Stresses at high-stress points—thermocryogenic loading, = 1°F.
, deg Model , lb/in2 , lb/in2 , lb/in2
30 3°ELD 11.48 –14.46 112.81 –81.59 27.54
30 6°ELD 7.79 –13.32 106.03 –77.74 24.57
60 3°ELD 11.89 –11.41 88.56 –98.58 24.26
60 6°ELD 10.33 –8.97 82.52 –92.07 20.99
90 3°ELD 11.99 –12.01 93.44 –91.49 24.79
90 6°ELD 8.67 –8.62 86.96 –85.13 21.42
120 3°ELD 11.82 –12.49 95.53 –93.32 25.15
120 6°ELD 8.74 –10.04 89.54 –87.18 21.80
150 3°ELD 12.91 –10.26 78.64 –96.13 23.95
150 6°ELD 11.52 –9.29 70.94 –88.76 20.71
168 3°ELD 15.82 –14.08 107.74 –108.14 30.11
168 6°ELD 12.95 –9.74 106.03 –103.14 27.34
∆T θ
θθ
θ
σz
τθz
σθ
∆T
θ σθ σz τθz
10
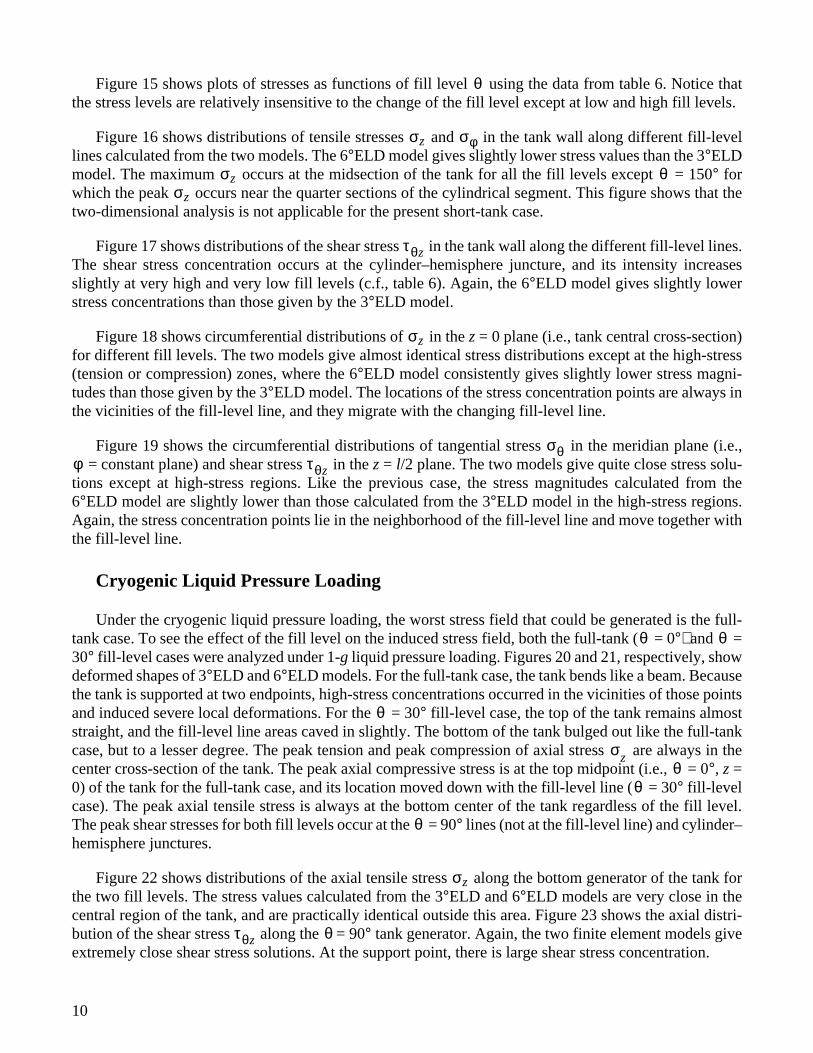
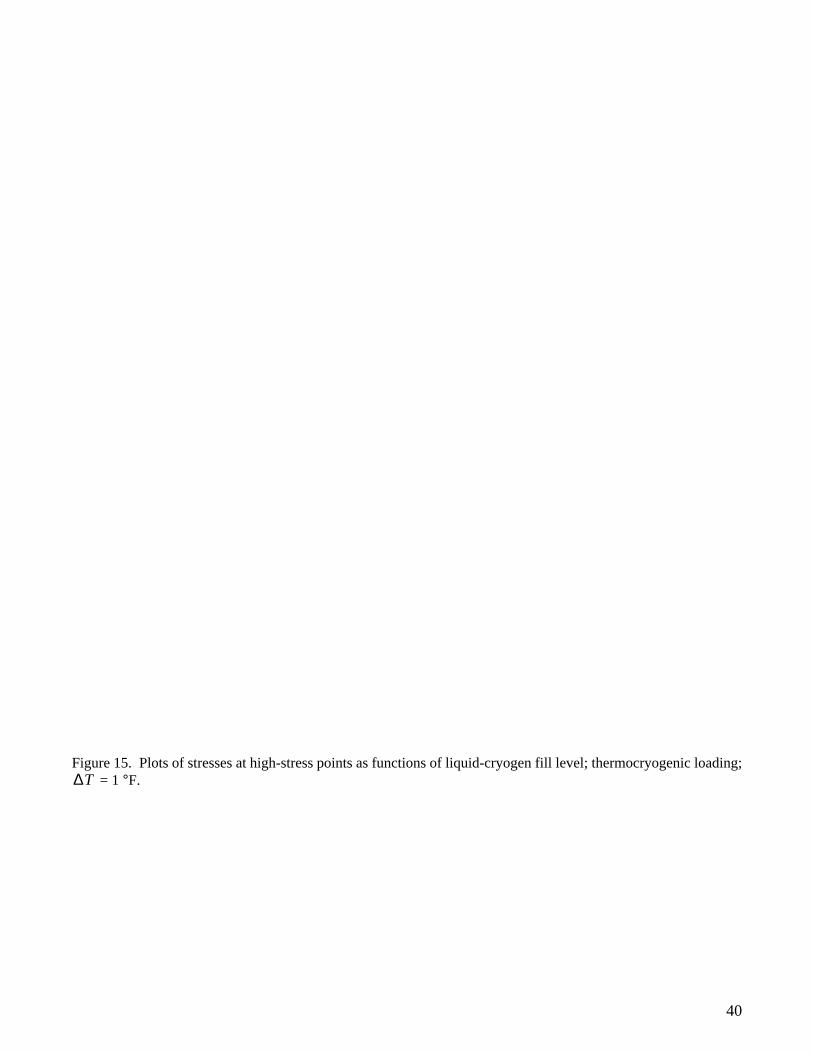
Figure 15 shows plots of stresses as functions of fill level using the data from table 6. Notice thatthe stress levels are relatively insensitive to the change of the fill level except at low and high fill levels.
Figure 16 shows distributions of tensile stresses and in the tank wall along different fill-levellines calculated from the two models. The 6°ELD model gives slightly lower stress values than the 3°ELDmodel. The maximum occurs at the midsection of the tank for all the fill levels except = 150° forwhich the peak occurs near the quarter sections of the cylindrical segment. This figure shows that thetwo-dimensional analysis is not applicable for the present short-tank case.
Figure 17 shows distributions of the shear stress in the tank wall along the different fill-level lines.The shear stress concentration occurs at the cylinder–hemisphere juncture, and its intensity increasesslightly at very high and very low fill levels (c.f., table 6). Again, the 6°ELD model gives slightly lowerstress concentrations than those given by the 3°ELD model.
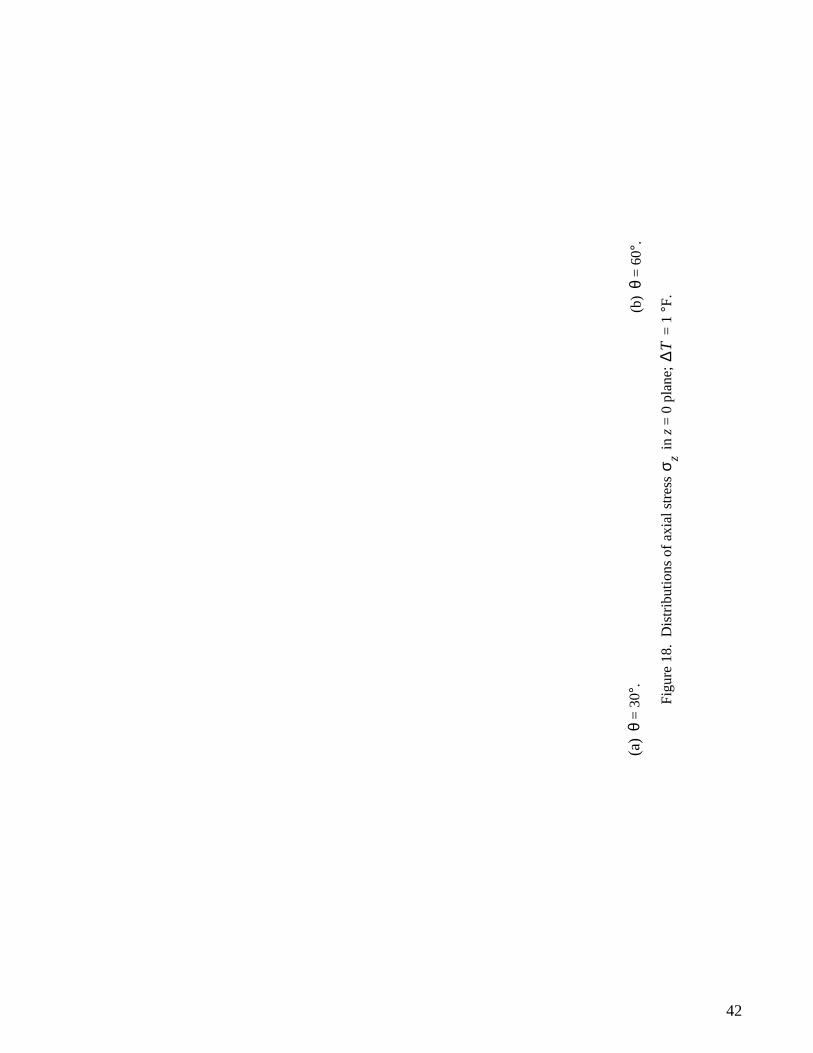
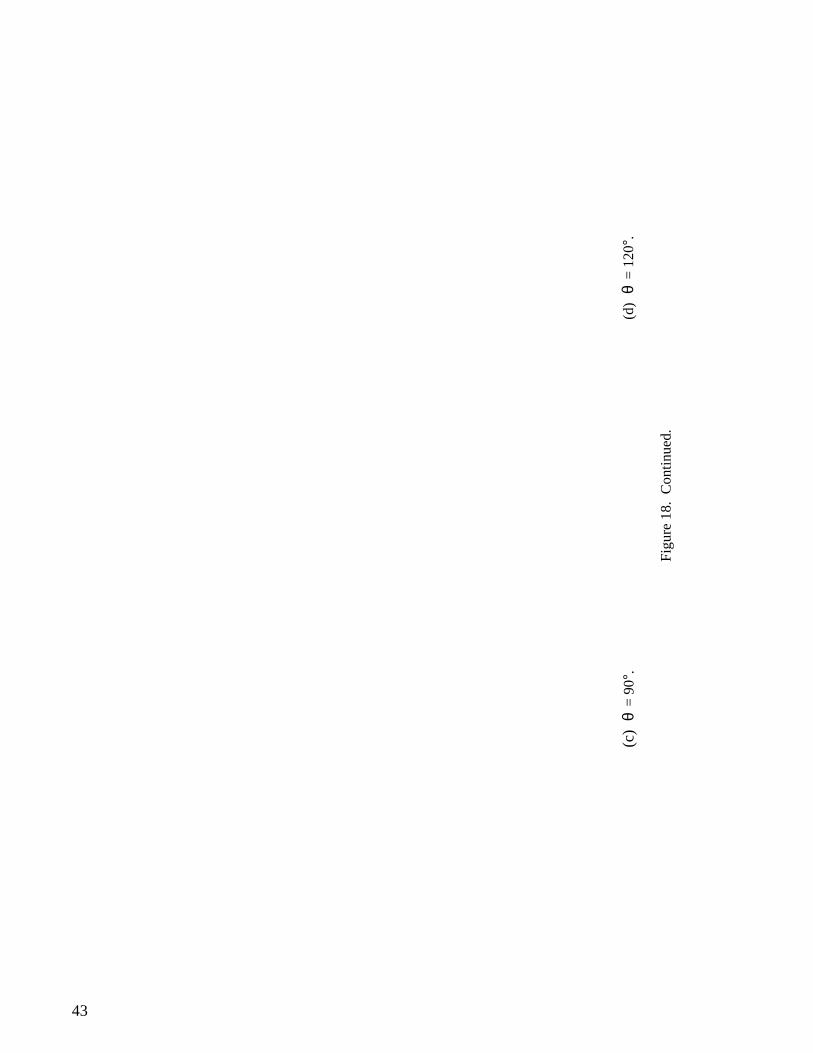
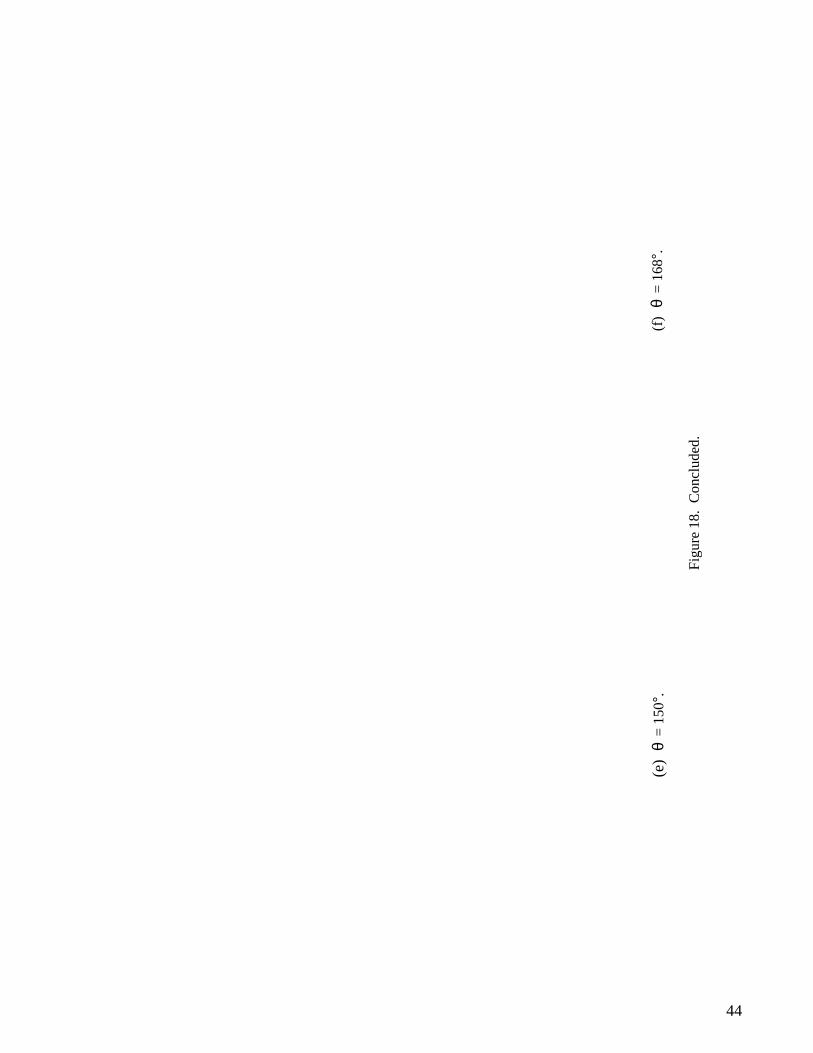
Figure 18 shows circumferential distributions of in thez = 0 plane (i.e., tank central cross-section)for different fill levels. The two models give almost identical stress distributions except at the high-stress(tension or compression) zones, where the 6°ELD model consistently gives slightly lower stress magni-tudes than those given by the 3°ELD model. The locations of the stress concentration points are always inthe vicinities of the fill-level line, and they migrate with the changing fill-level line.
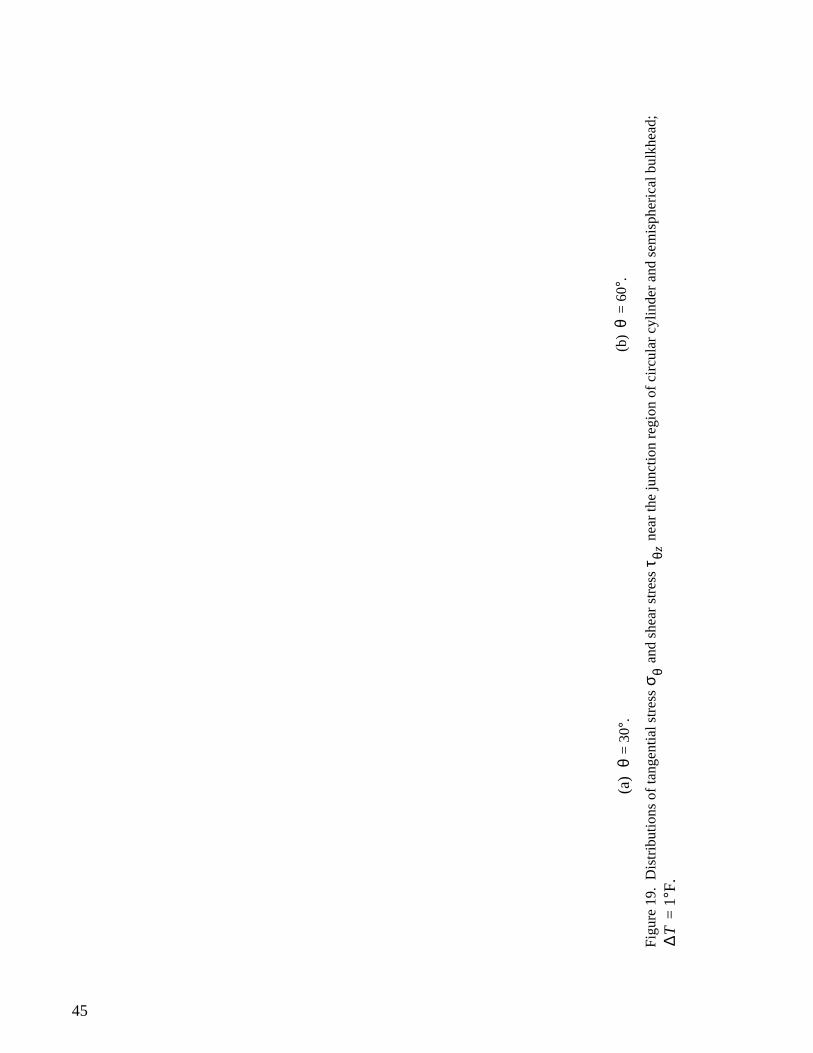
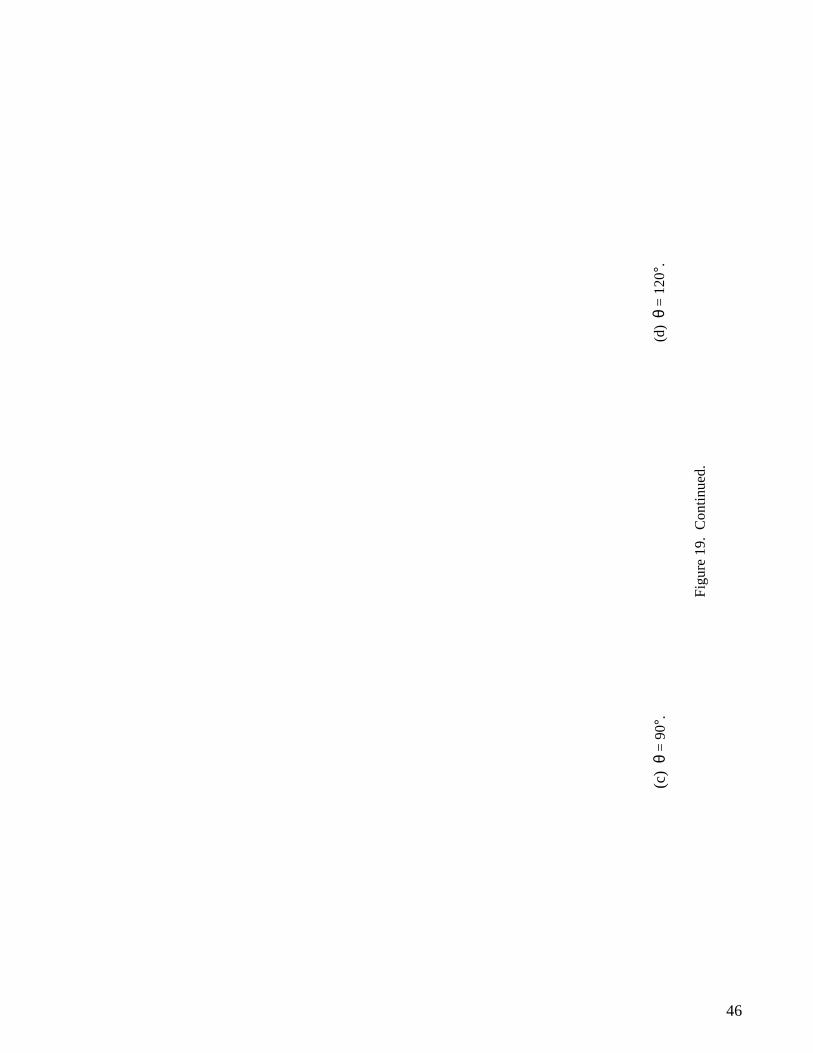
Figure 19 shows the circumferential distributions of tangential stress in the meridian plane (i.e.,= constant plane) and shear stress in thez = l/2 plane. The two models give quite close stress solu-
tions except at high-stress regions. Like the previous case, the stress magnitudes calculated from the6°ELD model are slightly lower than those calculated from the 3°ELD model in the high-stress regions.Again, the stress concentration points lie in the neighborhood of the fill-level line and move together withthe fill-level line.
Cryogenic Liquid Pressure Loading
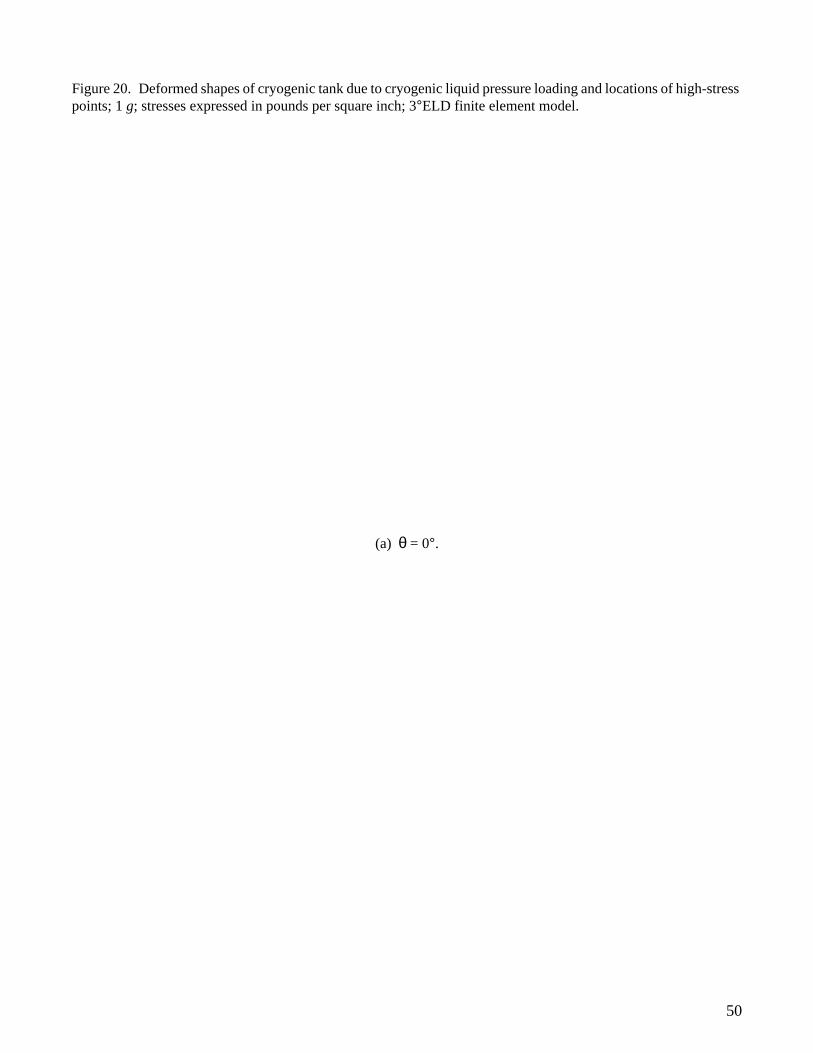
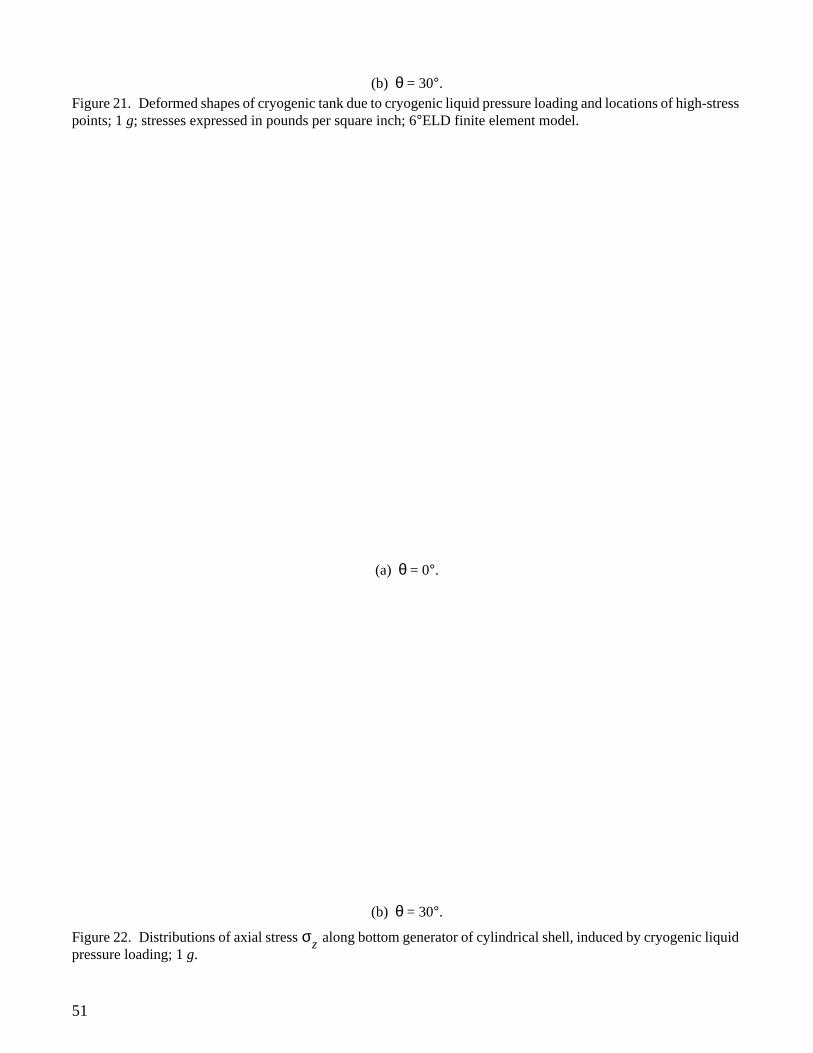
Under the cryogenic liquid pressure loading, the worst stress field that could be generated is the full-tank case. To see the effect of the fill level on the induced stress field, both the full-tank ( = 0°) and =30° fill-level cases were analyzed under 1-g liquid pressure loading. Figures 20 and 21, respectively, showdeformed shapes of 3°ELD and 6°ELD models. For the full-tank case, the tank bends like a beam. Becausethe tank is supported at two endpoints, high-stress concentrations occurred in the vicinities of those pointsand induced severe local deformations. For the = 30° fill-level case, the top of the tank remains almoststraight, and the fill-level line areas caved in slightly. The bottom of the tank bulged out like the full-tankcase, but to a lesser degree. The peak tension and peak compression of axial stress are always in thecenter cross-section of the tank. The peak axial compressive stress is at the top midpoint (i.e., = 0°, z =0) of the tank for the full-tank case, and its location moved down with the fill-level line ( = 30° fill-levelcase). The peak axial tensile stress is always at the bottom center of the tank regardless of the fill level.The peak shear stresses for both fill levels occur at the = 90° lines (not at the fill-level line) and cylinder–hemisphere junctures.
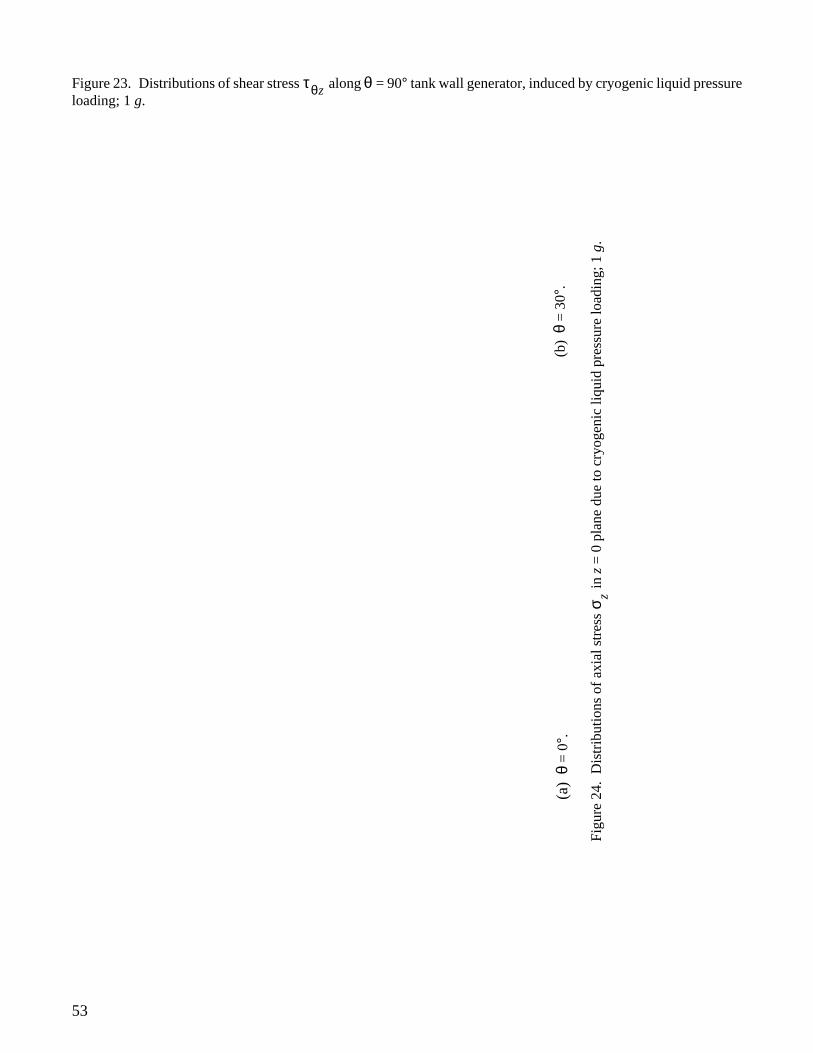
Figure 22 shows distributions of the axial tensile stress along the bottom generator of the tank forthe two fill levels. The stress values calculated from the 3°ELD and 6°ELD models are very close in thecentral region of the tank, and are practically identical outside this area. Figure 23 shows the axial distri-bution of the shear stress along the = 90° tank generator. Again, the two finite element models giveextremely close shear stress solutions. At the support point, there is large shear stress concentration.
θ
σz σφ
σz θσz
τθz
σz
σθφ τθz
θ θ
θ
σzθ
θ
θ
σz
τθz θ
11
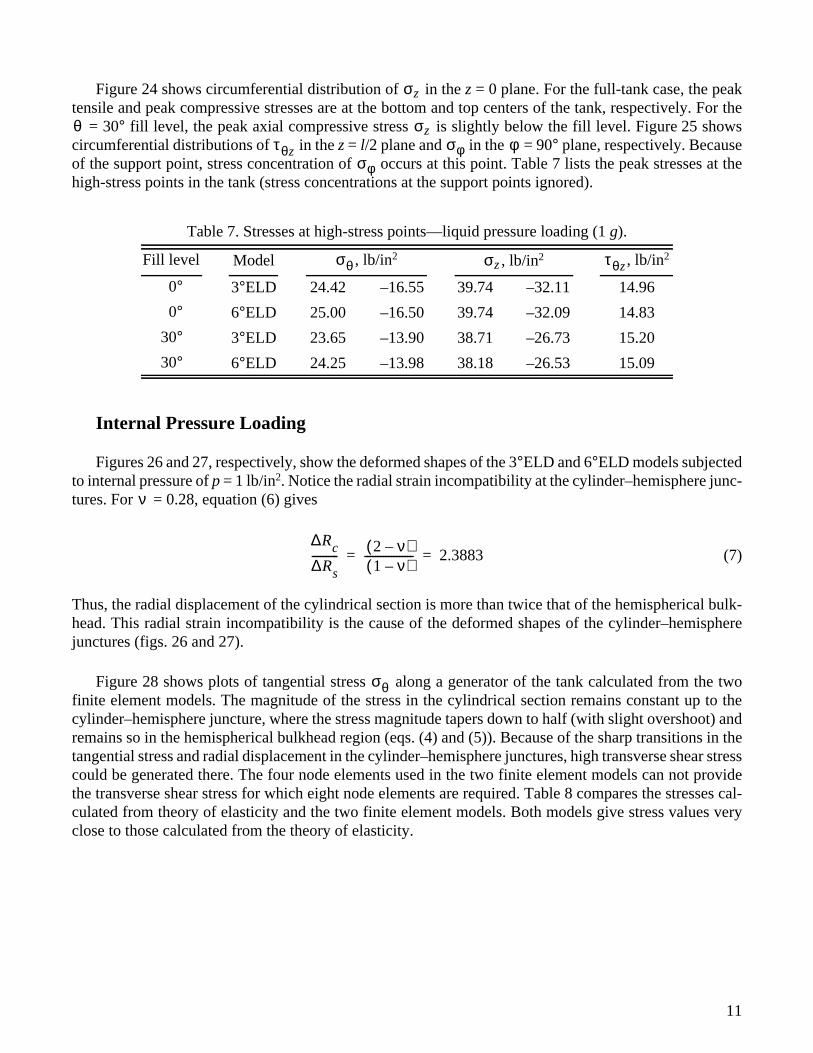
Figure 24 shows circumferential distribution of in thez = 0 plane. For the full-tank case, the peaktensile and peak compressive stresses are at the bottom and top centers of the tank, respectively. For the
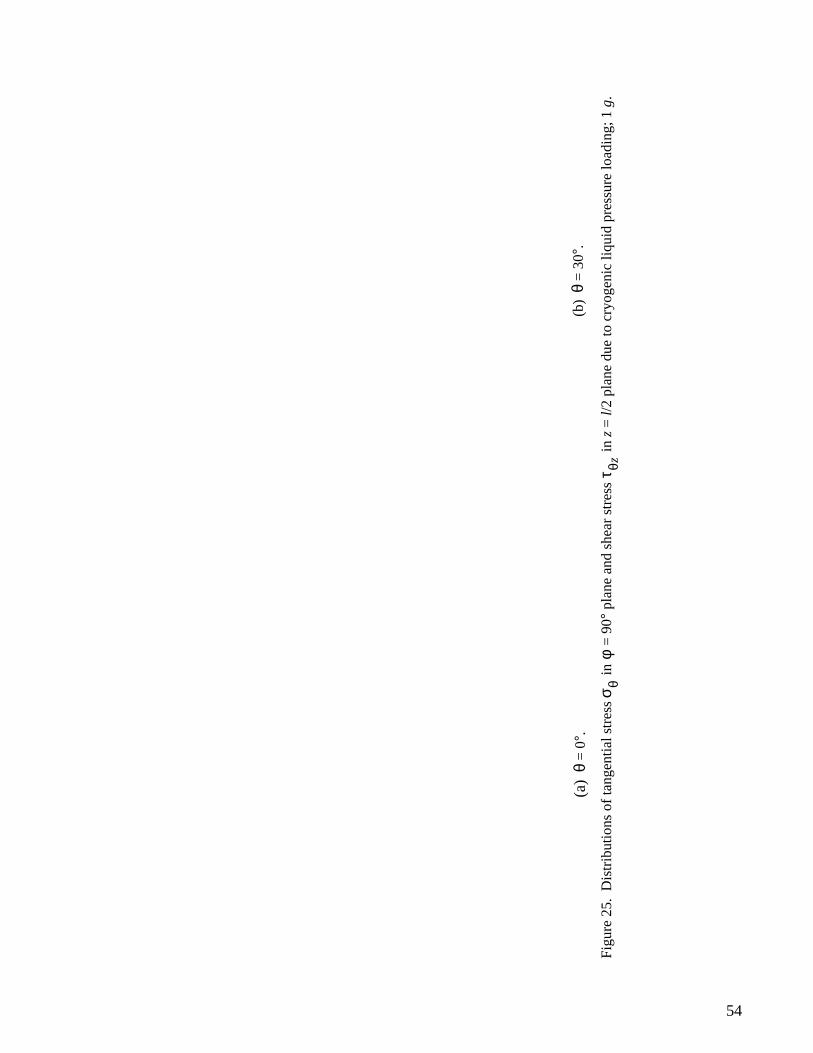
= 30° fill level, the peak axial compressive stress is slightly below the fill level. Figure 25 showscircumferential distributions of in thez = l/2 plane and in the = 90° plane, respectively. Becauseof the support point, stress concentration of occurs at this point. Table 7 lists the peak stresses at thehigh-stress points in the tank (stress concentrations at the support points ignored).
Internal Pressure Loading
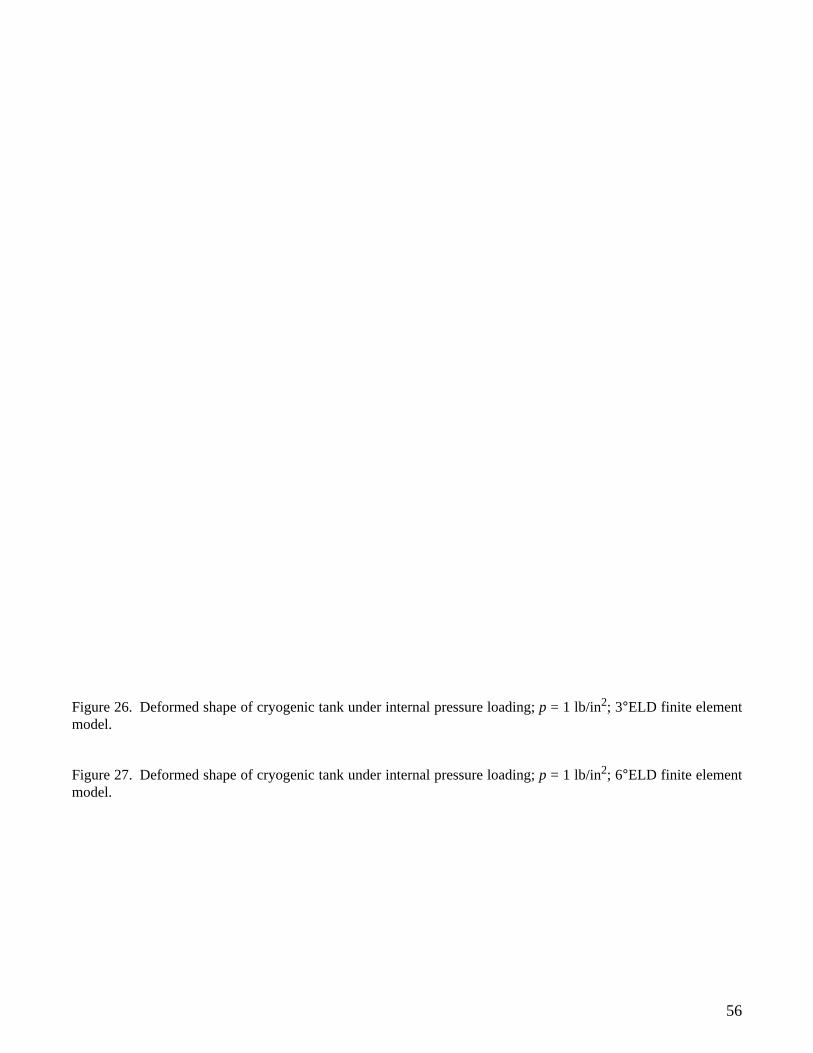
Figures 26 and 27, respectively, show the deformed shapes of the 3°ELD and 6°ELD models subjectedto internal pressure ofp = 1 lb/in2. Notice the radial strain incompatibility at the cylinder–hemisphere junc-tures. For = 0.28, equation (6) gives
(7)
Thus, the radial displacement of the cylindrical section is more than twice that of the hemispherical bulk-head. This radial strain incompatibility is the cause of the deformed shapes of the cylinder–hemispherejunctures (figs. 26 and 27).
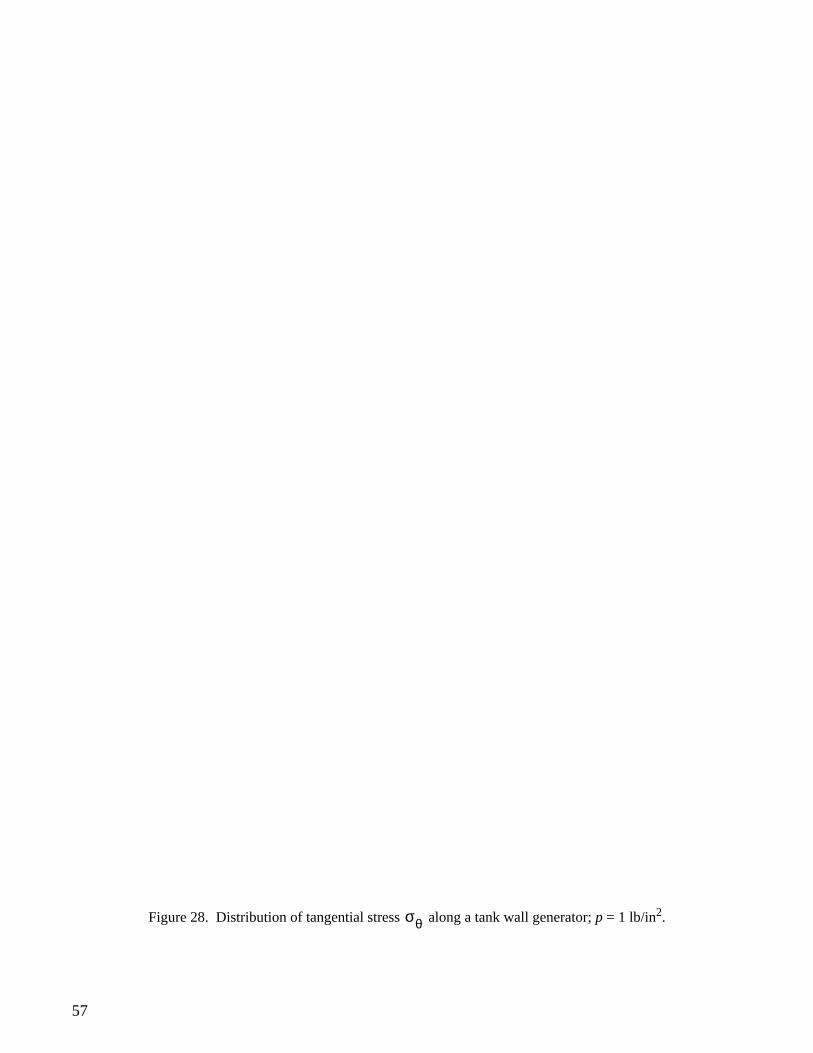
Figure 28 shows plots of tangential stress along a generator of the tank calculated from the twofinite element models. The magnitude of the stress in the cylindrical section remains constant up to thecylinder–hemisphere juncture, where the stress magnitude tapers down to half (with slight overshoot) andremains so in the hemispherical bulkhead region (eqs. (4) and (5)). Because of the sharp transitions in thetangential stress and radial displacement in the cylinder–hemisphere junctures, high transverse shear stresscould be generated there. The four node elements used in the two finite element models can not providethe transverse shear stress for which eight node elements are required. Table 8 compares the stresses cal-culated from theory of elasticity and the two finite element models. Both models give stress values veryclose to those calculated from the theory of elasticity.
Table 7. Stresses at high-stress points—liquid pressure loading (1g).
Fill level Model , lb/in2 , lb/in2 , lb/in2
0° 3°ELD 24.42 –16.55 39.74 –32.11 14.96
0° 6°ELD 25.00 –16.50 39.74 –32.09 14.83
30° 3°ELD 23.65 –13.90 38.71 –26.73 15.20
30° 6°ELD 24.25 –13.98 38.18 –26.53 15.09
σz
θ σzτθz σφ φ
σφ
σθ σz τθz
ν
∆Rc
∆Rs---------- 2 ν–( )
1 ν–( )------------------ 2.3883= =
σθ
12
Tank-Wall Inertia Loading
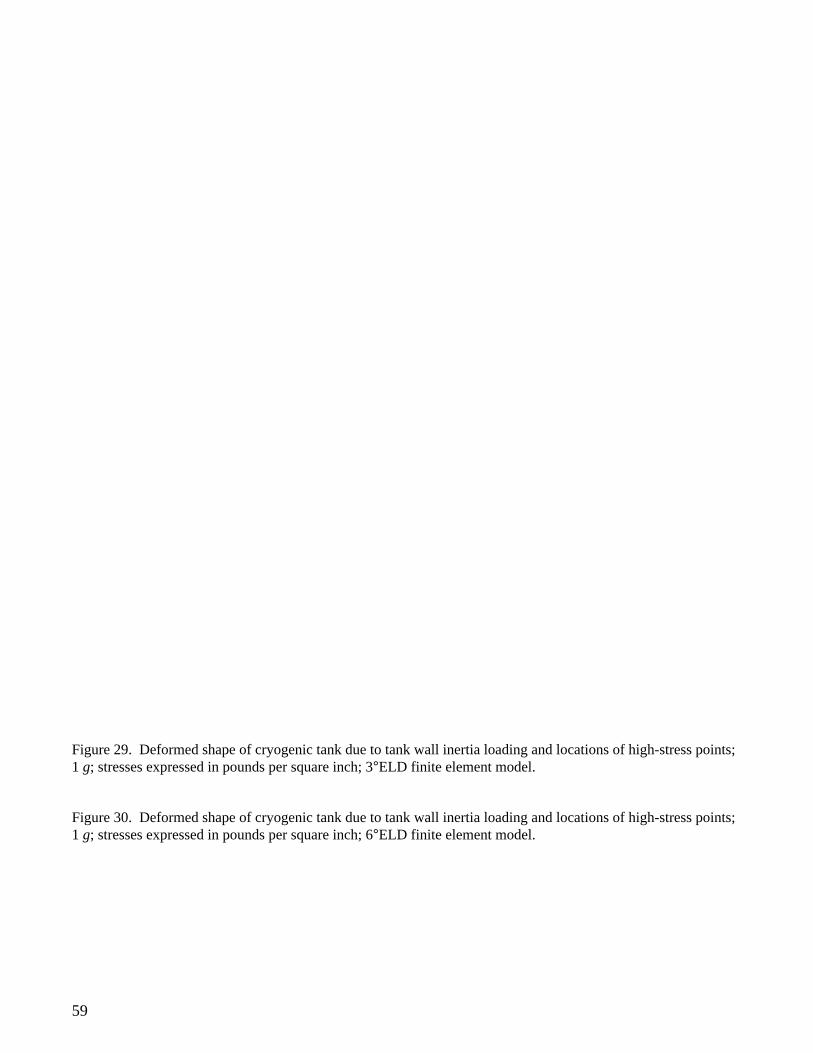
Under 1-g lateral inertia loading, the tank will bend like a beam under its own weight. Figures 29 and30, respectively, show the deformed shapes of the 3°ELD and 6°ELD models. The magnitude of the peakaxial compressive stress is slightly larger than that of the peak axial tensile stress. Both stresses are in thetank center cross-section. The peak shear stresses are at the cylinder–hemisphere junctures and are at the
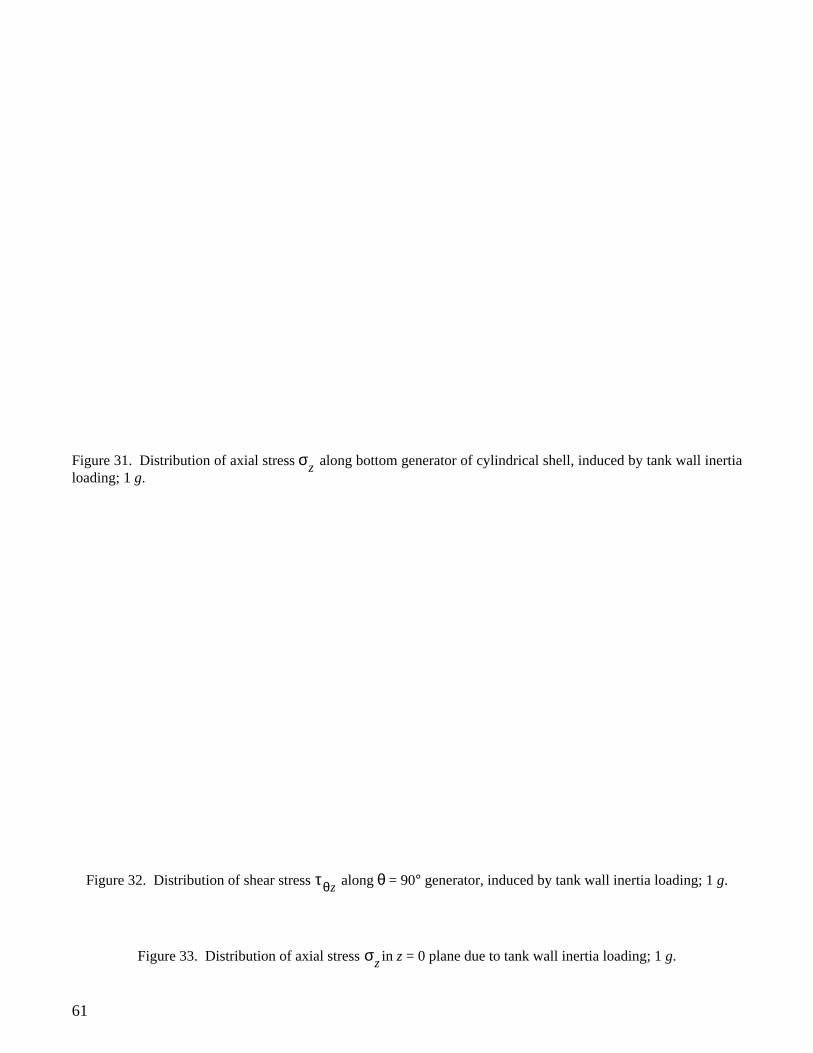
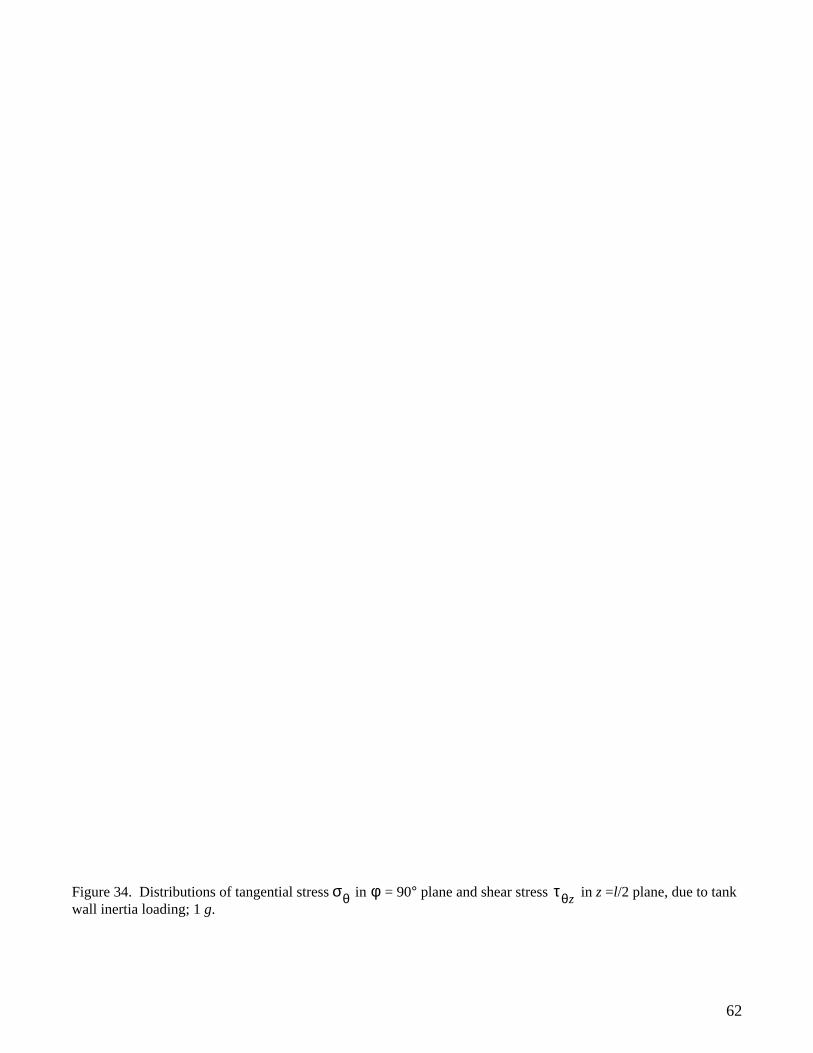
= 90° line. Figure 31 shows axial distributions of along the tank bottom generator calculated fromthe two models. The 6°ELD model gives slightly lower values of in the center region of the tank. Figure32 shows the axial distributions of along the = 90° tank generator. Both models give very close shearstress solutions. Again, the support point created very high shear stress concentrations. Figure 33 showsthe circumferential distributions of in thez = 0 plane, and figure 34 shows the composite circumferen-tial plots of in thez = l/2 plane, and in the = 90° plane. The support point also created very highstress concentrations of . Table 9 lists the stresses at the high-stress points resulting from 1-g inertialoading (stress concentrations at the support points not considered).
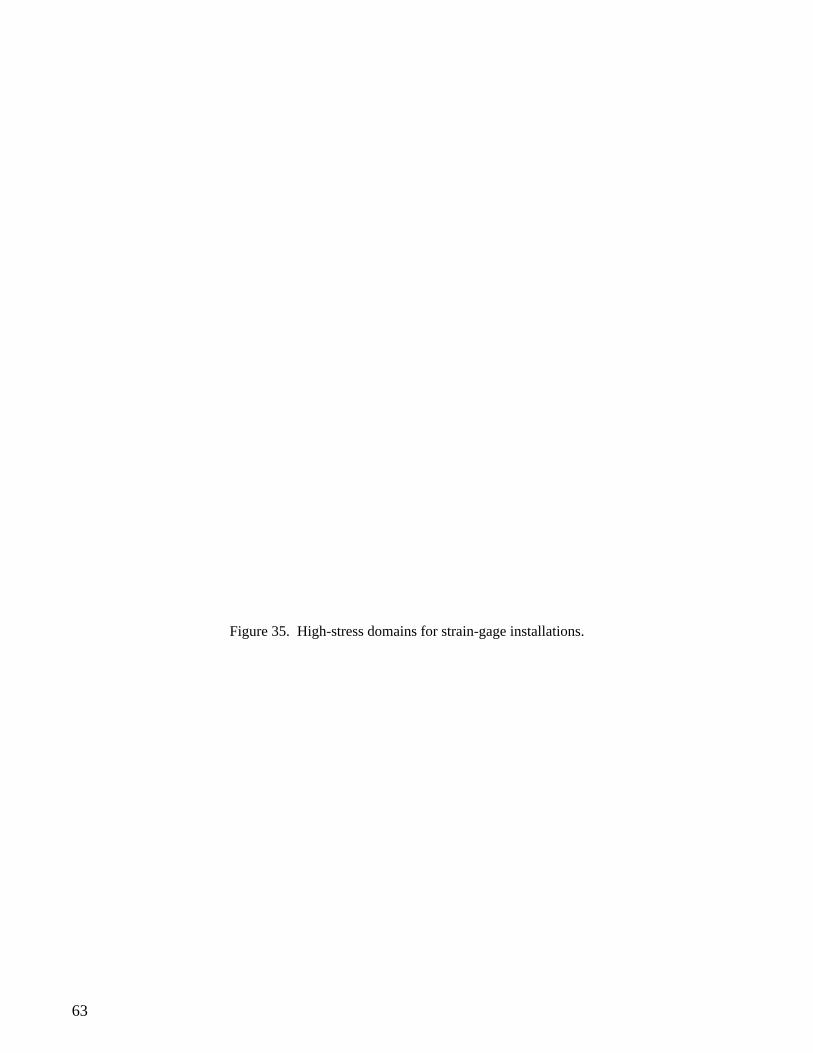
High-Stress Domains
Based on the above stress analyses, the domains of high-stress points may be mapped on the cryogenictank as shown in figure 35. Those high-stress domains were mapped based on the thermocryogenic stressanalysis, because this type of loading will create the most severe stress fields as compared with otherloading cases. In the experimental measurement of stresses, the high-stress domains are the areas wherestrain gages should be installed for obtaining the highest data outputs.
CONCLUDING REMARKS
Two finite element models of a cryogenic tank were set up for thermocryogenic buckling analysis andstress analysis of the tank under different loading conditions. The results of the analyses are summarizedin the following:
Table 8. Stresses induced by internal pressure loading (p = 1 lb/in2).
, lb/in2 , lb/in2
Theory of elasticity 95.50 47.75
3°ELD 95.47 47.74
6°ELD 95.36 47.73
Table 9. Stresses at peak stress points resulting from tank inertialoading of 1g.
Model , lb/in2 , lb/in2 , lb/in2
3°ELD 43.64 –44.46 78.28 –82.76 33.81
6°ELD 44.01 –43.43 76.43 –78.19 33.65
σθ σz
pRt
------- =pR2t------- =
θ σzσz
τθz θ
σzτθz σθ φ
σθ
σθ σz τθz
13
1. The thermocryogenic buckling temperature, , was insensitive to the liquid-cryogenfill level; however, it was sensitive to the radius-to-thickness ratio,R/t, and decreasedwith the increase ofR/t.
2. In thermocryogenic buckling analysis, the 6°ELD model gave lower values of andcould not give as smoothly buckled shapes as those the 3°ELD model gave. For ther-mocryogenic buckling analysis, the finite element density should be such that the ele-ment length is about five times the element thickness.
3. In the stress analysis, both 3°ELD and 6°ELD models gave very close stress solutions.Therefore, the 6°ELD model is adequate for reasonably accurate stress solutions, be-cause it requires about one-tenth of the computer central processing unit time than thatrequired to run the 3°ELD model.
4. Thermocryogenic loading induced the most severe stress fields. The peak tangentialstresses were in the region bounded by the 3° to 12° meridian planes; the peak axialstresses occurred in thez = 0 plane for all the fill levels except the = 150° fill-levelcase, for which the axial tensile stress occurred near thez = l/4 planes. The peak shearstresses occurred in thez = l/2 planes. The locations of those high-stress points movedwith the changing fill level.
5. The stress fields induced by liquid pressure, internal pressure, and inertia loadings aresecondary in nature as compared with the thermocryogenic loading.
6. High-stress domains were mapped on the cryogenic tank wall for experimental strain-gage installations.
Dryden Flight Research CenterNational Aeronautics and Space AdministrationEdwards, California, September 15, 1993
∆Tcr
∆Tcr
φ =θ
±±

14
Fig
ure
1.G
eom
etry
of c
ryog
enic
tank
.
15
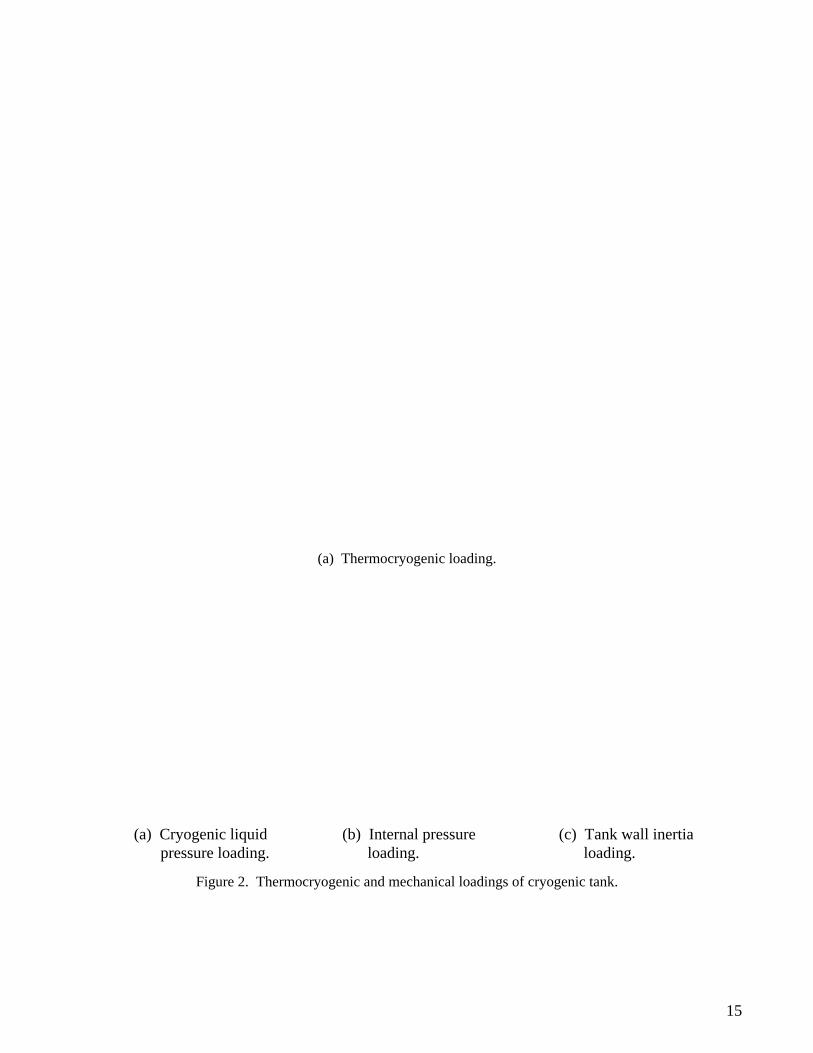
(a) Thermocryogenic loading.
(a) Cryogenic liquid (b) Internal pressure (c) Tank wall inertiapressure loading. loading. loading.
Figure 2. Thermocryogenic and mechanical loadings of cryogenic tank.
16
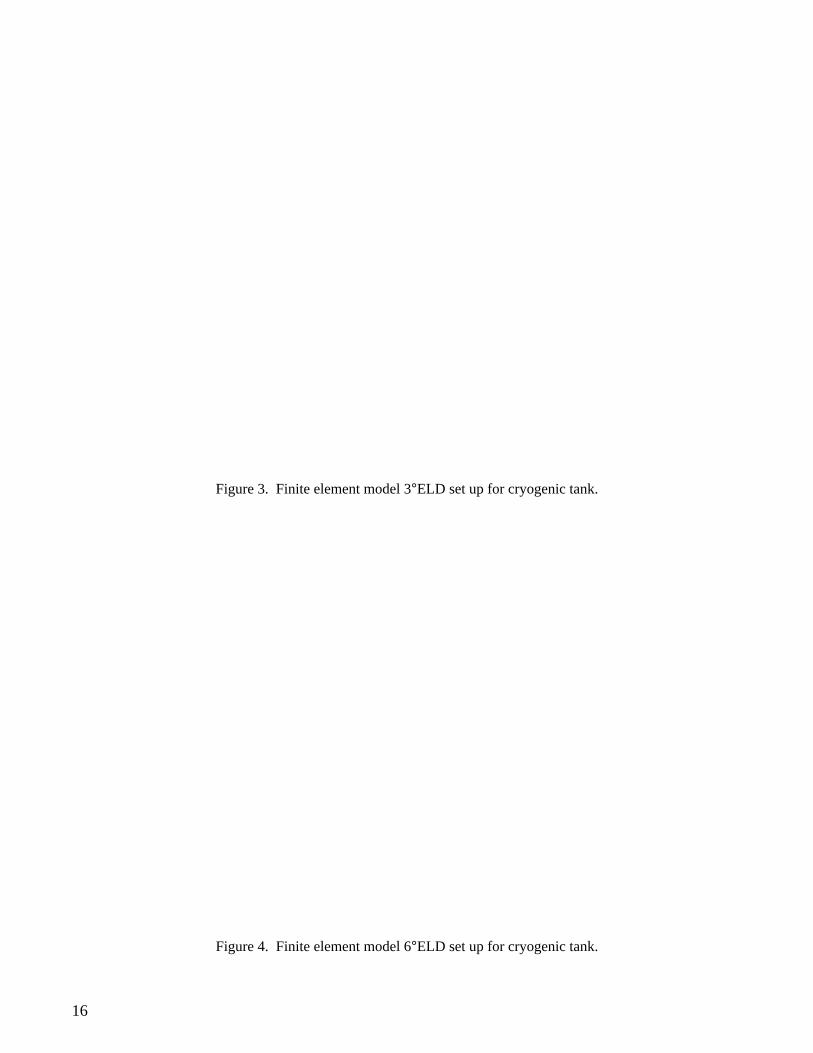
Figure 3. Finite element model 3°ELD set up for cryogenic tank.
Figure 4. Finite element model 6°ELD set up for cryogenic tank.
17
Thermocryogenic Buckling
18
Figure 5. Convergency curves of eigenvalue solutions; = 60°; 3°ELD finite element model.θ
19
(a) = 30°; = 2649°F.
(b) = 60°; = 2292°F.
Figure 6. Buckled shapes of partially filled cryogenic tank subjected to cylindrical strip heating; 3°ELD finite ele-ment model;R/t = 95.5.
θ ∆Tcr
θ ∆Tcr
20
(c) = 90°; = 2489°F.
(d) = 120°; = 2426°F.
Figure 6. Continued.
θ ∆Tcr
θ ∆Tcr
21
(e) = 150°; = 2378°F.
(f) = 168°; = 2007°F.
Figure 6. Concluded.
θ ∆Tcr
θ ∆Tcr
22
(a) = 30°; = 2323°F.
(b) = 60°; = 2063°F.
Figure 7. Buckled shapes of partially filled cryogenic tank subjected to cylindrical strip heating; 6°ELD finite ele-ment model;R/t = 95.5.
θ ∆Tcr
θ ∆Tcr
23
(c) = 90°; = 2241°F.
(d) = 120°; = 2182°F.
Figure 7. Continued.
θ ∆Tcr
θ ∆Tcr

24
(e) = 150°; = 2144°F.
(f) = 168°; = 1801°F.
Figure 7. Concluded.
θ ∆Tcr
θ ∆Tcr
25
(a) = 1415°F; R/t = 150.
(b) = 1060°F; R/t = 200.
Figure 8. Buckled shapes of partially filled cryogenic tank subjected to cylindrical strip heating; 3°ELD finite ele-ment model; = 60°.
∆Tcr
∆Tcr
θ
26
(c) = 849°F; R/t = 250.
(d) = 707°F; R/t = 300.
Figure 8. Continued.
∆Tcr
∆Tcr
27
(e) = 604°F; R/t = 350.
(f) = 525°F; R/t = 400.
Figure 8. Concluded.
∆Tcr
∆Tcr
28
(a) = 1198°F; R/t = 150.
(b) = 832°F; R/t = 200.
Figure 9. Buckled shapes of partially filled cryogenic tank subjected to cylindrical strip heating; 6°ELD finite ele-ment model; = 60°.
∆Tcr
∆Tcr
θ
29
(c) = 609°F; R/t = 250.
(d) = 451°F; R/t = 300.
Figure 9. Continued.
∆Tcr
∆Tcr
30
(e) = 347°F; R/t = 350.
(f) = 286°F; R/t = 400.
Figure 9. Concluded.
∆Tcr
∆Tcr
31
Figure 10. Variation of buckling temperature with liquid-cryogen fill level ;R/t = 95.5.
Figure 11. Plot of buckling temperature as a function of radius-to-thickness ratioR/t; = 60°; R =29.84375 in.
∆Tcr θ
∆Tcr θ
32
Figure 12. Increase of CPU time with number of eigenvalue iterations.
33
Thermocryogenic Loading
34
(a) = 30°.
(b) = 60°.Figure 13. Deformed shapes of cryogenic tank and locations of high-stress points; = 1°F; stresses expressedin pounds per square inch; 3°ELD finite element model.
θ
θ∆T

35
(c) = 90°.
(d) = 120°.
Figure 13. Continued.
θ
θ

36
(e) = 150°.
(f) = 168°.Figure 13. Concluded.
θ
θ
37
(a) = 30°.
(b) = 60°.Figure 14. Deformed shapes of cryogenic tank and locations of high-stress points; = 1°F; stresses expressedin pounds per square inch; 6°ELD finite element model.
θ
θ∆T

38
(c) = 90°.
(d) = 120°.
Figure 14. Continued.
θ
θ

39
(e) = 150°.
(f) = 168°.Figure 14. Concluded.
θ
θ
40
Figure 15. Plots of stresses at high-stress points as functions of liquid-cryogen fill level; thermocryogenic loading; = 1°F.∆T

41
Figure 16. Distributions of tensile stresses and in the cryogenic tank wall along liquid-cryogen fill levellines; = 1°F.
Figure 17. Distributions of shear stresses in the cryogenic tank wall along liquid-cryogen fill level lines; = 1°F.
σz σφ∆T
∆T
42
(a)
= 3
0°.
θ(b
) =
60°
.θ
Fig
ure
18.
Dis
trib
utio
ns o
f axi
al s
tres
s inz
= 0
pla
ne;
= 1°
F.
σ z∆
T
43
Fig
ure
18.
Con
tinue
d.
(c)
= 9
0°.
θ(d
) =
120
°.θ
44
Fig
ure
18.
Con
clud
ed.
(e)
= 1
50°.
θ(f
) =
168
°.θ
45
(a)
= 3
0°.
θ(b
) =
60°
.θ
Fig
ure
19.
Dis
trib
utio
ns o
f tan
gent
ial s
tres
s a
nd s
hear
str
ess
nea
r th
e ju
nctio
n re
gion
of c
ircul
ar c
ylin
der
and
sem
isph
eric
al b
ulkh
ead;
= 1
°F.
σ θτ θz
∆T
46
Fig
ure
19.
Con
tinue
d.
(c)
= 9
0°.
θ(d
) =
120
°.θ
47
Fig
ure
19.
Con
clud
ed.
(f)
= 1
68°.
θ(e
) =
150
°.θ

48
Cryogenic Liquid Pressure Loading

49
(a) = 0°.
(b) = 30°.
θ
θ
50
Figure 20. Deformed shapes of cryogenic tank due to cryogenic liquid pressure loading and locations of high-stresspoints; 1g; stresses expressed in pounds per square inch; 3°ELD finite element model.
(a) = 0°.θ
51
(b) = 30°.Figure 21. Deformed shapes of cryogenic tank due to cryogenic liquid pressure loading and locations of high-stresspoints; 1g; stresses expressed in pounds per square inch; 6°ELD finite element model.
(a) = 0°.
(b) = 30°.
Figure 22. Distributions of axial stress along bottom generator of cylindrical shell, induced by cryogenic liquidpressure loading; 1g.
θ
θ
θσz

52
(a) = 0°.
(b) = 30°.
θ
θ
53
Figure 23. Distributions of shear stress along = 90° tank wall generator, induced by cryogenic liquid pressureloading; 1g.
τθz θ
Fig
ure
24.
Dis
trib
utio
ns o
f axi
al s
tres
s inz
= 0
pla
ne d
ue to
cry
ogen
ic li
quid
pre
ssur
e lo
adin
g; 1
g.σ z
(a)
= 0
°.θ
(b)
= 3
0°.
θ
54
Fig
ure
25.
Dis
trib
utio
ns o
f tan
gent
ial s
tres
s in
= 9
0°
plan
e an
d sh
ear
stre
ss inz =
l/2 p
lane
due
to c
ryog
enic
liqu
id p
ress
ure
load
ing;
1g.
σ θφ
τ θz
(a)
= 0
°.θ
(b)
= 3
0°.
θ

55
Internal Pressure Loading
56
Figure 26. Deformed shape of cryogenic tank under internal pressure loading;p = 1 lb/in2; 3°ELD finite elementmodel.
Figure 27. Deformed shape of cryogenic tank under internal pressure loading;p = 1 lb/in2; 6°ELD finite elementmodel.
57
Figure 28. Distribution of tangential stress along a tank wall generator;p = 1 lb/in2.σθ
58
Tank Wall Inertia Loading
59
Figure 29. Deformed shape of cryogenic tank due to tank wall inertia loading and locations of high-stress points;1 g; stresses expressed in pounds per square inch; 3°ELD finite element model.
Figure 30. Deformed shape of cryogenic tank due to tank wall inertia loading and locations of high-stress points;1 g; stresses expressed in pounds per square inch; 6°ELD finite element model.

60
61
Figure 31. Distribution of axial stress along bottom generator of cylindrical shell, induced by tank wall inertialoading; 1g.
Figure 32. Distribution of shear stress along = 90° generator, induced by tank wall inertia loading; 1g.
Figure 33. Distribution of axial stress inz = 0 plane due to tank wall inertia loading; 1g.
σz
τθz θ
σz
62
Figure 34. Distributions of tangential stress in = 90° plane and shear stress inz =l/2 plane, due to tankwall inertia loading; 1g.
σθ φ τθz
63
Figure 35. High-stress domains for strain-gage installations.
63
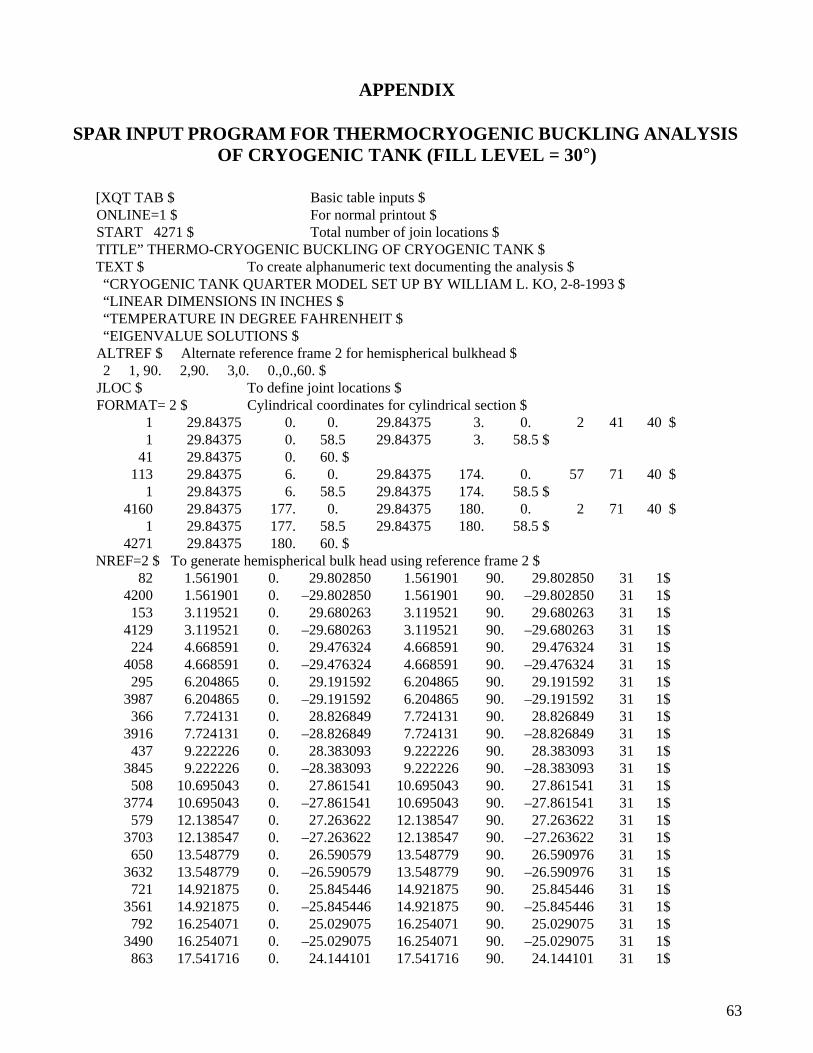
APPENDIX
SPAR INPUT PROGRAM FOR THERMOCRYOGENIC BUCKLING ANALYSISOF CRYOGENIC TANK (FILL LEVEL = 30 °)
[XQT TAB $ Basic table inputs $ONLINE=1 $ For normal printout $START 4271 $ Total number of join locations $TITLE” THERMO-CRYOGENIC BUCKLING OF CRYOGENIC TANK $TEXT $ To create alphanumeric text documenting the analysis $“CRYOGENIC TANK QUARTER MODEL SET UP BY WILLIAM L. KO, 2-8-1993 $“LINEAR DIMENSIONS IN INCHES $“TEMPERATURE IN DEGREE FAHRENHEIT $“EIGENVALUE SOLUTIONS $
ALTREF $ Alternate reference frame 2 for hemispherical bulkhead $2 1, 90. 2,90. 3,0. 0.,0.,60. $
JLOC $ To define joint locations $FORMAT= 2 $ Cylindrical coordinates for cylindrical section $
1 29.84375 0. 0. 29.84375 3. 0. 2 41 40 $1 29.84375 0. 58.5 29.84375 3. 58.5 $
41 29.84375 0. 60. $113 29.84375 6. 0. 29.84375 174. 0. 57 71 40 $
1 29.84375 6. 58.5 29.84375 174. 58.5 $4160 29.84375 177. 0. 29.84375 180. 0. 2 71 40 $
1 29.84375 177. 58.5 29.84375 180. 58.5 $4271 29.84375 180. 60. $
NREF=2 $ To generate hemispherical bulk head using reference frame 2 $82 1.561901 0. 29.802850 1.561901 90. 29.802850 31 1$
4200 1.561901 0. –29.802850 1.561901 90. –29.802850 31 1$153 3.119521 0. 29.680263 3.119521 90. 29.680263 31 1$
4129 3.119521 0. –29.680263 3.119521 90. –29.680263 31 1$224 4.668591 0. 29.476324 4.668591 90. 29.476324 31 1$
4058 4.668591 0. –29.476324 4.668591 90. –29.476324 31 1$295 6.204865 0. 29.191592 6.204865 90. 29.191592 31 1$
3987 6.204865 0. –29.191592 6.204865 90. –29.191592 31 1$366 7.724131 0. 28.826849 7.724131 90. 28.826849 31 1$
3916 7.724131 0. –28.826849 7.724131 90. –28.826849 31 1$437 9.222226 0. 28.383093 9.222226 90. 28.383093 31 1$
3845 9.222226 0. –28.383093 9.222226 90. –28.383093 31 1$508 10.695043 0. 27.861541 10.695043 90. 27.861541 31 1$
3774 10.695043 0. –27.861541 10.695043 90. –27.861541 31 1$579 12.138547 0. 27.263622 12.138547 90. 27.263622 31 1$
3703 12.138547 0. –27.263622 12.138547 90. –27.263622 31 1$650 13.548779 0. 26.590579 13.548779 90. 26.590976 31 1$
3632 13.548779 0. –26.590579 13.548779 90. –26.590976 31 1$721 14.921875 0. 25.845446 14.921875 90. 25.845446 31 1$
3561 14.921875 0. –25.845446 14.921875 90. –25.845446 31 1$792 16.254071 0. 25.029075 16.254071 90. 25.029075 31 1$
3490 16.254071 0. –25.029075 16.254071 90. –25.029075 31 1$863 17.541716 0. 24.144101 17.541716 90. 24.144101 31 1$
64
3419 17.541716 0. –24.144101 17.541716 90. –24.144101 31 1$934 18.781280 0. 23.192950 18.781280 90. 23.192950 31 1$
3348 18.781280 0. –23.192950 18.781280 90. –23.192950 31 1$1005 19.969367 0. 22.178228 19.969367 90. 22.178228 31 1$3277 19.969367 0. –22.178228 19.969367 90. –22.178228 31 1$1076 21.102718 0. 21.102718 21.102718 90. 21.102718 31 1$3206 21.102718 0. –21.102718 21.102718 90. –21.102718 31 1$1147 22.178228 0. 19.969367 22.178228 90. 19.969367 31 1$3135 22.178228 0. –19.969367 22.178228 90. –19.969367 31 1$1218 23.192950 0. 18.781280 23.192950 90. 18.781280 31 1$3064 23.192950 0. –18.781280 23.192950 90. –18.781280 31 1$1289 24.144101 0. 17.541716 24.144101 90. 17.541716 31 1$2993 24.144101 0. –17.541716 24.144101 90. –17.541716 31 1$1360 25.029075 0. 16.254071 25.029075 90. 16.254071 31 1$2922 25.029075 0. –16.254071 25.029075 90. –16.254071 31 1$1431 25.845446 0. 14.921875 25.845446 90. 14.921875 31 1$2851 25.845446 0. –14.921875 25.845446 90. –14.921875 31 1$1502 26.590976 0. 13.548779 26.590976 90. 13.548779 31 1$2780 26.590976 0. –13.548779 26.590976 90. –13.548779 31 1$1573 27.263622 0. 12.138547 27.263622 90. 12.138547 31 1$2709 27.263622 0. –12.138547 27.263622 90. –12.138547 31 1$1644 27.861541 0. 10.695043 27.861541 90. 10.695043 31 1$2638 27.861541 0. –10.695043 27.861541 90. –10.695043 31 1$1715 28.383093 0. 9.222226 28.383093 90. 9.222226 31 1$2567 28.383093 0. –9.222226 28.383093 90. –9.222226 31 1$1786 28.826849 0. 7.724131 28.826849 90. 7.724131 31 1$2496 28.826849 0. –7.724131 28.826849 90. –7.724131 31 1$1857 29.191592 0. 6.204865 29.191592 90. 6.204865 31 1$2425 29.191592 0. –6.204865 29.191592 90. –6.204865 31 1$1928 29.476324 0. 4.668591 29.476324 90. 4.668591 31 1$2354 29.476324 0. –4.668591 29.476324 90. –4.668591 31 1$1999 29.680263 0. 3.119521 29.680263 90. 3.119521 31 1$2283 29.680263 0. –3.119521 29.680263 90. –3.119521 31 1$2070 29.802850 0. 1.561901 29.802850 90. 1.561901 31 1$2212 29.802850 0. –1.561901 29.802850 90. –1.561901 31 1$2141 29.84375 0. 0. 29.84375 90. 0. 31 1$
MATC $ To specify material properties $1 27.9+6 0.28 0.29 9.0–6 9.0–6 $ For hot region $2 27.9+6 0.28 0.29 7.8–6 7.8–6 $ For cold region $
SA $ Shell section properties $FORMAT=ISOTROPIC; 1 0.3125 $ Shell thickness $
CONSTRAINT CASE 1 $ To constrain certain joint $SYMMETRY PLANE=2 $ Symmetry with respect to xz plane $SYMMETRY PLANE=3 $ Symmetry with respect to xy plane $ZERO 1 2; 2171 $ Joint 2171 has zero x- and y-displacements $
[XQT ELD $ To form data sets containing element definitions $E43 $ Quadrilateral combined membrane and bending element $GROUT 1” HOT REGION $
NMAT=1 $ Pointer command for material 1 $NSECT=1 $ Pointer command for shell thickness 1 $
1 42 43 2 1 1 40 $
65
42 113 114 43 1 9 70 $ 30 degree liquid level $GROUP 2” COLD REGION $
NMAT=2 $NSECT=1 $
681 752 753 682 1 49 70 $ 30 degree liquid level $4160 4231 4232 4161 1 1 40 $
E33 $ Triangular combined membrane and bending element $GROUP 1” HOT REGION $NMAT=1 $NSECT=1 $
41 82 83 2 30 $GROUP 2” COLD REGION $
NMAT=2 $NSECT=1 $4271 4230 4229 2 30 $
[XQT TOPO $ To analyze element interconnection topology $RESET LRKMAP=55000 $ Block length of data set KMAP $RESET LRAMAP=100000 $ Block length of data set AMAP $RESET MAXSUB=54000 $ Maximum allowable value of size index “Is” $
[XQT E $ Element information packet $[XQT EKS $ Element intrinsic stiffness and stress matrix generator $[XQT K $ To assemble unconstrained system stiffness matrices $[XQT AUS $ Subprocessor for arithmetic utility system $ALPHA; CASE TITLE 1 $ To define case title $
1” SUPPORTED AT JOINT 2171 $TABLE; NODAL TEMPERATURE 1 $ Temperature input $
CASE 1 $ LIQUID LEVEL THETA=30 DEGREES $J=1,467; 1. $ Hot region $J=468,538; .75 $J=539,609; .5 $J=610,680; .25 $J=681,4271; 0. $ Liquid level $
[XQT INV $ SPAR format matrix decomposition processor $RESET CON=1 LRA=12000 $ Constrain case=1, output data set block length $
[XQT EQNF $ Equivalent nodal force generator for thermal loads $RESET SET=1 $
[XQT SSOL $ Static solution generator $[XQT AUS $ Subprocessor for arithmetic utility system $DEFINE D=STAT DISP $ To define static displacements $DEFINE R=STAT REAC $ To define static reactions $GLOB DISP=LTOG (D) $ Displacememts in global cordinate system $GLOB REAC=LTOG (R) $ Reaction in global cordinate system $
[XQT VPRT $ Vector printer $TPRINT STAT DISP $ To print static displacements $TPRINT STAT REAC To print static reactions
[XQT GSF $ Stress data generator $RESET EMBED=1 SET=1 $ All stresses computed in the current GSF
$ execution will be embedded in the E-state,$ for use in computing geometric stiffness$ matrices, KG $[XQT PSF $ Stress table printer $
66
RESET CROSS=0 $ To print midsurface stresses $E43; E33 $
[XQT KG $ System initial stress (geometric) stiffness matrix assembler $[XQT AUS $ Subprocessor for arithmetic utility system $
K1800=SUM (K, 1800. KG) $ To redefine new K by shifting 1800. $[XQT INV $ SPAR format matrix decomposition processor $
RESET K=K1800 $ To replace K with K1800 $[XQT EIG $ Sparse matrix eigensolver $RESET PROB=BUCK CON=1 INIT=1 NREQ=1 K=K1800 SHIFT=1800. NDYN=100 $
[XQT DCU $ Data complex utility program $TOC=1 $ Table of content=1 $
[XQT PLTA $ Plot specification generator $SPEC=1 $
STITLE” UNDEFORMED SHAPE $ROTATE 20,1 5,2 5,3 $ To rotate 20, 5, 5 degrees respectivelyVIEW=2 $ with respect to x, y, and z-axes $SYM 3 $ To add mirror image with respect to xy-plane $E43 1; E43 2; E33 1; E33 2 $
SPEC=2 $STITLE” BUCKLED SHAPE-LIQUID LEVEL=30 DEGREES $ROTATE 20,1 5,2 5,3 $VIEW=2 $SYM 3 $E43 1; E43 2; E33 1; E33 2 $SPEC=3 $
STITLE” DEFORMED SHAPE-LIQUID LEVEL=30 DEGREES $ROTATE 20,1 5,2 5,3 $VIEW=2 $SYM 3 $E43 1; E43 2; E33 1; E33 2 $
[XQT PLTB $ Production of graphical display $DISP=UNDEF $ To display undeformed shape $PLOT=1 $DISP=BUC $ To display buckled shape $
DNORM=3.0 $ To define displacement scale $PLOT=2 $
DISP=STAT $ To display static demormation shape $DNORM=6.0 $ To define displacement scale $PLOT=3 $
[XQT EXIT $ To end the input program $
66
REFERENCES
1. Timoshenko, S.P. and S.W. Krieger,Theory of Plates and Shells, McGraw-Hill Book Co., Inc., NewYork, 1959, pp. 481–485.
2. Stephens, Craig A. and Gregory J. Hanna,Thermal Modeling and Analysis of a Cryogenic Tank DesignExposed to Extreme Heating Profiles, NASA CR-186012, 1991.
3. Hanna, Gregory J. and Craig A. Stephens,Predicted Thermal Response of a Cryogenic Fuel TankExposed to Simulated Aerodynamic Heating Profiles With Different Cryogens and Fill Levels, NASA CR-4395, 1991.
4. Hill, D.W., “Buckling of a Thin Circular Cylindrical Shell Heated Along an Axial Strip,” AFOSR-TN-59-1250, Dec. 1959.
5. Abir, David and S.V. Nardo, “Thermal Buckling of Circular Cylindrical Shells Under CircumferentialTemperature Gradients,”J. Aero/Space Sciences, vol. 29, Dec. 1959, pp. 803–808.
6. Bushnell, David and Strether Smith, “Stress and Buckling of Nonuniformly Heated Cylindrical andConical Shells,”AIAA Journal, vol. 9, no. 12, Dec. 1972, pp. 2314–2321.
7. Whetstone, W.D.,SPAR Structural Analysis System Reference Manual, System Level 13A, Vol. 1, Pro-gram Execution, NASA CR-158970-1, Dec. 1978.

67

68

69

70

71

72

73
REPORT DOCUMENTATION PAGE Form ApprovedOMB No. 0704-0188
Public reporting burden for this collection of information is estimated to average 1 hour per response, including the time for reviewing instructions, searching existing data sources,gathering and maintaining the data needed, and completing and reviewing the collection of information. Send comments regarding this burden estimate or any other aspect of thiscollection of information, including suggestions for reducing this burden, to Washington Headquarters Services, Directorate for Information Operations and Reports, 1215 JeffersonDavis Highway, Suite 1204, Arlington, VA 22202-4302, and to the Office of Management and Budget, Paperwork Reduction Project (0704-0188), Washington, DC 20503.
1. AGENCY USE ONLY (Leave blank) 2. REPORT DATE 3. REPORT TYPE AND DATES COVERED
4. TITLE AND SUBTITLE 5. FUNDING NUMBERS
6. AUTHOR(S)
8. PERFORMING ORGANIZATIONREPORT NUMBER
7. PERFORMING ORGANIZATION NAME(S) AND ADDRESS(ES)
9. SPONSORING/MONOTORING AGENCY NAME(S) AND ADDRESS(ES) 10. SPONSORING/MONITORINGAGENCY REPORT NUMBER
11. SUPPLEMENTARY NOTES
12a. DISTRIBUTION/AVAILABILITY STATEMENT 12b. DISTRIBUTION CODE
Unclassified—UnlimitedSubject Category 39
13. ABSTRACT (Maximum 200 words)
14. SUBJECT TERMS 15. NUMBER OF PAGES
16. PRICE CODE
17. SECURITY CLASSIFICATIONOF REPORT
18. SECURITY CLASSIFICATIONOF THIS PAGE
19. SECURITY CLASSIFICATIONOF ABSTRACT
20. LIMITATION OF ABSTRACT
NSN 7540-01-280-5500 Standard Form 298 (Rev. 2-89)Prescribed by ANSI Std. Z39-18298-102
Thermocryogenic Buckling and Stress Analyses of a Partially FilledCryogenic Tank Subjected to Cylindrical Strip Heating
WU 505-70-63
William L. Ko
NASA Dryden Flight Research CenterP.O. Box 273Edwards, California 93523-0273
H-1955
National Aeronautics and Space AdministrationWashington, DC 20546-0001 NASA TM-4579
Thermocryogenic buckling and stress analyses were conducted on a horizontally oriented cryogen-ic tank using the finite element method. The tank is a finite-length circular cylindrical shell with its twoends capped with hemispherical shells. The tank is subjected to cylindrical strip heating in the regionabove the liquid-cryogen fill level and to cryogenic cooling below the fill level (i.e., under thermocryo-genic loading). The effects of cryogen fill level on the buckling temperature and thermocryogenic stressfield were investigated in detail. Both the buckling temperature and stress magnitudes were relativelyinsensitive to the cryogen fill level. The buckling temperature, however, was quite sensitive to the ra-dius-to-thickness ratio. A mechanical stress analysis of the tank also was conducted when the tank wasunder (1) cryogen liquid pressure loading, (2) internal pressure loading and (3) tank-wall inertia load-ing. Deformed shapes of the cryogenic tanks under different loading conditions were shown, and high-stress domains were mapped on the tank wall for the strain-gage installations. The accuracies of solu-tions from different finite element models were compared.
Cryogenic tank; Thermocryogenic buckling; Stress analysis; Thermocryogenic load-ing; Internal pressure loading; Liquid pressure loading; Tank wall inertia loading
AO4
69
Unclassified Unclassified Unclassified Unlimited
November 1994 Technical Memorandum
Available from the NASA Center for AeroSpace Information, 800 Elkridge Landing Road,Linthicum Heights, MD 21090; (301)621-0390.

![Thermomechanical Buckling of Simply Supported …jmee.isme.ir/article_20567_59428197b92e994c077f0008f1169483.pdfShahsiah and Eslami [3] analyzed the thermal buckling of FGM cylindrical](https://img.pdfslide.us/doc/110x75/5ab81ae47f8b9ad13d8c2d05/thermomechanical-buckling-of-simply-supported-jmeeismeirarticle2056759428197b92e.jpg)