Embed Size (px)
Citation preview
University of Texas at El Paso University of Texas at El Paso
ScholarWorks@UTEP ScholarWorks@UTEP
Open Access Theses & Dissertations
2020-01-01
Thermoanalytical Studies On The Decomposition Of Energetic Thermoanalytical Studies On The Decomposition Of Energetic
Ionic Liquids Ionic Liquids
Alan Esparza University of Texas at El Paso
Follow this and additional works at: https://scholarworks.utep.edu/open_etd
Part of the Aerospace Engineering Commons, and the Chemical Engineering Commons
Recommended Citation Recommended Citation Esparza, Alan, "Thermoanalytical Studies On The Decomposition Of Energetic Ionic Liquids" (2020). Open Access Theses & Dissertations. 2961. https://scholarworks.utep.edu/open_etd/2961
This is brought to you for free and open access by ScholarWorks@UTEP. It has been accepted for inclusion in Open Access Theses & Dissertations by an authorized administrator of ScholarWorks@UTEP. For more information, please contact [email protected].

THERMOANALYTICAL STUDIES ON THE DECOMPOSITION OF ENERGETIC
IONIC LIQUIDS
ALAN ALBERTO ESPARZA HERNANDEZ
Doctoral Program in Mechanical Engineering
APPROVED:
Evgeny Shafirovich, Ph.D., Chair
Ahsan Choudhuri, Ph.D.
Norman D. Love, Ph.D.
Russell R. Chianelli, Ph.D.
Stephen L. Crites, Jr., Ph.D.
Dean of the Graduate School

Copyright ©
by
Alan Alberto Esparza Hernandez
2020

Dedication
To my family.

THERMOANALYTICAL STUDIES ON THE DECOMPOSITION OF ENERGETIC
IONIC LIQUIDS
by
ALAN ALBERTO ESPARZA HERNANDEZ, B.S, M.S.
DISSERTATION
Presented to the Faculty of the Graduate School of
The University of Texas at El Paso
in Partial Fulfillment
of the Requirements
for the Degree of
DOCTOR OF PHILOSOPHY
Mechanical Engineering
THE UNIVERSITY OF TEXAS AT EL PASO
May 2020

v
Acknowledgements
This work was supported in part by the Air Force Office of Scientific Research under award
No. FA9550-18-1-0406 (Program Manager: Dr. Mitat A. Birkan). The thermogravimetric
analyzer, differential scanning calorimeters, mass spectrometer, and FTIR spectrometer were
acquired owing to support by the U.S. Department of Defense (Grants Nos. W911NF-12-1-0056,
W911NF-14-1-0034, and W911NF-17-1-0458; Grant Officer’s Representatives: Dr. Ralph A.
Anthenien of the Army Research Office, Dr. Clifford D. Bedford of the Office of Naval Research,
and Dr. Mitat A. Birkan of the Air Force Office of Scientific Research).
I want to extend my gratitude to Dr. Steven D. Chambreau of ERC, Inc., and Dr.
Ghanshyam L. Vaghjiani of AFRL/RQRS Edwards Air Force Base, for their continuous support
and incredible feedback.
Lastly, I want to acknowledge my advisor Dr. Evgeny Shafirovich for believing in me since
2014.

vi
Abstract
Hydrazine has been extensively used as a propellant for space applications for more than half a
century. However, its hazardous characteristics cause high storage and handling costs. For this
reason, the search for alternatives, the so-called “green monopropellants,” is of great interest. Most
green monopropellants are mixtures of an oxidizer and a fuel, and several ionic liquids (ILs) have
been proposed for this application. Among them, hydroxylammonium nitrate (HAN) and 2-
hydroxylethylhydrazinium nitrate (HEHN) are promising oxidizer and fuel, respectively. The
objective of the present work was to clarify the decomposition kinetics of both HAN and HEHN,
using thermogravimetric analysis (TGA), differential scanning calorimetry (DSC), mass
spectrometry (MS), and Fourier-transform infrared (FTIR) spectroscopy. For HAN decomposition
at atmospheric pressure, the TGA and DSC methods revealed similar values of the apparent
activation energy: 62.2 ± 3.7 kJ/mol and 57.5 ± 3.5 kJ/mol, respectively, with H2O, HNO3, N2,
NO, N2O, and NO2 being identified as products. An iridium/rhodium foam catalyst decreased the
temperature of HAN decomposition at atmospheric pressure by over 60 °C. The temperature of
thermal decomposition of HAN decreases by ca. 50 °C with increasing pressure from atmospheric
to 2 MPa and remains virtually constant with further increase to 15 MPa. The experiments revealed
two stages of HEHN decomposition. The analysis of TGA and DSC has shown autocatalytic
behavior and produced apparent activation energies of 113.7 ± 1.7 kJ/mol at the first stage and
123.6 ± 2.5 kJ/mol at the second stage. The evolved gas analysis has shown that the first stage
generates H2O, N2, NH3, NO, N2O, and NO2, while the second stage also generates HNO3 and
CO2.

vii
Table of Contents
Dedication ...................................................................................................................................... iii
Acknowledgements ..........................................................................................................................v
Abstract .......................................................................................................................................... vi
Table of Contents .......................................................................................................................... vii
List of Tables ................................................................................................................................. ix
List of Figures ..................................................................................................................................x
Chapter 1 Introduction ...........................................................................................................1
Chapter 2 Literature review ...................................................................................................3
2.1 Decomposition of HAN at atmospheric pressure ...................................................................3
2.1.1 Reaction schemes ...........................................................................................................3
2.1.2 Decomposition of HAN and HAN-based monopropellants at high pressures ............21
2.1.3 Kinetics of HAN decomposition ..................................................................................30
2.2 Literature review on the decomposition of HEHN ...............................................................33
2.3 Summary ...............................................................................................................................37
Chapter 3 Experimental .......................................................................................................40
3.1 Solutions ...............................................................................................................................40
3.1.1 Aqueous hydroxylammonium nitrate solution.............................................................40
3.1.2 2-hydroxyethylhydrazinium nitrate .............................................................................41
3.2 Instrumentation .....................................................................................................................41
3.2.1 Thermoanalytical instruments ......................................................................................41
3.2.2 Characterization instruments .......................................................................................45
3.2.3 Materials ......................................................................................................................47
3.2.4 Experimental methods .................................................................................................47

viii
Chapter 4 Thermoanalytical studies on the decomposition of hydroxylammonium nitrate at
atmospheric and high pressures: results and discussion ................................................................51
4.1 Overview ...............................................................................................................................51
4.2 Results ...................................................................................................................................51
4.2.1 Thermoanalytical study on the thermal and catalytic decomposition of HAN at
atmospheric pressure ....................................................................................................51
4.2.2 Thermoanalytical study on the decomposition of HAN at high pressures ..................64
4.3 Discussion .............................................................................................................................74
4.4 Conclusions ...........................................................................................................................75
Chapter 5 Decomposition of 2-hydroxyethylhydrazinium nitrate: results and discussion ..78
5.1 Overview ...............................................................................................................................78
5.2 Results ...................................................................................................................................78
5.2.1 Thermoanalytical experiments .....................................................................................78
5.2.2 Model-free analysis of the TGA data ...........................................................................81
5.2.3 Model-free analysis of the DSC data ...........................................................................85
5.2.4 Model-based analysis of the TGA data ........................................................................88
5.2.5 Effect of experimental scatter in the determination of kinetic parameters via
model-free and model-based methods .........................................................................91
5.2.6 Evolved gas analysis ....................................................................................................96
5.3 Discussion .............................................................................................................................99
5.4 Conclusions .........................................................................................................................101
Chapter 6 Conclusions .......................................................................................................103
References ....................................................................................................................................106
Appendix ......................................................................................................................................118
Vita ...............................................................................................................................................124

ix
List of Tables
Table 2.1. Reactions and associated rate coefficients during the kinetic modeling of radical
decomposition [25] . ..................................................................................................................... 12
Table 2.2. Reaction steps and their kinetic parameters in the decomposition of HEHN [67]. ..... 34
Table 2.3. Summary of the kinetic parameters of HAN decomposition. ...................................... 38
Table 4.1. The obtained kinetic parameters of HAN decomposition. .......................................... 55
Table 4.2. Kinetic parameters of HAN decomposition obtained via Ozawa-Wall-Flynn at
pressures of 5, 10, and 15 MPa, based on the average values of the peak temperatures. ............. 71
Table 4.3. Kinetic parameters of HAN decomposition obtained via Ozawa-Wall-Flynn at
pressures of 5, 10, and 15 MPa, based on the actual peak temperatures. ..................................... 74
Table 5.1. Kinetic parameters of HEHN decomposition obtained by the Ozawa-Wall-Flynn
(TGA – OWF and DSC – OWF), and Kissinger (DSC − K) methods. ........................................ 85
Table 5.2. Kinetic models tested for fitting the TGA data on decomposition of HEHN.............. 88
Table 5.3. Kinetic parameters determined in model-based analysis of the TGA data on HEHN
decomposition. .............................................................................................................................. 90
Table 5.4. Kinetic parameters of HEHN decomposition obtained by the Ozawa-Wall-Flynn
(TGA – OWF and DSC – OWF), and Kissinger (DSC − K) methods. Not average values. ....... 95
Table 5.5. Kinetic parameters determined in model-based analysis of the TGA data on
decomposition of HEHN. The values in Table 5.4 were used as initial conditions. .................... 96

x
List of Figures
Figure 2.1.Yield of nitrous acid as a function of the concentration of nitric acid and
hydroxylamine at 25 C [5]. ............................................................................................................. 4
Figure 2.2. Evolution of species concentrations during thermal decomposition of HAN at a set
temperature of 403 K in a nitrogen environment at 1 atm [3]. ....................................................... 6
Figure 2.3. Evolution of species concentrations during thermal decomposition of HAN at a set
temperature of 433 K in a nitrogen environment at 1 atm [3]. ....................................................... 7
Figure 2.4. Evolution of species concentrations during thermal decomposition of 9 M HAN at a
set temperature of 180 °C [14]. ....................................................................................................... 9
Figure 2.5. Reaction paths of HAN decomposition: (a) initiation reactions and (b) chain reactions
and termination reactions [22]. ..................................................................................................... 11
Figure 2.6. TGA and DTA curves for the (a) thermal and (b) catalytic decomposition of 40 wt%
HAN solution [27]. ....................................................................................................................... 14
Figure 2.7. TGA-DTA profiles of the (a) thermal and (b) catalytic decomposition of 40 wt%
HAN solutions [29]. ...................................................................................................................... 15
Figure 2.8. (a) Thermal and (b) catalytic decomposition of 40 wt% HAN solutions in the batch
reactor [29]. ................................................................................................................................... 15
Figure 2.9. DTA-TG curves of the (a) thermal and (b) catalytic decomposition of 95% aqueous
HAN solution [20]. ....................................................................................................................... 16
Figure 2.10. DTA-TGA curves during the (a) thermal and (b) catalytic decomposition of 95%
aqueous HAN solution [22]. ......................................................................................................... 17
Figure 2.11. Profile of detected fragment by DTA-TG-MS of 95% aqueous HAN solution: (a)
thermal decomposition and (b) catalytic decomposition [22]....................................................... 18

xi
Figure 2.12. Thermal decomposition of 83.9% HAN solution, 83% HAN/methanol, and 55%
HAN/methanol via (a) TGA and (b) DSC [38]. ........................................................................... 19
Figure 2.13. Catalytic decomposition (iridium catalyst) of 83.9% HAN solution, 83%
HAN/methanol, and 55% HAN/methanol via (a) TGA and (b) DSC [38]. .................................. 20
Figure 2.14. The thermolysis products of solid HAN in 0.1 MPa of Ar. The heating rate was 35
K s-1 and Tf was 560 K. H2O and any IR-inactive species are not quantified [16]. ................... 22
Figure 2.15. The temporal oscillations of the product concentrations when 1 mg of solid HAN is
thermolyzed at 130 K s-1 and 3.45 MPa of Ar [16]. .................................................................... 23
Figure 2.16. Overall burning velocity of HAN/TEAN/Water mixture as a function of pressure
[45]. ............................................................................................................................................... 24
Figure 2.17. Effects of pressure on the burning rate of crystalline HAN (points 1), liquid
propellant 57.5% HAN + 37.5% EAN + 5% H2O (points 2), gelled and crosslinked solution of
HAN in water 64/36 (points 3), gelled liquid propellant 55.4% HAN + 36.5% EAN + 5.6% H2O
+ 2.5% polyacrylamide (points 4), and 64/36 HAN-water solution (points 5) [46]. .................... 25
Figure 2.18. Burning rate of HANGLY26 monopropellant as function of pressure [48]. ........... 26
Figure 2.19. Burning rate plot of HAN269MEO15 and HAN 284MEO17 [49]. ......................... 27
Figure 2.20. Linear burning rates of (a) 95 -80 mass % and (b) 80 - 50 mass % aqueous solutions
[50]. ............................................................................................................................................... 28
Figure 2.21. Regression rate of Samples #1 and #3 [51]. ............................................................. 29
Figure 2.22. Linear burning rates of baseline solution with added 14.9% methanol by weight
[55]. ............................................................................................................................................... 30
Figure 2.23. Comparison of 1-HWS and 2-HSS kinetic analysis of hydroxylamine nitrate
decomposition in a glass cell [61]. ................................................................................................ 32

xii
Figure 2.24. Species evolution from rapid thermolysis of 0.610 mg of HEHN at 290 °C and 0.1
MPa N2 [67]. ................................................................................................................................ 35
Figure 2.25. Thermal decomposition of HEHN at 10 K/min. (a)TGA-DTA and (b)FTIR curves
[72]. ............................................................................................................................................... 37
Figure 3.1. Aqueous HAN solution. ............................................................................................. 40
Figure 3.2. HEHN. ........................................................................................................................ 41
Figure 3.3. Netzsch TG 209 F1 Iris. ............................................................................................. 42
Figure 3.4. Netzsch DSC 404 F1 Pegasus. ................................................................................... 43
Figure 3.5. Netzsch DSC 204 HP Phoenix. .................................................................................. 44
Figure 3.6. Netzsch QMS 403D Aëlos. ........................................................................................ 45
Figure 3.7. Bruker Tensor II. ........................................................................................................ 46
Figure 3.8. Ir/Rh foam catalyst. .................................................................................................... 47
Figure 4.1. TG curve for decomposition of aqueous HAN solution at a heating rate of 10 K/min
in the test that involved an isothermal step before heating. .......................................................... 52
Figure 4.2. TG curves for decomposition of HAN at heating rates of 1, 2.5, 5, and 10 K/min in
the tests that involved vacuum cycles before heating. .................................................................. 53
Figure 4.3. Ozawa-Flynn-Wall analysis based on TG data at different degrees of conversion for
the non-catalytic decomposition of aqueous HAN. ...................................................................... 54
Figure 4.4. Activation energy (dashed) and pre-exponential factor at different degrees of
conversion for the non-catalytic decomposition of aqueous HAN. .............................................. 55
Figure 4.5. Arrhenius plot based on TGA data for thermal decomposition of HAN. .................. 56
Figure 4.6. DSC curves for the thermal decomposition of HAN solution at heating rates of 1, 5,
and 10 K/min................................................................................................................................. 57

xiii
Figure 4.7. Arrhenius plot based on DSC data for thermal decomposition of HAN. ................... 58
Figure 4.8. TG curves for the thermal and catalytic decomposition of aqueous HAN solution at 5
K/min. ........................................................................................................................................... 59
Figure 4.9. Ozawa-Flynn-Wall analysis based on TG data at different degrees of conversion for
the catalytic decomposition of aqueous HAN. ............................................................................. 60
Figure 4.10. Activation energy (dashed) and pre-exponential factor at different degrees of
conversion for the catalytic decomposition of aqueous HAN. ..................................................... 60
Figure 4.11. Arrhenius plot for catalytic decomposition of HAN. ............................................... 61
Figure 4.12. Evolution of H2O, NO, N2O, and NO2 during catalytic decomposition of HAN in a
TGA test. ....................................................................................................................................... 63
Figure 4.13. Evolution of HNO3 during catalytic decomposition of HAN in a TGA test. .......... 64
Figure 4.14. DSC curves for decomposition of HAN at gauge pressures 0−0.5 MPa at a heating
rate of 10 °C/min. .......................................................................................................................... 65
Figure 4.15. DSC curves for decomposition of HAN at gauge pressures 1−6 MPa at a heating
rate of 10 °C/min. .......................................................................................................................... 65
Figure 4.16. DSC curves for decomposition of HAN at gauge pressures 7−15 MPa at a heating
rate of 10 °C/min. .......................................................................................................................... 66
Figure 4.17. DSC curves for decomposition of HAN at 5 MPa at heating rates of 1 – 10 °C/min.
....................................................................................................................................................... 67
Figure 4.18. DSC curves for decomposition of HAN at 10 MPa at heating rates of 1 – 10 °C/min.
....................................................................................................................................................... 68
Figure 4.19. DSC curves for decomposition of HAN at 15 MPa at heating rates of 1 – 10 °C/min.
....................................................................................................................................................... 68

xiv
Figure 4.20. Temperature of the DSC peak as a function of gauge pressure at heating rates of 1 –
10 °C/min. ..................................................................................................................................... 69
Figure 4.21. Arrhenius plot of the decomposition of HAN at 5 MPa (average values). .............. 70
Figure 4.22. Arrhenius plot of the decomposition of HAN at 10 MPa (average values). ............ 70
Figure 4.23. Arrhenius plot of the decomposition of HAN at 15 MPa (average values). ............ 71
Figure 4.24. Arrhenius plot of the decomposition of HAN at 5 MPa (actual peak temperatures).
....................................................................................................................................................... 72
Figure 4.25. Arrhenius plot of the decomposition of HAN at 10 MPa (actual peak temperatures).
....................................................................................................................................................... 73
Figure 4.26. Arrhenius plot of the decomposition of HAN at 15 MPa (actual peak temperatures).
....................................................................................................................................................... 73
Figure 5.1. TGA curves of HEHN decomposition at different heating rates. .............................. 79
Figure 5.2. DSC curves of HEHN decomposition at heating rates of 1, 2.5, 5, and 10 °C/min. .. 80
Figure 5.3. TG and DSC curves of HEHN decomposition at 10 °C/min. .................................... 81
Figure 5.4. The heating rate vs. the reciprocal of the temperature at different conversion degrees
0.05 apart for HEHN determined by TGA. ................................................................................... 82
Figure 5.5. The activation energy (red) and pre-exponential factor (blue) vs. the conversion
degree for HEHN determined by TGA. ........................................................................................ 83
Figure 5.6. The Ozawa-Wall-Flynn analysis of the TGA data for the first stage of HEHN
decomposition. The units of the heating rate and temperature are K/min and K, respectively. ... 84
Figure 5.7. The Ozawa-Wall-Flynn analysis of the DSC data for two stages of HEHN
decomposition. The units of the heating rate and temperature are K/min and K, respectively. ... 86

xv
Figure 5.8. The Kissinger analysis of the DSC data for two stages of HEHN decomposition. The
units of the heating rate and temperature are K/min and K, respectively. .................................... 87
Figure 5.9. The Ozawa-Wall-Flynn analysis of the TGA data (not average values) for the first
stage of HEHN decomposition. The units of the heating rate and temperature are K/min and K,
respectively. .................................................................................................................................. 92
Figure 5.10. The Ozawa-Wall-Flynn analysis of the DSC data (not average values) for two stages
of HEHN decomposition. The units of the heating rate and temperature are K/min and K,
respectively. .................................................................................................................................. 93
Figure 5.11. The Kissinger analysis of the DSC data (not average values) for two stages of
HEHN decomposition. The units of the heating rate and temperature are K/min and K,
respectively. .................................................................................................................................. 94
Figure 5.12. Temperature profiles of the most intense lines in the mass spectra of gases evolved
during TGA of HEHN at a heating rate of 10 °C/min. ................................................................. 97
Figure 5.13. Temperature profiles of the most intensive lines in the FTIR spectra of gases
evolved during TGA of HEHN at a heating rate of 10 °C/min. ................................................... 98
Figure 5.14. FTIR spectra of gases evolved at 196 °C and 251 °C during TGA of HEHN at a
heating rate of 10 °C/min. ............................................................................................................. 99

1
Chapter 1 Introduction
Hydrazine has been extensively used as a propellant for space applications for more than half a
century because of its favorable characteristics, such as long-term stability in storage, a low
adiabatic decomposition temperature (below 1000 °C), and a stable catalytic decomposition. There
is a clear understanding of the hydrazine chemistry, and it is considered one of the most reliable
propellants in the aerospace industry. It is estimated that about 10,000 hydrazine thrusters had been
flown by 1990 [1]. However, hydrazine presents certain challenges that cannot be dismissed. For
example, its high crystallization point (1.4 °C), high toxicity, high vapor pressure, and its risk to
detonation led to increasing storage and handling costs [1]. For this reason, the search for
alternatives, the so-called “green monopropellants,” is of great interest.
Several green monopropellants such as hydrogen peroxide and nitrous oxide-based
propellants have been previously studied [1]. Moreover, there is an increased interest in energetic
ionic liquids (EILs) for green propulsion applications. EILs are compounds with a melting point
below 100 °C [2]. The vapor pressure of the EILs is low, and they are less toxic than hydrazine,
thus lowering the storage and handling costs. Hydroxylammonium nitrate (HAN) is an ionic liquid
that is considered as a promising oxidizing component of green monopropellants. It has been
paired with several fuels such as triethanolammonium nitrate (TEAN), glycerol, glycine, urea,
methanol, and 2-hydroxylethylhydrazinium nitrate (HEHN, an ionic liquid) [1] [3]. There are
several HAN-based green monopropellants currently being tested such as AF-M315E by NASA
in the Green Propellant Infusion Mission (GPIM) and SHP163 by JAXA in the Rapid Innovative
Payload Demonstration Satellite (RAPIS) [4].
Unfortunately, some characteristics of green monopropellants hinder their implementation.
For example, they generate much higher temperatures than hydrazine does. As a result,
2
conventional thrusters designed for hydrazine cannot be used. Unlike hydrazine, the catalytic
decomposition of the EILs does not occur at room temperature, and the required preheating of the
catalyst reduces the overall efficiency of the system. Moreover, green propellants are a relatively
new technology, and the decomposition mechanisms of their components are not well understood.
For example, the processes of thermal and catalytic decomposition of HAN have been extensively
studied, but there are still a significant number of discrepancies in the proposed reaction models
and global kinetics of decomposition. In addition, the decomposition of HAN at high pressures is
under-examined. Furthermore, the available data on the decomposition of HEHN are scarce.
The objective of the present work is to better understand the kinetics of decomposition of
the ionic liquids HAN and HEHN via thermoanalytical methods as well as to characterize the gas
products via mass spectrometry and Fourier-transform infrared spectroscopy. This work starts with
an extensive review of the literature on the decomposition of HAN and HEHN. Next, the
experimental methodology is explained. Then, the results on thermal and catalytic decomposition
of HAN, at atmospheric and high pressure, are presented. Finally, the results on the thermal
decomposition of HEHN are reported.

3
Chapter 2 Literature review
This section synthesizes the information available on the decomposition of HAN and HAN-based
monopropellants. The information on HAN decomposition is broad. The following review will
present the data found in literature and will be divided into three major topics: 1) the thermal and
catalytic decomposition of HAN, 2) HAN decomposition at high pressures, and 3) the
determination of the activation energy and pre-exponential factor.
2.1 Decomposition of HAN at atmospheric pressure
2.1.1 Reaction schemes
It is important to start this review with the reaction mechanisms that have been proposed for a
better understanding of HAN decomposition. Several research groups investigated the reaction
mechanism of the decomposition of HAN.
Stedman’s research group first worked on the oxidation of hydroxylamine (NH2OH) by
nitric acid (HNO3). In one study, Pembridge and Stedman [5] observed that the reaction was
characterized by an induction period followed by a rapid autocatalytic reaction. The compounds
N2O and HNO2 were identified as major products of the reaction. Also, it was observed that in
high concentrations of HNO3 nitrous acid can be generated instead of consumed, leading to an
autocatalytic reaction. This is shown in Figure 2.1.

4
Figure 2.1.Yield of nitrous acid as a function of the concentration of nitric acid and
hydroxylamine at 25 C [5].
These authors proposed the following reaction scheme:
H+ + HNO2 + NO3− ↔ N2O4 + H2O (2-1)
NH2OH + N2O4 → HNO + N2O3 + H2O (2-2)
HNO + N2O4 → HNO2 + N2O3 (2-3)
N2O3 + H2O ↔ 2 HNO2 (2-4)
HNO2 + NH3OH+ → N2O + H2O + H3O+ (2-5)

5
In a follow-up study, Gowland and Stedman [6] expanded on the formation of nitrous acid.
They observed that HNO2 increases with increasing HNO3 and decreasing NH3OH+. Also,
Gowland and Stedman [7] observed that oxidation of hydroxylamine by nitric acid formed a
boundary reaction layer where nitrous acid and nitric acid are above a layer of hydroxylamine and
nitric acid. It is believed that the autocatalytic reaction has taken place in the upper layer. Between
the layers, the nitrous acid diffuses toward the bottom, while the hydroxylamine diffuses in the
opposite direction.
Similarly, Bennet et al. [8] studied the reaction between hydroxylamine and nitric acid.
N2O, N2, and HNO2 were observed to be major products of the decomposition. The presence of
HNO2 was attributed to the products of the reaction between hydroxylamine and HNO3, thus
confirming that an autocatalytic reaction took place.
Oxley and Brower [9] studied the HAN decomposition with gas chromatography (GC) and
Fourier-transform infrared (FTIR) spectroscopy. HAN was placed in an isothermal bath at 129°C
or 139°C. The major products of the decomposition were N2O, N2, and NO. The formation of these
gases was also accompanied by accumulation of HNO3 causing an autocatalytic effect during
decomposition. Based on this, they proposed the following reaction scheme:
HAN ↔ NH2OH + HNO3 (2-6)
NH2OH + HNO3 → NOH + HNO2 + H2O (2-7)
NH2OH + HNO2 → N2O + 2 H2O (2-8)
HONH2 + HNO → N2 + 2 H2O (2-9)
HNO + HNO3 → 2 HNO2 (2-10)

6
Thynell’s research group used confined rapid thermolysis to investigate HAN
decomposition. Kim et al. [10] studied the decomposition of 13 M HAN (81 %wt HAN, 19 %wt
H2O) at temperatures of 403 and 433 K. The evolved gases were analyzed by FTIR, and the results
are shown in Figures 2.2 and 2.3. It was observed that at temperature of 403 K the induction time
was 1.8 s, while at 433 K the induction time decreased to 1.2 s. At 403 K and after the induction
time, H2O is the first product detected, most likely due to evaporation. However, N2O was
observed to evolve in largest concentration among the other observed gases. These gases included
NO2, NO, and HNO3. At 433 K, H2O detection indicated the end of the induction time, and the
other gases started to evolve. It is interesting that both H2O and HNO3 reached their maximum
relative partial pressure at the same time.
Figure 2.2. Evolution of species concentrations during thermal decomposition of HAN at a set
temperature of 403 K in a nitrogen environment at 1 atm [3].

7
Figure 2.3. Evolution of species concentrations during thermal decomposition of HAN at a set
temperature of 433 K in a nitrogen environment at 1 atm [3].
In another study, Lee and Thynell investigated the effect of water content in HAN/water
mixtures at concentrations of 13 M, 10.7 M, and 9 M [11]. The product gases were analyzed via
FTIR spectroscopy. As expected, the initial water content increased with lower HAN
concentrations. However, the other observed species (NO, N2O, NO2, and HNO3) were found
virtually in the same amounts regardless of concentration. In a more recent study, Zhang and
Thynell [12] modeled the decomposition of 0.1 m HAN in the temperature range of 493 – 523 K.
Their study was focused on HONO formation from the autocatalysis between HNO3 and NH2OH.
They proposed three potential pathways of HAN decomposition such as nitration of NH2OH,
scavenging of HONO and HNO, and the autocatalytic regeneration of HONO. They also found
than the overall reaction rate can be accelerated by adding HNO3 to the original solution and

8
suppressed by adding NH2OH. This suggests that the rise of the solution acidity causes the
autocatalytic effect.
Litzinger’s research group contributed greatly to the understanding of HAN
decomposition. In one study, Lee and Litzinger [13] studied the combustion chemistry of 13 M
HAN solution using a CO2 laser at heat fluxes of 100 and 400 W/cm2 and at pressures of 0.5 and
1.0 atm, respectively. They observed that HAN started to decompose after all water was removed
due to boiling. They identified the product gases using a triple quadrupole mass spectrometer
(TQMS). At a pressure of 0.5 atm and a heat flux of 100 W/cm2, the initial species consists
primarily of H2O due to evaporation. After all water was boiled off, the major decomposition
products observed were H2O, NO2, N2, O2, NO, and N2O. At 1 atm and 400 W/cm2, the observed
products were identical, but NO was found to be the dominant species. In a follow up study, Lee
and Litzinger [14] analyzed 9 and 10.7 M HAN mixtures by the same method. Base on the
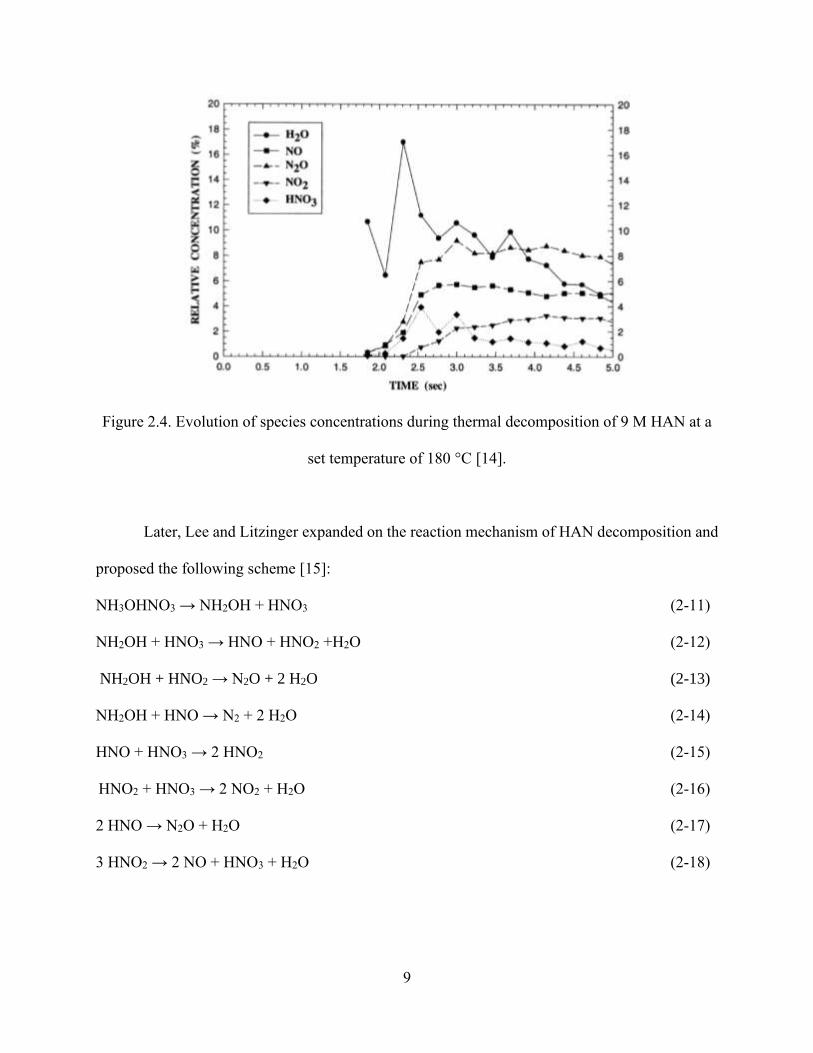
evolution of product gases shown in Figure 2.4, they proposed that HAN decomposition is
characterized by four main events:
1. An initial induction period is observed, i.e. no reaction occurs.
2. Water formation is observed due to evaporation after the induction period.
3. Rapid and simultaneous evolution of N2O, NO, and HNO3 is observed. The
formation of the latter was attributed to the proton transfer from NH3OH+ to NO3⁻.
Also, the rapid decrease is the concentration of HNO3 is explained by fast depletion
of HAN.
4. The presence of NO2 correlates with the disappearance of HNO3.
9
Figure 2.4. Evolution of species concentrations during thermal decomposition of 9 M HAN at a
set temperature of 180 °C [14].
Later, Lee and Litzinger expanded on the reaction mechanism of HAN decomposition and
proposed the following scheme [15]:
NH3OHNO3 → NH2OH + HNO3 (2-11)
NH2OH + HNO3 → HNO + HNO2 +H2O (2-12)
NH2OH + HNO2 → N2O + 2 H2O (2-13)
NH2OH + HNO → N2 + 2 H2O (2-14)
HNO + HNO3 → 2 HNO2 (2-15)
HNO2 + HNO3 → 2 NO2 + H2O (2-16)
2 HNO → N2O + H2O (2-17)
3 HNO2 → 2 NO + HNO3 + H2O (2-18)

10
It is commonly agreed that the first step in HAN decomposition is caused by proton transfer
from NH3OH+ to NO3⁻ to form NH2OH and HNO3 [16]. This leads to an autocatalytic step,
characterized by the oxidation of NH2OH by HNO3.
Raman et al. [17] and Ashcraft et. al [18] performed ab initio calculations of different
reaction pathways in the oxidation of hydroxylamine by nitrous and nitric acids. They explained
that the intermediates N2O and N2O3 play a key role in the autocatalysis of these reactions. Also,
it was observed that HONO intermediate is crucial in the autocatalytic pathway.
In another study, Amariei et al. [19] studied the catalytic and thermal decomposition of
80 wt% HAN/H2O mixtures in a dynamic reactor. Also, they identified the gases of decomposition
via mass spectrometry. In both thermal and catalytic decomposition, a major gas observed was N2
followed by NO. Other gases were NO2, N2O and O2. By quantifying the product gases and
performing a reaction mass balance, they proposed two parallel competitive reactions for HAN
decomposition:
6 NH3OHNO3(aq) → 3 N2(g) + 2 NO(g) + 10 H2O(g) + 4HNO3(g) (2-19)
ΔrH° = −117.8 kJ/mol
6 NH3OHNO3(aq) → 2 N2(g) + 2 N2O(g) + 10 H2O(g) + 4HNO3(g) (2-20)
ΔrH° = −121.0 kJ/mol
Amrousse et al. [20] [21] did not observe any HNO3 during the catalytic decomposition of
aqueous HAN solution. Thus, they proposed the following exothermic reactions:
NH3OHNO3(aq) → 2 H2O(l) + N2(g) + O2(g) (2-21)
NH3OHNO3(aq) → 2 H2O(l) + 0.5 N2(g) + NO2(g) (2-22)
NH3OHNO3(aq) → 2 H2O(l) + 2 NO(g) (2-23)
NH3OHNO3(aq) → 2 H2O(l) + N2O(g) + 0.5 O2(g) (2-24)

11
Later, Katsumi et al. [22] stated that the catalytic decomposition of HAN follows almost
the same path as in its non-catalytic case. They observed that the catalyst does not alter the species
formed but only decreases the decomposition temperature. Thus, they proposed the mechanism
shown in Figure 2.5. It is seen that the initiation step remains the same as the one proposed by Lee
and Litzinger [15]. However, the iridium catalyst is hypothesized to activate R1 (see Figure 2.5)
at a lower temperature, thus generating HNO3. Next, HNO3 reacts with NH2OH (R2) and produces
HNO and HONO, which can react again with NH2OH.
Figure 2.5. Reaction paths of HAN decomposition: (a) initiation reactions and (b) chain reactions
and termination reactions [22].
In Kidd III et al. [23], the thermal decomposition of aqueous HAN solution at different
concentrations was studied in a vacuum chamber, and the reaction gases were characterized by a
mass spectrometer. In addition, a theoretical study was performed using the reaction mechanism
generator (RMG) [24]. The MS detected signals m/z = 30 and 46, but the numerical simulations
revealed that those values do not correspond to the formation of NO and NO2 but rather to the
formation of HNO and H2N2O.
12
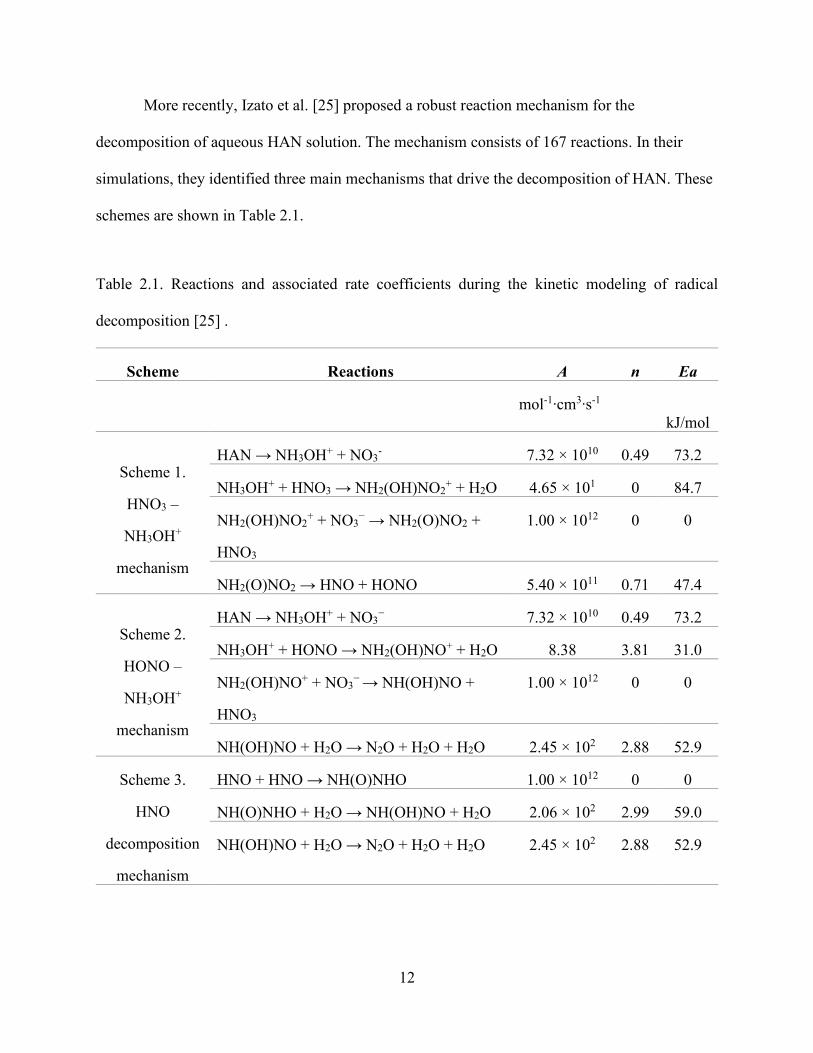
More recently, Izato et al. [25] proposed a robust reaction mechanism for the
decomposition of aqueous HAN solution. The mechanism consists of 167 reactions. In their
simulations, they identified three main mechanisms that drive the decomposition of HAN. These
schemes are shown in Table 2.1.
Table 2.1. Reactions and associated rate coefficients during the kinetic modeling of radical
decomposition [25] .
Scheme Reactions A n Ea
mol-1∙cm3∙s-1
kJ/mol
Scheme 1.
HNO3 –
NH3OH+
mechanism
HAN → NH3OH+ + NO3- 7.32 × 10¹⁰ 0.49 73.2
NH3OH+ + HNO3 → NH2(OH)NO2+ + H2O 4.65 × 101 0 84.7
NH2(OH)NO2+ + NO3
− → NH2(O)NO2 +
HNO3
1.00 × 10¹² 0 0
NH2(O)NO2 → HNO + HONO 5.40 × 10¹¹ 0.71 47.4
Scheme 2.
HONO –
NH3OH+
mechanism
HAN → NH3OH+ + NO3− 7.32 × 10¹⁰ 0.49 73.2
NH3OH+ + HONO → NH2(OH)NO+ + H2O 8.38 3.81 31.0
NH2(OH)NO+ + NO3− → NH(OH)NO +
HNO3
1.00 × 10¹² 0 0
NH(OH)NO + H2O → N2O + H2O + H2O 2.45 × 10² 2.88 52.9
Scheme 3.
HNO
decomposition
mechanism
HNO + HNO → NH(O)NHO 1.00 × 10¹² 0 0
NH(O)NHO + H2O → NH(OH)NO + H2O 2.06 × 10² 2.99 59.0
NH(OH)NO + H2O → N2O + H2O + H2O 2.45 × 10² 2.88 52.9
13
Each scheme was summarized to a single equation to propose an overall reaction
mechanism,
HAN → HNO + HONO + H2O (Scheme 1) (2-25)
HAN + HONO → N2O + 2 H2O + HNO3 (Scheme 2) (2-26)
HNO → 0.5 N2O + 0.5 H2O (Scheme 3) (2-27)
Thus, the thermal decomposition of aqueous HAN was described as:
HAN → 0.75 N2O + 1.75 H2O + 0.5 HNO3 (2-28)
2.1.1.1 Thermal and catalytic decomposition of HAN and HAN-based monopropellants
The processes of thermal and catalytic decomposition of HAN and HAN-based monopropellants
have been studied with different techniques by several research groups.
Kappenstein’s research group has studied several catalysts for HAN and HAN-based
monopropellants. Eloirdi et al. [26] tested platinum, rhodium, and palladium supported catalysts
for the HAN-TEAN-H2O (LGP) mixture in a batch reactor. It was observed that the platinum
supported catalyst decreases the onset temperature of LGP decomposition from 128 °C to 70 °C.
Courthéoux et al. [27] studied both the thermal and catalytic decomposition of 40 wt% HAN
aqueous solution via TGA and DTA. Figure 2.6 shows the TG and DTA curves of HAN
decomposition. For the non-catalytic case, they observe complete vaporization of water at 135 °C
and an endothermic peak at 110 °C. HAN decomposed over the range of 150 – 170 °C. Pt/Al2O3-
Si was used for the catalytic decomposition of HAN solution. It was observed that only 4% of
water was vaporized before the mixture decomposed at 50 °C.

14
Figure 2.6. TGA and DTA curves for the (a) thermal and (b) catalytic decomposition of 40 wt%
HAN solution [27].
In a separate study, Courthéoux et al. [28] presented the effect of powdered and spherical
catalysts for 79 wt% HAN/water solution. In their experiments, the solution was injected to a pre-
heated catalyst at a temperature of 45 °C, and the change in pressure was recorded. Both catalysts
successfully catalyzed the solution and remained active after 23 successful injections, but breaking
of the spherical catalyst was observed. In a follow-up study to [27], Courthéoux et al. [29],
expanded on the thermal and catalytic decomposition of aqueous HAN solutions at concentrations
of 40 and 79 wt%. The experiments were carried out in DTA, TGA, and in a constant volume
batch reactor. In DTA experiments, the thermal and catalytic decomposition of 40 wt% HAN
solutions occurred at 180 °C and 107 °C, respectively. In the batch reactor, the thermal
decomposition took place at a temperature of 135 °C, while the catalytic decomposition occurred
at 107 °C. The TGA-DTA curves are shown in Figure 2.7, and the batch reactor pressure profiles
are shown in Figure 2.8.

15
Figure 2.7. TGA-DTA profiles of the (a) thermal and (b) catalytic decomposition of 40 wt%
HAN solutions [29].
Figure 2.8. (a) Thermal and (b) catalytic decomposition of 40 wt% HAN solutions in the batch
reactor [29].
For 79 wt% HAN solutions, the thermal and catalytic decomposition temperatures in DTA
experiments were 160 °C and 56 °C, respectively. In batch reactor experiments, these temperatures
decreased greatly. The thermal decomposition occurred at 115 °C, while the catalyst was able to
decompose the solution at temperatures as low as 21 °C.
Amrousse et al. [20] studied the thermal and catalytic decomposition of 95% aqueous HAN
solution via differential thermal analysis (DTA) and thermogravimetric analysis (TGA). They
recorded a thermal decomposition temperature of 155 °C, whereas a (10%)Ir/Al2O3-La2O3 catalyst

16
decreased this temperature to 47 °C. The DTA-TG curves for these experiments are shown in
Figure 2.9.
Figure 2.9. DTA-TG curves of the (a) thermal and (b) catalytic decomposition of 95% aqueous
HAN solution [20].
In a follow-up study to [20], Amrousse et al. [30] investigated the thermal and catalytic
decomposition of HAN-based blends via differential scanning calorimetry. The analyzed mixtures
were: HAN/methanol/H2O (95/5/0), HAN/methanol/H2O (90/5/5), HAN/methanol (50/50),
HAN/ethanol/H2O (90/5/5), and HAN/ethanol (50/50). The thermal decomposition temperatures
of these mixtures were in the 153 – 157 °C range, about the same as for 95% HAN solutions [20].
In the catalytic case, platinum and iridium catalysts decreased the decomposition temperature of
all mixtures down to 50 – 62 °C and 47 – 60 °C, respectively. In another study, Amrousse et al.
[31] studied the catalytic decomposition of HAN/H2O/AN/methanol monopropellant via DTA-
TGA-MS. It was observed that water completely evaporated before the solution started to
decompose, and it was characterized by a sharp exothermic peak. The products observed were N2,
17
NH3, NO, NO2, N2O, NO2, and H2O. In a subsequent study, Amrousse et al. [32] identified HNO3
as another major product of decomposition.
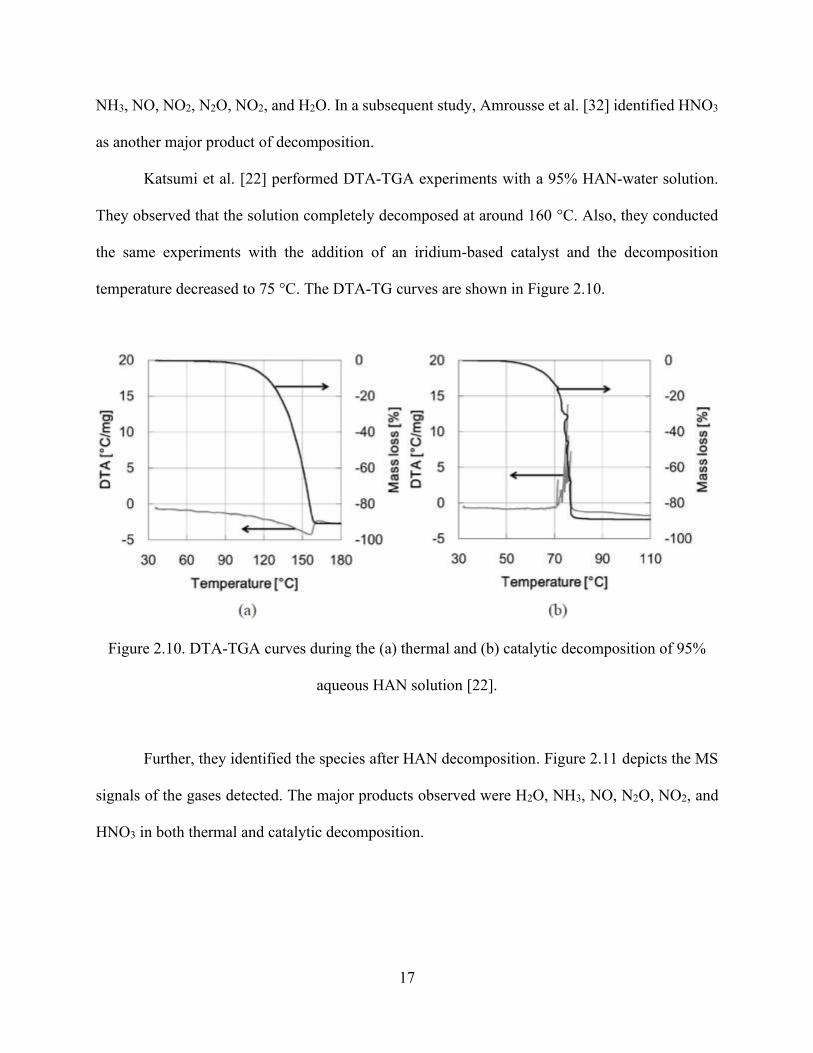
Katsumi et al. [22] performed DTA-TGA experiments with a 95% HAN-water solution.
They observed that the solution completely decomposed at around 160 °C. Also, they conducted
the same experiments with the addition of an iridium-based catalyst and the decomposition
temperature decreased to 75 °C. The DTA-TG curves are shown in Figure 2.10.
Figure 2.10. DTA-TGA curves during the (a) thermal and (b) catalytic decomposition of 95%
aqueous HAN solution [22].
Further, they identified the species after HAN decomposition. Figure 2.11 depicts the MS
signals of the gases detected. The major products observed were H2O, NH3, NO, N2O, NO2, and
HNO3 in both thermal and catalytic decomposition.

18
Figure 2.11. Profile of detected fragment by DTA-TG-MS of 95% aqueous HAN solution: (a)
thermal decomposition and (b) catalytic decomposition [22].
Yetter’s research group investigated the thermal and electrolytic decomposition of aqueous
HAN-based monopropellants [33] and aqueous HAN solutions [34]. In Risha et al. [33] work, the
XM46 propellant decomposed at 115 °C, which was the maximum temperature recorded
regardless of input energy. In the study by Khare et al. [34], a 13 M HAN solution was successfully
decomposed via electrolysis. A theoretical model of the decomposition was presented, and they
proposed that the decomposition of HAN via electrolysis produces NH2OH, HNO3, HONO, HNO,
N2O, N2, NO, NO2, H2O, H2, and O2.
Oomen et al. [35] used an Ir/Al2O3 as a catalyst for an aqueous HAN solution. They
observed that the catalyst was able to decrease the decomposition temperature from 128 to 66 °C.
They reported a much lower decomposition temperature than those found in the literature, but it
was later discovered by Hoyani et al. [36] that the preparation process of the HAN solution
significantly affects its thermal stability.
Onodaka et al. [37] conducted TGA-DTA experiments with aqueous HAN solutions at
concentrations over the range of 10 – 90%. It was seen that HAN only decomposes after the water
in the solution is vaporized.
19
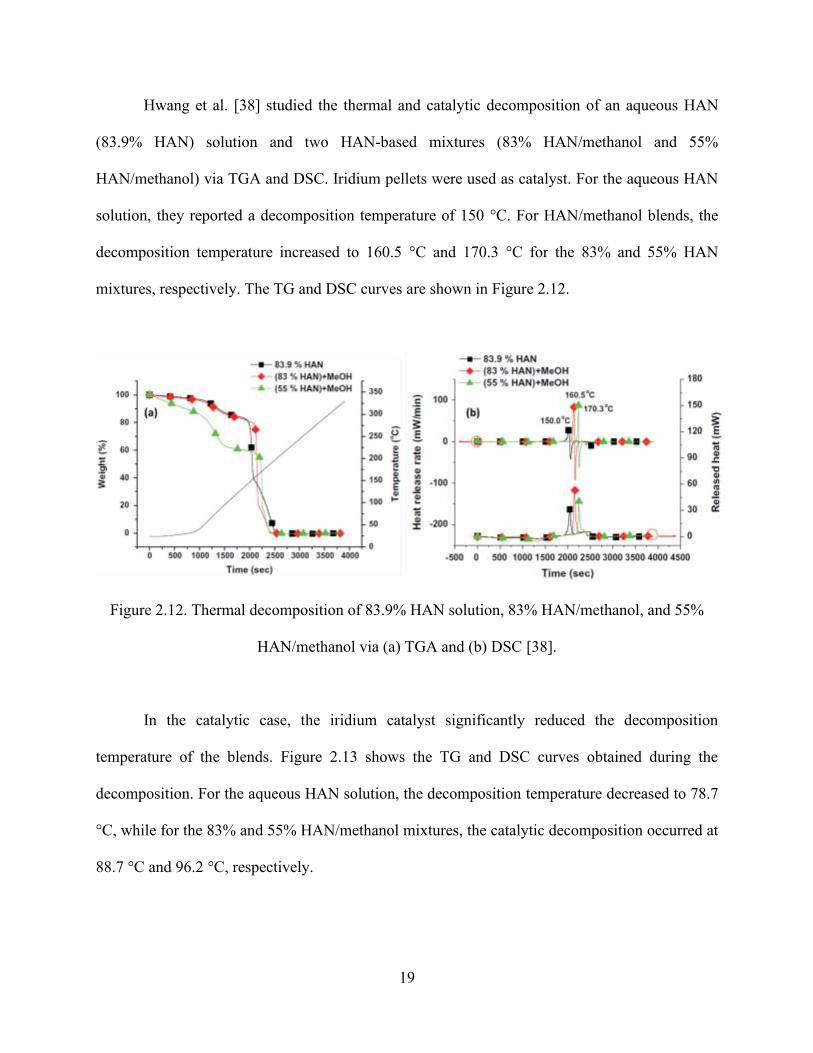
Hwang et al. [38] studied the thermal and catalytic decomposition of an aqueous HAN
(83.9% HAN) solution and two HAN-based mixtures (83% HAN/methanol and 55%
HAN/methanol) via TGA and DSC. Iridium pellets were used as catalyst. For the aqueous HAN
solution, they reported a decomposition temperature of 150 °C. For HAN/methanol blends, the
decomposition temperature increased to 160.5 °C and 170.3 °C for the 83% and 55% HAN
mixtures, respectively. The TG and DSC curves are shown in Figure 2.12.
Figure 2.12. Thermal decomposition of 83.9% HAN solution, 83% HAN/methanol, and 55%
HAN/methanol via (a) TGA and (b) DSC [38].
In the catalytic case, the iridium catalyst significantly reduced the decomposition
temperature of the blends. Figure 2.13 shows the TG and DSC curves obtained during the
decomposition. For the aqueous HAN solution, the decomposition temperature decreased to 78.7
°C, while for the 83% and 55% HAN/methanol mixtures, the catalytic decomposition occurred at
88.7 °C and 96.2 °C, respectively.

20
Figure 2.13. Catalytic decomposition (iridium catalyst) of 83.9% HAN solution, 83%
HAN/methanol, and 55% HAN/methanol via (a) TGA and (b) DSC [38].
Atamanov et al. [39] investigated the effects of K2CO3-activated carbon on the catalytic
decomposition of HAN. The catalyst decreased the decomposition temperature from 185.2 to
92.5 °C. They characterized the species via MS and reported the formation of N (m/z = 14), H2O
(m/z = 18), N2 (m/z = 28), NO (m/z = 30), H3NO or hydroxylamine (HA, m/z = 33), N2O (m/z =
44), NO2 (m/z = 44).
Chambreau et al. [40] went more in depth on the secondary products of the catalytic
decomposition of HAN aerosols. Iridium was the catalyst of choice, and a mass spectrometer was
used to identify the reaction species. As expected, NH3 and H2O were detected as their m/z values,
17 and 18, were observed. Unlike in previous studies, m/z = 46 was mostly attributed to a fragment
of m/z = 63 which corresponds to formation of HNO3. Only a small amount of NO2 was responsible
for the detection of m/z = 46. Signals 32 and 33 were assigned to HA. They also detected m/z
values 30 and 44, which were assigned to NO and dissolved CO2, respectively.
More recently, Izato et al. [25] conducted TGA-DTA-MS experiments on 92 wt% aqueous
HAN solution. The reported decomposition temperature was around 149 °C. The observed m/z

21
values were 16 (NH2+ or O2), 17 (NH3
+ or OH+), 18 (H2O+), 28 (N2
+), 30 (NO+), 44 (N2O+), 46
(NO2+), and 63 (HNO3
+).
2.1.2 Decomposition of HAN and HAN-based monopropellants at high pressures
For space applications, it is necessary to understand the kinetics and reaction mechanisms of HAN
at elevated pressures. For this reason, the decomposition of HAN at high pressures has been
extensively studied in the past by several research groups.
Van Dijk and Priest [41] observed the behavior of an 11 M HAN-H2O solution at pressures
of 200 – 700 MPa. First, they identified the peaks in the Raman spectrum of this mixture at ambient
conditions. At pressures up to 590 MPa and temperatures up to 65°C, the Raman spectrum remain
unchanged from its readings at standard conditions. However, when the temperature was increased
to 74°C, new peaks around 1290 cm-1 appeared and at the same time, the peak at 1010 cm-1
disappeared, suggesting a reaction had occurred.
Cronin and Brill [16] first investigated the decomposition of HAN at concentrations
ranging from 12 mol to 17.7 mol (solid HAN) via thermolysis and over a range of pressures (0.014
– 6.89 MPa). As shown in Figure 2.14, they observed that at pressures below 0.69 MPa, the product
gases, specifically N2O, HNO3, and NO2, remained relatively constant with increasing time.

22
Figure 2.14. The thermolysis products of solid HAN in 0.1 MPa of Ar. The heating rate was 35
K s-1 and Tf was 560 K. H2O and any IR-inactive species are not quantified [16].
However, at pressures above that point, the concentration of the products oscillated at the
beginning of thermolysis before stabilizing at a later stage. This is shown in Figure 2.15.

23
Figure 2.15. The temporal oscillations of the product concentrations when 1 mg of solid HAN is
thermolyzed at 130 K s-1 and 3.45 MPa of Ar [16].
In another work, Cronin and Brill [42] studied a HAN-based blend for liquid gun
propellants. The mixture was comprised of HAN, TEAN, and water. In their experiments, they
observed that water in the mixture leaves a thermal trace, thus slowing down the decomposition
process and the overall intensity of the exotherms. The removal of water, however, was shown to
increase the rate of decomposition.
Vosen performed strand burner experiments for HAN at high pressures. In the first study,
Vosen [43] performed combustion experiments with a 9.1 M HAN solution in water at pressures
of 6.7 MPa and 30 MPa. At the end of each experiment, liquid water was found in the strand
burner. It was observed that the burning rate was slower at 30 MPa than at 6.7 MPa. Vosen reported
that the decomposition temperature increased from 360 K at 0.1 MPa to 620 K at 40 MPa. This
was understandable because of the presence of liquid water at high pressures. In addition, Vosen
studied the effect of concentration and pressure on the decomposition of aqueous HAN solutions

24
[44]. It was observed that for mixtures ranging from 5.20 to 9.10 M HAN, the apparent
decomposition rate decreased with increasing the pressure up to 13 MPa. However, at pressures
greater than 13 MPa, the decomposition rate remained independent of pressure. Also, it was
reported that the decomposition rate increased with HAN concentration. Also, Vosen [45] studied
the burning rates of a HAN/TEAN/water mixture over the range of pressures of 6.7 – 34 MPa. The
mixture, 60.9/19.2/20 wt%, exhibited two different pressure regimes. In the first regime, the
overall burning rate decreased from 144 mm/s at 6.7 MPa to 37.6 mm/s at 23 MPa, and remained
virtually constant at 30 mm/s over the pressure range of 26 – 34 mm/s. This is shown in Figure
2.16.
Figure 2.16. Overall burning velocity of HAN/TEAN/Water mixture as a function of pressure
[45].
Kondrikov et al. [46] determined the burn rates of several HAN-based mixtures in a
constant-pressure bomb over the range of pressures of 0.1 – 36 MPa. The mixtures included:
crystalline HAN, HAN/monoethanolamine nitrate (EAN)/H2O (57.5/37.5/5),
HAN/EAN/H2O/polyacrylamide (55.4/36.5/5.6/2.5), HAN/H2O (64/36), gelled HAN, and
HAN/H2O (58/42). The burning rates of these mixtures are shown in Figure 2.17. It is seen that in
the case of crystalline HAN, there are three major pressure regimes. At pressures up to 1.1 MPa,

25
the pressure exponent is 1.6. Then, it increases to 2.6 at pressures up to 2.1 MPa to later decrease
down to 1.5 over the pressure range of 2.1 – 20 MPa. In the case of aqueous solutions, the overall
burning rate is significantly higher than in solids. However, a negative pressure exponent was
observed within the range of 7 to 30 MPa. Also, it is seen that the presence of H2O in the mixtures
increased significantly the burning rate during combustion of HAN.
Figure 2.17. Effects of pressure on the burning rate of crystalline HAN (points 1), liquid
propellant 57.5% HAN + 37.5% EAN + 5% H2O (points 2), gelled and crosslinked solution of
HAN in water 64/36 (points 3), gelled liquid propellant 55.4% HAN + 36.5% EAN + 5.6% H2O
+ 2.5% polyacrylamide (points 4), and 64/36 HAN-water solution (points 5) [46].
Farshchi et al. [47] conducted droplet combustion experiments on 13 M HAN-water
mixtures. It was seen that as samples were heated, gas bubbles formed inside the droplets and it

26
was attributed to liquid-phase reactions of HAN and boiling. Experiments performed in air resulted
in a visible flame, while experiments in a nitrogen atmosphere did not show any flame.
Chang and Kuo [48] carried out strand burner experiments with the HAN-based
monopropellant HANGLY26, (60% HAN, 14% glycine, and 26% water) over the range of
pressures 1.5 – 18.2 MPa. They observed that the pressure dependency of burning rate, as shown
in Figure 2.18, can be described into four power-law regimes: 1.5 < P ≤ 3.9 MPa, 3.9 < P ≤ 8.8
MPa, 8.8 < P ≤ 11.6 MPa, and 11.6 < P ≤ 18.2 MPa.
Figure 2.18. Burning rate of HANGLY26 monopropellant as function of pressure [48].
Similarly, Chang et al. [49] investigated the pressure dependence of linear burning rate of
HAN/methanol-based monopropellants. Strand burner experiments of two blends,
HAN269MEO15 (69.70% HAN, 0.60% AN, 14.79% methanol, 14.91% water) and
HAN284MEO17 (77.25% HAN, 0.67% AN, 17.19% methanol, 4.89% water) were performed at
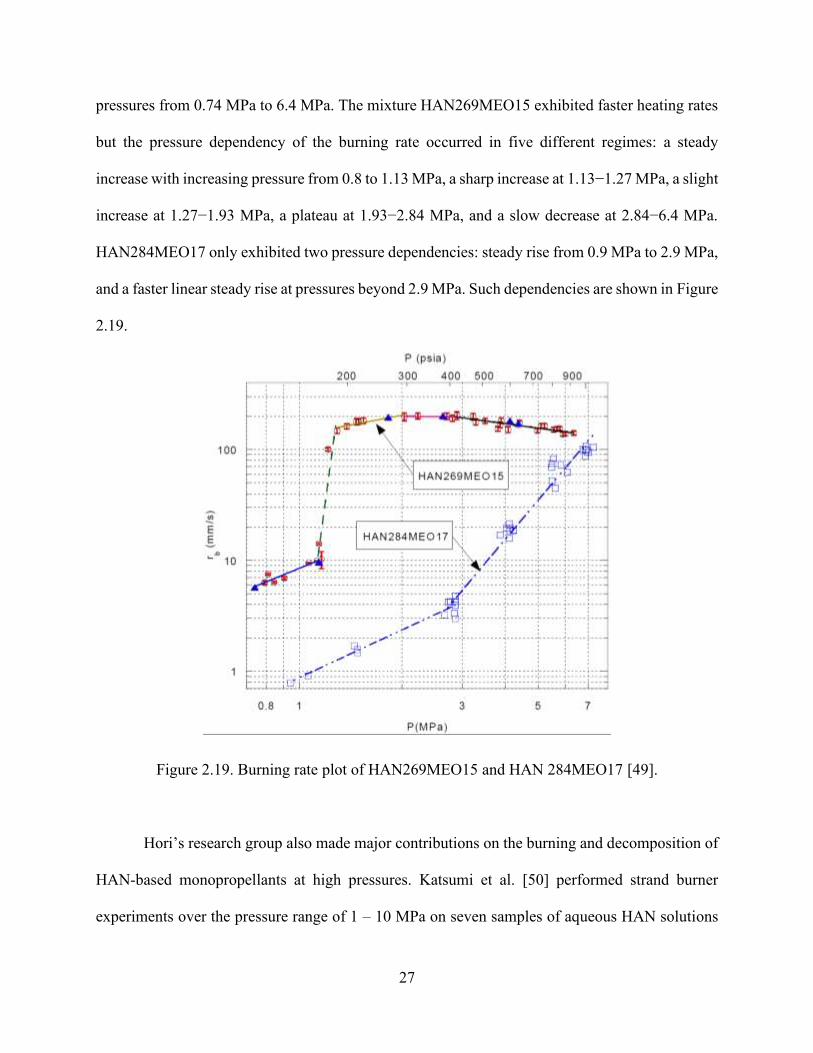
27
pressures from 0.74 MPa to 6.4 MPa. The mixture HAN269MEO15 exhibited faster heating rates
but the pressure dependency of the burning rate occurred in five different regimes: a steady
increase with increasing pressure from 0.8 to 1.13 MPa, a sharp increase at 1.13−1.27 MPa, a slight
increase at 1.27−1.93 MPa, a plateau at 1.93−2.84 MPa, and a slow decrease at 2.84−6.4 MPa.
HAN284MEO17 only exhibited two pressure dependencies: steady rise from 0.9 MPa to 2.9 MPa,
and a faster linear steady rise at pressures beyond 2.9 MPa. Such dependencies are shown in Figure
2.19.
Figure 2.19. Burning rate plot of HAN269MEO15 and HAN 284MEO17 [49].
Hori’s research group also made major contributions on the burning and decomposition of
HAN-based monopropellants at high pressures. Katsumi et al. [50] performed strand burner
experiments over the pressure range of 1 – 10 MPa on seven samples of aqueous HAN solutions

28
with concentrations ranging 50 – 95 mass %. The overall burning rate was observed to increase
with pressure; however, HAN concentration affected the maximum burning rate. As the HAN
content decreased from 95 to 80 mass %, the maximum regression rate increased. However, the
maximum burning rate decreased as HAN concentration decreased from 80 to 50 mass %. The
burning rates of these samples are shown in Figure 2.20.
Figure 2.20. Linear burning rates of (a) 95 -80 mass % and (b) 80 - 50 mass % aqueous solutions
[50].
Katsumi et al. [51] [52] studied the linear burning rates of two mixtures containing
HAN/ammonium nitrate (AN)/water/methanol over the range of pressures of 1 – 10 MPa. The
composition of the first mixture, named “Sample #1” is 95/5/8/0 (mass ratio), while the content of
the second mixture, “Sample #3”, is 95/5/8/21 (mass ratio). Two pressure regimes in the regression
rates were observed for Sample #1. At pressures 1 – 3 MPa, the linear burning rate remained
virtually constant. However, at pressures > 3 MPa, the regression rates increased by more than an
order of magnitude and kept increasing with pressure. On the other hand, Sample #3 only exhibited
one pressure regime where the burning rates kept increasing with pressure. This is shown in Figure
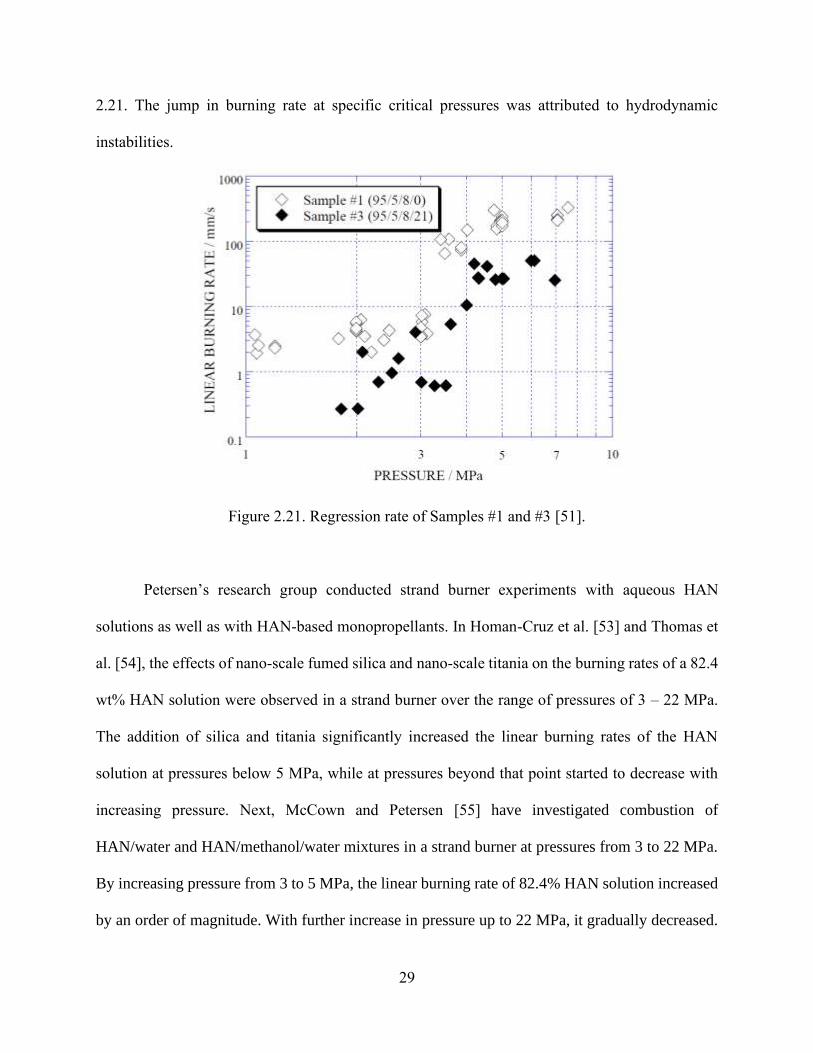
29
2.21. The jump in burning rate at specific critical pressures was attributed to hydrodynamic
instabilities.
Figure 2.21. Regression rate of Samples #1 and #3 [51].
Petersen’s research group conducted strand burner experiments with aqueous HAN
solutions as well as with HAN-based monopropellants. In Homan-Cruz et al. [53] and Thomas et
al. [54], the effects of nano-scale fumed silica and nano-scale titania on the burning rates of a 82.4
wt% HAN solution were observed in a strand burner over the range of pressures of 3 – 22 MPa.
The addition of silica and titania significantly increased the linear burning rates of the HAN
solution at pressures below 5 MPa, while at pressures beyond that point started to decrease with
increasing pressure. Next, McCown and Petersen [55] have investigated combustion of
HAN/water and HAN/methanol/water mixtures in a strand burner at pressures from 3 to 22 MPa.
By increasing pressure from 3 to 5 MPa, the linear burning rate of 82.4% HAN solution increased
by an order of magnitude. With further increase in pressure up to 22 MPa, it gradually decreased.

30
The addition of 14.9% methanol dramatically increased the burning rate in the low part of the
tested pressure range. The burning rate was independent of pressure in the range of 3−4.8 MPa. At
higher pressures, five different pressure regimes were observed. At 4.8−10.8 MPa the burning rate
decreases with increasing pressure. Between 10.8 and 19.4 MPa, the burning rate first increases,
then remains constant, and finally decreases. At 19.4−22 MPa it remains constant. This is depicted
in Figure 2.22.
Figure 2.22. Linear burning rates of baseline solution with added 14.9% methanol by weight
[55].
2.1.3 Kinetics of HAN decomposition
The determination of kinetic parameters of HAN decomposition is crucial to better
understand the reaction.
Shaw and Williams [56] developed a model for the deflagration of aq-HAN solutions. In
their model, they deduced the kinetic parameters at three different aq-HAN concentrations. The
activation energy obtained was in the range of 60.7 – 71.1 kJ/mol. The pre-exponential factor lied
in the range of 3.05 – 4.94 × 10¹⁰ s-1.

31
Rafeev and Rubstov [57] determined the effective activation energy of HAN
decomposition via the rate of heat release under isothermal conditions. The obtained activation
energy was 64.0 ± 7.5 kJ/mol. The decomposition HAN was found to be of autocatalytic type.
They also observed via IR spectroscopy that the final products of HAN decomposition were NO2,
NO, N2O, and H2O.
In a later study, Schoppelrei et al. [58] determined the kinetic parameters of different HAN
concentrations (0.82 – 1.74 m) at 27.5 MPa. The experiments were conducted in two different flow
cells made of 316 stainless steel and titanium. The kinetic parameters varied with concentration
and material. For the SS case, the activation energies and pre-exponential factors for HAN
concentration of 0.84 – 0.98 m were in the range of 66 – 94 kJ/mol and 8.1 × 10⁵ – 4.9 × 10⁸ s-1,
respectively. Experiments with HAN concentrations in the range of 0.76 – 1.74 m were conducted
in the titanium cell. The activation energy was in the range of 64 – 154 kJ/mol, while the pre-
exponential ranged from 8.9 × 10⁵ to 8.7 × 10¹⁵ s-1. Following this study, Schoppelrei and Brill
[59] determined the kinetics of HAN decomposition at 27.5 MPa in the temperature range of 463
– 523 K. By monitoring the NH3OH+ destruction and N2O formation, they deduced an activation
energy of 103 ± 21 kJ/mol and a pre-exponential factor of 1.3 × 10⁹ ± 1.5 × 10² s-1.
Lee and Litzinger [15] conducted a numerical analysis for the decomposition of HAN.
They obtained 63.2 ± 2.1 for the activation energy and 1.7 × 10¹⁰ ± 9.3 × 10² s−1 for the pre-
exponential factor.
Lee and Thynell [11] determined effective activation energy of solid HAN and 13 M HAN,
which were estimated to be 46.9 kJ/mol and 53.7 kJ/mol, respectively.
Mannan’s group studied the decomposition of HAN (24 wt%) with calorimetry. In Wei et
al. [60] they used an automatic pressure tracking adiabatic calorimeter (APTAC) to analyze the

32
decomposition of HAN in glass, titanium, and stainless steel cells. Also, they compared two
methods of heating, viz., the heat-wait-search (HWS) and heat-soak-search (HSS). In HWS
experiments, they reported decomposition temperatures of 171 °C in glass, 150 °C in titanium, and
139 °C in stainless steel. In HSS experiments, they reported temperatures of 165 °C in glass,
131 °C in titanium, and 127 °C in stainless steel. It is seen that HAN decomposition was catalyzed
by both titanium and stainless steel, and this was also reported in their other work [61]. Also, they
calculated the activation energy by fitting the results obtained by these two methods to an nth order
reaction. They reported an activation energy of 585 kJ/mol and proposed that this very large
number indicates that HAN decomposes autocatalytically. The corresponding Arrhenius plot that
describes these phenomena is shown in Figure 2.23.
Figure 2.23. Comparison of 1-HWS and 2-HSS kinetic analysis of hydroxylamine nitrate
decomposition in a glass cell [61].
Liu et. al [62] further expanded on the reaction kinetics of HAN (24 wt%) decomposition.
They reported a pre-exponential factor of 2.6 × 10⁶ ± 7.6 × 10³ mol-1∙cm3∙s-1 and an activation
energy of 82 ± 0.4 kJ/mol. Also, they obtained a reaction order of 0.55 ± 0.06.
33
More recently, Izato et al. [25] developed a robust reaction mechanism for the
decomposition of aqueous HAN. For the proton transfer step, they reported an activation energy
of 73.2 kJ/mol, a pre-exponential factor of 7.32 × 10¹⁰ mol-1∙cm3∙s-1, and a reaction order of 0.49.
Moreover, the obtained activation energy and pre-exponential factor of the autocatalytic step were
84.7 kJ/mol and 4.65 mol-1∙cm3∙s-1, respectively, with a reaction order of 3.81.
2.2 Literature review on the decomposition of HEHN
The available data in the open literature on the composition, characteristics, and decomposition
of HEHN are scarce.
HEHN was synthesized by the reaction of 2-hydrozyethylzydrazine (HEH) and nitric acid
[63]. A simplified scheme is shown below:
HO–CH2–CH2–NH–NH2 + HNO3 → [HO–CH2–CH2–NH2–NH2]+[NO3]
− (2-29)
Wucherer et al. [64] reported the performance of multiple fuel/oxidizer monopropellant
blends. In this study, 82% HAN was used as the oxidizer, while methanol, ethanol, 1-propanol, 2-
propanol, 1-butanol, glycine, and HEHN were candidates for fuels. The specific impulse was first
calculated, and it was reported that HEHN/HAN and methanol/HAN blends performed the best
with values of 278 s and 284 s, respectively. Also, the chamber temperatures were the highest with
calculated temperatures of 2097 °C for the HEHN/HAN mixture and 2149 °C for the
methanol/HAN. A 1 lbf test thruster with a preheated Shell 405 catalyst was used to study the
ignition and combustion performance of these mixtures. For the HEHN/HAN mixture, it was
observed that ignition at the first pulse was smooth, but the pressure profile rapidly became rough.
This was explained by damage of the catalyst caused by the combustion of the mixture. Likewise,
34
the combustion of methanol/HAN was smooth at the beginning and rough after 2 s. The catalyst
bed did not show any damage, but it was sintered together.
The reaction gases of HEHN decomposition were investigated via mass spectrometry by
Tanzella et al. [65]. They performed drop tests on quartz wool and Shell 405 catalyst surfaces
heated up to 230°C. The detected masses in both surfaces included: 14 – 18, 26 – 32, 39 – 46, and
63 m/z. The major peaks of the mass spectrum were 30 m/z, which corresponds to NO, and 44
m/z, which correlates to the masses of N2O and CO2. In quartz wool experiments, the intensity of
the signal for both N2O and NO were about the same. On Shell 405 surfaces, the N2O signal was
about 5 times higher than NO, suggesting that the catalyst significantly induced the consumption
of NO.
Resonant laser ignition was used by Alfano et al. [66] to ignite both HEHN and
HEHN/HAN mixtures. It was observed that HEHN does not ignite with no oxidizer. On the other
hand, HEHN/HAN mixtures were successfully ignited.
The kinetics of decomposition of HEHN were studied by Chowdhury and Thynell [67]. By
employing confined rapid thermolysis (CRT), Fourier-transform infrared (FTIR) spectrometry,
and time-of-flight mass spectrometry (ToFMS), they proposed a three-step kinetic model for
HEHN decomposition (see Table 2.2).
Table 2.2. Reaction steps and their kinetic parameters in the decomposition of HEHN [67].
Step Reaction Activation energy Pre-exponential factor
1 HEHN → HEH + HNO3 183.0 kJ∙mol−1 2.0 × 10¹⁶ s−1
2 HEHN + HNO3 → HEH + 2 HNO3 124.8 kJ∙mol−1 3.9 × 10¹² mol−1∙cm3∙s−1
3 HEH + HNO3 → 2.5 H2O + 0.42 N2O
+1.08 N2 + 0.042 O2 + CH3CHO 24.3 kJ∙mol−1 8.3 × 10⁵ mol−1∙cm3∙s−1
35
The initiation step was characterized by deprotonation of HEHN to form HEH and HNO3.
HEHN → HEH + HNO3 (2-30)
The calculated kinetic parameters of this reaction were 183 kJ/mol for the activation energy and 2
× 1016 s-1 for the pre-exponential factor.
The MS, shown in Figure 2.24, detected extremely small quantities of HNO3, suggesting
that HNO3 reacts quickly with HEH in the condense phase. This produces an autocatalytic effect
during the decomposition. The activation energy and pre-exponential factor of this reaction were
124 kJ/mol and 3.9 × 10¹² mol-1∙cm3∙s-1, respectively.
HEHN + HNO3 → HEH + 2 HNO3 (2-31)
H2O was the major decomposition product observed with the MS. Other gases such as N2O, N2,
NH3, CO2, and NO were also detected. A final third step was added to account for these gases. The
activation energy and pre-exponential factor deduced were 24.3 kJ/mol and 8.3 × 10⁵ s-1,
respectively.
HEH + HNO3 → 2.5 H2O + 0.42 N2O + 1.08 N2 + 0.042 O2 + CH3CHO ( 2-32)
Figure 2.24. Species evolution from rapid thermolysis of 0.610 mg of HEHN at 290 °C and 0.1
MPa N2 [67].
36
Shamshina et al. [68] studied the catalytic ignition of various hydrazine-derived ionic
liquids, including HEH and HEHN. They performed drop tests on several catalyst and observed
that Shell 405 was the only catalyst that successfully decomposed HEHN. However, catalytic
ignition was only possible when the catalyst was pre-heated to at least 100°C
Prince et al. [69] first proposed HEHN as a suitable candidate for electrospray propulsion.
Patrick et al. [70] studied several pathways of HEHN dissociation during electrospray. It was
revealed that there is a strong H-bonding between the anion and cation.
Since HEHN is not hypergolic, Swami et al. [71] studied blends of HEHN with hypergolic
substances such as unsymmetrical dimethylhydrazine (UDMH) to observe its hypergolicity, i.e.
ignition delay, with red fuming nitric acid and white fuming nitric acid. From mixtures ranging
from 20% to 80% HEHN by weight, it was reported that a 40% HEHN blend experienced the least
ignition delay. In another study, Swami et al. [72] studied the thermal decomposition of HEHN
using TGA, DTA, and FTIR spectroscopy. At a heating rate of 10 K/min, two distinct periods of
mass loss were observed. First, the mass decreased by 10% in the temperature range of 40 – 80 °C,
which was attributed to the evaporation of water absorbed by the sample. Next, the mass dropped
by 75% between 180 °C and 240 °C because of HEHN decomposition. The identified product
gases were N2O, CO2, NH3, HNO3, and NO2. The TG-DTA and FTIR curves are shown in Figure
2.25.

37
Figure 2.25. Thermal decomposition of HEHN at 10 K/min. (a)TGA-DTA and (b)FTIR curves
[72].
2.3 Summary
As it is seen from this review, the decomposition of HAN has been studied extensively. In general,
the decomposition of HAN can be narrowed down to two major events [5] [9] [14] [15] [25]:
1. Proton transfer reaction between hydroxylamine and nitric acid.
2. An autocatalytic reaction involving the oxidation of hydroxylamine by nitric acid.
Several reaction schemes have been proposed. In general, the decomposition of HAN can
be described by the following scheme [15]:
NH3OHNO3 → NH2OH + HNO3 (2-33)
NH2OH + HNO3 → HNO + HNO2 +H2O (2-34)
NH2OH + HNO2 → N2O + 2 H2O (2-35)
NH2OH + HNO → N2 + 2 H2O (2-36)
HNO + HNO3 → 2 HNO2 (2-37)
HNO2 + HNO3 → 2 NO2 + H2O (2-38)
2 HNO → N2O + H2O (2-39)
3 HNO2 → 2 NO + HNO3 + H2O (2-40)

38
Further, HAN decomposition has been studied with various thermoanalytical methods such
as DTA [20] [22] [27] [29], DSC [30], and TGA [22] [29], and it was reported that HAN
decomposition occurred at temperatures from 150 to 180 °C. In addition, catalyst such as Pt/Al2O3
[27] and Ir/Al2O3-La2O3 [30] decreased the decomposition temperatures of certain concentrations
of HAN to 21°C and 47 °C, respectively. MS and FTIR have revealed that the major products of
decomposition include H2O, NO, N2O, NO2, and HNO3.
The combustion of HAN [16] [41] [42] [50] [51] [52] and HAN-based monopropellants
(HAN/TEAN/water [43] [44] [45], HAN/glycine/water [48], and HAN/methanol/water [50] [51]
[52] [53] [55] has been studied in a strand burner at pressures 1 – 34 MPa. In general, multiple
pressure regimes of the burning rate were observed, and the mechanism is still not well understood.
Various research groups reported on the kinetic parameters of HAN decomposition, and
the results are summarized in Table 2.3.
Table 2.3. Summary of the kinetic parameters of HAN decomposition.
Research group Activation Energy Pre-exponential factor
Shaw and Williams [56] 61 – 70 kJ/mol 3.1 – 4.9 × 10¹⁰ s-1
Rafeev and Rubstov [57] 64 ± 7.5 kJ/mol Not reported
Schoppelrei et al. [58] 64 – 154 kJ/mol 8.1 × 10⁵ – 8.7 × 10¹⁵ s-1
Schoppelrei and Brill [59] 103 ± 21 kJ/mol 1.3 × 10⁹ ± 1.5 × 10² s-1
Lee and Litzinger [15] 63.2 ± 2.1 1.7 × 10¹⁰ ± 9.3 × 10² mol−1∙cm3∙s−1
Wei et al. [61] 585 kJ/mol Not reported
Liu et al. [62] 82 ± 0.4 kJ/mol 2.6 × 10⁶ ± 7.6 × 10³ mol-1∙cm3∙s-1

39
Lastly, the decomposition of HEHN undergoes an autocatalytic reaction between HEH and
HNO3. The activation energy and pre-exponential factor of this reaction were determined: 124
kJ/mol and 3.9 × 10¹² mol-1∙cm3∙s-1, respectively [67]. The decomposition products included H2O,
HNO3 NH3, N2, NO, N2O, NO2, O2, CO2, and CH3CHO [65] [67] [72]. A two-stage decomposition
was observed via TGA-DTA [72], where the first decrease in mass, by 10%, was observed in the
temperature range of 40 – 80 °C and was attributed to the evaporation of water absorbed by the
sample. Next, the mass dropped by 75% between 180 °C and 240 °C because of HEHN
decomposition.

40
Chapter 3 Experimental
The thermal and catalytic decomposition of hydroxylammonium nitrate (HAN) as well as the non-
catalytic decomposition of 2-hydroxyethylhydrazinium nitrate were studied using
thermoanalytical methods. These methods included thermogravimetric analysis and differential
scanning calorimetry. The latter was conducted at atmospheric pressure and over the pressure
range from atmospheric to 150 bar using two different instruments. In addition, the species
generated during decomposition were characterized by mass spectrometry and Fourir-Transform
Infrared (FTIR) spectroscopy.
This chapter describes more in depth the materials, instruments, and methods employed
throughout this project.
3.1 Solutions
3.1.1 Aqueous hydroxylammonium nitrate solution
Aqueous hydroxylammonium nitrate (24 wt% HAN,
99.999% pure) solution was purchased from Sigma Aldrich
and was used as received. It has a density of 1.118 g/mL. A
container with the HAN solution is shown in Figure 3.1
Figure 3.1. Aqueous HAN solution.

41
3.1.2 2-hydroxyethylhydrazinium nitrate
The ionic liquid 2-hydroxyethylhydrazinium nitrate (HEHN)
was synthesized at the Air Force Research Laboratory
(AFRL), Edwards Air Force Base, following the procedure
described in reference [63]. Gas chromatography has shown
that its purity is at least 97%. HEHN was used as received
from the AFRL. A container with the HEHN is shown in
Figure 3.2.
Figure 3.2. HEHN.
3.2 Instrumentation
3.2.1 Thermoanalytical instruments
3.2.1.1 Thermogravimetric analyzer (TGA)
The thermal and catalytic decomposition of ionic liquids were studied using a Netzsch TG 209 F1
Iris (Figure 3.3) thermogravimetric analyzer. The concept of the TGA is simple. It records the
mass change of a sample during a heating or cooling cycle. The instrument can operate at
temperatures up to 1000 °C.

42
Figure 3.3. Netzsch TG 209 F1 Iris.
In HAN experiments, a 10 μL sample was placed using a pipette, into a 6 mm diameter
alumina crucible and heated in a 20 mL/min helium flow at different heating rates over the range
from 1 to 10 °C/min. In HEHN experiments, a 10 mg sample was used. Three vacuum cycles were
performed before each test. HAN samples were heated to 250 °C, while HEHN experiments ran
up to 350 °C. Before any test, correction runs for the crucibles were performed and the balance
was calibrated.
3.2.1.2 Differential scanning calorimeter (DSC)
The Netzsch DSC 404 F1 Pegasus (Figure 3.4) differential scanning calorimeter was used to study
the decomposition of ionic liquids. This instrument includes two 6 mm alumina crucibles sitting
on a platinum sample carrier. One of the crucibles is empty, serving as reference, while the other
is loaded with a sample. Both crucibles are heated by a SiC heater and their change in heat is
measured. The DSC detects whenever a reaction has occurred by comparing the difference in heat

43
between the reference and the sample crucible. The instrument can operate at temperatures up to
1500 °C.
Figure 3.4. Netzsch DSC 404 F1 Pegasus.
In HAN experiments, a 10 μL sample was placed, using a pipette, into a 6 mm alumina
crucible and heated in a 20 mL/min helium flow at different heating rates over the range from 1 to
10 °C/min. In HEHN experiments, a 10 mg sample was used. Three vacuum cycles were
performed before each test. HAN samples were heated to 250 °C, while HEHN experiments ran
up to 350 °C. Before any test, correction runs for the crucibles were performed. Temperature and
sensitivity calibrations were performed to accurately determine the peak temperatures.

44
3.2.1.3 High-pressure differential scanning calorimeter (HPDSC)
Decomposition of aqueous HAN solution was studied using the Netzsch DSC 204 HP Phoenix
(Figure 3.5) high-pressure differential scanning calorimeter (HPDSC). This instrument can operate
at pressures and temperatures up to 15 MPa and 600 °C, respectively. In each test, a sample of the
HAN solution (10 μL) was placed in an alumina crucible and three vacuum cycles were performed
to evaporate water from the solution and to purge air from the furnace. The instrument was
pressurized using nitrogen gas over the range of gauge pressures from 0 to 15 MPa. Two mass
flow meters (SLA5800 Series, Brooks Instruments) were used to ensure constant pressure during
the heating process. Correction runs for all crucibles, heating rates, and pressures were carried out
prior to the DSC tests.
Figure 3.5. Netzsch DSC 204 HP Phoenix.
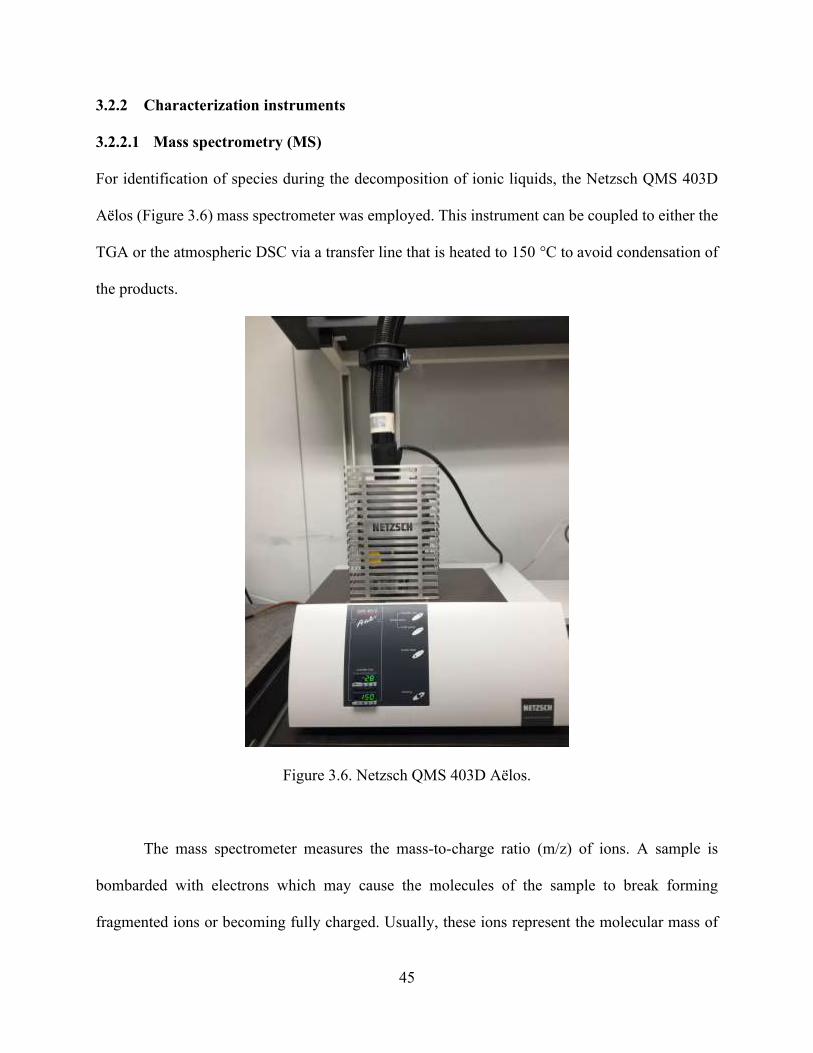
45
3.2.2 Characterization instruments
3.2.2.1 Mass spectrometry (MS)
For identification of species during the decomposition of ionic liquids, the Netzsch QMS 403D
Aëlos (Figure 3.6) mass spectrometer was employed. This instrument can be coupled to either the
TGA or the atmospheric DSC via a transfer line that is heated to 150 °C to avoid condensation of
the products.
Figure 3.6. Netzsch QMS 403D Aëlos.
The mass spectrometer measures the mass-to-charge ratio (m/z) of ions. A sample is
bombarded with electrons which may cause the molecules of the sample to break forming
fragmented ions or becoming fully charged. Usually, these ions represent the molecular mass of

46
the detected species, but a high ionization energy (IE) can produce several ionized fragments. To
keep the fragmentation of the gas products at a minimum, the electron impact ionization energy
was set to 25 eV, the lowest operating IE. The MS was set at a speed of 200 ms for each mass unit.
3.2.2.2 Fourier-transform infrared (FTIR) spectroscopy
In addition, the Bruker Tensor II (Figure 3.7) FTIR spectrometer was used to identify the reaction
products during HEHN decomposition. This instrument was coupled to the TGA via a transfer line
that is heated at 200 °C to avoid condensation of the species. The FTIR spectrometer was set to
absorbance and measured spectra every 625 ms with a resolution of 4 cm-1.
Figure 3.7. Bruker Tensor II.
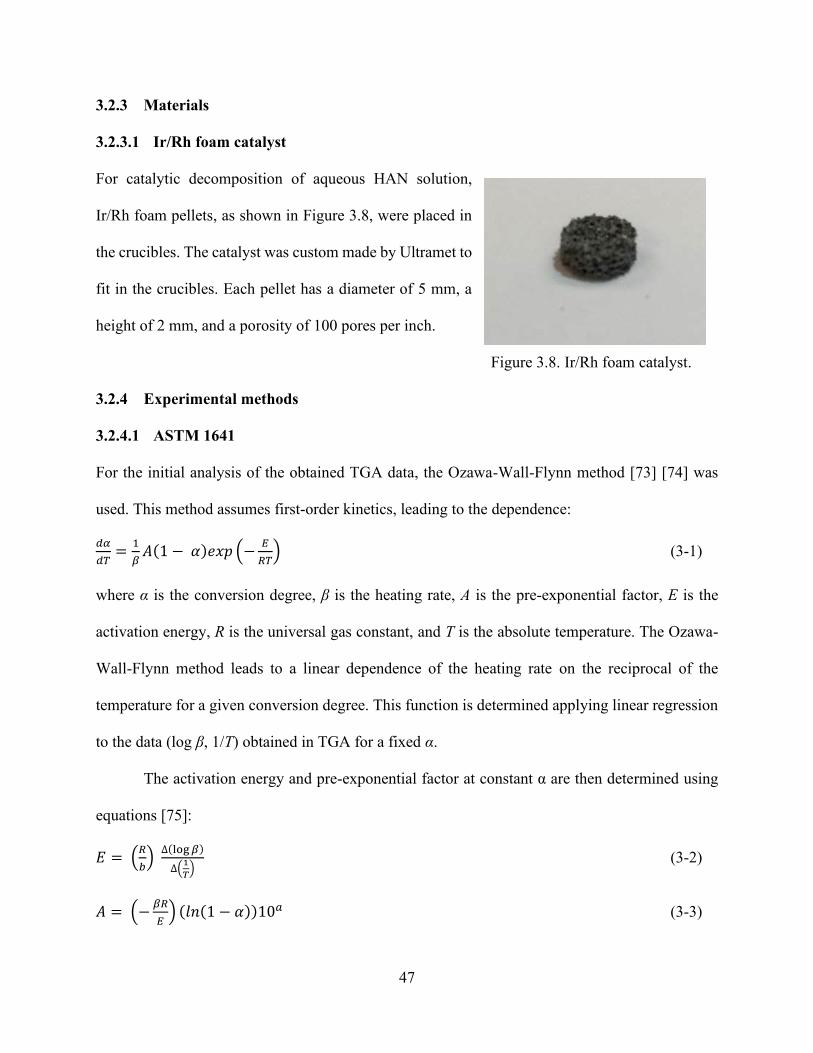
47
3.2.3 Materials
3.2.3.1 Ir/Rh foam catalyst
For catalytic decomposition of aqueous HAN solution,
Ir/Rh foam pellets, as shown in Figure 3.8, were placed in
the crucibles. The catalyst was custom made by Ultramet to
fit in the crucibles. Each pellet has a diameter of 5 mm, a
height of 2 mm, and a porosity of 100 pores per inch.
Figure 3.8. Ir/Rh foam catalyst.
3.2.4 Experimental methods
3.2.4.1 ASTM 1641
For the initial analysis of the obtained TGA data, the Ozawa-Wall-Flynn method [73] [74] was
used. This method assumes first-order kinetics, leading to the dependence:
𝑑𝛼
𝑑𝑇=
1
𝛽𝐴(1 − 𝛼)𝑒𝑥𝑝 (−
𝐸
𝑅𝑇) (3-1)
where α is the conversion degree, β is the heating rate, A is the pre-exponential factor, E is the
activation energy, R is the universal gas constant, and T is the absolute temperature. The Ozawa-
Wall-Flynn method leads to a linear dependence of the heating rate on the reciprocal of the
temperature for a given conversion degree. This function is determined applying linear regression
to the data (log β, 1/T) obtained in TGA for a fixed α.
The activation energy and pre-exponential factor at constant α are then determined using
equations [75]:
𝐸 = (𝑅
𝑏)
∆(log 𝛽)
∆(1
𝑇)
(3-2)
𝐴 = (−𝛽𝑅
𝐸) (𝑙𝑛(1 − 𝛼))10𝑎 (3-3)
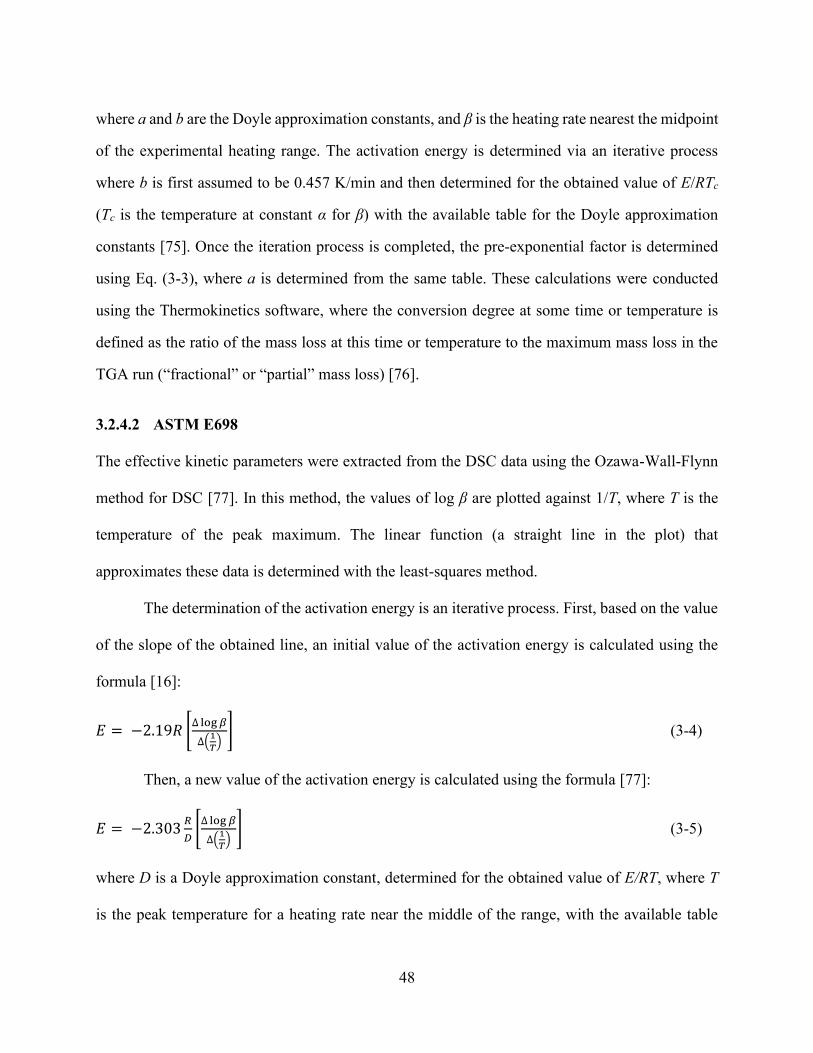
48
where a and b are the Doyle approximation constants, and β is the heating rate nearest the midpoint
of the experimental heating range. The activation energy is determined via an iterative process
where b is first assumed to be 0.457 K/min and then determined for the obtained value of E/RTc
(Tc is the temperature at constant α for β) with the available table for the Doyle approximation
constants [75]. Once the iteration process is completed, the pre-exponential factor is determined
using Eq. (3-3), where a is determined from the same table. These calculations were conducted
using the Thermokinetics software, where the conversion degree at some time or temperature is
defined as the ratio of the mass loss at this time or temperature to the maximum mass loss in the
TGA run (“fractional” or “partial” mass loss) [76].
3.2.4.2 ASTM E698
The effective kinetic parameters were extracted from the DSC data using the Ozawa-Wall-Flynn
method for DSC [77]. In this method, the values of log β are plotted against 1/T, where T is the
temperature of the peak maximum. The linear function (a straight line in the plot) that
approximates these data is determined with the least-squares method.
The determination of the activation energy is an iterative process. First, based on the value
of the slope of the obtained line, an initial value of the activation energy is calculated using the
formula [16]:
𝐸 = −2.19𝑅 [∆ log 𝛽
∆(1
𝑇)
] (3-4)
Then, a new value of the activation energy is calculated using the formula [77]:
𝐸 = −2.303𝑅
𝐷[
∆ log 𝛽
∆(1
𝑇)
] (3-5)
where D is a Doyle approximation constant, determined for the obtained value of E/RT, where T
is the peak temperature for a heating rate near the middle of the range, with the available table

49
[77]. Once the iterative process is completed, the pre-exponential factor is calculated using the
formula [77]:
𝐴 =𝛽𝐸
𝑅𝑇2 𝑒𝑥𝑝 (𝐸
𝑅𝑇) (3-6)
3.2.4.3 Kissinger method
The activation energy and pre-exponential factor of the two stages were also determined from the
DSC data by the Kissinger [78] [79] [80] method. In general, the rate of a chemical reaction can
be described by:
𝑑𝛼
𝑑𝑡= 𝑓(𝛼)𝐴𝑒𝑥𝑝 (
−𝐸
𝑅𝑇) (3-7)
where f(α) is the conversion function (dimensionless). In the Kissinger method, taking the
derivative of the conversion function with respect to time as shown in Eq. (3-7) at its maximum
point for a given heating rate and setting it to zero leads to the equation:
ln𝛽
𝑇𝑚2 = (ln
𝐴𝑅
𝐸) −
𝐸
𝑅𝑇𝑚 (3-8)
where Tm is the temperature at maximum reaction rate. Equation (3-8) describes a straight line in
the plot of its left-hand side vs. (1/Tm), with the slope −E/R and intercept ln(AR/E).
3.2.4.4 Netzsch Thermokinetics
Netzsch Thermokinetics software is intended to use for extraction of kinetic data from TG and
DSC data. In the present work, the model-free (ASTM E1641 and ASTM E698) and model-based
capabilities are employed.
For an accurate determination of kinetic parameters, the maximum number of data sets
were imported. In this case, 16 TG and DSC (4 per heating rate) files were loaded into Netzsch

50
Thermokinetics. The software operates with partial mass (for TG), and partial area (for DSC)
instead of conversion degree as it is usually used in thermal analysis [76].
One of the most useful features of Netzsch Thermokinetics is its model-based capabilities.
In the present work, model-based analysis was conducted to determine the decomposition models
that fit the TGA data.

51
Chapter 4 Thermoanalytical studies on the decomposition of
hydroxylammonium nitrate at atmospheric and high pressures: results
and discussion
4.1 Overview
This chapter presents the obtained results on the effective kinetic parameters for both non-catalytic
(thermal) and catalytic decomposition of aqueous HAN solution as well as the obtained
information on the evolved gas products. In addition, the obtained results on the effect of pressure
on the thermal decomposition of HAN are also reported.
4.2 Results
4.2.1 Thermoanalytical study on the thermal and catalytic decomposition of HAN at
atmospheric pressure
4.2.1.1 Non-catalytic decomposition of aqueous HAN solution
Initially, thermogravimetric analysis of aqueous HAN solution was conducted with a 10 min
isothermal step before heating. Figure 4.1 shows the TG curve obtained at a heating rate of
10 K/min. The initial drop in mass is explained by evaporation of water, while the second stage of
mass loss is associated with HAN decomposition.

52
Figure 4.1. TG curve for decomposition of aqueous HAN solution at a heating rate of 10 K/min
in the test that involved an isothermal step before heating.
Although the initial mass loss correlates with the water content in the solution, it cannot be
excluded that some bonded water still remains at temperatures above the water boiling point and
may influence the decomposition kinetics. Therefore, for a more accurate determination of HAN
decomposition kinetic parameters, all subsequent TGA tests were carried out with three vacuum
cycles before heating. Comparison of the measured mass loss with the concentration of water in
the initial solution shows that after three vacuum cycles all water was evaporated. Although some
traces of water could remain, they probably would be vaporized with approaching the boiling point
of water during the relatively slow heating process, so the potential effect of water on the
decomposition of HAN would be negligible. Figure 4.2 shows TG curves obtained in such a
procedure at heating rates of 1, 2.5, 5, and 10 K/min. It is seen that, in contrast with Figure 4.1, the
TG curves are smooth and there is only one stage of mass loss, caused by HAN decomposition. It
is also seen that an increase in the heating rate increases the decomposition temperature. At
0
10
20
30
40
50
60
70
80
90
100
30 50 70 90 110 130 150 170 190 210 230 250
Mass,
%
Temperature, °C

53
1 K/min HAN was fully decomposed at about 160 °C, while at 10 K/min the decomposition was
complete at about 220 °C.
Figure 4.2. TG curves for decomposition of HAN at heating rates of 1, 2.5, 5, and 10 K/min in
the tests that involved vacuum cycles before heating.
The apparent activation energy and pre-exponential factor were determined using the
Ozawa-Flynn-Wall method [73] [74] [75], which assumes the first-order kinetics. Figure 4.3 shows
the Ozawa-Flynn-Wall analysis at different conversion rates, while Figure 4.4 presents the values
of the activation energy and pre-exponential factor as a function of conversion, calculated based
on the data shown in Figure 4.4. It is seen that the kinetic parameters significantly increase with
increasing the conversion from 2% to 15%, but change only slightly with further increasing the
conversion. Only after loss of 60% mass, the activation energy starts to decrease significantly. The
approximate constancy of the kinetic parameters over a wide range of the conversion degrees
validates the applicability of the method. The activation energy and pre-exponential factor
0
10
20
30
40
50
60
70
80
90
100
30 50 70 90 110 130 150 170 190 210 230 250
Ma
ss, %
Temperature, °C
10 K/min5 K/min2.5 K/min1 K/min

54
extracted at 20 % mass loss are shown in Table 4.1, while the Arrhenius plot is shown in Figure
4.5.
Figure 4.3. Ozawa-Flynn-Wall analysis based on TG data at different degrees of conversion for
the non-catalytic decomposition of aqueous HAN.
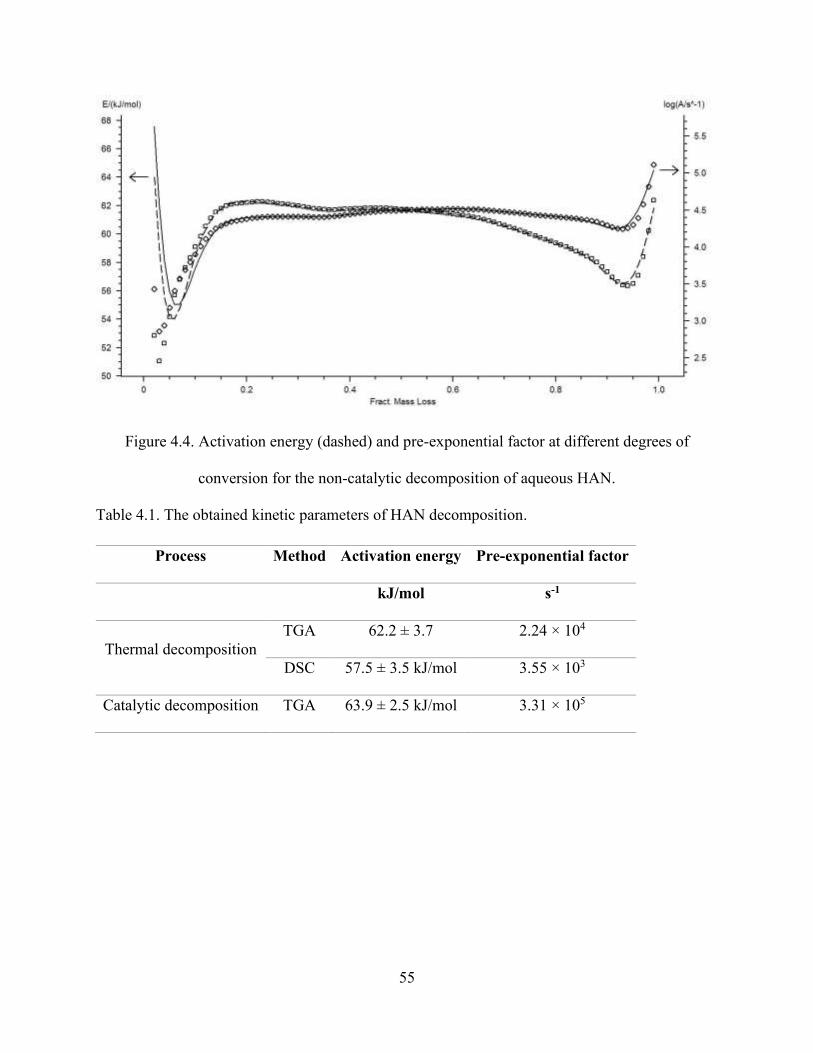
55
Figure 4.4. Activation energy (dashed) and pre-exponential factor at different degrees of
conversion for the non-catalytic decomposition of aqueous HAN.
Table 4.1. The obtained kinetic parameters of HAN decomposition.
Process Method Activation energy Pre-exponential factor
kJ/mol s-1
Thermal decomposition
TGA 62.2 ± 3.7 2.24 × 10⁴
DSC 57.5 ± 3.5 kJ/mol 3.55 × 10³
Catalytic decomposition TGA 63.9 ± 2.5 kJ/mol 3.31 × 10⁵

56
Figure 4.5. Arrhenius plot based on TGA data for thermal decomposition of HAN.
Figure 4.6 shows DSC curves at heating rates of 1, 5, and 10 K/min. It is seen that each
curve has a sharp exothermic peak, the temperature of which increases with increasing the heating
rate. The observed deviation from zero line, particularly noticeable at a heating rate of 10 K/min,
was caused by an instrumental error, which, however, could not affect the temperature of the sharp
peak.
-0.2
0
0.2
0.4
0.6
0.8
1
1.2
2.1 2.2 2.3 2.4 2.5
log (β
)
1000 K/T

57
Figure 4.6. DSC curves for the thermal decomposition of HAN solution at heating rates of 1, 5,
and 10 K/min.
The DSC data for the sharp peaks were analyzed with the Netzsch Thermokinetics software
to determine the apparent activation energy and the pre-exponential factor using the Ozawa-Flynn-
Wall method [73] [74] and following the ASTM 698 standard [77]. Figure 4.7 shows the obtained
Arrhenius plot, while the obtained values of the activation energy and pre-exponential factor are
shown in Table 4.1. It is seen that the data obtained by TGA and DSC are close to each other.
More specifically, in the DSC method the average value of the apparent activation energy is less
by 4.7 kJ/mol and the uncertainty ranges overlap, while the pre-exponential factor is less by about
6 times.
-0.5
0.5
1.5
2.5
3.5
30 50 70 90 110 130 150 170 190 210 230 250
Hea
t flow
, μW/mg
Temperature, °C
10 K/min
5 K/min
1 K/min

58
Figure 4.7. Arrhenius plot based on DSC data for thermal decomposition of HAN.
The obtained values of an apparent activation energy of thermal decomposition (around
60 kJ/mol) are in agreement with the literature data for solid HAN [57] and solutions with high
concentrations of HAN [15] [56] [58] discussed in the Literature Review. However, the obtained
values of the pre-exponential factor are by six to seven orders of magnitude less than those
determined by Shaw and Williams [56] and Lee and Litzinger [15]. Apparently, this discrepancy
is explained by the effect of water in those experiments. For example, the addition of water has
been shown to accelerate the reactions of solid HAN in some reaction models [14]. Also, solutions
with higher concentration of water have shorter induction times than solid HAN, most likely
because of a strong ion association [15]. In our tests, conducted at relatively low heating rates,
water was vaporized by the time the decomposition began.
-0.2
0
0.2
0.4
0.6
0.8
1
1.2
1.9 2 2.1 2.2 2.3 2.4
log(β
)
1000 K/T

59
4.2.1.2 Catalytic decomposition of aqueous HAN solution
The catalytic decomposition of aqueous HAN solution was studied in TGA tests that involved
three vacuum cycles before heating. Figure 4.8 compares the TG curves obtained for the thermal
and catalytic decomposition of aqueous HAN at the same heating rate, 5 K/min. It is seen that the
catalyst decreased the temperature of full decomposition by over 60 °C.
Figure 4.8. TG curves for the thermal and catalytic decomposition of aqueous HAN solution at 5
K/min.
Using the Ozawa-Flynn-Wall method [73] [74] [75], the TGA data were used to extract
the kinetic parameters for the catalytic decomposition of HAN. Ozawa-Flynn-Wall analysis based
on TG data at different degrees of conversion for the catalytic decomposition of aqueous HAN.
Figure 4.9 shows the Ozawa-Flynn-Wall method at different degrees of conversion. Also, Figure
4.10 shows that the average activation energy and pre-exponential factor significantly increase
0
10
20
30
40
50
60
70
80
90
100
30 50 70 90 110 130 150 170 190 210 230 250
Ma
ss, %
Temperature, °C
Thermaldecomposition
Catalyticdecomposition

60
with increasing the conversion from 2% to 7% and change only slightly with further increasing
the conversion degree.
Figure 4.9. Ozawa-Flynn-Wall analysis based on TG data at different degrees of conversion for
the catalytic decomposition of aqueous HAN.
Figure 4.10. Activation energy (dashed) and pre-exponential factor at different degrees of
conversion for the catalytic decomposition of aqueous HAN.

61
The kinetic parameters extracted at 20% are shown in Table 4.1, while the Arrhenius plot
for the catalytic decomposition of HAN is shown in Figure 4.11. Comparison with the data for
thermal (non-catalyzed) decomposition, obtained by the same method, shows that the average
activation energy remains virtually constant though the pre-exponential factor increases by 15
times when the catalyst is present.
Figure 4.11. Arrhenius plot for catalytic decomposition of HAN.
The insignificant effect of the catalyst on the activation energy may be explained based on
the hypothesis of Shaw and Williams [56] that the activation energy is determined by the
endothermicity of the proton transfer reaction (Eq. (2-33)). Since the catalyst cannot change the
endothermicity, it is clear that it cannot change the activation energy of this reaction either (though
it increases the pre-exponential factor). This also confirms that the apparent activation energy of
HAN decomposition is determined by the proton transfer reaction.
-0.2
0
0.2
0.4
0.6
0.8
1
1.2
2.4 2.5 2.6 2.7 2.8
log (β
)
1000 K/T

62
4.2.1.3 Mass spectrometry
The gases evolved during TGA of aqueous HAN solution were analyzed using mass
spectrometry. For an accurate identification of the detected substances, the analysis involved the
literature data on mass spectra of gases [81]. The same products were detected for both thermal
and catalytic decomposition processes. The mass spectra obtained during decomposition contain
peaks at mass-to-charge ratios (m/z) of 20, 36, 38, and 40 that belong to argon. There are also
peaks at m/z of 16 and 32 that indicate O2 from residual air. Peaks at m/z of 14 and 28 indicate N2,
which could be originated from both air and HAN decomposition. Peaks at m/z of 17 and 18 belong
to H2O produced by decomposition of HAN. Peaks at m/z of 30, 44, and 46 indicate NO, N2O, and
NO2, respectively. A relatively small (the ion current was by three orders of magnitude lower than
for NO, N2O, and NO2) peak of HNO3 at m/z of 63 was also detected. Also, the temperature
variation of the intensity for m/z of 28 (N2) has a small peak during decomposition. Disregarding
Ar as well as O2 and N2 from air, it can be concluded that the obtained results are in qualitative
agreement with the previous data on gas products of thermal decomposition of HAN though the
peak of HNO3 was much smaller than in the experiments [9] [10] [14] [15] [16] [42].
Figure 4.12 shows the evolution of H2O, NO, N2O, and NO2 during the catalytic
decomposition alongside the TG curve. It is seen that the maximum concentrations of these species
were detected at about 145 °C, close to the end of the decomposition process in the TG curve.
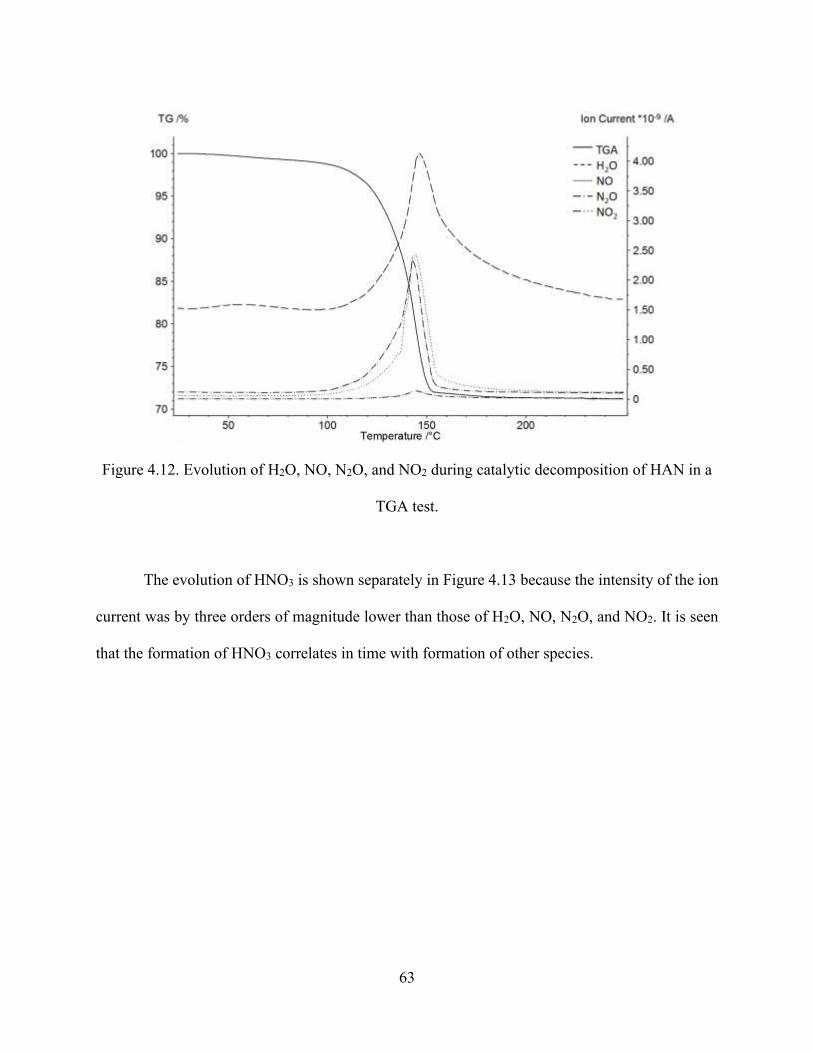
63
Figure 4.12. Evolution of H2O, NO, N2O, and NO2 during catalytic decomposition of HAN in a
TGA test.
The evolution of HNO3 is shown separately in Figure 4.13 because the intensity of the ion
current was by three orders of magnitude lower than those of H2O, NO, N2O, and NO2. It is seen
that the formation of HNO3 correlates in time with formation of other species.

64
Figure 4.13. Evolution of HNO3 during catalytic decomposition of HAN in a TGA test.
4.2.2 Thermoanalytical study on the decomposition of HAN at high pressures
4.2.2.1 HPDSC experiments
Figures 4.14 – 4.16 show typical DSC curves for the thermal decomposition of HAN at a heating
rate of 10 ºC/min and different pressures. It is seen that at 0–0.5 MPa (Figure 4.14) the exothermic
effect is significant over a wide range of temperatures, while at higher pressures (Figures 4.15 and
4.16) it is concentrated in a much smaller temperature range. Further, at gauge pressures 1–6 MPa
(Figure 4.15) there is still a noticeable heat release before the sharp peak, while at 7–15 MPa
(Figure 4.16) this initial increase is absent and virtually all heat is released at some temperature as
usually occurs for processes with a high activation energy.

65
Figure 4.14. DSC curves for decomposition of HAN at gauge pressures 0−0.5 MPa at a heating
rate of 10 °C/min.
Figure 4.15. DSC curves for decomposition of HAN at gauge pressures 1−6 MPa at a heating
rate of 10 °C/min.
0
10
20
120 130 140 150 160 170 180 190 200
Hea
t F
low
, m
W/m
g
Temperature, °C
0.0 MPa
0.1 MPa
0.2 MPa
0.3 MPa
0.4 MPa
0.5 MPa
0
10
20
120 130 140 150 160 170 180 190 200
Hea
t F
low
, m
W/m
g
Temperature,°C
1 MPa
2 MPa
3 MPa
4 MPa
5 MPa
6 MPa

66
Figure 4.16. DSC curves for decomposition of HAN at gauge pressures 7−15 MPa at a heating
rate of 10 °C/min.
To determine the kinetic parameters via ASTM E698 [77], it is necessary to conduct
HPDSC experiments at different heating rates, typically over the range of 1 – 10 K/min. Figures
4.17 – 4.19 show the typical DSC curves at pressures 5, 10, and 15 MPa.
0
10
20
120 130 140 150 160 170 180 190 200
Hea
t F
low
, m
W/m
g
Temperature, °C
7 MPa
8 MPa
9 MPa
10 MPa
11 MPa
12 MPa
13 MPa
14 MPa
15 MPa

67
Figure 4.17. DSC curves for decomposition of HAN at 5 MPa at heating rates of 1 – 10 °C/min.
0
10
20
30
40
50
60
30 40 50 60 70 80 90 100 110 120 130 140 150
Hea
t F
low
, m
W/m
g
Temperature, °C
1 ºC/min
2.5 ºC/min
5 ºC/min
10 ºC/min

68
Figure 4.18. DSC curves for decomposition of HAN at 10 MPa at heating rates of 1 – 10 °C/min.
Figure 4.19. DSC curves for decomposition of HAN at 15 MPa at heating rates of 1 – 10 °C/min.
0
10
20
30
40
50
60
30 40 50 60 70 80 90 100 110 120 130 140 150
Hea
t F
low
, m
W/m
g
Temperature, °C
1 ºC/min
2.5 ºC/min
5 ºC/min
10 ºC/min
0
10
20
30
40
50
60
30 40 50 60 70 80 90 100 110 120 130 140 150
Hea
t F
low
, m
W/m
g
Temperature, °C
1 ºC/min
2.5 ºC/min
5 ºC/min
10 ºC/min

69
Figure 4.20 shows the plot of the DSC peak temperature as a function of pressure. The
peak temperature at atmospheric pressure was close to the value reported in Section 4.2.1. It is
seen that the peak temperature decreases by about 50 °C with increasing gauge pressure from 0 to
2 MPa and remains about the same (around 130 °C) with further increase in pressure.
Figure 4.20. Temperature of the DSC peak as a function of gauge pressure at heating rates of 1 –
10 °C/min.
4.2.2.2 Model-free analysis of the HPDSC data
The effective kinetic parameters were extracted using the Ozawa-Wall-Flynn method for
DSC. Figures 4.21 – 4.23 show the Arrhenius plots of the decomposition of HAN at 5, 10, and
15 MPa, absed on the average values of the peak temperatures for each heating rate. The obtained
kinetic parameters are summarized in Table 4.2.
70
90
110
130
150
170
190
0 1 2 3 4 5 6 7 8 9 10 11 12 13 14 15
Te
mp
era
ture
of P
ea
k, °C
Pressure, MPa
1 °C/min
2.5 °C/min
5 °C/min
10 °C/min
H2O boiling
HNO3 boiling

70
Figure 4.21. Arrhenius plot of the decomposition of HAN at 5 MPa (average values).
Figure 4.22. Arrhenius plot of the decomposition of HAN at 10 MPa (average values).
y = -5.1916x + 13.551R² = 0.8846
-0.2
0.0
0.2
0.4
0.6
0.8
1.0
1.2
2.3 2.4 2.5 2.6 2.7
log (β
)
1000 K/T
y = -8.8039x + 22.624R² = 0.9474
-0.2
0.0
0.2
0.4
0.6
0.8
1.0
1.2
2.3 2.4 2.5 2.6 2.7
log (β
)
1000 K/T

71
Figure 4.23. Arrhenius plot of the decomposition of HAN at 15 MPa (average values).
Table 4.2. Kinetic parameters of HAN decomposition obtained via Ozawa-Wall-Flynn at
pressures of 5, 10, and 15 MPa, based on the average values of the peak temperatures.
Pressure Activation Energy Pre-exponential factor
kJ/mol s-1
5 MPa 92.7 ± 2.7 2.0 × 10¹³
10 MPa 161.9 ± 2.9 3.2 × 10²²
15 MPa 94.9 ± 11.4 2.5 × 10¹³
It is seen that the obtained values of the apparent activation energy are significantly higher
than that obtained at atmospheric pressure (around 60 kJ/mol, see Section 4.2.1). The highest
activation energy was obtained at 10 MPa. At 15 MPa, the results are less reliable (see Figure
4.23).
y = -5.315x + 13.803R² = 0.3016
-0.2
0.0
0.2
0.4
0.6
0.8
1.0
1.2
2.3 2.4 2.5 2.6 2.7
log (β
)
1000 K/T

72
Figures 4.17 – 4.19 show that the temperature of the DSC peak does not necessarily
increase with heating rate. In fact, at heating rates of 5 °C/min the temperature of the peak is either
the same (see Figure 4.17), close (see Figure 4.18), or higher (Figure 4.19) than the peak
temperatures obtained at 10 °C/min. However, these temperatures fluctuate, and it is interesting to
investigate the effect of the scatter on the determination of kinetic parameters. Figures 4.24 – 4.26
show the Arrhenius plots of DSC curves at 5, 10, and 15 MPa, obtained using the actual datapoints,
not the average values of the peak temperatures. The obtained kinetic parameters are summarized
in Table 4.3. It is seen that the obtained parameters are significantly lower that in Table 4.2, and
closer to the values obatined at atmospheric pressure.
Figure 4.24. Arrhenius plot of the decomposition of HAN at 5 MPa (actual peak temperatures).
y = -4.7695x + 12.492R² = 0.8127
-0.2
0
0.2
0.4
0.6
0.8
1
1.2
2.3 2.4 2.5 2.6 2.7
log (β
)
1000 K/T

73
Figure 4.25. Arrhenius plot of the decomposition of HAN at 10 MPa (actual peak temperatures).
Figure 4.26. Arrhenius plot of the decomposition of HAN at 15 MPa (actual peak temperatures).
y = -4.3822x + 11.525R² = 0.4716
-0.2
0
0.2
0.4
0.6
0.8
1
1.2
2.3 2.4 2.5 2.6 2.7
log (β
)
1000 K/T
y = -3.1603x + 8.42R² = 0.1793
-0.2
0.0
0.2
0.4
0.6
0.8
1.0
1.2
2.3 2.4 2.5 2.6 2.7
log (β
)
1000 K/T

74
Table 4.3. Kinetic parameters of HAN decomposition obtained via Ozawa-Wall-Flynn at
pressures of 5, 10, and 15 MPa, based on the actual peak temperatures.
Pressure Activation Energy Pre-exponential factor
kJ/mol s-1
5 MPa 84.6 ± 2.4 1.6 × 10¹²
10 MPa 77.2 ± 5.0 2.1 × 10¹¹
15 MPa 53.6 ± 7.2 6.5 × 10⁷
4.3 Discussion
It is seen that pressure significantly affects the decomposition of HAN and its kinetics. The
observed sharp decrease in the decomposition temperature of HAN (Figure 4.20) is remarkable. It
is also notable that the DSC peak was broad at low pressures (Figure 4.14) and sharp at high ones
(Figure 4.16). These results can be explained by the suppressing effect of pressure on the
evaporation of products that form and react during the decomposition process. The first step of
HAN decomposition produces nitric acid (HNO3), which plays a critical role in the reaction
mechanism [12]. The loss of nitric acid by evaporation inhibits the reactions. An increased pressure
suppresses the evaporation, promoting the reactions and leading to a decreased temperature of
decomposition and sharper DSC peaks. To verify this explanation, the boiling point of nitric acid
(65 wt% aqueous solution) was determined with DSC tests at gauge pressures of 0, 1, and 2 MPa.
The obtained dependence is shown in Figure 4.20. It is seen that the HNO3 boiling curve separates
the areas with higher and lower decomposition temperatures, which supports the proposed
explanation of the pressure effect.

75
In addition, although water is not involved as a reactant in the reaction mechanism
described by Eqs. (2-33) – (2-40), it has been previously reported that water decreases the
induction period of solid HAN [14]. Figure 4.20 shows that at pressures below 0.5 MPa the peak
temperature is higher than the boiling point of water, while at higher pressures it is the opposite.
Therefore, the formation of liquid water during the reaction at high pressures may also play a role
in decreasing the decomposition temperature.
In general, the calculated kinetic parameters at high pressures were higher to those reported
in Table 4.1. In addition, the relatively high values of activation energy correlate with the sharpness
observed in Figures 4.15 and 4.16. It is worth noting, however, that the deduced kinetic parameters
vary with how analysis is approached. By employing the average temperatures of the peaks, the
obtained activation energies have considerable discrepancies that cannot be overlooked. For
example, the calculated activation energies at 5 and 15 MPa are close to each other, but the
obtained value at 10 MPa is 67 – 69 kJ/mol higher. On the other hand, using the actual datapoints
in the analysis led to a decrease in the activation energy as pressure was increased. It is noteworthy
that at 5 MPa the values obtained by the two methods are similar and the R2 values are closer to 1.
This may indicate that the activation energy at this pressure lies around the 85 – 93 kJ/mol range,
though more experiments are needed to confirm this. At pressures of 10 and 15 MPa, however, the
scatter is too large for making any reliable conclusions.
4.4 Conclusions
The kinetics of thermal (no catalyst) and catalytic decomposition of aqueous HAN solution was
studied using thermoanalytical methods (TGA and DSC) coupled with mass spectrometry. For
both thermal and catalytic cases, the major decomposition products were H2O, NO, N2O, and NO2,
while peaks of N2 and HNO3 had much lower intensities. Thermal decomposition of HAN was

76
complete at about 160 °C at a heating rate of 1 K/min and at about 220 °C at 10 K/min. The values
of the apparent activation energy obtained for thermal decomposition using both TGA and DSC
methods are in agreement with the literature data for solid HAN [57] and solutions with high
concentrations of HAN [15] [56] [58]. The obtained values of the pre-exponential factor are much
lower than those reported in the literature for aqueous HAN solutions [15] [56], apparently because
of full vaporization of water from the HAN solution at the beginning of the TGA and DSC tests.
The use of an iridium/rhodium foam catalyst decreased the temperature of full decomposition by
over 60 ºC (at a heating rate of 1 K/min). The effect of the catalyst on the activation energy is
insignificant, which confirms the hypothesis [56] that the apparent activation energy of HAN
decomposition is determined by the endothermicity of the proton transfer reaction. The catalyst,
however, significantly increases the pre-exponential factor.
High-pressure differential scanning calorimetry was used to investigate the effect of
pressure on the decomposition of HAN. Analysis of the DSC curves obtained at a heating rate of
10 ºC/min shows that at pressures 0−0.5 MPa (gauge) the heat is released over a wide range of
temperatures, while at higher pressures the exothermic reaction occurs rapidly upon reaching a
certain temperature, which indicates a high activation energy. The temperature of complete
decomposition decreases by ca. 50 °C with increasing pressure from atmospheric to 2 MPa (gauge)
and changes only slightly with further increase in pressure up to 15 MPa (gauge). This effect can
be explained by the suppression of HNO3 evaporation at pressures beyond 2 MPa.
In general, the activation energy and pre-exponential factor at high pressures are higher
than the values obtained at atmospheric pressure. At 5 MPa, the values obtained by both
approaches are close to each other and the activation energy may lie in the 85 – 93 kJ/mol range,

77
though more experiments are needed to confirm this. At pressures of 10 and 15 MPa, however, the
scatter is too large for making any trustworthy conclusions.

78
Chapter 5 Decomposition of 2-hydroxyethylhydrazinium nitrate: results and
discussion
5.1 Overview
This chapter presents the results on the kinetics of thermal decomposition of HEHN and the
obtained information on the evolved gaseous products.
5.2 Results
5.2.1 Thermoanalytical experiments
In the TGA and DSC runs, the maximum temperature was 400 °C. HEHN was decomposed, and
a black, flaky solid residue was observed in the crucible after the run. The crucibles were fully
cleaned by heating up to 1000 °C.
Figure 5.1 shows the typical TG curves at heating rates of 1, 2.5, 5, and 10 °C/min. In
contrast with the work [72], no mass loss due to evaporation of water was detected in our
experiments, which is explained by the high purity of the tested HEHN and by conducting vacuum
cycles before the run. It is seen that the TG curves have two distinct mass loss regimes at
temperatures higher than the boiling point of water. The first regime, where the mass decreases by
approximately 45%, is observed over the temperature range of 140 – 180 ºC at a heating rate of
1 °C/min. With increasing the heating rate to 10 °C/min, the end temperature of this regime
increases to 220 ºC. The second regime, characterized by 45 – 80% mass loss, occurs over the
temperature range of 180 – 210 ºC at a heating rate of 1 °C/min and 220 – 250 ºC at 10 °C/min.
The existence of two mass loss regimes implies that there are two stages in the decomposition of
HEHN. In the TGA trace in work [72], the mass decreases smoothly with increasing temperature,

79
and the differential thermogravimetric analysis showed only a single peak for the decomposition.
It should be noted that purity of the tested HEHN was not reported in reference [72].
Figure 5.1. TGA curves of HEHN decomposition at different heating rates.
Figure 5.2 illustrates the typical HEHN DSC curves at 1, 2.5, 5, and 10 °C/min. It is seen
that each curve has two evident exothermic peaks about 50 ºC apart. At a heating rate of 1 °C/min,
the peaks are at 165 ºC and 210 ºC. With increasing the heating rate, the peak temperatures
increase, reaching 196 ºC and 244 ºC at 10 °C/min. In each curve, the second peak is higher and
sharper than the first one.
0
10
20
30
40
50
60
70
80
90
100
30 50 70 90 110 130 150 170 190 210 230 250 270 290
Ma
ss, %
Temperature, °C
1 °C/min
2.5 °C/min
5 °C/min
10 °C/min

80
Figure 5.2. DSC curves of HEHN decomposition at heating rates of 1, 2.5, 5, and 10 °C/min.
The existence of two exothermic peaks correlates with the two regimes of mass loss
observed in the TGA. Figure 5.3 shows that the temperature of the first DSC peak correlates with
the first mass loss regime in the TG curves, while the second peak corresponds to the final, drastic
loss of mass.
-2
0
2
4
6
8
10
12
14
30 50 70 90 110 130 150 170 190 210 230 250 270 290
Hea
t flow
, μ
W/m
g
Temperature, °C
1 °C/min
2.5 °C/min
5 °C/min
10 °C/min

81
Figure 5.3. TG and DSC curves of HEHN decomposition at 10 °C/min.
5.2.2 Model-free analysis of the TGA data
The obtained TGA and DSC data were analyzed using Netzsch Thermokinetics 3.1 software with
the goal of extracting kinetic information via model-free analysis (based on Ozawa-Wall-Flynn
[73] [74] [75] [77] and Kissinger [78] [79] [80] methods) and, as the next step, model-based
analysis.
Figure 5.4 shows the dependencies of the heating rate on the reciprocal of the temperature
at different values of the conversion degree, determined from the obtained TGA data for
decomposition of HEHN. As seen from Eq. (2), the activation energy is proportional to the slope
of such a dependence. Using Eqs. (2) and (3), these data lead to the dependencies of the activation
energy and pre-exponential factor on the conversion degree, shown in Figure 5.5. It is seen in
Figures 5.4 and 5.5 that two distinct regimes take place. Both the activation energy and pre-
exponential factor change slightly with increasing the conversion degree from 10 to 40% and more
0
2
4
6
8
10
12
14
0
10
20
30
40
50
60
70
80
90
100
30 50 70 90 110 130 150 170 190 210 230 250 270 290
Hea
t flow
(μ
W/m
g)
Ma
ss, %
Temperature, °C
TG
DSC

82
significantly with increasing it from 50 to 90%. Since these two ranges correlate with the two
stages of mass loss observed in the TG curves, it can be concluded that the activation energy is 96
– 98 kJ/mol at the first stage and 87 − 119 kJ/mol at the second stage of HEHN decomposition.
Figure 5.4. The heating rate vs. the reciprocal of the temperature at different conversion degrees
0.05 apart for HEHN determined by TGA.
1.9 2.0 2.1 2.2 2.3 2.4
1000 K/T
0
0.2
0.4
0.6
0.8
1.0
log Heating rate/(K/min)
0.05 0.90
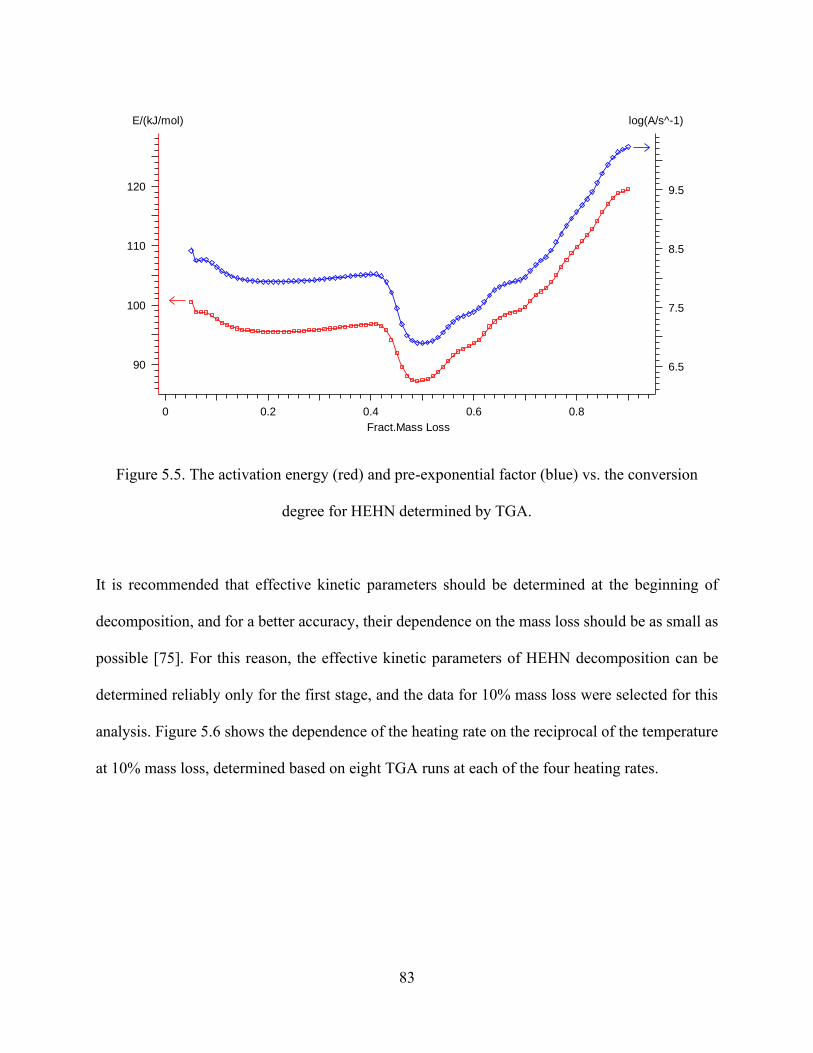
83
Figure 5.5. The activation energy (red) and pre-exponential factor (blue) vs. the conversion
degree for HEHN determined by TGA.
It is recommended that effective kinetic parameters should be determined at the beginning of
decomposition, and for a better accuracy, their dependence on the mass loss should be as small as
possible [75]. For this reason, the effective kinetic parameters of HEHN decomposition can be
determined reliably only for the first stage, and the data for 10% mass loss were selected for this
analysis. Figure 5.6 shows the dependence of the heating rate on the reciprocal of the temperature
at 10% mass loss, determined based on eight TGA runs at each of the four heating rates.
0 0.2 0.4 0.6 0.8
Fract.Mass Loss
90
100
110
120
E/(kJ/mol)
6.5
7.5
8.5
9.5
log(A/s^-1)
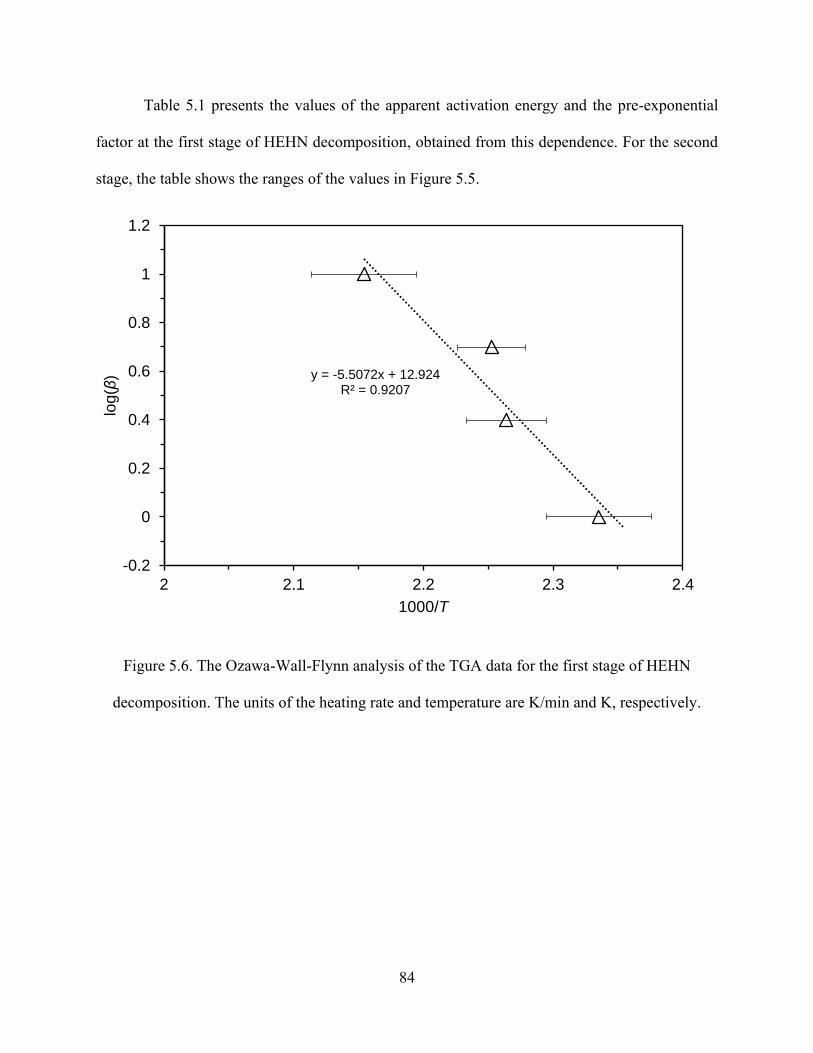
84
Table 5.1 presents the values of the apparent activation energy and the pre-exponential
factor at the first stage of HEHN decomposition, obtained from this dependence. For the second
stage, the table shows the ranges of the values in Figure 5.5.
Figure 5.6. The Ozawa-Wall-Flynn analysis of the TGA data for the first stage of HEHN
decomposition. The units of the heating rate and temperature are K/min and K, respectively.
y = -5.5072x + 12.924R² = 0.9207
-0.2
0
0.2
0.4
0.6
0.8
1
1.2
2 2.1 2.2 2.3 2.4
log(β
)
1000/T

85
Table 5.1. Kinetic parameters of HEHN decomposition obtained by the Ozawa-Wall-Flynn
(TGA – OWF and DSC – OWF), and Kissinger (DSC − K) methods.
Stage Activation energy Pre-exponential factor
kJ∙mol−1 s−1
TGA – OWF
1 97.6 ± 7.8 1.6 × 10⁸
2 87 – 119 7.8 × 10⁶ – 1.7 × 10¹⁰
DSC – OWF
1 145.2 ± 0.9 4.1 × 10¹⁷
2 155.2 ± 9.0 2.2 × 10¹⁷
DSC – K
1 143.6 ± 0.3 2.9 × 10¹⁷
2 217.9 ± 1.7 6.0 × 10²³
5.2.3 Model-free analysis of the DSC data
The effective kinetic parameters were extracted from the DSC data using the Ozawa-Wall-Flynn
method for DSC [77].
These calculations were conducted using the Thermokinetics software. Figure 5.7 shows the
logarithm of the heating rate vs. the reciprocal of the temperature for the first and second peaks in
the DSC curves, obtained in eight experiments at each heating rate. It is seen that for the second
peak (the line on the left in Figure 5.7), the scatter is larger and the accuracy of the linear
approximation is lower than for the first peak. This may indicate a more complex reaction
mechanism, which could also cause the observed increase in the apparent activation energy in

86
Figure 5.5. The kinetic parameters obtained from the dependences shown in Figure 5.7 are
presented in Table 5.1 The activation energies of the two stages by DSC are higher than the values
obtained from the TGA data.
Figure 5.7. The Ozawa-Wall-Flynn analysis of the DSC data for two stages of HEHN
decomposition. The units of the heating rate and temperature are K/min and K, respectively.
The activation energy and pre-exponential factor of the two stages were also determined
from the DSC data by the Kissinger [78] [79] [80] method. Figure 5.8 shows the obtained Kissinger
lines, described by Eq. (3-8) in Chapter 3, for the two DSC peaks. Again, the scatter was larger for
the second peak. The slope and intercept were determined using the least-squares method, and the
obtained values of E and A are shown in Table 5.1.
y = -7.9899x + 17.847R² = 0.994
y = -8.5476x + 17.394R² = 0.643
-0.2
0
0.2
0.4
0.6
0.8
1
1.2
1.8 1.9 2 2.1 2.2 2.3
log(β
)
1000/T
First Peak
Second Peak

87
Figure 5.8. The Kissinger analysis of the DSC data for two stages of HEHN decomposition. The
units of the heating rate and temperature are K/min and K, respectively.
It is worth noting that the Kissinger and Ozawa-Wall-Flynn analyses of the DSC data have
produced virtually the same activation energy of the first stage, 144 – 145 kJ/mol. However, the
value determined based on the TGA data is lower by about 50 kJ/mol. Additionally, there is a large
difference between the values of the activation energy of the second stage extracted by two
methods from the same DSC data. These discrepancies indicate that the model-free methods
involve assumptions that may be invalid for the investigated reactions. For example, the Ozawa-
Wall-Flynn method assumes the first order of the reaction, which may be incorrect. Furthermore,
the Kissinger method does not allow determination of the reaction order. Model-based methods do
y = -17.266x + 30.469R² = 0.9926y = -26.205x + 44.57
R² = 0.8694
-9
-8
-7
-6
-5
1.8 1.9 2 2.1 2.2 2.3
ln(β
/Tm
2)
1000/Tm
First Peak
Second Peak

88
not involve such assumptions/limitations and can provide more detailed information on the
reaction mechanism.
5.2.4 Model-based analysis of the TGA data
The model-based analysis was conducted to determine the decomposition models that fit the TGA
data. Since two stages of HEHN decomposition were observed, the models with two consecutive
reactions were tested. The analysis was performed based on seven kinetic models (Table 5.2) for
each of the two stages, totaling 49 two-stage decomposition models. The model abbreviations in
Table 3 are commonly used in the literature. Also, as usual, f(e,p) is a function of conversion
degree α (α = p = 1 – e), Kcat is the catalytic constant, and X is the concentration of the autocatalyst.
Table 5.2. Kinetic models tested for fitting the TGA data on decomposition of HEHN.
Model
abbreviation f(e,p) Reaction type
F1 𝑒 First order
F2 𝑒2 Second order
Fn 𝑒𝑛 nth order
B1 𝑒𝑝 Autocatalysis via the first order Prout-Tompkins
equation
Bna 𝑒𝑛𝑝𝑎 Autocatalysis via the nth order Prout-Tompkins
equation
C1-X 𝑒(1 + 𝐾𝑐𝑎𝑡𝑋) First order autocatalysis
Cn-X 𝑒𝑛(1 + 𝐾𝑐𝑎𝑡𝑋) nth order autocatalysis

89
It should be noted that the Thermokinetics software also includes the Avrami-Erofeev
equations (kinetic models A2, A3, and An), which describe sigmoid-type kinetic curves similar to
those obtained in autocatalysis. However, these equations describe processes with nucleation and
growth, such as crystallization, and they should not be used for autocatalytic processes, where
branching is an inherent part of the reaction mechanism [82]. For this reason, the Avrami-Erofeev
equations were not tested in the model-based analysis of HEHN decomposition.
For a successful analysis, the Thermokinetics software relies on realistic initial conditions;
thus they were based on the kinetic parameters obtained by model-free analysis (TGA-OWF, DSC-
OWF, and DSC-K methods) shown in Table 5.1. As noted above, in the TGA-OWF case, the
kinetic parameters of the second stage could not be reliably determined. However, to provide the
initial conditions for model-based analysis, the parameters calculated at 0.55 conversion degree,
i.e. at the beginning of the second stage (see Figure 5.5), were used. The software carries out a
nonlinear regression calculation using the Prince-Dormand method to solve 5th-degree ordinary
differential equations. The quality of fit is determined by performing Fisher’s exact test (F-test),
where the algorithm searches for the model with the least variance [76]. This model is
characterized by Fexp value being equal to unity, while others get larger values of Fexp.
First, the analysis determined the best two-stage reaction models for each of the three initial
conditions. For TGA-OWF, DSC-OWF, and DSC-K initial conditions, two, two, and one models,
respectively, are characterized by Fexp = 1.00. Next, the software compared these models between
each other and determined their Fexp values in this group of five, which were in the range from
1.00 to 1.02. Table 5.3 presents these models and the obtained kinetic parameters, while Figures
A1 – A5 in the Appendix show the computed and experimental TG curves for each model.

90
Table 5.3. Kinetic parameters determined in model-based analysis of the TGA data on HEHN
decomposition.
Initial
conditions
First stage Second stage Fexp
Model E A n Model E A n
kJ∙mol−1 M1−n∙s−1 kJ∙mol−1 M1−n∙s−1
TGA-OWF Bna 111.9 1.5 × 10⁹ 2.31 C1-X 127.3 2.0 × 10¹⁰ 1 1.00
TGA-OWF Bna 112.5 1.6 × 10⁹ 2.28 Cn-X 125.7 2.6 × 10¹⁰ 0.78 1.00
DSC-OWF Bna 115.8 4.2 × 10⁹ 2.26 Cn-X 121.3 5.1 × 10¹⁰ 0.3 1.02
DSC-OWF Cn-X 112.6 4.1 × 10⁸ 2.57 Fn 122.4 1.0 × 10¹¹ 0.09 1.02
DSC-K Bna 115.8 4.2 × 10⁹ 2.26 Fn 121.3 6.4 × 10¹⁰ 0.3 1.02
It should be noted that Thermokinetics software uses kinetic functions based on the
conversion degree (see Table 5.2), where pre-exponential factors have a dimension of s−1
independently on the reaction order. To obtain the pre-exponential factors for kinetic functions
based on concentrations, shown in Table 4, the molarity of HEHN was determined based on its
density at 298 K, 1.428 g/cm3.
Analysis of the five models in Table 5.3 shows a high confidence level for the first stage.
Four models indicate that this stage is Prout-Tompkins autocatalysis (Bna) with an activation
energy of 112 – 116 kJ/mol and reaction order of 2.3. One model shows nth order autocatalysis
(Cn-X) with the same activation energy and slightly different reaction order, 2.6. The results for
the second stage show larger differences between the obtained models. Three of them show
autocatalysis (Cn-X) with a reaction order from 0.3 to 1, and two others show an nth order reaction

91
(Fn) with a reaction order from 0.1 to 0.3. These discrepancies are not surprising, given the larger
scatter for the second stage in the experimental TGA and DSC data. The activation energies of the
second stage, obtained in the five models, are close to each other, 121 – 127 kJ/mol. The fractional
order of the reaction indicates that the reaction mechanism is more complex than in the tested
kinetic models.
Although these results do not allow one to make unambiguous conclusions on the precise
kinetic model at each stage, several important features can be noted. The expected autocatalytic
behavior was undoubtedly confirmed for the first stage. The average value and the standard
deviation were determined for each stage of the five models. The obtained values of the apparent
activation energy are: 113.7 ± 1.7 kJ/mol for the first stage and 123.6 ± 2.5 kJ/mol for the second
stage. It is worth noting that the second stage has a higher apparent activation energy than the first
one. Also, the second stage has a lower apparent reaction order.
5.2.5 Effect of experimental scatter in the determination of kinetic parameters via model-
free and model-based methods
As shown in Figures 5.6 – 5.8, the scatter cannot be ignored. Since the methods used are based on
linear regression, there is an inherent error associated. However, in this case, the scatter plays a
major role in the determination of effective kinetic parameters.
Figure 5.9 shows the Ozawa-Wall-Flynn analysis of the TGA data including all 16 points.
It is seen that the R2 in Figure 5.9 is significantly less than the value in Figure 5.6. and the equation
of the line is completely different. As the kinetic parameters from TG data were obtained via
Netzsch Thermokinetics from all 16 points in Section 5.2.2, no further analysis is done here.
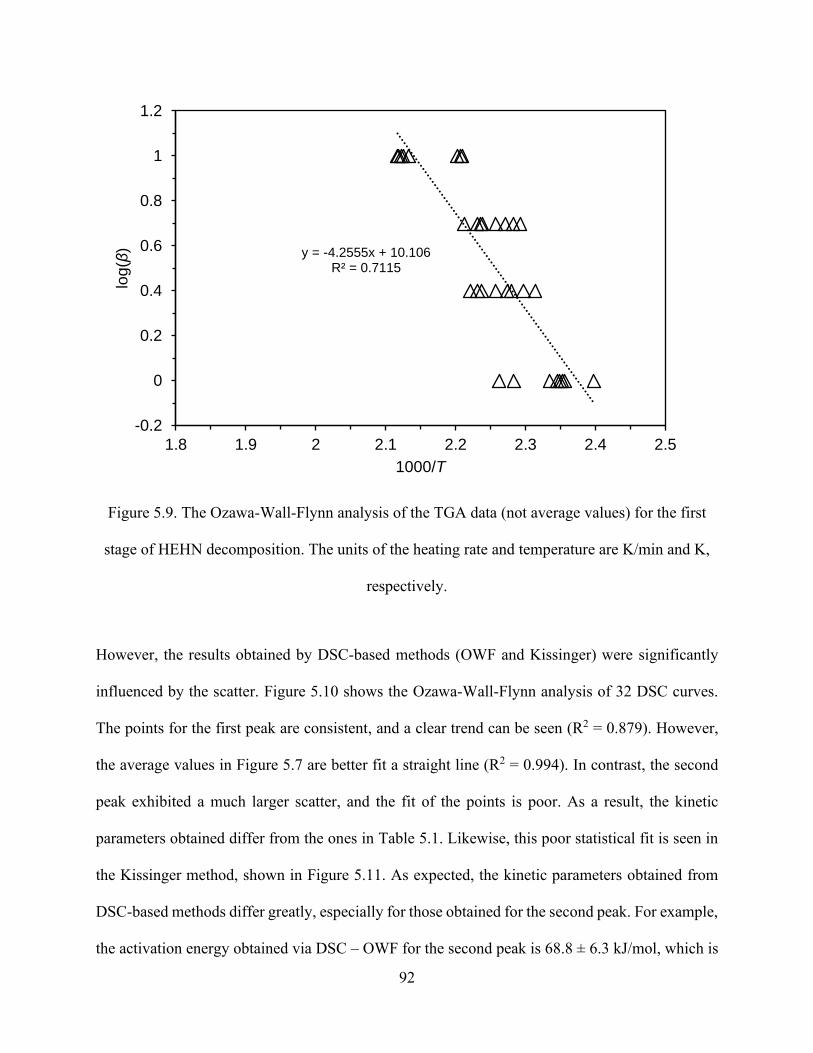
92
Figure 5.9. The Ozawa-Wall-Flynn analysis of the TGA data (not average values) for the first
stage of HEHN decomposition. The units of the heating rate and temperature are K/min and K,
respectively.
However, the results obtained by DSC-based methods (OWF and Kissinger) were significantly
influenced by the scatter. Figure 5.10 shows the Ozawa-Wall-Flynn analysis of 32 DSC curves.
The points for the first peak are consistent, and a clear trend can be seen (R2 = 0.879). However,
the average values in Figure 5.7 are better fit a straight line (R2 = 0.994). In contrast, the second
peak exhibited a much larger scatter, and the fit of the points is poor. As a result, the kinetic
parameters obtained differ from the ones in Table 5.1. Likewise, this poor statistical fit is seen in
the Kissinger method, shown in Figure 5.11. As expected, the kinetic parameters obtained from
DSC-based methods differ greatly, especially for those obtained for the second peak. For example,
the activation energy obtained via DSC – OWF for the second peak is 68.8 ± 6.3 kJ/mol, which is
y = -4.2555x + 10.106R² = 0.7115
-0.2
0
0.2
0.4
0.6
0.8
1
1.2
1.8 1.9 2 2.1 2.2 2.3 2.4 2.5
log(β
)
1000/T

93
almost as half as the one obtained with average values. The rest of the kinetic parameters are shown
in Table 5.4.
Figure 5.10. The Ozawa-Wall-Flynn analysis of the DSC data (not average values) for two stages
of HEHN decomposition. The units of the heating rate and temperature are K/min and K,
respectively.
y = -7.0651x + 15.842R² = 0.879
y = -4.0327x + 8.4833R² = 0.3033
-0.2
0
0.2
0.4
0.6
0.8
1
1.2
1.8 1.9 2 2.1 2.2 2.3 2.4
log(β
)
1000/T
First Peak
Second Peak
94
Figure 5.11. The Kissinger analysis of the DSC data (not average values) for two stages of
HEHN decomposition. The units of the heating rate and temperature are K/min and K,
respectively.
y = -15.348x + 26.309R² = 0.8661
y = -8.2822x + 9.1913R² = 0.2572
-9
-8
-7
-6
-5
1.8 1.9 2 2.1 2.2 2.3 2.4 2.5
ln(β
/Tm
2)
1000/Tm
First Peak
Second Peak

95
Table 5.4. Kinetic parameters of HEHN decomposition obtained by the Ozawa-Wall-Flynn
(TGA – OWF and DSC – OWF), and Kissinger (DSC − K) methods. Not average values.
Stage Activation energy Pre-exponential factor
kJ∙mol−1 s−1
TGA – OWF
1 97.6 ± 7.8 1.6 × 10⁸
2 87 – 119 7.8 × 10⁶ – 1.7 × 10¹⁰
DSC – OWF
1 127.5 ± 2.7 3.3 × 10¹⁵
2 68.8 ± 6.3 1.1 × 10⁸
DSC – K
1 127.6 ± 0.8 4.1 × 10¹⁵
2 68.9 ± 1.7 8.1 × 10⁷
This discrepancy in results directly affects the model-based analysis as the values in Table 5.4 are
used as initial conditions for the numerical simulations. Table 5.5 shows the kinetic models and
parameters obtained. It is seen that six models were obtained as opposed to five with average
values as initial conditions. Models Bna → C1-X and Bna → Cn-X appear in both tables because
the initial conditions did not change for TGA-OWF analysis. For DSC-based analysis, the resulting
models are completely different. In Table 5.5, the three kinetic models, Fn → B1, Cn-X → B1,
and F2 → Bna, were obtained as opposed to the two presented in Table 5.4. Surprisingly, the
activation energies and reaction orders in both tables are close to each other, with the exception of

96
F2 → Bna. It can be concluded that the initial conditions have a significant effect on the numerical
simulations.
Table 5.5. Kinetic parameters determined in model-based analysis of the TGA data on
decomposition of HEHN. The values in Table 5.4 were used as initial conditions.
Initial
conditions
First stage Second stage Fexp
Model E A n Model E A n
kJ∙mol−1 M1−n∙s−1 kJ∙mol−1 M1−n∙s−1
TGA-OWF Bna 111.9 1.5 × 10⁹ 2.31 C1-X 127.3 2.0 × 10¹⁰ 1 1.00
TGA-OWF Bna 112.5 1.6 × 10⁹ 2.28 Cn-X 125.7 2.6 × 10¹⁰ 0.78 1.00
DSC-OWF Fn 115.3 1.2 × 10⁹ 2.39 B1 129.7 2.0 × 10¹² 1 1.06
DSC-OWF Cn-X 114.7 1.2 × 10⁹ 2.40 B1 129.0 1.6 × 10¹² 1 1.06
DSC-OWF F2 112.7 1.5 × 10⁹ 2.00 Bna 154.7 7.8 × 10¹¹ 6.25 1.07
DSC-K Cn-X 114.1 1.2 × 10⁹ 2.4 Cn-X 125.2 2.6 × 10¹¹ 0 1.06
5.2.6 Evolved gas analysis
During the thermal decomposition of HEHN, 38 m/z values were detected by mass spectrometry.
Figure 5.12 shows the most intense MS signals generated during heating HEHN at a rate of
10 °C/min. Other signals were by 1 – 3 orders of magnitude less (ion currents of the order of 10−12
– 10−10 A), and many of them were possibly caused by fragmentation of HEH+ (their temperature
profiles are presented in the Appendix, Figures A6 – A10). Two stages of gas evolution are clearly
seen in Figure 5.12. The gases, identified using the literature data [81], include H2O (m/z = 18),

97
NH3 (m/z = 16, 17), N2 (m/z = 28), and NO (m/z = 30). The m/z = 44 curve could be produced by
both N2O and CO2.
Figure 5.12. Temperature profiles of the most intense lines in the mass spectra of gases evolved
during TGA of HEHN at a heating rate of 10 °C/min.
Figure 5.13 shows some of the most intense FTIR signals generated during heating HEHN
at a rate of 10 °C/min. The two stages are again seen clearly. In addition, Figure 5.14 shows the
FTIR spectra obtained at temperatures of 196 °C and 251 °C (for clarity, in the range of
wavelengths 700 – 2300 cm−1 with the most intense lines). The FTIR analysis confirms that a
significant amount of NH3 was released at both stages. It also clarifies that the m/z = 44 signal
during the first stage was generated by N2O and not by CO2, while during the second stage the m/z
= 44 signal was produced mainly by CO2 and, to a lesser extent, by N2O. It also shows intense
lines of HNO3 during the second stage.
0
1
2
3
4
5
6
7
8
30 50 70 90 110 130 150 170 190 210 230 250 270 290
Ion
Curr
en
t, n
A
Temperature,°C
m/z = 16
m/z = 17
m/z = 18
m/z = 28
m/z = 30
m/z = 44

98
Figure 5.13. Temperature profiles of the most intensive lines in the FTIR spectra of gases
evolved during TGA of HEHN at a heating rate of 10 °C/min.
0
100 120 140 160 180 200 220 240 260 280 300
Ab
so
rba
nce
, a
.u.
Temperature,°C
NO₂NH₃
N₂O CO₂
HNO₃

99
Figure 5.14. FTIR spectra of gases evolved at 196 °C and 251 °C during TGA of HEHN at a
heating rate of 10 °C/min.
5.3 Discussion
All the used techniques (TGA, DSC, MS, and FTIR) have clearly shown the existence of two
stages of HEHN thermal decomposition. The model-free analysis was conducted using both the
average values of the peak temperatures and the actual datapoints. It is seen that the R2 values for
the first stage are close to unity in both approaches, however, the linear fitting for the second stage
is poor in the plots with the actual datapoints, thus no reliable results can be obtained. For this
reason, the kinetic parameters obtained using average peak temperatures were chosen as the
preferred initial conditions for model-based analysis.
The apparent activation energies determined by the model-based thermal analysis, 113.7 ±
1.7 kJ/mol for the first stage and 123.6 ± 2.5 kJ/mol for the second stage, are relatively close
7009001100130015001700190021002300
Ab
so
rba
nce
, a
.u.
Wavenumber, cm-1
196 °C
251 °C
NH₃
NH3
NO₂
N₂ON₂O
NH₃
NO₂
HNO₃
HNO₃

100
(especially the latter) to the value of 124.8 kJ/mol obtained by Chowdhury and Thynell [67] for
step 2 in their reaction mechanism (autocatalytic reaction between HEHN and HNO3) and much
lower than 183 kJ/mol for step 1 (proton transfer) in that mechanism (see Table 2.2 in Chapter 2).
Apparently, the proton transfer reaction, despite its high activation energy, is able to produce a
small initial number of HNO3 molecules, the number of which is then dramatically increased by
the autocatalytic reaction.
The FTIR spectroscopy has shown a clear difference in the compositions of gases evolved
during the two stages. At the first stage, NH3 generates the most intense signal, followed by N2O,
whereas at the second stage NO2 and HNO3 prevail. The results of mass spectrometry complement
the FTIR data. They show significant amounts of N2 and NO. Note the symmetrical diatomic
molecules of N2 cannot be detected by FTIR.
Combining the results of MS and FTIR, one can suggest that the first stage of HEHN
decomposition generates H2O, N2, NH3, NO, N2O, and NO2. The composition of gases evolved
during the second stage is different. Although it includes the same five gases, the amounts of NH3
and N2O significantly decreased and strong signals of HNO3 and CO2 appeared. Note that the gases
detected in [72] included NO2, NH3, N2O, HNO3, and CO2, but they evolved via a single
decomposition process.
These results imply that the reaction mechanism of HEHN composition differs from that
proposed by Chowdhury and Thynell [67]. In particular, the reaction step 3 (see Table 2.2) should
include NH3, NO, NO2, and CO2. It should also be noted that the obtained FTIR spectra do not
confirm the presence of acetaldehyde (CH3CHO) postulated in that reaction mechanism. Further,
the reaction mechanisms of the two stages, discovered in the present work, differ from each other.

101
The existence of two stages of HEHN decomposition during linear heating has not been
reported previously. The low-temperature stage of the mass loss in TGA experiments [72] was
caused by the evaporation of water and not by decomposition of HEHN. No mass loss was
observed at such temperatures in the present work, where a high-purity HEHN was tested and
vacuum cycles were used to vaporize any absorbed water.
5.4 Conclusions
Thermal decomposition of high-purity HEHN was studied using thermogravimetric analysis and
differential scanning calorimetry. The decomposition is characterized by two regimes of mass loss
in TGA and two distinct exothermic peaks in DSC, which indicates the existence of two stages in
the overall decomposition process.
The effective kinetic parameters of both stages were determined using the Ozawa-Wall-
Flynn, Kissinger, and model-based methods. Model-free analysis was conducted using both the
average values of the peak temperatures and the actual datapoints. In the latter, the linear fitting
for the second stage was poor, thus no reliable results could be obtained. For this reason, the kinetic
parameters obtained via model-free analysis using the average peak temperatures were chosen as
the preferred initial conditions for model-based analysis. The model-based analysis has shown
autocatalytic behavior of the involved reactions and produced apparent activation energies of 113.7
± 1.7 kJ/mol at the first stage and 123.6 ± 2.5 kJ/mol at the second stage, close to the value of
124.8 kJ/mol, previously obtained [67] for the autocatalytic reaction between HEHN and HNO3.
Mass spectrometry and FTIR spectroscopy of gases evolved at different temperatures
during TGA of HEHN confirm the existence of these two stages. These results also show that the

102
previously proposed [67] reaction mechanism of HEHN decomposition has to be expanded to
include NH3, NO, NO2, and CO2 gas products.
103
Chapter 6 Conclusions
The kinetics of thermal (no catalyst) and catalytic decomposition of aqueous HAN solution was
studied using thermoanalytical methods (TGA and DSC) coupled with mass spectrometry.
For both thermal and catalytic cases, the major decomposition products were H2O, NO,
N2O, and NO2, while peaks of N2 and HNO3 had much lower intensities. Thermal decomposition
of HAN was complete at about 160 °C at a heating rate of 1 K/min and at about 220 °C at 10 K/min.
The use of an iridium/rhodium foam catalyst decreased the temperature of full decomposition by
over 60 ºC (at a heating rate of 1 K/min).
The values of the apparent activation energy obtained for thermal decomposition using
both TGA and DSC methods are in agreement with the literature data for solid HAN [57] and
solutions with high concentrations of HAN [15] [56] [58]. The obtained values of the pre-
exponential factor are much lower than those reported in the literature for aqueous HAN solutions
[15] [56], apparently because of full vaporization of water from the HAN solution at the beginning
of the TGA and DSC tests. The effect of the catalyst on the activation energy is insignificant,
which confirms the hypothesis [56] that the apparent activation energy of HAN decomposition is
determined by the endothermicity of the proton transfer reaction. The catalyst, however,
significantly increases the pre-exponential factor.
High-pressure differential scanning calorimetry was used to investigate the effect of
pressure on the decomposition of HAN. Analysis of the DSC curves obtained at a heating rate of
10 ºC/min shows that at pressures 0−0.5 MPa (gauge) the heat is released over a wide range of
temperatures, while at higher pressures the exothermic reaction occurs rapidly upon reaching a
certain temperature, which indicates a high activation energy. The temperature of complete
decomposition decreases by ca. 50 °C with increasing pressure from atmospheric to 2 MPa (gauge)

104
and changes only slightly with further increase in pressure up to 15 MPa (gauge). This effect can
be explained by the suppression of HNO3 evaporation at pressures beyond 2 MPa.
In general, the calculated activation energy and pre-exponential factor are higher than those
values obtained at atmospheric pressures. At pressures of 5 MPa, the activation energy may lie in
the 85 – 93 kJ/mol range, but more experiments are needed to confirm this. At pressures of 10 and
15 MPa, however, the scatter is too large for making any trustworthy conclusions.
The thermal decomposition of HEHN was studied using thermogravimetric analysis and
differential scanning calorimetry. The decomposition is characterized by two regimes of mass loss
in TGA and two distinct exothermic peaks in DSC, which indicates the existence of two stages in
the decomposition process.
The apparent activation energy and pre-exponential factor were first deduced for each stage
with the Ozawa-Wall-Flynn method. In the results obtained for both TGA and DSC data, there is
a two-order of magnitude difference between the pre-exponential factors of the two stages, while
the activation energies are close to each other.
Model-based analysis of TGA data has shown reasonable fit and realistic parameters for a
model that includes autocatalysis as the first stage. The activation energies of the two stages are
close to each other and to the values obtained by the Ozawa-Wall-Flynn method. The obtained
fractional orders of reaction indicate a complex mechanism of each stage.
The values of the activation energy of both stages, obtained by model-free and model-
based methods, are close to the activation energy of the autocatalytic reaction between HEHN and
HNO3, determined in prior research where confined rapid thermolysis was used [67]. Mass
spectrometry and FTIR spectroscopy of gases evolved at different temperatures during TGA of
HEHN confirm the existence of these two stages. These results also show that the previously
105
proposed [67] reaction mechanism of HEHN decomposition has to be expanded to include NH3,
NO, NO2, and CO2 gas products.

106
References
[1] C. Kappenstein, Y. Batonneau, R. Brahmi and L. Pirault-Roy, "Propulsion and catalysis-
Historical survey, up-to-date overview, and current challenges," International Journal of
Energetic Materials and Chemical Propulsion, vol. 9, no. 5, pp. 413-436, 2010.
[2] Z. Lei, B. Chen, Y. Koo and D. MacFarlane, "Introduction: ionic liquids," Chemical Reviews,
vol. 117, no. 10, pp. 6633-6635, 2017.
[3] M. Fokema and J. Torkelson, "Thermally stable catalyst and process for the decomposition
of liquid propellants". United States of America Patent 2007/0184971, 9 August 2007.
[4] K. Hori, T. Katsumi, S. Sawai, N. Azuma, K. Hatai and J. Nakatsuka, "HAN-based green
propellant, SHP163-Its R&D and test in space," Propellants, Explosives, Pyrotechnics, vol.
44, no. 9, pp. 1080-1083, 2019.
[5] J. Pembridge and G. Stedman, "Kinetics, mechanism, and stoicheiometry of the oxidation of
hydroxylamine by nitric acid," Journal of the Chemical Society, Dalton Transactions, no.
11, pp. 1657-1663, 1979.
[6] R. Gowland and G. Stedman, "Kinetic and product studies on the decomposition of
hydroxylamine in nitric acid," Journal of Inorganinc and Nuclear Chemistry, vol. 43, no. 11,
pp. 2859-2862, 1981.
[7] R. Gowland and G. Stedman, "A novel moving boundary reaction involving hydroxylamine
and nitric acid," Journal of the Chemical Society, Chemical Communications, no. 18, pp.
1038-1039, 1983.
107
[8] M. Bennet, G. Brown, L. Maya and F. Posey, "Oxidation of hydroxylamine by nitrous and
nitric acids," Inorganic Chemistry, vol. 21, pp. 2461-2468, 1982.
[9] J. Oxley and K. Brower, "Thermal decomposition of hydroxylamine nitrate," Propulsion,
vol. 872, pp. 63-70, 1988.
[10] E. Kim, H. Lee and C. T. S. Mallery, "Thermal decomposition studies of energetic materials
using confined rapid thermolysis/ FTIR spectroscopy," Combustion and Flame, pp. 239-255,
1997.
[11] H. Lee and S. Thynell, "Confined rapid thermolysis/FTIR spectroscopy of
hydroxylammonium nitrate," in 33rd Joint Propulsion Conference and Exhibit, Seattle, WA,
1997.
[12] K. Zhang and S. Thynell, "Thermal decomposition mechanism of aqueous
hydroxylammonium nitrate (HAN): Molecular simulation and kinetic modeling," The
Journal of Physical Chemistry A, vol. 122, no. 41, pp. 8086-8100, 2018.
[13] Y. Lee and T. Litzinger, "Combustion Chemistry of HAN, TEAN, and XM46," Combustion
Science and Technology, vol. 141, pp. 19-36, 1999.
[14] H. Lee and T. Litzinger, "Thermal decomposition of HAN-based liquid propellants,"
Combustion and Flame, vol. 127, pp. 2205-2222, 2001.
[15] H. Lee and T. Litzinger, "Chemical kinetic study of HAN decomposition," Combustion and
Flame, vol. 135, pp. 151-169, 2003.
[16] J. Cronin and T. Brill, "Thermal decomposition of energetic materials. 8. Evidence of an
oscillating process during the high-rate thermolysis of hydroxylammonium nitrate, and

108
comments on the interionic interactions," The Journal of Physical Chemistry, vol. 90, pp.
178-181, 1986.
[17] S. Raman, R. Ashcraft, M. Vial and M. Klasky, "Oxidation of hydroxylamine by nitrous and
nitric acids. Model development from first SCRF calculations," Journal of Physical
Chemistry A, vol. 109, pp. 8526-8536, 2005.
[18] R. R. S. Ashcraft and W. Green, "Ab initio aqueous thermochemistry: application to the
oxidation of hydroxylammine in nitric acid solution," Journal of Physical Chemistry B, vol.
111, pp. 11968-11983, 2007.
[19] D. Amariei, L. Courthéoux, S. Rossignol and C. Kappenstein, "Catalytic and thermal
decomposition of ionic liquid monopropellants using a dynamic reactor. Comparison of
powder and sphere-shaped catalyst," Chemical Engineering and Processing, vol. 46, pp.
165-174, 2007.
[20] R. Amrousse, K. Hori, W. Fetimi and K. Farhat, "HAN and ADN as liquid ionic
monopropellants: Thermal and catalytic decomposition process," Applied Catalysis B:
Enviromental, vol. 127, pp. 121-128, 2012.
[21] R. Amrousse, T. Katsumi, Y. Niboshi, N. Azuma, A. Bachar and K. Hori, "Performance and
deactivation of Ir-based catalyst during hydroxylammonium nitrate catalytic
decomposition," Applied Catalysis A: General, vol. 452, pp. 64-68, 2013.
[22] T. Katsumi, R. Amrousse, R. Niboshi and K. Hori, "A study on the combustion mechanism
of hydroxylammonium nitrate," International Journal of Energetic Materials and Chemical
Propulsion, vol. 14, pp. 307-319, 2015.
109
[23] F. Kidd III and N. L. K. Taylor, "Decomposition of hydroxylammonium nitrate in a low
pressure flowing thermal capillary system," Journal of Molecular Liquids, vol. 262, pp. 396-
404, 2018.
[24] C. Gao, J. Allen, W. Green and R. West, "Reaction mechanism generator: automatic
construction of chemical kinetic mechanisms," Computer Physics Communications, vol.
203, pp. 212-225, 2016.
[25] Y. Izato, K. Shiota and A. Miyake, "A detailed kinetics model for the decomposition of
aqueous hydroxylammonium nitrate," Science and Technology of Energetic Materials, vol.
80, no. 6, pp. 212-221, 2019.
[26] R. Eloirdi, S. Rossignol, C. Keppenstein, D. Duprez and N. Pillet, "Catalytic decomposition
of different monopropellants," in 3rd International Conference on Spacecraft Propulsion,
Cannes, 2000.
[27] L. Courthéoux, D. Amariei, S. Rossignol, C. Kappenstein, N. Pillet and M. Ford, "Thermal
and catalytic decomposition of HNF and HAN-based propellants," in 2nd International
Conference on Green Propellants for Space Propulsion, Cagliari, 2004.
[28] L. Courthéoux, D. Amariei, S. Rossignol and C. Kappenstein, "Facile catalytic
decomposition at low temperature of energetic ionic liquid as hydrazine substitute,"
European Journal of Inorganic Chemistry, pp. 2293-2295, 2005.
[29] L. Courthéoux, D. Amariei, S. Rossignol and C. Kappenstein, "Thermal and catalytic
decomposition of HNF and HAN liquid ionic as propellants," Applied Catalysis B:
Enviromental, vol. 62, pp. 217-225, 2006.
110
[30] R. Amrousse, T. Katsumi, T. Sulaiman, B. Das, H. Kumagai, K. Maeda and K. Hori,
"Hydroxylammonium nitrate as green propellant: Decomposition and stability,"
International Journal of Energetic Materials and Chemical Propulsion, vol. 11, no. 3, pp.
241-257, 2012.
[31] R. Amrousse, T. Katsumi, A. Bachar, R. Brahmi, M. Bensitel and K. Hori, "Chemical
engineering study for hydroxylammonium nitrate monopropellant decomposition over
monolith and grain metal-based catalysts," Reaction Kinetics, Mechanisms and Catalysis,
vol. 111, pp. 71-88, 2014.
[32] R. Amrousse, T. Katsumi, N. Itouyama, N. Azuma, H. Kagawa, K. Hatai, H. Ikeda and K.
Hori, "New HAN-based mixtures for reaction control system and low toxic spacecraft
propulsion subsystem: Thermal decomposition and possible thruster applications,"
Combustion and Flame, vol. 162, pp. 2686-2692, 2015.
[33] G. Risha, R. Yetter and V. Yang, "Electrolytic-induced decomposition and ignition of HAN-
based liquid monopropellants," International Journal of Energetic Materials and Chemical
Propulsion, vol. 6, no. 5, pp. 575-588, 2007.
[34] P. Khare, V. Yang, H. Meng, G. Risha and R. Yetter, "Thermal and electrolytic
decomposition and ignition of HAN-water solutions," Combustion Science and Technology,
vol. 187, pp. 1065-1078, 2015.
[35] C. Oomen, S. Rajaraman, R. Arun Chandru and R. Rajeev, "Catalytic decomposition of
hydroxylammonium nitrate monopropellant," in 2011 International Conference on
Chemistry and Chemical Process, Singapore, 2011.

111
[36] S. Hoyani, R. Patel, C. Oomen and R. Rajeev, "Thermal stability of hydroxylammonium
nitrate (HAN)," Journal of Thermal Analysis and Calorimetry, vol. 129, pp. 1083-1093,
2017.
[37] S. Onodaka, K. Sakaue, R. Noguchi, T. Kuwahara, X. Yu and H. Shibamoto, "Ignition
characteristics of HAN liquid for gas-hybrid rockets," in 49th AIAA/ASME/SAE/ASEE Joint
Propulsion Conference, San Jose, 2013.
[38] C. Hwang, S. Baek and S. Cho, "Experimental investigation of decomposition and
evaporation characteristics of HAN-based monopropellants," Combustion and Flame, vol.
161, pp. 1109-1116, 2014.
[39] M. Atamanov, K. Hori, E. Aliyev, R. Amrousse and Z. Mansurov, "Experimental
investigations of combustion enhancement of HAN-based green propellants with K2CO3-
activated carbon," in 26th International Colloqium on the Dynamics of Explosions and
Reactive Systems, Boston, 2017.
[40] S. Chambreau, D. Popolan-Vaida, G. Vaghjiani and S. Leone, "Catalytic decomposition of
hydroxylammonium nitrate ionic liquid," The Journal of Physical Chemistry Letters, vol. 8,
pp. 2126-2130, 2017.
[41] C. Van Dijk and R. Priest, "Thermal decomposition of hydroxylammonium nitrate at kilobar
pressures," Combustion and Flame, vol. 57, pp. 15-24, 1984.
[42] J. Cronin and T. Brill, "Thermal decomposition of energetic materials 29-The fast thermal
decomposition characteristics of a multicomponent material: liquid gun propellant 1845,"
Combustion and Flame, vol. 74, pp. 81-89, 1988.

112
[43] S. Vosen, "The burning rate of hydroxylammonium nitrate-based liquid propellants," in
Twenty-Second Symposium (International) on Combustion/The Combustion Institute,
Seattle, Washington, 1988.
[44] S. Vosen, "Concentration and pressure effects on the decomposition rate of aqueous
hydroxylammonium nitrate solutions," Combustion Science and Technology, vol. 68, pp. 85-
99, 1989.
[45] S. Vosen, "Hydroxylammonium nitrate-based liquid propellant combustion-Interpretation of
strand burner data and the laminar burning velocity," Combustion and Flame, vol. 82, pp.
376-388, 1990.
[46] B. Kondrikov, V. Annikov, V. Egorshev and L. De Luca, "Burning hydroxylammonium
nitrate," Combustion, Explosion, and Shock Waves, vol. 36, pp. 135-145, 2000.
[47] M. Farshchi, V. Vaezi and B. Shaw, "Studies of HAN-based monopropellant droplet
combustion," Combustion Science and Technology, vol. 174, no. 7, pp. 71-97, 2002.
[48] Y. Chang and K. Kuo, "Assessment of combustion characteristics and mechanism of
hydroxylammonium nitrate-based liquid monopropellant," Journal of Propulsion and
Power, vol. 18, no. 5, pp. 1076-1085, 2002.
[49] Y. Chang, J. Josten, B. Zhang, K. Kuo and B. Reed, "Combustion characteristics of energetic
HAN/methanol-based monopropellants," in 38th AIAA/ASME/SAE/ASEE Joint Propulsion
Conference & Exhibit, Indianapolis, 2002.
[50] T. Katsumi, R. Matsuda, T. Inoue, N. Tsuboi, H. Ogawa, S. Sawai and K. Hori, "Combustion
characteristics of hydroxylammonium nitrate aqueous solution," International Journal of
Energetic Materials and Chemical Propulsion, vol. 9, no. 3, pp. 219-231, 2010.

113
[51] T. Katsumi, H. Kodama, H. Shibamoto, J. Nakatsuka, K. Hasegawa, K. Kobayashi, H.
Ogawa, N. Tsuboi, S. Sawai and K. Hori, "Combustion characteristics of HAN-based liquid
monopropellant," International Journal of Energetic Materials and Chemical Propulsion,
vol. 7, no. 2, pp. 123-137, 2008.
[52] T. Katsumi, T. Inoue, J. Nakatsuka, K. Hasegawa, K. Kobayashi, S. Sawai and K. Hori,
"HAN-based green propellant, application, and its combustion mechanism," Combustion,
Explosion, and Shock Waves, vol. 48, no. 5, pp. 536-543, 2012.
[53] G. Homan-Cruz, K. McCown III and E. Petersen, "Effects of nano-scale additives and
methanol on the linear burning rates of aqueous HAN solutions," in Propulsion and Energy
Forum, 2014, 2014.
[54] J. Thomas, G. Homan-Cruz, J. Stahl and E. Petersen, "The effects of SiO2 and TiO2 on the
two-phase burning behavior of aqueous HAN propellant," Proceedings of the Combustion
Institute, vol. 37, pp. 3159-3166, 2019.
[55] K. McCown III and E. Petersen, "Effects of methanol and fumed silica on linear burning
rates of aqueous hydroxylammonium nitrate," International Journal of Energetic Materials
and Chemical Propulsion, vol. 14, no. 1, pp. 1-12, 2015.
[56] B. Shaw and F. Williams, "A model for the deflagration of aqueous solutions of
hydroxylammonium nitrate," in Twenty-Fourth Symposium (International) on
Combustion/The Combustion Institute, Sydney, Australia, 1992.
[57] V. Rafeev and Y. Rubstov, "Kinetics and mechanism of thermal decomposition of
hydroxylammonium nitrate," Russian Chemical Bulletin, vol. 42, pp. 1811-1815, 1993.

114
[58] J. Schoppelrei, M. Kieke and T. Brill, "Spectroscopy of hydrothermal reactions. 2. Reactions
and kinetic parameters of [NH3OH]NO3 and equilibria of (NH4)2CO3 determined with a
flow cell and FT Raman spectroscopy," The Journal of Physical Chemistry, vol. 100, pp.
7463-7470, 1996.
[59] J. Schoppelrei and T. Brill, "Spectroscopy of hydrothermal reactions 7. Kinetics of aqueous
[NH3OH]NO3 at 463-523 K and 27.5 MPa by infrared spectroscopy," The Journal of
Physical Chemistry A, vol. 101, pp. 8593-8596, 1997.
[60] C. Wei, W. Rogers and M. Mannan, "Thermal decomposition hazard evaluation of
hydroxylamine nitrate," Journal of Hazardous Materials, vol. 130, pp. 163-168, 2006.
[61] C. Wei, W. Rogers and M. Mannan, "Detection of autocatalytic decomposition behavior of
energetic material using APTAC," Journal of Thermal Analysis and Calorimetry, vol. 83,
pp. 125-130, 2006.
[62] L. Liu, C. Wei, Y. Guo, W. Rogers and M. Mannan, "Hydroxylamine nitrate self-catalytic
kinetics study with adiabatic calorimetry," Journal of Hazardous Materials, vol. 162, pp.
1217-1222, 2009.
[63] A. Brand and G. Drake, "Energetic hyrazinium salts". United States of America Patent
6,218,577 B1, 17 April 2001.
[64] E. Wucherer, S. Christofferson and B. Reed, "Assessment of high pressure HAN-
monopropellants," in 36th AIAA/ASME/SAE/ASEE, Huntsville, 2000.
[65] F. Tanzella, I. Jayaweera, G. Smith, J. Law, G. Krishnan and A. Sanjurjo, "Decomposition
kinetics and modeling of S-HAN5, HEHN and AF-M315E," 2004.
115
[66] A. Alfano, J. Mills and G. Vaghjiani, "Resonant laser ignition study of HAN-HEHN
propellant mixture," Combustion Science and Technology, vol. 181, pp. 902-913, 2009.
[67] A. Chowdhury and S. Thynell, "Kinetics of decomposition of energetic ionic liquids,"
Propellants, Explosives, Pyrotechnics, vol. 35, pp. 572-581, 2010.
[68] J. Shamshina, M. Smiglak, D. Drab, T. Gannon Parker, H. Dykes, R. Di Salvo, A. Reich and
R. Rogers, "Catalytic ignition of ionic liquids for propellant applications," Chemical
Communications, vol. 46, pp. 8965-8967, 2010.
[69] B. Prince, B. Fritz and Y. Chiu, "Ionic liquids in electrospray propulsion systems," in Ionic
Liquids: Science and Applications, American Chemical Society, 2012, pp. 27-49.
[70] A. Patrick, K. Vogelhuber, B. Prince and C. Annesley, "Theoretical and experimental
insights into the dissociation of 2-hydroxyethylhydrazinium nitrate clusters formed via
electrospray," The Journal of Physical Chemistry A, vol. 122, pp. 1960-1966, 2018.
[71] U. Swami, K. Senapathi, K. Srinivasulu, J. Desingu and A. Chowdhury, "Ignition delays of
mixtures of the non-hypergolic energetic ioninc liquid hydroxyethylhydrazinium nitrate
blended with unsymmetrical dimethylhydrazine," Propellants, Explosives, Pyrotechnics,
vol. 44, pp. 1139-1146, 2019.
[72] U. Swami, K. Senapathi, K. Srinivasulu, J. Desingu and A. Chowdhury, "Energetic ionic
liquid hydroxyethylhydrazinium nitrate as an alternative monopropellant," Combustion and
Flame, vol. 215, pp. 93-102, 2020.
[73] T. Ozawa, "A new method of analyzing thermogravimetric data," Bulletin of the Chemical
Society of Japan , vol. 38, no. 11, pp. 1881-1886, 1965.
116
[74] J. W. L. Flynn, "A quick, direct method for the determination of activation energy from
thermogravimetric data," Journal of Polymer Science Part B: Polymer Letters banner, vol.
4, pp. 323-328, 1966.
[75] ASTM E1641-18, Test method for decomposition kinetics by thermogravimetry using the
Ozawa/Flynn/Wall method, West Conshohocken, PA: ASTM International, 2018.
[76] I. Arkhangel'skii, A. Dunaev, I. Makarenko, N. Tikhonov, S. Belyaev and A. Tarasov, Non-
isothermal kinematic methods, Berlin: Max Planck Research Library for the History and
Development of Knowledge, Textbooks 1, Edition Open Access, 2013.
[77] ASTM E698-16: Standard test method for kinetic parameters for thermally unstable
materials using differential scanning calorimetry and the Flynn/Wall/Ozawa method, West
Conshohocken, PA: ASTM International, 2018.
[78] H. Kissinger, "Variation of peak temperature with heating rate in differential thermal
analysis," Journal of Research of the National Bureau of Standards, vol. 57, pp. 217-221,
1956.
[79] H. Kissinger, "Reaction kinetics in differential thermal analysis," Analytical Chemistry, vol.
29, pp. 1702-1706, 1957.
[80] ASTM E2890-12, Standard test method for kinetic parameters for thermally unstable
materials by differential scanning calorimetry using the Kissinger method, West
Conshohocken, PA: ASTM International, 2018.
[81] P. Linstrom and W. (. Mallard, NIST Chemistry WebBook, NIST Standard Reference
Database Number 69, Maryland: National Institute of Standards and Technology, 2018.

117
[82] M. Bohn, "Problems and faulty uses with the Prout-Tompkins description of autocatalytic
reactions and the solutions," Journal of Thermal Analysis and Calorimetry, vol. 116, pp.
1061-1072, 2014.
[83] J. Howard, G. Gever, A. Neill and P. Wei, "The thermal decomposition of 2-
hydrazinoethanol and 1-hydrazino-2-propanol," The Journal of Organic Chemistry, vol. 26,
no. 4, pp. 1082-1083, 1961.
[84] S. Chambreau, D. Popolan-Vaida, O. Kostko, J. Lee, Z. Zhou, T. Brown, P. Jones, J. Zhang,
G. Vaghjiani and S. L. S. Zare, The Journal of Chemical Physics, to be submitted.

118
Appendix
Figure A 1. Initial conditions: TGA-OWF. Kinetic model: Bna→C1-X. Experimental (points)
and predicted (lines) TG curves.
50 150 250 350
Temperature, °C
20
40
60
80
100
Mass, %
A B C1 2
9.7 K/min 9.7 K/min 9.7 K/min 9.7 K/min 4.9 K/min 4.9 K/min 4.9 K/min 4.9 K/min 2.4 K/min 2.4 K/min 2.4 K/min 2.4 K/min 0.98 K/min 0.98 K/min 0.98 K/min 0.98 K/min
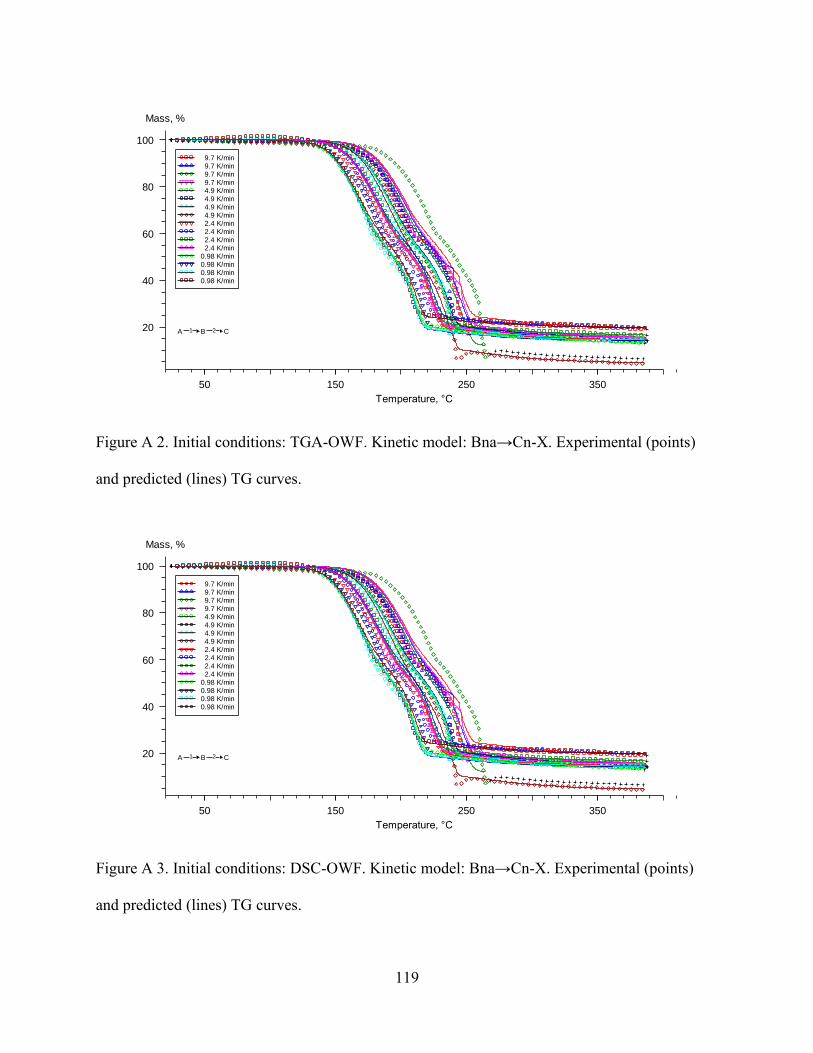
119
Figure A 2. Initial conditions: TGA-OWF. Kinetic model: Bna→Cn-X. Experimental (points)
and predicted (lines) TG curves.
Figure A 3. Initial conditions: DSC-OWF. Kinetic model: Bna→Cn-X. Experimental (points)
and predicted (lines) TG curves.
50 150 250 350
Temperature, °C
20
40
60
80
100
Mass, %
A B C1 2
9.7 K/min 9.7 K/min 9.7 K/min 9.7 K/min 4.9 K/min 4.9 K/min 4.9 K/min 4.9 K/min 2.4 K/min 2.4 K/min 2.4 K/min 2.4 K/min 0.98 K/min 0.98 K/min 0.98 K/min 0.98 K/min
50 150 250 350
Temperature, °C
20
40
60
80
100
Mass, %
A B C1 2
9.7 K/min 9.7 K/min 9.7 K/min 9.7 K/min 4.9 K/min 4.9 K/min 4.9 K/min 4.9 K/min 2.4 K/min 2.4 K/min 2.4 K/min 2.4 K/min 0.98 K/min 0.98 K/min 0.98 K/min 0.98 K/min

120
Figure A 4. Initial conditions: DSC-OWF. Kinetic model: Cn-X→Fn. Experimental (points) and
predicted (lines) TG curves.
Figure A 5. Initial conditions: K-OWF. Kinetic model: Bna→Fn. Experimental (points) and
predicted (lines) TG curves.
50 150 250 350
Temperature, °C
20
40
60
80
100
Mass, %
A B C1 2
9.7 K/min 9.7 K/min 9.7 K/min 9.7 K/min 4.9 K/min 4.9 K/min 4.9 K/min 4.9 K/min 2.4 K/min 2.4 K/min 2.4 K/min 2.4 K/min 0.98 K/min 0.98 K/min 0.98 K/min 0.98 K/min
50 150 250 350
Temperature, °C
20
40
60
80
100
Mass, %
A B C1 2
9.7 K/min 9.7 K/min 9.7 K/min 9.7 K/min 4.9 K/min 4.9 K/min 4.9 K/min 4.9 K/min 2.4 K/min 2.4 K/min 2.4 K/min 2.4 K/min 0.98 K/min 0.98 K/min 0.98 K/min 0.98 K/min

121
Figure A 6. Temperature profiles of gases (m/z = 12, 14, 15, 26, 27, and 29) evolved during TGA
of HEHN at a heating rate of 10 °C/min.
Figure A 7. Temperature profiles of gases (m/z = 41–43, and 46) evolved during TGA of HEHN
at a heating rate of 10 °C/min.
0.0
0.1
0.2
0.3
0.4
0.5
30 50 70 90 110 130 150 170 190 210 230 250 270 290
Ion
Curr
en
t, n
A
Temperature,°C
m/z = 12
m/z = 14
m/z = 15
m/z = 26
m/z = 27
m/z = 29
0.0
0.1
0.2
30 50 70 90 110 130 150 170 190 210 230 250 270 290
Ion
cu
rre
nt,
nA
Temperature, °C
m/z = 41
m/z = 42
m/z = 43
m/z = 46

122
Figure A 8. Temperature profiles of gases (m/z = 50–59) during TGA of HEHN at a heating rate
of 10 °C/min.
Figure A 9. Temperature profiles of gases (m/z = 61, 66, 68, and 69) during TGA of HEHN at a
heating rate of 10 °C/min.
0
1
2
3
4
5
6
30 50 70 90 110 130 150 170 190 210 230 250 270 290
Ion
Cu
rre
nt,
pA
Temperature, °C
m/z = 50
m/z = 51
m/z = 52
m/z = 53
m/z = 54
m/z = 55
m/z = 56
m/z = 57
m/z = 58
m/z = 59
0
1
2
3
4
5
6
7
8
9
10
30 50 70 90 110 130 150 170 190 210 230 250 270 290
Ion
Curr
en
t, p
A
Temperature, °C
m/z = 61
m/z = 66
m/z = 68
m/z = 69

123
Figure A 10. Temperature profiles of gases (m/z = 70–72, 76, and 79) during TGA of HEHN at a
heating rate of 10 °C/min.
0
1
2
3
4
5
6
7
8
9
10
30 50 70 90 110 130 150 170 190 210 230 250 270 290
Ion
Curr
en
t, p
A
Temperature, °C
m/z = 70
m/z = 71
m/z = 72
m/z = 76
m/z = 79
124
Vita
Alan A. Esparza Hernandez earned his B.S. and M.S. in Mechanical Engineering from The
University of Texas at El Paso in 2014 and 2016, respectively. He joined Dr. Shafirovich’s group
in the summer of 2014 for his master’s studies on combustion synthesis of high-temperature
materials. He coauthored a full-length article “Mechanically activated combustion synthesis of
molybdenum borosilicides for ultrahigh-temperature structural applications,” published in Journal
of Alloys and Compounds. He presented his results at the 9th U.S. National Combustion Meeting.
In the fall of 2016, he began his PhD’s studies on the decomposition of energetic ionic
liquids under Dr. Shafirovich’s supervision. He has coauthored two full-length articles submitted
to Combustion and Flame. One of them, titled “Thermoanalytical studies on the thermal and
catalytic decomposition of aqueous hydroxylammonium nitrate solution,” has been published, and
the other one, titled “Two-stage decomposition of 2−hydroxyethylhydrazinium nitrate (HEHN),”
is currently under review. He coauthored the article “Combustion of aqueous HAN/methanol
propellants at high pressures,” and is currently under review for publication in Proceedings of the
Combustion Institute. He also coauthored the article “Thermal decomposition and hypergolic
reaction of a dicyanoborohydride ionic liquid,” published in The Journal of Physical Chemistry A.
He presented his results at the AIAA Propulsion and Energy Forums in 2017 and 2019, and at the
JANNAF 49th Combustion Subcommittee Meeting in 2019.
In the summer of 2016, he went on a 10-week study abroad program in Kitakyushu, Japan,
where he worked in Dr. Koichi Yonemoto’s research group. He participated in the 2017 Princeton
– Combustion Institute Summer School on Combustion. He interned at the National Energy
Laboratory as a CIESESE fellow in 2018.
This dissertation was typed by Alan A. Esparza Hernandez.