Embed Size (px)
Citation preview
www.elsevier.com/locate/epsl
Earth and Planetary Science L
Thermo-mechanical model of the Dead Sea Transform
S.V. Sobolev a,b,*, A. Petrunin a,b, Z. Garfunkel c, A.Y. Babeyko a
DESERT Group
a GeoForschungsZentrum, Telegrafenberg, 14473 Potsdam, Germanyb Institute of Physics of the Earth, B. Gruzinskaya 10, 123810 Moscow, Russia
c Institute of Earth Sciences, Hebrew University, Givat Ram Jerusalem, 91904, Israel
Received 24 November 2004; received in revised form 10 June 2005; accepted 28 June 2005
Available online 19 August 2005
Editor: S. King
Abstract
We employ finite-element thermo-mechanical modelling to study the dynamics of a continental transform boundary between
the Arabian and African plates marked by the Dead Sea Transform (DST), that accommodated ca 105 km of relative transform
displacement during the last 20 Myr. We show that in the initially cold lithosphere expected at the DST, shear deformation
localizes in a 20–40 km wide zone where temperature-controlled mantle strength is minimal. The resulting mechanically weak
decoupling zone extends sub-vertically through the entire lithosphere. One or two major faults at the top of this zone take up
most of the transform displacement. These and other modelling results are consistent with geological observations and
lithospheric structures imaged along the DESERT seismic line, suggesting that the Arava Valley segment of the DST is an
almost pure strike-slip plate boundary with less than 3 km of transform-perpendicular extension. Modelling suggests that the
location of the Arava Valley segment of the DST has been controlled by the minimum in lithospheric strength possibly
associated with margin of the Arabian Shield lithosphere and/or by regionally increased crustal thickness. Models also show
that heating of the Arabian Shield mantle adjacent to the DST, inferred independently by petrological and seismological studies,
is required to explain asymmetric Late Cenozoic uplift in the area.
D 2005 Elsevier B.V. All rights reserved.
Keywords: thermo-mechanical model; lithospheric geodynamics; transform fault; Dead Sea transform
0012-821X/$ - see front matter D 2005 Elsevier B.V. All rights reserved.
doi:10.1016/j.epsl.2005.06.058
* Corresponding author. GeoForschungsZentrum, Telegrafenberg,
14473 Potsdam, Germany. Tel.: +49 331 2881248; fax: +49 331
2881266.
E-mail address: [email protected] (S.V. Sobolev).
1. Introduction
The transform plate boundaries are one of the three
major types of such boundaries recognized in the clas-
sical plate tectonics concept [1,2]. Therefore under-
standing of their dynamics is a key issue in plate
tectonics. Of particular interest is the dynamics of
etters 238 (2005) 78–95
S.V. Sobolev et al. / Earth and Planetary Science Letters 238 (2005) 78–95 79
transform boundaries crossing continental lithosphere,
as their activity generates powerful earthquakes
strongly influencing human activities. Despite numer-
ous studies and remarkable achievements, the compli-
cated deformation processes along continental
transform boundaries are still incompletely understood.
Key questions to be addressed are, how is the large
shear strain along a transform plate boundary distrib-
uted within the heterogeneous and rheologically strati-
fied continental lithosphere, and what are the factors
controlling strain localization and partitioning? We
address these questions using finite element thermo-
mechanical modelling of lithospheric deformation con-
strained by geological data and high-resolution geo-
African plate
Dead Sea Transform
DESERT lin
Mediterra
nean
Red
Sea
32o
31o
30o
29o
28o
34o 35o
34o 35o
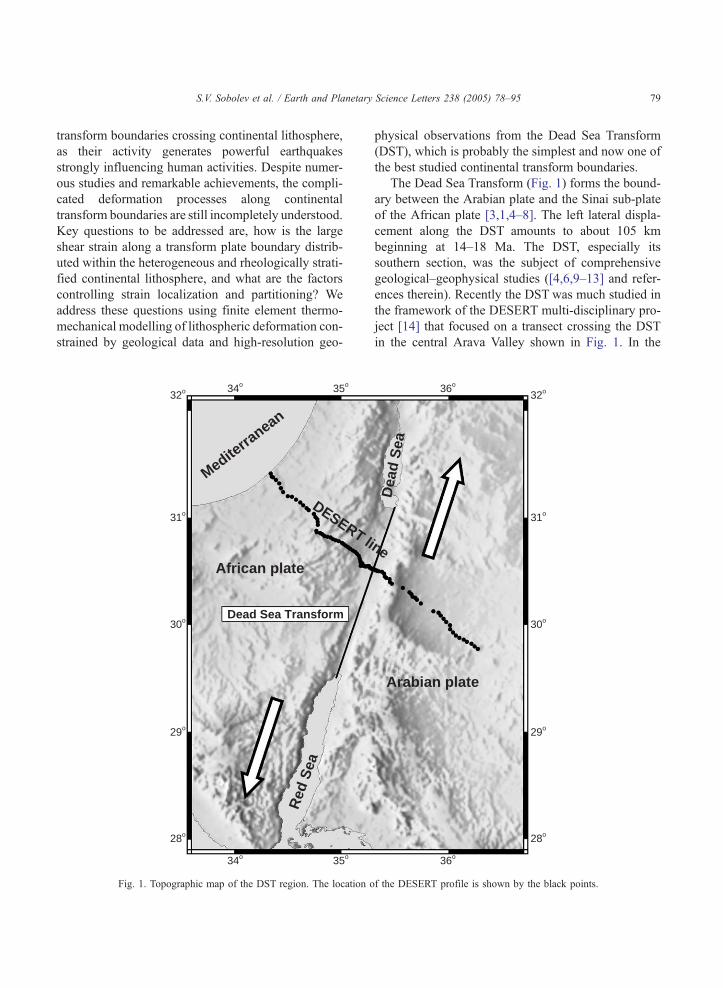
Fig. 1. Topographic map of the DST region. The location o
physical observations from the Dead Sea Transform
(DST), which is probably the simplest and now one of
the best studied continental transform boundaries.
The Dead Sea Transform (Fig. 1) forms the bound-
ary between the Arabian plate and the Sinai sub-plate
of the African plate [3,1,4–8]. The left lateral displa-
cement along the DST amounts to about 105 km
beginning at 14–18 Ma. The DST, especially its
southern section, was the subject of comprehensive
geological–geophysical studies ([4,6,9–13] and refer-
ences therein). Recently the DST was much studied in
the framework of the DESERT multi-disciplinary pro-
ject [14] that focused on a transect crossing the DST
in the central Arava Valley shown in Fig. 1. In the
Arabian plate
e
Dea
d S
ea32o
31o
30o
29o
28o
36o
36o
f the DESERT profile is shown by the black points.
S.V. Sobolev et al. / Earth and Planetary Science Letters 238 (2005) 78–9580
modelling study presented here we also focus on the
central Arava Valley segment of the DST, located
away from the large pull-apart basins and therefore
probably the simplest part of the entire DST.
In addition to the key questions related to the trans-
form boundary in general, mentioned above, we will
also consider some important questions specific to the
DST. Among these are the questions: (i) What is the
origin of the narrow brift-likeQ valley coinciding with
the DST and what is the relative importance of the
transform perpendicular extension (rifting component)
at the DST? (ii) What is the origin of the Cenozoic
uplift resulting in an asymmetric surface topography at
the DST? To answer these questions we will consider
two groups of models. First we consider simplified
models aimed to investigate effects of different types
of lithospheric heterogeneity on localization and parti-
tioning of the strike-slip deformation (first group of
models). Then we analyse the evolution of the DST
itself considering heterogeneous lithospheric structure
around the DST (second group of models).
2. Strain partitioning in the model of simplified
continental transform plate boundary
Let us consider first a typical lithologically (and
rheologically) stratified continental lithosphere, which
consists of a two-layer crust and mantle lithosphere.
The anti-symmetric off-plane velocities of F0.3 cm/
yr (similar to the DST) are applied to the sides of the
lithosphere thus subjecting it to left-lateral strike-slip
deformation (Fig. 2, top). With this model setup we
will study the effect of heterogeneities of crustal
thickness and lithospheric temperature on the process
of localization of the strike-slip deformation within
rheologically stratified lithosphere.
The upper section of Fig. 2 shows three models. In
the first model (left) the lower crust is thicker in the
model left, while the temperature at the model bottom
is kept constant. In the second model (middle) the
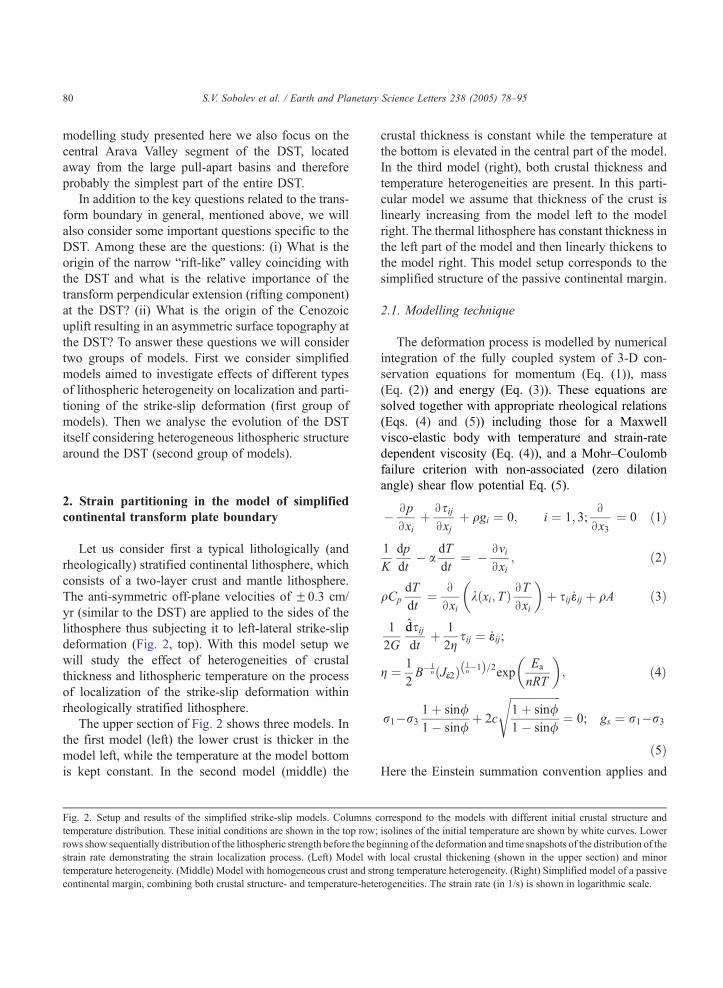
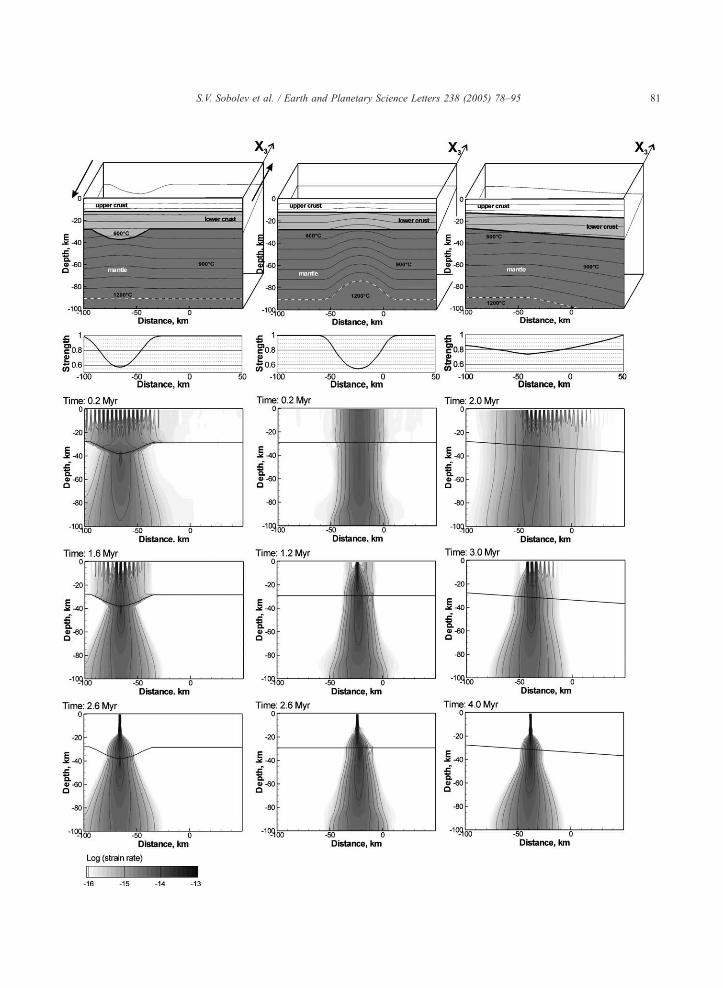
Fig. 2. Setup and results of the simplified strike-slip models. Columns c
temperature distribution. These initial conditions are shown in the top row;
rows show sequentially distribution of the lithospheric strength before the beg
strain rate demonstrating the strain localization process. (Left) Model wi
temperature heterogeneity. (Middle) Model with homogeneous crust and str
continental margin, combining both crustal structure- and temperature-hete
crustal thickness is constant while the temperature at
the bottom is elevated in the central part of the model.
In the third model (right), both crustal thickness and
temperature heterogeneities are present. In this parti-
cular model we assume that thickness of the crust is
linearly increasing from the model left to the model
right. The thermal lithosphere has constant thickness in
the left part of the model and then linearly thickens to
the model right. This model setup corresponds to the
simplified structure of the passive continental margin.
2.1. Modelling technique
The deformation process is modelled by numerical
integration of the fully coupled system of 3-D con-
servation equations for momentum (Eq. (1)), mass
(Eq. (2)) and energy (Eq. (3)). These equations are
solved together with appropriate rheological relations
(Eqs. (4) and (5)) including those for a Maxwell
visco-elastic body with temperature and strain-rate
dependent viscosity (Eq. (4)), and a Mohr–Coulomb
failure criterion with non-associated (zero dilation
angle) shear flow potential Eq. (5).
� Bp
Bxiþ Bsij
Bxjþ qgi ¼ 0; i ¼ 1; 3;
B
Bx3¼ 0 ð1Þ
1
K
dp
dt� a
dT
dt¼ � Bvi
Bxi; ð2Þ
qCp
dT
dt¼ B
Bxik xi; Tð Þ BT
Bxi
� �þ sijeeij þ qA ð3Þ
1
2G
ddsijdt
þ 1
2gsij ¼ eeij;
g ¼ 1
2B�1
n Jee2ð Þ1n�1ð Þ=2exp Ea
nRT
� �; ð4Þ
r1�r3
1þ sin/1� sin/
þ 2c
ffiffiffiffiffiffiffiffiffiffiffiffiffiffiffiffiffiffi1þ sin/1� sin/
s¼ 0; gs ¼ r1�r3
ð5ÞHere the Einstein summation convention applies and
orrespond to the models with different initial crustal structure and
isolines of the initial temperature are shown by white curves. Lower
inning of the deformation and time snapshots of the distribution of the
th local crustal thickening (shown in the upper section) and minor
ong temperature heterogeneity. (Right) Simplified model of a passive
rogeneities. The strain rate (in 1/s) is shown in logarithmic scale.
S.V. Sobolev et al. / Earth and Planetary Science Letters 238 (2005) 78–95 81
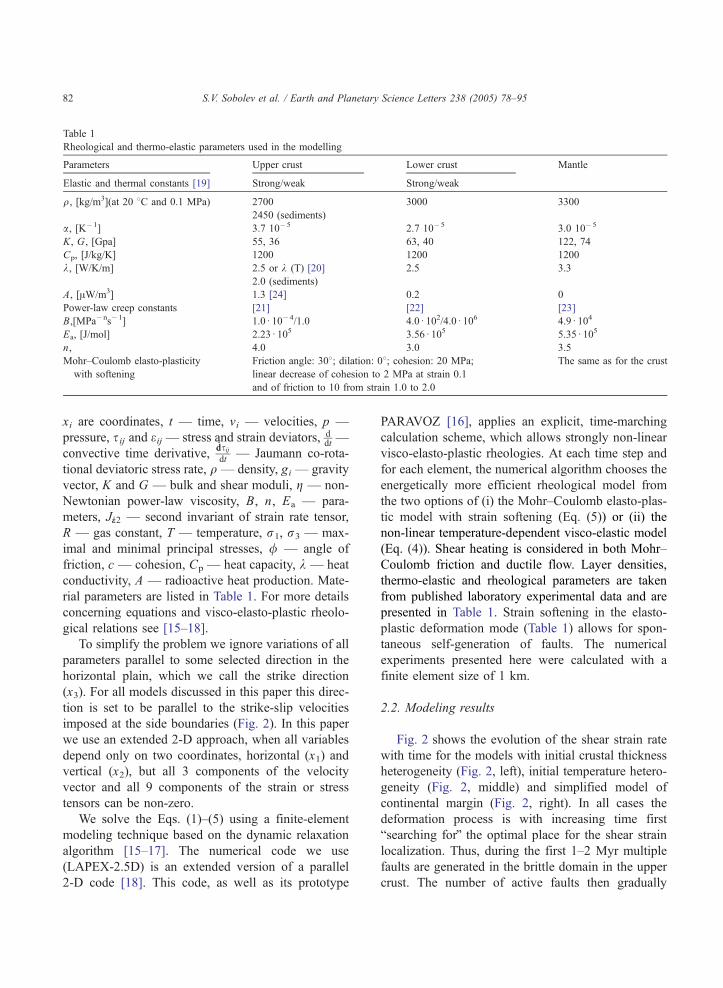
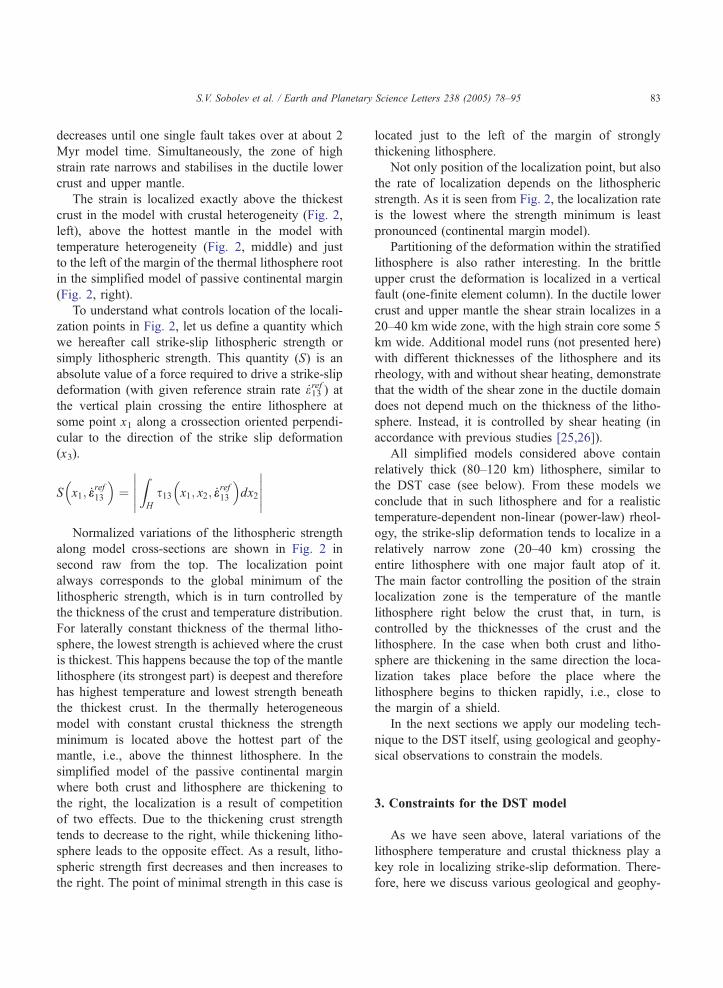
Table 1
Rheological and thermo-elastic parameters used in the modelling
Parameters Upper crust Lower crust Mantle
Elastic and thermal constants [19] Strong/weak Strong/weak
q, [kg/m3](at 20 8C and 0.1 MPa) 2700 3000 3300
2450 (sediments)
a, [K�1] 3.7 10�5 2.7 10�5 3.0 10�5
K, G, [Gpa] 55, 36 63, 40 122, 74
Cp, [J/kg/K] 1200 1200 1200
k, [W/K/m] 2.5 or k (T) [20] 2.5 3.3
2.0 (sediments)
A, [AW/m3] 1.3 [24] 0.2 0
Power-law creep constants [21] [22] [23]
B,[MPa�ns�1] 1.0d 10�4/1.0 4.0d 102/4.0d 106 4.9d 104
Ea, [J/mol] 2.23d 105 3.56d 105 5.35d 105
n, 4.0 3.0 3.5
Mohr–Coulomb elasto-plasticity
with softening
Friction angle: 308; dilation: 08; cohesion: 20 MPa;
linear decrease of cohesion to 2 MPa at strain 0.1
and of friction to 10 from strain 1.0 to 2.0
The same as for the crust
S.V. Sobolev et al. / Earth and Planetary Science Letters 238 (2005) 78–9582
xi are coordinates, t — time, vi — velocities, p —
pressure, sij and eij — stress and strain deviators, ddt—
convective time derivative,ddsijdt
— Jaumann co-rota-
tional deviatoric stress rate, q — density, gi — gravity
vector, K and G — bulk and shear moduli, g — non-
Newtonian power-law viscosity, B, n, Ea — para-
meters, Jee2 — second invariant of strain rate tensor,
R — gas constant, T — temperature, r1, r3 — max-
imal and minimal principal stresses, / — angle of
friction, c — cohesion, Cp — heat capacity, k — heat
conductivity, A — radioactive heat production. Mate-
rial parameters are listed in Table 1. For more details
concerning equations and visco-elasto-plastic rheolo-
gical relations see [15–18].
To simplify the problem we ignore variations of all
parameters parallel to some selected direction in the
horizontal plain, which we call the strike direction
(x3). For all models discussed in this paper this direc-
tion is set to be parallel to the strike-slip velocities
imposed at the side boundaries (Fig. 2). In this paper
we use an extended 2-D approach, when all variables
depend only on two coordinates, horizontal (x1) and
vertical (x2), but all 3 components of the velocity
vector and all 9 components of the strain or stress
tensors can be non-zero.
We solve the Eqs. (1)–(5) using a finite-element
modeling technique based on the dynamic relaxation
algorithm [15–17]. The numerical code we use
(LAPEX-2.5D) is an extended version of a parallel
2-D code [18]. This code, as well as its prototype
PARAVOZ [16], applies an explicit, time-marching
calculation scheme, which allows strongly non-linear
visco-elasto-plastic rheologies. At each time step and
for each element, the numerical algorithm chooses the
energetically more efficient rheological model from
the two options of (i) the Mohr–Coulomb elasto-plas-
tic model with strain softening (Eq. (5)) or (ii) the
non-linear temperature-dependent visco-elastic model
(Eq. (4)). Shear heating is considered in both Mohr–
Coulomb friction and ductile flow. Layer densities,
thermo-elastic and rheological parameters are taken
from published laboratory experimental data and are
presented in Table 1. Strain softening in the elasto-
plastic deformation mode (Table 1) allows for spon-
taneous self-generation of faults. The numerical
experiments presented here were calculated with a
finite element size of 1 km.
2.2. Modeling results
Fig. 2 shows the evolution of the shear strain rate
with time for the models with initial crustal thickness
heterogeneity (Fig. 2, left), initial temperature hetero-
geneity (Fig. 2, middle) and simplified model of
continental margin (Fig. 2, right). In all cases the
deformation process is with increasing time first
bsearching forQ the optimal place for the shear strain
localization. Thus, during the first 1–2 Myr multiple
faults are generated in the brittle domain in the upper
crust. The number of active faults then gradually
S.V. Sobolev et al. / Earth and Planetary Science Letters 238 (2005) 78–95 83
decreases until one single fault takes over at about 2
Myr model time. Simultaneously, the zone of high
strain rate narrows and stabilises in the ductile lower
crust and upper mantle.
The strain is localized exactly above the thickest
crust in the model with crustal heterogeneity (Fig. 2,
left), above the hottest mantle in the model with
temperature heterogeneity (Fig. 2, middle) and just
to the left of the margin of the thermal lithosphere root
in the simplified model of passive continental margin
(Fig. 2, right).
To understand what controls location of the locali-
zation points in Fig. 2, let us define a quantity which
we hereafter call strike-slip lithospheric strength or
simply lithospheric strength. This quantity (S) is an
absolute value of a force required to drive a strike-slip
deformation (with given reference strain rate eref13 ) at
the vertical plain crossing the entire lithosphere at
some point x1 along a crossection oriented perpendi-
cular to the direction of the strike slip deformation
(x3).
S x1; eeref13
� �¼
�����ZH
s13 x1; x2; eeref13
� �dx2
�����Normalized variations of the lithospheric strength
along model cross-sections are shown in Fig. 2 in
second raw from the top. The localization point
always corresponds to the global minimum of the
lithospheric strength, which is in turn controlled by
the thickness of the crust and temperature distribution.
For laterally constant thickness of the thermal litho-
sphere, the lowest strength is achieved where the crust
is thickest. This happens because the top of the mantle
lithosphere (its strongest part) is deepest and therefore
has highest temperature and lowest strength beneath
the thickest crust. In the thermally heterogeneous
model with constant crustal thickness the strength
minimum is located above the hottest part of the
mantle, i.e., above the thinnest lithosphere. In the
simplified model of the passive continental margin
where both crust and lithosphere are thickening to
the right, the localization is a result of competition
of two effects. Due to the thickening crust strength
tends to decrease to the right, while thickening litho-
sphere leads to the opposite effect. As a result, litho-
spheric strength first decreases and then increases to
the right. The point of minimal strength in this case is
located just to the left of the margin of strongly
thickening lithosphere.
Not only position of the localization point, but also
the rate of localization depends on the lithospheric
strength. As it is seen from Fig. 2, the localization rate
is the lowest where the strength minimum is least
pronounced (continental margin model).
Partitioning of the deformation within the stratified
lithosphere is also rather interesting. In the brittle
upper crust the deformation is localized in a vertical
fault (one-finite element column). In the ductile lower
crust and upper mantle the shear strain localizes in a
20–40 km wide zone, with the high strain core some 5
km wide. Additional model runs (not presented here)
with different thicknesses of the lithosphere and its
rheology, with and without shear heating, demonstrate
that the width of the shear zone in the ductile domain
does not depend much on the thickness of the litho-
sphere. Instead, it is controlled by shear heating (in
accordance with previous studies [25,26]).
All simplified models considered above contain
relatively thick (80–120 km) lithosphere, similar to
the DST case (see below). From these models we
conclude that in such lithosphere and for a realistic
temperature-dependent non-linear (power-law) rheol-
ogy, the strike-slip deformation tends to localize in a
relatively narrow zone (20–40 km) crossing the
entire lithosphere with one major fault atop of it.
The main factor controlling the position of the strain
localization zone is the temperature of the mantle
lithosphere right below the crust that, in turn, is
controlled by the thicknesses of the crust and the
lithosphere. In the case when both crust and litho-
sphere are thickening in the same direction the loca-
lization takes place before the place where the
lithosphere begins to thicken rapidly, i.e., close to
the margin of a shield.
In the next sections we apply our modeling tech-
nique to the DST itself, using geological and geophy-
sical observations to constrain the models.
3. Constraints for the DST model
As we have seen above, lateral variations of the
lithosphere temperature and crustal thickness play a
key role in localizing strike-slip deformation. There-
fore, here we discuss various geological and geophy-
S.V. Sobolev et al. / Earth and Planetary Science Letters 238 (2005) 78–9584
sical data constraining lithospheric structure and ther-
mal state in the DST region.
3.1. Thermal state of the lithosphere
The DST formed as a result of the Mid-Cenozoic
break-up of the Arabian–Nubian platform that sepa-
rated the Arabian from the African plate. The frac-
tured area is underlain by a Late Proterozoic basement
[27–29]. During most of the Phanerozoic this region
was a part of a stable platform that experienced only a
few episodes of igneous activity and mild deforma-
tion. The last important pre-breakup igneous activity
was in the Early Cretaceous (140–120 Ma, [30]), so
there was enough time for the thermal effects of this
event to have largely decayed before the DST formed.
The surface heat flow of 50–55 mW/m2 [31,32] or 60
mW/m2 [24], similar to the Protoerozoic shields
worldwide, suggests a relatively cold crust and mantle
lithosphere and the absence of large long-lived ther-
mal perturbations.
However, during the Cenozoic continental
breakup, widespread igneous activity resumed, also
in the region crossed by the DST, especially on its
eastern side [30,33,34]. Though sporadic activity has
taken place since 20–18 Ma, the most voluminous
igneous rocks formed 8–5 Ma ago. Volcanism of
this age also occurred along the DESERT transect
[35]. Mineral compositions of mantle xenoliths from
these Neogene–Quaternary basalts near the DST indi-
cate high upper mantle temperatures [36,37] that
appear to be higher than expected for a steady-state
conductive geotherm corresponding to the observed
surface heat flow. High upper mantle temperatures
below the young volcanics adjacent to the DST and
the Red Sea are also indicated by low shear wave
velocities [38,39]. A recent receiver function study
[40] suggests a low S-velocity zone beneath the DST
and adjacent Arabian Shield with the top at 60–80 km
depth, which could be the lithosphere–asthenosphere
boundary.
These data imply that, when continental break-up
began, the lithosphere in the region around the DST
was still cold and thick. However, as continental
breakup progressed this initial state was modified
and the lithosphere was likely thinned and a warmer
geotherm established. This occurred quite recently
(likely later than 10 Ma) so that there was not enough
time to allow elevated heat flow to reach the surface
yet.
The above scenario is supported by the history of
uplifting which also suggests significant modification
of the underlying lithosphere. Considerable, but vari-
able, regional uplifting accompanied the continental
break-up. Before break-up at the end of the Eocene
(40–35 Ma), a shallow sea covered the area crossed by
the DST, which shows that it was flat and close to sea
level, whereas now the areas flanking the DST are 1–2
km above sea level. Uplifting developed gradually as
the transform motion progressed. Elevations reached
only a few hundred meters at 12–15 Ma, while about
half the present relief is younger than 5 Ma (e.g.,
[41,35]).
For the modelling an important question is what
was the topography of the lithosphere–asthenosphere
boundary in the region just before the initiation of the
DST at 15–20 Ma? There is good evidence [14] that
the crust is now (and likely was at 15–20 Ma) gradu-
ally thickening from the Mediterranean margin
towards the Arabian Shield. Little surface topography
at 15–20 Ma implies that the isostatic effect of the
Moho topography was largely compensated by the
thickening of the lithosphere to the east of the Med-
iterranean similar to the simplified model of the con-
tinental margin discussed above.
In view of these observations, the initial state
envisaged in our model is that of a relatively thick
and cold lithosphere whose temperature reflects a
steady-state conductive geotherm compatible with
the surface heat flow of 50–60 mW/m2 and crustal
heat generation according to Forster et al. (in prepara-
tion) [24]. In this model we also assume that the
lithosphere thickens to the east of the Mediterranean
margin largely compensating the isostatic effect of the
eastwards thickening crust (Fig. 3). Assuming of less
than some 0.3 km of isostatically compensated alti-
tude difference between left (SW) and right (NE) ends
of the model cross-section, we estimate eastward
thickening of the initial lithosphere to be about 50 km.
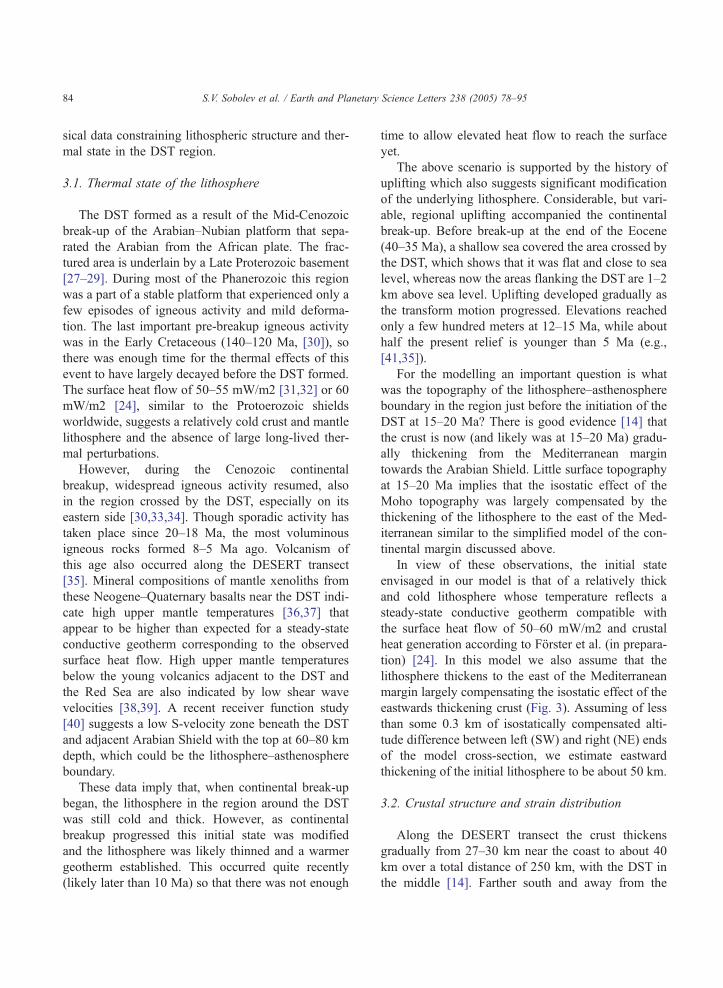
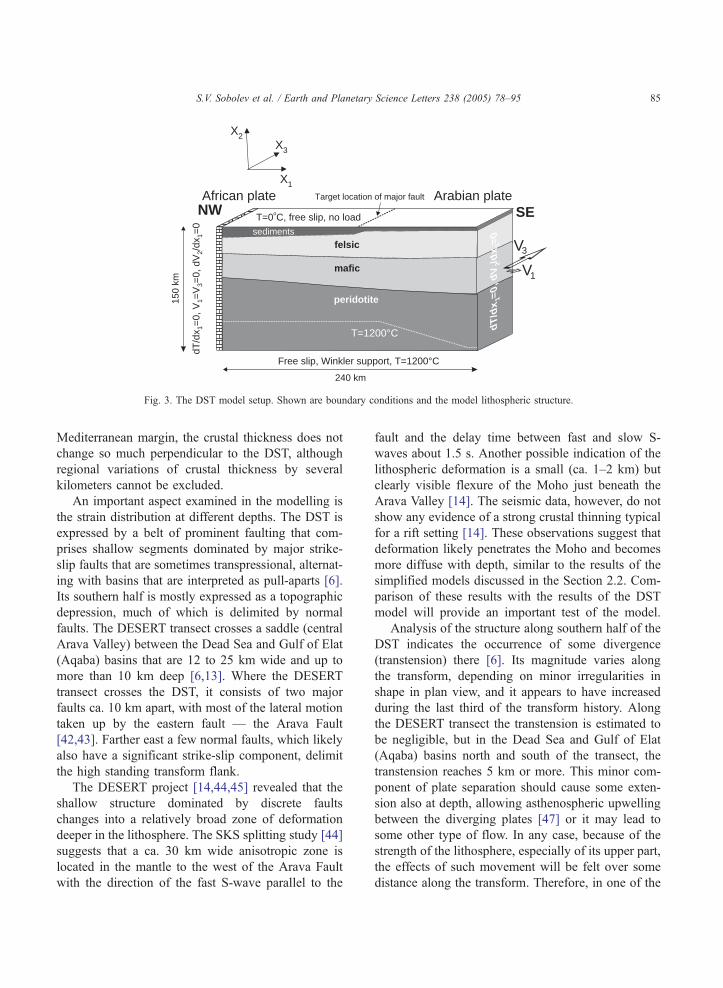
3.2. Crustal structure and strain distribution
Along the DESERT transect the crust thickens
gradually from 27–30 km near the coast to about 40
km over a total distance of 250 km, with the DST in
the middle [14]. Farther south and away from the
sediments
felsic V3
V1
X2
X1
Free slip, Winkler support, T=1200°C
T=0oC, free slip, no load
dT/d
x 1=
0, V
1=V
3=0,
dV
2/dx
1=0
dT
/dx
1=0,
dV
2/dx
1=0
mafic
peridotite150
km
240 km
NW SEAfrican plate Arabian plate
T=1200°C
X3
Target location of major fault
Fig. 3. The DST model setup. Shown are boundary conditions and the model lithospheric structure.
S.V. Sobolev et al. / Earth and Planetary Science Letters 238 (2005) 78–95 85
Mediterranean margin, the crustal thickness does not
change so much perpendicular to the DST, although
regional variations of crustal thickness by several
kilometers cannot be excluded.
An important aspect examined in the modelling is
the strain distribution at different depths. The DST is
expressed by a belt of prominent faulting that com-
prises shallow segments dominated by major strike-
slip faults that are sometimes transpressional, alternat-
ing with basins that are interpreted as pull-aparts [6].
Its southern half is mostly expressed as a topographic
depression, much of which is delimited by normal
faults. The DESERT transect crosses a saddle (central
Arava Valley) between the Dead Sea and Gulf of Elat
(Aqaba) basins that are 12 to 25 km wide and up to
more than 10 km deep [6,13]. Where the DESERT
transect crosses the DST, it consists of two major
faults ca. 10 km apart, with most of the lateral motion
taken up by the eastern fault — the Arava Fault
[42,43]. Farther east a few normal faults, which likely
also have a significant strike-slip component, delimit
the high standing transform flank.
The DESERT project [14,44,45] revealed that the
shallow structure dominated by discrete faults
changes into a relatively broad zone of deformation
deeper in the lithosphere. The SKS splitting study [44]
suggests that a ca. 30 km wide anisotropic zone is
located in the mantle to the west of the Arava Fault
with the direction of the fast S-wave parallel to the
fault and the delay time between fast and slow S-
waves about 1.5 s. Another possible indication of the
lithospheric deformation is a small (ca. 1–2 km) but
clearly visible flexure of the Moho just beneath the
Arava Valley [14]. The seismic data, however, do not
show any evidence of a strong crustal thinning typical
for a rift setting [14]. These observations suggest that
deformation likely penetrates the Moho and becomes
more diffuse with depth, similar to the results of the
simplified models discussed in the Section 2.2. Com-
parison of these results with the results of the DST
model will provide an important test of the model.
Analysis of the structure along southern half of the
DST indicates the occurrence of some divergence
(transtension) there [6]. Its magnitude varies along
the transform, depending on minor irregularities in
shape in plan view, and it appears to have increased
during the last third of the transform history. Along
the DESERT transect the transtension is estimated to
be negligible, but in the Dead Sea and Gulf of Elat
(Aqaba) basins north and south of the transect, the
transtension reaches 5 km or more. This minor com-
ponent of plate separation should cause some exten-
sion also at depth, allowing asthenospheric upwelling
between the diverging plates [47] or it may lead to
some other type of flow. In any case, because of the
strength of the lithosphere, especially of its upper part,
the effects of such movement will be felt over some
distance along the transform. Therefore, in one of the
S.V. Sobolev et al. / Earth and Planetary Science Letters 238 (2005) 78–9586
models we allow for some transform-perpendicular
extension to represent such effects.
4. Model of the DST
4.1. Model setup
Our model setup, representing the situation along
the DESERT transect, is shown in Fig. 3. The litho-
sphere is lithologically layered and thermally hetero-
geneous, including a three-layered crust thinning to
the west and a mantle lithosphere. Initial crustal struc-
ture is fixed from the seismic observations [14], ignor-
ing small Moho flexure. We do not correct the present
day structure for the 105 km transform motion,
because of small gradients of crustal structure parallel
to the DST. In this approximation and because model
properties do not vary parallel to the transform strike,
the model represents an average picture of a ca. 100
km long segment of the DST. We consider the evolu-
tion of such a domain subjected to left-lateral trans-
form motion with a velocity of 0.6 cm/year, leading to
a total offset of 105 km in 17.5 Myr, and to a slight
transform-perpendicular extension in one of the mod-
els. Layer densities and thermo-elastic parameters are
taken from published laboratory experimental data
and are consistent with a recent analysis for the area
[24] (Table 1). All calculations have been done using
the same rheological model for the mantle and two
different rheological models for the crust (Table 1).
One model is based on recent laboratory data for
naturally hydrous quartz [21] and plagioclase [22]
(hereafter called strong crust model) and another
model is its modification where the effective viscosity
at fixed strain rate is reduced by 10 times (hereafter
called weak crust model). The numerical modelling
technique is the same as described in Section 2.1.
The initial temperature distribution is assumed to
be conductive steady state within the thermal litho-
sphere (defined as domain with temperature below
1200 8C) and constant below it. The expected shape
of the 1200 8C (i.e., bottom of the thermal lithosphere)
isotherm in the initial model, simulating thickening of
the lithosphere towards the Arabian shield, is schema-
tically shown in Fig. 3. The depth to this isotherm is
calibrated in order to fulfil the following constraints:
(1) Initial surface heat flow must be in the range of
50–60 mW/m2 and (2) maximal initial altitude varia-
tion along profile must be less than 0.3 km. The
location of the margin of the thickening lithosphere
is constrained by the known position of the major
fault at the surface (see also simplified models, Sec-
tion 2.2). In a series of models we have also perturbed
the initial temperature structure replacing a large por-
tion of the lithosphere by the asthenosphere with
T=1200 8C.
4.2. Modelling results
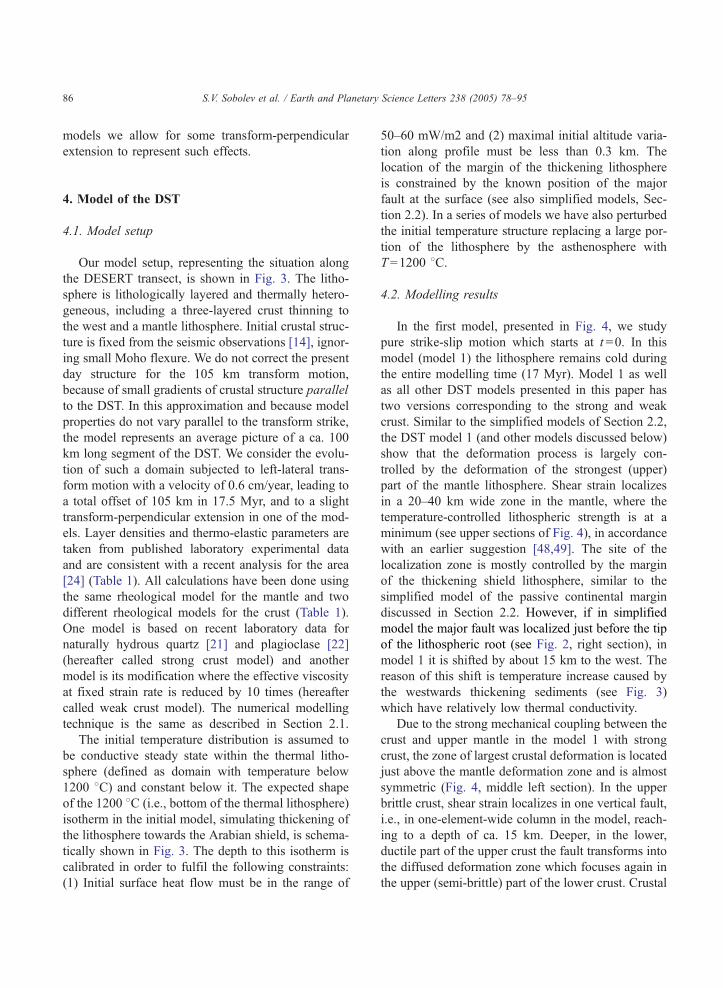
In the first model, presented in Fig. 4, we study
pure strike-slip motion which starts at t =0. In this
model (model 1) the lithosphere remains cold during
the entire modelling time (17 Myr). Model 1 as well
as all other DST models presented in this paper has
two versions corresponding to the strong and weak
crust. Similar to the simplified models of Section 2.2,
the DST model 1 (and other models discussed below)
show that the deformation process is largely con-
trolled by the deformation of the strongest (upper)
part of the mantle lithosphere. Shear strain localizes
in a 20–40 km wide zone in the mantle, where the
temperature-controlled lithospheric strength is at a
minimum (see upper sections of Fig. 4), in accordance
with an earlier suggestion [48,49]. The site of the
localization zone is mostly controlled by the margin
of the thickening shield lithosphere, similar to the
simplified model of the passive continental margin
discussed in Section 2.2. However, if in simplified
model the major fault was localized just before the tip
of the lithospheric root (see Fig. 2, right section), in
model 1 it is shifted by about 15 km to the west. The
reason of this shift is temperature increase caused by
the westwards thickening sediments (see Fig. 3)
which have relatively low thermal conductivity.
Due to the strong mechanical coupling between the
crust and upper mantle in the model 1 with strong
crust, the zone of largest crustal deformation is located
just above the mantle deformation zone and is almost
symmetric (Fig. 4, middle left section). In the upper
brittle crust, shear strain localizes in one vertical fault,
i.e., in one-element-wide column in the model, reach-
ing to a depth of ca. 15 km. Deeper, in the lower,
ductile part of the upper crust the fault transforms into
the diffused deformation zone which focuses again in
the upper (semi-brittle) part of the lower crust. Crustal
Master fault
Viscosity at t=17 Myr Viscosity at t=17 Myr
Lithospheric strength at t=0
Model 1 strong crust Model 1 weak crust
EastWest EastWest
Master fault
Str
eng
th (
1013
Pa*
m)
Str
eng
th (
1013
Pa*
m)
1
2
3
1
2
3
Lithospheric strength at t=0
Cumulative strain at t=17 Myr Cumulative strain at t=17 Myr
Fig. 4. Results of the pure strike-slip model with the cold and thick lithosphere (model 1), strong crust (left) and weak crust (right). The upper
sections show distance dependence of the lithospheric strength prior to the deformation (t =0). The middle sections show the distribution of the
cumulative finite strain (square root of the second invariant of the finite strain tensor) at t =17 Myr. Thin white lines indicate major lithospheric
boundaries. The bottom sections present the distribution of the viscosity at t =17 Myr.
S.V. Sobolev et al. / Earth and Planetary Science Letters 238 (2005) 78–95 87
deformation is significantly different in the model 1
with weak crust. In this case the lower crust is par-
tially decoupled from the upper mantle and the upper
crust from the lower crust (Fig. 4 upper right section).
As a result, deformation pattern becomes more com-
plicated and asymmetric and more faults are generated
in the upper crust. Quite interesting is calculated dis-
tribution of viscosity (Fig. 4 lower section). Due to the
dependency of the viscosity on strain rate and tem-
perature and due to the shear heating, the actively
deforming lithosphere becomes weak, i.e., behaves
mechanically like asthenosphere. This week zone
effectively decouples mutually moving plates. One
consequence of this is that thermal and mechanical
definitions of the lithosphere do not coincide within
this decoupling zone.
The shortcoming of model 1 is that it does not
explain neither magmatic activity in the region nor the
Late Cenozoic uplift, nor the seismic observations
suggesting present day thickness of the lithosphere
Model 2 strong crust
Master fault17 Myr
Master fault
Model 2 weak crust17 Myr
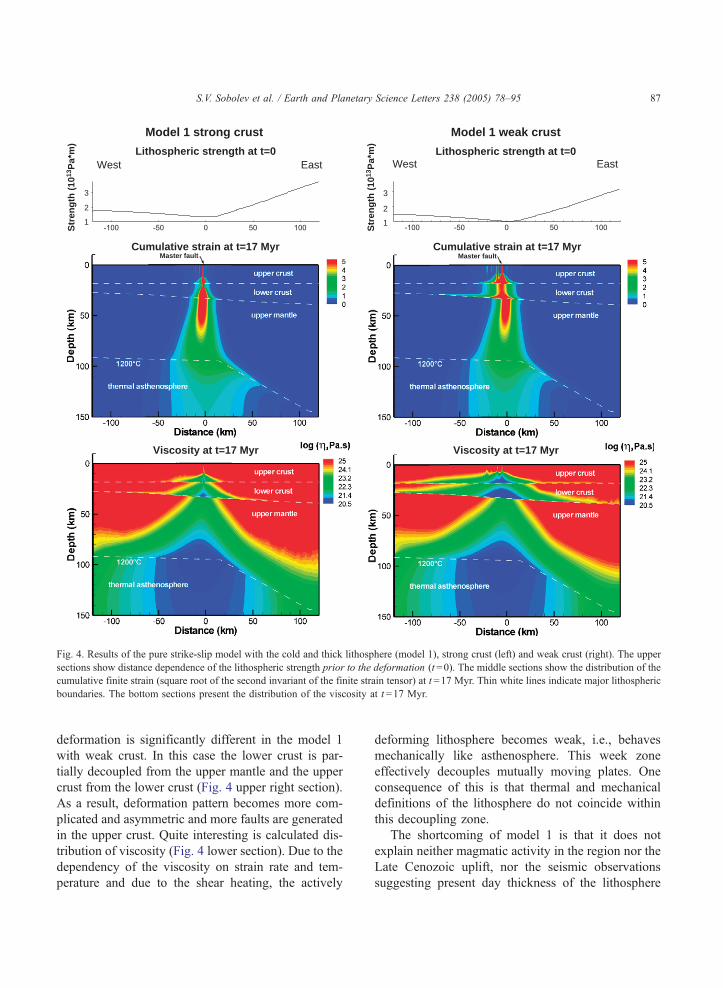
Fig. 5. Cumulative finite strain at t =17 Myr in the pure strike-slip model with the lithosphere thermally perturbed at t =12 Myr. Left — strong
crust model, right — weak crust model.
S.V. Sobolev et al. / Earth and Planetary Science Letters 238 (2005) 78–9588
to be about 70 km beneath the DST and its surround-
ings. Therefore we introduce here another model,
model 2. In this model (Fig. 5) the lithosphere is
thinned at t =12 Myr model time (ca. 5 Ma), i.e.,
the mantle lithosphere is replaced by the astheno-
sphere with a temperature of 1200 8C within the
domain below the white dashed curve in Fig. 5. The
depth of this curve below the DST proper and east of
it is taken according to the receiver function observa-
tions [40]. Shape of this boundary closer to the Med-
iterranean Sea is unknown, and we simply assume that
lithospheric thickness reduction gradually reduces
towards the Mediterranean Sea. The deformation pat-
tern after 105 km of strike slip displacement in model
2 (Fig. 5) is almost the same as in model 1 (Fig. 4,
Strong crust
major fault
Distance (km)
Alt
itu
de
(km
)
-100 0 100-1
-0.5
0
0.5
1
1.5
2
observation
model 2
model 1
model 3
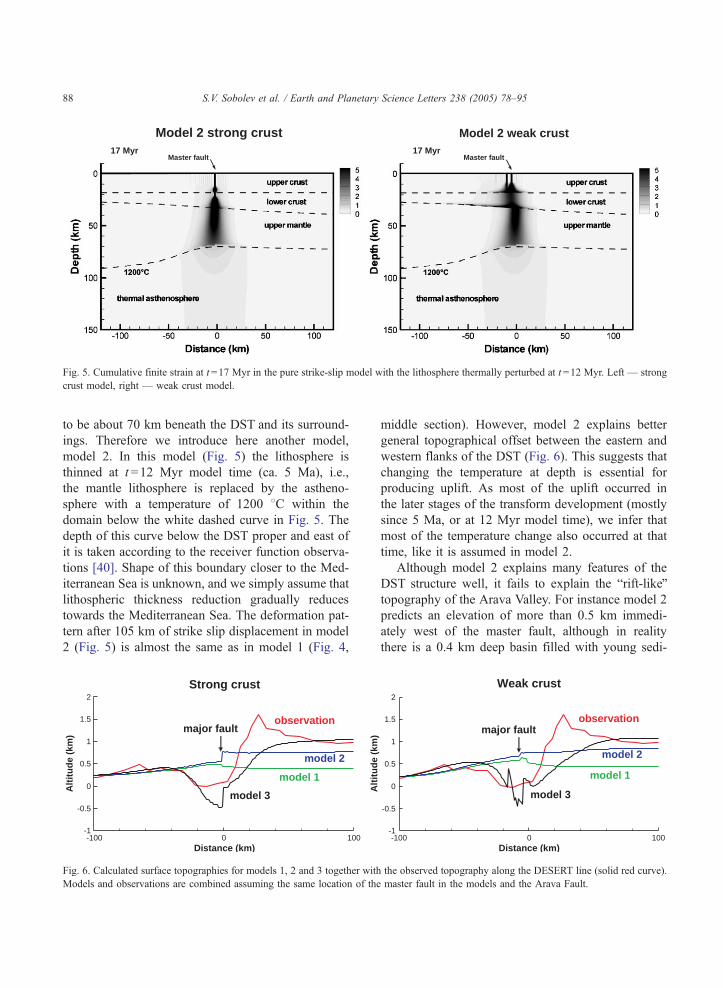
Fig. 6. Calculated surface topographies for models 1, 2 and 3 together with
Models and observations are combined assuming the same location of the
middle section). However, model 2 explains better
general topographical offset between the eastern and
western flanks of the DST (Fig. 6). This suggests that
changing the temperature at depth is essential for
producing uplift. As most of the uplift occurred in
the later stages of the transform development (mostly
since 5 Ma, or at 12 Myr model time), we infer that
most of the temperature change also occurred at that
time, like it is assumed in model 2.
Although model 2 explains many features of the
DST structure well, it fails to explain the brift-likeQtopography of the Arava Valley. For instance model 2
predicts an elevation of more than 0.5 km immedi-
ately west of the master fault, although in reality
there is a 0.4 km deep basin filled with young sedi-
Weak crust
Distance (km)-100 0 100
Alt
itu
de
(km
)
-1
-0.5
0
0.5
1
1.5
2
major faultobservation
model 1
model 2
model 3
the observed topography along the DESERT line (solid red curve).
master fault in the models and the Arava Fault.
S.V. Sobolev et al. / Earth and Planetary Science Letters 238 (2005) 78–95 89
ments immediately west of the Arava Fault (see Fig.
2 in [14]).
The Arava Valley topography is better fitted by
model 3 (black curves in Fig. 6) in which we add a
few kilometres of transform-perpendicular (east–
west) extension, with all other conditions being the
same as in model 2. Note, however, that as we
consider neither erosion and sedimentation nor the
3D effects, we may not expect very good fit of the
observed surface topography. We assume that exten-
sion starts at 12 Myr. model time and continues till
17 Myr. model time. Total extension is 2 km in the
strong- and 3 km in the weak-crust modifications of
model 3. As Fig. 6 shows, the addition of only 2–3
km of extension (less than 3% of the strike-slip
displacement) dramatically changes the topography
close to the major transform fault. If more than 2–3
km of extension is implemented, the model generates
deeper basin than observed (0.4–0.5 km) [14]. This
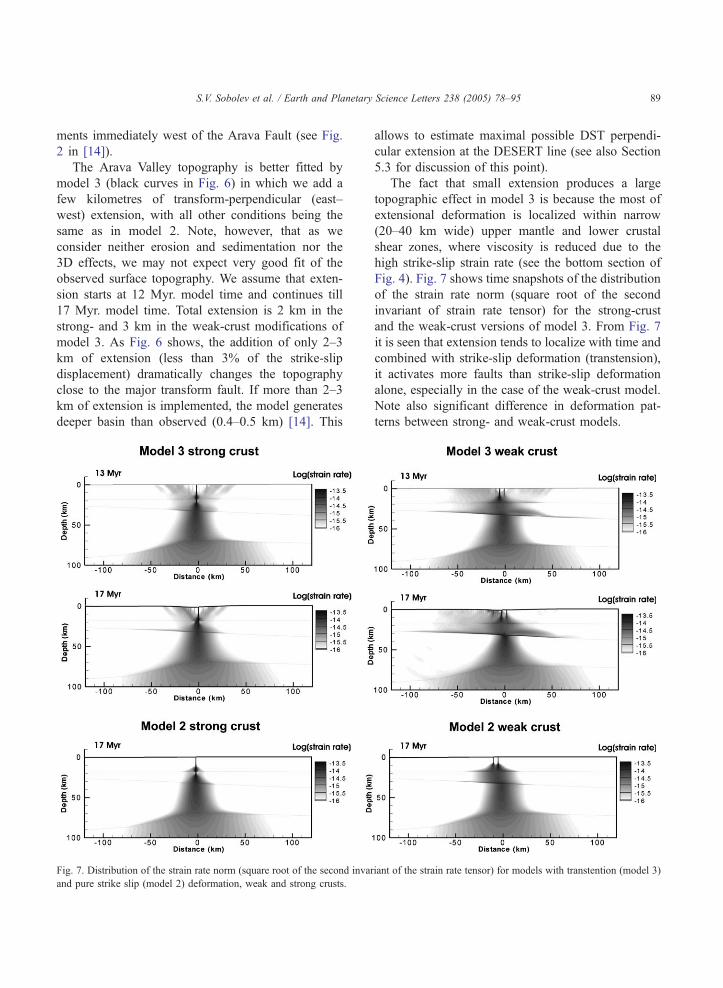
Fig. 7. Distribution of the strain rate norm (square root of the second invar
and pure strike slip (model 2) deformation, weak and strong crusts.
allows to estimate maximal possible DST perpendi-
cular extension at the DESERT line (see also Section
5.3 for discussion of this point).
The fact that small extension produces a large
topographic effect in model 3 is because the most of
extensional deformation is localized within narrow
(20–40 km wide) upper mantle and lower crustal
shear zones, where viscosity is reduced due to the
high strike-slip strain rate (see the bottom section of
Fig. 4). Fig. 7 shows time snapshots of the distribution
of the strain rate norm (square root of the second
invariant of strain rate tensor) for the strong-crust
and the weak-crust versions of model 3. From Fig. 7
it is seen that extension tends to localize with time and
combined with strike-slip deformation (transtension),
it activates more faults than strike-slip deformation
alone, especially in the case of the weak-crust model.
Note also significant difference in deformation pat-
terns between strong- and weak-crust models.
iant of the strain rate tensor) for models with transtention (model 3)
S.V. Sobolev et al. / Earth and Planetary Science Letters 238 (2005) 78–9590
5. Discussion
The successful geodynamic model must satisfy
robust geophysical observations revealing litho-
spheric structure, with the seismic and seismological
data from the DESERT project being an outstanding
example of such observations. Therefore we begin
with a discussion of the model results versus these
data. Then, we focus the discussion on the factors
controlling localization and depth distribution of the
deformation at the DST i.e., the key questions at
which the modelling was aimed. Finally we discuss
major fault
major fault
major fault
Ie I12
e11
Ie I12
(a)
(b)
(d
(e
(c) (f
Strong crust t=17 Myr
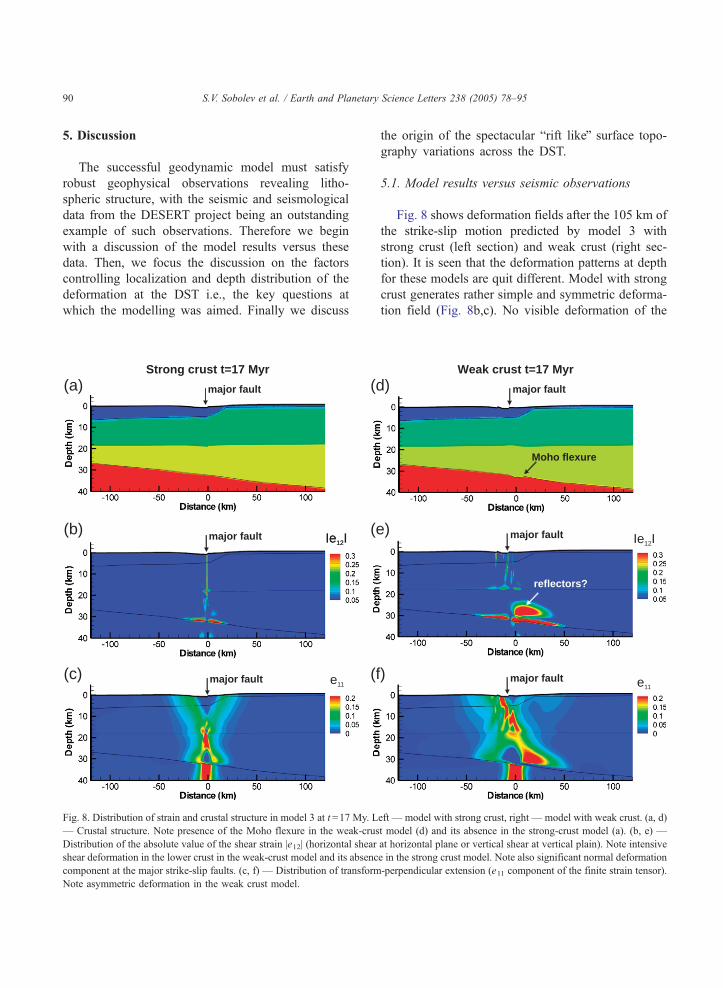
Fig. 8. Distribution of strain and crustal structure in model 3 at t =17 My. L
— Crustal structure. Note presence of the Moho flexure in the weak-crus
Distribution of the absolute value of the shear strain |e12| (horizontal shear
shear deformation in the lower crust in the weak-crust model and its absenc
component at the major strike-slip faults. (c, f) — Distribution of transform
Note asymmetric deformation in the weak crust model.
the origin of the spectacular brift likeQ surface topo-
graphy variations across the DST.
5.1. Model results versus seismic observations
Fig. 8 shows deformation fields after the 105 km of
the strike-slip motion predicted by model 3 with
strong crust (left section) and weak crust (right sec-
tion). It is seen that the deformation patterns at depth
for these models are quit different. Model with strong
crust generates rather simple and symmetric deforma-
tion field (Fig. 8b,c). No visible deformation of the
major fault
major fault
major fault
Moho flexure
reflectors?
Ie I12
e11
)
)
)
Weak crust t=17 Myr
eft — model with strong crust, right — model with weak crust. (a, d)
t model (d) and its absence in the strong-crust model (a). (b, e) —
at horizontal plane or vertical shear at vertical plain). Note intensive
e in the strong crust model. Note also significant normal deformation
-perpendicular extension (e11 component of the finite strain tensor).
S.V. Sobolev et al. / Earth and Planetary Science Letters 238 (2005) 78–95 91
Moho is associated with this model (Fig. 8a). In
contrary model with weak crust generates rather com-
plicated asymmetric deformation field with small (1
km) but visible flexure at Moho (Fig. 8d,e,f) consis-
tent with seismic observations [14]. The weak-crust
model 3 also predicts a zone of high horizontal shear
strain in the lower crust east of the major fault (Fig.
8e). This zone is related to lower crustal flow, which
accommodates deformation and it may partially
account for the high lower crustal reflectivity
observed east of the Arava Fault [14]. Apparently
the weak-crust model 3 fits seismic data better than
strong-crust model 3.
All our models predict a 20–40 km wide zone of
high finite strain in the upper mantle. In the olivine-
dominated rocks such a zone must be associated with
the anisotropy of seismic waves with the direction of
the fast S-wave sub-parallel to the strike-slip. We
estimate the delay time between slow and fast S-
waves to be 1.4 s for model 1 and 1.3 s for models
2 and 3. These numbers are obtained by calculation of
S-wave anisotropy in the mantle from the calculated
cumulative shear strain (Fig. 5) using the following
simplified piecewise-linear relation between the strain
and S-wave anisotropy, which is consistent with
experimental data [50] and modelling results [51]:
{shear strain; anisotropy}={0,0},{0.5, 5%},{1.0,
7%}, {2.0, 8.5%}, {infinity, 8.5%}. Both the orienta-
tions of the fast S axis and the magnitudes of the delay
times in the models agree well with the SKS splitting
observations [44].
Although transtention model (model 3) with weak
crust is generally consistent with most of seismic and
seismological observations along DESERT line, some
of the observed features remain unexplained. None of
our models can replicate the bright seismic reflector
and converter 10 km above the Moho observed in
both seismic [14] and seismological [45] data.
Obviously this reflector/converter demands some fea-
ture currently not present in the model, such as an
inherited lithological heterogeneity possibly also asso-
ciated with the localized shear strain. Another unex-
plained feature is westward shift of the mantle
anisotropic zone relative to the Arava fault [45]. In
all our models the major fault is located either above
the central part of the mantle deformation zone or is
even slightly shifted to the west of it (Fig. 4), not to
the east as observed. We suggest two possible expla-
nations of this phenomenon. First, possibility is that
the Arava fault at the DESERT line is relatively young
feature, and most of the strike-slip displacement is
taken by other faults west of it, located above the zone
of strongly anisotropic mantle. This idea is in line
with seismic observation suggesting that the upper-
most section of the Arava fault is very narrow (10 m)
[46], but apparently contradicts some geological
observations [43]. Another possibility is a 3-D effect
of presence of the Dead Sea pull-apart basin less than
100 km to the north of the DESERT line. If the mantle
deformation zone is located right beneath the Dead
Sea basin and continues to the south parallel to the
strike of the DST, then it must cross the DESERT line
indeed west of the Arava fault.
5.2. Controls of the position of the DST and strain
distribution at depth
The question of what controls the position of the
DST is among the basic questions concerning this
plate boundary. Steckler and Ten-Brink [48] sug-
gested that the DST north of the Dead Sea follows
the zone of the minimum lithospheric strength at the
Mediterranean margin, while to the south of the Dead
Sea, where this margin becomes too oblique to the
plate motion direction, the DST is parallel to the plate
velocity. In this hypothesis the lithospheric heteroge-
neity south of the Dead Sea did not play a role in the
localization of the DST. Our modelling shows that
the strike-slip deformation does localize in the zones
of minimal lithospheric strength, confirming the idea
of Steckler and Ten-Brink [48] in this respect. How-
ever, we also show that possible localizing factor was
a margin of the thick lithospheric root of the Arabian
shield located below the part of the Arava valley at
the pre DST time or regional thickening of the crust
at the trace of the DST. Therefore we suggest that
between the Dead Sea and the Red Sea the location
of the DST might have been significantly influenced
by the inherited regional minimum of the lithospheric
strength.
In all our models the strike-slip deformation loca-
lizes in the sub-vertical zone crossing the entire litho-
sphere. Strain partitioning within the lithosphere is
controlled by its rheology. For realistic crustal and
mantle rheologies (although weaker than those
implied by recent laboratory experiments for the natu-
S.V. Sobolev et al. / Earth and Planetary Science Letters 238 (2005) 78–9592
rally hydrous feldspar and quartz [21,22]), our models
generate deformation patterns, which are consistent
with geological and geophysical observations at the
DST. In the brittle upper 10–20 km of the crust the
deformation is localized in a few sub-vertical strike-
slip faults with one of them taking up most of the
strike-slip deformation. Deeper, the faults merge into a
diffused, 20–40 km wide, ductile deformation zone
which widens slightly with depth and has a 5–10 km
wide high-strain core. The width of this deformation
zone does not depend much on the thickness of the
lithosphere and is mostly controlled by shear heating
together with temperature- and strain rate-dependency
of the viscosity of the rocks. Note, that the similar
width (40 km) of the lower crustal shear zone for the
DST was suggested previously based on elastic mod-
elling of the subsidence of the Dead Sea basin [52].
5.3. Origin of the variations of surface topography
across the DST
Our modelling suggests that modification of the
mantle temperature is required to generate the
observed asymmetrical regional uplift of the litho-
sphere around the DST. Based on the tectonic history
of the region we suggest the following scenario. A big
portion of the Arabian Shield and adjacent Mediterra-
nean was tectonically stagnant following the Meso-
zoic, probably due to its location far from active
mantle convection flows. This might have resulted
in cooling and over-thickening of the lithosphere as
well as in reduced temperature of the sub-lithospheric
mantle in the entire region. The situation changed at
some 30 Ma with the appearance of the Afar plume
and the rifting and spreading of the Red Sea. We
speculate that at this time, the rejuvenation of the
asthenosphere, and destabilisation and destruction
(i.e., thermal erosion due to a small-scale astheno-
spheric convection) of the over-thickened mantle
lithosphere began. This process likely peaked during
the last 5 Myr and was marked by the surface uplift.
The western shoulder of the DST, which is mechani-
cally linked to the heavy oceanic lithosphere of the
Mediterranean, did not uplift much during this pro-
cess. In contrast, the eastern shoulder, which is largely
decoupled from the Mediterranean lithosphere by the
mechanically weak DST, was isostatically uplifted.
First results of the DST modelling with consideration
of the mechanical instability of the Arabian Shield
lithosphere [53] support this scenario.
The specific feature of the DST topography is a
narrow (20–30 km wide) valley, which was actually
one of the reasons to call the DST the Dead Sea Rift.
The 2-D thermo-mechanical models of the rifting
processes (e.g., [54]) imply that the width of the rift
valley is proportional to the initial thickness of the
lithosphere. For a lithospheric thickness of more than
100 km (consistent with the surface heat flow of 50–
60 mW/m2) the expected width of the rift valley is
much larger than that actually observed at the DST.
Our modelling suggests a possible explanation of this
contradiction. As we have shown in the previous
section the strike-slip deformation localizes in a rela-
tively narrow zone, whose width does not depend on
lithospheric thickness. When some subordinate exten-
sion is added (model 3) it is concentrated in the same
narrow zone where the major strike-slip deformation
is localized (see Fig. 8). The reason for this concen-
tration is reduced lithospheric viscosity within this
zone due to the high strike-slip strain rates. Accord-
ingly, the surface expression of the lithospheric exten-
sion, the rift-like valley, is narrow and its width does
not depend on the lithospheric thickness. What is in
fact happening in this process is a major coupling of
the strike-slip deformation and the fault perpendicular
extension, which is simulated by our extended 2-D
method but cannot be replicated by usual 2-D models.
A related question is how important is the rifting
(transform-perpendicular extension) deformation com-
ponent at the DST (e.g., [6,55,56])? We have seen
above that model 3, which combines transtension
(105 km strike-slip and 2–3 km of transform perpen-
dicular extension) and lithospheric thinning, fits rea-
sonably well with most of the observations along the
DESERT line. If extension is larger than 2–3 km the
model generates basin deeper than 0.4 km, observed at
DESERT line [14]. Note, however, that our model
does not consider transform-parallel extension, which
may also contribute to the subsidence of the Arava
Valley [52,57,58]. We expect that the transform-paral-
lel extension will also concentrate in the same narrow
deformation zone as the transform-perpendicular
extension (for the same reasons discussed before)
and will lead to similar consequences for the crustal
structure and surface topography. Therefore the
amount of transform-perpendicular extension neces-
S.V. Sobolev et al. / Earth and Planetary Science Letters 238 (2005) 78–95 93
sary to explain the observed topography and crustal
structure may be in fact less than 3 km or even absent
at all. From this we conclude that in the Arava Valley
part of the DST, the rifting was relatively unimportant
in accordance with geological observations [6].
6. Conclusions
1. We have developed fully coupled thermo-mechan-
ical models in an extended 2-D approximation to
study evolution of the continental lithosphere sub-
jected to transtensional deformation during 20 Myr.
The models have been focused on the geodynamic
setting of the DST in the region between the Red
Sea and the Dead Sea (Arava Valley), crossed by
the DESERT transect. The geological data as well
as geophysical and petrophysical observations in
the DESERT experiment have been used to con-
strain initial and boundary conditions and to
choose the thermal and rheological parameters.
The model, which combines plate-scale transten-
sion (strongly dominated by strike-slip deformation
component) with thinning of the mantle lithosphere
of the Arabian Shield at 5–10 Ma, and has rela-
tively week crust, replicates well most of the geo-
logical, geophysical and geodetic observations.
2. The shear strain at the DST in the Arava Valley is
localized in a sub-vertical shear zone, which
crosses the entire lithosphere. In the upper crust
the deformation localizes at one or two major
vertical faults located at the top of this zone. The
width of this zone in the lower crust and upper
mantle (20–40 km) is controlled by shear heating
and temperature- and strain-rate-dependence of the
viscosity of the rocks.
3. The strike-slip deformation localizes in the zone of
minimal lithospheric strength, usually in the region
of the highest temperature of the uppermost man-
tle. This temperature in turn depends on the thick-
ness of the crust (the thicker the crust the higher is
the sub-crustal temperature) and the thickness of
the lithosphere (the thinner the lithosphere the
higher is the sub-crustal temperature). The model-
ing suggests that the location of the DST between
the Dead Sea and the Red Sea might have been
controlled by the inherited regional minimum of
the lithospheric strength.
4. Modelling without consideration of the possible
transform parallel extension in the Arava Valley
shows that the rifting deformation component
(transform-perpendicular extension) at the DST in
this region is likely less than 3 km. We expect that
with consideration of the transform parallel exten-
sion, for which full 3-D modelling is required, the
transform-perpendicular extension may even
become unnecessary to fit the observations.
5. Uplift of the Arabian Shield adjacent to the DST
requires young (b10 Ma) thinning of the litho-
sphere at and east of the plate boundary. Such
lithospheric thinning is consistent with seismologi-
cal observations, with the low present-day surface
heat flow and with the high temperatures derived
from mantle xenoliths brought up by Neogene–
Quaternary basalts.
Acknowledgements
This study was funded by the Deutsche For-
schungsgemeinschaft and the GeoForschungsZentrum
Potsdam. Comments of Zohar Gvirtzman, Uri Ten
Brink and anonymous reviewer were very helpful to
improve the paper. John von Neumann Institute for
Computing (Forschungszentrum Julich) provided
supercomputing facilities (Project HPO11).
References
[1] J.T. Wilson, A new class of faults and their bearing on con-
tinental drift, Nature 207 (1965) 343.
[2] W.J. Morgan, Rises, trenches, great faults, and crustal blocks,
J. Geophys. Res. 73 (1968) 1959–1982.
[3] R. Freund, A model for the development of Israel and adjacent
areas since the Upper Cretaceous times, Geol. Mag. 102
(1965) 189–205.
[4] R. Freund, Z. Garfunkel, I. Zak, M. Goldberg, T. Weissbrod,
B. Derin, The shear along the Dead Sea rift, Philos. Trans. R.
Soc. Lond. Ser. A 267 (1970) 107–130.
[5] D.P. McKenzie, D. Davies, P. Molnar, Plate tectonics of the
Red Sea and east Africa, Nature 224 (1970) 125–133.
[6] Z. Garfunkel, Internal structure of the Dead Sea leaky trans-
form (rift) in relation to plate kinematics, Tectonophysics 80
(1981) 81–108.
[7] S. Joffe, Z. Garfunkel, The plate kinematics of the circum Red
Sea — a reevaluation, Tectonophysics 141 (1987) 5–22.
[8] X. LePichon, J.M. Gaulier, The rotation of Arabia and the
Levant fault system, Tectonophysics 153 (1988) 271–294.
S.V. Sobolev et al. / Earth and Planetary Science Letters 238 (2005) 78–9594
[9] K. Bandel, New stratigraphic and structural evidence for lat-
eral dislocation in the Jordan rift connected with description of
the Jurassic rock column in Jordan, Neues Jahrb. Geol.
Palaeontol. Abh. 161 (1981) 271–308.
[10] Z. Ben-Avraham, Structural framework of the Gulf of Elat
(Aqaba)-northern Red Sea, J. Geophys. Res. 90 (1985)
90,703–90,726.
[11] U. ten Brink, M. Rybakov, A. Al-Zoubi, M. Hassouneh, A.
Batayneh, U. Frieslander, V. Goldschmidt, M. Daoud, Y.
Rotstein, J.K. Hall, The anatomy of the Dead Sea plate
boundary: does it reflect continuous changes in plate motion?
Geology 27 (1999) 887–980.
[12] Z. Garfunkel, Z. Ben-Avraham, The structure of the Dead Sea
basin, Tectonophysics 266 (1996) 155–176.
[13] Z. Garfunkel, Z. Ben-Avraham, Basins along the Dead Sea
transform, in: P.A. Ziegler, W. Cavazza, A.H.F. Robertson, S.
Crasquin-Soleau (Eds.), Peri-Tethys Memoir 6: Peri-Tethyan
Rift/Wrench Basins and Passive Margins, Mem. Mus. Natn.
Hist. Nat., vol. 186, 2001, pp. 607–627.
[14] DESERT Group, The crustal structure of the Dead Sea trans-
form, Geophys. J. Int. 156 (2004) 655–681.
[15] P.A. Cundall, M. Board, A microcomputer program for mod-
elling large-strain plasticity problems, in: G. Swoboda (Ed.),
Numerical Methods in Geomechanics, Balkema, Rotterdam,
1989, pp. 2101–2108.
[16] A.N. Poliakov, P.A. Cundall, Y.Y. Podladchikov, V.A. Lya-
khovsky, An explicit inertial method for the simulation of the
viscoelastic flow: an evaluation of elastic effects on diapiric
flow in two- and three-layers models, in: D.B. Stone, S.K.
Runcorn (Eds.), Flow and Creep in the Solar System: Obser-
vations, Modelling and Theory, Kluwer Academic Publishers,
1993, pp. 175–195.
[17] J. Chery, M.D. Zoback, R. Hassani, An integrated mechanical
model of the San Andreas fault in central and northern Cali-
fornia, J. Geophys. Res. 106 (2001) 22,051–22,066.
[18] A.Yu. Babeyko, S.V. Sobolev, R.B. Trumbull, O. Oncken, L.L.
Lavier, Numerical models of crustal-scale convection and
partial melting beneath the Altiplano–Puna plateau, Earth
Planet. Sci. Lett. 199 (2002) 373–388.
[19] S.V. Sobolev, A.Yu. Babeyko, Modeling of mineralogical
composition, density and elastic wave velocities in anhydrous
magmatic rocks, Surv. Geophys. 15 (1994) 515–544.
[20] J. Arndt, T. Bartel, E. Scheuber, F. Schilling, Thermal and
rheological properties of granodioritic rocks from the central
Andes, north Chile, Tectonophysics 271 (1997) 75–88.
[21] G.C. Gleason, J. Tullis, A flow law for dislocation creep of
quartz aggregates determined with the molten salt cell, Tecto-
nophysics 247 (1995) 1–23.
[22] E. Rybacki, G. Dresen, Dislocation and diffusion creep of
synthetic anorthite aggregates, J. Geophys. Res. 105 (2000)
26017–26036.
[23] G. Hirth, D.L. Kohlstedt, Water in the oceanic upper man-
tle: implications for rheology, melt extraction and the evolu-
tion of the lithosphere, Earth Planet. Sci. Lett. 144 (1996)
93–108.
[24] H.-J. Forster, A. Forster, R. Oberhansli, D. Stromeyer, S.V.
Sobolev, Lithosphere composition and thermal regime across
the Dead Sea Transform in Israel and Jordan, CGU-AGU-
SEG-EEGS 2004 Joint Assembly, Montreal (2004), CD-
ROM, T11A-05.
[25] D.A. Yuen, L. Fleitout, G. Schubert, C. Froidevaux, Shear
deformation zones along major transform faults, Geophys.
J. R. Astron. Soc. 54 (1978) 93–119.
[26] W. Thatcher, P.C. England, Ductile shear zones beneath strike-
slip faults: implications for the thermomechanics of the San
Andreas fault zone, J. Geophys. Res. 103 (1998) 891–905.
[27] J.R. Vail, Pan-African (Late Precambrian) tectonic terrains and
the reconstruction of the Arabian–Nubian Shield, Geology 13
(12) (1985) 839–842.
[28] A. Kroner, M. Eyal, Y. Eyal, Early pan-African evolution of
the basement around Elat, Israel, and Sinai, Peninsula
revealed by single-zircon evaporation dating, Geology 18
(1990) 545–548.
[29] K.M. Ibrahim, W.J. McCourt, Neoproterozoic granitic mag-
matism and tectonic evolution of the northern Arabian shield;
evidence from Southwest Jordan, J. Afr. Earth Sci. 20 (1995)
103–118.
[30] Z. Garfunkel, Tectonic setting of Phanerozoic magmatism in
Israel, Isr. J. Earth-Sci. 38 (1989) 51–74.
[31] Z. Ben-Avraham, R. Haenel, H. Villinger, Heat flow through
the Dead Sea rift, Mar. Geol. 28 (1978) 28,253–28,269.
[32] Y. Eckstein, G. Simmons, Review of heat flow data from the
eastern Mediterranean region, Pure Appl. Geophys. 117 (1979)
150–159.
[33] G. Giannerini, R. Campredon, G. Feraud, B. Abou-Zakhem,
Intraplate deformation and associated volcanism at the north-
western part of the Arabian plate, Bull. Soc. Geol. Fr. 4 (1988)
937–947.
[34] S. Ilani, Y. Harlavan, K. Tarawneh, I. Rabba, R. Weinberger,
K. Ibrahim, S. Peltz, G. Steinitz, New K–Ar ages of basalts
from the Harrat Ash Shaam volcanic field in Jordan: implica-
tions for the span and duration of the upper-mantle upwelling
beneath the western Arabian plate, Geology 29 (2) (2001)
171–174.
[35] G. Steinitz, Y. Bartov, The Miocene–Pliocene history of the
Dead Sea segment of the rift in light of K–Ar ages of basalt,
Isr. J. Earth Sci. 40 (1991) 199–208.
[36] M. Stein, Z. Garfunkel, E. Jagoutz, Chronothermometry of
peridotitic and pyroxenitic xenoliths; implications for the ther-
mal evolution of the Arabian lithosphere, Geochim. Cosmo-
chim. Acta 57 (1993) 1325–1337.
[37] S. Nasir, The lithosphere beneath the northwestern part of the
Arabian Plate (Jordan); evidence from xenoliths and geophy-
sics, Tectonophysics 201 (1992) 357–370.
[38] O. Hadiouche, W. Zurn, On the structure of the crust and upper
mantle beneath the Afro-Arabian region from surface wave
dispersion, Tectonophysics 209 (1992) 179–196.
[39] E. Debayle, J.-J. Leveque, M. Cara, Seismic evidence for a
deeply rooted low-velocity anomaly in the upper mantle
beneath the northeastern Afro/Arabian continent, Earth Planet.
Sci. Lett. 193 (2001) 423–436.
[40] A. Hofstetter, G. Bock, Shear-wave velocity structure of the
Sinai sub-plate from receiver function analyses, Geophys. J.
Int. 158 (2004) 67–84.
S.V. Sobolev et al. / Earth and Planetary Science Letters 238 (2005) 78–95 95
[41] H. Ginat, E. Zilberman, Y. Avni, Tectonic and paleogeographic
significance of the Edom River, a Pliocene stream that crossed
the Dead Sea rift valley, Isr. J. Earth Sci. 49 (2000) 159–177.
[42] A. Sneh, Y. Bartov, T. Weissbrod and M. Rosensaft, Geologi-
cal map of Israel 1:200,000, sheets 3 and 4, Geological Survey
of Israel, 1998, Jerusalem.
[43] Y. Bartov, Y. Avni, R. Calvo, U. Frieslander, The Zofar
Fault— a major intra-rift feature in the Arava rift valley,
Geol. Soc. Isr. Current Res. 11 (1998) 27–32.
[44] G. Rumpker, T. Ryberg, G. Bock, Desert Seismology Group,
Boundary-layer mantle flow under the Dead Sea Transform
Fault inferred from seismic anisotropy, Nature 425 (2003)
497–501.
[45] A. Mohsen, R. Hofstetter, G. Bock, R. Kind, M. Weber, K.
Wylegalla, Desert Group, A receiver function study across the
Dead Sea Transform, Geophys. J. Int. 160 (2005) 948–960.
[46] Ch. Haberland, A. Agnon, R. El-Kelani, N. Maercklin, I.
Qabbani, G. Rumpker, T. Ryberg, F. Scherbaum, M. Weber,
Modeling of seismic guided waves at the Dead Sea Trans-
form, J. Geophys. Res. 108 (2003) 2342, doi:10.1029/
2002JB002309.
[47] Z. Garfunkel, C.A. Anderson, G. Schubert, Mantle circulation
and the lateral migration of subducted slabs, J. Geophys. Res.
91 (1986) 7,205–7,223.
[48] M.S. Steckler, U.S. ten Brink, Lithospheric strength variations
as a control on new plate boundaries; examples from the
northern Red Sea region, Earth Planet. Sci. Lett. 79 (1986)
120–132.
[49] V. Lyakhovsky, Z. Ben-Avraham, M. Achmon, The origin of
the Dead Sea Rift, Tectonophysics 240 (1994) 29–43.
[50] D. Mainprice, P.G. Silver, Interpretation of SKS-waves using
samples from the subcontinental lithosphere, Phys. Earth Pla-
net. Inter. 78 (1993) 257–280.
[51] A. Tommasi, B. Tikoff, A. Vauchez, Upper mantle tectonics:
three-dimensional deformation, olivine crystallographic fab-
rics and seismic properties, Earth Planet. Sci. Lett. 168
(1999) 173–186.
[52] R. Katzman, U. ten Brink, J. Lin, Three-dimensional modeling
of pull-apart basins; implications for the tectonics of the Dead
Sea basin, J. Geophys. Res. 100 (1995) 6295–6312.
[53] A.G. Petrunin, S.V. Sobolev, A.Yu. Babeyko, Z. Garfunkel,
Thermo-mechanical model of the Dead Sea Transform: main
controls, Geophys. Res. Abst. 6 (2004) 03366.
[54] E. Burov, A. Polyakov, Erosion and rheology controls on
synrift and postrift evolution: verifying old and new ideas
using a fully coupled numerical model, J. Geophys. Res.
106 (2001) 16,461–16,481.
[55] Z. Ben-Avraham, M.D. Zoback, Transform-normal extension
and asymmetric basins: an alternative to pull-apart models,
Geology 20 (1992) 20,423–20,426.
[56] S. Wdowinski, E. Zilberman, Kinematic modelling of large-
scale structural asymmetry across the Dead Sea Rift, Tectono-
physics 266 (1996) 187–201.
[57] A. Al-Zoubi, U. ten Brink, Lower crustal flow and the role of
shear in basin subsidence: an example from the Dead Sea
basin, Earth Planet. Sci. Lett. 199 (2002) 67–79.
[58] A. Sagy, Z. Reches, A. Agnon, Hierarchic 3D architecture and
mechanisms of the margins of the Dead Sea pull-apart, Tec-
tonics 22 (2002).