Embed Size (px)
Citation preview

Energy Equip. Sys./ Vol. 7/No. 1/March 2019/ 99-108
Energy Equipment and Systems
http://energyequipsys.ut.ac.ir
www.energyequipsys.com
Thermo-fluid simulation of the gas turbine performance based on the first law of thermodynamics
Author
Mohammad Mahdi Rastegardoost a
Forooza Samadi
b*
a School of Mechanical Engineering, University
of Tehran, Tehran, Iran
b Mechanical Engineering Department, The
University of Alabama, Tuscaloosa, AL 35404, United States
ABSTRACT
The thermal efficiency of the gas turbine depends on the compression work which is in direct relationship with the working fluid temperature. Amongst various solutions presented to augment gas turbines and combined cycle power plants output, wet compression is known as the most cost-effective method. This paper provides a method of simulating wet compression, based on the first law of thermodynamics. Water droplet evaporation rate, compression work, and the concept of wet compression efficiency are described. Results of first law and second law analyses are compared, and the effect of wet compression on gas turbine performance is indicated. Moreover, the results of the wet compression procedure are compared with both the values obtained for the dry compression process and the results of wet compression analysis using the second law. Finally, it is seen that the first law analysis provides equally consistent results with the experimental data for the cases considered in the paper.
Article history:
Received : 14 October 2018 Accepted : 31 October 2018
Keywords: Wet Compression, Gas Turbine, Thermo-Fluid Simulation.
1. Introduction
Compressor consumes a considerable portion of the power produced by gas turbine; and therefore, decreasing the work consumed by compressor plays a substantial role in improving the turbine output. Moreover, the power output and efficiency of the turbine are strong functions of the compressor inlet temperature as the power output drops by 0.54 – 0.90% for every 1℃ rise in inlet air temperature [1]. A decrease in output power and an increase in heat rate occurs in power plants when electric demands are high during the hot days. Fogging, or Cooling down the
Corresponding author: Forooza Samadi Mechanical Engineering Department, The University of Alabama, Tuscaloosa, AL 35404, United States Email: [email protected]
compressor inlet air through adding small water droplets, has traditionally been employed to reduce the compressor work. It is a common approach comparing other available inlet air cooling techniques because of the simplicity, low installation downtime, high effectiveness, and comparatively low initial investment cost [2]. High-pressure fogging with overspray is called “wet compression process” and has commonly been implemented in simple and combined cycle applications. Investigating this process needs the study of multiphase flow and water evaporation during the compression process.
Wet compression is a power augmentative idea in gas turbine applications. Studies on this topic started in the late 1940s by [3]. For the first time, Wilcox and Trout used the case of the turbojet engine to develop the analysis of

100 Mohammad Mahdi Rastegardoost & Forooza Samadi / Energy Equip. Sys. / Vol. 7/No. 1/March 2019
power augmentation by water ingestion at the inlet of the compressor [4]. Later, Hill used an axial compressor to discuss the effects of inlet cooling on load redistribution in the stages [5]. A comprehensive discussion of the theory and application of fogging technology was presented by [6].
Wet compression is a strategy based on liquid water injection into the compressor stages. Chaker et al. [7-9] presented the results of extensive experimental and theoretical studies of wet compression. Analysis of evaporative and overspray fogging conditions developed by Bhargava et al. showed high performance improvements comparing the simple wet compression process [1]. Horlock developed a one-dimensional analysis of compressor off-design performance to illustrate the compressor performance due to a decrease in temperature for water injection [10]. White and Meacock evaluated the effect of water injection on compressor performance [11]. They investigated the thermodynamic and aerodynamic aspects of using wet compression process and showed that water injection affects the compressor characteristics, and make individual compressor stages operate considerably off-design. They suggest redesigning the compressors so that they can take advantage of all the merits of the water injected cycles.
The main achievements of wet compression are decreasing the compressor specific work and discharge temperature and increasing the compressor pressure ratio and mass flow rate [12, 13]. Various parameters including the injected water droplets diameter, the evaporation rate, and the injected water mass flow rate affect these benefits [14, 15]. Moreover, displacement of an operating point on the performance curve, with a redistribution of the load among different compressor stages is observed [16, 17]. In a research conducted by Sanaye et al. [18], the evaporation of water droplets in the compressor inlet duct was modeled, and the diameter of water droplets was estimated at the end of the inlet duct.
Regarding the effects of wet compression on gas turbine cycles, Zheng et al. [15] developed a second law model of wet compression to analyze the effect of fog inlet cooling on gas turbine performance. Later, they [19] expanded their analysis to a regenerative gas turbine cycle, and they discussed the concept of continuous evaporation and internal cooling of the compressor through wet compression. In 2015, Chaker performed a CFD simulation for several gas turbine inlet
ducts and provided an overall description of design considerations for fogging systems, wet compression systems, and combined systems [20]. Recently, Tahani [21] used the experimental data and matching component algorithm to analyze a gas turbine cycle containing wet compression process with overspray. They also found the optimal values for overspray rate, droplet diameter and temperature using a nature-inspired optimization algorithm. The approach that is commonly applied to simulate the wet compression process is using the second law of thermodynamics in conjunction with the other entropy formulas like Gibbs. Although that method is appealing since it applies entropy under the second law base analysis, this paper is going to use the first law of thermodynamics to predict the behavior of droplet through the compressor for the application of gas turbine wet compression. The traditionally investigated parameters, such as water droplet evaporation rate, and wet compression work and efficiency, will be found with the help of the first law of thermodynamics, and the results will be compared to the ones obtained using the second law-based models. Nomenclature
𝜆 Thermal conductivity (𝑊
𝑚𝐾)
ℎ Convection coefficient (𝑊
𝑚2𝐾)
𝑆 Surface area (𝑚2)
𝑇 Absolute temperature (𝐾)
𝐷 Diameter (𝑚)
�̇� Heat transfer rate (𝑊)
�̇� Work rate (𝑊)
𝜇 Dynamic viscosity (𝑘𝑔
𝑚 𝑠)
𝐶𝑝 Specific heat capacity (𝑘𝐽
𝑘𝑔 𝐾)
𝜌 Density (𝑘𝑔
𝑚3)
𝑔 Gravity acceleration (𝑚
𝑠2)
𝛽 Thermal dilatation coefficient
Δ𝑚 Mass variation (𝑘𝑔)
𝐿𝑉 Vaporization latent heat (𝑘𝐽
𝑘𝑔)
𝑅 Universal gas constant (𝑁𝑚
𝑘𝑚𝑜𝑙 𝐾)
𝜃 Dimensionless temperature
𝛿 Diffusion coefficient
𝑁𝐶 Corrected speed
𝐶𝐹 Quasi-dimensionless mass flow rate
𝜓 Pressure coefficient
Mohammad Mahdi Rastegardoost & Forooza Samadi / Energy Equip. Sys. / Vol. 7/No. 1/March 2019 101
𝑆𝐹 Shape factor
𝜂 Efficiency
𝑣 Specific volume (𝑚3
𝑘𝑔)
𝑈 The tip speed of the compressor (𝑚
𝑠)
𝜔 Humidity
Δ𝑡 Time variation
𝜑 Mass flux (𝑚𝑎𝑠𝑠 𝑝𝑒𝑟 𝑢𝑛𝑖𝑡 𝑎𝑟𝑒𝑎)
𝑀 Molecular mass (𝑔𝑟
𝑚𝑜𝑙)
Γ Mass flux coefficient
𝑝 Partial pressure (𝑃𝑎)
𝑆ℎ Sherwood number
Subscript
𝐶𝑜𝑛𝑣 Convection heat transfer
𝑙𝑎𝑡 Latent heat
𝑑 Droplet
𝑎 Air
𝑒𝑣𝑎𝑝 Evaporation
𝑉 Vapor
𝑀𝑖𝑥 Mixture
𝐴𝑣𝑔 Average
Dimensionless Parameters
𝑁𝑢 Nusselt Number
𝑃𝑟 Prandtl Number
𝑆𝑐 Schmidt Number
𝐺𝑟 Grashof Number
𝑆ℎ Sherwood Number 2. Analysis and Methodology The wet compression process is defined as injecting small water droplets into the inlet duct of the compressor. Therefore, the wet
compression analysis contains droplet evaporation modeling, flow modeling, and calculating wet compression work. Also, since the flow is mixed, the specification of mixture flow parameters need to be considered. In this study, a model is developed to simulate a one-dimensional analysis of compressor off-design performance by using the first law of thermodynamics.
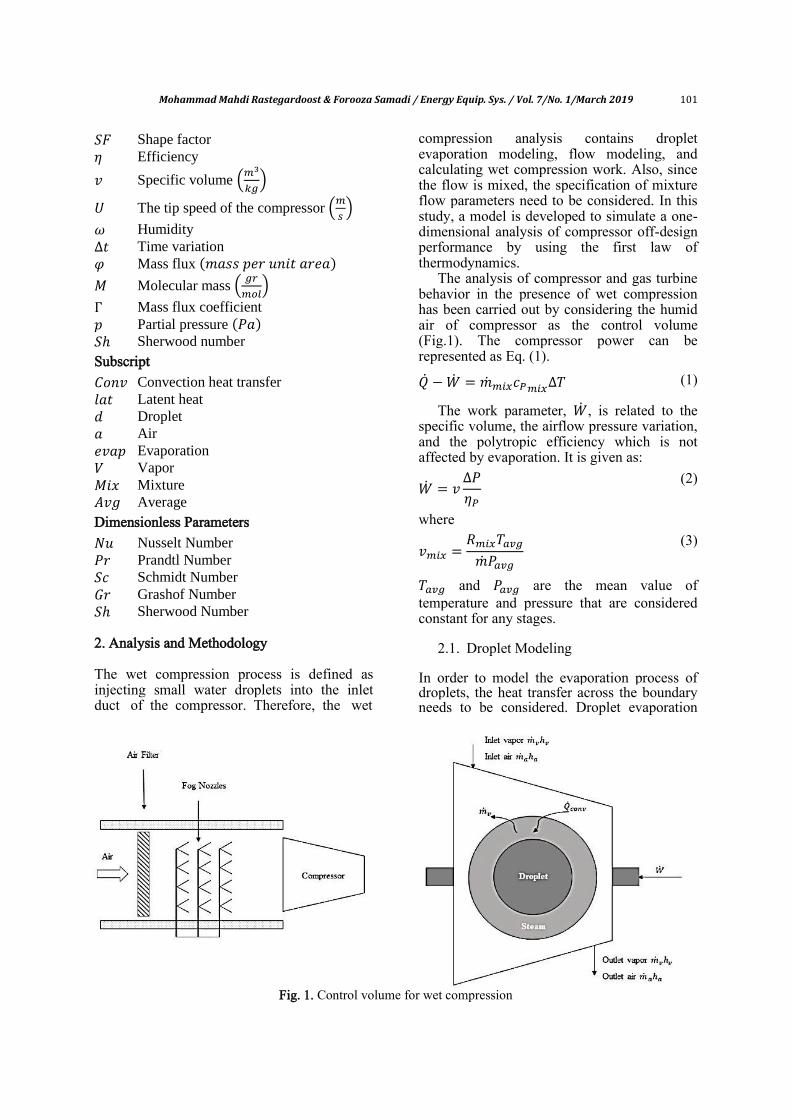
The analysis of compressor and gas turbine behavior in the presence of wet compression has been carried out by considering the humid air of compressor as the control volume (Fig.1). The compressor power can be represented as Eq. (1).
�̇� − �̇� = �̇�𝑚𝑖𝑥𝑐𝑃𝑚𝑖𝑥∆𝑇 (1)
The work parameter, �̇�, is related to the specific volume, the airflow pressure variation, and the polytropic efficiency which is not affected by evaporation. It is given as:
�̇� = 𝑣∆𝑃
𝜂𝑃
(2)
where
𝑣𝑚𝑖𝑥 =𝑅𝑚𝑖𝑥𝑇𝑎𝑣𝑔
�̇�𝑃𝑎𝑣𝑔
(3)
𝑇𝑎𝑣𝑔 and 𝑃𝑎𝑣𝑔 are the mean value of temperature and pressure that are considered constant for any stages.
2.1. Droplet Modeling In order to model the evaporation process of droplets, the heat transfer across the boundary needs to be considered. Droplet evaporation
Fig. 1. Control volume for wet compression

102 Mohammad Mahdi Rastegardoost & Forooza Samadi / Energy Equip. Sys. / Vol. 7/No. 1/March 2019
rate depends on heat transfer between the droplet and the main fluid. The forced convection takes place as long as there is a slip velocity between air and droplet, whereas, the natural convection prevails when slip velocity is negligible. Droplets are heated up, a thin layer of liquid evaporates, and both air and liquid use the latent heat to be cooled. The saturated water vapor around the droplets is transported away from the liquid surface until the whole water evaporates. The analysis of droplets evaporation is based on the following assumptions: The moist air is assumed to follow a
polytropic process. The physical properties of air and liquid
water are homogeneous in each phase considered.
The water droplet is a perfect sphere. The temperature inside the droplet and on
its surface is uniform, and the air is not soluble in the liquid water.
The evaporation rate of water droplet affects the wet compression polytrophic index. Therefore, it is assumed that the evaporation rate remained constant throughout the wet compression.
Heat and mass transfer through the outer layer of the droplet into the surrounding air occurred by convection, diffusion, and radiation are neglected. Figure 1 represents the considered control volume including droplet, input, and output streams of the problem.
The rate of heat absorption by a droplet, �̇�, is a summation of convection rate, �̇�𝑐𝑜𝑛𝑣, and the rate of losing latent heat by the evaporation, �̇�𝑙𝑎𝑡, and it is presented as.
�̇� = �̇�𝑐𝑜𝑛𝑣 + �̇�𝑙𝑎𝑡 . (4)
The convection heat transfer between the droplet and surrounding air is given as
�̇�𝑐𝑜𝑛𝑣 = ℎ × 𝑆𝑑 × (𝑇𝑎 − 𝑇𝑑), (5)
where Sd is the droplet surface area, and the convective coefficient, h, may be found through the Nusselt number definition. Correlations are given as
𝑁𝑢 = 2 + 0.6 𝐺𝑟𝑡0.25 × 𝑃𝑟0.33, (6)
where Grt is the Grashof number and Pr represents the Prandtl number that is calculated using
𝑃𝑟 =𝜇𝑎 ×𝐶𝑃,𝑑
𝜆𝑎
. (7)
The thermal conductivity of the air λa and its dynamic viscosity, μa, that are needed in calculating the Prandtl number are defined, respectively, as [7]
𝜆𝑎
= (46.766 + 0.7143 𝑇𝑎) × 10−4 (8)
and
𝜇𝑎 = (0.004823 × 𝑇𝑎 + 0.3976) × 10−5. (9)
The thermal Grashof number and thermal dilatation for a perfect gas are given, respectively, by
𝐺𝑟𝑡 =𝜌𝑎
2𝑔 𝛽 (𝑇𝑎 − 𝑇𝑑)𝐷𝑑3
𝜇𝑎2
(10)
and
𝛽 =1
𝜌𝑎
(𝜕𝜌𝑎
𝜕𝑇)
𝐶,𝑝=
1
𝑇𝑎. (11)
The mass flow rate and specific latent heat of water, which is a strong function of droplet temperature, are the parameters used for calculating the rate of latent heat transfer between droplets and humid surrounding air as
�̇�𝑙𝑎𝑡 =∆𝑚𝑑 ×𝐿𝑉
∆𝑡, (12)
where LV is the latent heat of vaporization of water which is calculated using
𝐿𝑉 = 1000 × (2498 − 2.413 × 𝑇𝑑), (13)
while Δmd represents the change in the droplet mass which is affected by the droplet geometry through changing the mass flux moving through the droplet surface. Therefore, knowledge of Sherwood, Grashof, and Schmidt numbers is necessary to achieve the mass flow rate that evaporates from the droplets. The change in the droplet mass is thus given as
∆𝑚𝑑 = −∆𝑡 × 𝑆𝑑 × 𝜑𝑒𝑣𝑎𝑝, (14)
and the evaporated mass flux 𝜑𝑒𝑣𝑎𝑝 is given by
𝜑𝑒𝑣𝑎𝑝 =𝑀 ×𝑆ℎ × Γ
𝑅 × 𝐷𝑑(
𝑝𝑆
𝑇𝑑−
𝑝𝑉
𝑇𝑎), (15)
where Ma = 28.8403 is the molecular weight of the air, Γ shows the mass flux coefficient, ps
and pV represent the saturated pressure and vapor pressure, respectively. These values can be calculated, respectively, using
𝑃𝑉 = 𝑃 − 𝑃𝑎 , (16)

Mohammad Mahdi Rastegardoost & Forooza Samadi / Energy Equip. Sys. / Vol. 7/No. 1/March 2019 103
𝑃𝑎 =𝑃
1 +𝜔
0.622
(17)
and
𝜔 =0.622 × 𝜑 × 𝑃𝑎
𝑃 − 𝜑 × 𝑃𝑎.
(18)
The Sherwood number can be calculated using the well-known correlation
𝑆ℎ = 2 + 0.6(𝐺𝑟0.25 × 𝑆𝑐0.33), (19)
where the Schmidt number is given as
𝑆𝑐 =𝜇𝑎
𝛿 × 𝜌𝑎, (20)
and
𝛿 = 0.0000226 ×(
101325
1000𝑝)
(𝑇𝑎
273.15).
(21)
Figure 2 demonstrates a schematic of the procedure of calculating the parameters in Eq.(12) which leads to calculating the latent heat.
2.2.Mixture Parameters The right-hand side of the Eq.(1) is calculated for a mixture of water, steam, and air. All parameters related to the mixture analysis are found at the average temperature and pressure of any stage.
The specific heat capacity of the mixture is
𝑐𝑃𝑚𝑖𝑥 =𝑃𝑣
𝑃𝑐𝑃𝑣 +
𝑃𝑎
𝑃𝑐𝑃𝑎
(22)
In which, the specific heat capacity of steam and air in terms of dimensionless temperature and the molecular weight are given, respectively, as
𝑐𝑃𝑣 = 143.05 − 183.54 × 𝜃𝑚0.25
+ 82.751 × 𝜃𝑚0.5
− 3.6989 × 𝜃𝑚
(23)
and
𝑐𝑃𝑎 =981+8×𝜃𝑚×𝑀𝑎
1000, (24)
Fig.2. A schematic of the latent heat calculation method

104 Mohammad Mahdi Rastegardoost & Forooza Samadi / Energy Equip. Sys. / Vol. 7/No. 1/March 2019
where θm represents the dimensionless temperature, presented as
𝜃𝑚
=𝑇𝑚
100, (25)
where 𝑇𝑚 is the mixture average temperature at any stage. and the mixture’s molecular weight is given as
𝑀𝑚 =𝑃𝑣
𝑃𝑀𝑣 +
𝑃𝑎
𝑃𝑀𝑎 ,
(26)
where the molecular weights of the air and vapor, respectively, are
𝑀𝑎 = 28.8403 (27)
𝑀𝑣 = 18.015.
2.3.Compressor Modeling
The droplets moving through the compressor are simulated and the heat transfer analysis used to estimate the pressure of the compressor’s stages and predict the variation of air temperature during wet compression. Considering the definition of corrected speed (NC), the relation between the flux coefficient, 𝜑, and the dimensionless mass flow rate, CF, is given by
𝜑 =
𝑚𝑎̇
𝜌 𝐴
𝑈=
(𝑚𝑎̇
𝐴)𝑅 (
𝑇
𝑃)
𝑘 𝑁𝐶 √𝑇= 𝐾
�̇�√𝑇
𝑃𝑁𝐶=
𝐾CF
𝑁𝐶.
(28)
By dividing Eq. (28) by that for the design point, the quasi-dimensionless flux coefficient is obtained as
𝜑∗ =𝐶𝐹∗
𝑁𝐶∗ . (29)
The asterisk sign represents the proportion of parameter to its value at the design point. Using the method presented by Spina [22] and the generalized chart and the values of parameters at compressor stages presented by Muir [23], the dimensionless pressure coefficient can be calculated as
𝜓∗
= 𝜓𝑚𝑎𝑥∗
−𝜓
𝑚𝑎𝑥∗ − 1
[𝜑𝜓𝑚𝑎𝑥
∗ + 𝑆𝐹 (𝜑𝜓𝑚𝑎𝑥
∗ − 1) − 1]2
× [𝜑𝜓𝑚𝑎𝑥
∗ + 𝑆𝐹 (𝜑𝜓𝑚𝑎𝑥
∗ − 1) − 𝜑∗]2
,
(30)
while
𝜓 =Δℎ
𝑈2 =𝑐𝑃Δ𝑇
𝑈2 . (31)
SF is the shape factor introduced by Cerri et al. [24] that depends on the type of compressor stages. It is achieved experimentally and varies from – 0.5 to 1.0, negative values representing supersonic stages and positive values representing the subsonic ones. By calculating the output temperature of the first stage as well as the characteristic values for the operating point, stage by stage, and calculating the output pressure of each stage using.
𝑃2
𝑃1= (
𝑇2
𝑇1)
𝛾 𝜂𝑝
𝛾−1.
(32)
the output pressure and temperature of the compressor can be found.
2.4.Evolutionary Algorithm The general algorithm used to calculate the compressor work is presented in Fig.3. The developed iterative code includes the following functions:
1. Taking the initial conditions at the entrance of the stage
2. Making assumptions for exit temperature and pressure of the stage
3. Simulating the flow 4. Calculating the droplets heat transfer 5. Using the first law of thermodynamics to
update the assumption parameters The trial and error procedure will be
finished when the surrounding air is completely saturated, or when the droplet evaporates completely. The flow chart in Fig.3 presents this procedure systematically.
3.Results One of the advantages of the wet compression in comparison with the fogging method is that it works effectively regardless of how high the ambient relative humidity is. Furthermore, evaporating water droplets, which are carried through the stages of the compressor by the air flux, create an obstacle to the temperature rise. Therefore, the power consumption of compressor is reduced, while the mass flow rate has been increased.
The developed model is used to simulate a 10-stage compressor installed in an ambient with a temperature of 35°C, a pressure of 101.325 kPa, and 60% relative humidity. Also, the developed model by Zheng based on the

Mohammad Mahdi Rastegardoost & Forooza Samadi / Energy Equip. Sys. / Vol. 7/No. 1/March 2019 105
second law of thermodynamics was applied, and the results are compared. Figure 4 shows the exit temperature for different stages of the compressor. This figure shows that by evaporation of water droplets in the wet compression process, the exit temperature of the stages, as well as the whole compressor, is reduced. Also, the behavior of stages’ exit temperature through the wet compressor that is
found using the first law of thermodynamics is the same as the one obtained in a dry process. Moreover, there is a change in the slope of the graph showing the results computed using the second law of thermodynamics, whereas it is not seen in the first law of thermodynamic results. Table 1 compares the exact values of any stage exit temperature that is plotted in Fig 4.
Fig.1. Flowchart showing the procedure of calculating the wet compressor work
Fig. 2. Compressor different stages exit temperatures

106 Mohammad Mahdi Rastegardoost & Forooza Samadi / Energy Equip. Sys. / Vol. 7/No. 1/March 2019
Table 1. Comparison between compressor stages exit temperatures using first and 2nd law analysis
Stages 1 2 3 4 5 6 7 8 9 10
Dry 58.00 80.95 103.85 126.68 149.47 172.2 194.87 217.49 240.06 262.57
OS 1%
2nd
Law 48.69 66.27 80.50 92.51 107.48 130.11 152.71 175.27 197.79 220.26
OS 1%
1st Law
49.21 67.78 84.73 102.13 120.04 138.52 157.69 177.67 198.64 220.85
Difference (%) 1.1 2.3 5.3 10.4 11.7 6.5 3.3 1.4 0.4 0.3
Table 1 demonstrates that the differences of
calculated exit temperatures value, between the first and second law of thermodynamics have a bell-shaped behavior, and it is increased in the middle stages of the compressor.
Figure 5 compares the pressure ratio of all dry and wet compression stages modeled by the first and second law. In the wet compression process, pressure ratio at initial stages is lower than dry compression. Similar to the stages exit temperatures (Fig.4), there is a sudden change in the graph plotted using the results for pressure ratio obtained from second law analysis that is not seen in the first law analysis results. Table 2 compares the exact values of any stage pressure ratio that is plotted in Fig.5. It shows that unlike the differences
between the exit temperatures, the difference between the results for the pressure ratio analyzed using the first and second laws of thermodynamics has a U-shape trend with the minimum value in the middle stages.
To validate the developed model, performance parameters of the NACA 10-Stage gas turbine at the design and off-design points are investigated and compared to the values reported by the simulation. The simulation was tuned to model the behavior of the NACA 10-Stage gas turbine in dry conditions. The simulation of wet compression was carried out through programming by considering the same ambient conditions, injected water amount, and
Fig.3. Stage Pressure ratio
Table 2. Comparison between compressor stages exit pressures using first and 2nd law analysis
Stages 1 2 3 4 5 6 7 8 9 10
Dry 1.25 1.24 1.22 1.20 1.19 1.18 1.17 1.16 1.15 1.15
OS 1%
2nd
Law 1.25 1.23 1.22 1.21 1.20 1.20 1.19 1.18 1.17 1.16
OS 1%
1st Law
1.16 1.17 1.17 1.19 1.19 1.20 1.21 1.22 1.23 1.25
Difference
(%) 7.0 5.2 3.6 2.1 0.8 0.2 1.6 3.5 5.4 7.4

Mohammad Mahdi Rastegardoost & Forooza Samadi / Energy Equip. Sys. / Vol. 7/No. 1/March 2019 107
droplets diameter used in the experimental test. Table 3 shows this comparison where R is the reported value, C1 is the computed value using the first law, C2 is the computed value using
the second law, and D1 and D2 are percentage errors for the first and the second law of thermodynamics, respectively. The results presented in
Table 3 indicate that in the heat transfer related concepts, the first low based simulation results in the values closer to the reported ones. However, for calculating work, the second low based simulation achieves more accurate result comparing the ones resulted from the first law simulation. 4.Conclusion This paper provides a comprehensive analysis of the thermodynamics and heat transfer in the gas turbine wet compressor. The presented method can evaluate the performance of a gas turbine in the presence of wet compression. Water droplet evaporation rate, wet compression work, and the concept of wet compression efficiency were described, and a comparison between the results of the first and second laws analyses was conducted. The results indicated that thermodynamic simulation based on the first law is closer to the point at initial stages of the compressor. Consequently, by increasing the temperature and pressure of the compressor through the next stages, the results produced by the second law were shown to follow those reported by experiments. Finally, it was shown that both the first and the second laws based simulations granted acceptable results in modeling the wet compression process, although in the parameters related to the heat transfer, the first law based analysis resulted in more accurate values.
References
[1] Bhargava R., Meher-Homji C., Parametric Analysis of Existing Gas Turbines with Inlet Evaporative and Overspray Fogging, in ASME Turbo Expo 2002, Power for Land, Sea, and Air, American Society of Mechanical Engineers, 387-401 (2002).
[2] Bagnoli M., Bianchi M., Melino F., Spina P.R., Development and Validation of a Computational Code for Wet Compression Simulation of Gas Turbines, Journal of Engineering for Gas Turbines and Power, 130(1): 012004 (2008).
[3] Kleinschmidt R., Value of Wet Compression in Gas-Turbine Cycles, Mechanical Engineering, 69(2): 115-116(1947).
[4] Wilcox E.C., Trout A.M., Analysis of Thrust Augmentation of Turbojet Engines by Water Injection at Compressor Inlet Including Charts for Calculating Compression Processes with Water Injection (1951).
[5] Hill P., Aerodynamic and Thermodynamic Effects of Coolant Injection on Axial Compressors, The Aeronautical Quarterly, 14(4): 331-348(1963).
[6] Meher-Homji C.B., Mee T.R., Gas Turbine Power Augmentation By Fogging Of Inlet Air, in Proceedings of the 28th Turbomachinery Symposium, Texas A&M University. Turbomachinery Laboratories, (1999).
Table 3. Comparison between reported and calculated values
Parameter Design]\\point
R C1 D1 % C2 D2 %
Compressor inlet temperature (℃) 15 15 0 15 0
Compressor discharge temperature (℃) 262 260.82 -0.4 256.48 -2.1
Air mass flow rate (𝑘𝑔
𝑠) 26.1 26.1 0 26.1 0
Compressor work input (𝑀𝑊) 6.38 6.32 -0.9 6.41 0.47
Total turbine work output (𝑀𝑊) 13.22 13.29 0.5 13.28 0.45
Net-work output (𝑀𝑊) 6.84 6.85 0.14 6.87 0.43
Heat rate (𝑘𝐽
𝑘𝑊ℎ) 13532.3 13720.20 1.39 13791.44 1.91
108 Mohammad Mahdi Rastegardoost & Forooza Samadi / Energy Equip. Sys. / Vol. 7/No. 1/March 2019
[7] Chaker M., Meher-Homji C.B., Mee T., Inlet Fogging of Gas Turbine Engines: Part A—Fog Droplet Thermodynamics, Heat Transfer and Practical Considerations, in ASME Turbo Expo 2002: Power for Land, Sea, and Air, American Society of Mechanical Engineers, 413-428 (2002).
[8] Chaker M., Meher-Homji C.B., Mee T., Inlet Fogging of Gas Turbine Engines: Part B—Fog Droplet Sizing Analysis, Nozzle Types, Measurement and Testing, in: ASME Turbo Expo 2002: Power for Land, Sea, and Air, American Society of Mechanical Engineers, 429-441 (2002).
[9] Chaker M., Meher-Homji C.B., Mee T., Inlet Fogging of Gas Turbine Engines: Part C—Fog Behavior in Inlet Ducts, CFD Analysis and Wind Tunnel Experiments, in: ASME Turbo Expo 2002: Power for Land, Sea, and Air, American Society of Mechanical Engineers, 443-455 (2002).
[10] Horlock J., Compressor Performance with Water Injection, in ASME Turbo Expo 2001: Power for Land, Sea, and Air, American Society of Mechanical Engineers V001T003A039-V001T003A039 (2001).
[11] White A.J., Meacock A.J., An Evaluation of the Effects of Water Injection on Compressor Performance, Journal of Engineering for Gas Turbines and Power, 126(4) 748-754 (2004).
[12] Hartel C., Pfeiffer P., Model Analysis of High-Fogging Effects on the Work of Compression, in ASME Turbo Expo 2003, Collocated with the 2003 International Joint Power Generation Conference, American Society of Mechanical Engineers, 689-698 (2003).
[13] Horlock J., The Basic Thermodynamics of Turbine Cooling, Journal of Turbomachinery, 123(3): 583-592(2001).
[14] Utamura M., Takehara I., Karasawa H., MAT, A Novel, Open Cycle Gas turbine for power augmentation, Energy conversion and management, 39(16-18) (1998) 1631-1642.
[15] Q. Zheng, Y. Sun, S. Li, Wang Y., Thermodynamic Analyses of Wet Compression Process in the Compressor of A Gas Turbine, in ASME Turbo Expo 2002: Power for Land, Sea, and Air, American Society of Mechanical Engineers, 487-496 (2002).
[16] Bagnoli M., Bianchi M., Melino F., Peretto A., Spina P., Bhargava R., Ingistov S., A Parametric Study of Interstage Injection on GE Frame 7EA Gas Turbine, in: ASME Turbo Expo 2004: Power for Land, Sea, and Air, American Society of Mechanical Engineers, 489-499 (2004).
[17] Matz C., Cataldi G., Kappis W., Mundinger G., Bischoff S., Helland E., Ripken M., Prediction of Evaporative Effects Within the Blading of an Industrial Axial Compressor, Journal of Turbomachinery, 132(4): 041013-041013-041011(2010).
[18] Sanaye S., Rezazadeh H., Aghazeynali M., Samadi M., Mehranian D., Ahangaran M.K., Effects of Inlet Fogging and Wet Compression on Gas Turbine Performance, in: ASME Turbo Expo 2006: Power for Land, Sea, and Air, American Society of Mechanical Engineers, 769-776(2006).
[19] Zheng Q., Li M., Sun Y., Thermodynamic Analysis of Wet Compression and Regenerative (WCR) Gas Turbine, ASME Paper No. GT-2003-38517 (2003).
[20] Chaker M., Mee I.I.I.T.R., Design Consideration of Fogging and Wet Compression Systems as Function of Gas Turbine Inlet Duct Configurations, (56673) V003T020A015(2015).
[21] Tahani M., Masdari M., Salehi M., Ahmadi N., Optimization of Wet Compression Effect on the Performance of V94. 2 Gas Turbine, Applied Thermal Engineering, 143: 955-963(2018).
[22] Spina P.R., Gas Turbine Performance Prediction by Using Generalized Performance Curves of Compressor and Turbine Stages, in ASME Turbo Expo 2002: Power for Land, Sea, and Air, American Society of Mechanical Engineers, 1073-1082(2002).
[23] Muir D.E., Axial Flow Compressor Modelling for Engine Health Monitoring Studies, Carleton University, Canada, (1988).
[24] Cerri G., Salvini C., Procacci R., Rispoli F., Fouling and Air Bleed Extracted Flow Influence on Compressor Performance, in ASME 1993 International Gas Turbine and Aeroengine Congress and Exposition, American Society of Mechanical Engineers, V03CT17A027-V003CT017A027 (1993).