Embed Size (px)
Citation preview
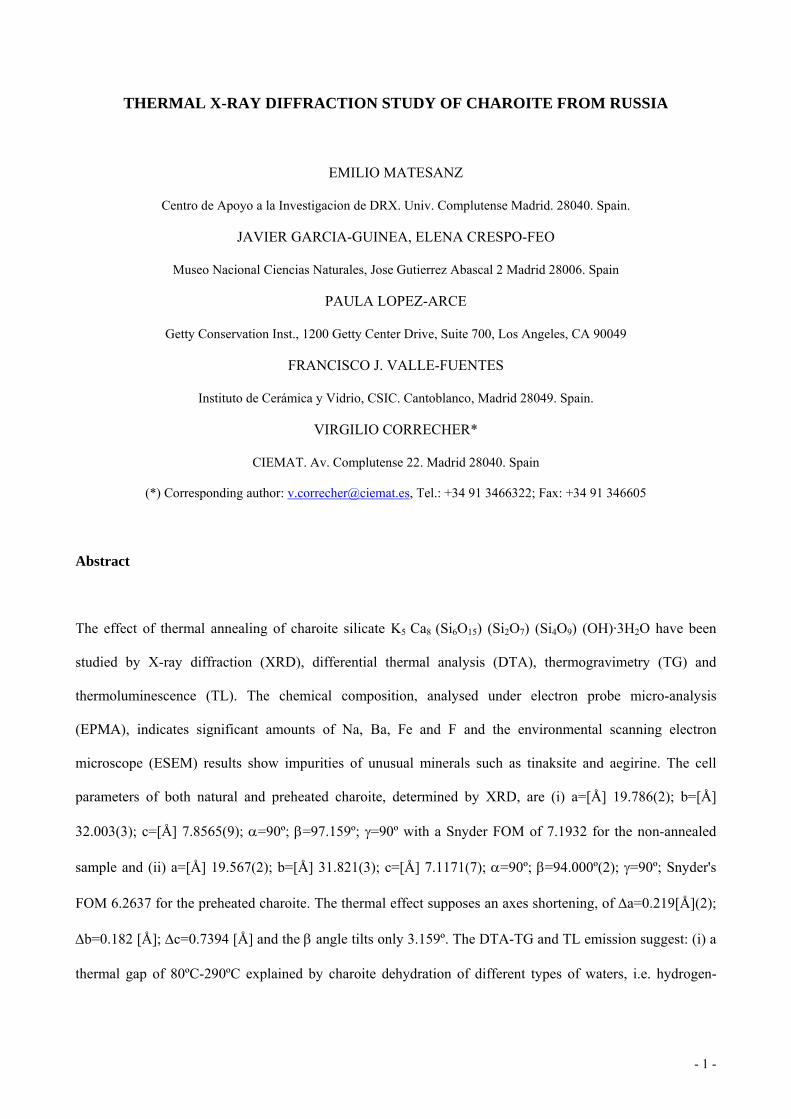
THERMAL X-RAY DIFFRACTION STUDY OF CHAROITE FROM RUSSIA
EMILIO MATESANZ
Centro de Apoyo a la Investigacion de DRX. Univ. Complutense Madrid. 28040. Spain.
JAVIER GARCIA-GUINEA, ELENA CRESPO-FEO
Museo Nacional Ciencias Naturales, Jose Gutierrez Abascal 2 Madrid 28006. Spain
PAULA LOPEZ-ARCE
Getty Conservation Inst., 1200 Getty Center Drive, Suite 700, Los Angeles, CA 90049
FRANCISCO J. VALLE-FUENTES
Instituto de Cerámica y Vidrio, CSIC. Cantoblanco, Madrid 28049. Spain.
VIRGILIO CORRECHER*
CIEMAT. Av. Complutense 22. Madrid 28040. Spain
(*) Corresponding author: [email protected], Tel.: +34 91 3466322; Fax: +34 91 346605
Abstract
The effect of thermal annealing of charoite silicate K5 Ca8 (Si6O15) (Si2O7) (Si4O9) (OH)·3H2O have been
studied by X-ray diffraction (XRD), differential thermal analysis (DTA), thermogravimetry (TG) and
thermoluminescence (TL). The chemical composition, analysed under electron probe micro-analysis
(EPMA), indicates significant amounts of Na, Ba, Fe and F and the environmental scanning electron
microscope (ESEM) results show impurities of unusual minerals such as tinaksite and aegirine. The cell
parameters of both natural and preheated charoite, determined by XRD, are (i) a=[Å] 19.786(2); b=[Å]
32.003(3); c=[Å] 7.8565(9); α=90º; β=97.159º; γ=90º with a Snyder FOM of 7.1932 for the non-annealed
sample and (ii) a=[Å] 19.567(2); b=[Å] 31.821(3); c=[Å] 7.1171(7); α=90º; β=94.000º(2); γ=90º; Snyder's
FOM 6.2637 for the preheated charoite. The thermal effect supposes an axes shortening, of Δa=0.219[Å](2);
Δb=0.182 [Å]; Δc=0.7394 [Å] and the β angle tilts only 3.159º. The DTA-TG and TL emission suggest: (i) a
thermal gap of 80ºC-290ºC explained by charoite dehydration of different types of waters, i.e. hydrogen-
- 1 -
bonded to the charoite lattice and non-bonded waters and (ii) the gap 290ºC-480ºC depicting a
dehydroxylation processes.
Keywords.- Charoite, structure, dehydration, X-ray Diffraction, differential thermal analysis,
thermogravimetry, thermoluminescence.
- 2 -
Introduction
Charoite forms at 200°-250°C by alteration of limestone in the presence of solutions emanating from the
Murun nephline syenite intrusion, one of the several Mesozoic potassic alkaline complexes located in the
Aldan shield of eastern Siberia complexes, in the south part of Olekminsk (Mitchell et al. 1994). The
complex formed by a magmatic evolution from alkaline ultrabasic to basic, intermediate, to peralkaline
granite and nepheline syenite by a long-term differentiation and vertical zonation of the alkaline magma
(Vladykin 2000). The chemical formula of charoite varies among different charoite outcrops, and it
commonly possesses inclusions of aegirine, feldspar, tinaksite and some other rather uncommon minerals.
The metasomatic rock also exhibits a complex association with unusual minerals such as charoite, canasite,
fedorite, ekanite, miserite, tinaksite, benstonite, tokkoite, murunskite, frankamenite and davanite, together
with other more common minerals such as pectolite, aegirine, microcline and quartz (Reguir 2001). Some the
characteristic features of the crystal structures of these unusual minerals (canasite, frankamenite, miserite,
tinaksite and tokkoite) have been reported by Rozhdestvenskaya & Nikishova (2002).
From a chemical point of view, the charoite phase is interesting as it contains large amounts of K, Na, Ca,
Ba, Sr, Br and F. This open lattice holds very different cations and is highly resistant to thermal dehydration,
though there are few investigations on the study of the thermal effect on the charoite samples. To the best of
our knowledge, only Kraeff et al. (1980) performed differential thermogravimetric analyses (DTA) of
charoite and showed two main steps circa 290ºC and 430ºC associated with the dehydration process. What is
well-known about this mineral is that there is (i) no aluminum (0.01%), (ii) only a small amount of sodium
(2%), (iii) hydroxyl groups, (iv) coexistence of large amounts of potassium (9.5%) and calcium (22%), and
(v) a purple colour attributed to its 0.1% of MnO and 0.01% of Fe2O3, it is of great interest to be studied by
thermoluminescence (TL). It is suggested that Mn2+ and Mn3+ ions are responsible for the colour and
luminescence emission of charoite (Reguir 2001). Charoite is a rare species, probably owing to the specific
chemical reaction between a limestone and an alkaline fluid subjected to unusual physical conditions of the
massif. The colour of charoite is described as a stunning purple forming a swirling pattern of interlocking
fibers. The International Mineralogical Association recently approved it as a new mineral in 1978, with the
- 3 -
formula K5 Ca8 (Si6O15) (Si2O7) (Si4O9) (OH)·3H2O (Rogova et al. 1978). It is included in the Dana
classification class 70.1.2.3 as chain-silicate column or tube structures with columnar silicate units of double
crankshaft chains, i.e., monoclinic P*/4 (pseudo-orthorhombic) 2/m. However, according to the publications
on charoite there is no an agreement to determine the unit-cell parameter values (Rogova et al. 1978;
Nikishova et al. 1984).
In this work, we focus on the thermal study of a well-characterised charoite. To this end, we employ (i) in
situ high-temperature X-ray diffraction (HTXRD), (ii) simultaneous thermo-differential thermal analysis and
thermogravimetry (DTA-TG) and (iii) thermoluminescence (TL) of natural aliquots of representative chips
of charoite.
Samples, experimental and analytical techniques
Charoite samples were selected from sets of high quality gemstone that come from Murun massif, in Siberia,
Russia. The colour of the charoite masses is intense purple, and the material forms a swirling pattern of
interlocking crystals. It shows strong anisotropy with white (K-feldspar) and black (aegirine) areas mixed
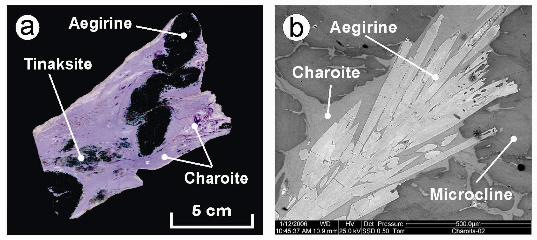
with the charoite. Analytical samples for the thermal measurements were chosen from the purple areas of
coarse micro-folds (Fig 1a). The morphology and composition of charoite crystals, and of the associated less
common minerals, were assessed under environmental scanning electron microscopy and energy dispersive
X-ray spectroscopy (EDS-ESEM) using a Philips XL30/40 EDS-ESEM (Fig. 1b). Polished specimens of
charoite were coated with graphite (20 nm) in a Bio-Rad SC515 sputter coating unit. The EPMA chemical
analyses of the charoite specimens and paragenetic phases is 58.5% SiO2, 0.03% Al2O3, 0.14% Fe2O3, 0.1%
MnO, 2.53% BaO, 21.9% CaO, 2.26 Na2O, 10.01% K2O, 0.02% TiO2, 0.03% P2O5, 0.33% F2, 0.02% Cl2 and
4.13% Lost of Ignition. These measurements were performed in a Jeol Superprobe JXA-8900M, with bulk
and channel-selected (TAP, PETJ, LIF, PETH) X-ray spectra. Natural standards and synthetic crystals from
the collection of the “Servicio de Microscopia Electronica Luis Bru”, Complutense University have been
used for this purpose.
- 4 -
The powder pattern of the minerals has been performed by XRD (powder method) in a Panalytical X’Pert
PRO Alpha1 diffractometer equipped with a Ge primary beam monochromator and a fast detector
X’Celerator (Cu Kα radiation, 45 kV, 40 mA). Patterns were obtained by continuous scanning from 1.5º2θ
to 70º2θ in steps of 0.02º 2θ. Maximum resolution conditions were used, being the intensity loss
compensated with long counting times. The effective counting time per step was 1725 s for charoite, and
3562 s for 710oC-preheated charoite. High-temperature powder X-ray diffraction patterns were recorded
between room temperature (RT) and 710ºC using a Panalytical X-Pert PRO MPD diffractometer (Cu Kα
radiation, 45 kV, 40 mA) equipped with a high- temperature Anton Paar HTK1200 camera and a fast
detector X’Celerator with Ni β filter. The Isothermal runs from 2º to 50º 2θ were measured at different in
situ temperatures, from RT to 710ºC (varying intervals of 20ºC and then back to RT after heating), with a
scan step size of 0.03º 2θ and a time per step of 49.3 s. The heating rate was 5ºC·min-1 and an additional
delay of 2 min was introduced before scanning to facilitate the temperature stabilization. Samples were
mounted on a standard alumina sample-holder for this camera (circular sample-holder with a cavity of 0.8
mm for front loading). The temperature was measured using a Pt-10% RhPt thermocouple. All experiments
were carried out in air.
Thermogravimetric and Differential Thermal analysis (TG-DTA) of 50.6 mg of sample was recorded with a
simultaneous TG-DTA-DSC thermal analyser (Setaram, Labsys CS 32-CS 332 Controller) also in air.
Thermal treatments were performed with a first heating gradient at a heating rate of 20ºC·min-1 from RT up
to 80º C, a second heating ramp at 10ºC·min-1 up to 1000ºC and an isothermal grade during 5 min at this last
temperature. The sample was packed in alumina crucible and the reference material was an empty alumina
crucible. The TL measurements of charoite were performed using an automated Risø TL system model TL
DA-12 (Botter-Jensen & Duller, 1992). This reader is provided with an EMI 9635 QA photomultiplier, and
the emission was observed through a blue filter (a FIB002 of the Melles-Griot Company) where the
wavelength is peaked at 320–480 nm. Full-width at half-maximum (FWHM) value is 80 ± 16 nm, and peak
transmittance (minimum) is 60%. The TL reader is also provided with a 90Sr/90Y source with a dose rate of
0.020 Gy·s−1 calibrated against a 60Co photon source, in a secondary standards laboratory (Correcher &
- 5 -
Delgado 1998). All the TL measurements were performed using a linear heating rate of 5ºC·s−1 from RT up
to 550ºC, in a N2 atmosphere. Several aliquots of 5.0±0.1mg of each charoite sample were used for each
measurement. The incandescent background was directly subtracted from the TL data. The sample was
carefully powdered with an agate pestle and mortar to avoid triboluminescence (Garcia-Guinea & Correcher
2000).
Discussion of the experimental results
X-Ray Diffraction of charoite aliquots.
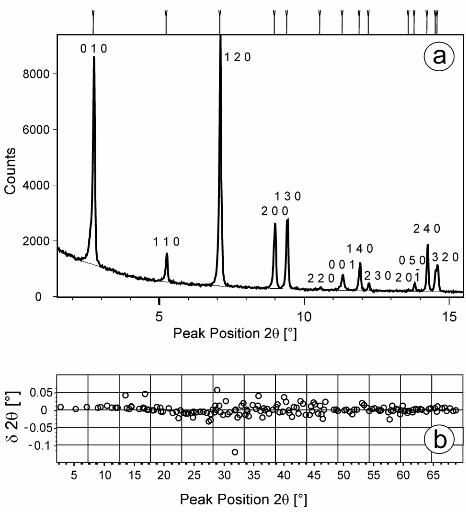
The Charoite phase identification was performed on an experimental XRD diffractogram recorded very
slowly using monochromatic radiation. The obtained results fit very well in the ICDD 42-1402 pattern that is
supported by previous results published by Rogova et al. (1978) and Fleischer (1978). However, several
lines of our experimental diffractogram that are not included in the ICDD 42-1402 file, but could be also
assigned to charoite (Figure 2). Cell parameters of charoite aliquots, natural and preheated up to 710ºC, were
determined from diffractograms collected at low speed with λ radiation of Cu Kα1 and the best resolution of
the XRD equipment. The indexing of charoite diffraction patterns, cell parameters and the spatial group test
were performed using DICVOL04 (Boultif & Louër 2004) program, included in the X’Pert Highscore Plus
v2.1b (Panalytical) sofware. It allows us to obtain the best explanation for the peak list based on the
calculated Figure of Merit (FOM) of Snyder (Smith & Snyder 1979), and the number of missing or
unexplained peaks.
The cell parameters were estimated taking into account the following sequence: (i) comparison of the list of
the peaks in the ICDD 42-1402 pattern with the cell parameter reported in the card, (ii) index the list of the
peaks obtained from the sample here studied by refining the cell parameters in the ICDD 42-1402 card, (iii)
indexing our list of peaks with published charoite cell parameters, i.e., a=(Å) 19.610; b=(Å) 32.120; c=(Å)
7.200; α=(°) 90.000; β=(°) 93.760; γ=(°) 90.000 (Nikishova et al. 1984) and (iv) ab-initio calculations.
- 6 -
(i) Testing the ICDD 42-1402, we found a good agreement between observed and calculated peak 2θ
angles computed for λ Cu Kα1 when compared to the proposed cell parameters, i.e., –0.1< δ2θ < +0.1. The
exception is the 11.35º peak (Figure 2) which remains quite distant from the theoretical value in accordance
with this card-file this peak matching the 040 orientation.
(ii) Using our experimental XRD data, the refinement of the ICDD 42-1402 cell displays a better FOM
compared to the card data; it could be also observe how the 11.34º peak moves circa 0.3º, out of the
calculated value.
(iii) Using the XRD data of cell-1 proposed by Nikishova et al. (1984) we obtain similar cell parameters in
comparison with those defined in the 42-1402 card and the 11.34º peak is also shifted. Conversely, using the
cell-2 data proposed by those authors many peaks misfit being an unacceptable solution.
(iv) The ab initio calculations using only our own results in DICVOL offer other cell refinement with a
better FOM, still close to the published data. Using DICVOL on the initial 40 peaks, a single result becomes
apparent: a=[Å] 19.786(2); b=[Å] 32.003(3); c=[Å] 7.8565(9); α=[°] 90; β=[°] 97.159(2); γ=[°] 90 with a
Snyder FOM of 7.1932. We suggest these cell parameters despite the small peak at 31.74º shifts 0.12º from
the theoretical value.
The test of all the possible spatial groups was estimated assuming that the indexing yielded the best results
using a primitive β-monoclinic cell. According to the FOM values, we determined that the more probable
spatial groups for charoite are P2, Pm, or P2/m which agrees with the published choices (Nikishova et al.
1984).
Similarly, the preheated charoite aliquot at 710ºC was analysed by XRD at RT under X-irradiation of λ Cu
Kα1. We propose the following cell refined parameters for this anhydrous charoite: a=[Å] 19.567(2); b=[Å]
31.821(3); c=[Å] 7.1171(7); α=90º; β=94.000º(2); γ=90º; Snyder's FOM 6.2637; Spatial groups P2, Pm,
P2/m. In addition of the obvious dehydration-dehydroxylation of charoite as the sample was heated from RT
to 710ºC; the axes shortening, as follows, show the irreversible thermal contraction of the charoite cell:
Δa=0.219[Å] (2); Δb=0.182 [Å]; Δc= 0.7394 [Å]. Meanwhile, angles α and γ remain orthogonal at 90º and β
- 7 -
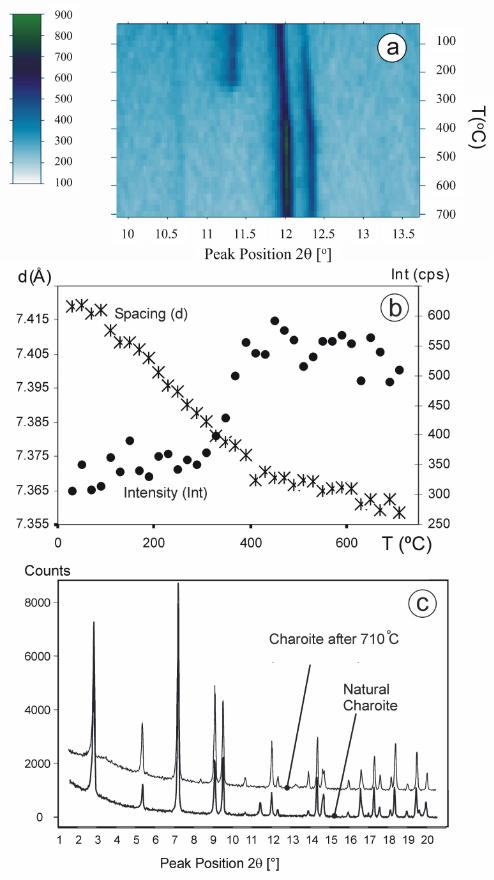
angle tilt only 3.159º. The in-situ thermal XRD profiles (Figs. 3a&b) reveal as the main crystallographic
orientation (001) of charoite disappear at ~240º. Additionally, for several peaks the trend of d-spacing vs
Temperature changes circa 380ºC, as shown in Figure 3b. This squeezing of the charoite lattice, from 240ºC
to 380ºC, supposes a re-orientation of the crystals due to the thermal annealing that could be linked to
dehydration-dehydroxylation processes.
TG-DTA and TL analyses of charoite.
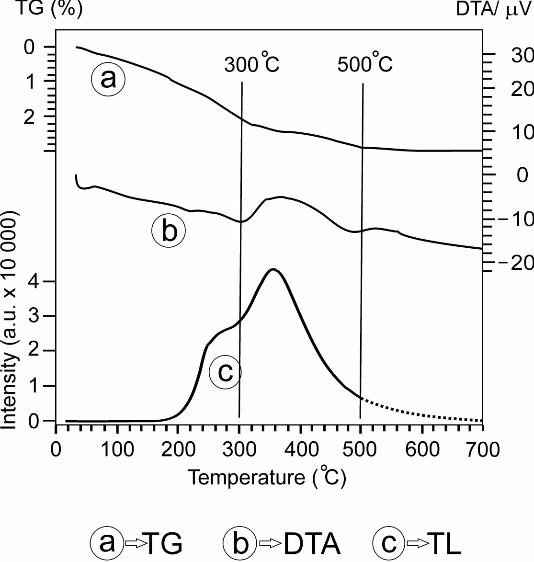
The endothermic peaks observed in the differential thermal analysis due to the heat absorption during
dehydration and dehydroxylation processes agree with the coupled thermogravimetric analyses (Figure 4).
The first endothermic peak at ~40ºC agrees with a first loss of mass due to the sample dehydration of
absorbed H2O. Although H2O loss is continuous between temperatures from ~40 to ~500ºC, three major
steps can be distinguished at 210, 290 and 480ºC (Fig. 4). We infer that the gap 80-290ºC may be charoite
dehydration of different types of H2O, i.e. hydrogen-bonded to the charoite lattice and non-bonded H2O.
Furthermore, the interval 290-480ºC should imply a different solid-state process of H2O losses, such as
dehydration-dehydroxylation step represented by the following features: (i) TG: slope changes at 290 and
500ºC, which could be interpreted as increasingly slow losses of H2O or OH by various structural
mechanisms; (ii) DTA endothermic peaks at 210, 290 and 480ºC, i.e., possible losses of H2O, and a clear
exothermic peak ~360ºC which can be explained by a reorientation of the crystals with the corresponding
structural axes shortening and slight modifications in the β angles; (iii) a TL glow curve peaked at ~250ºC
and ~360ºC which agrees with two crucial intervals of dehydration of possible hydrogen-bonded H2O (~210-
290ºC) and with a possible dehydroxylation processes (~290-480ºC) (Fig. 4). The thermal XRD profiles of
charoite show that the (001) peak vanishes circa ~240ºC in agreement with the TG-DTA and TL data. This
observation supports the hypothesis of H2O losses with well-built links to the charoite lattice, e.g., hydrogen
bonds.
In this sense, the use of the TL is of interest since supplies information, among others, on (i) trapped charge
recombination sites related to metastable defects inside the lattice (McKeever 1985), (ii) phase transitions
(Correcher et al. 2004a) or (iii) consecutive breaking and linking of bonds including redox reactions,
- 8 -
dehydroxylation and dehydration processes (Correcher et al. 2004b). This property is based on the emission
of light from a dielectric solid sample (insulator or semiconductor) when it is heated after being exposed to
ionising radiation such as X-rays, gamma rays, beam of electrons, etc. (McKeever 1985). During the
analytical heating, the TL signal is registered by a photomultiplier tube and recorded as a function of
temperature or wavelength as a TL glow curve. The spectra of the minerals can be compared to characterise
the emission bands that are associated with the presence of different impurities, e.g. Mn ions giving rise to
the green emission or Fe centers producing the red waveband (Brooks et al. 2002; Finch et al. 2003; Garcia-
Guinea et al. 1999). Luminescence techniques are also used to study the types and spatial distribution of
point defects in natural minerals, e.g., diamonds, and detecting post-growth ionizing irradiation with further
low-temperature annealing in natural conditions (Chakhmouradian et al. 2002).
The origin of the UV-blue 380ºC TL of charoite, with an intensity of 40,000 a.u., (arbitrary units) could be
explained assuming that: (i) some orientations of the charoite lattice suffer stress during the irreversible
dehydration-dehydroxylation ending at 380ºC; (ii) charoite invariably displays a blue luminescence
(Gorobets & Rogojine 2002); (iii) the 340 nm emission peak is very common in the luminescence spectra of
silicates (silica, feldspars, feldspathoids, etc.) in which their 3D-framework silicon-oxygen lattices are
stressed. These Si-O strained structures include some non-bridging oxygen (NBOCs) or silicon vacancy-hole
centres and Si-O bonding defects, which seem to be responsible for this common 340 nm emission. One can
therefore speculate that charoite structure includes such centres. (iv) many Si-O bonds suffer an additional
stress due to different processes, namely dehydration or dehydroxylation or both, involving losses of H2O,
with hydrogen atoms bonded to the lattice, or breaking of hydroxyl groups, also bonded to the silicate lattice.
(v) The charoite composition has silicon and calc-alkali ions such as K and Ca, but little Al, for this reason,
we minimize the importance of [AlO4]º/alkali centres producing the blue emission at ~400 nm. These
processes, observed in other hydrolysed minerals, are interpreted as being due to a continuum in the trap
distribution or to the existence of a tunnelling recombination process in coincidence with the de-
hydroxylation temperature of charoite (Correcher et al. 2008).
- 9 -
The mechanism that induces the 340 nm emission could be due to a combination of NOBCs (generated from
surface hydroxyls groups charge) and the vibrational absorption of a SiO2 network containing water (Yao et
al. 2001). Anneda et al., (2003) could observe how the UV emission does not depend on the chemical
composition of the samples but is related to the chemical and the physical states of the surfaces. They
concluded that such emission increases significantly with the increase of OH groups adsorbed on the surface
of porous silica.
Conclusions
1. The EPMA and ESEM analyses of the charoite masses display aegirine, tinaksite and microcline. Despite
the complex paragenesis, we were able to extract grains of charoite with a reasonable purity (or highly
homogeneous) that is corroborated since the behaviour of the aliquots chemically studied under EPMA and
structurally under XRD, DTA-TG and TL is quite consistent, i.e. there are no significant deviations of the
measurements.
2. The cell parameters of natural charoite have been determined by means of XRD using the initial 40 peaks.
The estimated values are: a=[Å] 19.786(2); b=[Å] 32.003(3); c=[Å] 7.8565(9); α=[°] 90; β=[°] 97.159(2);
γ=[°] 90 with a Snyder FOM of 7.1932. We could appreciate how the little peak at 31.74º shifts 0.12º from
the theoretical calculation. Preheated charoite at 710ºC was also analysed by XRD at RT under X irradiation
of λ Cu Kα1 with the following results: a=[Å] 19.567(2); b=[Å] 31.821(3); c=[Å] 7.1171(7); α=90º;
β=94.000º(2); γ =90º; with a Snyder FOM of 6.2637. The thermal expansion of the charoite cell showed an
axes shortening, Δa=0.219[Å] (2); Δb=0.182 [Å]; Δc=0.7394 [Å] whilst angles α and γ remain orthogonal at
90º and β angle tilts only 3.159º. Possible spatial groups for both preheated and non-preheated charoite are
P2, Pm, ó P2/m in good agreement with the literature.
3. The TG-DTA analyses show: (1) the gap 80ºC-290ºC could be associated with charoite dehydration of
different types of waters, i.e. hydrogen-bonded to the charoite lattice and non-bonded waters; (2) the interval
- 10 -
290ºC-480ºC could be linked to dehydroxylation processes. The TL glow curves display a maximum peaked
at 250ºC and 360ºC which agree with two crucial intervals of dehydration of possible hydrogen-bonded
waters (~210ºC-290ºC) and with a possible dehydroxylation processes (~250ºC-380ºC). The high blue TL
intensity of the sample is attributed to the charoite strained structure including possible non-bridging oxygen,
silicon vacancy-hole centres and Si-O bonding defects which seem to be responsible of this common 340 nm
emission in stressed silicates.
Acknowledgements
This work has been supported by CAM (06/0134/2003), MCYT (BQU2003-08531-C02-01); CICYT
(FIS2007-61823) and Comunidad Autonoma de Madrid (CAM) MATERNAS-S-0505/MAT/0094 projects.
Author Emilio Matesanz is working under a contract supported by the FSE by the Spanish MCyT. Thanks
are also due to Martin Fernandez Hernan for the valuable help in the charoite samples provide.
References
ANEDDA, A., CARBONARO, C.M., CLEMENTE, F., CORPINO, R., RAGA & F., SERPI A. (2003):
Ultraviolet excitation of photoluminescence of porous silica under vacuum conditions. J. Non-Cryst. Solids
322 (1-3), 95-99.
BØTTER-JENSEN, L. & DULLER, G.A.T. (1992): A new system for measuring OSL from quartz samples.
Nucl. Tracks Radiat. Meas. Part D. 20, 549-553.
BOULTIF, A. & LOUËR, D. (2004): Powder pattern indexing with the dichotomy method, J. Appl. Cryst.
37, 724 - 731.
BROOKS, R.J., FINCH A.A., HOLE D.E., TOWNSEND P.D. & WU ZL. (2002): The red to near-infrared
luminescence in alkali feldspar. Contrib. Mineral. Petr. 143 (4), 484-494.
- 11 -
CHAKHMOURADIAN, A.R., REGUIR, E.P. & MITCHELL R.H. (2002): Strontium-apatite: New
occurrences, and the extent of Sr-for-Ca substitution in apatite-group minerals. Can. Mineral. 40, 121-136.
CORRECHER, V. & DELGADO, A. (1998): On the use of natural quartz as transfer dosimeter in
retrospective dosimetry. Radiat. Meas. 29(3-4), 411-414.
CORRECHER, V., GARCIA-GUINEA, J., LOPEZ-ARCE, P. & GOMEZ-ROS, J.M. (2004a): Luminescence
emission spectra in the temperature range of the structural phase transitions of Na2SO4. Spectrochim Acta A. 60,
1431-1438.
CORRECHER, V., GOMEZ-ROS, J.M., GARCIA-GUINEA, J. & DELGADO, A. (2004b):
Thermoluminescence kinetic parameters of basaltic rock samples due to continuous trap distribution. Nucl.
Instrum. Meth. A. 528, 717-720.
CORRECHER, V., GOMEZ-ROS, J.M., GARCIA-GUINEA, J., LIS, M. & SANCHEZ-MUÑOZ, L. (2008)
Calculation of the activation energy in a continuous trap distribution system of a charoite silicate using initial
rise and TL glow curve fitting methods. Radiat. Meas. 43, 269-272.
FINCH, A.A., HOLE, D.E. & TOWNSEND, P.D. (2003): Orientation dependence of luminescence in
plagioclase. Phys Chem Miner 30 (6), 373-381.
FLEISCHER, M. (1978): New mineral names. Am. Miner. 63, 1289-1291.
GARCIA-GUINEA, J. & CORRECHER, V. (2000): Luminescence spectra of alkali feldspars: Influence of
crushing on the ultraviolet emission band. Spectrosc. Lett. 33, 103-113.
GARCIA-GUINEA, J., TOWNSEND, P.D., SANCHEZ-MUÑOZ, L. & ROJO, J.M. (1999): Ultraviolet-
blue Ionic Luminescence of Alkali Feldspars from Bulk and Interfaces. Phys. Chem. Minerals, 26, 658-667.
- 12 -
GOROBETS, B.S. & ROGOJINE, A.A. (2002): Luminescent spectra of minerals. Publ. Ed. RPC VIMS.
Moscow. 283 pp.
KRAEFF, A., POORTER, R.P.E. & SCHUILING, R.D. (1980): Additional information on charoite. N.Jb.
Miner.Mh. H11, 498-500.
MCKEEVER, S. W. S. (1985): Thermoluminescence of solids. Cambridge University Press, New York.
MITCHELL. R.H., SMITH, C.B. & VLADYKIN, N.V. (1994): Isotopic composition of strontium and
neodymium in potassic rocks of the Little Murun complex, Aldan Shield, Siberia. Lithos, 32, 243-248
NIKISHOVA, L.V., LAZEBNIK, Y.D. & LAZEBNIK, K.A. (1984): New data on charoite. Acta
Crystallogr. A 40, Suppl., S C246-C246.
REGUIR, E. (2001): Aspects of the mineralogy of the Murun alkaline complex, Yakutia, Russia. M.Sc. Dept.
Geol. Lakehead University, Thunder Bay (Ontario, Canada) (0-612-60867-0).
ROGOVA, V. P., ROGOV, Y. G., DRITS, V. A. & KUZNETSOVA, N. N. (1978): Charoite, a new mineral,
and a new jewellery stone. Zapiski Vses. Mineralog. Obshch., 107, 94-100 (in Russian).
ROZHDESTVENSKAYA, I.V. & NIKISHOVA, L.V. (2002) Crystallochemical characteristics of alkali
calcium silicates from charoitites. Crystallogr. Rep. 47(4) 545-554.
SMITH, G.S. & SNYDER, R.L. (1979): Fn, Cell parameters were analysed by the X’Pery HighScore Plus
software using the Figure of Merit of Snyder a Criterion for Rating Powder Diffraction Patterns and
Evaluating the Reliability of Powder Indexing, J. Appl. Cryst. 12, 60-65.
- 13 -
VLADYKIN, N.V. (2000): The Malyi Murun volcano-plutonic complex: An example of differentiated
mantle magmas of lamproitic type. Geochem. Int. 38, S73-S83, Suppl. 1.
YAO, B.D., SHI, H.Z., ZHANG, X.Y. & ZHANG, L.D. (2001): Ultraviolet photoluminescence from
nonbridging oxygen hole centers in porous silica. Appl. Phys. Lett. 78 (2), 174-176.
- 14 -
- 15 -
FIGURE CAPTIONS
Figure 1.- (a) Charoite rock specimen with black masses of aegirine and yellow spots of tinaksite; (b) ESEM
image with aegirine crystals, charoite masses and K-feldspar.
Figure 2.- (a) Indexation of a X-ray diffractogram of natural charoite taken at room temperature. (b) Plot δ2θ
versus 2θ positions of this natural charoite.
Figure 3.- (a) Contour plot detail depicting the in-situ difractograms of charoite, note the vanishing of the
peak 11.2 (2θ) at circa 240ºC. (b) Plots temperature versus spacing and versus intensity of the XRD (140)
peak (c) A comparative plot of both XRD diffractogram natural and 710oC preheated charoite.
Figure 4.- (a) Thermogravimetric (TG), (b) Differential Thermal Analysis (DTA) and (c)
Thermoluminescence (TL) response of natural Charoite