Embed Size (px)
Citation preview
Christian Carbogno and Matthias Scheffler
IPAM Workshop “Energy Conservation and Waste Heat Recovery” – 18th-22nd November 2013
FRITZ-HABER-INSTITUT DER MAX-PLANCK-GESELLSCHAFT,
BERLIN - GERMANY
THERMAL TRANSPORT FROM FIRST PRINCIPLES
electronsphonons
rT
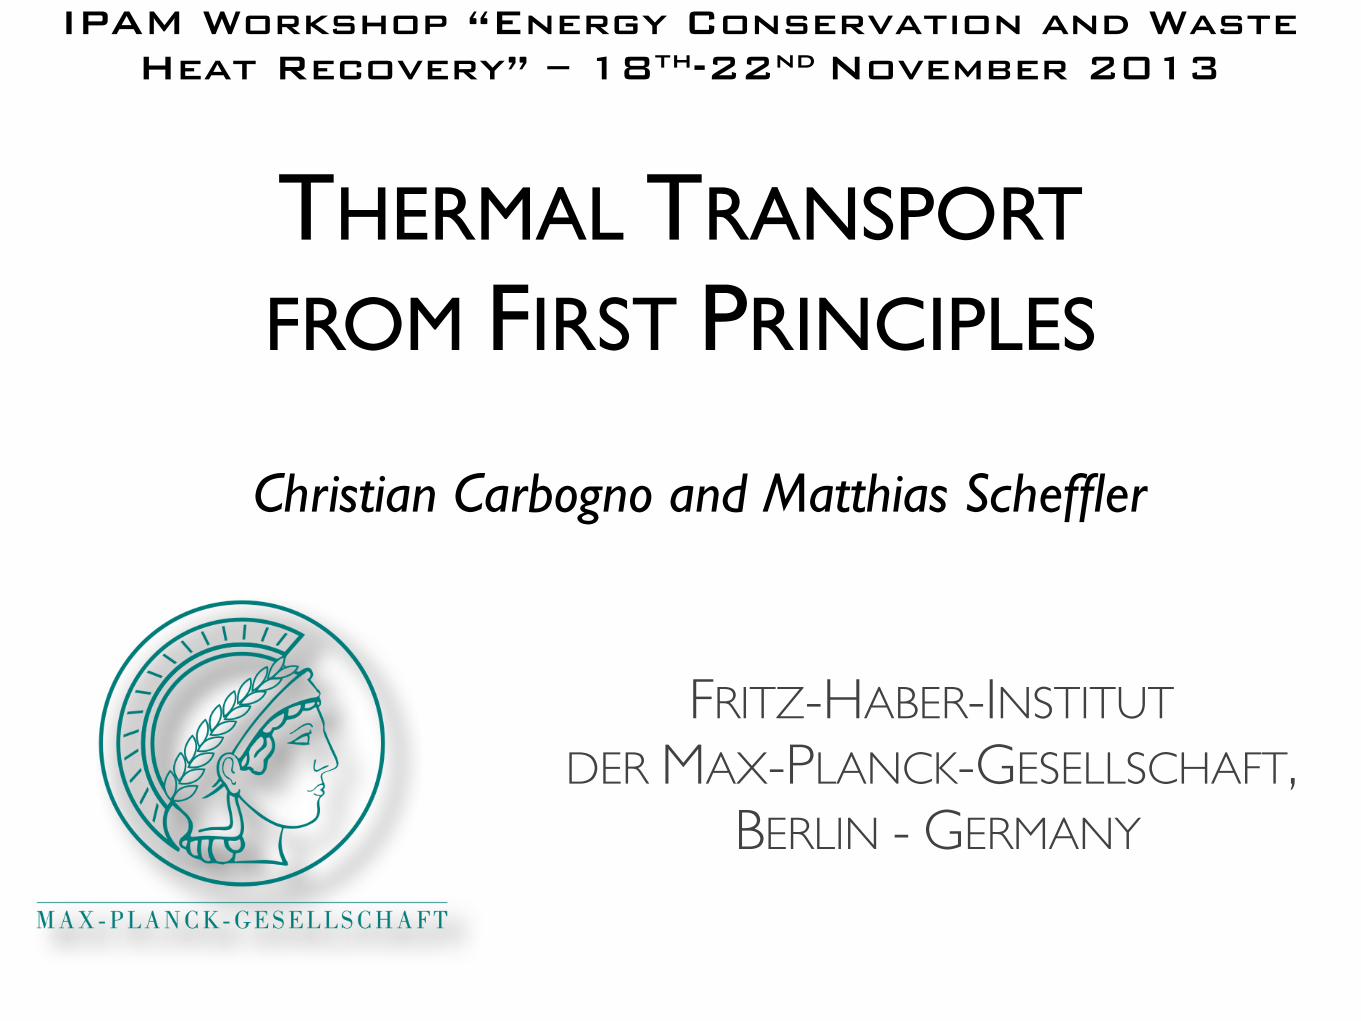
Jh = � (ph + el)rT
rU = �SelrT
Jq = ��elrU=) zT =
S2el �el T
ph + el
The Thermoelectric Effect
Efficiency: figure of merit
Jh
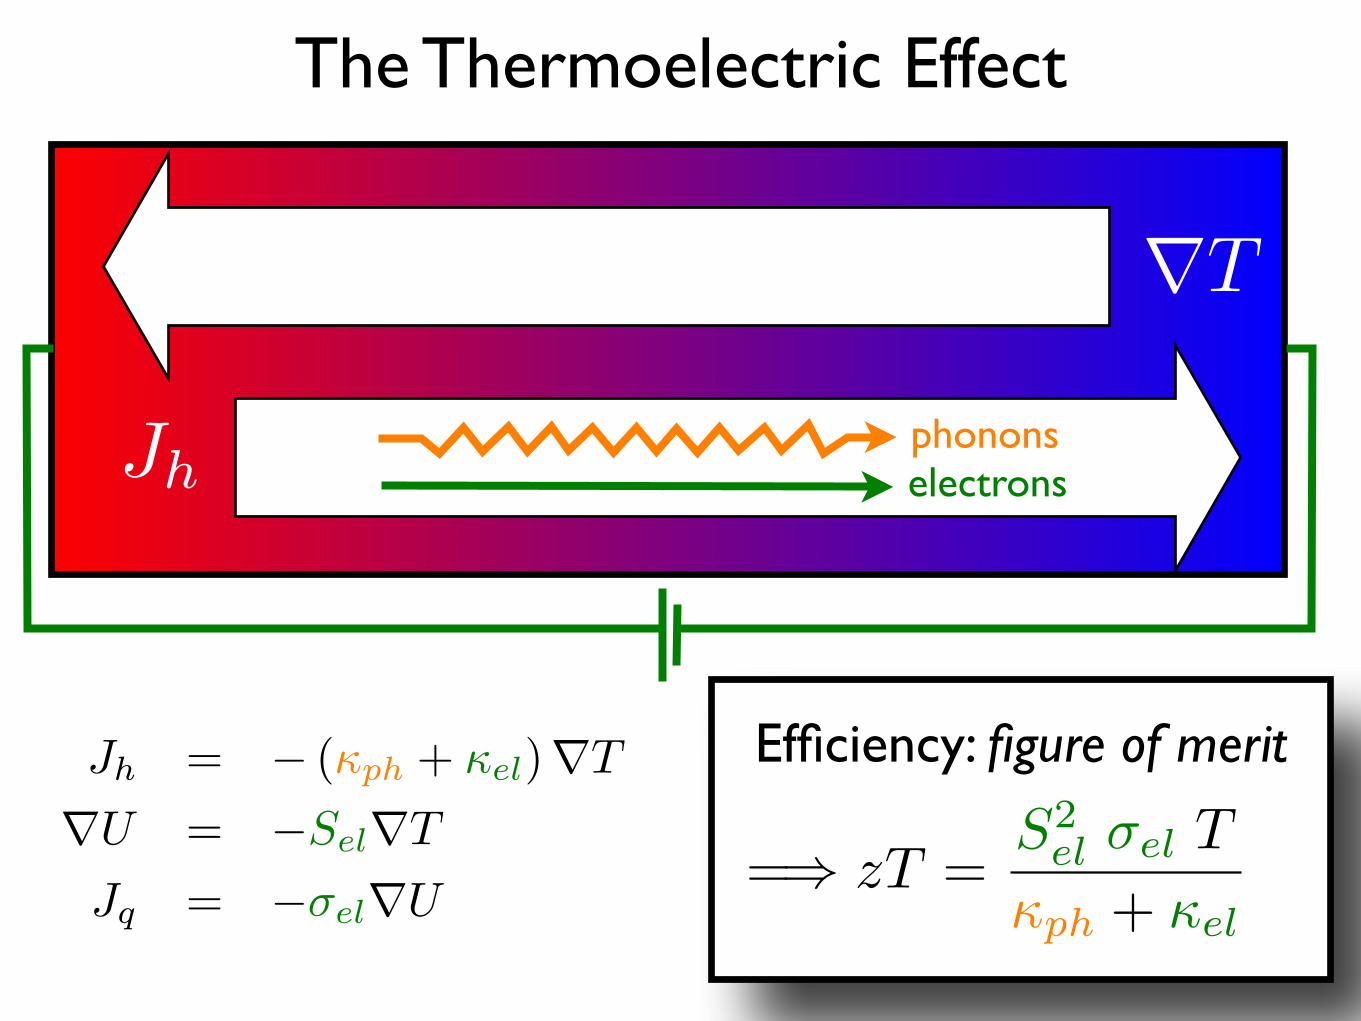
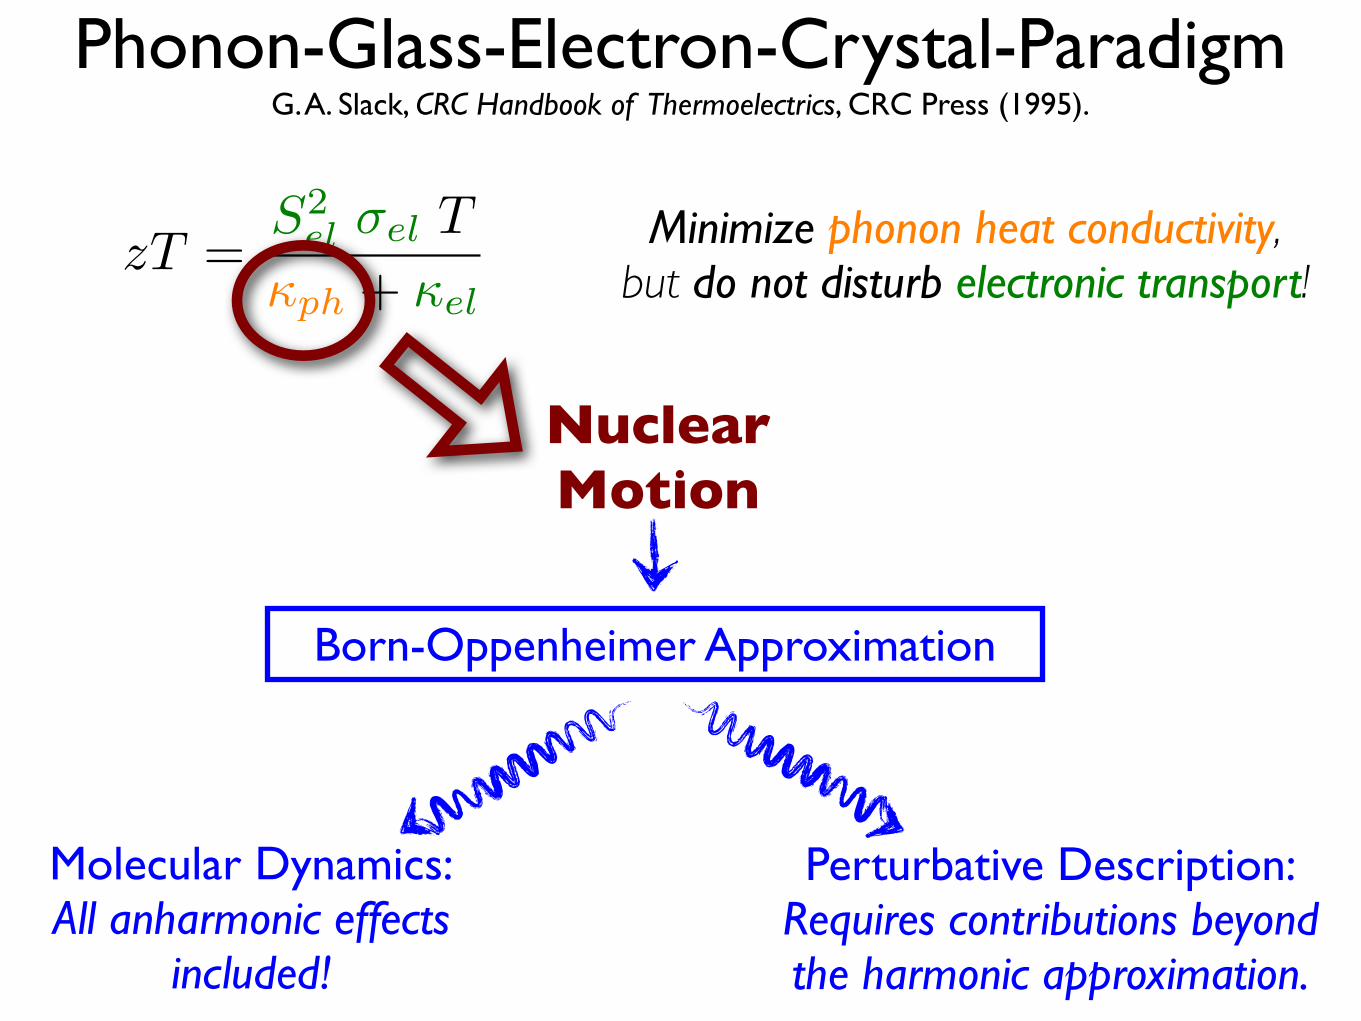
Phonon-Glass-Electron-Crystal-ParadigmG. A. Slack, CRC Handbook of Thermoelectrics, CRC Press (1995).
zT =S2el �el T
ph + el
Minimize phonon heat conductivity,but do not disturb electronic transport!
Nuclear Motion
?Born-Oppenheimer Approximation
Molecular Dynamics Perturbative Description
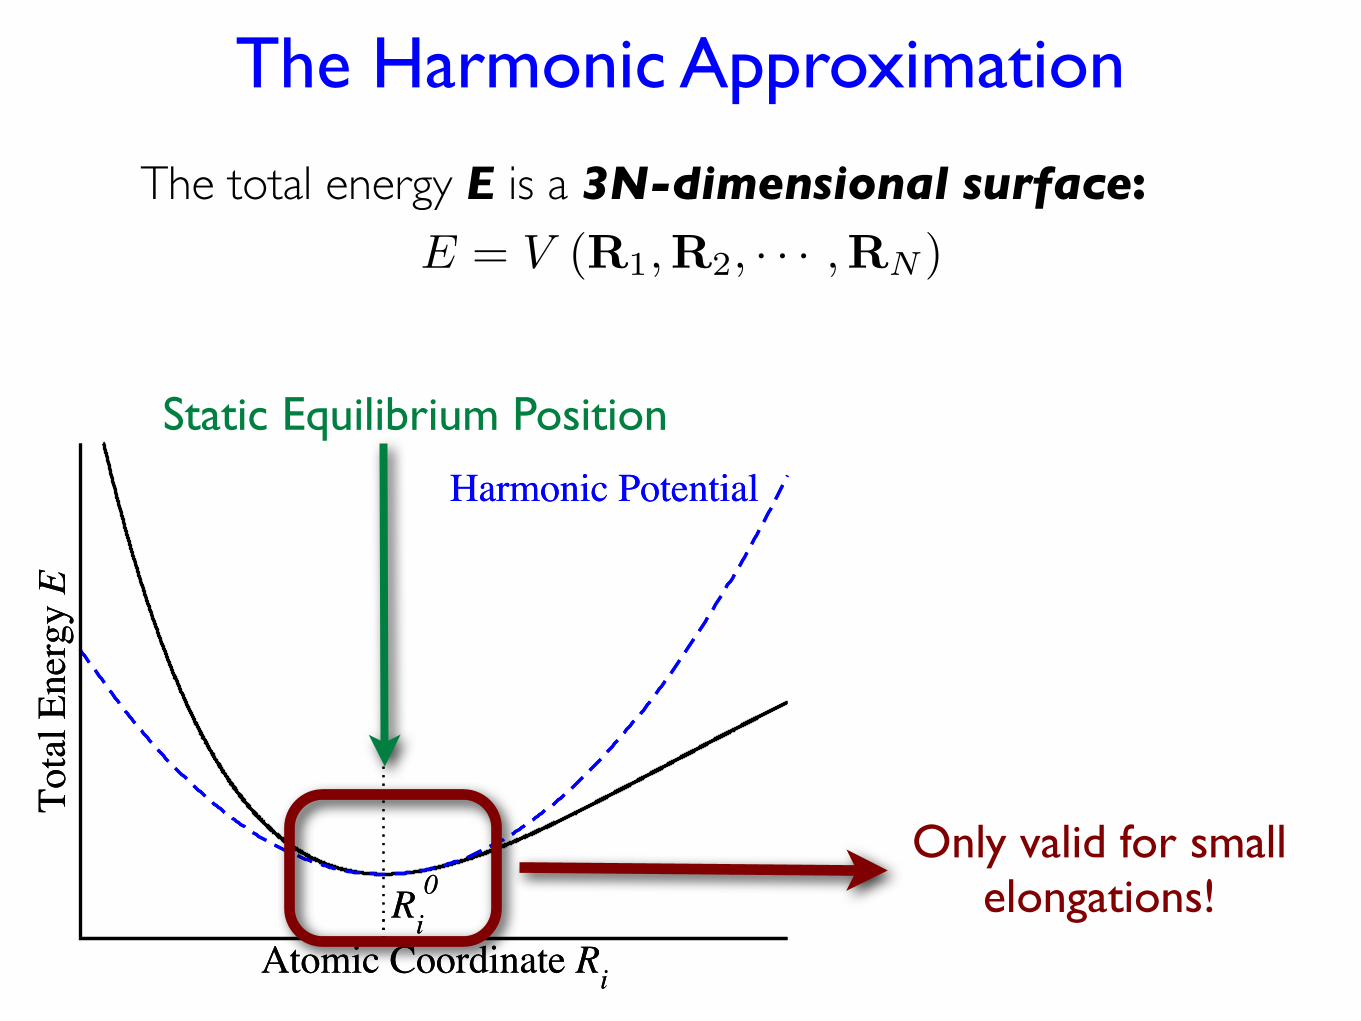
Atomic Coordinate Ri
Tota
l Ene
rgy E
Harmonic Potential
Ri0
Atomic Coordinate Ri
Tota
l Ene
rgy E
Harmonic Potential
Ri0
The total energy E is a 3N-dimensional surface:
Only valid for smallelongations!
E = V (R1,R2, · · · ,RN )
Static Equilibrium Position
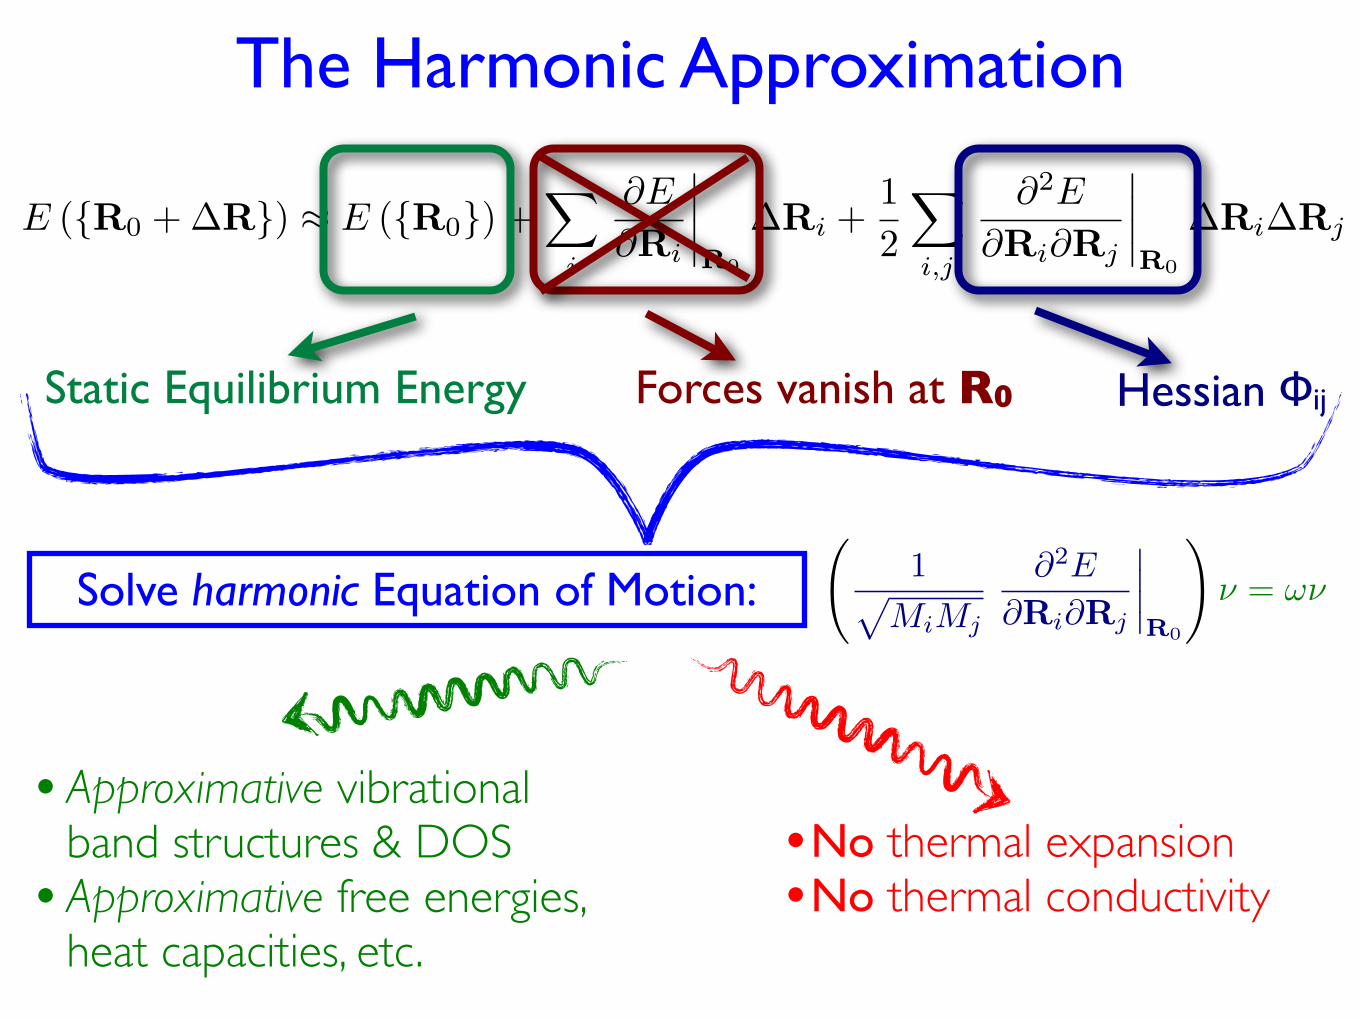
The Harmonic Approximation
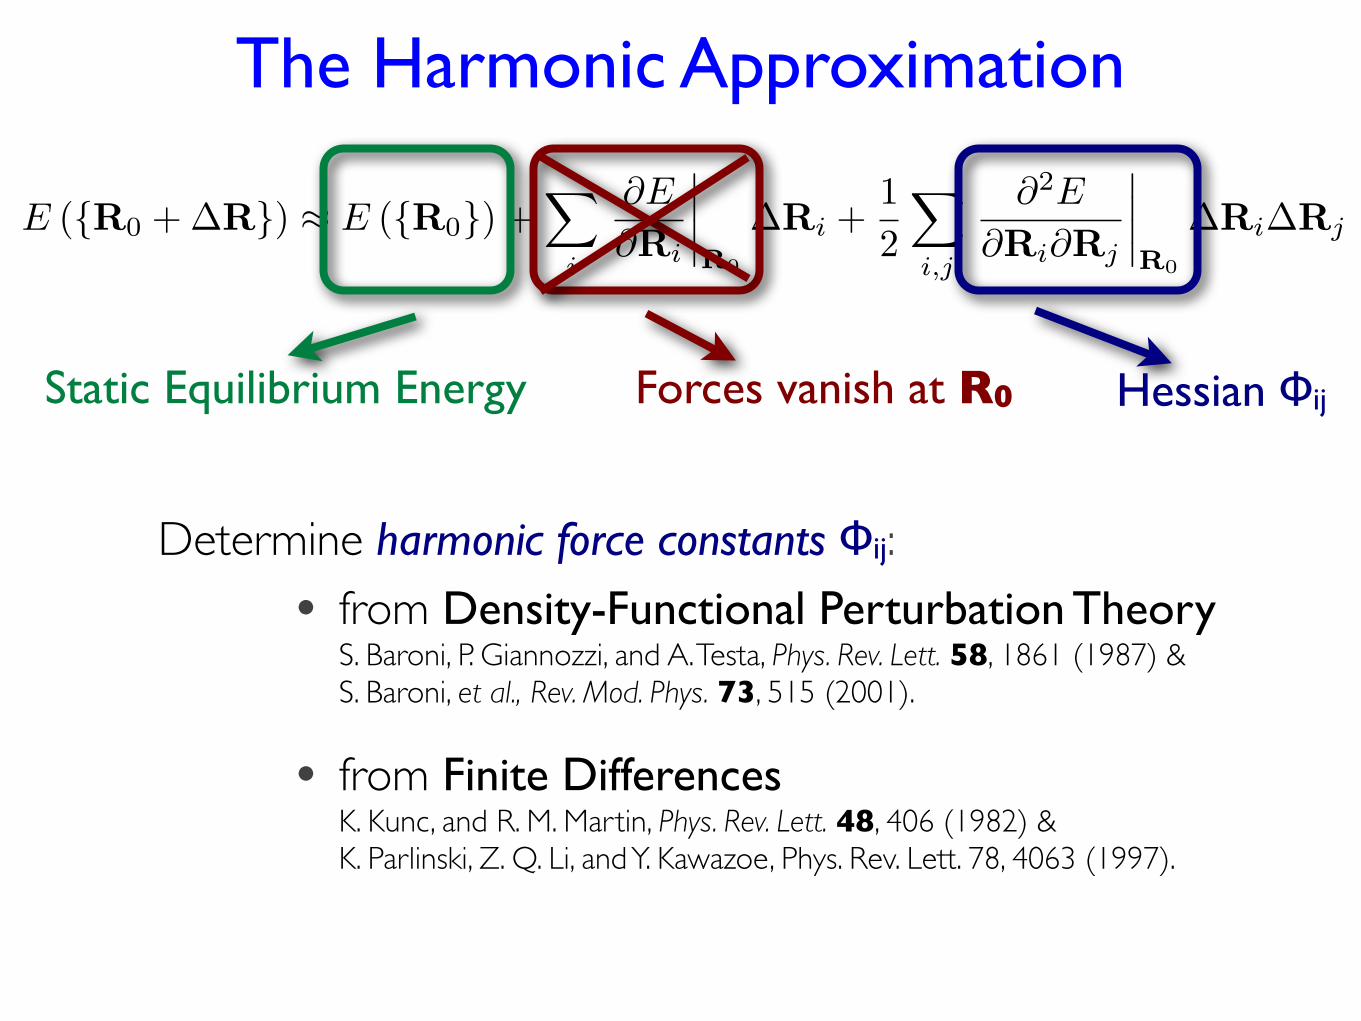
E ({R0 + �R}) ⇡ E ({R0}) +X
i
@E
@Ri
����R0
�Ri +12
X
i,j
@2E
@Ri@Rj
����R0
�Ri�Rj
Static Equilibrium Energy Forces vanish at R0 Hessian Φij
The Harmonic Approximation
Determine harmonic force constants Φij:• from Density-Functional Perturbation Theory
S. Baroni, P. Giannozzi, and A. Testa, Phys. Rev. Lett. 58, 1861 (1987) &S. Baroni, et al., Rev. Mod. Phys. 73, 515 (2001).
• from Finite DifferencesK. Kunc, and R. M. Martin, Phys. Rev. Lett. 48, 406 (1982) &K. Parlinski, Z. Q. Li, and Y. Kawazoe, Phys. Rev. Lett. 78, 4063 (1997).
E ({R0 + �R}) ⇡ E ({R0}) +X
i
@E
@Ri
����R0
�Ri +12
X
i,j
@2E
@Ri@Rj
����R0
�Ri�Rj
Static Equilibrium Energy Forces vanish at R0 Hessian Φij
The Harmonic Approximation
•Approximative vibrational band structures & DOS
•Approximative free energies, heat capacities, etc.
•No thermal expansion•No thermal conductivity
Solve harmonic Equation of Motion:
1pMiMj
@2E
@Ri@Rj
����R0
!⌫ = !⌫
ph
ph
ph
E
R
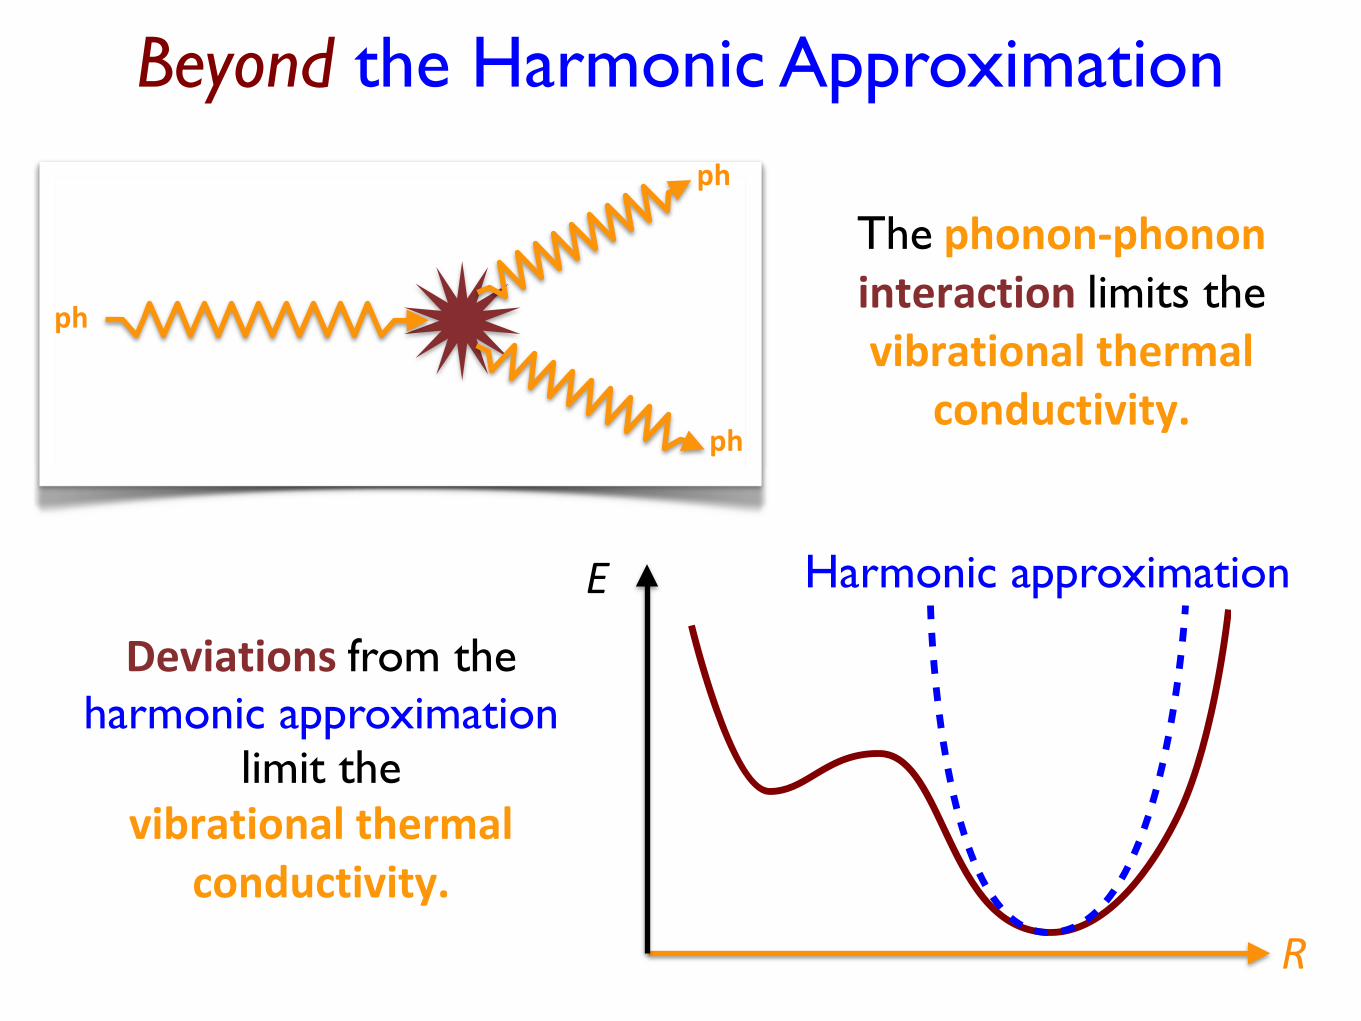
The#phonon&phonon#interaction#limits the vibrational#thermal#
conductivity.
Harmonic approximation
Deviations#from the harmonic approximation
limit the vibrational#thermal#
conductivity.
Beyond the Harmonic Approximation
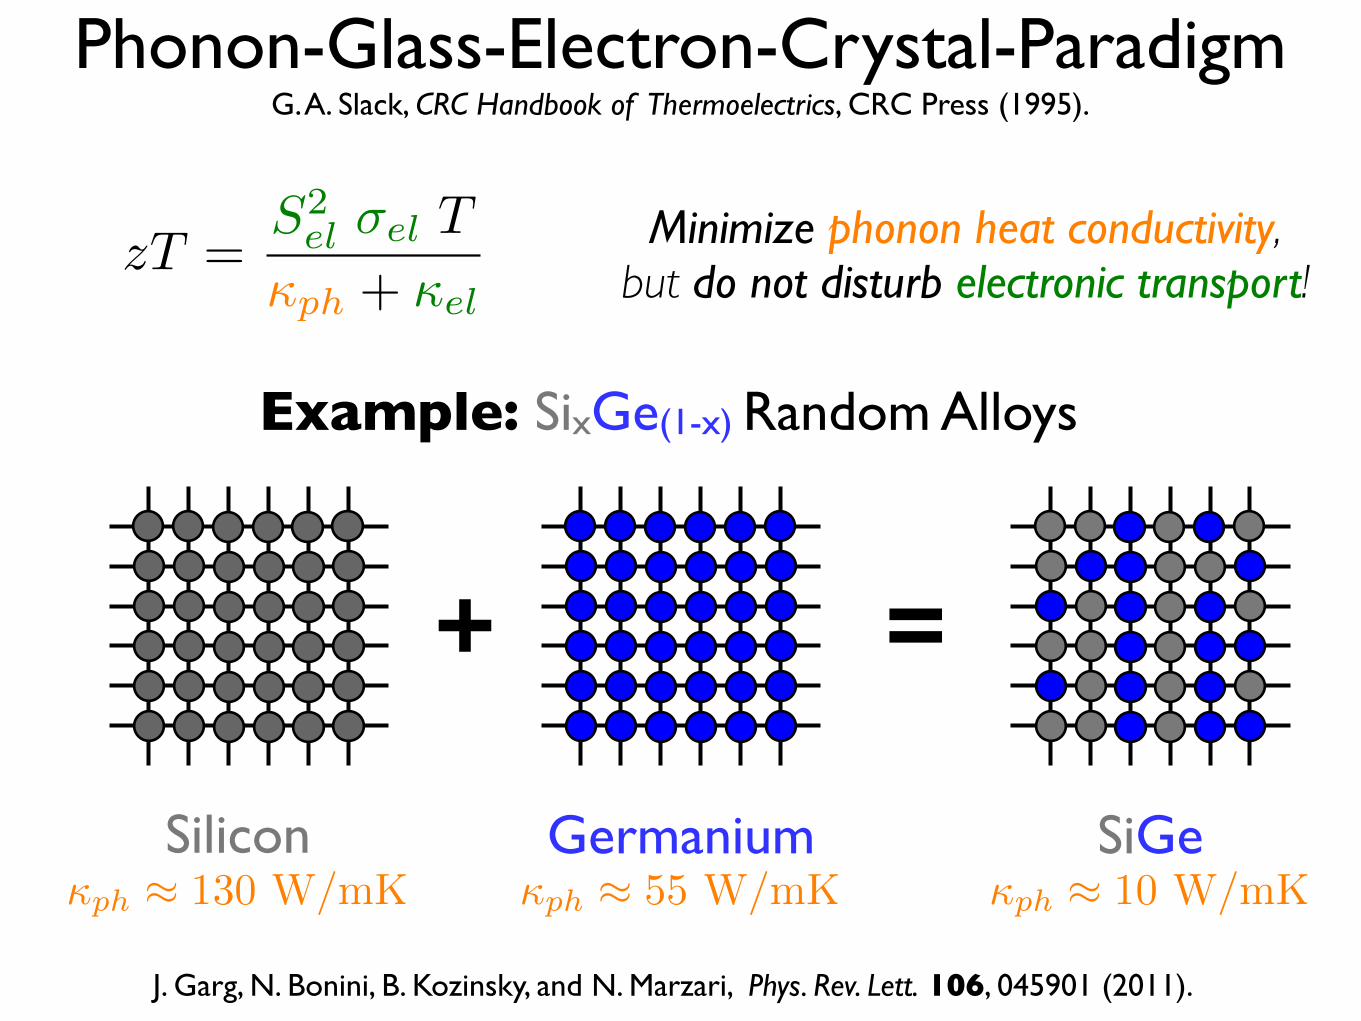
Phonon-Glass-Electron-Crystal-ParadigmG. A. Slack, CRC Handbook of Thermoelectrics, CRC Press (1995).
zT =S2el �el T
ph + el
Minimize phonon heat conductivity,but do not disturb electronic transport!
Nuclear Motion
Born-Oppenheimer Approximation
Molecular Dynamics:All anharmonic effects
included!
Perturbative Description:Requires contributions beyondthe harmonic approximation.
zT =S2el �el T
ph + el
Minimize phonon heat conductivity,but do not disturb electronic transport!
Example: SixGe(1-x) Random Alloys
+ =
Silicon Germanium SiGeph ⇡ 130 W/mK ph ⇡ 55 W/mK ph ⇡ 10 W/mK
J. Garg, N. Bonini, B. Kozinsky, and N. Marzari, Phys. Rev. Lett. 106, 045901 (2011).
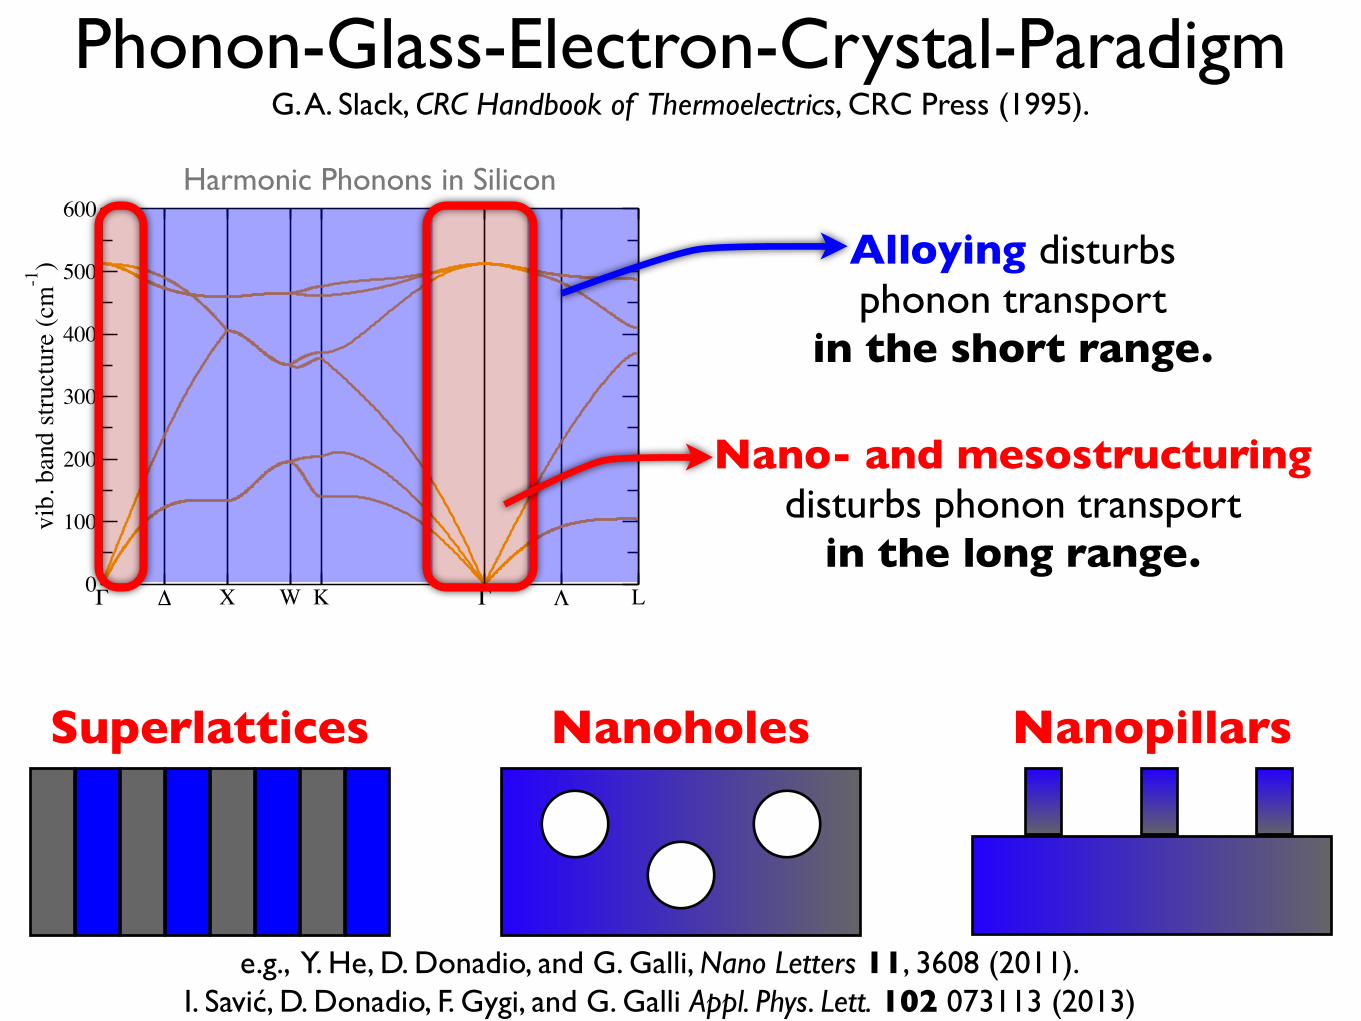
Phonon-Glass-Electron-Crystal-ParadigmG. A. Slack, CRC Handbook of Thermoelectrics, CRC Press (1995).
Phonon-Glass-Electron-Crystal-ParadigmG. A. Slack, CRC Handbook of Thermoelectrics, CRC Press (1995).
Γ ∆ X W K Γ Λ L0
100
200
300
400
500
600
vib.
ban
d str
uctu
re (c
m-1
)
Harmonic Phonons in Silicon
Nano- and mesostructuring disturbs phonon transport
in the long range.
Superlattices Nanoholes Nanopillars
Alloying disturbs phonon transport
in the short range.
e.g., Y. He, D. Donadio, and G. Galli, Nano Letters 11, 3608 (2011).I. Savić, D. Donadio, F. Gygi, and G. Galli Appl. Phys. Lett. 102 073113 (2013)
Phonon-Glass-Electron-Crystal-ParadigmG. A. Slack, CRC Handbook of Thermoelectrics, CRC Press (1995).
Superlattices Nanoholes Nanopillars
Γ ∆ X W K Γ Λ L0
100
200
300
400
500
600
vib.
ban
d str
uctu
re (c
m-1
)
Harmonic Phonons in Silicon
Nanostructuring disturbs phonon transport
in the long range.
Alloying disturbs phonon transport
in the short range.
LETTERdoi:10.1038/nature11439
High-performance bulk thermoelectrics withall-scale hierarchical architecturesKanishka Biswas1{, Jiaqing He1,2{, Ivan D. Blum2, Chun-I Wu3, Timothy P. Hogan3, David N. Seidman2, Vinayak P. Dravid2
& Mercouri G. Kanatzidis1,4
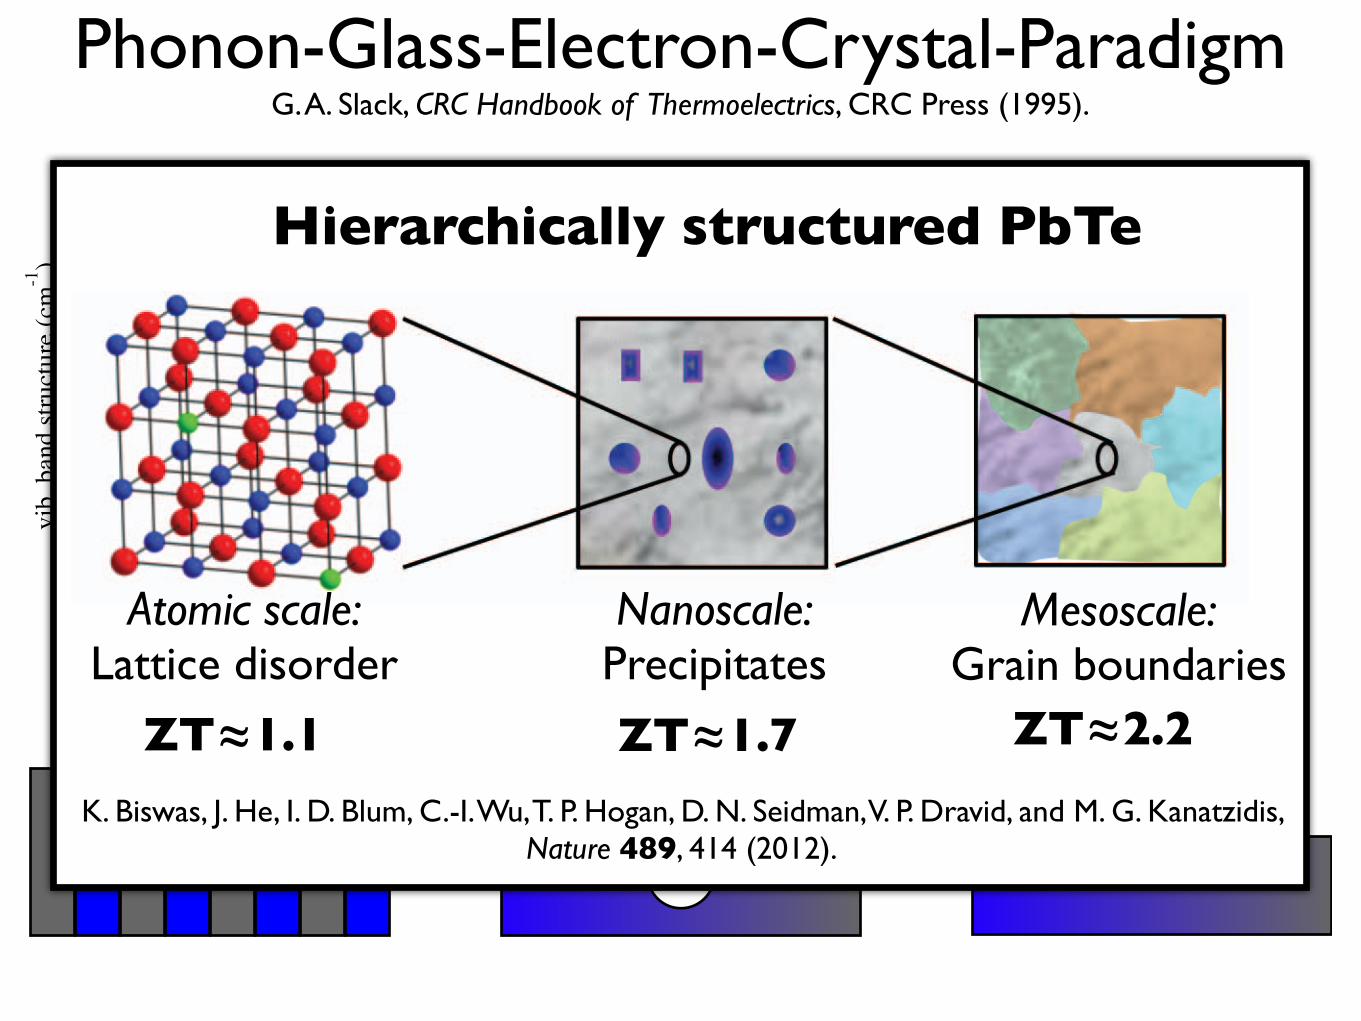
With about two-thirds of all used energy being lost as waste heat,there is a compelling need for high-performance thermoelectricmaterials that can directly and reversibly convert heat to electricalenergy. However, the practical realization of thermoelectric materialsis limited by their hitherto low figure of merit, ZT, which governs theCarnot efficiency according to the second law of thermodynamics.The recent successful strategy of nanostructuring to reduce thermalconductivity has achieved record-high ZT values in the range 1.5–1.8at 750–900 kelvin1–3, but still falls short of the generally desiredthreshold value of 2. Nanostructures in bulk thermoelectrics alloweffective phonon scattering of a significant portion of the phononspectrum, but phonons with long mean free paths remain largelyunaffected. Here we show that heat-carrying phonons with longmean free paths can be scattered by controlling and fine-tuning themesoscale architecture of nanostructured thermoelectric materials.Thus, by considering sources of scattering on all relevant length scalesin a hierarchical fashion—from atomic-scale lattice disorder andnanoscale endotaxial precipitates to mesoscale grain boundaries—we achieve the maximum reduction in lattice thermal conductivityand a large enhancement in the thermoelectric performance of PbTe.By taking such a panoscopic approach to the scattering of heat-carrying phonons across integrated length scales, we go beyondnanostructuring and demonstrate a ZT value of 2.2 at 915 kelvinin p-type PbTe endotaxially nanostructured with SrTe at a con-centration of 4 mole per cent and mesostructured with powderprocessing and spark plasma sintering. This increase in ZT beyondthe threshold of 2 highlights the role of, and need for, multiscalehierarchical architecture in controlling phonon scattering in bulkthermoelectrics, and offers a realistic prospect of the recovery of asignificant portion of waste heat.
The performance of a thermoelectric material is quantified byZT 5 sS2/(kel 1 klat), where s is the electrical conductivity, S is theSeebeck coefficient, T is the temperature, kel is the electronic thermalconductivity and klat is the lattice thermal conductivity4,5. Among thehigh-ZT materials, PbTe (refs 1–3) is the most efficient for power-generation applications at high temperature, whereas Bi2Te3-basedmaterials6,7 are renowned for refrigeration near room temperature.Several innovative strategies have recently been introduced to increasethe ZT value of PbTe (refs 1–3). Nanostructuring, in particular, hasbeen proven to be an effective approach to enhance ZT by reducing klat
through the placement of suitable nanoscale precipitates in the matrix,for example in AgPbmSbTem12 (ref. 8; LAST), NaPbxSbTe21x (ref. 9;SALT) and PbTe–PbS (ref. 10). Alternatively, p-type PbTe12xSex
(ref. 11) and Tl–PbTe (ref. 12) also have excellent thermoelectricproperties, arising from multiple valence bands and the introductionof a density-of-states distortion in the valence band, respectively.Skutterudite structures have also been shown to have high ZT values13.Yet, despite remarkable progress, all state-of-the-art materials have ZT
values in the range of 1.5–1.8 at 750–900 K, well below the target of 2sought in the field.
Optimized atomic-scale doping/substitution (Fig. 1a) in the PbTestructure can lead to a ZT value of ,1.1 at 775 K (Fig. 1b) in the case ofa bulk ingot sample of PbTe doped with 2 mol% Na. The maximum
1Department of Chemistry, Northwestern University, Evanston, Illinois 60208, USA. 2Materials Science and Engineering, Northwestern University, Evanston, Illinois 60208, USA. 3Department of Electricaland Computer Engineering, Michigan State University, East Lansing, Michigan 48824, USA. 4Materials Science Division, Argonne National Laboratory, Argonne, Illinois 60439, USA. {Present addresses:New Chemistry Unit, Jawarharlal Nehru Centre for Advanced Scientific Research (JNCASR), Jakkur, Bangalore 560064, India (K.B.); Frantier Institute of Science and Technology (FIST), Xi’an JiaotongUniversity, Xi’an 710054, China (J.H.).
b
a
Mesoscale Nanoscale Atomic scale
ZT ≈ 1.1
SPS
Ingot
ZT ≈ 1.7 ZT ≈ 2.2
2.4
2.0
1.6
1.2
0.8
0.4
0.0300 400 500 600 700 800 900
T (K)
ZT
300 600 900
2
1
0
4 mol% SrTe, 2 mol% Na: SPS
2 mol% SrTe, 1 mol% Na: ingot (ref. 14)
0 mol% SrTe, 2 mol% Na: ingot
Figure 1 | All-length-scale hierarchy in thermoelectric materials.a, Maximum achievable ZT values for the respective length scales: the atomicscale (alloy scattering: red, Te; blue, Pb; green, dopant), the nanoscale (PbTematrix, grey; SrTe nanocrystals, blue) to the mesoscale (grain-boundaryscattering). By combining the effects of atomic-scale alloy doping, endotaxialnanostructuring and mesoscale grain-boundary control, maximum phononscattering can be achieved at high temperatures and the figure of merit can beincreased beyond the value possible with nanostructuring alone. b, ZT as afunction of temperature for an ingot of PbTe doped with 2 mol% Na (atomicscale), PbTe–SrTe(2 mol%) doped with 1 mol% Na (ref. 14; atomic plusnanoscale) and spark-plasma-sintered PbTe–SrTe(4 mol%) doped with 2% Na(atomic plus nano plus mesoscale). The measurement uncertainty of allexperimental ZT versus T data was 10% (error bars). Inset, comparison of ZT inSPS and ingot samples with the same composition (PbTe–SrTe(4 mol%) dopedwith 2 mol% Na).
4 1 4 | N A T U R E | V O L 4 8 9 | 2 0 S E P T E M B E R 2 0 1 2
Macmillan Publishers Limited. All rights reserved©2012
K. Biswas, J. He, I. D. Blum, C.-I. Wu, T. P. Hogan, D. N. Seidman, V. P. Dravid, and M. G. Kanatzidis, Nature 489, 414 (2012).
Atomic scale:Lattice disorder
Nanoscale:Precipitates
Mesoscale:Grain boundaries
ZT≈1.1 ZT≈1.7 ZT≈2.2
Hierarchically structured PbTe

Is Nano- & Mesostructuring the Answer?
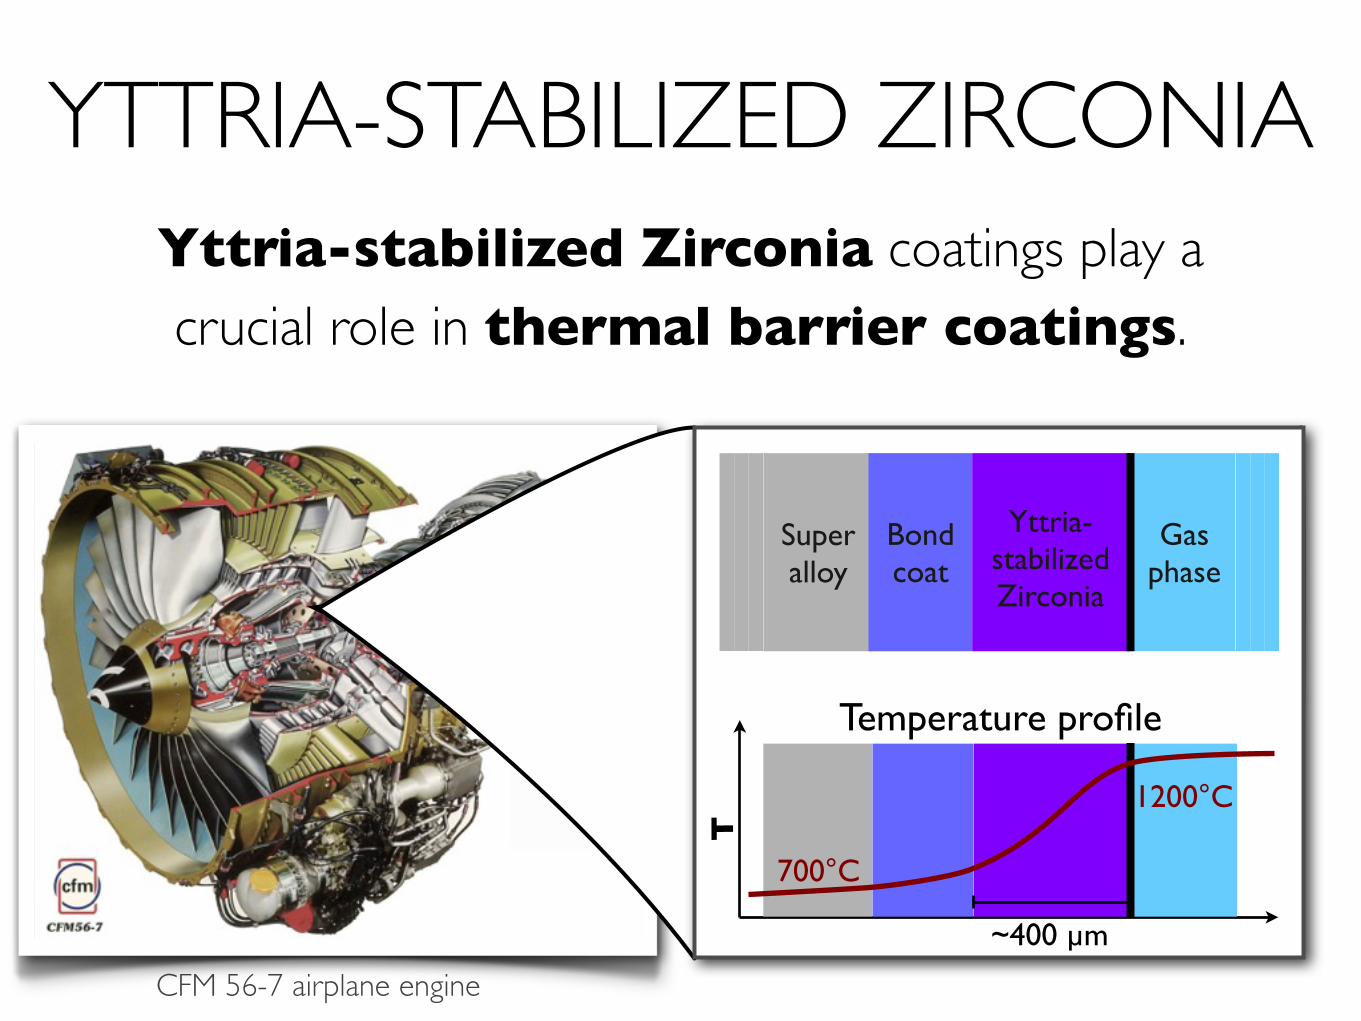
CFM 56-7 airplane engine
Superalloy
Bondcoat
Yttria-stabilized Zirconia
Gasphase
T
1200°C
Temperature profile
~400 µm
700°C
YTTRIA-STABILIZED ZIRCONIAYttria-stabilized Zirconia coatings play a crucial role in thermal barrier coatings.
CFM 56-7 airplane engine
Superalloy
Bondcoat
Yttria-stabilized Zirconia
Gasphase
T
1200°C
Temperature profile
~400 µm
700°C
YTTRIA-STABILIZED ZIRCONIAYttria-stabilized Zirconia coatings play a crucial role in thermal barrier coatings.
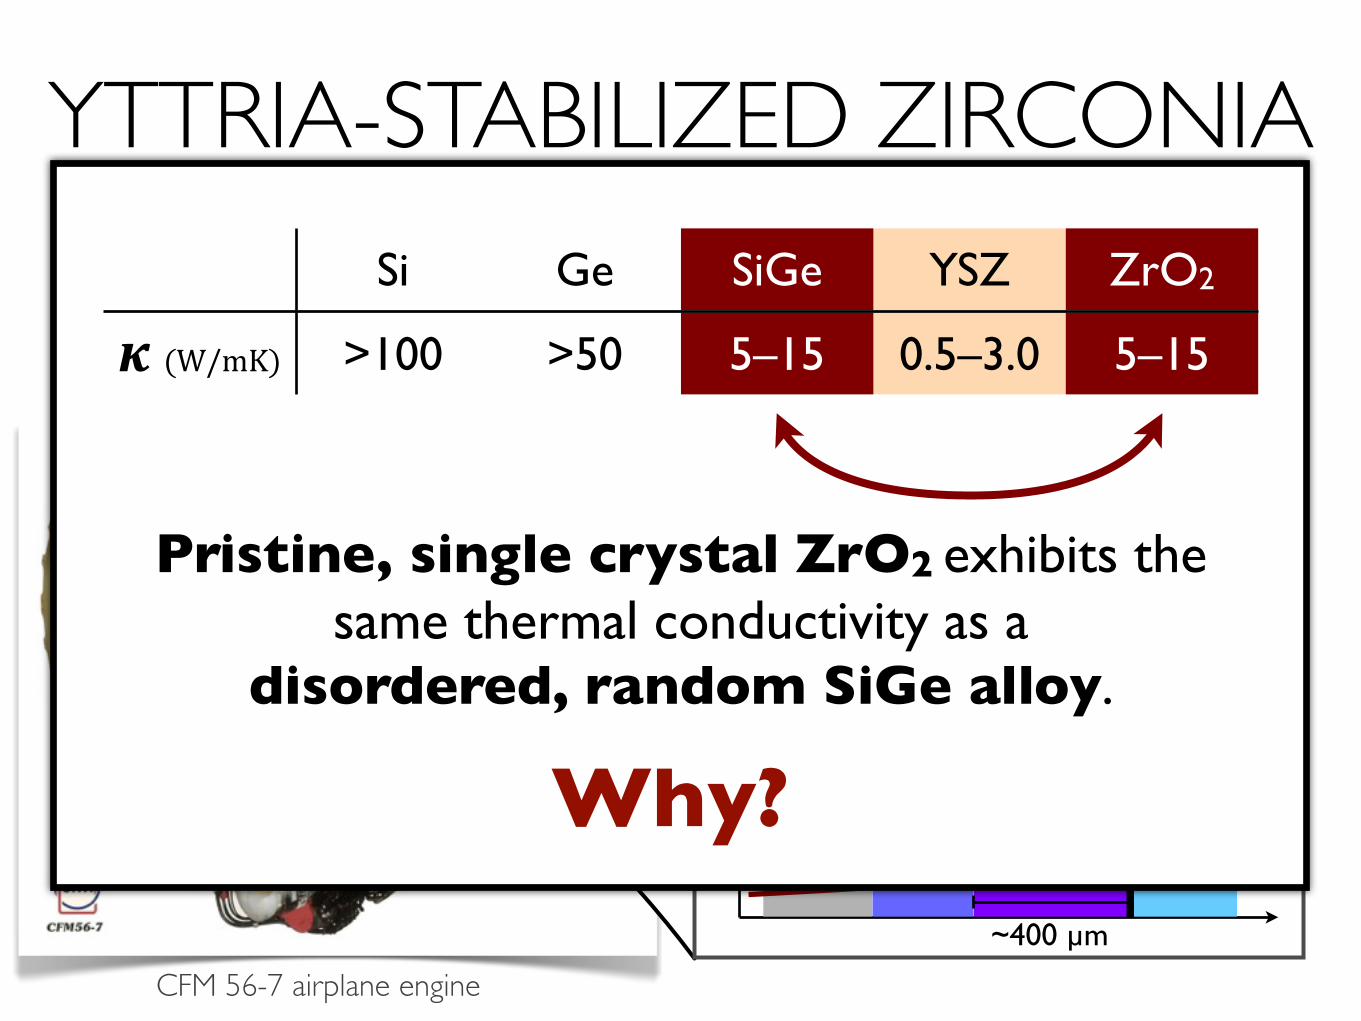
Si Ge SiGe YSZ ZrO2
!"(W/mK) >100 >50 5–15 0.5–3.0 5–15
Pristine, single crystal ZrO2 exhibits the same thermal conductivity as a
disordered, random SiGe alloy.
Why?
400 5 10 15 20 25 30 35
2500°C
0°C
500°C
1000°C
1500°C
2000°C
YO1.5 (mol %)te
mpe
ratu
re (°
C)
CT
MT + C
M + C
M + δ Zr3Y4O12
ZrO2
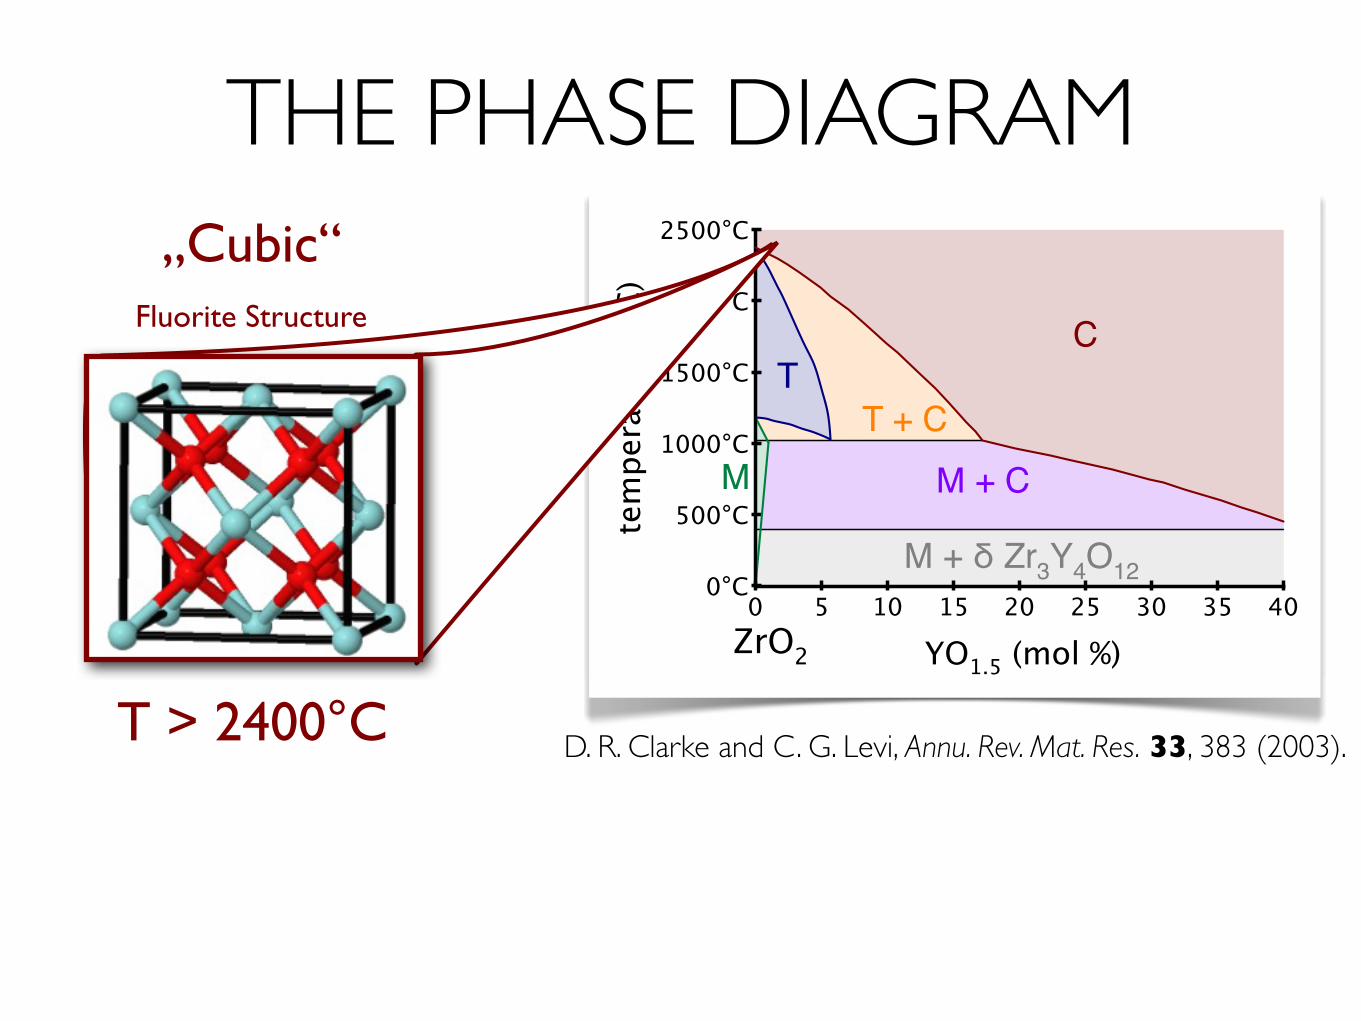
THE PHASE DIAGRAM„Monoclinic“Baddeleyite Structure
T < 1200°C D. R. Clarke and C. G. Levi, Annu. Rev. Mat. Res. 33, 383 (2003).
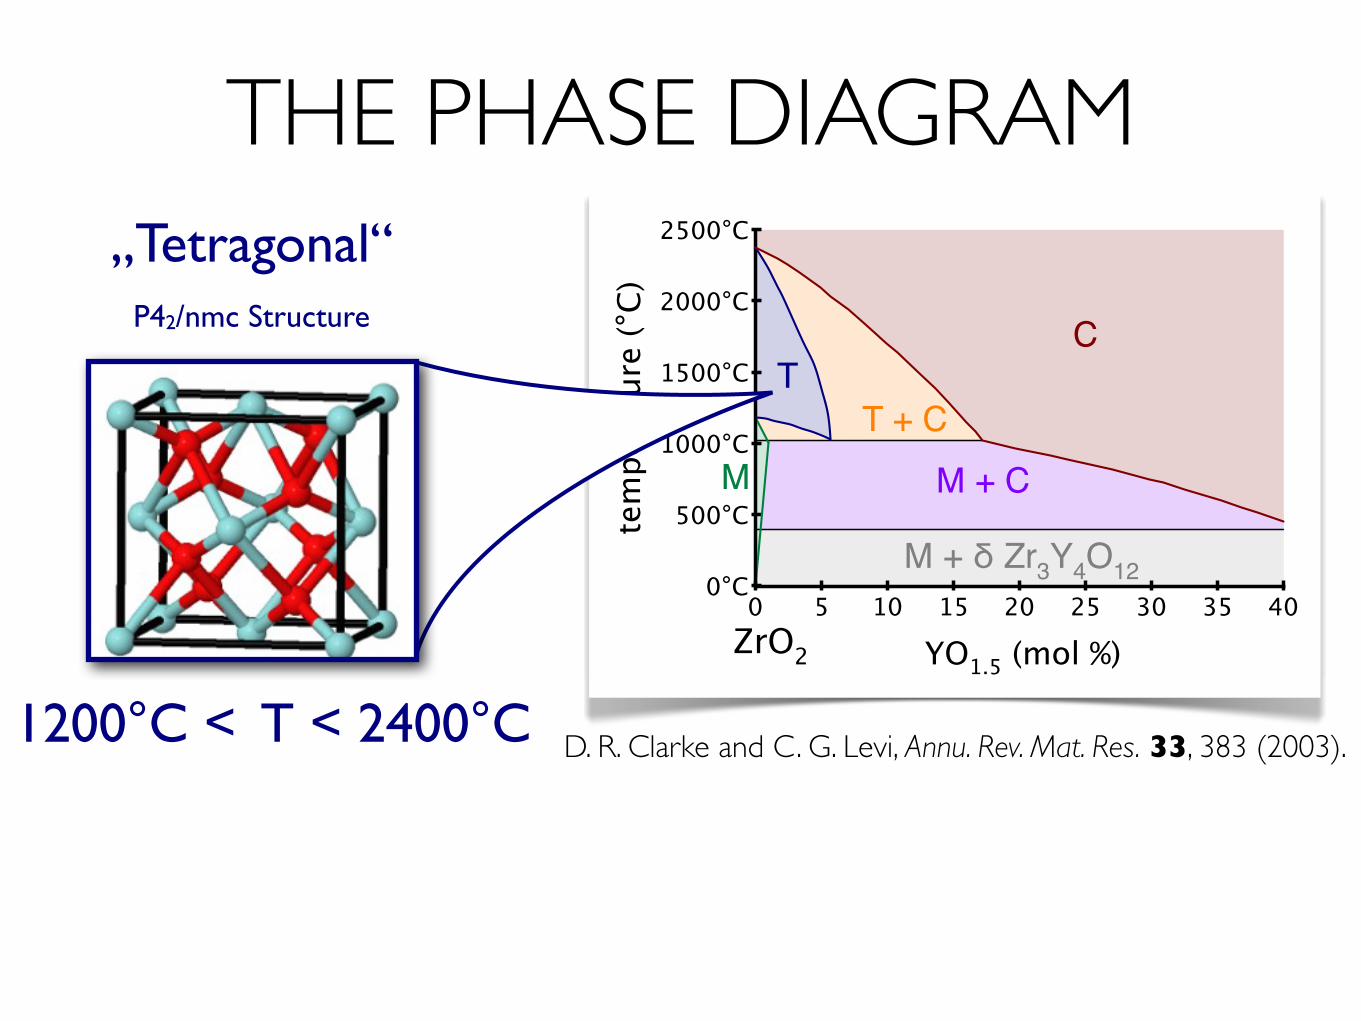
400 5 10 15 20 25 30 35
2500°C
0°C
500°C
1000°C
1500°C
2000°C
YO1.5 (mol %)te
mpe
ratu
re (°
C)
CT
MT + C
M + C
M + δ Zr3Y4O12
ZrO2
THE PHASE DIAGRAM„Tetragonal“
P42/nmc Structure
1200°C < T < 2400°C D. R. Clarke and C. G. Levi, Annu. Rev. Mat. Res. 33, 383 (2003).
400 5 10 15 20 25 30 35
2500°C
0°C
500°C
1000°C
1500°C
2000°C
YO1.5 (mol %)te
mpe
ratu
re (°
C)
CT
MT + C
M + C
M + δ Zr3Y4O12
ZrO2
THE PHASE DIAGRAM„Cubic“
Fluorite Structure
T > 2400°C D. R. Clarke and C. G. Levi, Annu. Rev. Mat. Res. 33, 383 (2003).
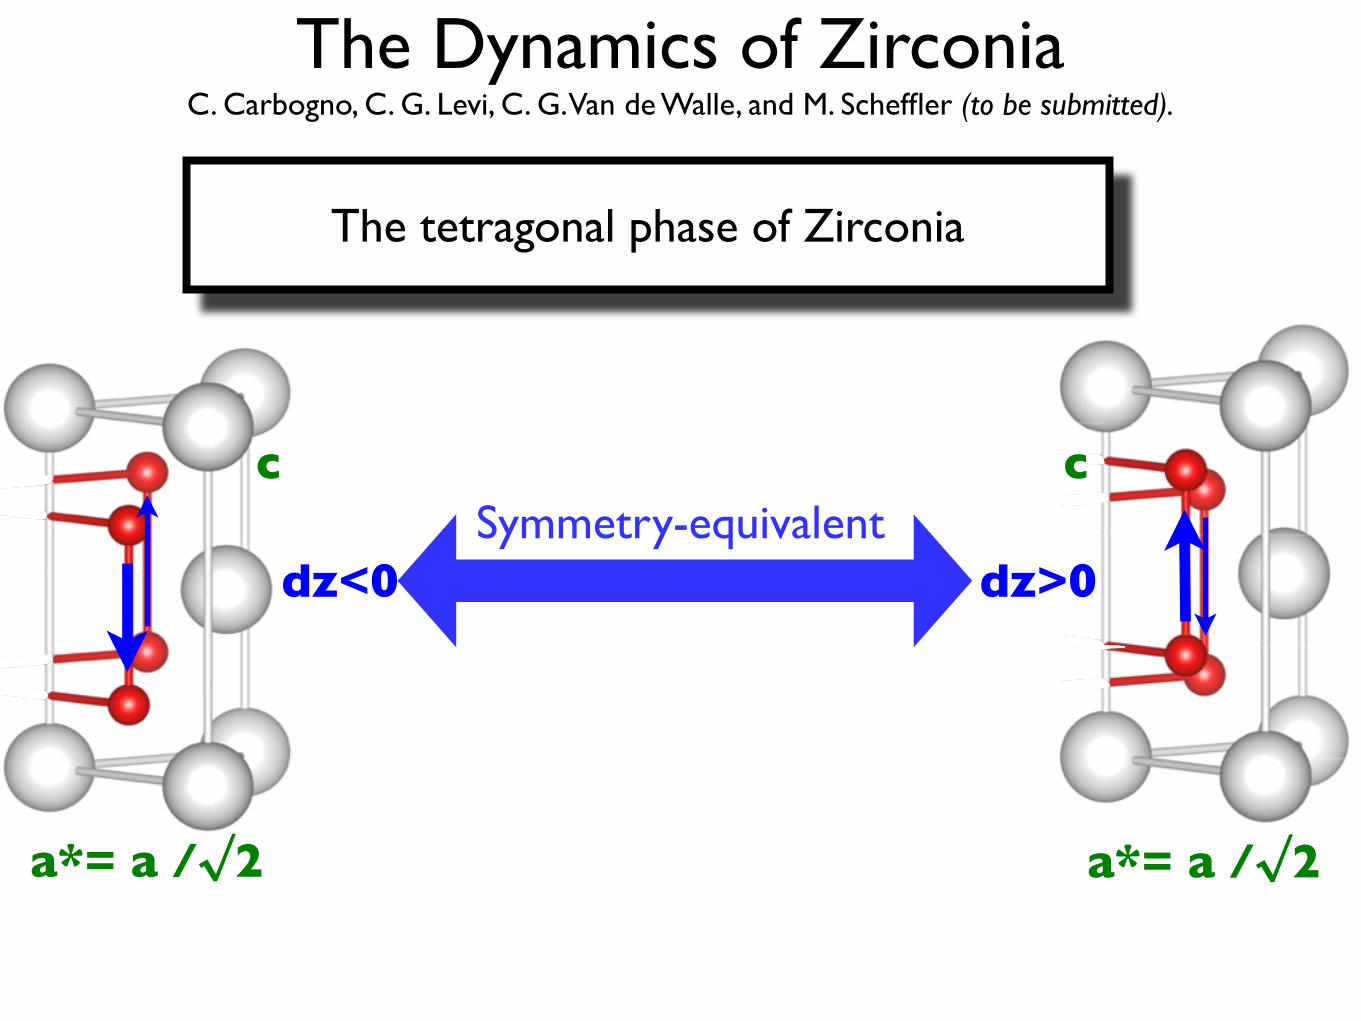
The Dynamics of ZirconiaC. Carbogno, C. G. Levi, C. G. Van de Walle, and M. Scheffler (to be submitted).
The tetragonal phase of Zirconia
c
a*= a /√2
c
a*= a /√2
Symmetry-equivalentdz>0dz<0
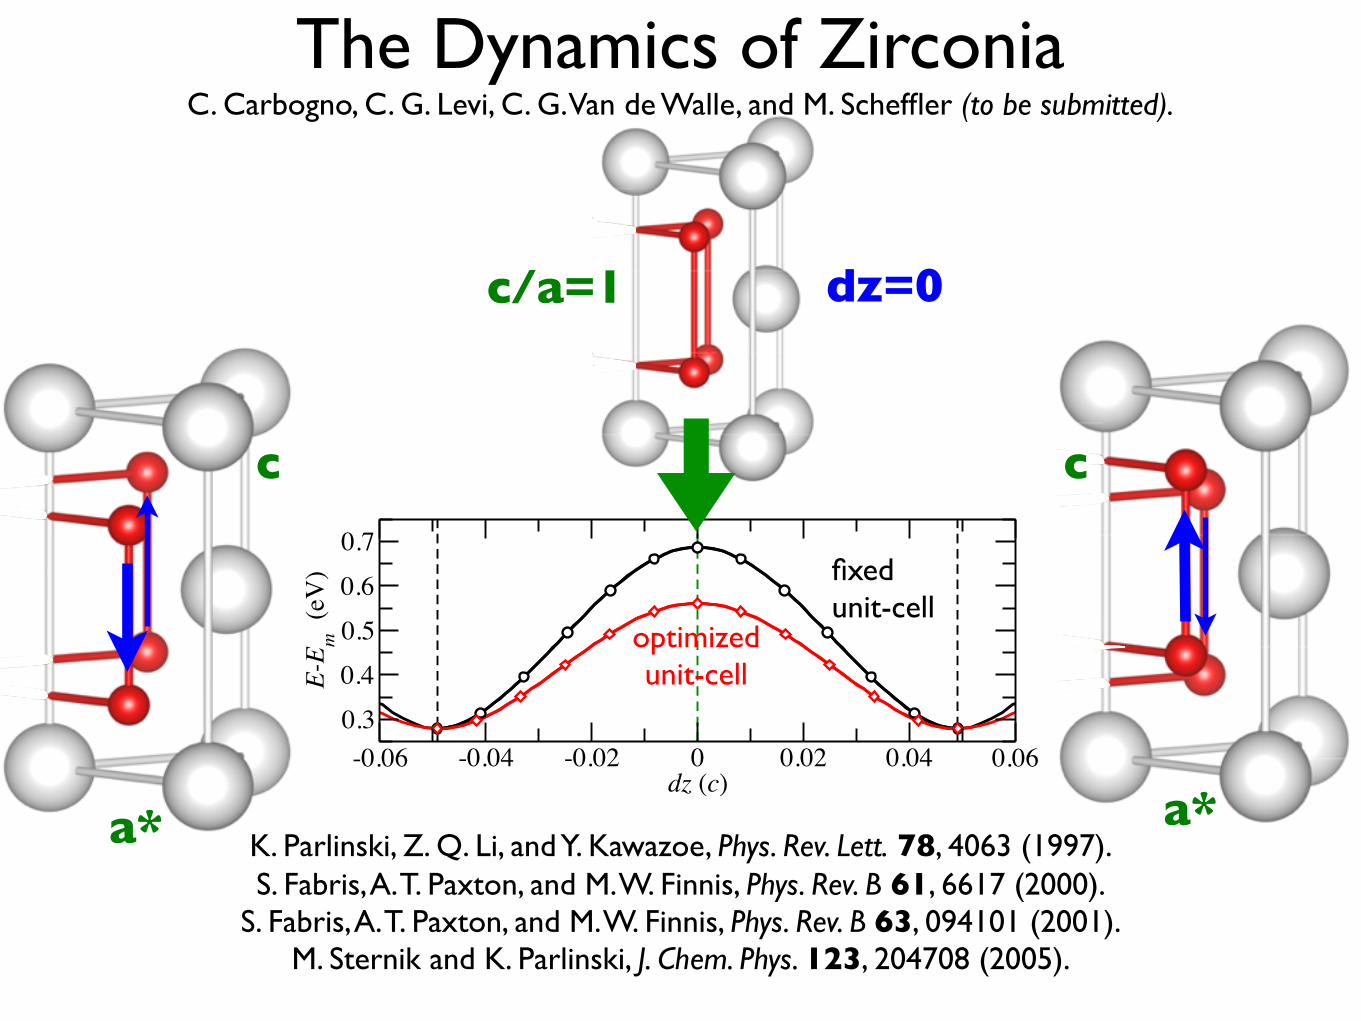
The Dynamics of ZirconiaC. Carbogno, C. G. Levi, C. G. Van de Walle, and M. Scheffler (to be submitted).
c
a*
c
a*-0.06 -0.04 -0.02 0 0.02 0.04 0.06
dz (c)
0.30.40.50.6
0.7
E-E m
(eV
) fixed unit-cell
optimizedunit-cell
K. Parlinski, Z. Q. Li, and Y. Kawazoe, Phys. Rev. Lett. 78, 4063 (1997).S. Fabris, A. T. Paxton, and M. W. Finnis, Phys. Rev. B 61, 6617 (2000).
S. Fabris, A. T. Paxton, and M. W. Finnis, Phys. Rev. B 63, 094101 (2001).M. Sternik and K. Parlinski, J. Chem. Phys. 123, 204708 (2005).
c/a=1 dz=0
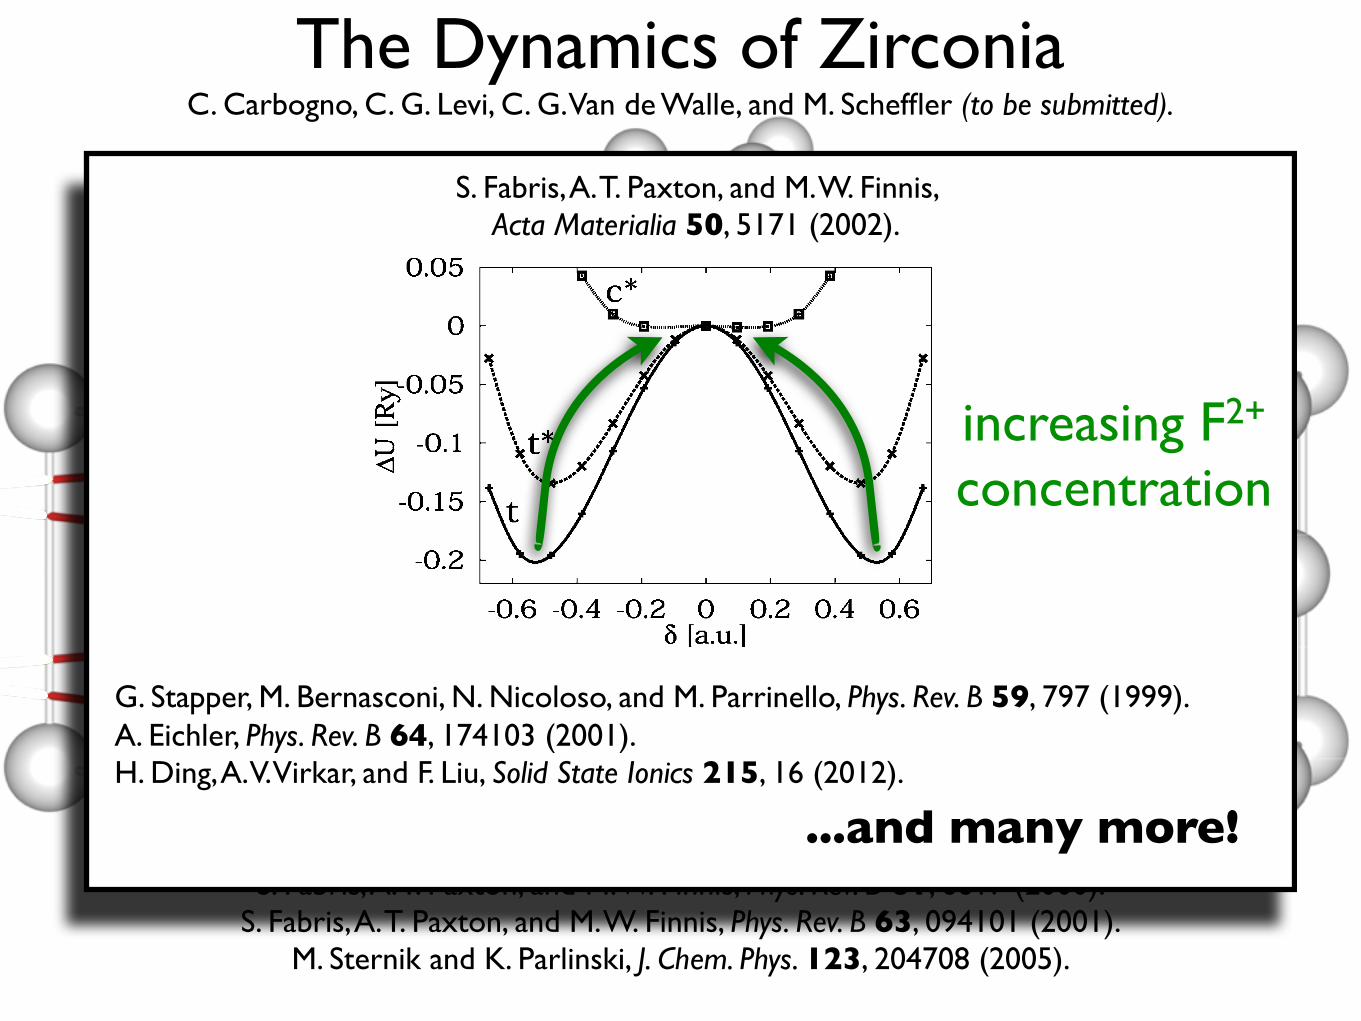
5176 S. Fabris et al. / Acta Materialia 50 (2002) 5171–5178
was then obtained by MD simulation of the V4super-cell. The local atomic environment is verydifferent from that of the fluorite structure: 14 cat-ions out of 32 are 7-fold coordinated and themajority of the oxygen ions are not in centro–sym-metric positions. The minimum energy is obtainedfor a perfect cubic super-cell (c/a=1).Despite these distortions, the RDF shown in Fig.
4 suggests that the structure of the V4 is, on aver-age, cubic. The first peak of the Zr–O componentconfirms that the oxygen sublattice is not tetra-gonally distorted. The calculated average Zr–O dis-tance compares very well with the experimentalone in 15% mol yttria stabilized zirconia [22–27],shown by the arrow. In the tetragonal structures,the O–O second coordination shell shows a charac-teristic three-peaked RDF. The corresponding RDFof the c∗ phase, shows only a single peak centeredat r ! a0√(2) ! 6.8 a.u., which is the second shellO–O distance in the perfect cubic lattice. Becauseof the outward displacement of the large numberof Zr atoms NN to the vacancies, the first Zr–Zrpeak is shifted to smaller r, which is also exper-imentally observed (see arrow in Fig. 4(c)). Apartfrom this detail, the Zr–Zr RDF shows completesimilarity with the other cases and therefore the Zrsublattice is fcc, even in the V4 supercell.
4. Discussion
Our results corroborate some of the early experi-mental observations on stabilized zirconia and onother compounds with the general formula M7O12[35,36]. These reported a strong distortion of theoxygen sublattice, with the NN O atoms relaxingtowards the vacancy by !0.3 A and the NN Zrrelaxing away from the vacancy by less than 0.2 A[35]. Moreover, in the special case of the Zr3M4O12compounds, the difference between the orderedand disordered fluorite structures was determinedby the arrangement of the oxygen vacancies [35],which where reported to lie along the [111] direc-tions [36].When the results described in the previous Sec-
tions are considered in the context of the c↔tphase transition in pure zirconia [14], they alsoprovide insight on how the structural distortions
around the oxygen vacancies affect the relativestability of the tetragonal and cubic phases. Therelationship between the c and t forms is governedby a temperature-dependent double-well in thepotential energy. At low temperature, the cubicphase c is structurally unstable and it lowers theenergy by distorting the oxygen sublattice alongthe X"
2 mode of vibration. The extent of this distor-tion is measured by the order parameter d. The 0K double-well for the c"t structures is shown inFig. 6 by a solid line labelled t.The static relaxations showed that both the unre-
laxed cells V1 and V4 are unstable with respect tothe short-range isotropic relaxation around the vac-ancies. Moreover, our atomistic simulations sug-gest that the V1 cell is also unstable with respectto the tetragonal distortion. Let us now simplysuperimpose these two displacement fields to seehow the oxygen vacancies, considered as centersof dilations, modify the energy double-well. In thefollowing, the statically relaxed configurations ofV1 and V4 which show the radial displacementsonly, are taken as reference systems, to which weapply the tetragonal distortion d. The results areshown in Fig. 6.Similarly to the c structure, the defective V1 cell
is unstable with respect to the tetragonal distortion:the atomic relaxations around the vacancy partiallyreduce the height and width of the double well(Fig. 6). A static minimization from the minimum
Fig. 6. Total energy vs. tetragonal distortion d of the oxygensublattice for three 96-site cells: t pure stoichiometric tetragonalstructure; t∗ partially stabilized zirconia (V1 super-cell); c∗ fullystabilized zirconia (V4 super-cell).
increasing F2+
concentration
S. Fabris, A. T. Paxton, and M. W. Finnis, Acta Materialia 50, 5171 (2002).
G. Stapper, M. Bernasconi, N. Nicoloso, and M. Parrinello, Phys. Rev. B 59, 797 (1999). A. Eichler, Phys. Rev. B 64, 174103 (2001). H. Ding, A. V. Virkar, and F. Liu, Solid State Ionics 215, 16 (2012).
...and many more!
The Dynamics of ZirconiaC. Carbogno, C. G. Levi, C. G. Van de Walle, and M. Scheffler (to be submitted).
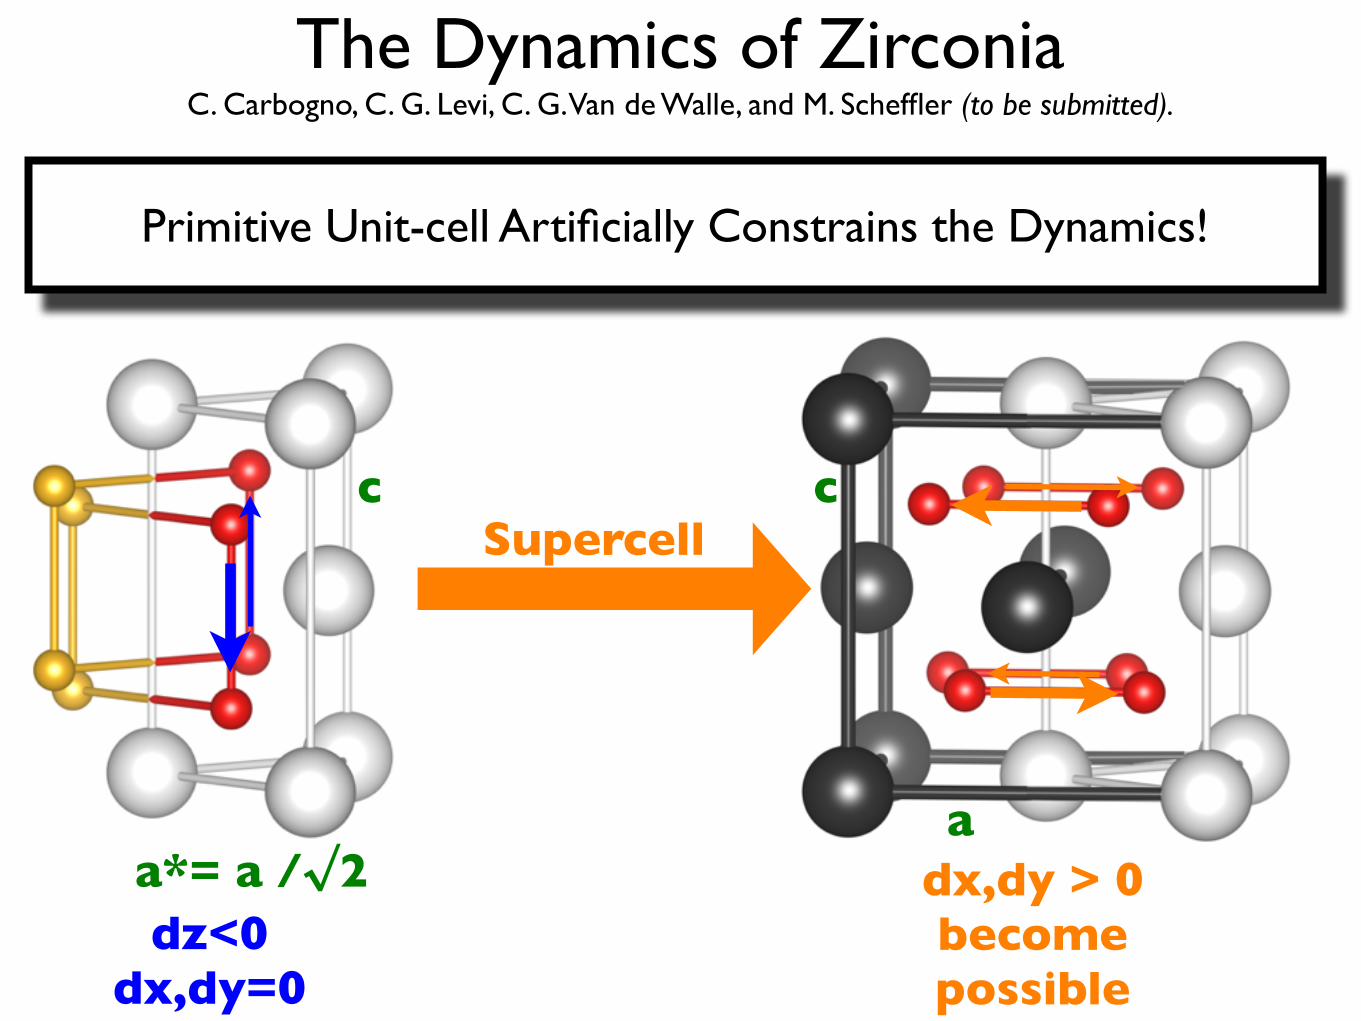
Primitive Unit-cell Artificially Constrains the Dynamics!
c
a*= a /√2a
c
dz<0dx,dy=0
dx,dy > 0become possible
Supercell
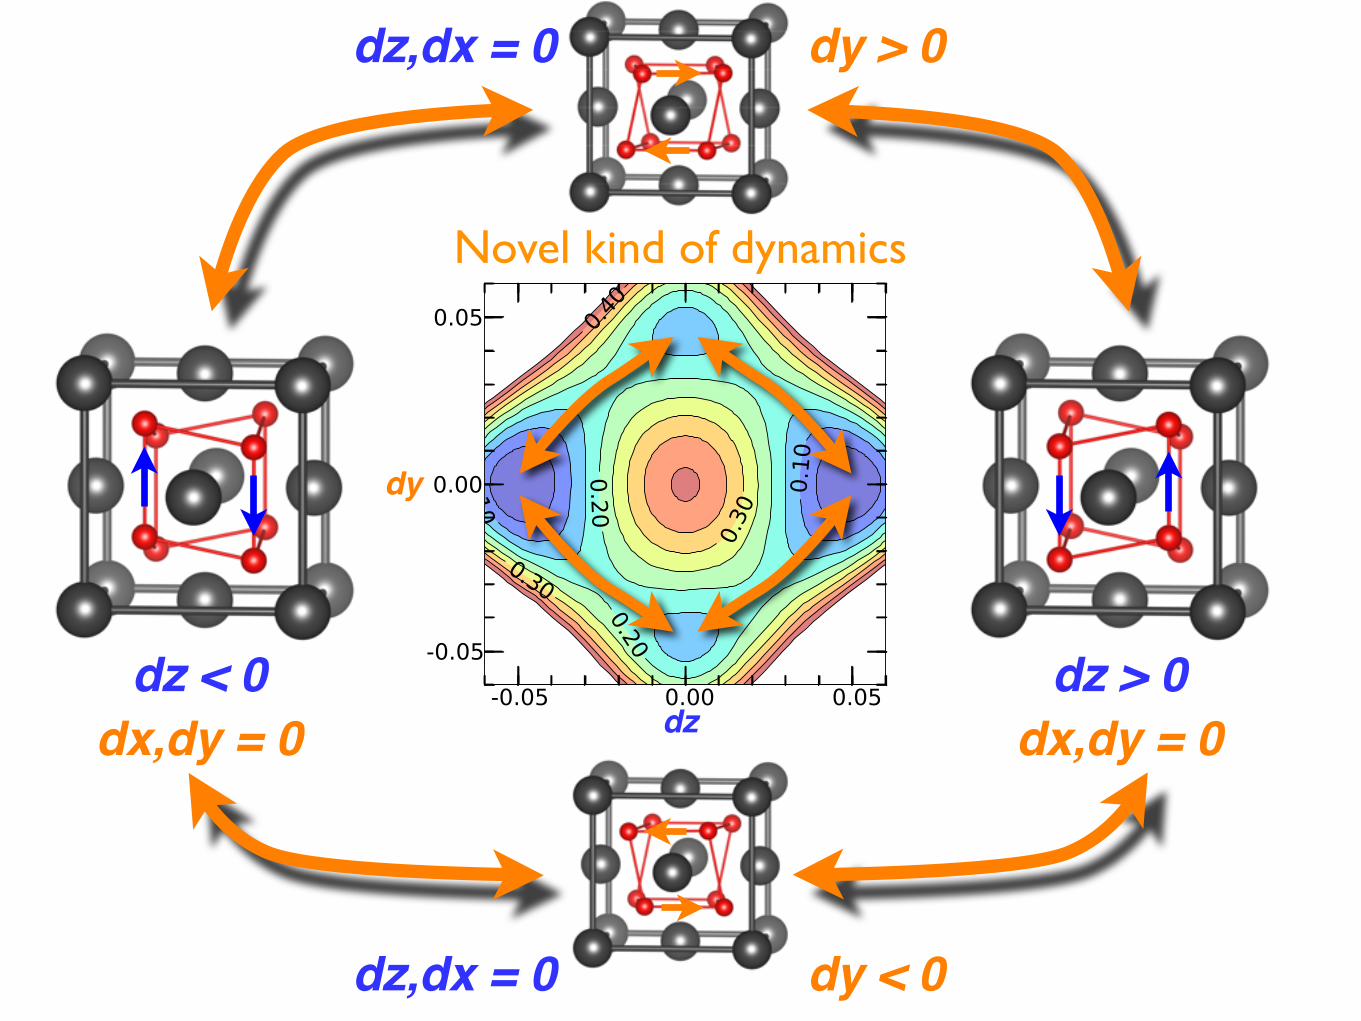
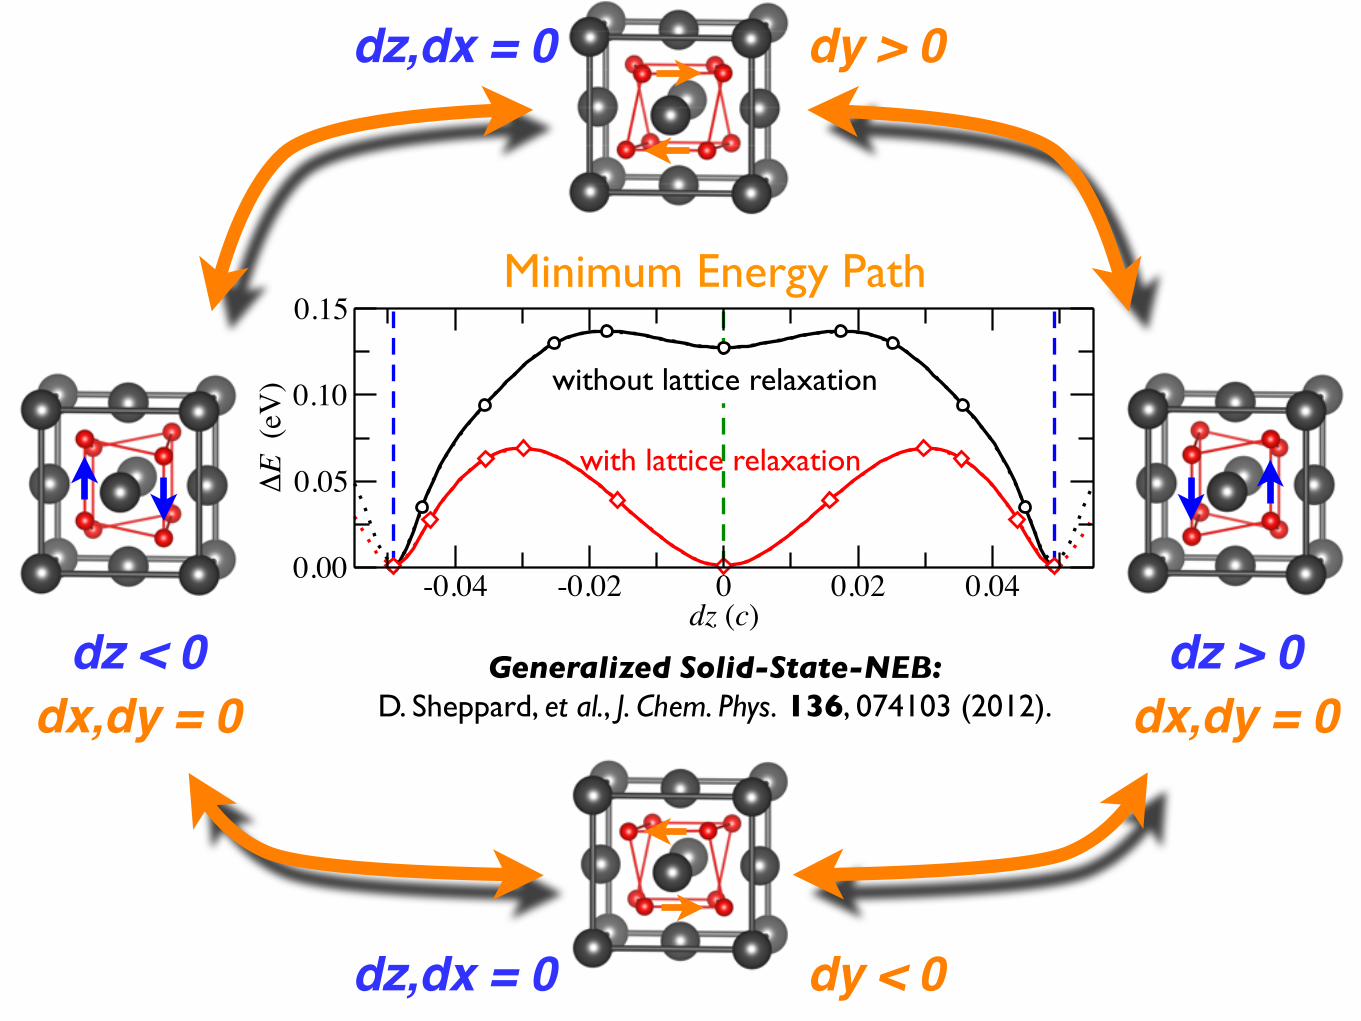
dz < 0dx,dy = 0
dz > 0dx,dy = 0
dz,dx = 0 dy > 0
dz,dx = 0 dy < 0
Novel kind of dynamics
dz
dy
-0.04 -0.02 0 0.02 0.04dz (c)
0.00
0.05
0.10
0.15∆
E (e
V)
dz < 0dx,dy = 0
dz > 0dx,dy = 0
dz,dx = 0 dy > 0
dz,dx = 0 dy < 0
Minimum Energy Path
without lattice relaxation
with lattice relaxation
Generalized Solid-State-NEB: D. Sheppard, et al., J. Chem. Phys. 136, 074103 (2012).
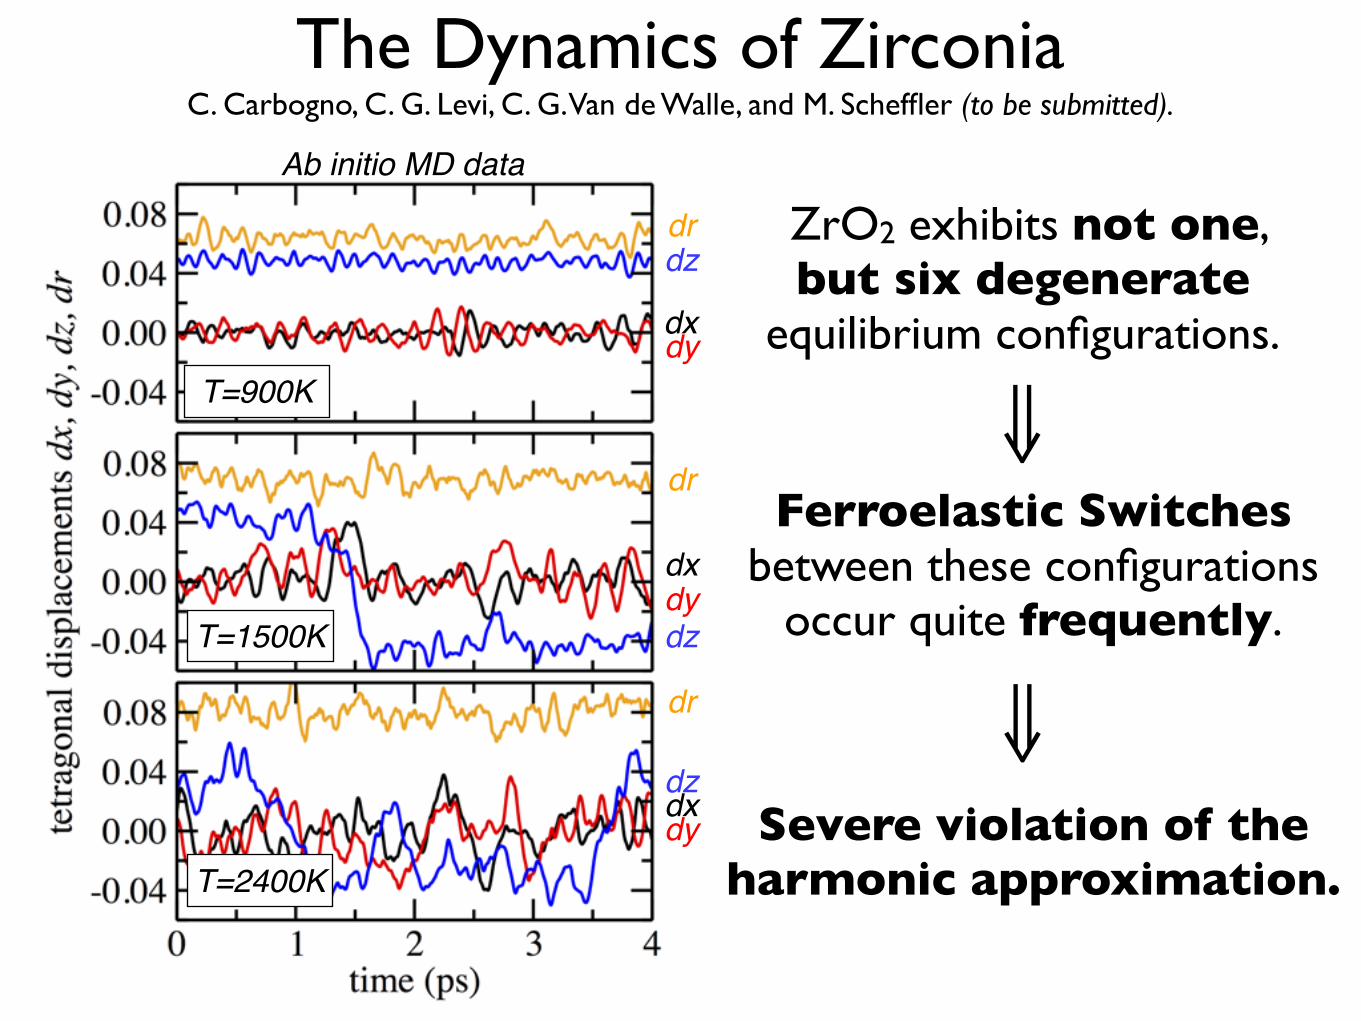
The Dynamics of ZirconiaC. Carbogno, C. G. Levi, C. G. Van de Walle, and M. Scheffler (to be submitted).
T=900K
T=1500K
T=2400K
dx
dx
dx
dy
dy
dy
dz
dz
dz
dr
dr
dr
Ab initio MD data
ZrO2 exhibits not one,but six degenerate
equilibrium configurations.
Ferroelastic Switchesbetween these configurations
occur quite frequently.
Severe violation of the harmonic approximation.
⇓
⇓
Theory
m
mm
µm
nm
fs ps ns µs ms time
space
Heat Transport Mechanisms
TIME AND LENGTH SCALES
Semi-empirical potentials+ vast experience+ established methodologies– reliable description is questionable
ZrO2
time
m
mm
µm
nm
fs ps ns µs ms
space
Heat Transport Mechanisms
TIME AND LENGTH SCALES
Semi-empirical potentials:
First-principles approaches:+ more accurate description– limited time and length scalesZrO2
+ vast experience+ established methodologies– reliable description is questionable
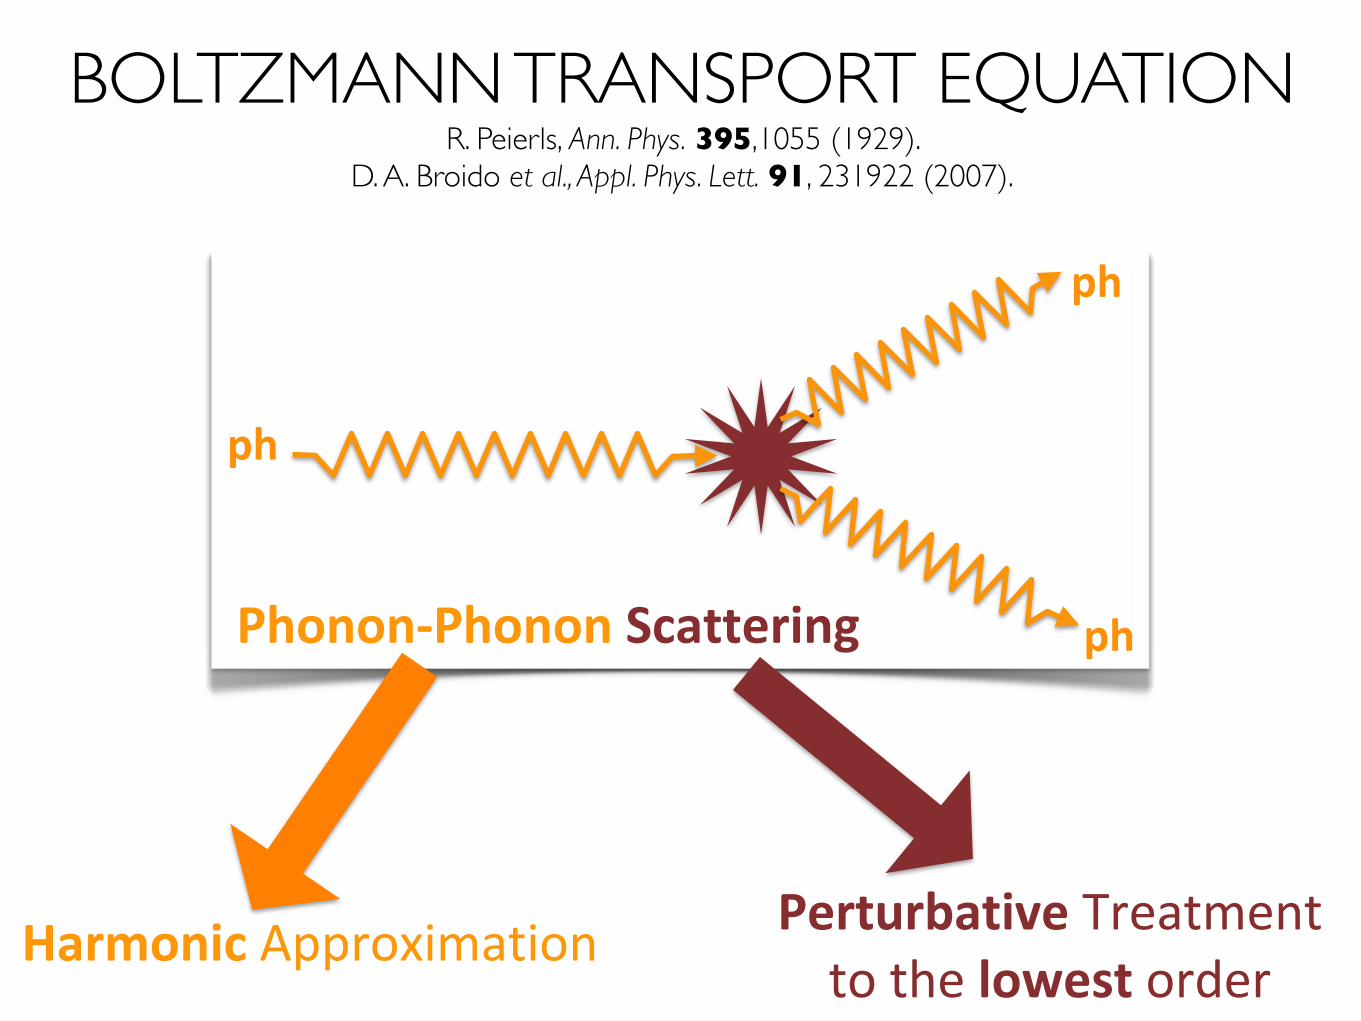
BOLTZMANN TRANSPORT EQUATIONR. Peierls, Ann. Phys. 395,1055 (1929).
D. A. Broido et al., Appl. Phys. Lett. 91, 231922 (2007).
Boltzmann-Peierls-Transport-Equation describes the evolution of the phonon phase space distribution f(ω,q,t).
f(ω,q,t) f(ω,q,t+dt)BoltzmannTransportEquation
ph
ph
ph
BOLTZMANN TRANSPORT EQUATIONR. Peierls, Ann. Phys. 395,1055 (1929).
D. A. Broido et al., Appl. Phys. Lett. 91, 231922 (2007).
Phonon&Phonon#Scattering
Harmonic!Approximation Perturbative!Treatment!to!the!lowest!order
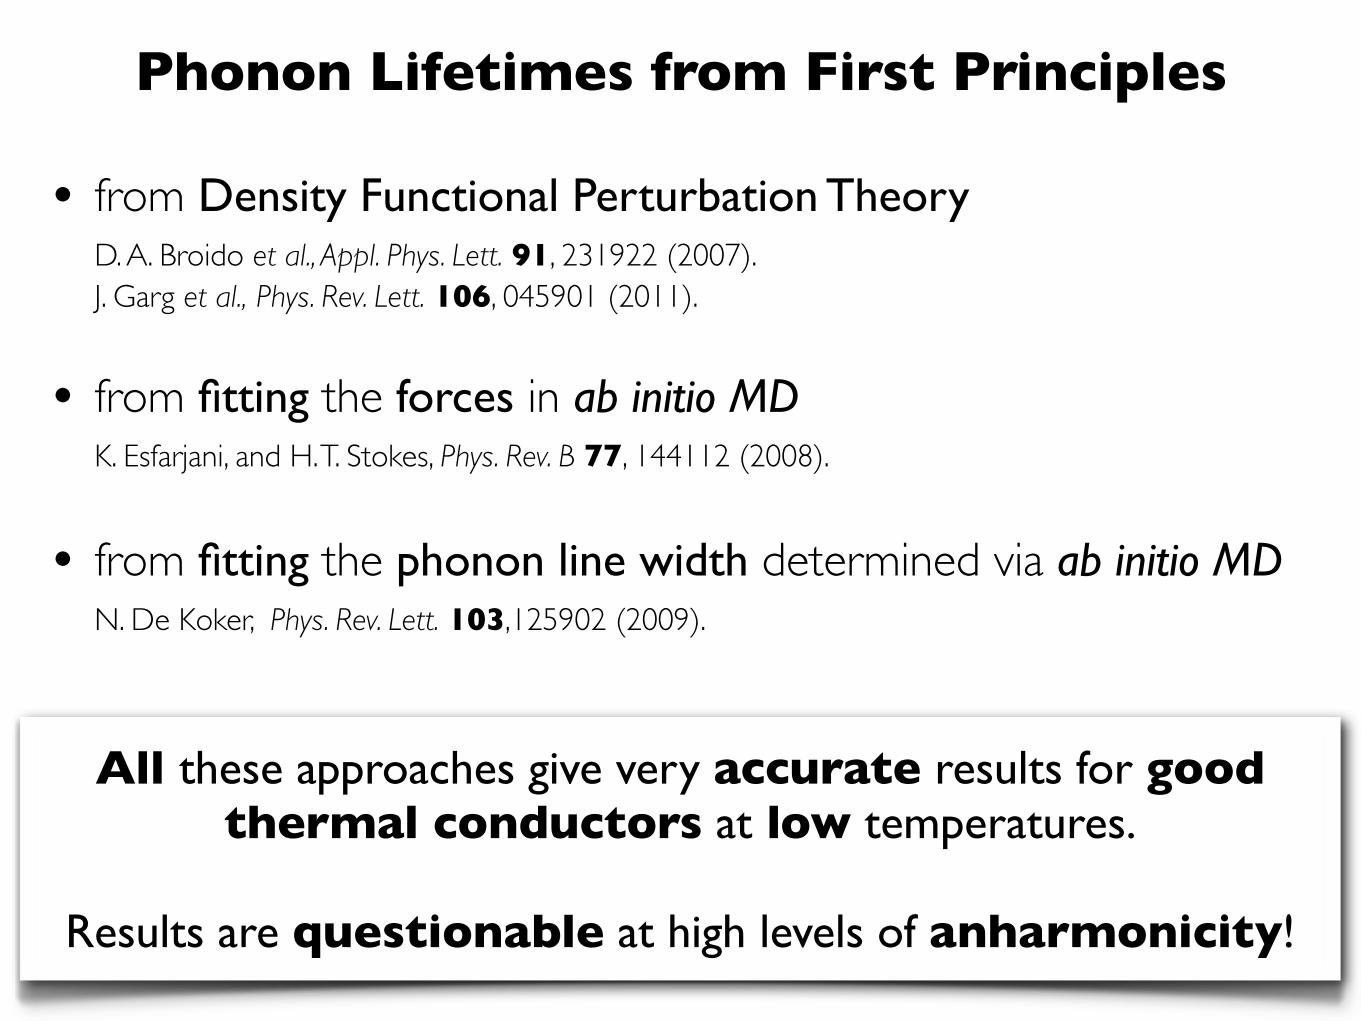
Phonon Lifetimes from First Principles
• from Density Functional Perturbation TheoryD. A. Broido et al., Appl. Phys. Lett. 91, 231922 (2007).J. Garg et al., Phys. Rev. Lett. 106, 045901 (2011).
• from fitting the forces in ab initio MDK. Esfarjani, and H. T. Stokes, Phys. Rev. B 77, 144112 (2008).
• from fitting the phonon line width determined via ab initio MD N. De Koker, Phys. Rev. Lett. 103,125902 (2009).
All these approaches give very accurate results for good thermal conductors at low temperatures.
Results are questionable at high levels of anharmonicity!
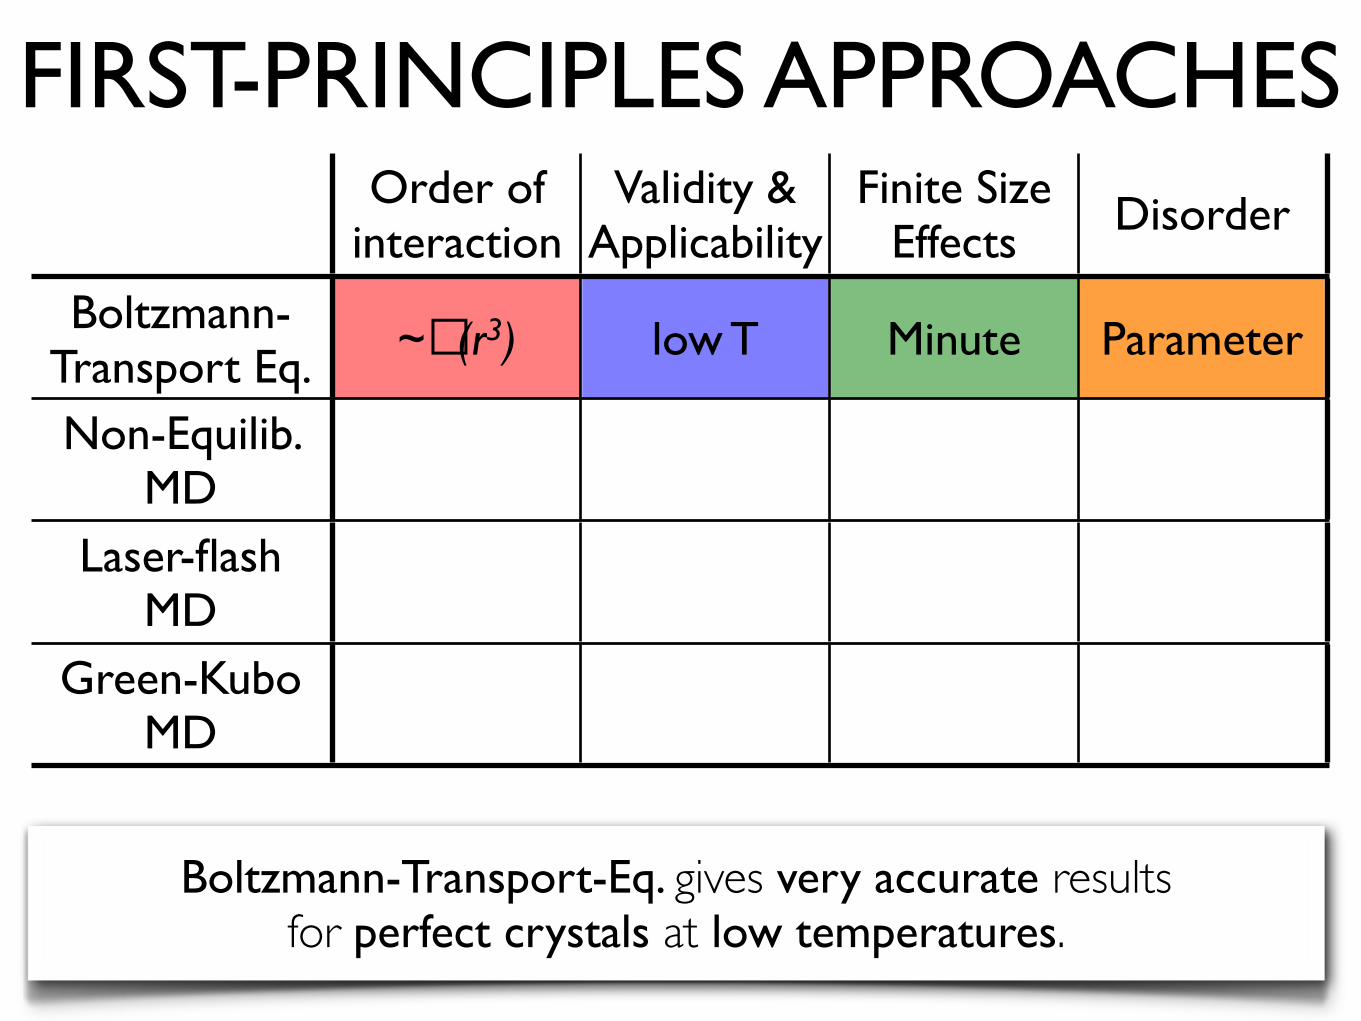
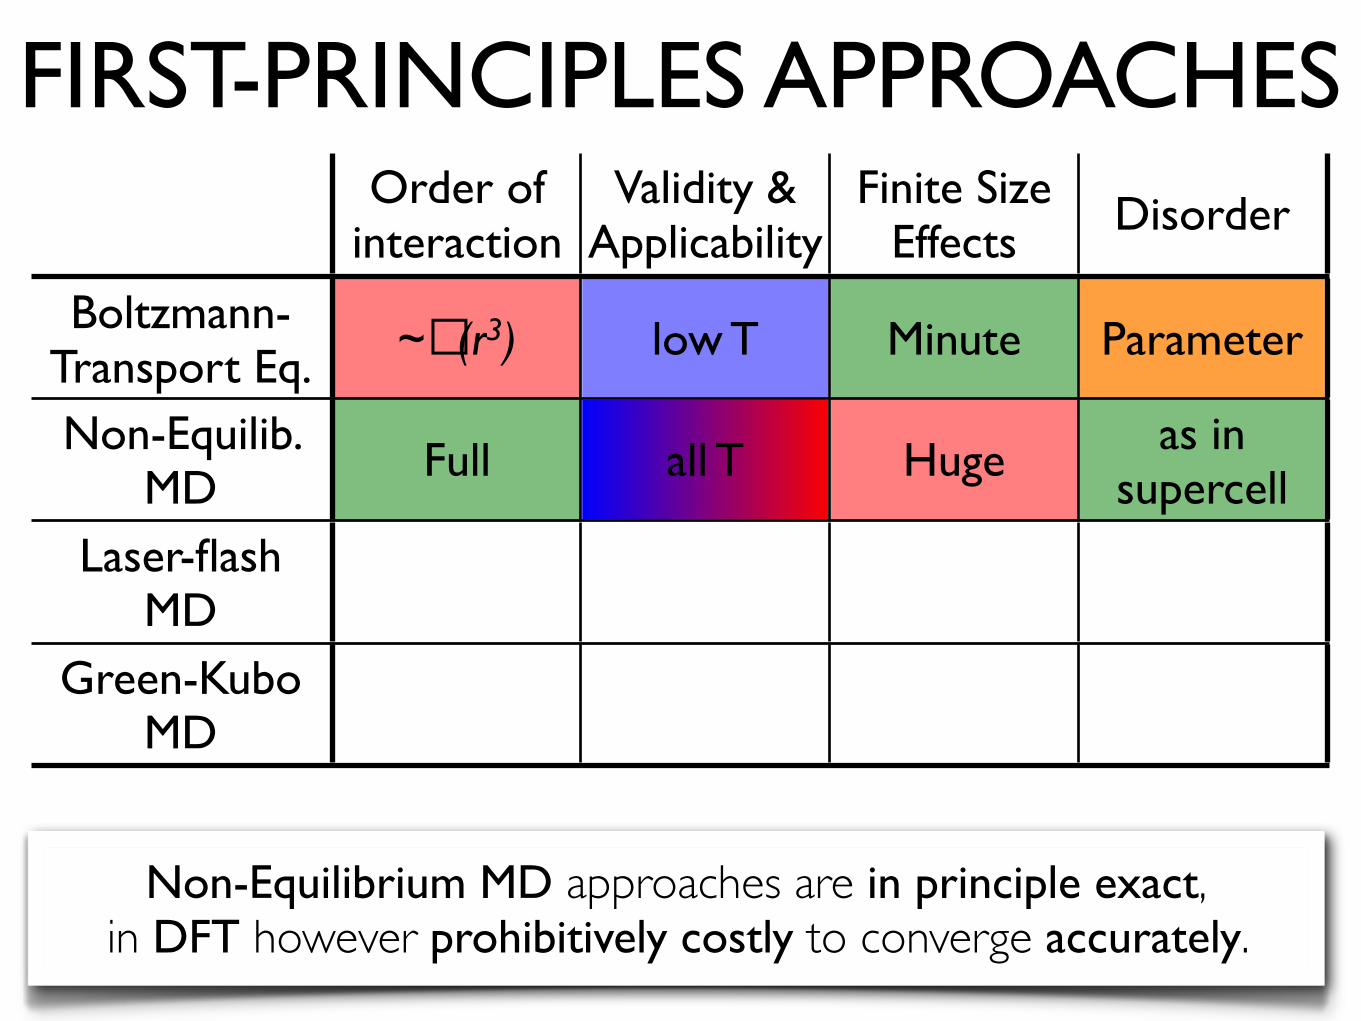
FIRST-PRINCIPLES APPROACHES Order of
interactionValidity &
ApplicabilityFinite Size
EffectsDisorder
Boltzmann-Transport Eq.
~�(r3) low T Minute Parameter
Non-Equilib. MD
Laser-flash MD
Green-Kubo MD
Boltzmann-Transport-Eq. gives very accurate results for perfect crystals at low temperatures.
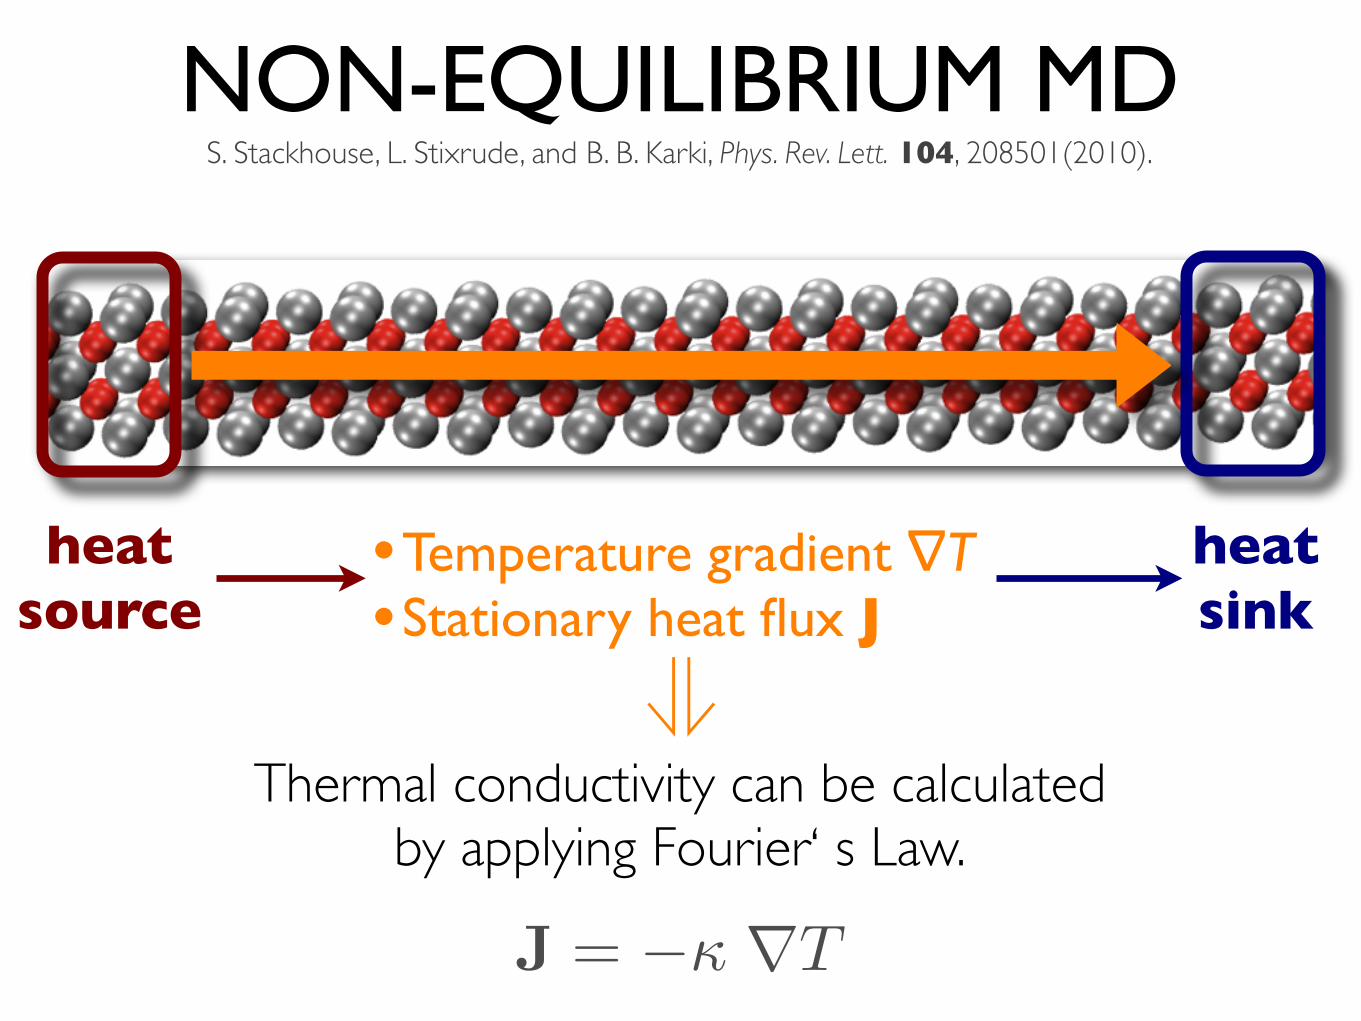
NON-EQUILIBRIUM MDS. Stackhouse, L. Stixrude, and B. B. Karki, Phys. Rev. Lett. 104, 208501(2010).
heatsource
heatsink
•Temperature gradient ∇T •Stationary heat flux J
⇓Thermal conductivity can be calculated
by applying Fourier‘ s Law.
J = � rT
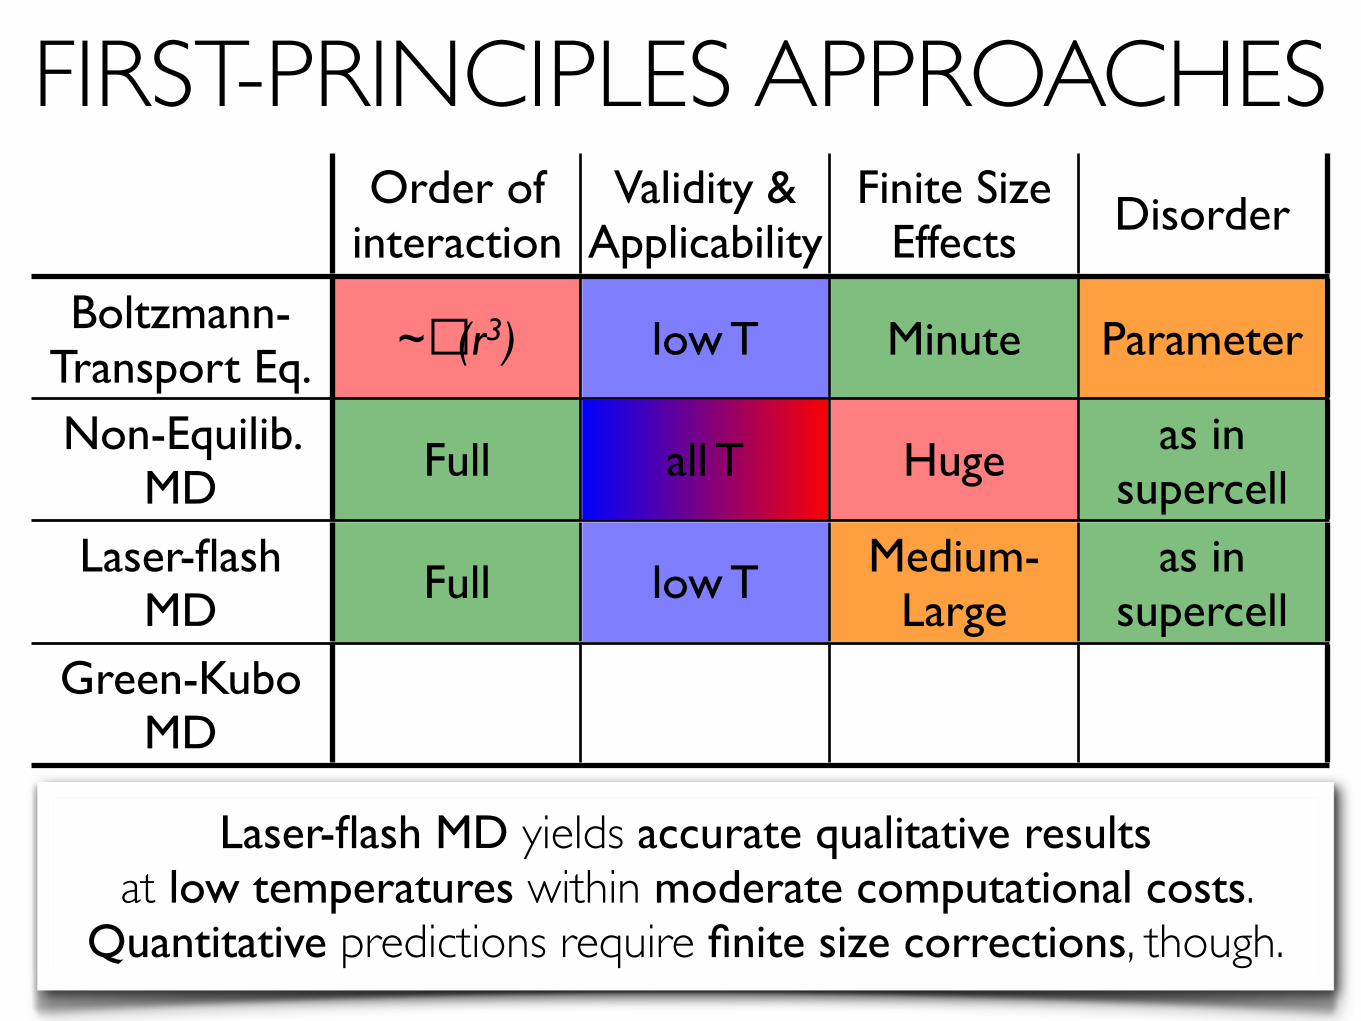
FIRST-PRINCIPLES APPROACHES Order of
interactionValidity &
ApplicabilityFinite Size
EffectsDisorder
Boltzmann-Transport Eq.
~�(r3) low T Minute Parameter
Non-Equilib. MD
Full all T Huge as in supercell
Laser-flash MD
Green-Kubo MD
Non-Equilibrium MD approaches are in principle exact,in DFT however prohibitively costly to converge accurately.
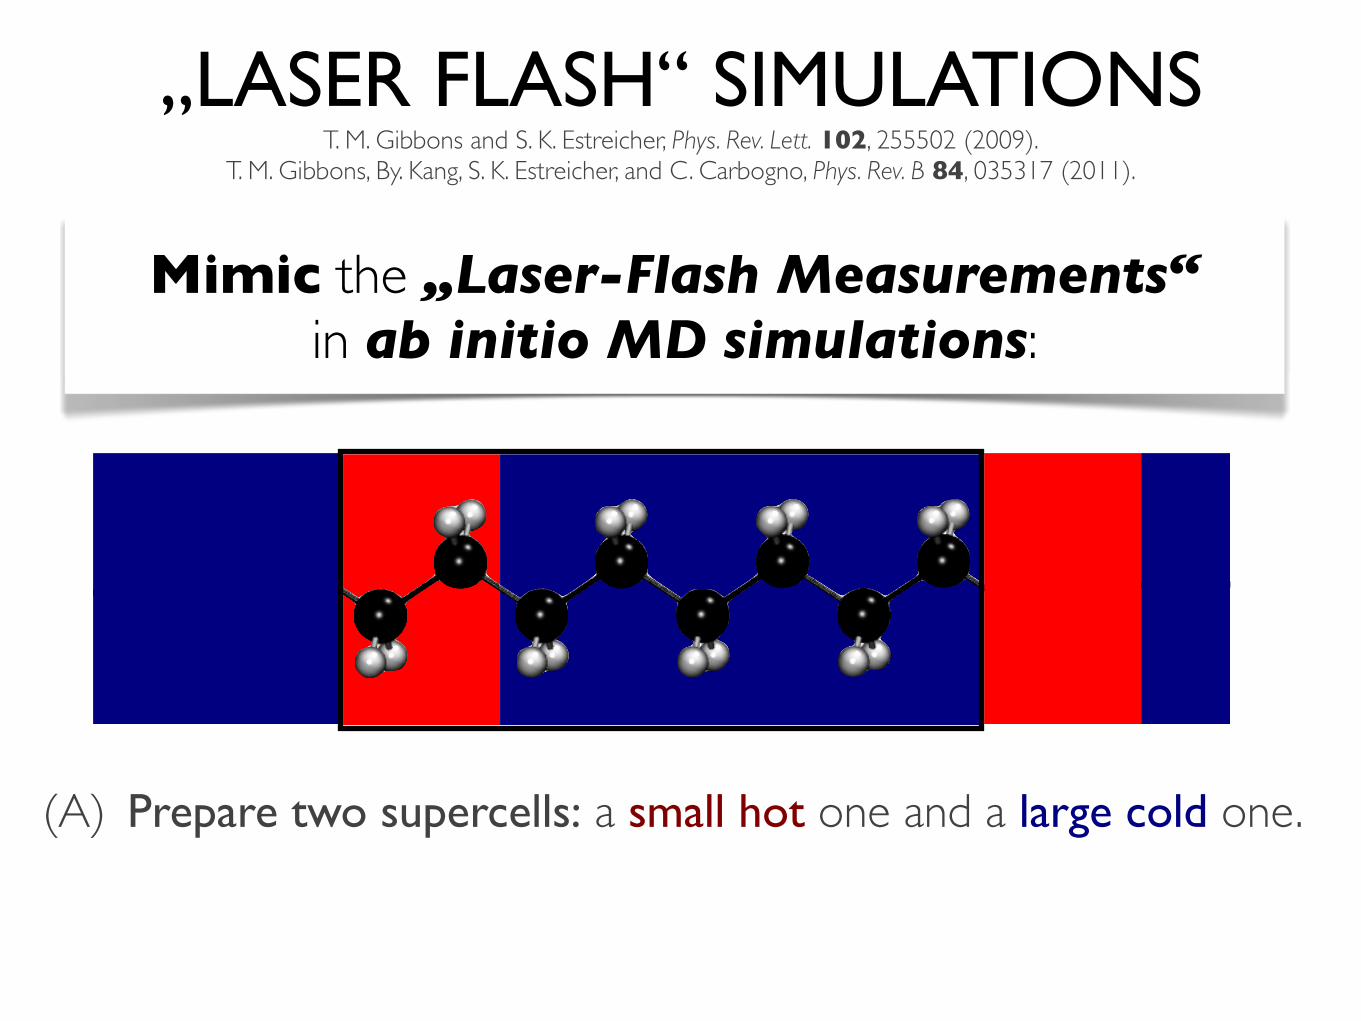
„LASER FLASH“ SIMULATIONST. M. Gibbons and S. K. Estreicher, Phys. Rev. Lett. 102, 255502 (2009).
T. M. Gibbons, By. Kang, S. K. Estreicher, and C. Carbogno, Phys. Rev. B 84, 035317 (2011).
(A) Prepare two supercells: a small hot one and a large cold one.
Mimic the „Laser-Flash Measurements“ in ab initio MD simulations:
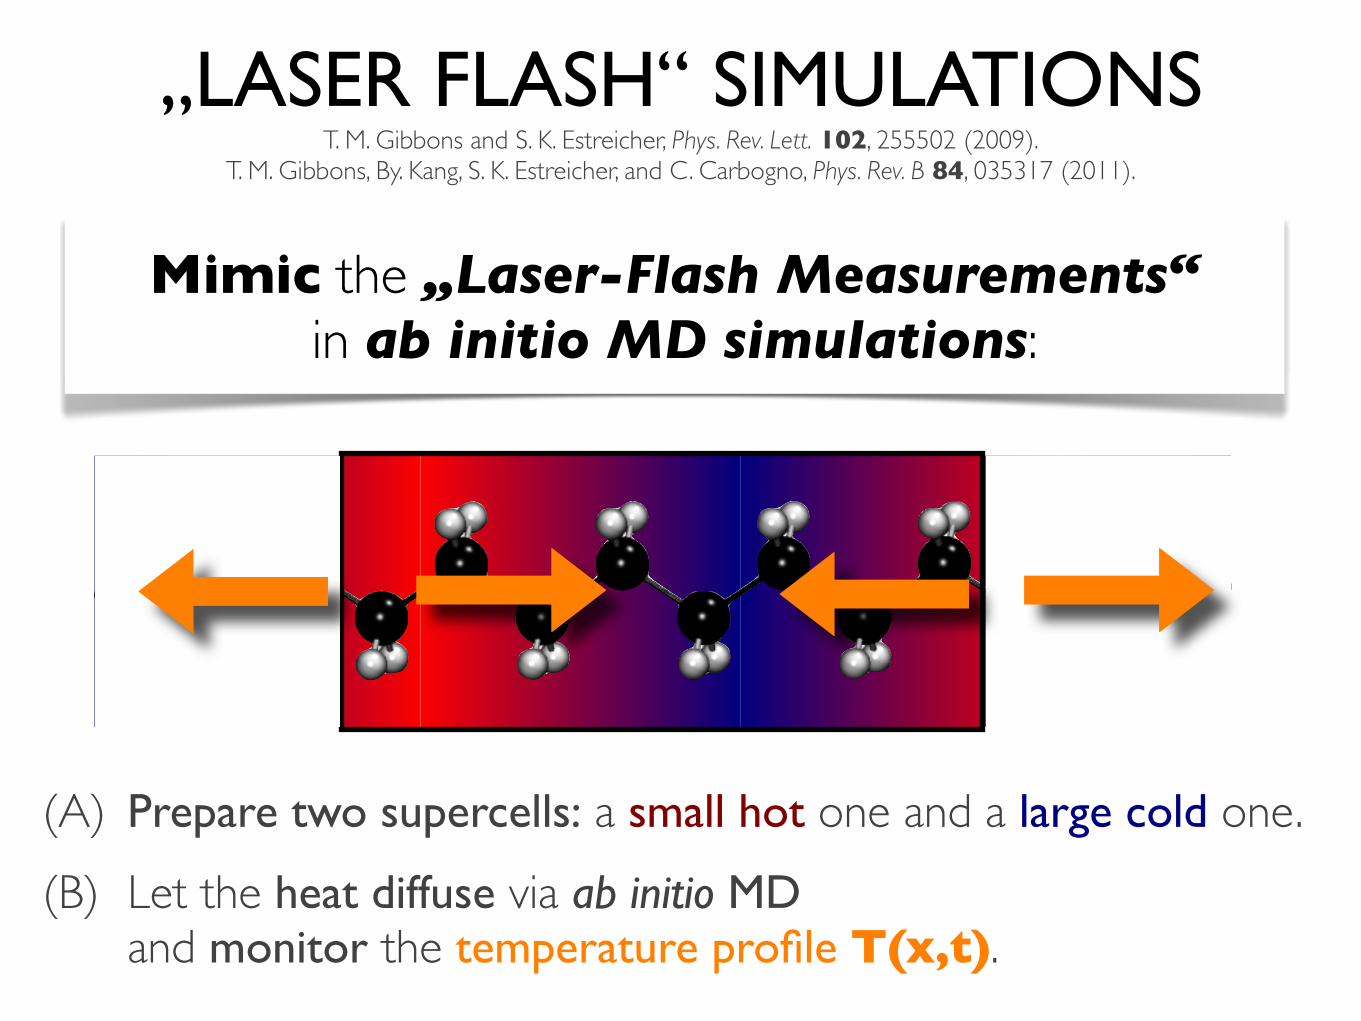
(A) Prepare two supercells: a small hot one and a large cold one.(B) Let the heat diffuse via ab initio MD
and monitor the temperature profile T(x,t).
Mimic the „Laser-Flash Measurements“ in ab initio MD simulations:
„LASER FLASH“ SIMULATIONST. M. Gibbons and S. K. Estreicher, Phys. Rev. Lett. 102, 255502 (2009).
T. M. Gibbons, By. Kang, S. K. Estreicher, and C. Carbogno, Phys. Rev. B 84, 035317 (2011).
FIRST-PRINCIPLES APPROACHES Order of
interactionValidity &
ApplicabilityFinite Size
EffectsDisorder
Boltzmann-Transport Eq.
~�(r3) low T Minute Parameter
Non-Equilib. MD
Full all T Huge as in supercell
Laser-flash MD
Full low T Medium-Large
as in supercell
Green-Kubo MD
Laser-flash MD yields accurate qualitative results at low temperatures within moderate computational costs.
Quantitative predictions require finite size corrections, though.
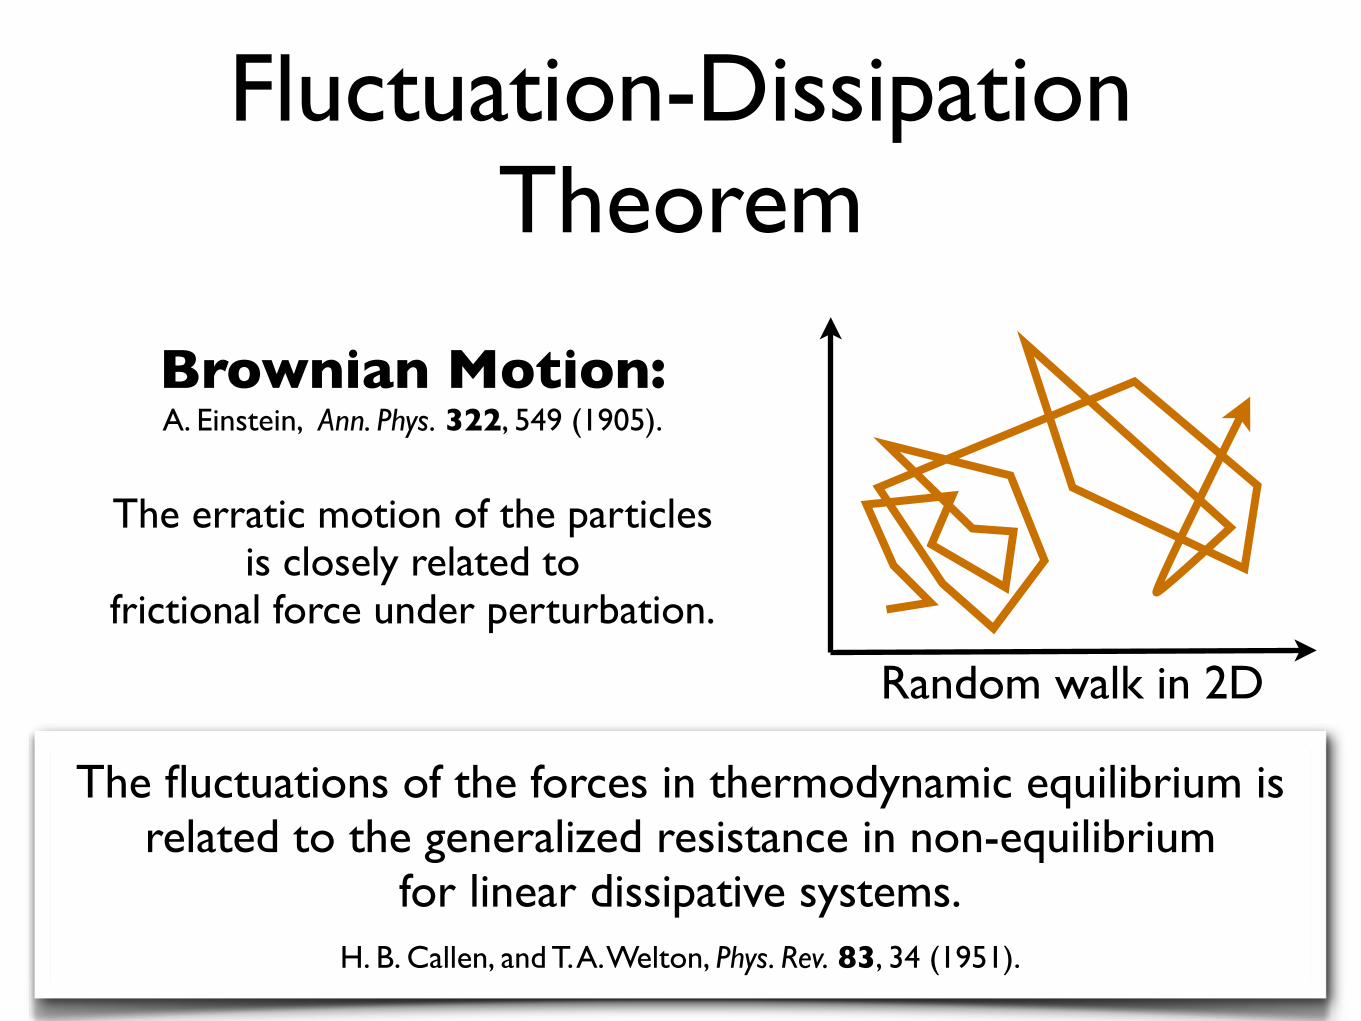
Fluctuation-Dissipation Theorem
The fluctuations of the forces in thermodynamic equilibrium is related to the generalized resistance in non-equilibrium
for linear dissipative systems.H. B. Callen, and T. A. Welton, Phys. Rev. 83, 34 (1951).
Brownian Motion:A. Einstein, Ann. Phys. 322, 549 (1905).
The erratic motion of the particlesis closely related to
frictional force under perturbation.
Random walk in 2D
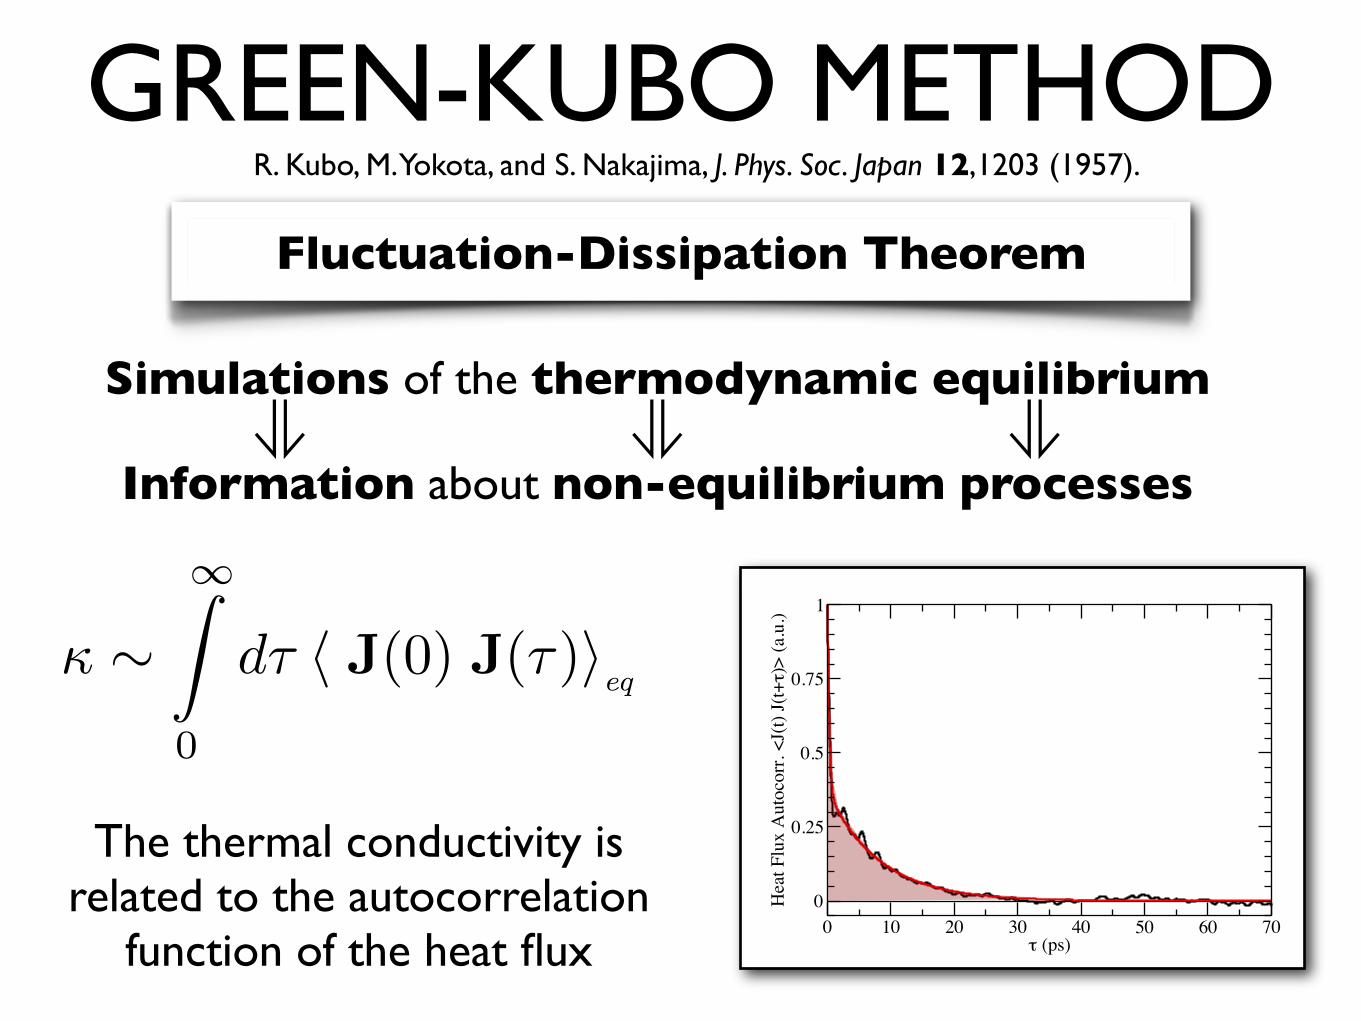
GREEN-KUBO METHODR. Kubo, M. Yokota, and S. Nakajima, J. Phys. Soc. Japan 12,1203 (1957).
The thermal conductivity is related to the autocorrelation
function of the heat flux
Simulations of the thermodynamic equilibrium⇓ ⇓ ⇓
Information about non-equilibrium processes
Fluctuation-Dissipation Theorem
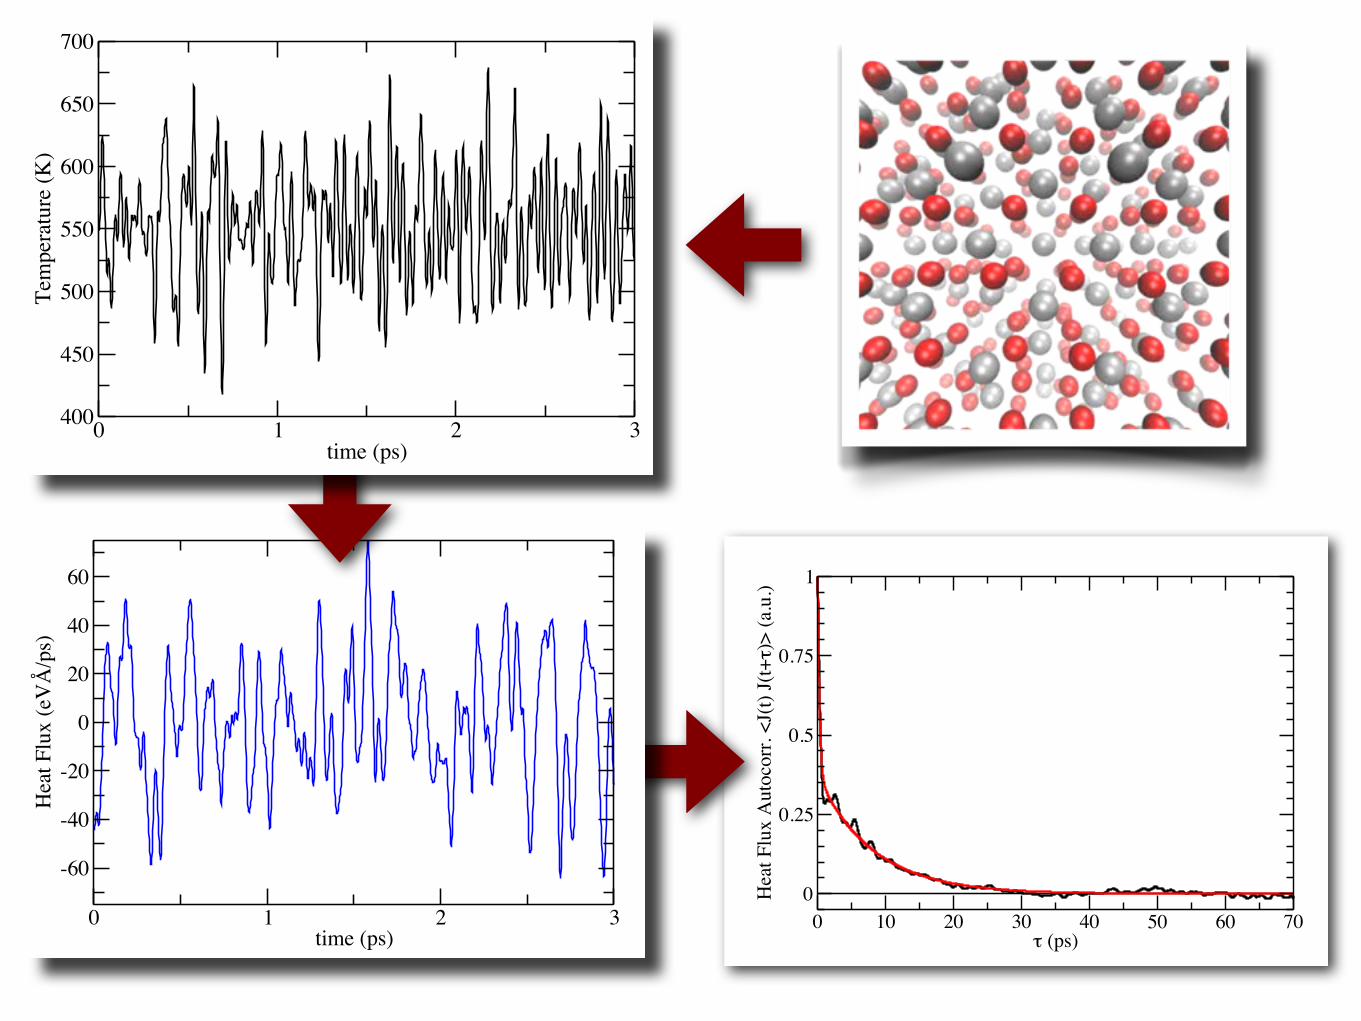
0 10 20 30 40 50 60 70τ (ps)
0
0.25
0.5
0.75
1
Hea
t Flu
x A
utoc
orr.
<J(t)
J(t+τ)
> (a
.u.)
⇠1Z
0
d⌧ h J(0) J(⌧)ieq
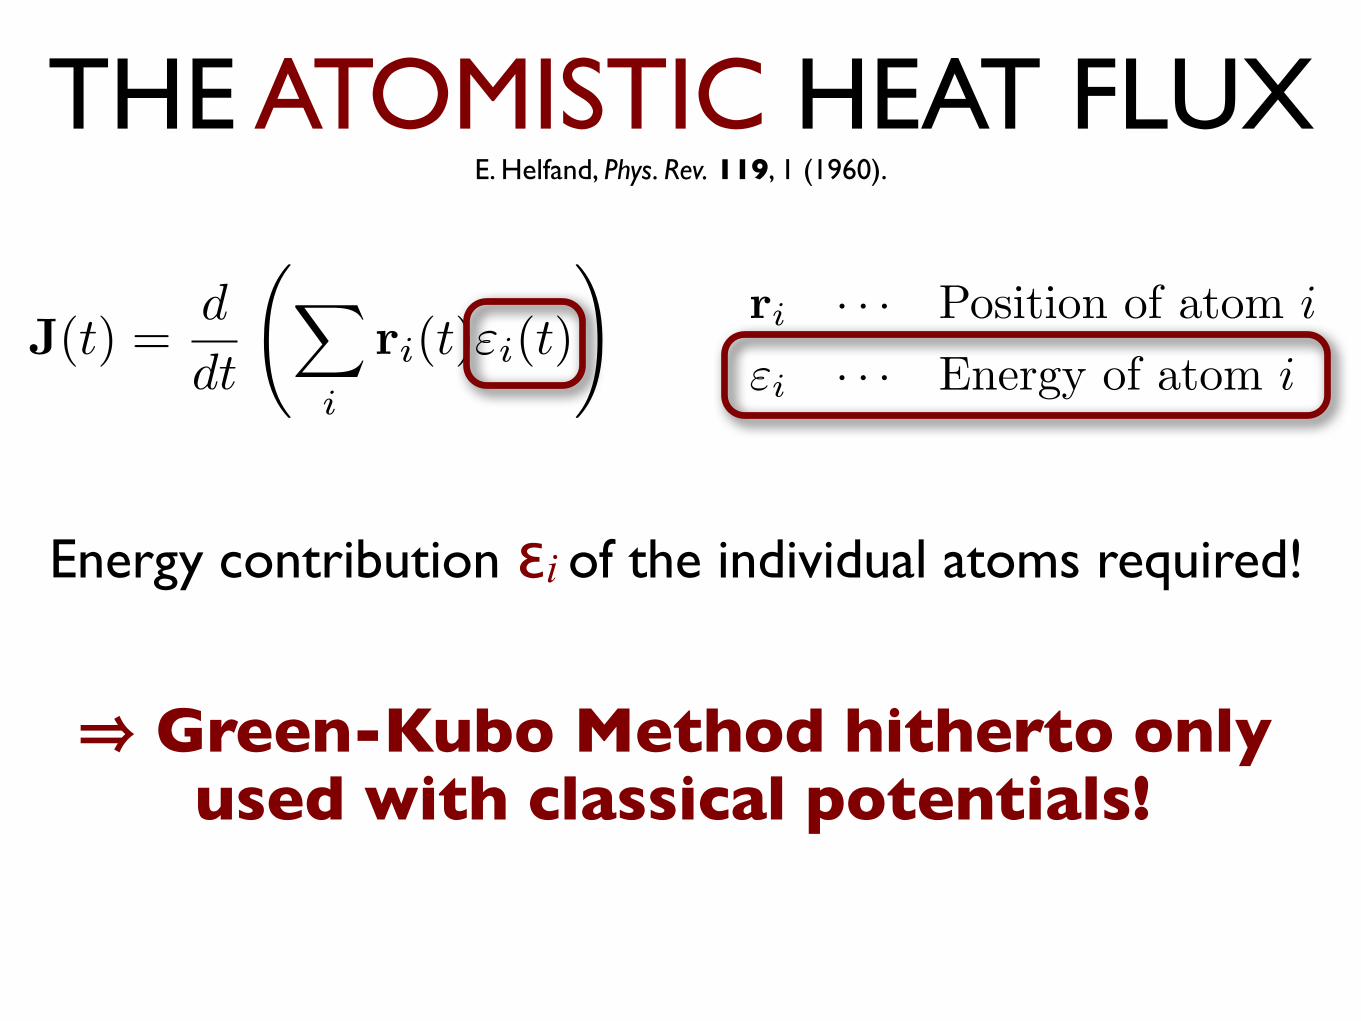
THE ATOMISTIC HEAT FLUXE. Helfand, Phys. Rev. 119, 1 (1960).
J(t) =d
dt
X
i
ri(t)"i(t)
!ri · · · Position of atom i
"i · · · Energy of atom i
Energy contribution εi of the individual atoms required!
⇒ Green-Kubo Method hitherto only used with classical potentials!
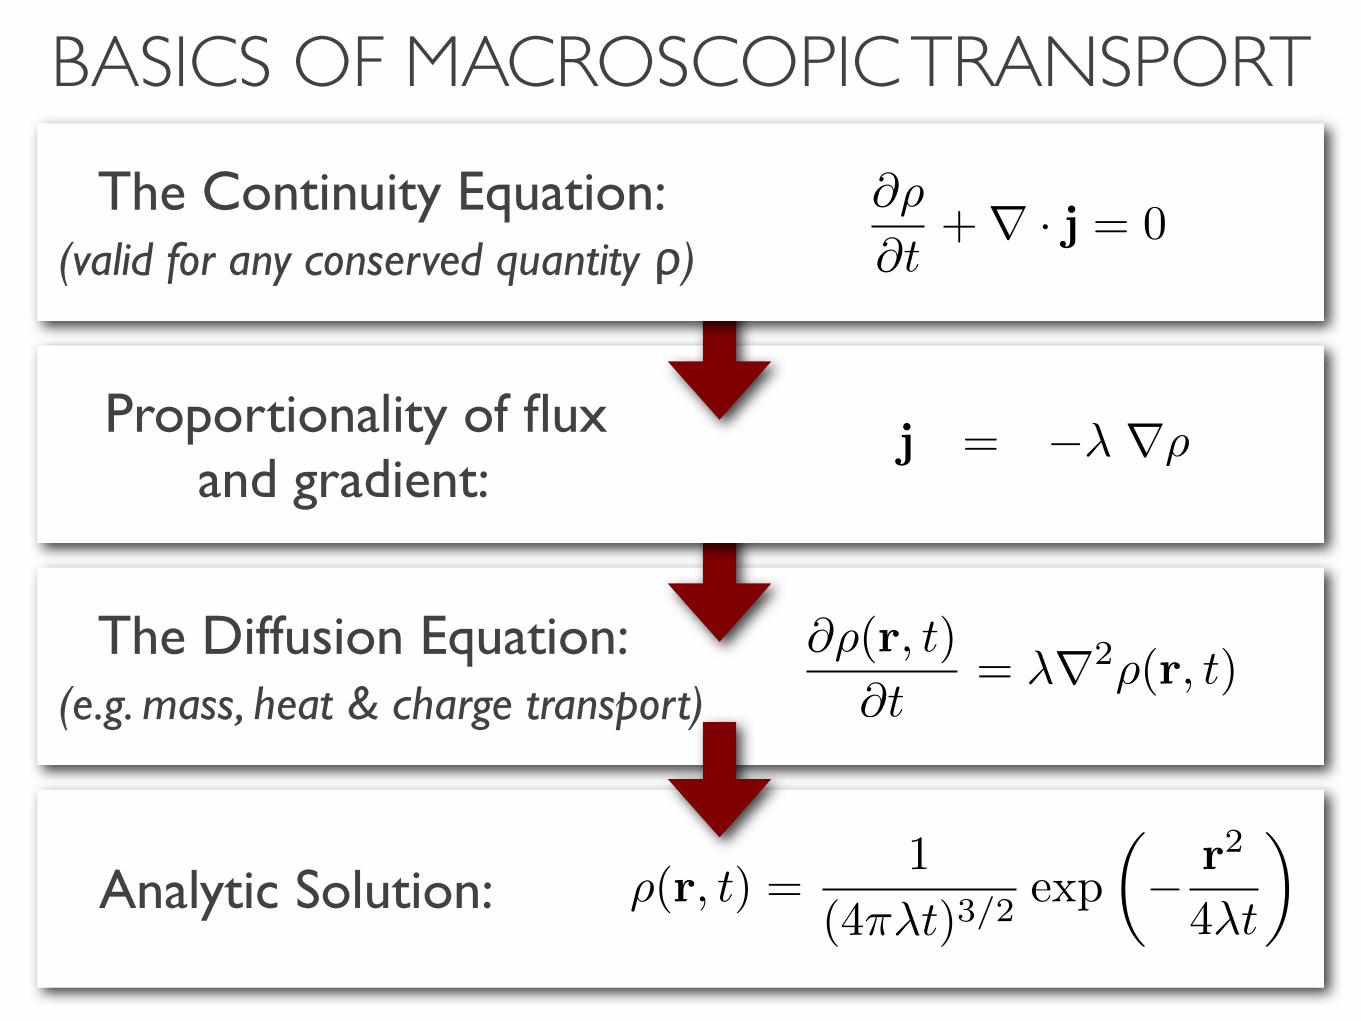
Analytic Solution: ⇢(r, t) =1
(4⇡�t)3/2exp
✓� r2
4�t
◆
BASICS OF MACROSCOPIC TRANSPORT
The Diffusion Equation: (e.g. mass, heat & charge transport)
@⇢(r, t)
@t= �r2⇢(r, t)
Proportionality of flux and gradient:
j = �� r⇢
The Continuity Equation: (valid for any conserved quantity ρ)
@⇢
@t+r · j = 0
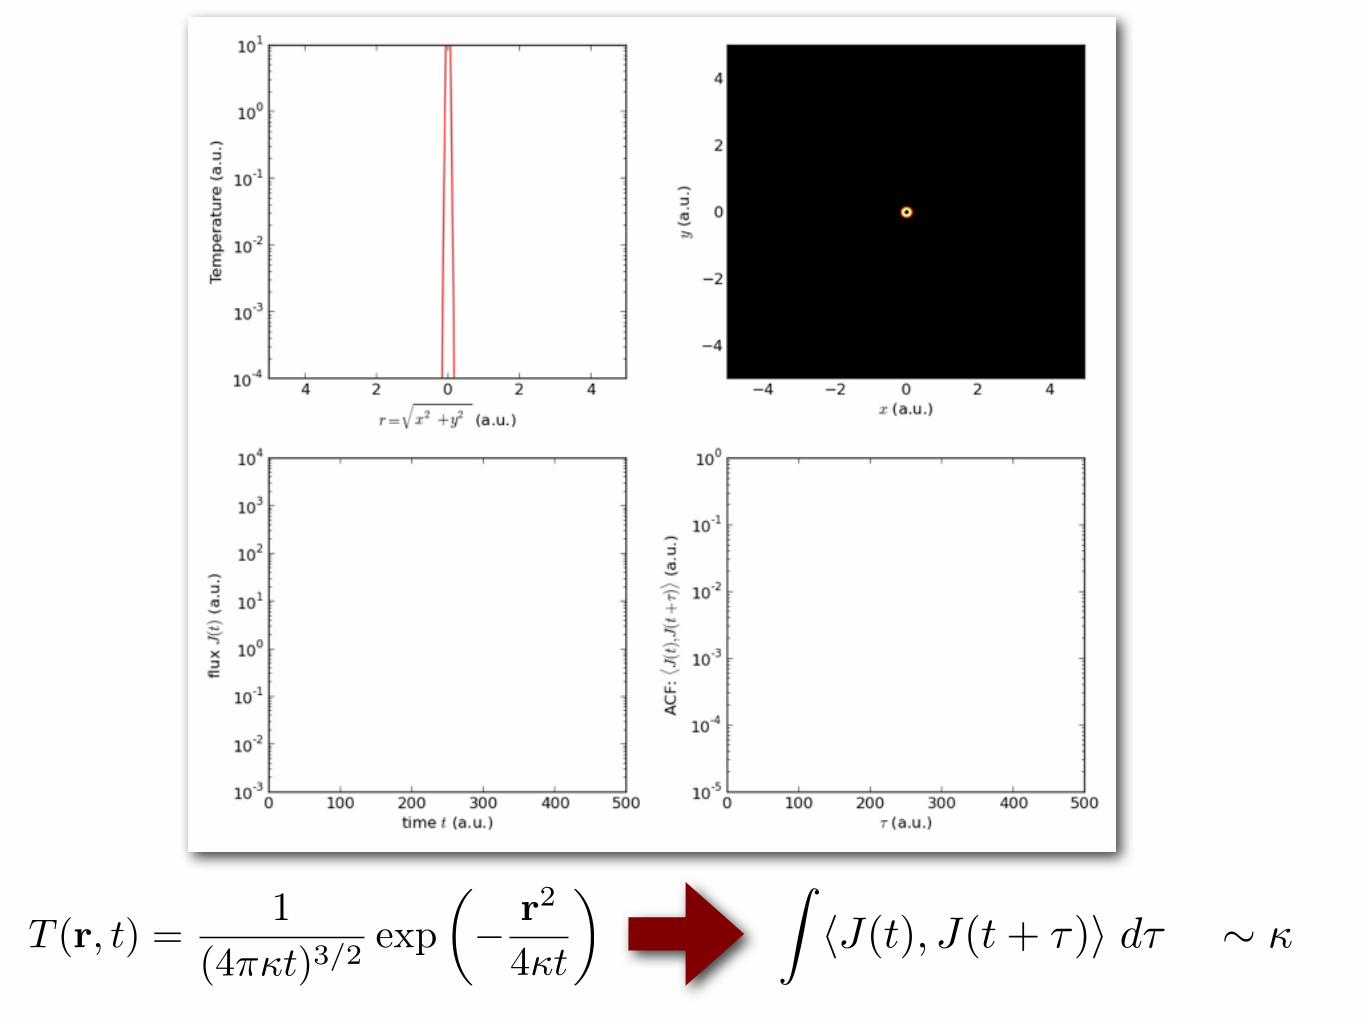
T (r, t) =1
(4⇡t)3/2exp
✓� r2
4t
◆ ZhJ(t), J(t+ ⌧)i d⌧ ⇠
0 10 20 30 40 50 60 70τ (ps)
0
0.25
0.5
0.75
1
Hea
t Flu
x A
utoc
orr.
<J(t)
J(t+τ)
> (a
.u.)
0 1 2 3time (ps)
-60
-40
-20
0
20
40
60
Hea
t Flu
x (e
VÅ
/ps)
0 1 2 3time (ps)
400
450
500
550
600
650
700Te
mpe
ratu
re (K
)
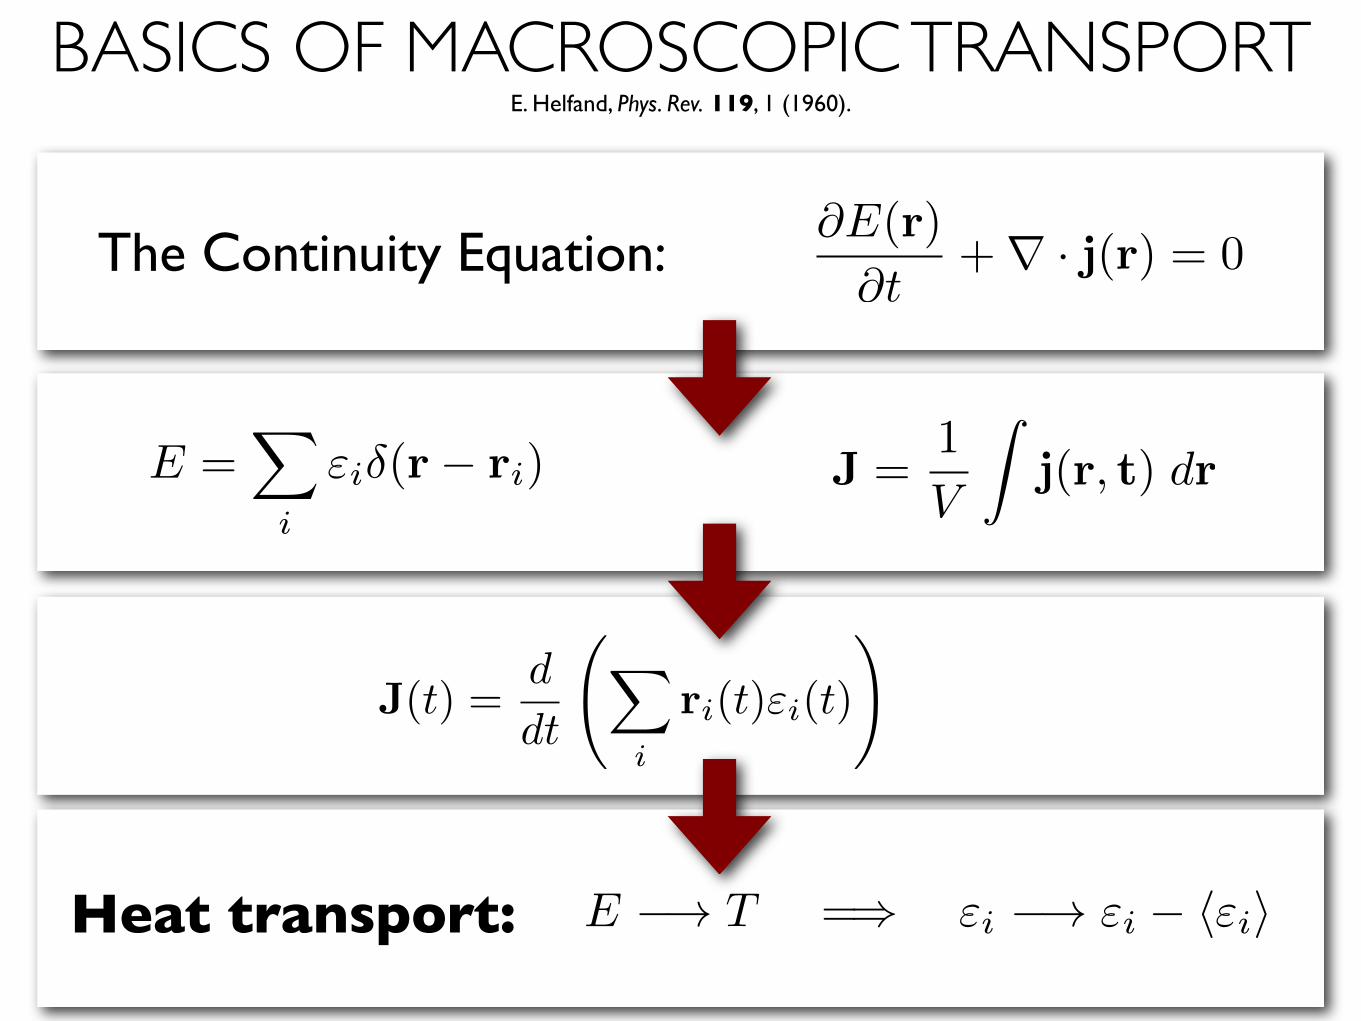
BASICS OF MACROSCOPIC TRANSPORTE. Helfand, Phys. Rev. 119, 1 (1960).
The Continuity Equation:@E(r)
@t+r · j(r) = 0
J =1
V
Zj(r, t) drE =
X
i
"i�(r� ri)
J(t) =d
dt
X
i
ri(t)"i(t)
!
Heat transport: E �! T =) "i �! "i � h"ii
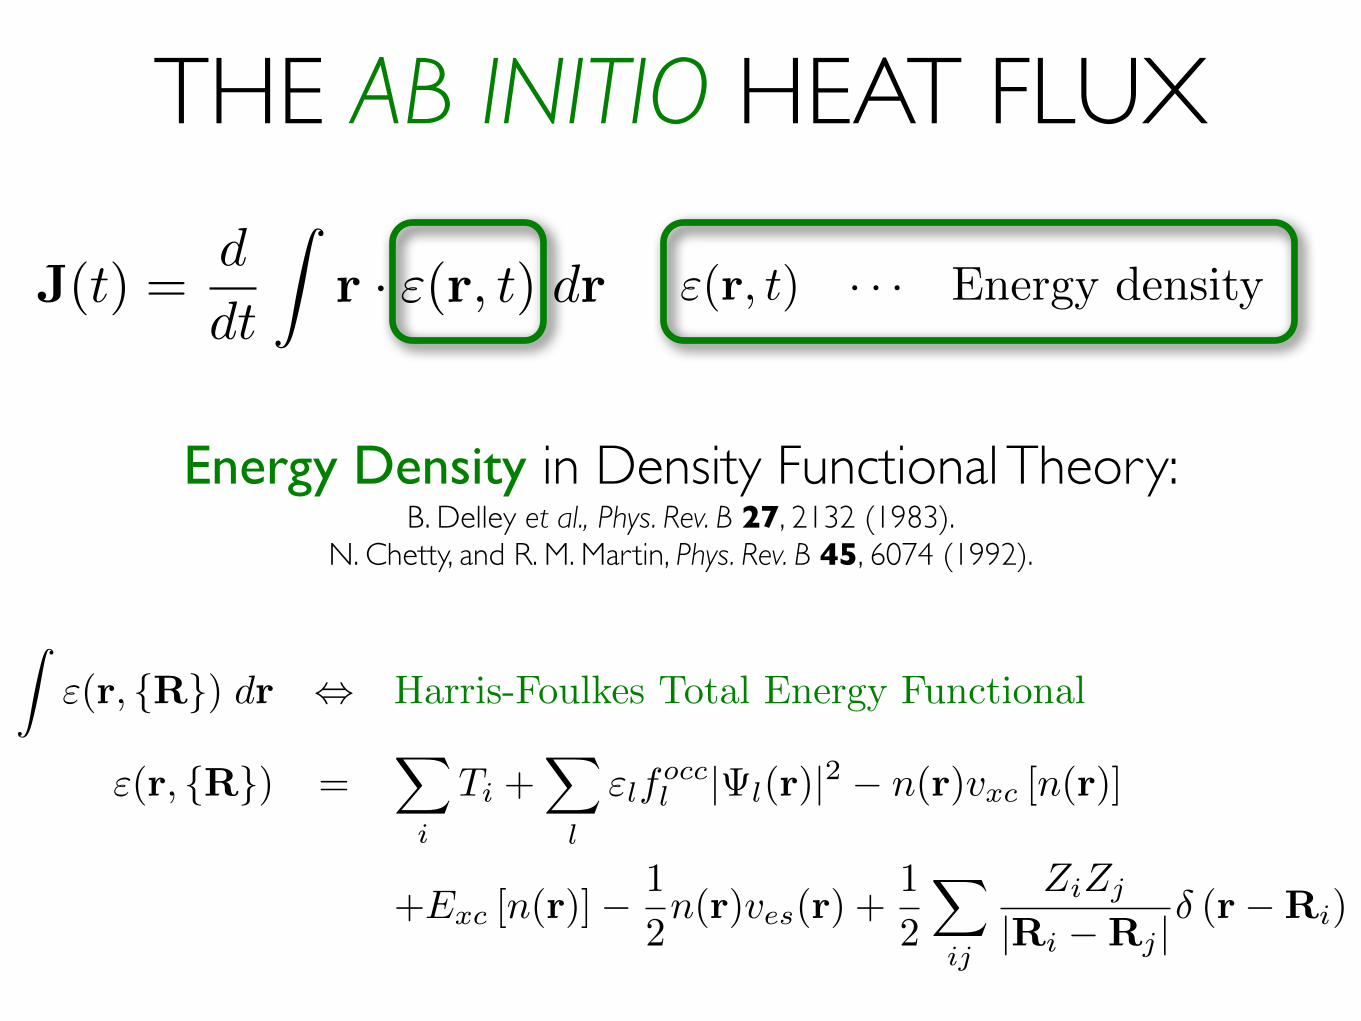
THE AB INITIO HEAT FLUX
J(t) =d
dt
Zr · "(r, t) dr "(r, t) · · · Energy density
Energy Density in Density Functional Theory:B. Delley et al., Phys. Rev. B 27, 2132 (1983).
N. Chetty, and R. M. Martin, Phys. Rev. B 45, 6074 (1992).
Z"(r, {R}) dr , Harris-Foulkes Total Energy Functional
"(r, {R}) =X
i
Ti
+X
l
"l
focc
l
| l
(r)|2 � n(r)vxc
[n(r)]
+Exc
[n(r)]� 1
2n(r)v
es
(r) +1
2
X
ij
Zi
Zj
|Ri
�Rj
|� (r�Ri
)
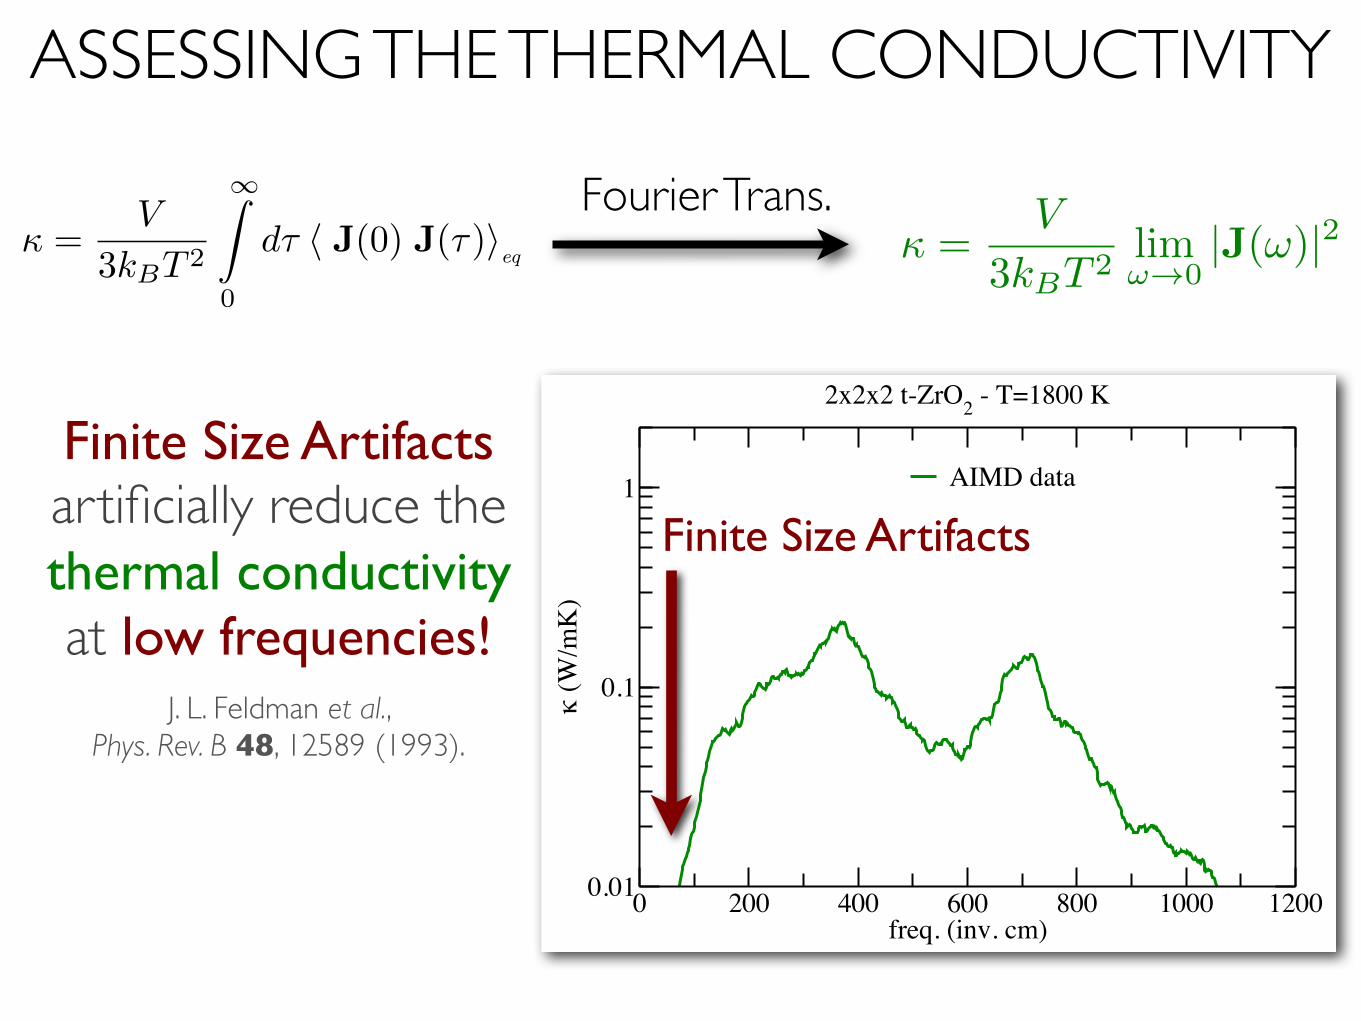
ASSESSING THE THERMAL CONDUCTIVITY
=V
3kBT 2
1Z
0
d⌧ h J(0) J(⌧)ieq
Fourier Trans. =
V
3kBT 2lim!!0
|J(!)|2
0 200 400 600 800 1000 1200freq. (inv. cm)
0.01
0.1
1
κ (W
/mK
)
AIMD data
2x2x2 t-ZrO2 - T=1800 K
Finite Size Artifacts
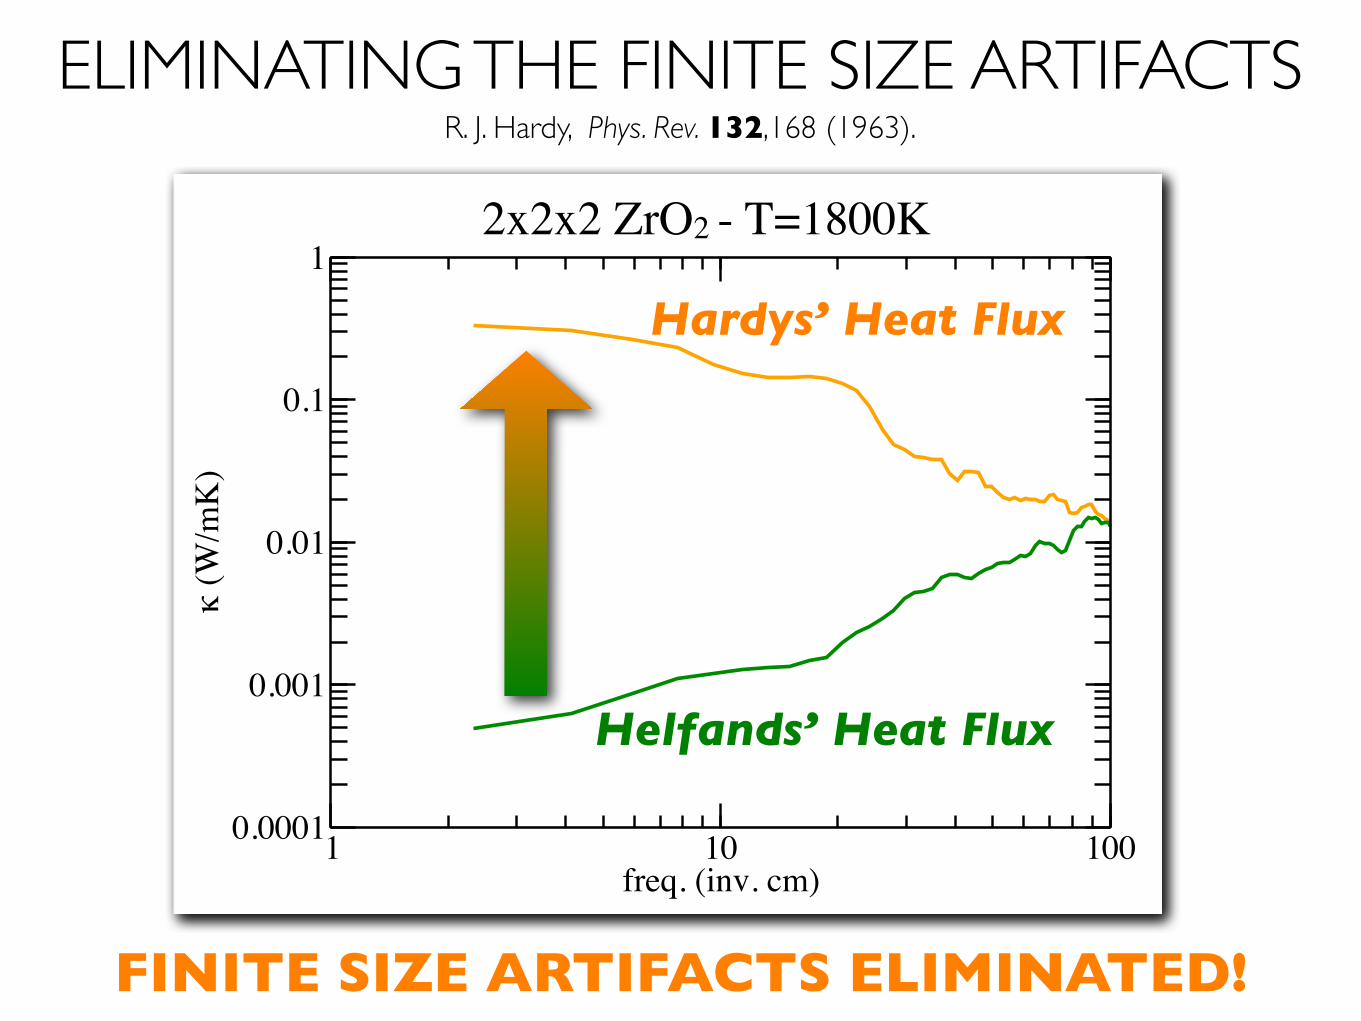
Finite Size Artifacts artificially reduce the thermal conductivity at low frequencies!
J. L. Feldman et al., Phys. Rev. B 48, 12589 (1993).
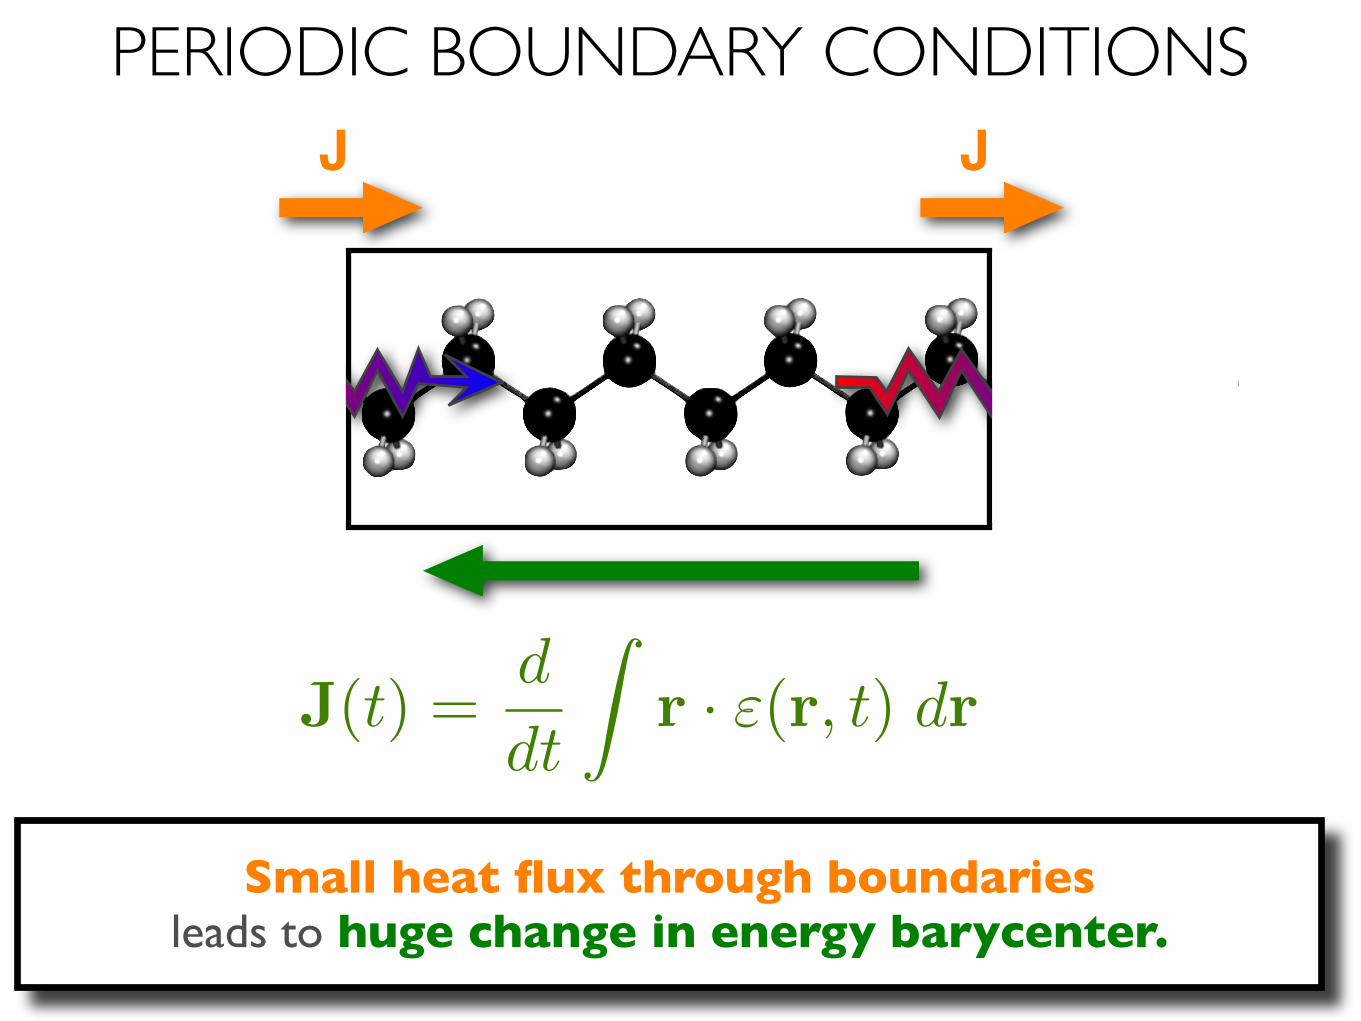
PERIODIC BOUNDARY CONDITIONSJ J
J(t) =d
dt
Zr · "(r, t) dr
Small heat flux through boundaries leads to huge change in energy barycenter.
0 200 400 600 800 1000 1200freq. (inv. cm)
0.01
0.1
1
κ (W
/mK
)
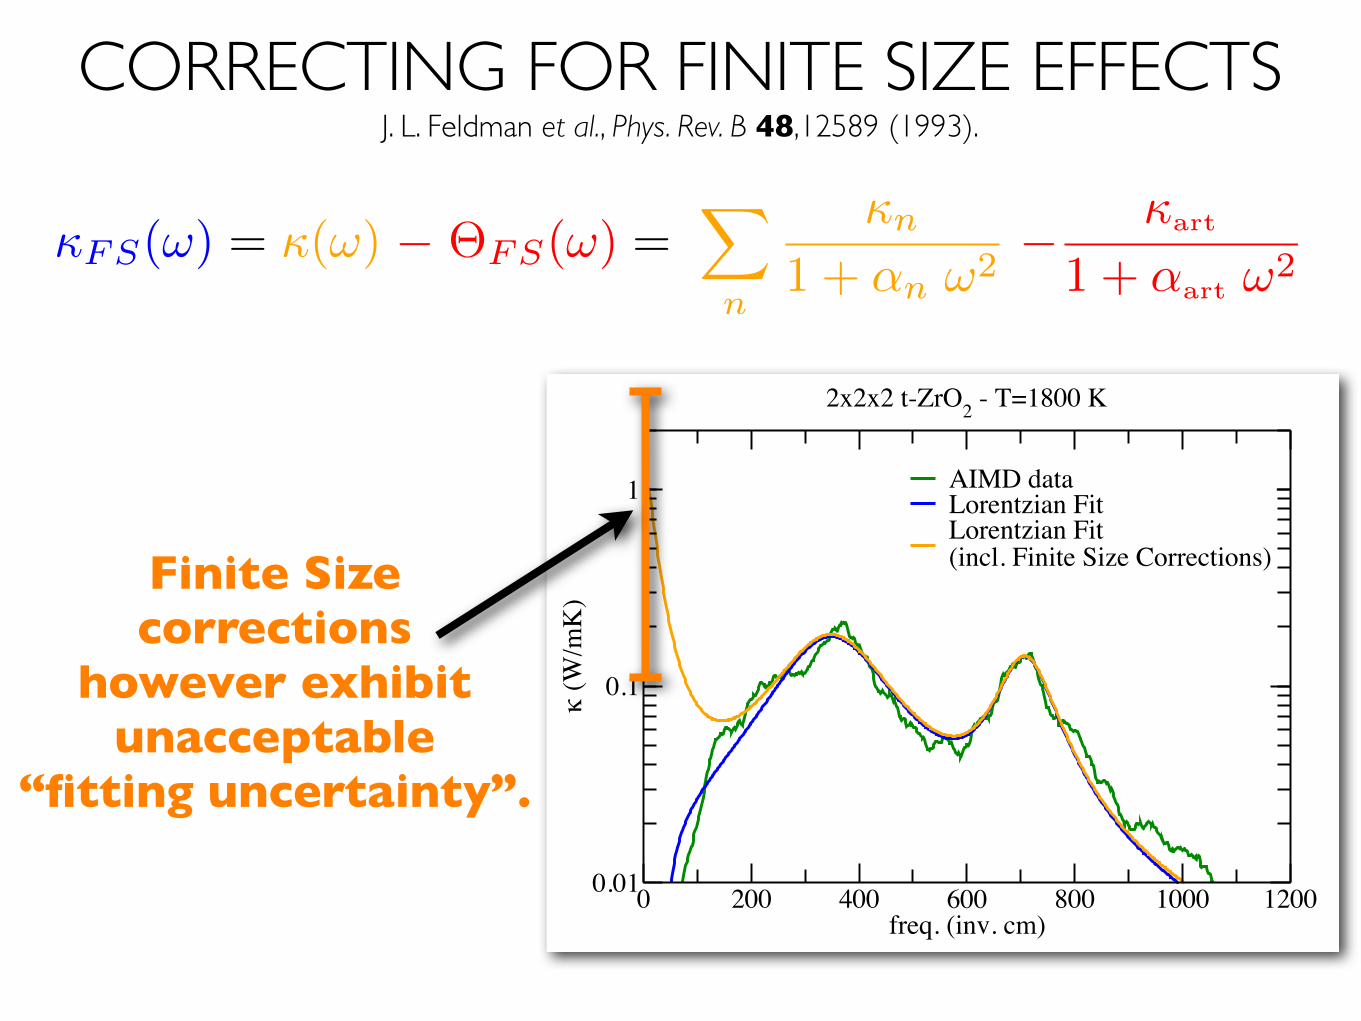
AIMD dataLorentzian FitLorentzian Fit(incl. Finite Size Corrections)
2x2x2 t-ZrO2 - T=1800 K
CORRECTING FOR FINITE SIZE EFFECTSJ. L. Feldman et al., Phys. Rev. B 48,12589 (1993).
FS(!) = (!) � ⇥FS(!) =X
n
n
1 + ↵n !2� art
1 + ↵art !2
Finite Size corrections
however exhibitunacceptable
“fitting uncertainty”.
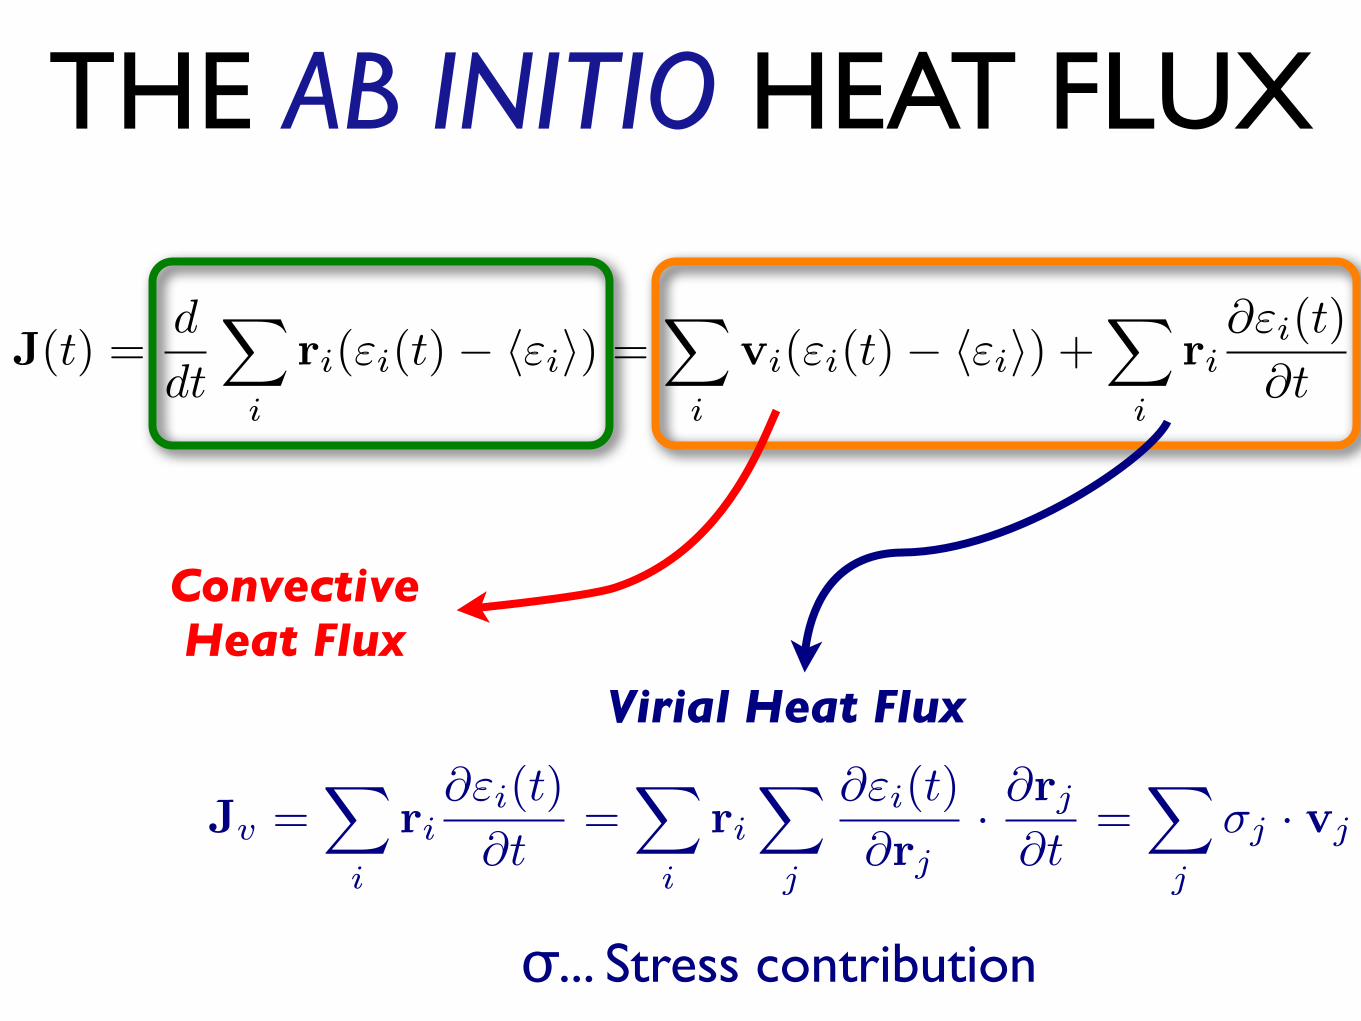
Convective Heat Flux
Virial Heat Flux
σ... Stress contribution
THE AB INITIO HEAT FLUX
Jv =X
i
ri@"i(t)
@t=
X
i
riX
j
@"i(t)
@rj· @rj@t
=X
j
�j · vj
J(t) =d
dt
X
i
ri("i(t)� h"ii) =X
i
vi("i(t)� h"ii) +X
i
ri@"i(t)
@t
Convective Heat Flux
Virial Heat Flux
σ... Stress contribution
THE AB INITIO HEAT FLUX
Jv =X
i
ri@"i(t)
@t=
X
i
riX
j
@"i(t)
@rj· @rj@t
=X
j
�j · vj
J(t) =d
dt
X
i
ri("i(t)� h"ii) =X
i
vi("i(t)� h"ii) +X
i
ri@"i(t)
@t
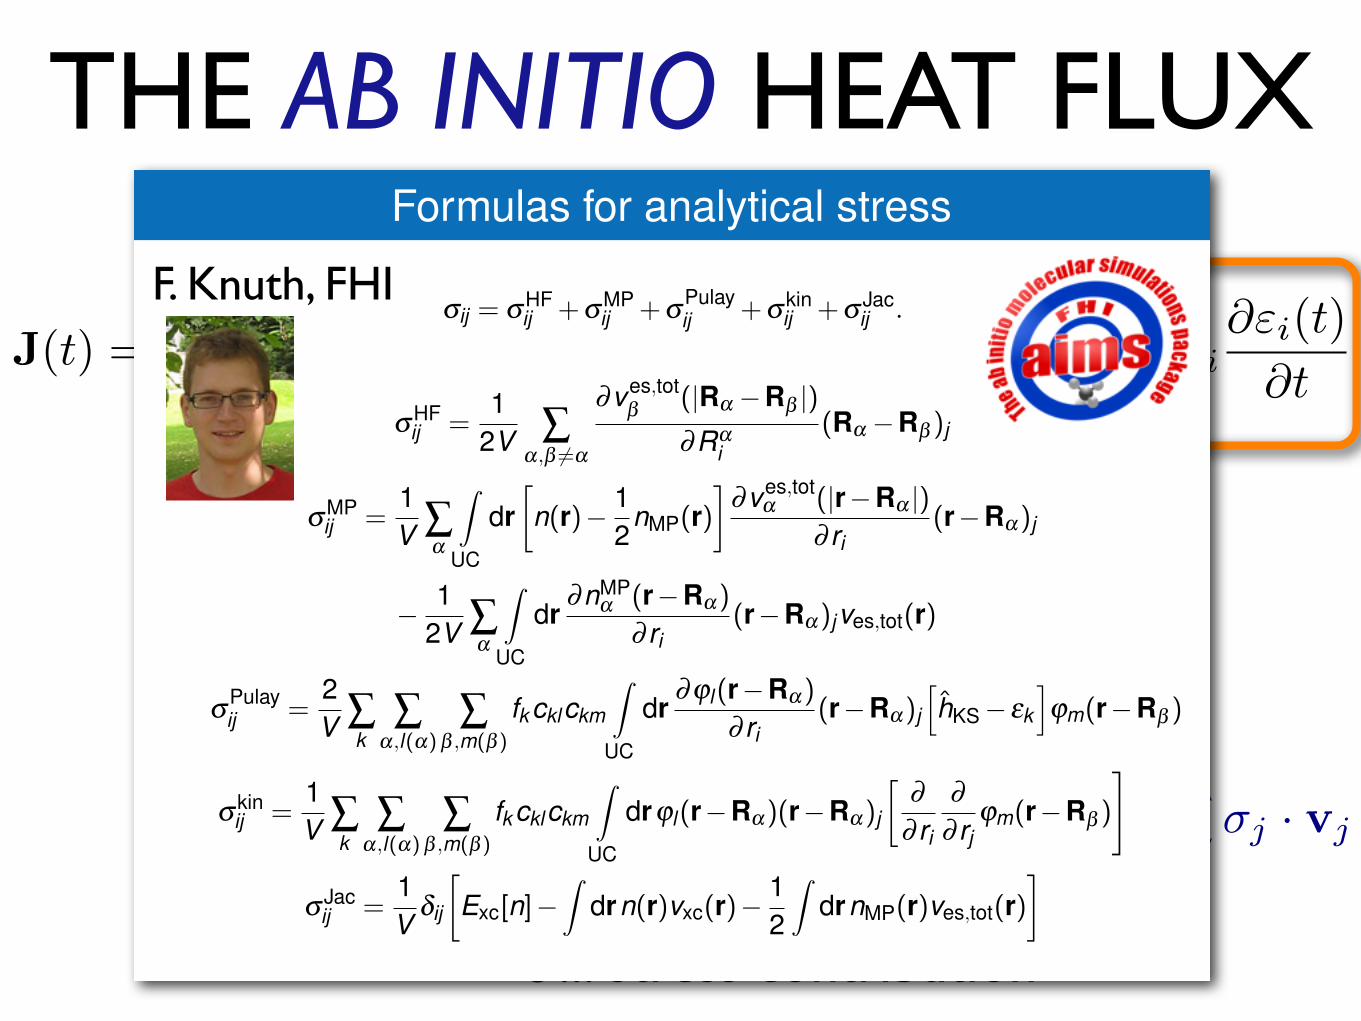
Formulas for analytical stress
sij = sHFij +sMP
ij +sPulayij +skin
ij +sJacij .
sHFij =
12V Â
a,b 6=a
∂ves,totb (|Ra �Rb |)
∂Rai
(Ra �Rb )j
sMPij =
1V Â
a
Z
UC
drn(r)� 1
2nMP(r)
�∂ves,tot
a (|r�Ra |)∂ ri
(r�Ra)j
� 12V Â
a
Z
UC
dr∂nMP
a (r�Ra)
∂ ri(r�Ra)j ves,tot(r)
sPulayij =
2V Â
kÂ
a,l(a)Â
b ,m(b)fkcklckm
Z
UC
dr∂jl(r�Ra)
∂ ri(r�Ra)j
hhKS � ek
ijm(r�Rb )
skinij =
1V Â
kÂ
a,l(a)Â
b ,m(b)fkcklckm
Z
UC
drjl(r�Ra)(r�Ra)j
∂
∂ ri
∂∂ rj
jm(r�Rb )
#
sJacij =
1V
dij
Exc[n]�
Zdrn(r)vxc(r)�
12
ZdrnMP(r)ves,tot(r)
�
F. Knuth, FHI
1 10 100freq. (inv. cm)
0.0001
0.001
0.01
0.1
1κ
(W/m
K)
1 10 100freq. (inv. cm)
0.0001
0.001
0.01
0.1
1κ
(W/m
K)
Helfands’ Heat Flux
1 10 100freq. (inv. cm)
0.0001
0.001
0.01
0.1
1κ
(W/m
K)
FINITE SIZE ARTIFACTS ELIMINATED!
Hardys’ Heat Flux
Helfands’ Heat Flux
ELIMINATING THE FINITE SIZE ARTIFACTSR. J. Hardy, Phys. Rev. 132,168 (1963).
2x2x2 ZrO2 - T=1800K
500 1000 1500 2000Temperature (K)
2
4
6
8
10
κ (W
/mK
)
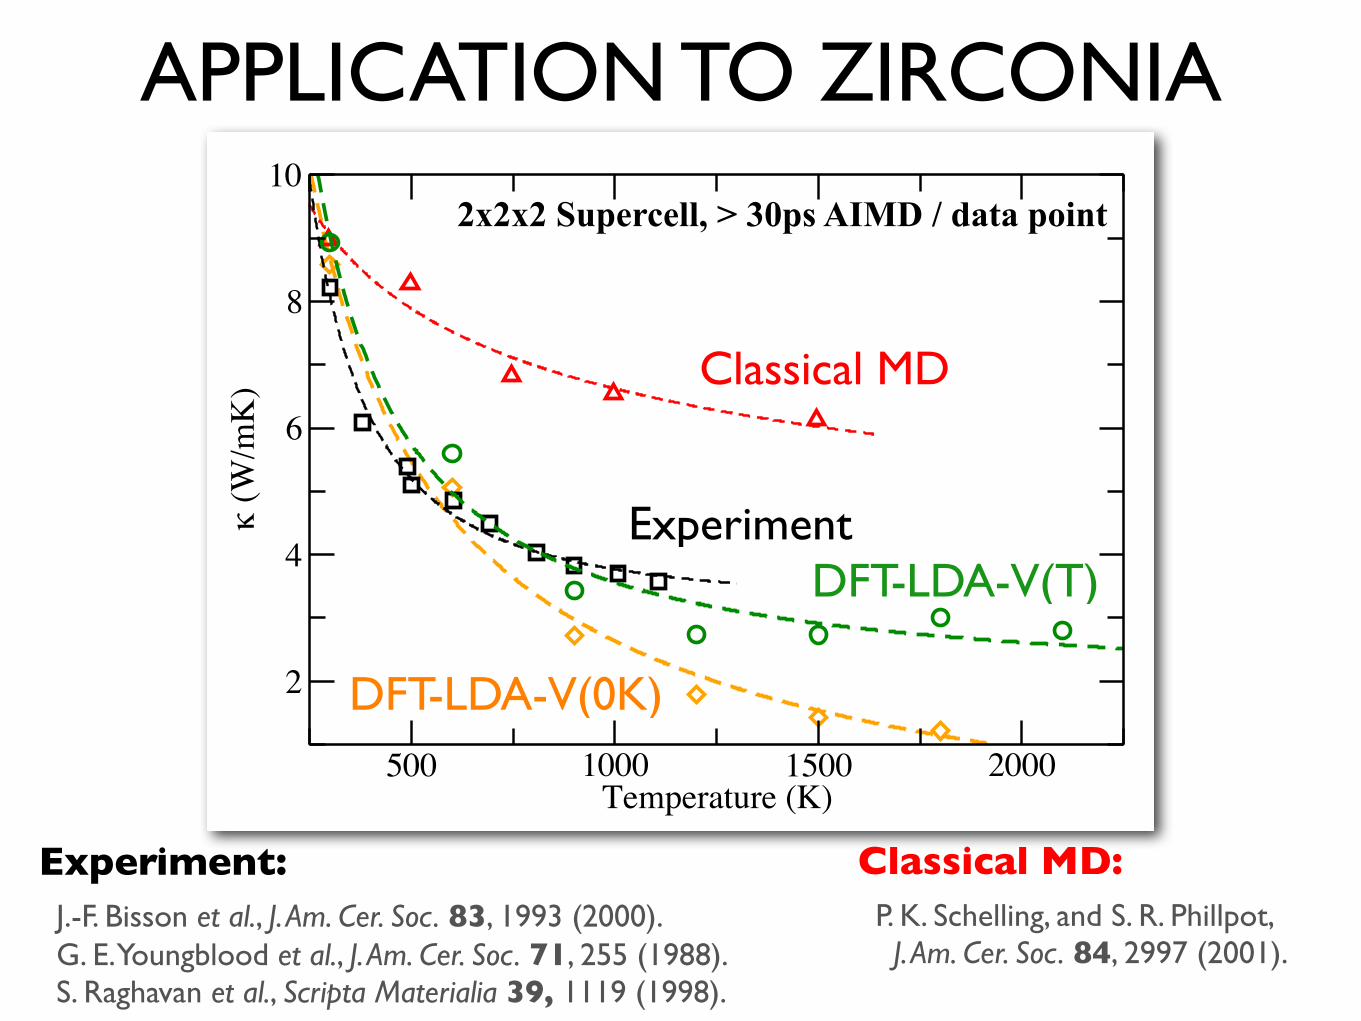
APPLICATION TO ZIRCONIA
Experiment
Classical MD
DFT-LDA-V(T)
2x2x2 Supercell, > 30ps AIMD / data point
Experiment: J.-F. Bisson et al., J. Am. Cer. Soc. 83, 1993 (2000). G. E. Youngblood et al., J. Am. Cer. Soc. 71, 255 (1988). S. Raghavan et al., Scripta Materialia 39, 1119 (1998).
Classical MD: P. K. Schelling, and S. R. Phillpot, J. Am. Cer. Soc. 84, 2997 (2001).
DFT-LDA-V(0K)
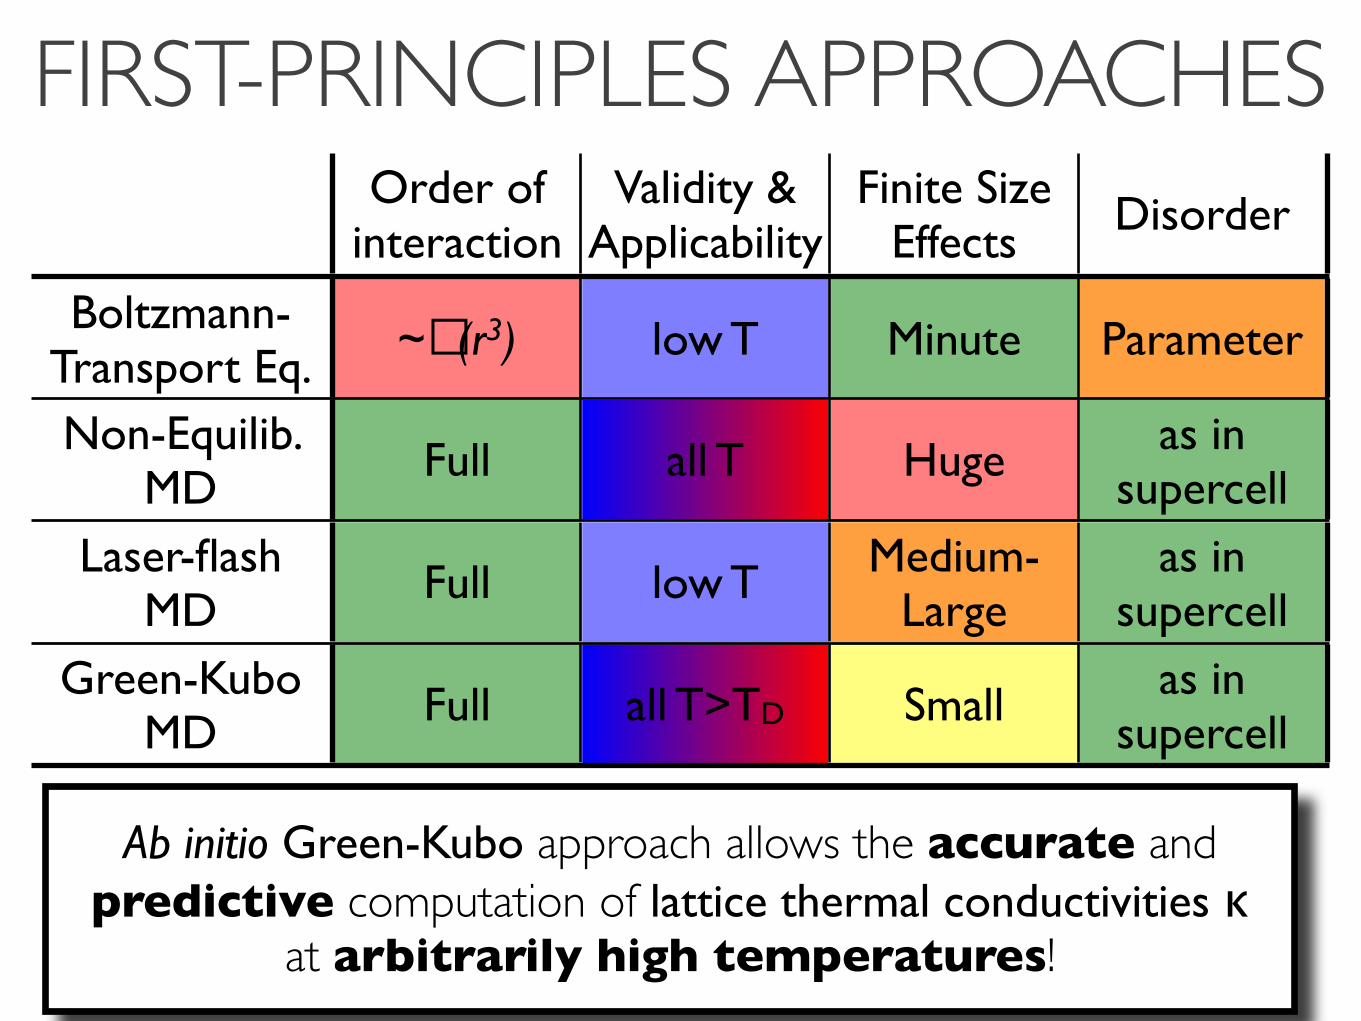
FIRST-PRINCIPLES APPROACHES Order of
interactionValidity &
ApplicabilityFinite Size
EffectsDisorder
Boltzmann-Transport Eq.
~�(r3) low T Minute Parameter
Non-Equilib. MD
Full all T Huge as in supercell
Laser-flash MD
Full low T Medium-Large
as in supercell
Green-Kubo MD
Full all T>TD Small as in supercell
Ab initio Green-Kubo approach allows the accurate and predictive computation of lattice thermal conductivities κ
at arbitrarily high temperatures!
...for the mathematicians...
Outlook & Discussion
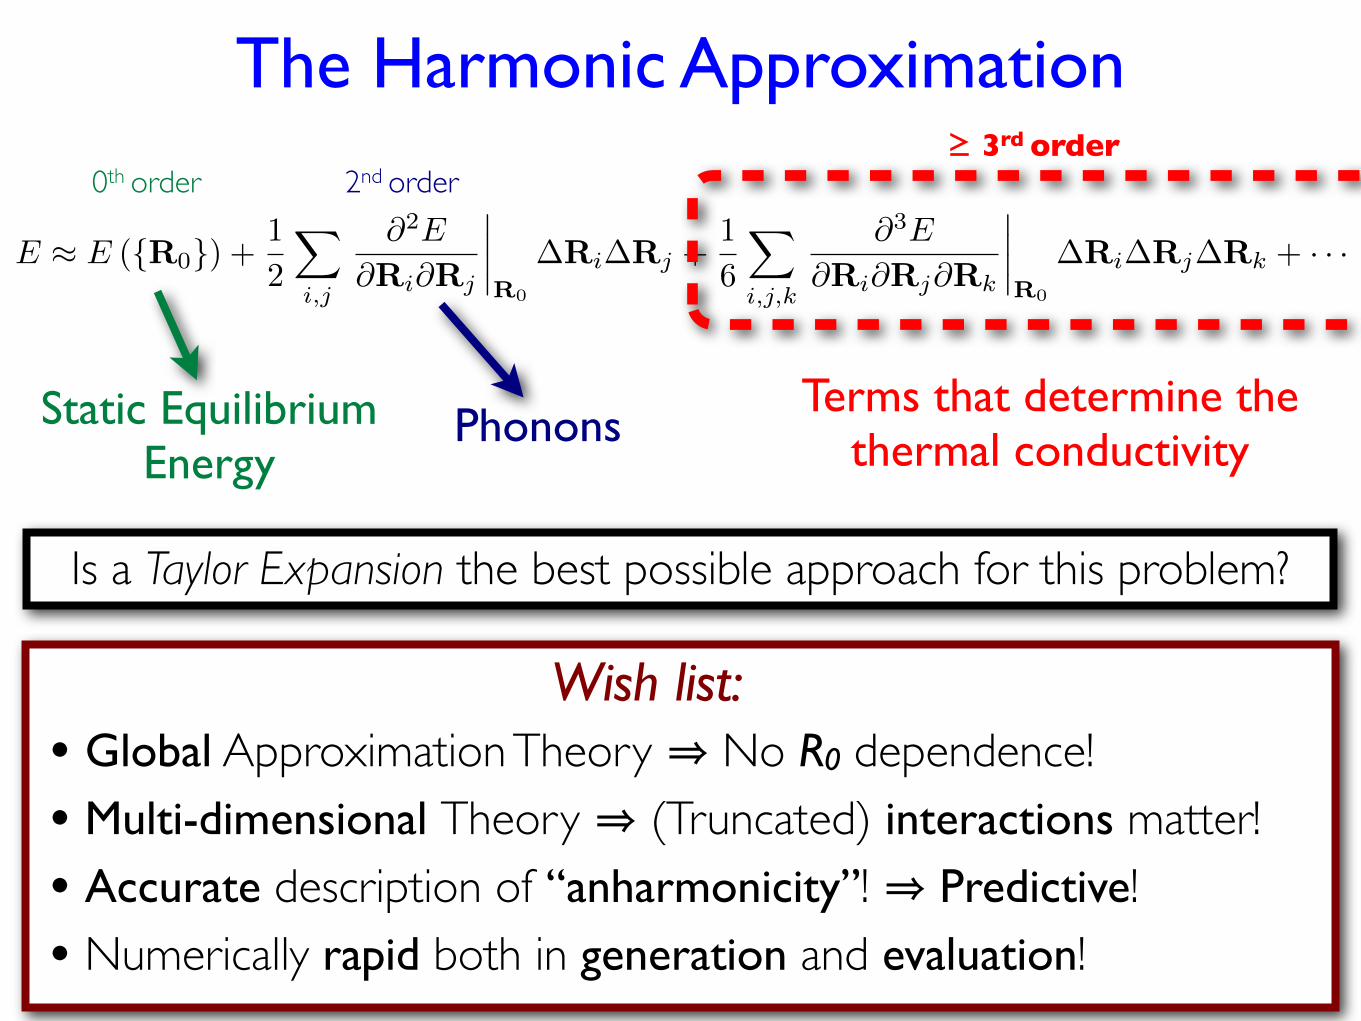
The Harmonic Approximation
E ⇡ E ({R0}) +1
2
X
i,j
@2E
@Ri@Rj
����R0
�Ri�Rj +1
6
X
i,j,k
@3E
@Ri@Rj@Rk
����R0
�Ri�Rj�Rk + · · ·
Static Equilibrium Energy
0th order
Phonons
2nd order
Terms that determine the thermal conductivity
≥ 3rd order
Is a Taylor Expansion the best possible approach for this problem?
• Global Approximation Theory ⇒ No R0 dependence!• Multi-dimensional Theory ⇒ (Truncated) interactions matter!• Accurate description of “anharmonicity”! ⇒ Predictive!• Numerically rapid both in generation and evaluation!
Wish list:

...for the rest of us...
Outlook & Discussion
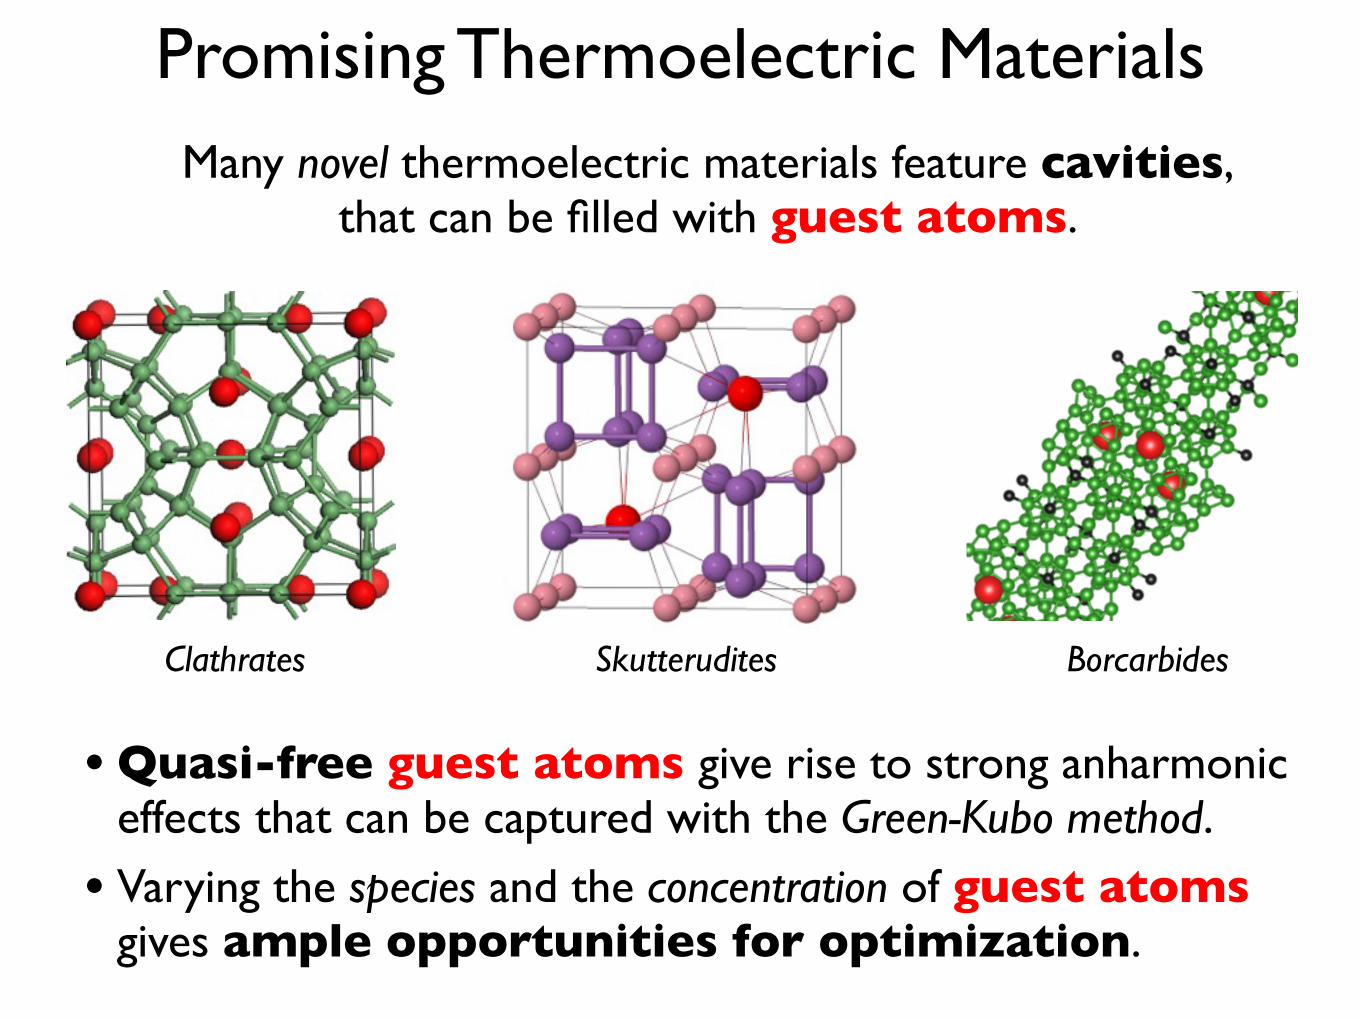
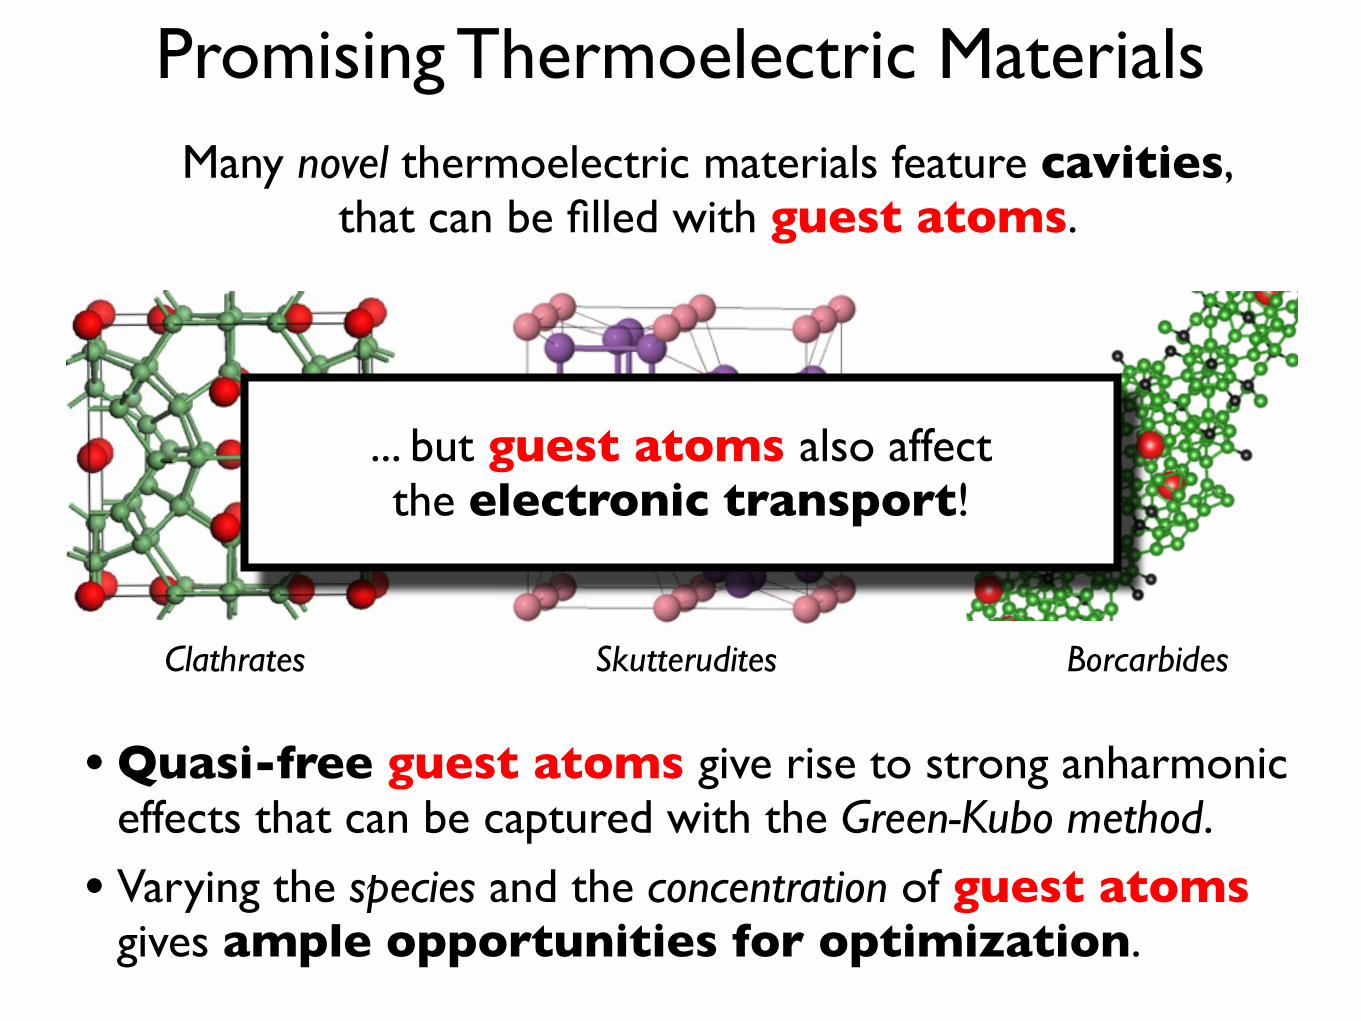
Promising Thermoelectric Materials
Clathrates Skutterudites Borcarbides
Many novel thermoelectric materials feature cavities,that can be filled with guest atoms.
•Quasi-free guest atoms give rise to strong anharmonic effects that can be captured with the Green-Kubo method.
• Varying the species and the concentration of guest atoms gives ample opportunities for optimization.
... but guest atoms also affect the electronic transport!
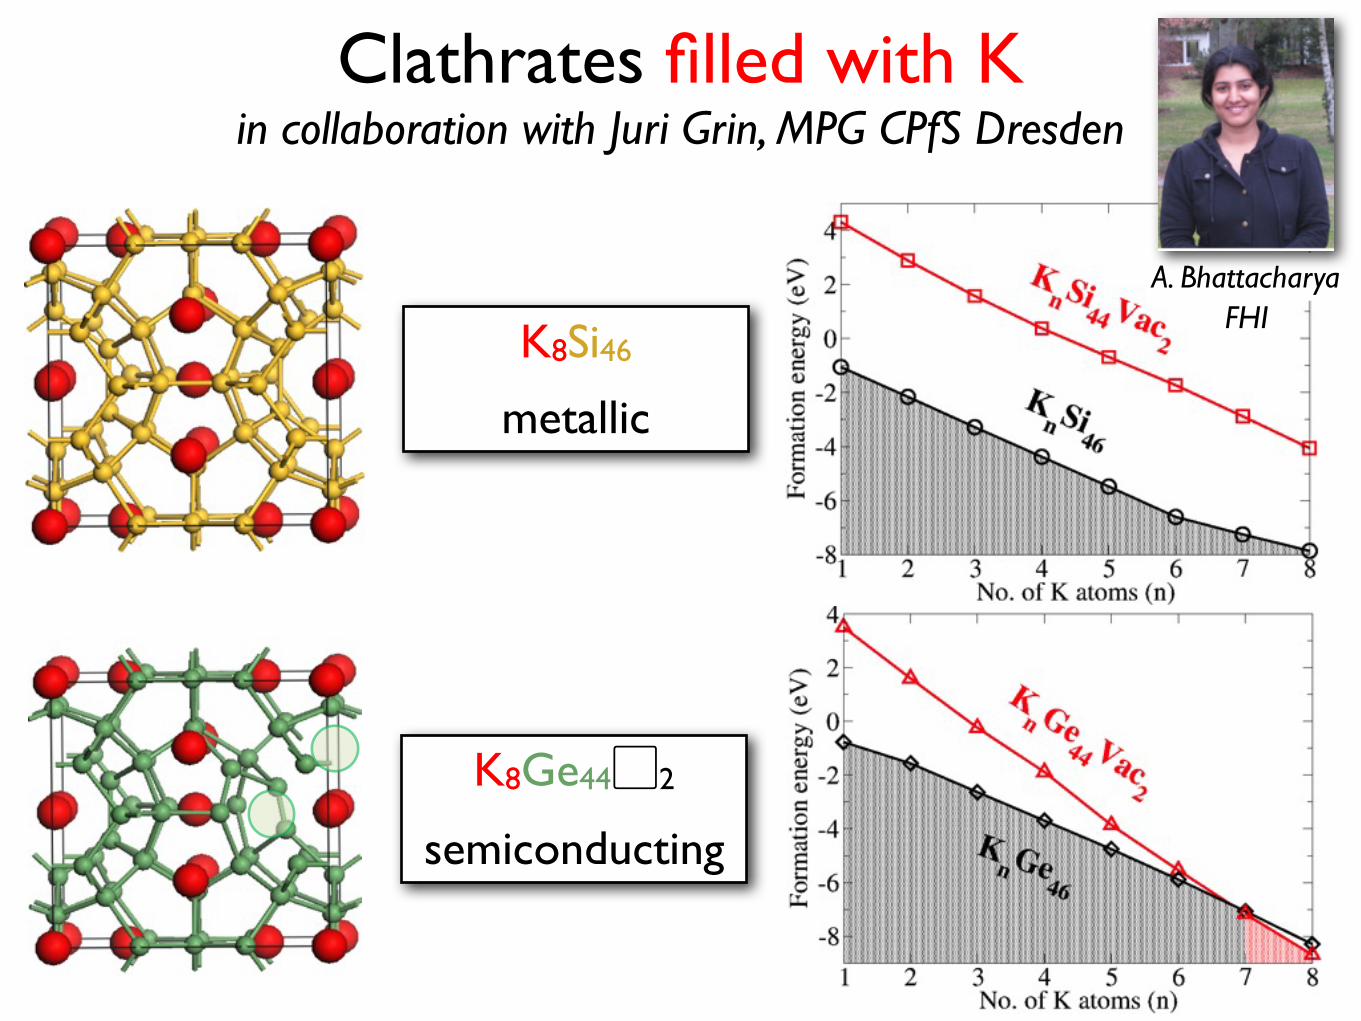
Clathrates filled with Kin collaboration with Juri Grin, MPG CPfS Dresden
K8Si46
metallic
K8Ge44▢2
semiconducting
A. BhattacharyaFHI
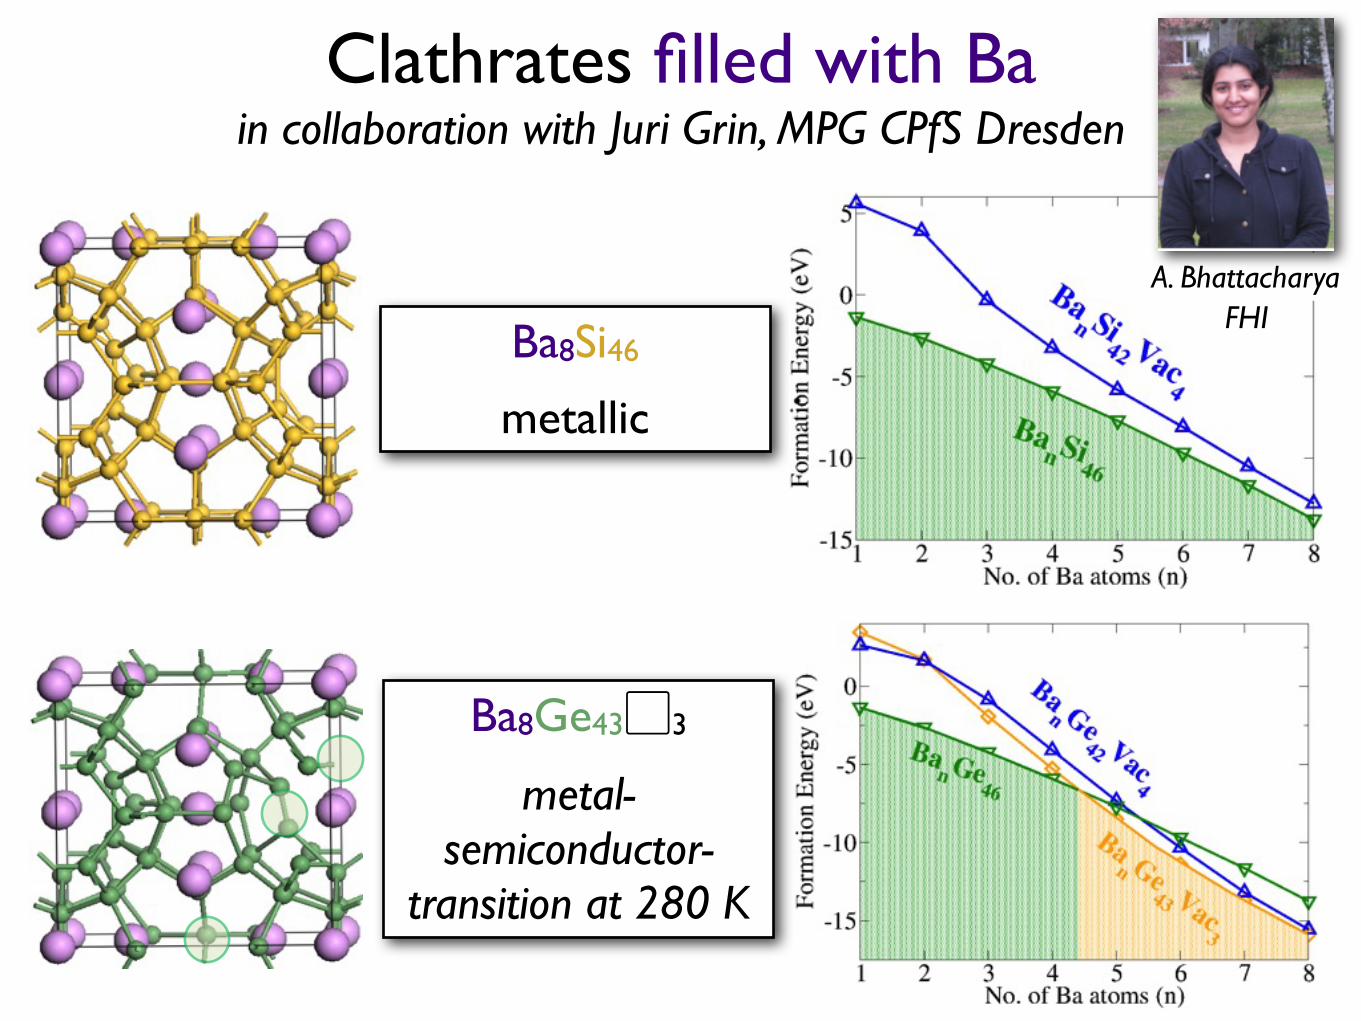
Clathrates filled with Bain collaboration with Juri Grin, MPG CPfS Dresden
Ba8Si46
metallic
Ba8Ge43▢3
metal-semiconductor-
transition at 280 K
A. BhattacharyaFHI
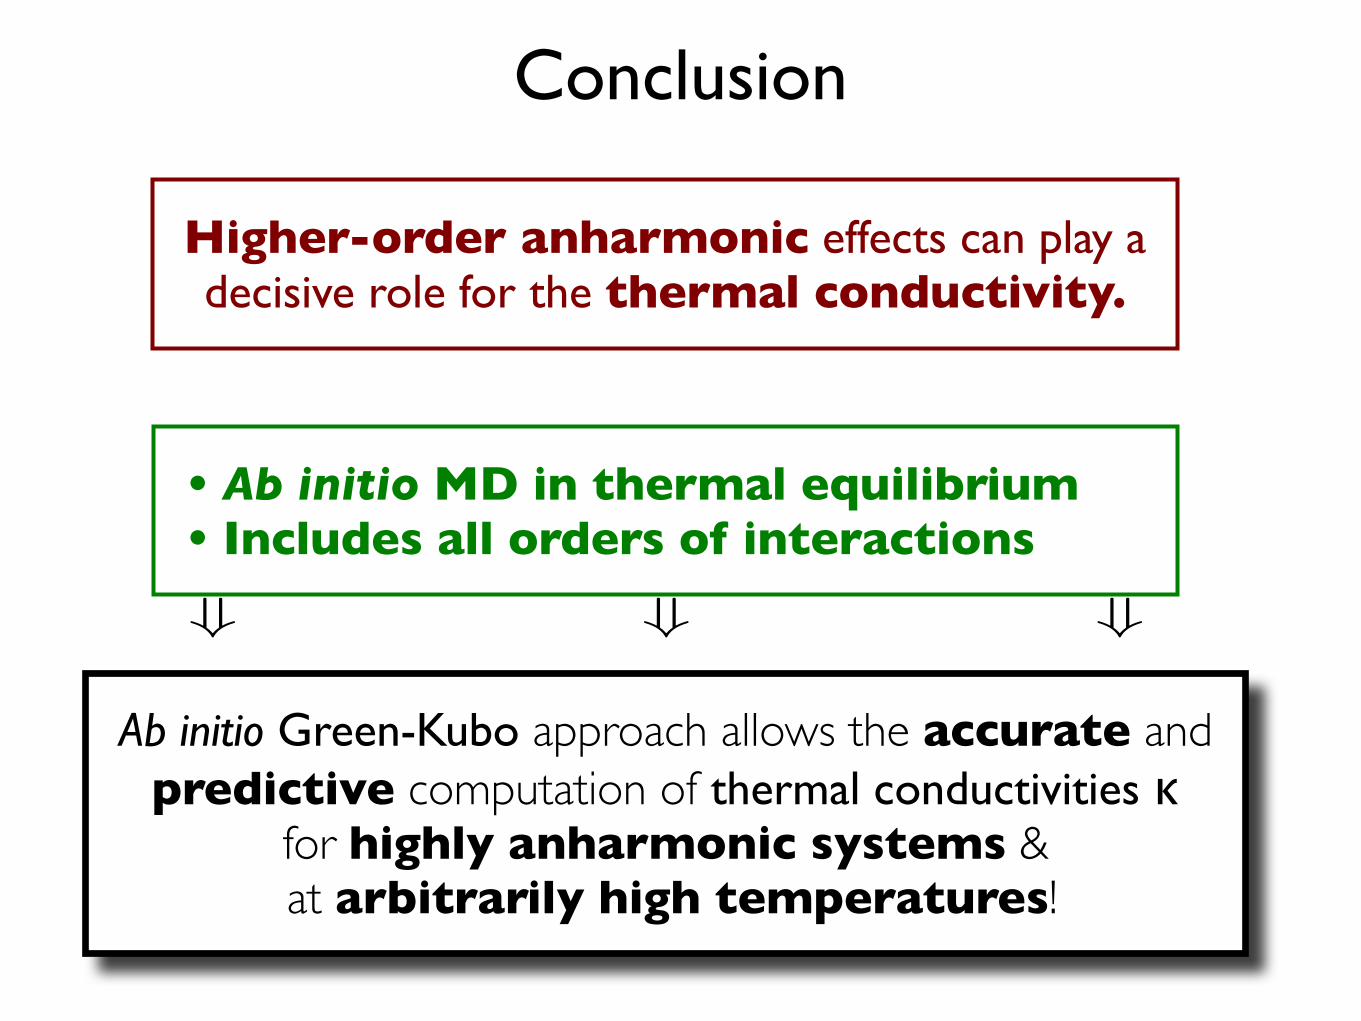
Conclusion
• Ab initio MD in thermal equilibrium• Includes all orders of interactions
Ab initio Green-Kubo approach allows the accurate and predictive computation of thermal conductivities κ
for highly anharmonic systems & at arbitrarily high temperatures!
+ + +
Higher-order anharmonic effects can play a decisive role for the thermal conductivity.
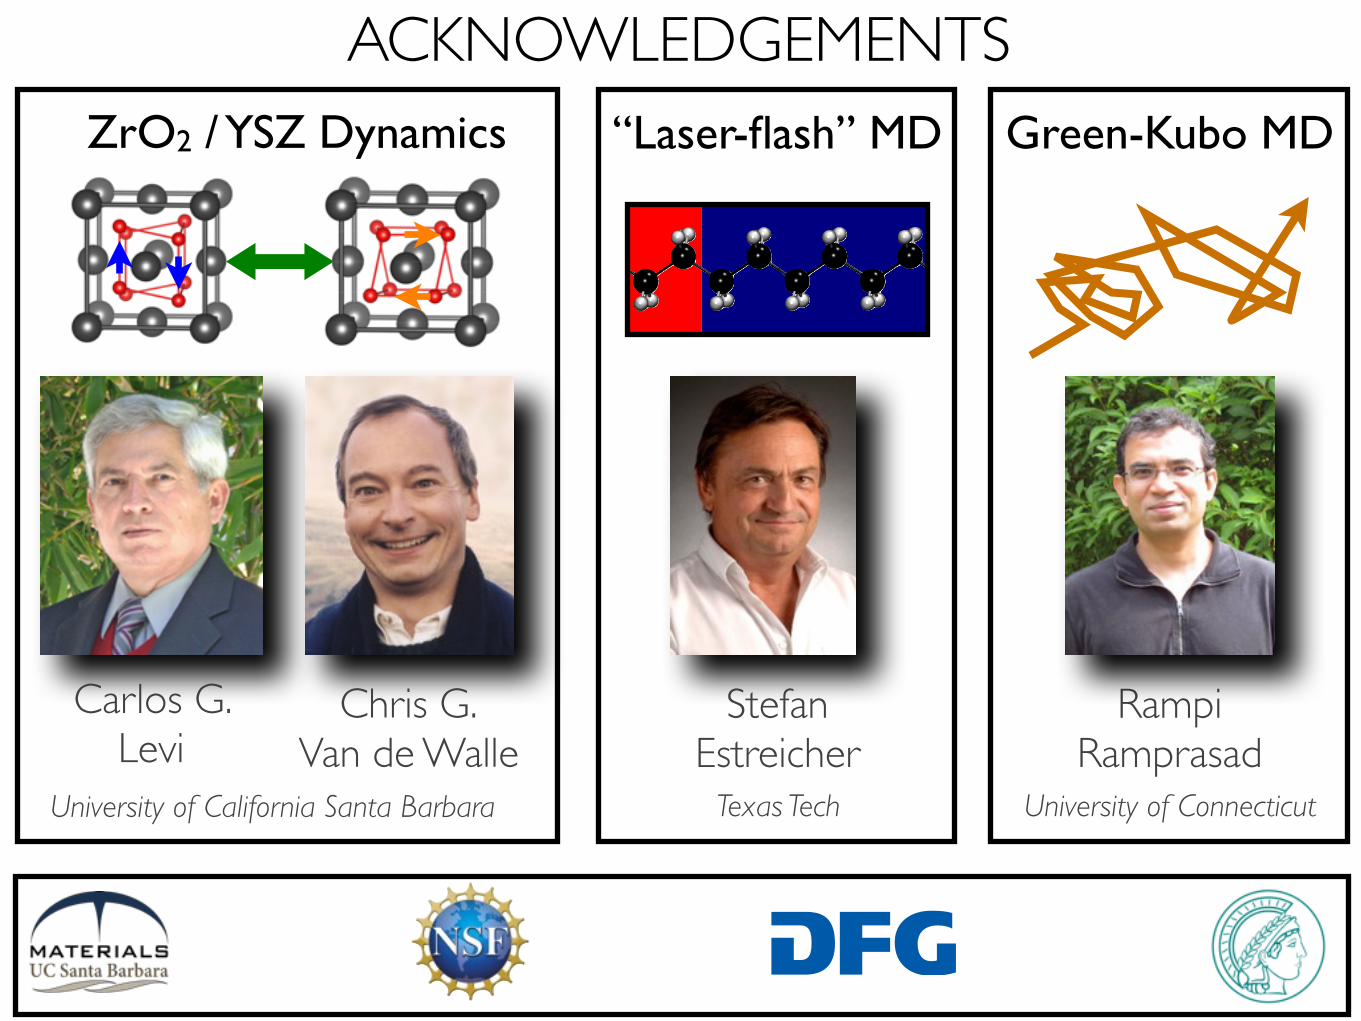
ACKNOWLEDGEMENTS
Carlos G. Levi
Chris G.Van de Walle
University of California Santa Barbara
ZrO2 / YSZ Dynamics
StefanEstreicher
“Laser-flash” MD
Texas Tech
RampiRamprasad
Green-Kubo MD
University of Connecticut


![IP ADDRESS MANAGEMENT [IPAM]. What is IPAM? Windows Server 2012 introduces IP address management[IPAM], which is a framework for discovering, auditing,](https://img.pdfslide.us/doc/110x75/56649c7b5503460f9492f68a/ip-address-management-ipam-what-is-ipam-windows-server-2012-introduces.jpg)