Embed Size (px)
Citation preview
VIRGINIA CENTER FOR TRANSPORTATION INNOVATION AND RESEARCH
530 Edgemont Road, Charlottesville, VA 22903-2454
www. VTRC.net
Thermal Response of a HighlySkewed Integral Bridge
http://www.virginiadot.org/vtrc/main/online_reports/pdf/12-r10.pdf
EDWARD J. HOPPE, Ph.D., P.E.Senior Research Scientist
Research AssistantSETH L. EICHENTHAL
Final Report VCTIR 12-R10
Standard Title Page - Report on Federally Funded Project 1. Report No.: 2. Government Accession No.: 3. Recipient’s Catalog No.: FHWA/VCTIR 12-R10
4. Title and Subtitle: 5. Report Date: Thermal Response of a Highly Skewed Integral Bridge
June 2012 6. Performing Organization Code:
7. Author(s): Edward J. Hoppe, Ph.D., P.E., and Seth L. Eichenthal
8. Performing Organization Report No.: VCTIR 12-R10
9. Performing Organization and Address: Virginia Center for Transportation Innovation and Research 530 Edgemont Road Charlottesville, VA 22903
10. Work Unit No. (TRAIS): 11. Contract or Grant No.: 91336
12. Sponsoring Agencies’ Name and Address: 13. Type of Report and Period Covered: Virginia Department of Transportation 1401 E. Broad Street Richmond, VA 23219
Federal Highway Administration 400 North 8th Street, Room 750 Richmond, VA 23219-4825
Final : October 2006 to August 2011 14. Sponsoring Agency Code:
15. Supplementary Notes: 16. Abstract:
The purpose of this study was to conduct a field evaluation of a highly skewed semi-integral bridge in order to provide feedback regarding some of the assumptions behind the design guidelines developed by the Virginia Department of Transportation. The project was focused on the long-term monitoring of a bridge on Route 18 over the Blue Spring Run in Alleghany County, Virginia.
The 110-ft-long, one-span bridge was constructed at a 45° skew and with no approach slabs. It incorporated an
elasticized expanded polystyrene material at the back of the integral backwall. Bridge data reflecting thermally induced displacements, loads, earth pressures, and pile strains were acquired at hourly intervals over a period of approximately 5 years. Approach elevations were also monitored. Analysis of data was used to formulate design recommendations for integral bridges in Virginia.
Field results indicated that semi-integral bridges can perform satisfactorily at a 45° skew provided some design details
are modified. The relatively high skew angle resulted in a pronounced tendency of the semi-integral superstructure to rotate in the horizontal plane. This rotation can generate higher than anticipated horizontal earth pressure acting on the abutment wingwall. Study recommendations include modifying the structural detail of the backwall-wingwall interface to mitigate crack formation and placing the load buttress close to the acute corner of a highly skewed abutment to reduce the abutment horizontal rotation.
The use of elastic inclusion at the back of the semi-integral backwall resulted in the reduction of earth pressures and
negligible approach settlements. The study recommendations include proposed horizontal earth pressure coefficients for design and a revised approach to calculating the required thickness of the elastic inclusion.
While recommending that the existing VDOT guidelines allow an increase in the allowable skew angle from 30° to 45°
for semi-integral bridges, the study also proposes a field investigation of the maximum skew angle for fully integral bridges because of the inherently low stiffness associated with a single row of foundation piles.
The study indicates that current VDOT guidelines can be relaxed to allow design of a wider range of jointless bridges.
The implementation of integral design has been shown to reduce bridge lifetime costs because of the elimination of deck joints, which often create numerous maintenance problems.
17 Key Words: 18. Distribution Statement: Integral bridge, skew, semi-integral, long-term monitoring, thermal response, earth pressures, strains, design, guidelines
No restrictions. This document is available to the public through NTIS, Springfield, VA 22161.
19. Security Classif. (of this report): 20. Security Classif. (of this page): 21. No. of Pages: 22. Price: Unclassified Unclassified 39
Form DOT F 1700.7 (8-72) Reproduction of completed page authorized

FINAL REPORT
THERMAL RESPONSE OF A HIGHLY SKEWED INTEGRAL BRIDGE
Edward J. Hoppe, Ph.D., P.E. Senior Research Scientist
Seth L. Eichenthal Research Assistant
In Cooperation with the U.S. Department of Transportation Federal Highway Administration
Virginia Center for Transportation Innovation and Research (A partnership of the Virginia Department of Transportation
and the University of Virginia since 1948)
June 2012 VCTIR 12-R10

ii
DISCLAIMER
The contents of this report reflect the views of the authors, who are responsible for the facts and the accuracy of the data presented herein. The contents do not necessarily reflect the official views or policies of the Virginia Department of Transportation, the Commonwealth Transportation Board, or the Federal Highway Administration. This report does not constitute a standard, specification, or regulation. Any inclusion of manufacturer names, trade names, or trademarks is for identification purposes only and is not to be considered an endorsement.
Copyright 2012 by the Commonwealth of Virginia. All rights reserved.
iii
ABSTRACT
The purpose of this study was to conduct a field evaluation of a highly skewed semi-integral bridge in order to provide feedback regarding some of the assumptions behind the design guidelines developed by the Virginia Department of Transportation. The project was focused on the long-term monitoring of a bridge on Route 18 over the Blue Spring Run in Alleghany County, Virginia.
The 110-ft-long, one-span bridge was constructed at a 45° skew and with no approach
slabs. It incorporated an elasticized expanded polystyrene material at the back of the integral backwall. Bridge data reflecting thermally induced displacements, loads, earth pressures, and pile strains were acquired at hourly intervals over a period of approximately 5 years. Approach elevations were also monitored. Analysis of data was used to formulate design recommendations for integral bridges in Virginia.
Field results indicated that semi-integral bridges can perform satisfactorily at a 45° skew
provided some design details are modified. The relatively high skew angle resulted in a pronounced tendency of the semi-integral superstructure to rotate in the horizontal plane. This rotation can generate higher than anticipated horizontal earth pressure acting on the abutment wingwall. Study recommendations include modifying the structural detail of the backwall-wingwall interface to mitigate crack formation and placing the load buttress close to the acute corner of a highly skewed abutment to reduce the abutment horizontal rotation.
The use of elastic inclusion at the back of the semi-integral backwall resulted in the
reduction of earth pressures and negligible approach settlements. The study recommendations include proposed horizontal earth pressure coefficients for design and a revised approach to calculating the required thickness of the elastic inclusion.
While recommending that the existing VDOT guidelines allow an increase in the
allowable skew angle from 30° to 45° for semi-integral bridges, the study also proposes a field investigation of the maximum skew angle for fully integral bridges because of the inherently low stiffness associated with a single row of foundation piles.
The study indicates that current VDOT guidelines can be relaxed to allow design of a
wider range of jointless bridges. The implementation of integral design has been shown to reduce bridge lifetime costs because of the elimination of deck joints, which often create numerous maintenance problems.

FINAL REPORT
THERMAL RESPONSE OF A HIGHLY SKEWED INTEGRAL BRIDGE
Edward J. Hoppe, Ph.D., P.E. Senior Research Scientist
Seth L. Eichenthal Research Assistant
INTRODUCTION The Virginia Department of Transportation (VDOT) Structure & Bridge Division policy supports an integral bridge as a primary design selection where permitted by current standards. 1 VDOT has developed extensive guidelines for the use of integral or jointless bridges on the road network in Virginia. There are two distinct types of integral bridge abutments: full integral and semi-integral (also referred to as an integral backwall bridge). A characteristic feature of the VDOT full integral abutment is the moment relief hinge that serves to attenuate the moment transfer to tops of foundation piles, resulting in reduced pile stresses. Essentially, a full integral abutment accommodates translation and rotation of the superstructure, whereas a semi-integral abutment allows the translation but no moment transfer. Current VDOT design policy promotes full integral abutments where possible, followed by semi-integral and then by conventional options.
The primary justification for the use of jointless bridges is the recognition that they are less expensive to maintain over the life of the structure than are conventional bridges.2 The absence of joints and bearings results in lower construction and maintenance costs. Although superstructures with deck joints still dominate, the trend in the United States appears to be moving toward jointless bridges.
In an effort to optimize the integral design process, VDOT embarked on a number of research projects aimed at evaluating the performance of bridges during their service life.3,4 Field data were used to verify design assumptions, develop new details, and progressively relax use restrictions as new experience and expertise were acquired. Currently, there is a need to monitor and provide design feedback on the field performance of such bridges, especially in extreme or unusual cases, because these structures are subjected to stresses and displacements that are drastically different from those to which conventional bridges are subjected. Of particular importance is the assessment of structural behavior resulting from thermally induced stresses.
PURPOSE AND SCOPE One of the areas in which VDOT lacks long-term field experience is the behavior of
highly skewed integral bridges. The purpose of this study was to validate and expand on
2
VDOT’s design and construction guidelines for integral bridges, especially with regard to the possibility of increasing the allowable skew. Unless subject to a design waiver, VDOT integral bridges are currently limited to a 30° skew. 1 To explore the possibility of increasing the allowable skew angle, a long-term, multiyear field study of a highly skewed semi-integral bridge was conducted. The study was designed to collect data on foundation pile strains, earth pressures acting on abutments, loads exerted by the superstructure on the abutment, and settlement of bridge approaches. One of the most significant measurements sought was the actual lateral load required to restrain the superstructure from horizontal rotation.
The scope of this study was restricted to a field evaluation of the newly constructed semi-
integral bridge on Route 18 over the Blue Spring Run in Alleghany County, Virginia. All data collected in this study represent the effects of thermally induced displacements over a wide temperature range during the bridge service life.
METHODS
Three tasks were performed to achieve the study objectives: 1. A literature review pertaining to integral bridges was conducted. 2. Instrumentation was installed at the site of the Route 18 Bridge, and load, strain,
displacement, and weather condition data were collected regularly.
3. A 5-year-long field evaluation of the bridge performance was conducted.
Description of Route 18 Bridge
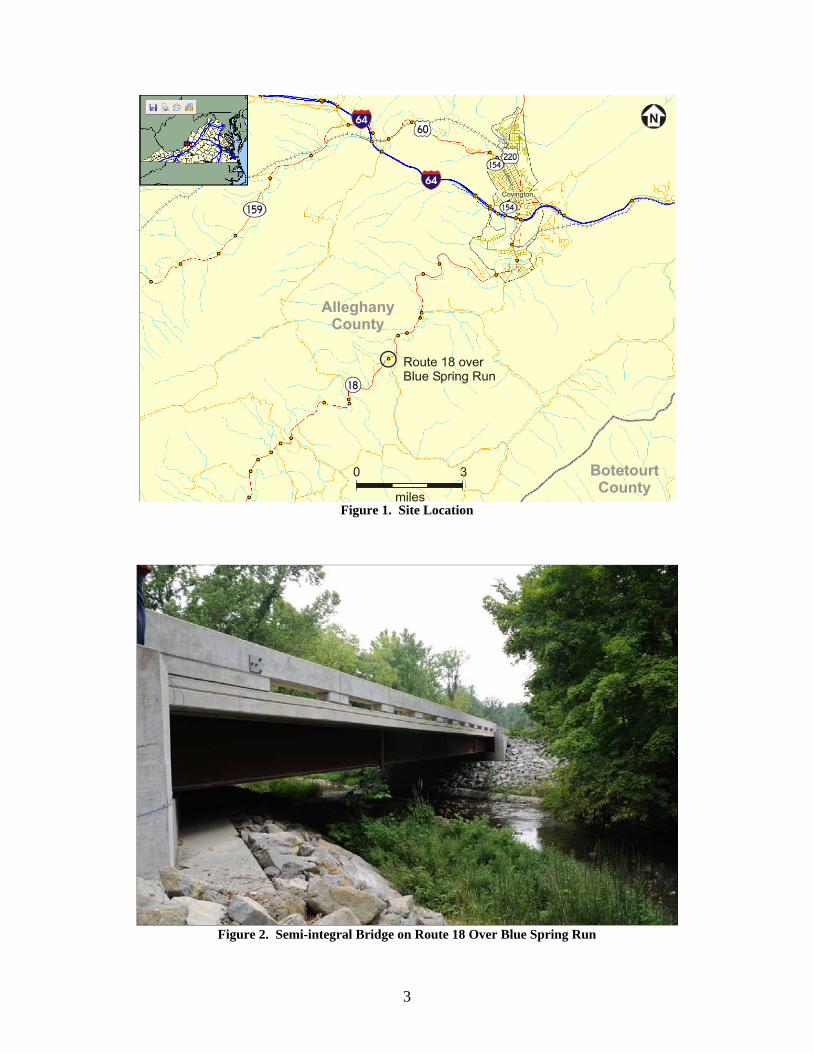
The bridge is located on Route 18 over the Blue Spring Run, approximately 5 miles south of Covington, as shown in Figure 1. It replaced a structure that was functionally obsolete. Figures 2 and 3 show the new bridge elevation view and layout. The bridge received design waivers for the 45° skew and for eliminating approach slabs at the adjoining embankments.
The semi-integral bridge is 110 ft long and 42.7 ft wide, with one-span steel girders
constructed at a 45° skew. At both abutments, the girders rest on expansion bearings consisting of laminated elastomeric bearing pads, 2.5 in thick. The abutment design incorporates a layer of elasticized expanded polystyrene (EPS), 15 in thick, protected from adjoining granular fill by a separation geotextile placed at the back of the integral backwall at Abutment A (see Figure 4). Consistent with the VDOT design policy, no elastic inclusion was applied at the other abutment of the one-span bridge. 1 Figure 4 shows the cross-sectional view of the Abutment A detail, with the elastic inclusion placed at the back of integral backwall. The material properties of the EPS, as provided by the manufacturer, 5 are shown in Figure 5.
3
Figure 1. Site Location
Figure 2. Semi-integral Bridge on Route 18 Over Blue Spring Run

4
Figure 3. Bridge Layout
Figure 4. Cross Section at Abutment A

5
Figure 5. Properties of Elasticized Expanded Polystyrene (EPS). Reprinted with permission of GeoTech
Systems Corporation.
The replacement bridge was constructed in stages in order to maintain traffic, starting with the southbound lane in Stage 1. After the northbound lane was completed in Stage 2, the closure section was cast along the centerline of the entire deck, including both integral backwalls. The function of the closure pour is to match superstructure rotations from both stages. A full set of as-built plans for the Route 18 Bridge and associated construction photographs can be seen at the project website.6
Literature Review The literature on the current state of the practice with respect to the design of integral bridges was reviewed. The search focused on peer-reviewed articles and literature sources. Search tools included the Engineering Index, TRISWorld, Mechanical and Transportation Engineering Abstracts, and VDOT OneSearch databases. The Google state DOT search engine was used in an effort to find documentation by state DOTs.
Field Instrumentation and Data Collection Electronic instrumentation installed at the bridge consisted of 120 vibrating wire strain
gages, 16 earth pressure cells, 2 high-capacity load cells, 1 displacement transducer, and weather station sensors. The following elements were monitored:
1. strains in selected foundation piles 2. horizontal earth pressures acting at the back of integral backwalls and at wingwalls
6
3. compression of the elastic inclusion at Abutment A
4. buttress reaction force required to restrain the superstructure from horizontal rotation 5. ambient air temperature, humidity, solar radiation, and rainfall. Sensors manufactured by Geokon, Inc., and Roctest Ltd. were interfaced with signal
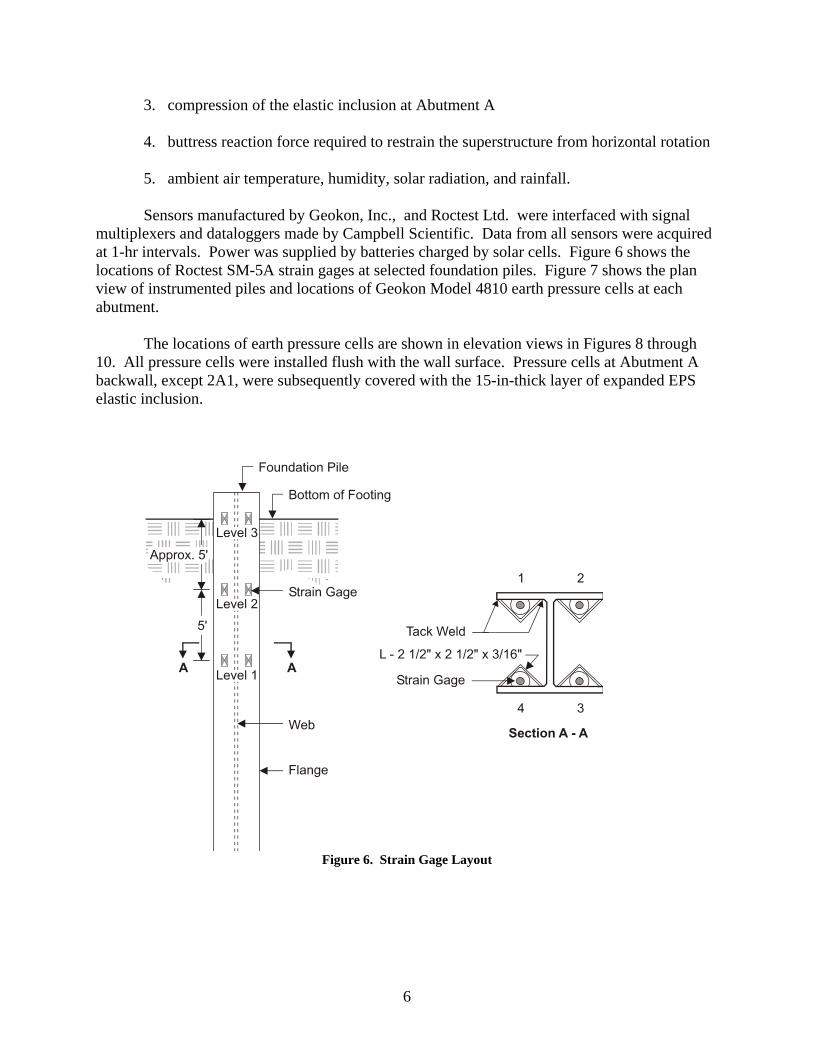
multiplexers and dataloggers made by Campbell Scientific. Data from all sensors were acquired at 1-hr intervals. Power was supplied by batteries charged by solar cells. Figure 6 shows the locations of Roctest SM-5A strain gages at selected foundation piles. Figure 7 shows the plan view of instrumented piles and locations of Geokon Model 4810 earth pressure cells at each abutment.
The locations of earth pressure cells are shown in elevation views in Figures 8 through
10. All pressure cells were installed flush with the wall surface. Pressure cells at Abutment A backwall, except 2A1, were subsequently covered with the 15-in-thick layer of expanded EPS elastic inclusion.
Figure 6. Strain Gage Layout

7
Figure 7. Plan View of Locations of Instrumented Piles and Earth Pressure Cells
Figure 8. Locations of Earth Pressure Cells at Abutment A Integral Backwall

8
Figure 9. View of Some Pressure Cells at Abutment A
Figure 10. Locations of Earth Pressure Cells at Abutment B Integral Backwall
9
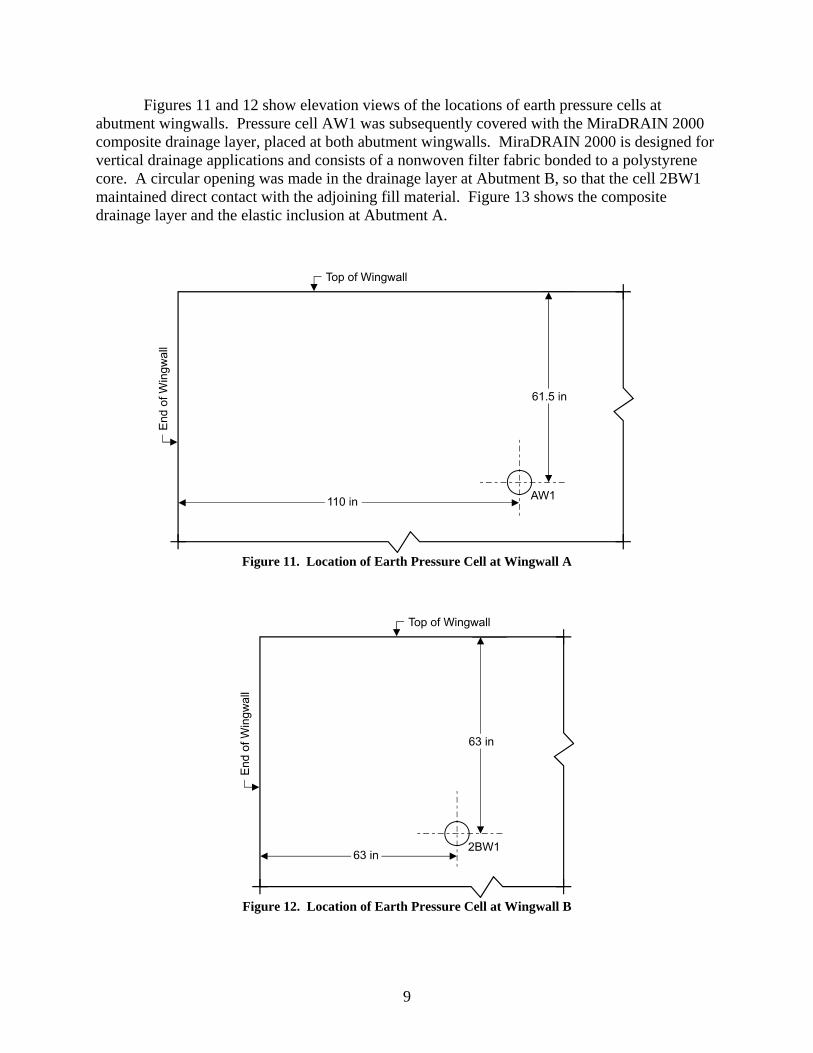
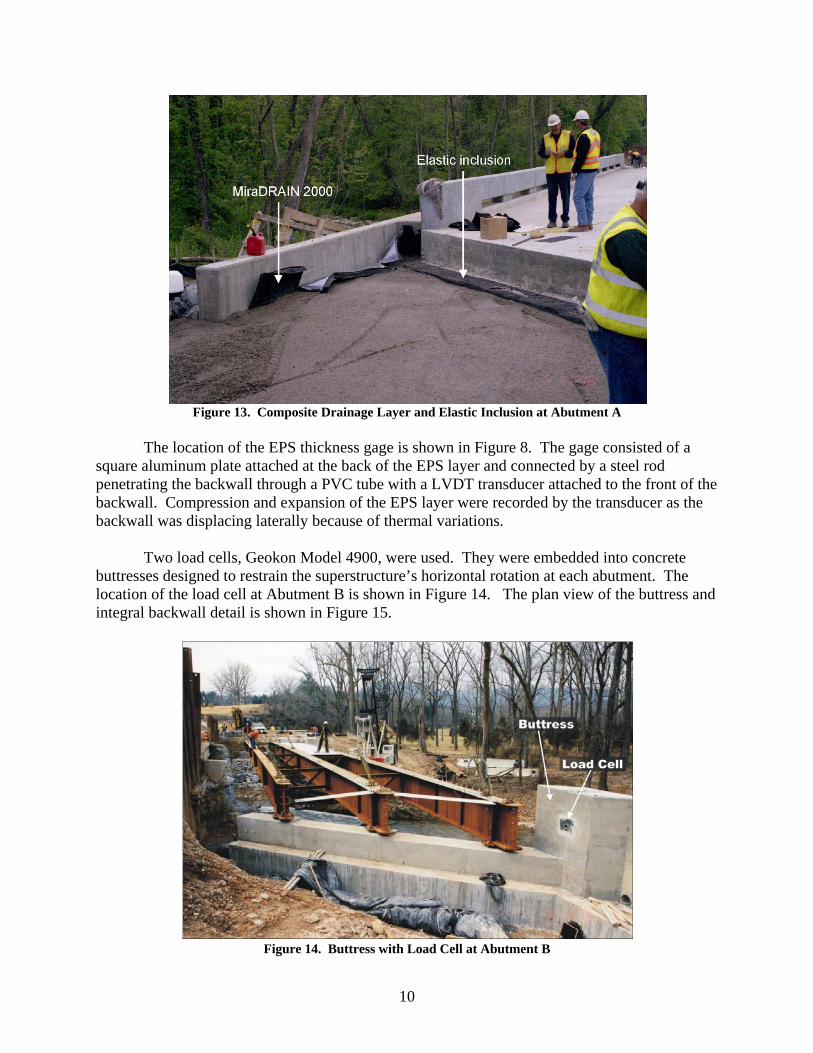
Figures 11 and 12 show elevation views of the locations of earth pressure cells at abutment wingwalls. Pressure cell AW1 was subsequently covered with the MiraDRAIN 2000 composite drainage layer, placed at both abutment wingwalls. MiraDRAIN 2000 is designed for vertical drainage applications and consists of a nonwoven filter fabric bonded to a polystyrene core. A circular opening was made in the drainage layer at Abutment B, so that the cell 2BW1 maintained direct contact with the adjoining fill material. Figure 13 shows the composite drainage layer and the elastic inclusion at Abutment A.
Figure 11. Location of Earth Pressure Cell at Wingwall A
Figure 12. Location of Earth Pressure Cell at Wingwall B
10
Figure 13. Composite Drainage Layer and Elastic Inclusion at Abutment A
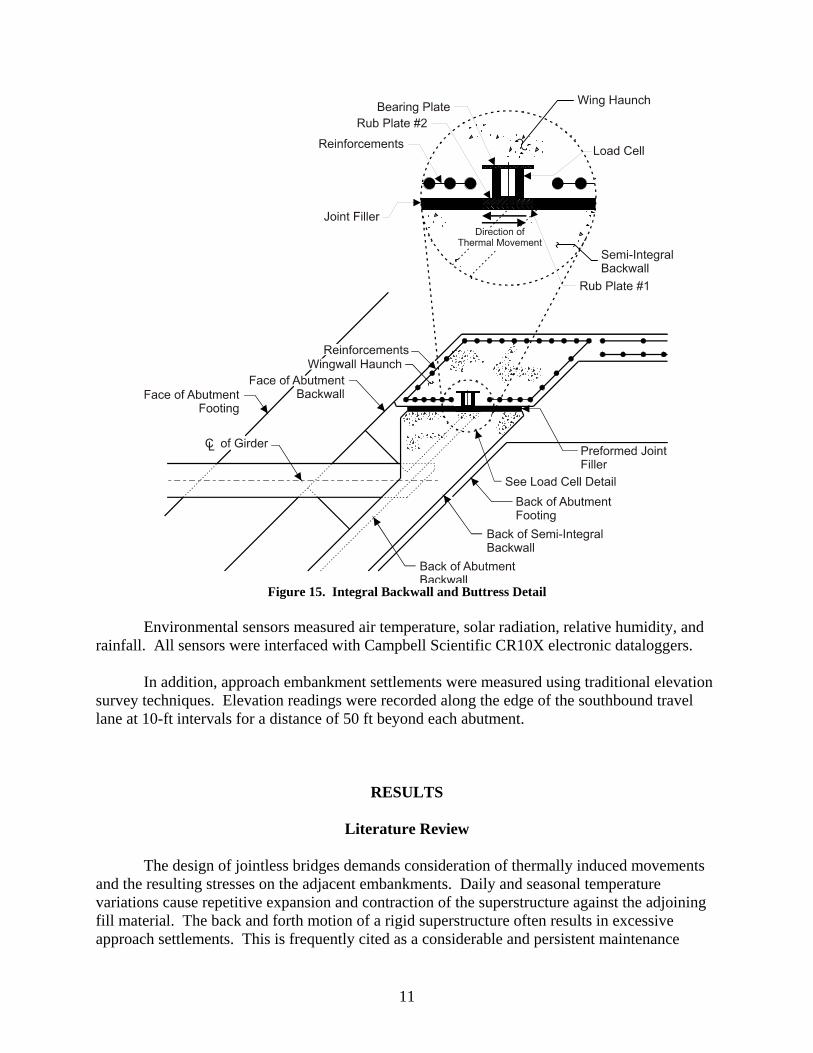
The location of the EPS thickness gage is shown in Figure 8. The gage consisted of a square aluminum plate attached at the back of the EPS layer and connected by a steel rod penetrating the backwall through a PVC tube with a LVDT transducer attached to the front of the backwall. Compression and expansion of the EPS layer were recorded by the transducer as the backwall was displacing laterally because of thermal variations. Two load cells, Geokon Model 4900, were used. They were embedded into concrete buttresses designed to restrain the superstructure’s horizontal rotation at each abutment. The location of the load cell at Abutment B is shown in Figure 14. The plan view of the buttress and integral backwall detail is shown in Figure 15.
Figure 14. Buttress with Load Cell at Abutment B
11
Figure 15. Integral Backwall and Buttress Detail
Environmental sensors measured air temperature, solar radiation, relative humidity, and
rainfall. All sensors were interfaced with Campbell Scientific CR10X electronic dataloggers. In addition, approach embankment settlements were measured using traditional elevation survey techniques. Elevation readings were recorded along the edge of the southbound travel lane at 10-ft intervals for a distance of 50 ft beyond each abutment.
RESULTS
Literature Review The design of jointless bridges demands consideration of thermally induced movements
and the resulting stresses on the adjacent embankments. Daily and seasonal temperature variations cause repetitive expansion and contraction of the superstructure against the adjoining fill material. The back and forth motion of a rigid superstructure often results in excessive approach settlements. This is frequently cited as a considerable and persistent maintenance
12
problem, precluding jointless bridges from widespread adoption.7 According to a survey compiled by Kunin and Alampalli, approach slabs for integral bridges have the largest number of incidences of poor performance.8 The problem of a settling approach slab is particularly acute at an integral bridge because the slab cannot be overlaid with pavement.
In the early stages of its adoption of integral bridges, VDOT also found excessive
settlements at the bridge approaches.3 The problem was traced to the use of uniformly graded fill material. VDOT proceeded with additional research aimed at selecting compatible backfill materials and methods. Field studies conducted by the Virginia Transportation Research Council (now the Virginia Center for Transportation Innovation and Research) resulted in the implementation of the elasticized expanded polystyrene at the back of the abutment backwall.4 This elastic inclusion, in conjunction with a densely compacted well-graded crushed stone placed at the bridge abutment, was found to be very effective at absorbing superstructure thermal displacements and attenuating approach settlements.
Thermally induced superstructure displacement can be estimated using Equation 1.9
δ = α x ΔT x Lo [Eq. 1]
where
δ = displacement α = coefficient of thermal expansion, 0.0000065/°F and 0.000006/°F for steel and concrete bridges, respectively ΔT = temperature differential between the effective bridge temperature and the temperature at the time of construction Lo = length of bridge from the neutral point to abutment.
VDOT uses ΔT = 120°F for the design of steel beam composite bridges (AASHTO
moderate climate zone) and ΔT = 80 °F for design of concrete beam composite bridges (AASHTO cold climate zone). 10 A thermal correction coefficient of 0.65 is applied to ΔT for calculating thermally induced forces transferred to substructure and for sizing joints and bearings at conventional bridges, as per VDOT office practice.
For calculating the required thickness of the elastic inclusion, a thermal correction coefficient of 0.67 is currently used by VDOT, resulting in the following formula1:
EPSt = 10 [0.01h + 0.67ΔL] [Eq. 2] where
EPSt = required EPS thickness in inches (shall not be less than 10 inches) h = height of integral backwall / abutment in inches

13
ΔL = total thermally induced movement at the abutment in inches (AASHTO formula).
Arsoy et al. studied thermal bridge displacements and concluded that daily temperature variations for locations in Virginia are not likely to exceed 25 percent of the maximum expected variation of seasonal temperatures.11 AASHTO recommendations may be deemed conservative, because they are based on extreme seasonal temperatures rather than the average winter and the average summer temperatures. 9 The property that determines the relative ability of heat to flow through a particular material is called thermal diffusivity. The higher the value of diffusivity, the more readily heat will move through. The American Concrete Institute has developed a procedure for estimating the rate of heat flow through concrete.12 It is evident that for a composite bridge deck, it would take several hours to equalize the concrete temperature with that of the surrounding air. Although daily ambient air temperature generally follows a sinusoidal pattern, thermal inertia of the concrete superstructure results in a more attenuated heat flow. Consequently, it is unlikely that the actual superstructure would be subjected to the full thermal range of movement calculated by Equation 1. Another reason for the actual integral bridge displacements to be somewhat lower than estimated is the restraint provided by the abutment and foundation piles. Mokwa and Duncan conducted extensive field studies on pile caps subjected to lateral loads and concluded that the soil lateral resistance developed at integral abutments is significant.13 A field study conducted in Indiana documented smaller than theoretical displacements, explaining the differences by resistance from pile caps, backfill, and approach slab friction.14 The magnitude of earth pressure acting on the integral abutment varies greatly with changes in ambient air temperature. It can reach an active state as the superstructure contracts and a potentially fully passive condition as the superstructure expands. Passive earth pressure is the highest limiting lateral pressure developed at the onset of shear failure. The intermediate state of stress is called the earth pressure at-rest. It is typically applied to restrained structures, with little or no movement against the soil mass. Arsoy et al. indicated that using full passive pressure for superstructure design, regardless of displacement, is not conservative because it reduces the flexural effects of dead and live loads in bridge girders.15 Currently, VDOT design practice does not apply passive earth pressure to superstructure design.16 The most commonly used earth pressure theories are those of Coulomb and Rankine.17 Both theories assume that the soil is cohensionless. In addition, Rankine assumed that the wall is frictionless, whereas Coulomb accounted for the interface friction angle. With no soil-wall friction and a horizontal backfill surface, the Coulomb and Rankine methods yield equal results. As the soil friction angle increases, the active pressure coefficient decreases and the passive pressure coefficient increases, as calculated by Coulomb’s theory.
Other theories include those of Caquot and Kérisel;18 Müller-Breslau;19 Absi and Kérisel;20 and Sokolovski.21 For large values of the wall friction angle, the log spiral theory developed by Caquot and Kérisel is more accurate than the Rankine or Coulomb earth pressure theories. It accounts for a failure surface consisting of the Prandtl zone bounded by the
14
logarithmic spiral and the Rankine zone bounded by a plane. Mokwa and Duncan developed a spreadsheet to calculate passive earth pressures using the log spiral theory.13 Current British practice introduced a method for calculating horizontal earth pressures using a parameter called K*, which provides a coefficient value greater than the earth pressure at rest and generally smaller than fully passive.22 The Eurocode passive earth pressure coefficients are presented in a graphical form, as a function of the internal friction angle and the interface friction angle.23 Wasserman advocated the use of the Rankine theory to calculate passive pressures conservatively.24 Hassiotis and Xiong25 provided guidelines for estimating passive pressures depending on the structure displacement. Mei et al. proposed a new model for predicting displacement-dependent lateral earth pressure.26 Clough and Duncan presented graphs of the earth pressure coefficient as a function of the sand density, wall movement, and wall height.27 In general, research has shown that the stresses and strains induced in a soil mass subjected to passive force are extremely complex and spatially non uniform. The magnitude of earth pressure acting on the integral abutment can be substantial as the state of stress shifts from active toward passive as a result of thermal expansion. With a stiff material adjoining the backwall, it is possible for the earth pressure to change by more than an order of magnitude. In order to attenuate this wide range of pressures, various studies have been conducted into elastic, compressible materials that could potentially be inserted between the backwall and the adjoining fill. 28 The principal challenge is to select material that remains elastic within the thermal movement range, does not creep with time, and remains durable. Extensive research into potentially applicable materials was conducted by Carder and Card. One of the promising materials identified was elasticized expanded polystyrene. It exhibits linear elastic stress strain behavior up to approximately 10 percent strain (regular EPS is elastic up to approximately 1 percent strain). Expanded polystyrene can be elasticized by temporarily loading it past the yield range. Horvath further explored the material properties and applications of elasticized EPS.29,30 Aytekin modeled the use of EPS as a compressible inclusion between a retaining structure and a swelling soil.31 One of the potentially significant and unusual properties of expanded polystyrene is its negative Poisson’s ratio.32
The design of wingwalls of integral abutments requires the consideration of earth pressures that may develop as the superstructure moves. A study by Ove Arup & Partners, Ltd., suggested the use of an earth pressure coefficient equal to unity to account for the effect of Poisson’s ratio.33 A field study by Shehu indicated relatively high stress concentrations in wingwalls of semi-integral abutments.34 Steinberg and Sargand also concluded that forces exerted on the wingwalls of skewed semi-integral bridges can be significant.35 Thomson and Luteneger discovered that the maximum value of earth pressure is dependent on wingwall orientation for the same relative wall movement.36 Greater soil confinement with U-back walls resulted in markedly increased soil pressures. A survey by Kunin and Alampalli indicated that an equal number of agencies used either active or passive pressures for wingwall design.8
The design of skewed integral bridges requires accounting for the superstructure rotation in the horizontal plane, attributable to noncollinear earth force reactions at abutments. Burke commented that skewed, semi-integral abutment bridges have a tendency to rotate incrementally toward the acute corners of bridge decks.37
15
As the fully integral abutment expands and contracts because of thermal variations, the foundation piles are subjected to combined axial and bending stresses. It is important that these repeated movements do not cause damage to piles, resulting in a reduced load-carrying capacity. A laboratory study by Arsoy et al. concluded that steel H-piles are most suitable for supporting fully integral abutments.38 Prestressed concrete piles and steel pipe piles were found to be too stiff, resulting in extensive tension cracks at the interface with the abutment. These considerations are less critical in the case of semi-integral bridges because there is no significant moment transfer to piles. The orientation of H-piles at fully integral abutments has been a subject of debate. VDOT follows the practice of orienting H-piles such that bending occurs along the weak axis. Current VDOT design practice calls for the web of the H-pile to be oriented perpendicular to the centerline of girders, regardless of skew. 16 This approach was also recommended by Abendroth and Greimann.39 For semi-integral bridges, pile orientation has not been considered significant because piles do not carry thermally induced lateral loads. The skewed semi-integral bridge at Route 18 over the Blue Spring Run was designed with pile flanges oriented parallel to the abutment face.
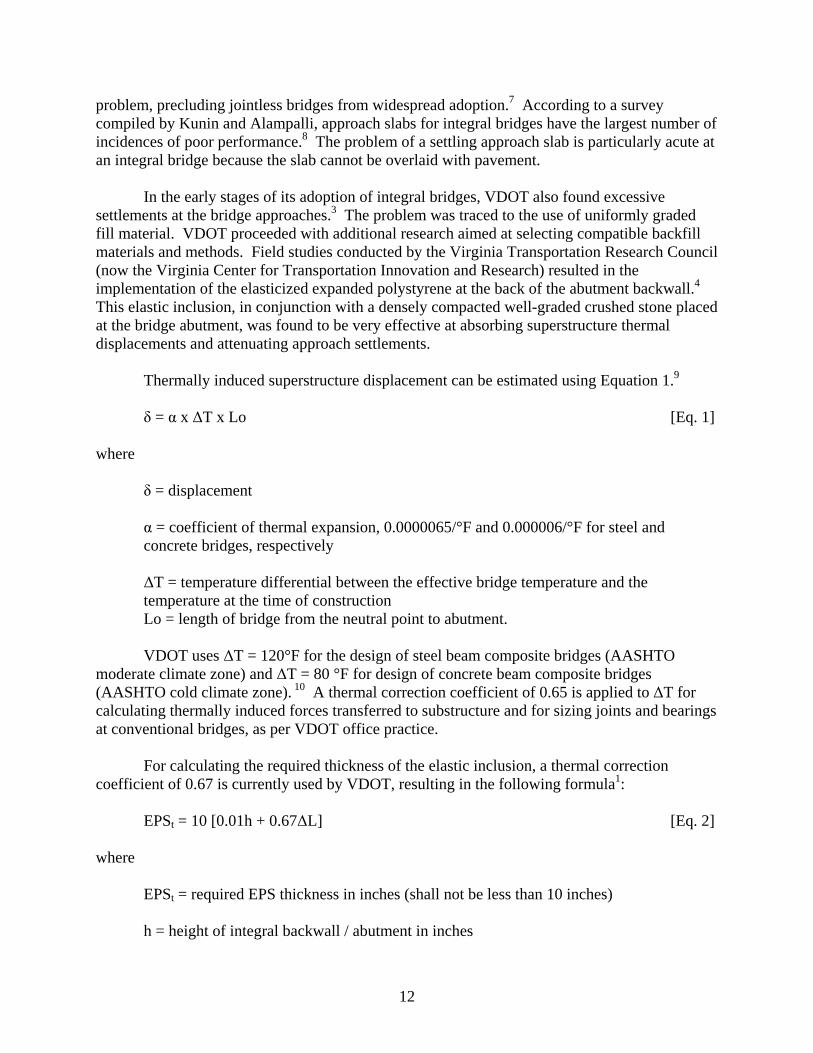
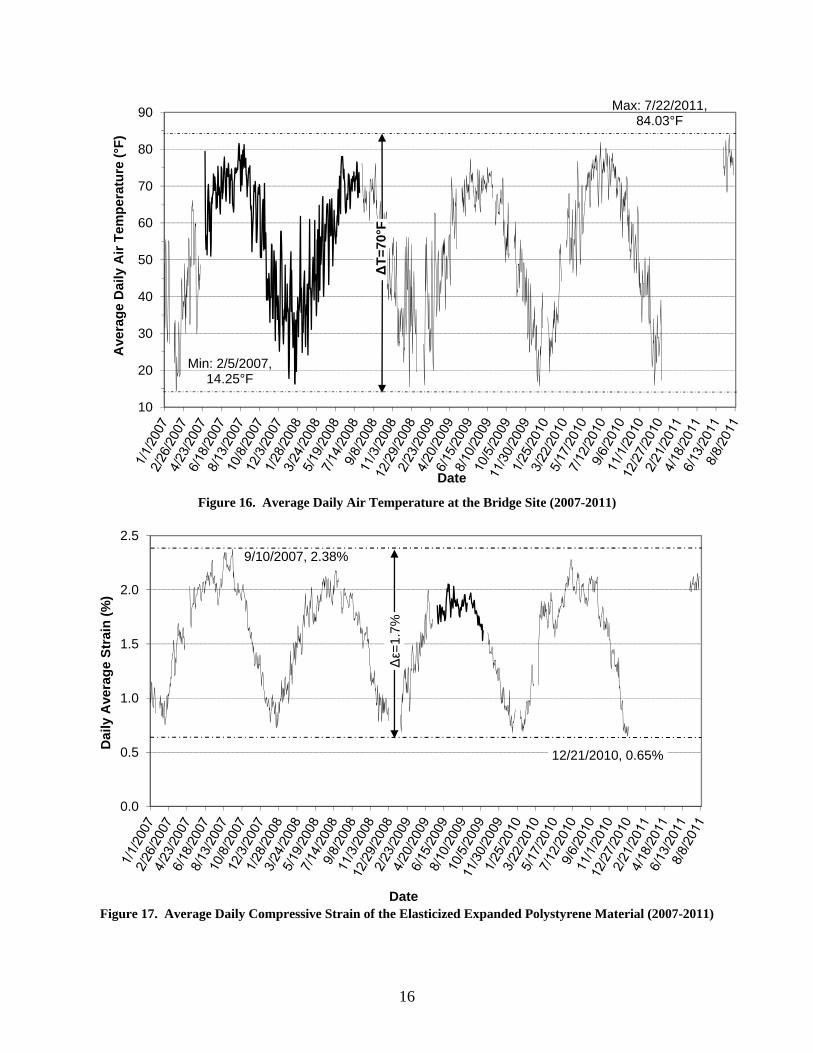
Field Data Bridge construction was completed in October 2006. The instrumentation has been
functioning satisfactorily since then over the entire monitoring period ending in August 2011. Figure 16 shows the composite graph of the average daily ambient air temperature for the 5-year monitoring period from January 1, 2007, through August 3, 2011. The 2011 data were collected only from early July to early August, which is typically the warmest time of the year. The maximum instantaneous recorded temperature was 100.3°F on July 22, 2011. The minimum was -1.3°F, recorded on February 11, 2007.
Figure 17 shows the corresponding daily average strain of the EPS elastic inclusion, resulting from the thermally induced expansion and contraction of the superstructure. The initial strain, following backfill compaction against the EPS, was 1.7 percent on August 24, 2006 (t = 80°F). The maximum instantaneous strain was 2.5 percent on September 9, 2007 (t = 84°F); The minimum was 0.6 percent on February 8, 2010 (t = 12°F).
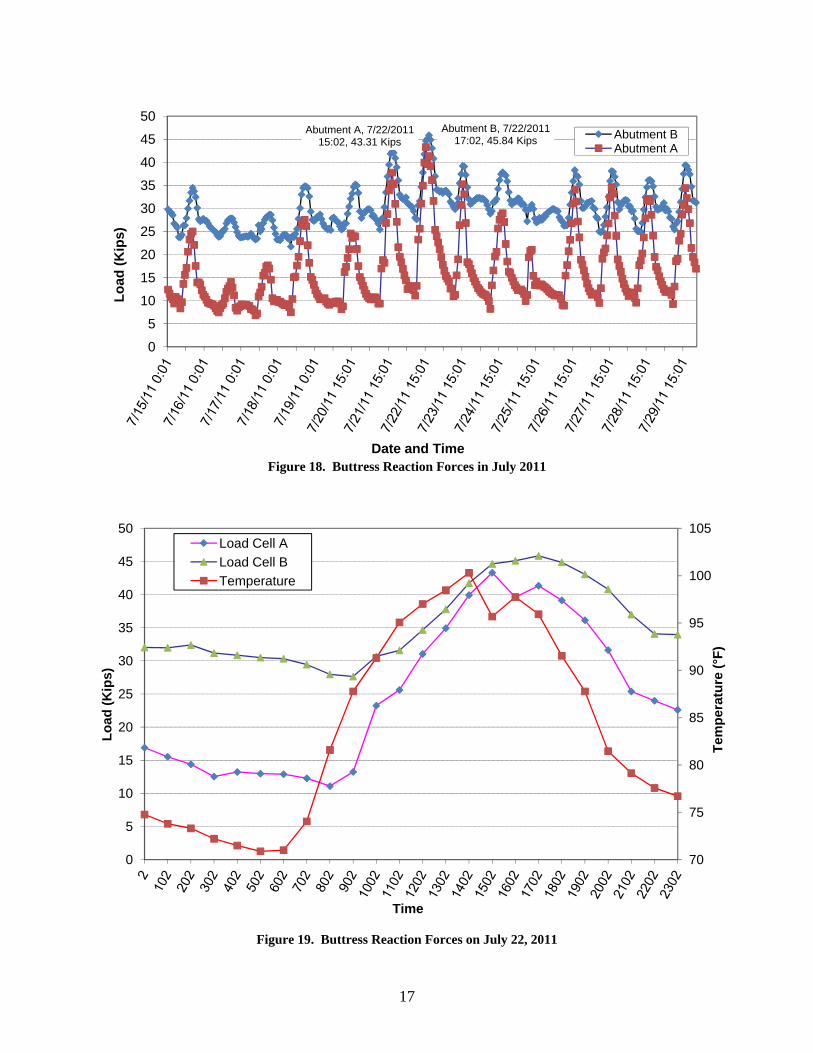
The maximum buttress reaction forces of 43 kips and 46 kips were recorded on July 22,
2011, at Abutment A and B, respectively, as shown on Figure 18. They were coincident with the maximum registered ambient air temperatures. Figure 19 shows the buildup of buttress forces and corresponding air temperatures on July 22, 2011. Buttress forces reached zero at Abutments A and B on February 7, 2007, and January 5, 2008, respectively.
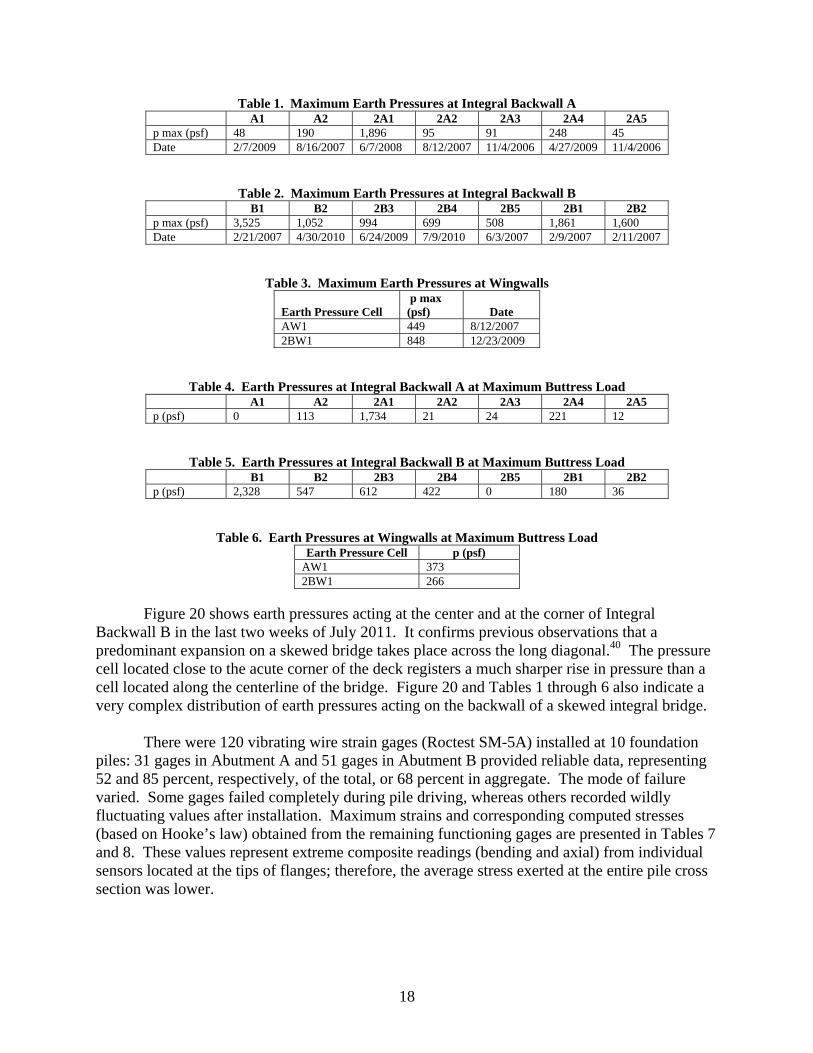
Maximum earth pressure values registered at individual pressure cells, with
corresponding dates, are shown in Tables 1 through 3. The surface of cell AW1 was covered with the MiraDRAIN 2000 composite drainage layer; cell 2BW1 was in direct contact with the adjacent embankment backfill. Magnitudes of earth pressure at the time of the maximum recorded buttress load are shown in Tables 4 through 6.
16
Figure 16. Average Daily Air Temperature at the Bridge Site (2007-2011)
Figure 17. Average Daily Compressive Strain of the Elasticized Expanded Polystyrene Material (2007-2011)
Max: 7/22/2011, 84.03°F
Min: 2/5/2007, 14.25°F
10
20
30
40
50
60
70
80
90A
vera
ge
Dai
ly A
ir T
emp
erat
ure
(°F
)
Date
ΔT
=70
°F
9/10/2007, 2.38%
12/21/2010, 0.65%
0.0
0.5
1.0
1.5
2.0
2.5
Dai
ly A
vera
ge
Str
ain
(%
)
Date
Δε=
1.7%
17
Figure 18. Buttress Reaction Forces in July 2011
Figure 19. Buttress Reaction Forces on July 22, 2011
Abutment B, 7/22/2011 17:02, 45.84 Kips
Abutment A, 7/22/2011 15:02, 43.31 Kips
0
5
10
15
20
25
30
35
40
45
50L
oad
(K
ips)
Date and Time
Abutment BAbutment A
70
75
80
85
90
95
100
105
0
5
10
15
20
25
30
35
40
45
50
Tem
per
atu
re (
°F)
Lo
ad (
Kip
s)
Time
Load Cell A
Load Cell B
Temperature
18
Table 1. Maximum Earth Pressures at Integral Backwall A A1 A2 2A1 2A2 2A3 2A4 2A5 p max (psf) 48 190 1,896 95 91 248 45 Date 2/7/2009 8/16/2007 6/7/2008 8/12/2007 11/4/2006 4/27/2009 11/4/2006
Table 2. Maximum Earth Pressures at Integral Backwall B B1 B2 2B3 2B4 2B5 2B1 2B2 p max (psf) 3,525 1,052 994 699 508 1,861 1,600 Date 2/21/2007 4/30/2010 6/24/2009 7/9/2010 6/3/2007 2/9/2007 2/11/2007
Table 3. Maximum Earth Pressures at Wingwalls Earth Pressure Cell
p max (psf)
Date
AW1 449 8/12/2007 2BW1 848 12/23/2009
Table 4. Earth Pressures at Integral Backwall A at Maximum Buttress Load A1 A2 2A1 2A2 2A3 2A4 2A5 p (psf) 0 113 1,734 21 24 221 12
Table 5. Earth Pressures at Integral Backwall B at Maximum Buttress Load B1 B2 2B3 2B4 2B5 2B1 2B2 p (psf) 2,328 547 612 422 0 180 36
Table 6. Earth Pressures at Wingwalls at Maximum Buttress Load Earth Pressure Cell p (psf)
AW1 373 2BW1 266
Figure 20 shows earth pressures acting at the center and at the corner of Integral
Backwall B in the last two weeks of July 2011. It confirms previous observations that a predominant expansion on a skewed bridge takes place across the long diagonal.40 The pressure cell located close to the acute corner of the deck registers a much sharper rise in pressure than a cell located along the centerline of the bridge. Figure 20 and Tables 1 through 6 also indicate a very complex distribution of earth pressures acting on the backwall of a skewed integral bridge.
There were 120 vibrating wire strain gages (Roctest SM-5A) installed at 10 foundation
piles: 31 gages in Abutment A and 51 gages in Abutment B provided reliable data, representing 52 and 85 percent, respectively, of the total, or 68 percent in aggregate. The mode of failure varied. Some gages failed completely during pile driving, whereas others recorded wildly fluctuating values after installation. Maximum strains and corresponding computed stresses (based on Hooke’s law) obtained from the remaining functioning gages are presented in Tables 7 and 8. These values represent extreme composite readings (bending and axial) from individual sensors located at the tips of flanges; therefore, the average stress exerted at the entire pile cross section was lower.

19
Figure 20. Earth Pressures at Abutment B in July 2011
Table 7. Maximum Pile Strains and Stresses at Abutment A Piles Pile No. 12 19 24 25 26 Microstrain -172 -205 -197 -133 Stress (psi) -4,988 -5,945 -5,713 -3,857 Date 1/24/2008 2/19/2010 4/6/2010 12/15/2010
Table 8. Maximum Pile Strains and Stresses at Abutment B Piles Pile No. 12 21 24 25 26 Microstrain -104 -205 -197 -182 -133 Stress (psi) -3,016 -5,945 -5,713 -5,278 -3,857 Date 2/6/2009 2/19/2010 12/28/2010 12/8/2008 2/6/2007
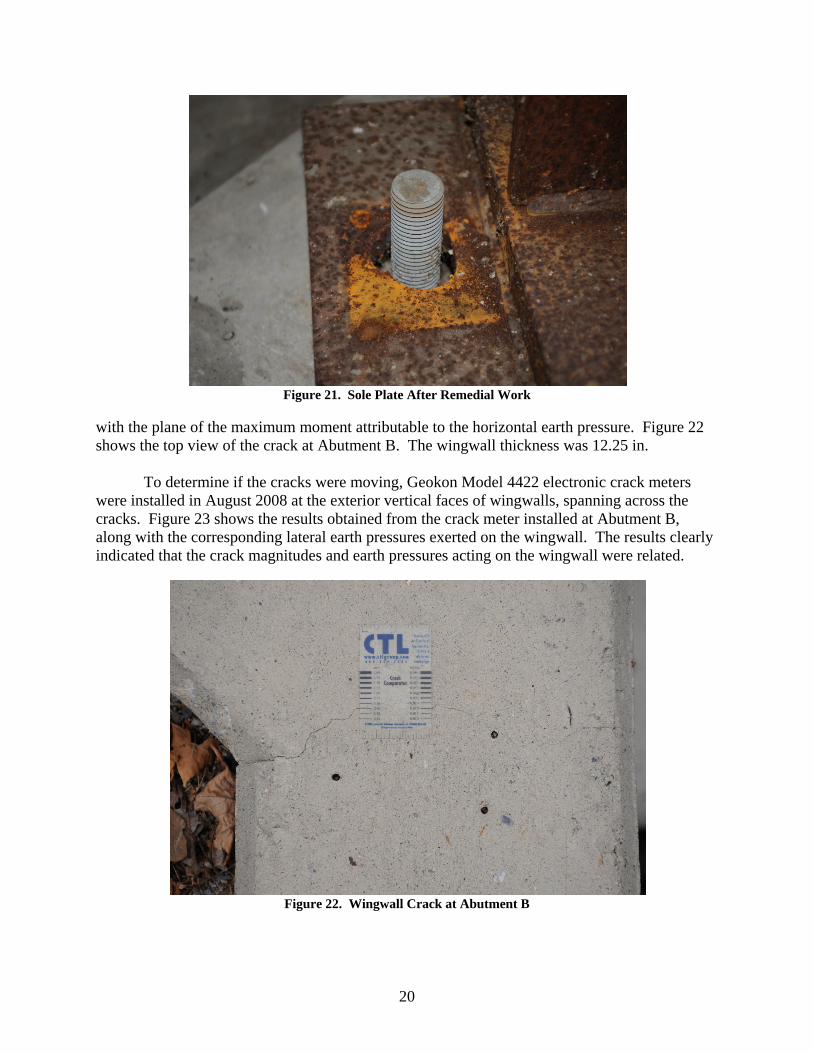
Shortly after the bridge was constructed, it was discovered by the researchers that a
number of anchor bolts came into direct contact with the sole plates along the side edges of the slots. This condition was indicative of some lateral displacement of the superstructure relative to the abutment. Sole plate slots were designed with 0.25-in lateral clearance for the anchor bolt. Remedial work, consisting of enlarging some slots with an acetylene torch, was undertaken by VDOT maintenance personnel to prevent the transfer of shear force to anchor bolts. Figure 21 shows the sole plate and anchor bolt detail after the repairs.
After approximately 1 year of service, hairline cracks were detected at the wingwall-to-
backwall interface. Cracking was observed at all four wingwalls. Crack locations corresponded
Abutment B, 7/22/2011 17:02,
45.84 kips
-500
0
500
1000
1500
2000
2500
3000
0
5
10
15
20
25
30
35
40
45
50
Ear
th P
ress
ure
(p
sf)
Lo
ad (
Kip
s)
Date andTime
Abutment B Load Cell
2B3
B1
20
Figure 21. Sole Plate After Remedial Work
with the plane of the maximum moment attributable to the horizontal earth pressure. Figure 22 shows the top view of the crack at Abutment B. The wingwall thickness was 12.25 in.
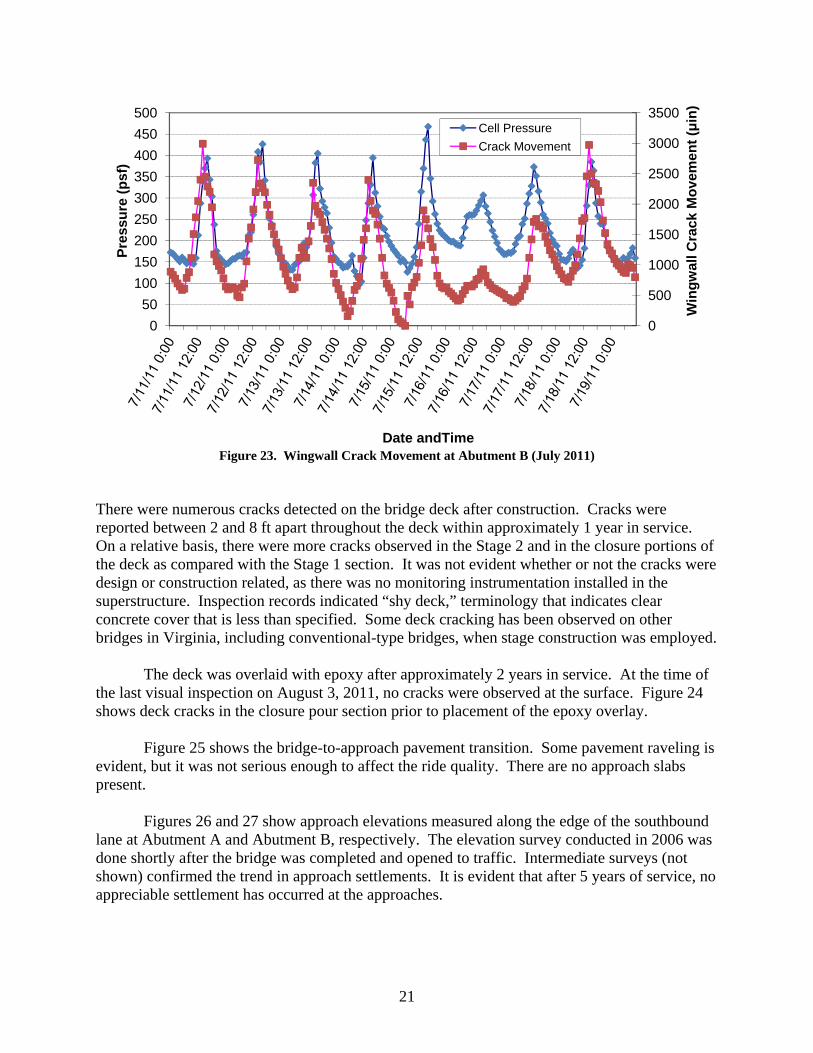
To determine if the cracks were moving, Geokon Model 4422 electronic crack meters
were installed in August 2008 at the exterior vertical faces of wingwalls, spanning across the cracks. Figure 23 shows the results obtained from the crack meter installed at Abutment B, along with the corresponding lateral earth pressures exerted on the wingwall. The results clearly indicated that the crack magnitudes and earth pressures acting on the wingwall were related.
Figure 22. Wingwall Crack at Abutment B
21
Figure 23. Wingwall Crack Movement at Abutment B (July 2011)
There were numerous cracks detected on the bridge deck after construction. Cracks were reported between 2 and 8 ft apart throughout the deck within approximately 1 year in service. On a relative basis, there were more cracks observed in the Stage 2 and in the closure portions of the deck as compared with the Stage 1 section. It was not evident whether or not the cracks were design or construction related, as there was no monitoring instrumentation installed in the superstructure. Inspection records indicated “shy deck,” terminology that indicates clear concrete cover that is less than specified. Some deck cracking has been observed on other bridges in Virginia, including conventional-type bridges, when stage construction was employed.
The deck was overlaid with epoxy after approximately 2 years in service. At the time of
the last visual inspection on August 3, 2011, no cracks were observed at the surface. Figure 24 shows deck cracks in the closure pour section prior to placement of the epoxy overlay.
Figure 25 shows the bridge-to-approach pavement transition. Some pavement raveling is
evident, but it was not serious enough to affect the ride quality. There are no approach slabs present.
Figures 26 and 27 show approach elevations measured along the edge of the southbound
lane at Abutment A and Abutment B, respectively. The elevation survey conducted in 2006 was done shortly after the bridge was completed and opened to traffic. Intermediate surveys (not shown) confirmed the trend in approach settlements. It is evident that after 5 years of service, no appreciable settlement has occurred at the approaches.
0
500
1000
1500
2000
2500
3000
3500
0
50
100
150
200
250
300
350
400
450
500
Win
gw
all C
rack
Mo
vem
ent
(μin
)
Pre
ssu
re (
psf
)
Date andTime
Cell Pressure
Crack Movement

22
Figure 24. Deck Cracks (August 2008)
Figure 25. Approach at Abutment B (August 2011)

23
Figure 26. Approach A Settlement
Figure 27. Approach B Settlement
1309
1309.05
1309.1
1309.15
1309.2
1309.25
1309.3
1309.35
1309.4
1309.45
1309.5
0 10 20 30 40 50
Ele
vati
on
(ft
)
Distance from Backwall (ft)
August 3, 2011
1309
1309.05
1309.1
1309.15
1309.2
1309.25
1309.3
1309.35
1309.4
1309.45
1309.5
0 10 20 30 40 50
Ele
vati
on
(ft
)
Distance from Backwall (ft)
August 3, 2011
24
DISCUSSION
The horizontal earth pressure coefficient (Kh) is the ratio of the horizontal to the vertical stress in soil, defined as follows:
Kh = σh / σv [Eq. 3] where σh = horizontal stress σv = vertical stress.
The maximum value of this ratio for a given soil corresponds to the state of passive failure, whereby Kh becomes the coefficient of passive earth pressure - Kp. It is very likely that a full passive pressure is not reached under all scenarios involving the integral bridge displacement against the adjoining soil. Therefore, it may be more informative to express the proposed design parameters in terms of Kh.
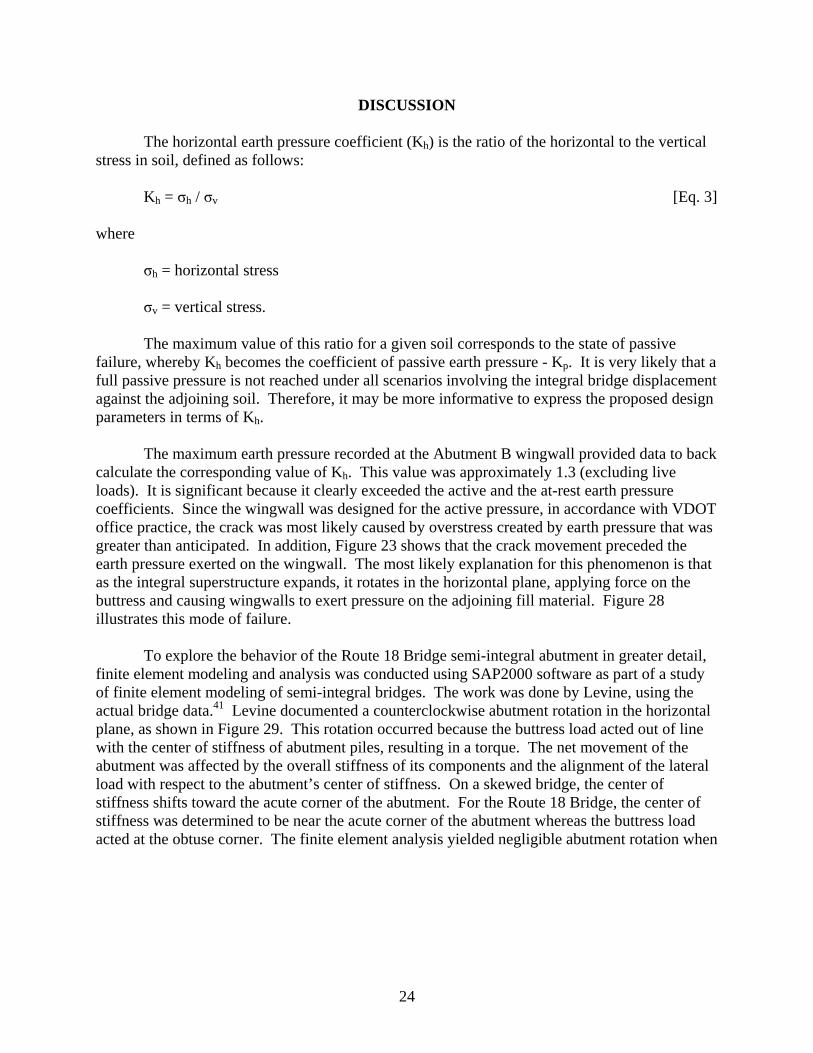
The maximum earth pressure recorded at the Abutment B wingwall provided data to back calculate the corresponding value of Kh. This value was approximately 1.3 (excluding live loads). It is significant because it clearly exceeded the active and the at-rest earth pressure coefficients. Since the wingwall was designed for the active pressure, in accordance with VDOT office practice, the crack was most likely caused by overstress created by earth pressure that was greater than anticipated. In addition, Figure 23 shows that the crack movement preceded the earth pressure exerted on the wingwall. The most likely explanation for this phenomenon is that as the integral superstructure expands, it rotates in the horizontal plane, applying force on the buttress and causing wingwalls to exert pressure on the adjoining fill material. Figure 28 illustrates this mode of failure.
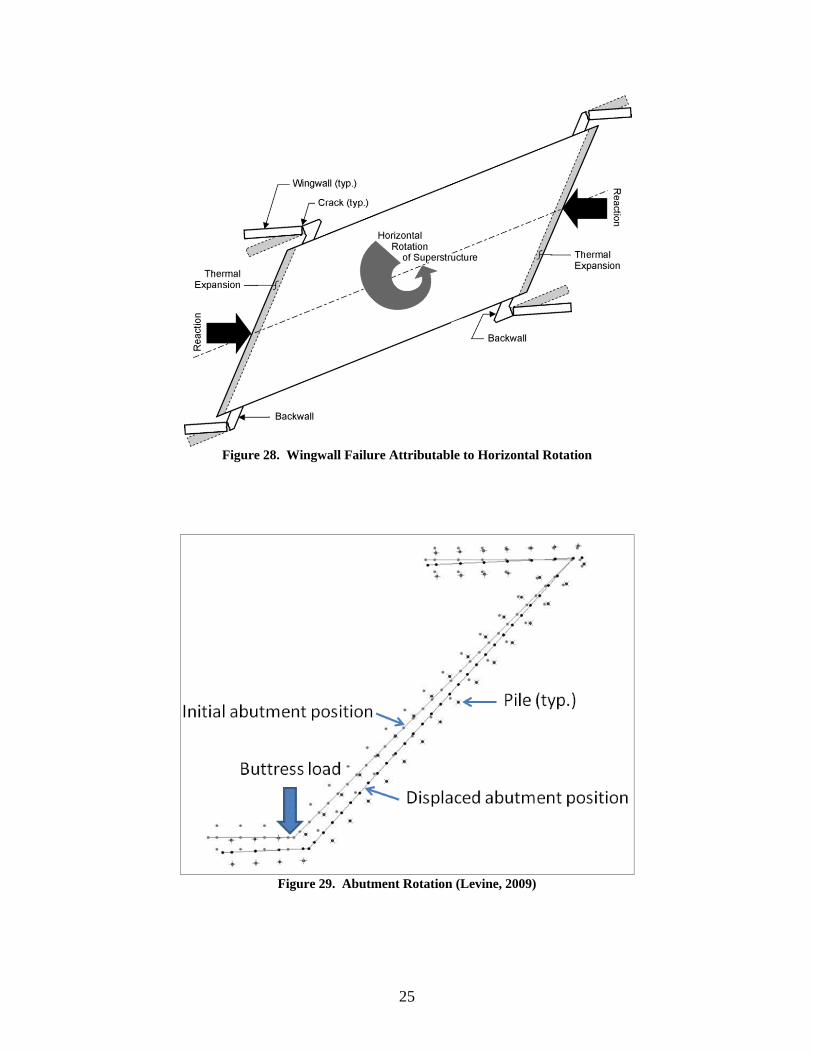
To explore the behavior of the Route 18 Bridge semi-integral abutment in greater detail,
finite element modeling and analysis was conducted using SAP2000 software as part of a study of finite element modeling of semi-integral bridges. The work was done by Levine, using the actual bridge data.41 Levine documented a counterclockwise abutment rotation in the horizontal plane, as shown in Figure 29. This rotation occurred because the buttress load acted out of line with the center of stiffness of abutment piles, resulting in a torque. The net movement of the abutment was affected by the overall stiffness of its components and the alignment of the lateral load with respect to the abutment’s center of stiffness. On a skewed bridge, the center of stiffness shifts toward the acute corner of the abutment. For the Route 18 Bridge, the center of stiffness was determined to be near the acute corner of the abutment whereas the buttress load acted at the obtuse corner. The finite element analysis yielded negligible abutment rotation when
25
Figure 28. Wingwall Failure Attributable to Horizontal Rotation
Figure 29. Abutment Rotation (Levine, 2009)

26
the buttress load was modeled at the center of stiffness. These results demonstrated that a more efficient design, resulting in a minimum abutment rotation and reduced earth pressures on wingwalls, can be achieved by constructing a buttress near the acute corner of the semi-integral abutment.
The range of thermally induced movements of the integral superstructure can be
estimated from the thickness measurements of the EPS elastic inclusion. The maximum and minimum instantaneous strains were 2.5 and 0.6 percent, respectively. These values corresponded to the change in the EPS thickness of 0.285 in. Since these measurements were taken perpendicular to the backwall, the actual range of movement along the centerline of the bridge was greater by a factor of √2, accounting for the 45° skew angle, resulting in 0.4 in of displacement. The thermal range of 0.4 in represented 303 microstrains on the 110-ft-long deck. The theoretical thermal strain, using ΔT = 120 °F as per AASHTO guidelines,9 was 780 microstrains. The resulting ratio of actual to theoretical thermal movements was 0.4. This value assumes that all thermal displacements took place within the elastic inclusion at Abutment A. It is possible that some minor displacement could have also occurred at Abutment B; therefore, the actual ratio may be somewhat higher, but it is likely that Equation 2 in its current form is overly conservative in estimating the required thickness of the elastic inclusion. The thermal correction coefficient of 0.67 appears to overestimate the actual magnitude of the superstructure displacement.
The observed long-term performance of the EPS elastic inclusion did not indicate any signs of creep at the strain levels recorded during the study, as shown in Figure 17. In addition, it is evident that the elastic inclusion has been operating at relatively low strains. It is therefore possible to revise the existing formula used in VDOT office practice1 for calculating the required EPS thickness in order to mobilize the 10 percent elastic range of the material. It is proposed that the thickness component resulting from the compaction effect remain at 0.01 of the backwall height to account for the variability in construction (the observed compression was approximately 0.006 of the height). The thickness component attributed to the thermal movement may be reduced from 0.67ΔL to 0.5ΔL. In addition, the skew effect must be accounted for, since the elastic inclusion is compressed in a direction perpendicular to the backwall. Therefore, the following revised formula is proposed for calculating the required thickness of the elasticized EPS material:
EPSt = 10 [0.01h + 0.5ΔL] cos(θ) [Eq. 4]
where
EPSt = required EPS thickness in inches (shall not be less than 10 inches, as per current VDOT practice)
h = height of integral backwall/abutment in inches ΔL = total thermally induced longitudinal movement at the abutment in inches (AASHTO formula) 9
27
θ = bridge skew angle.
The proposed formula results in an approximately 12 percent reduction in the required EPS thickness for a no-skew integral bridge. For a bridge at a 45° skew, the resulting thickness reduction is approximately 38 percent as compared to the current VDOT practice. 1 For high backwalls, it may be more efficient to design the EPS layer in stages, progressively increasing thickness with depth.
The maximum recorded buttress load of 46 kips was significantly smaller than the estimated design force of 157 kips. There are two possible reasons for the large discrepancy (1) the load may have been reduced by interface shear force developed at the backwall (currently ignored in design calculations) or (2) the smaller load may have been caused by a significantly smaller realized value of Kh (currently Kh = 4 is required by VDOT for design with the EPS layer).1
Load cell readings recorded at the buttresses allow for back calculation of the
corresponding actual value of Kh. The methodology pertaining to the buttress force derivation as outlined in the VDOT integral bridge design guidelines was followed.1 If no interface shear force developed, the resulting back calculated values of Kh were 0.8 and 0.9 at Abutments A and B, respectively. If interface shear force resisting backwall displacement developed, for Abutment A (with the EPS layer) the corresponding value of Kh was 2.3. For Abutment B (no EPS) the corresponding value of Kh was 3.6. In these back calculations the results of the study by Stark et al. were used to select the friction angle δ = 25° at the geofoam/nonwoven geotextile interface.42 The results of laboratory tests conducted by Shallenberger and Filz were used to estimate δ = 31° for the interface of granular backfill and concrete coated with the waterproofing compound (δ = 35° for the uncoated concrete and granular backfill).43
Since the interface shear force cannot be measured directly in the field, the only
corroborating evidence of its existence may be gained from analyzing the earth pressure cell data. Considering the maximum recorded earth pressures at integral backwalls, the peak back calculated value of Kh behind the EPS layer was 0.7. For the direct concrete-backfill interface, the peak back calculated value of Kh reached 13. Although it is possible that earth pressure cells may have been under-registering loads because of the soil arching effects, the available field data pointed to the most likely scenario of no interface shear force development. In addition, anecdotal evidence from previous VDOT construction projects pointed to a noticeable superstructure horizontal rotation in the absence of a restraining buttress, even at very small bridge skew angles. This observation indicates that no lateral frictional force is effectively mobilized at the integral backwall, probably due to frequent expansion and contraction cycles resulting in the loss of soil to backwall adhesion. Therefore, it appears that the Route 18 Bridge the actual value of the horizontal earth pressure coefficient was significantly less than 4.
No evidence of pile overstress was detected during the monitoring period. Analysis of foundation pile strains indicated a maximum computed localized compressive stress of approximately 6,000 psi. This stress did not include live loads (strain gages were zeroed after pile driving and before abutment construction) and represented 80 percent of the allowable working stress design load. The piles were designed for a working stress of 7,500 psi to reflect
28
local soil conditions in accordance with the office practice in VDOT’s Staunton District. The corresponding AASHTO allowable working stress for foundation piles was 9,000 psi. Maximum strains were recorded during the winter months. This may have been caused by additional lateral loads as the superstructure was contracting in cold weather. In addition to axial loads, piles of semi-integral abutments are subjected to some lateral loads attributable to earth pressure, the buttress force, and thermally induced bearing displacements, but these loads are typically not significant as there is no moment transfer from the superstructure. Considering the relatively low magnitude of recorded pile strains, there may be potential to optimize the foundation design methodology. One possible approach to advancing the state of the practice may be found in the study by Weakley, 44 incorporating geotechnical elements of the soil-structure interaction work of Mokwa and Duncan13 into structural analysis of piles. Strain feedback from instrumented piles, especially at fully integral abutments, may be used to improve the foundation design process.
CONCLUSIONS Semi-integral bridges can perform satisfactorily at a 45° skew.
Potential movements at skewed fully integral bridges should be investigated because of the
inherently low stiffness associated with a single row of foundation piles. Excessive horizontal rotation may have a detrimental impact on the performance of the wingwall and approach slab.
The buttress restraining horizontal rotation of the superstructure may be located in the
proximity of the acute corner of the semi-integral abutment. Sole plate slots for anchor bolts at semi-integral bridges should have sufficient lateral
clearance to accommodate potential displacements attributable to thermal movements or construction tolerances.
The use of elasticized EPS material at integral abutments results in significant reductions of
horizontal earth pressures and settlements at bridge approaches. The elimination of approach slabs, combined with the use of select backfill material and
elastic inclusion at abutments, is a viable design option.
Feedback from field measurements may be used to optimize the foundation design methodology for integral bridges.
RECOMMENDATIONS 1. VDOT’s Structure and Bridge Division should consider amending the existing integral
bridge design guidelines to allow for up to a 45° skew on semi-integral bridges with shallow girders.

29
2. VDOT’s Structure and Bridge Division should investigate maximum skew restrictions for fully integral bridges. The Virginia Center for Transportation Innovation and Research (VCTIR) should conduct long-term field monitoring study of a highly skewed fully integral bridge to provide data on performance characteristics.
3. VDOT’s Structure and Bridge Division should consider an alternative buttress design for
highly skewed semi-integral bridges such that the buttress force is applied near the acute corner of a skewed abutment. A proposed design is shown in Figure 30. Rub plates should be oriented in a plane parallel to the girder’s web. The overlap between the abutment stem and the backwall may have to be increased to accommodate this detail.
Figure 30. Proposed Buttress at Semi-Integral Bridges
The resulting buttress force will be greater in magnitude than one computed using the current methodology but will align closer to the center of the abutment stiffness, thus minimizing the abutment rotation. Buttress force derivations for the proposed design are presented in the Appendix.
4. VDOT’s Structure and Bridge Division should modify the existing bearing details for semi-integral bridges to allow for a minimum of 0.5-in lateral clearance of the anchor bolt at the sole plate. (The Route 18 Bridge had a 0.25-in clearance.)
5. VDOT’s Structure and Bridge Division should consider adopting the following coefficients of horizontal earth pressure for integral bridge substructure design: Kh = 1 if the elasticized EPS is used (currently Kh = 4)
Kh = 12 if no elastic inclusion is used (as per current VDOT practice).
6. VDOT’s Structure and Bridge Division should consider modifying the structural detail of the wingwall to backwall interface to mitigate crack formation or designing wingwalls for lateral earth pressure greater than the active state (Ka).
30
7. VDOT’s Structure and Bridge Division should consider adopting Equation 4 for calculating the required thickness of the EPS elastic inclusion at the backwall.
8. VDOT’s Structure and Bridge Division should continue the existing policy of providing design waivers for the exclusion of approach slabs where warranted.
9. On future field monitoring projects, VCTIR should install strain instrumentation in the superstructure to study potential causes of deck cracking.
10. VCTIR and VDOT’s Structure and Bridge Division should collaborate on the development of an optimized foundation design methodology for integral bridges.
BENEFITS AND IMPLEMENTATION PROSPECTS The concept of an integral bridge has been shown to provide numerous advantages over a
conventional design. One of the most important aspects of the integral bridge is the elimination of roadway expansion joints. These joints are usually expensive to procure and maintain and are constantly subjected to impact vehicular loading and damage by snow plows. Frequently, corrosion problems at beam ends and bearings can be traced to leaking joints, allowing salt-laden deck run-off to infiltrate the superstructure. In addition, the joint assembly hardware can become a safety hazard to passing motorists when it becomes dislodged from the deck. As the integral structure is typically less expensive to construct than the conventional equivalent, it can result in lower operating costs over a bridge lifetime. The use of elastic inclusion at the integral abutment has been shown to deliver considerable benefits, such as a reduction in horizontal earth pressures and mitigation of approach settlements.
The results of this study validate VDOT’s existing policy of continuous incremental
improvements to the integral bridge design methodology through field verification of performance. VDOT, as most other state DOTs, has placed design restrictions on jointless bridges, recognizing that they behave differently than conventional structures. The restrictions were placed on the maximum span length, skew, and curvature. As performance feedback is obtained from field monitoring of integral structures, the restrictions are being gradually relaxed, resulting in a more widespread usage of this type of design.
ACKNOWLEDGMENTS The authors express their appreciation to the staff of VDOT’s Staunton District Bridge Office and the members of the VDOT Jointless Bridge Committee for their technical guidance. Mr. George Bezold of VDOT’s Staunton District facilitated contact with the contractor. Messrs. Arthur Wagner and Richard Childs of VCTIR provided project coordination and assisted with field data collection. Mr. Aaron Levine conducted finite element analysis of bridge abutment. Ms. Linda DeGrasse assisted with data processing. Mr. Timothy Bagnall conducted extensive
31
data analysis and graphing. Messrs. Andy Zickler, Bruce Shepard, Park Thompson, and Keith Weakley provided critical review comments. Ms. Linda Evans provided editorial assistance.
REFERENCES 1. Virginia Department of Transportation, Structure and Bridge Division. Design Aids and
Typical Details, Volume V: Part 2, Chapter 17. May 2012. http://www.extranet.vdot.state.va.us/locdes/electronic%20pubs/Bridge%20Manuals/VolumeV-Part2/Chapter17.pdf. Accessed June 19, 2012.
2. Soltani, A.A., and Kukreti, A.R. Performance Evaluation of Integral Abutment Bridges. In
Transportation Research Record: Journal of the Transportation Research Board, No. 1371. Transportation Research Board of the National Academies, Washington, D.C., 1992, pp. 17-25.
3. Hoppe, E.J., and Gomez, J.P. Field Study of an Integral Backwall Bridge. VTRC 97- R7.
Virginia Transportation Research Council, Charlottesville, 1996. 4. Hoppe, E.J. Field Study of Integral Backwall with Elastic Inclusion. VTRC 05-R28.
Virginia Transportation Research Council, Charlottesville, 2005. 5. GeoTech Systems Corporation. Geoinclusion.
http://www.geosyscorp.com/noframes/products/geoinclusion.htm. Accessed June 19, 2012. 6. Virginia Center for Transportation Innovation and Research. Index of Blue Run.
http://matrix.vtrc.virginia.edu/Blue_Run/. Accessed May 23, 2012. 7. Burke, M.P., and Gloyd, S. Semi-integral Bridges: A Revelation. Transportation Research
Board Paper No. 960626. Transportation Research Board 75th Annual Meeting, Washington, D.C., 1996.
8. Kunin, J., and Alampalli, S. Integral Abutment Bridges: Current Practice in United States
and Canada. Journal of Performance of Constructed Facilities, August 2000, pp. 104-111. 9. AASHTO. LRFD Bridge Design Specifications, 5th Ed. Washington, D.C., 2010. 10. Virginia Department of Transportation, Structure and Bridge Division. Instructional and
Informational Memorandum No. IIM-S&B-80.3. January 2011. http://www.extranet.vdot.state.va.us/locdes/electronic%20pubs/Bridge%20Manuals/IIM/SBIIM80.3.pdf. Accessed September 2, 2011.
11. Arsoy, S., Duncan, J.M., and Barker, R.M. Approach to Evaluating Damage from Thermal
Bridge Displacements. In Transportation Research Record: Journal of the Transportation
32
Research Board, No. 1936. Transportation Research Board of the National Academies, Washington, D.C., 2005, pp. 124-129.
12. American Concrete Institute. Report on Thermal and Volume Change Effects on Cracking
of Mass Concrete. ACI 207.2R-07. Farmington Hills, MI, 2007. 13. Mokwa, R.L., and Duncan, J.M. Investigation of the Resistance of Pile Caps and Integral
Abutments to Lateral Loading. VTRC 00-CR4. Virginia Transportation Research Council, Charlottesville, 2000.
14. Frosch, R., Wenning, M., and Chovichien, V. The In-Service Behavior of Integral
Abutment Bridges: Abutment-Pile Response. In The 2005 FHWA Conference: Integral Abutment and Jointless Bridges (IAJB 2005), March 16-18, Baltimore, 2005, pp. 30-39.
15. Arsoy, S., Barker, R.M., and Duncan, J.M. The Behavior of Integral Abutment Bridges.
VTRC 00-CR3. Virginia Transportation Research Council, Charlottesville, 1999. 16. Virginia Department of Transportation, Structure and Bridge Division. Design Aids and
Typical Details, Volume V: Part 2, Chapter 0. May 2012. http://www.extranet.vdot.state.va.us/locdes/electronic%20pubs/Bridge%20Manuals/VolumeV-Part2/Chapter0.pdf. Accessed June 19, 2012.
17. Dunn, I.S., Anderson, L.R., and Kiefer, F.W. Fundamentals of Geotechnical Analysis.
John Wiley & Sons, New York, 1980. 18. Caquot, A., and Kérisel, J. Tables for the Calculation of Passive Pressure, Active Pressure
and Bearing Capacity of Foundation. Gauthier-Villars, Paris, 1948. 19. Müller-Breslau, H. Erddruck auf Stutzmauern. Alfred Kroner-Verlag, Stuttgart, 1906. 20. Absi, E., and Kérisel, J. Active and Passive Earth Pressure Tables. Taylor & Francis,
London, 1990. 21. Sokolovski, V.V. Statics of Soil Media. Butterworth, London, 1960. 22. Highways Agency. BA42/96 The Design of Integral Bridges. Design Manual for Roads
and Bridges. The Stationery Office, London, 1996. 23. Eurocode 7: Geotechnical Design: Part 1: General rules. EN 1997-1. European
Commission for Standardization (CEN), Brussels, 2004. 24. Wasserman, E.P. Design of Integral Abutments for Jointless Bridges. Structure, May
2001, pp. 24-33. 25. Hassiotis, S., and Xiong, K. Deformation of Cohesionless Fill Due to Cyclic Loading.
Stevens Institute of Technology, Hoboken, N.J., 2007.

33
26. Mei, G., Chen, Q., and Song, L. Model for Predicting Displacement-Dependent Lateral Earth Pressure. Canadian Geotechnical Journal, Vol. 46, 2009, pp. 969-975.
27. Clough, G.W., and Duncan, J.M. Earth Pressures: Foundation Engineering Handbook.
Van Nostrand Reinhold, New York, 1991. 28. Carder, D.R., and Card, G.B. Innovative Structural Backfills to Integral Bridge Abutments.
TRL Report No. 290. Transport Research Laboratory, Crawthorne, UK, 1997. 29. Horvath, J.S. Geofoam Geosynthetics. Horvath Engineering, P.C., Scarsdale, N.Y., 1995. 30. Horvath, J.S. Integral-Abutment Bridges: Problems and Innovative Solutions Using EPS
Geofoam and Other Geosynthetics. Report No. CE/GE-00-2. Manhattan College, New York, 2000.
31. Aytekin, M. Numerical Modeling of EPS Geofoam Used with Swelling Soil. Geotextiles
and Geomembranes, Vol. 15, 1997, pp. 133-146. 32. Preber, T., Bang, S., Chung, Y., and Cho, Y. Behavior of Expanded Polystyrene Blocks. In
Transportation Research Record: Journal of the Transportation Research Board, No. 1462. Transportation Research Board of the National Academies, Washington, D.C., 1994,pp. 36-46.
33. Ove Arup & Partners Ltd. Integral Bridge Research: Phase I Scoping Study. London, UK,
2005. 34. Shehu, J. Evaluation of the Wingwalls and Foundations of Skewed Semi-Integral Bridges
with Wall Abutments. M.S. Thesis, Ohio University, Russ College of Engineering and Technology, Athens, 2009.
35. Steinberg, E., and Sargand, S. Forces Exerted in the Wingwalls of Skewed Semi-Integral
Bridges. Ohio University, Department of Civil Engineering, Athens, 2001. 36. Thomson, T.A., and Luteneger, A.J. Passive Earth Pressure Tests on an Integral Bridge
Abutment. In Proceedings of the Fourth International Conference on Case Histories in Geotechnical Engineering, St. Louis, March 8-12, 1998, pp. 733-739.
37. Burke, M.P. Cracking of Concrete Decks and Other Problems with Integral-Type Bridges.
In Transportation Research Record: Journal of the Transportation Research Board, No. 1688. Transportation Research Board of the National Academies, Washington, D.C., 1999, pp. 131-138.
38. Arsoy, S., Barker, R.M., and Duncan, J.M. Experimental and Analytical Investigations of
Piles and Abutments of Integral Bridges. VTRC 02-CR6. Virginia Transportation Research Council, Charlottesville, 2002.

34
39. Abendroth, R.E., and Greimann, L.F. Field Testing of Integral Abutments. Iowa DOT Project HR-399. Iowa State University, Ames, 2005.
40. Hoppe, E.J., and Bagnall, T.M. Performance of a Skewed Semi-Integral Bridge: Volume I:
Field Monitoring. VTRC 08-R20. Virginia Transportation Research Council, Charlottesville, 2008.
41. Levine, A.D. Finite Element Modeling and Analysis of Semi-Integral Bridges. M.Sc.
Thesis, University of Virginia, Department of Civil Engineering, Charlottesville, 2009. 42. Stark, T.D., Arellano, D., Horvath, J.S., and Leshchinsky, D. Geofoam Applications in the
Design and Construction of Highway Embankments. NCHRP Web Document 65 (Project 24-11). Transportation Research Board of the National Academies, Washington, D.C., 2004.
43. Shallenberger, W.C., and Filz, G.M. Interface Strength Determination Using a Large
Displacement Shear Box. In Proceedings of the Second International Congress on Environmental Geotechnics, Osaka, 1996.
44. Weakley, K.P. Foundation Pile Design for Integral Abutments. CE693 Independent Study.
University of Virginia, Department of Civil Engineering, Charlottesville, 2006.

35
APPENDIX
FORCE DERIVATIONS FOR THE PROPOSED BUTTRESS AT A SEMI-INTEGRAL BRIDGE
Parameter Description
R Buttress force required to resist rotation of superstructure (kips)
Skew angle of bridge
Angle of Wall Friction
H Height of integral backwall (ft)
Kh Coefficient of horizontal earth pressure
Unit weight of soil (pcf)
d Horizontal distance from the end of the backwall to the center of the buttress rub plates
· sin
2· tan Moment arm for buttress force
· sin Moment arm for normal horizontal earth force
· cos Moment arm for tangential horizontal earth force
12
· · · Unit horizontal earth force at a point along the backwall (kips/LF)
cos Full horizontal earth force across the width of the bridge (kips)

36
· cos Component of “P” normal to the backwall (kips)
· sin Component of “P” tangential to backwall (kips)
Field observations to date indicate superstructure rotation with skew angles as low as 5. It appears that the shear force at the backwall/backfill interface is not always mobilized. Therefore, it is recommended that the interaction angle of friction, , between the soil and backwall be set to zero. Therefore, it can be assumed that Pt and Pn forces are not mobilized but only P remains. The following calculations include this assumption.
0 · · · ·
0 · · ·
0 · · · · 0 · 2
·2
· · sin
2
cos · · sin
2 · 2 · tan
· tan
1 · tan 2