Embed Size (px)
Citation preview
RESEARCH ARTICLE
Thermal regimes of Rocky Mountain lakes
warm with climate change
James J. Roberts1,2*, Kurt D. Fausch3☯, Travis S. Schmidt1☯, David M. Walters2☯
1 Colorado Water Science Center, U.S. Geological Survey, Fort Collins, Colorado, United States of America,
2 Fort Collins Science Center, U.S. Geological Survey, Fort Collins, Colorado, United States of America,
3 Department of Fish, Wildlife, and Conservation Biology, Colorado State University, Fort Collins, Colorado,
United States of America
☯ These authors contributed equally to this work.
Abstract
Anthropogenic climate change is causing a wide range of stresses in aquatic ecosystems,
primarily through warming thermal conditions. Lakes, in response to these changes, are
experiencing increases in both summer temperatures and ice-free days. We used continu-
ous records of lake surface temperature and air temperature to create statistical models of
daily mean lake surface temperature to assess thermal changes in mountain lakes. These
models were combined with downscaled climate projections to predict future thermal condi-
tions for 27 high-elevation lakes in the southern Rocky Mountains. The models predict a
0.25˚C�decade-1 increase in mean annual lake surface temperature through the 2080s,
which is greater than warming rates of streams in this region. Most striking is that on aver-
age, ice-free days are predicted to increase by 5.9 days �decade-1, and summer mean lake
surface temperature is predicted to increase by 0.47˚C�decade-1. Both could profoundly
alter the length of the growing season and potentially change the structure and function of
mountain lake ecosystems. These results highlight the changes expected of mountain lakes
and stress the importance of incorporating climate-related adaptive strategies in the devel-
opment of resource management plans.
Introduction
Aquatic systems are being altered by anthropogenically driven changes in climatic conditions
[1–5]. Changes in climate are causing a wide range of stresses in aquatic systems, and a partic-
ularly important one is increasing water temperature, which has been documented in streams
and lakes worldwide [5–7]. Lakes are important sentinels of climate change [8,9] and the
routes to change in lakes include three primary climate forcing pathways: temperature, precip-
itation, and incident solar radiation [10]. Rising water temperatures in lakes is a particularly
important change because lakes have warmed faster than atmospheric temperatures in some
cases [11,12]. Worldwide, the summer surface temperatures of lakes are increasing at an aver-
age rate of 0.34˚C �decade-1 [5]. These high rates of temperature rise are likely to have signifi-
cant effects on lakes because thermal regime has a strong influence on the structure and
PLOS ONE | https://doi.org/10.1371/journal.pone.0179498 July 6, 2017 1 / 17
a1111111111
a1111111111
a1111111111
a1111111111
a1111111111
OPENACCESS
Citation: Roberts JJ, Fausch KD, Schmidt TS,
Walters DM (2017) Thermal regimes of Rocky
Mountain lakes warm with climate change. PLoS
ONE 12(7): e0179498. https://doi.org/10.1371/
journal.pone.0179498
Editor: João Miguel Dias, Universidade de Aveiro,
PORTUGAL
Received: June 2, 2016
Accepted: May 31, 2017
Published: July 6, 2017
Copyright: This is an open access article, free of all
copyright, and may be freely reproduced,
distributed, transmitted, modified, built upon, or
otherwise used by anyone for any lawful purpose.
The work is made available under the Creative
Commons CC0 public domain dedication.
Data Availability Statement: All relevant data are
within the paper and its Supporting Information
files.
Funding: This work was funded by the United
States Geological Survey, who provided JJR
funding through the Mendenhall Postdoctoral
Fellowship Program. Colorado Parks and Wildlife
also provided funding to KDF. The funder provided
support in the form of salaries for authors JJR,
DMW, TSS, but did not have any additional role in
the study design, data collection and analysis,
decision to publish, or preparation of the
function of lentic ecosystems [13–15]. Specific lake processes that are susceptible to thermal
changes include plankton bloom phenology [16], harmful algal blooms [17], depletion of
hypolimnetic dissolved oxygen concentrations [18], and thermal suitability for vertebrates
[19,20].
Although changing thermal conditions are predicted for lakes of all sizes and types, the
influence of a changing climate on abiotic and biotic conditions of high-elevation mountain
lakes remains poorly studied. Small lakes are common features of mountainous landscapes,
where headwater systems function as important drivers of watershed processes [21]. One
region where headwater lakes are especially important to biogeochemical and hydrologic pro-
cesses is the southern Rocky Mountains (SRM; [22,23]). Within the SRM, a semi-arid portion
of western North America, mountain lakes and corresponding headwater networks influence
important water management decisions through their storage and release of snowmelt, an
important hydrologic driver of streams, rivers, and reservoirs [24–27]. Air temperatures in the
SRM are warming, although these trends are mostly confined to the summer and fall seasons
[28], and the magnitude of these changes are elevation dependent [29]. Therefore, understand-
ing how high-elevation mountain lakes respond to climate change is important for water man-
agement in the SRM and other regions where anthropogenic needs depend on mountain
hydrology.
Mountain lakes and associated headwater regions also provide critical refuge habitats for
native species throughout the SRM, many of which are imperiled (e.g., Cutthroat Trout Oncor-hynchus clarkii spp. and several amphibians; [30–32]). Various aspects of climate change,
including warming temperatures, have the potential to alter the unique habitats that these
lakes provide. However, the influence of changing climatic conditions on mountain lakes in
the SRM has been previously addressed mostly through broad scale generic modeling of North
American lakes (i.e., [33–35]) and a limited number of empirically-based studies of individual
mountain lakes [28,36]. Thus, uncertainty remains regarding how the thermal conditions of
SRM lakes have changed in the past, the magnitude of likely future changes, and the potential
landscape-level consequences of these changes for lake-dependent species and ecosystem
processes.
Here we use continuous records of surface water temperature for individual lakes and
weather station measurements of air temperature to create statistical models of daily mean
lake surface temperature. The fine-scale temporal resolution of our predictions facilitates
detailed analyses of SRM lake thermal regimes. We combine these statistical models with
dynamically downscaled regional climate model predictions to forecast lake surface water tem-
perature trends over the next 70 years, and test the hypothesis that mountain lakes in the SRM
are warming in response to climate change. Our model results provide information and mod-
els crucial to the creation of climate-smart management and conservation plans for mountain
lakes and their biota.
Materials and methods
Temperature data
We compiled data for 27 lakes, the majority of which are in Rocky Mountain National Park
(S1 Table), all of which had continuous records at least 2 years long (range: 2 to 15 years).
Temperature was recorded every 60 minutes for the entire duration of each continuous lake
record. We performed an initial quality check of these data using protocols established for
stream temperature data [37]. Only georeferenced data collected within the top 3 meters of the
water column or located within the first 250m of the lake inlet or outlet stream were included
in our analysis. Hydrogeomorphic site characteristics for each lake (S1 Table) were collected
Increasing temperatures in Rocky Mountain lakes
PLOS ONE | https://doi.org/10.1371/journal.pone.0179498 July 6, 2017 2 / 17
manuscript. The specific roles of these authors are
articulated in the ’author contributions’ section.
Competing interests: This work was funded by the
United States Geological Survey, who provided JJR
funding through the Mendenhall Postdoctoral
Fellowship Program. Colorado Parks and Wildlife
also provided funding to KDF. This commercial
affiliation does not alter our adherence to PLOS
ONE policies on sharing data and materials.
during logger deployment (maximum depth and elevation) and downloaded from the
National Hydrography Dataset Plus Version 2 (surface area and cumulative drainage area;
NHDPlusV2; http://www.horizon-systems.com/nhdplus/). To use the data collected in Rocky
Mountain National Park we received approval for this project from the park and we performed
this research under a Scientific Research and Collection Permit (#ROMO-2013-SCI-0009).
We acquired air temperature records from the snow telemetry (SNOTEL) network and cre-
ated a database of the 21 SRM SNOTEL sites nearest the lakes with temperature data. Daily
summaries of average air temperature (˚C) were downloaded from the SNOTEL webportal
(http://www.wcc.nrcs.usda.gov/snow/) and used to calculate the 7-day running mean of daily
air temperature (hereafter, mean weekly temperature). We used this metric as the independent
variable to create water temperature models of daily mean lake surface temperatures for each
lake and, in turn, to predict past and future lake temperatures.
Model development
We created a separate model of daily mean lake surface temperature for each lake. We used air
temperature from the nearest SNOTEL site (via Euclidian distance) and selected data to match
the period of lake temperature record. We used mean weekly air temperature as a predictor of
daily mean lake surface temperature (Fig 1A), and created predictive models using non-linear
logistic regression [38,39]. This modeled relationship represents how air temperature and lake
surface temperature co-vary, with extreme low air temperature rarely driving lake temperature
below 0˚C and an asymptotic upper limit of lake temperature controlled by evaporative cool-
ing [39]. Model parameters were fit using a non-linear least-squares loss function and the
Gauss-Newton algorithm. All models were fit using SYSTAT 12 software (Chicago, IL). We
evaluated model fit using the Nash Sutcliffe Coefficient (NSC; [40]) where a perfect model fit
receives a value of 1 and a poor model fit can receive negative values. The NSC is a more effec-
tive measure than the Root Mean Squared Error for evaluating the fit of non-linear models
[39].
Lake temperature predictions
Reconstructing lake temperature. We employed these non-linear models to predict past
lake surface temperature (reconstructing) using the entire air temperature time series (1986–
2014) from the SNOTEL sites. These reconstructions serve as baseline conditions for assessing
projected future thermal conditions for each lake (Fig 1B).
Projections of lake temperature. We used the model developed for each lake to project
future thermal conditions from dynamically downscaled climate projections [41]. The spatial
resolution of these climate projections is 15x5-km grid cells, and projections are available for
short-term (2035–2045) and long-term (2075–2085) time horizons. We used daily output of
surface air temperature from the PSU/OSU GENMOM (GNM; [42]) and MPI ECHAM5
(ECH; [43]) climate models, which were dynamically downscaled using a regional climate
model (RegCm3; [41]) under the A2 emission scenario from the IPCC AR4 (International
Panel of Climate Change) which assumes a medium-to-high emissions future [44]. The A2
emission scenario is most similar to the RCP 8.5 carbon scenario used in the newest IPCC
AR5 efforts [45]. Moreover, the GNM and ECH climate models were the only two models
from Hostetler et al. [41] that provided daily output suitable for our analysis. We compared
daily air temperatures measured at each SNOTEL site used in this study with temperatures
predicted from each climate model within the overlaying grid cell of each SNOTEL site for
2010–2012 (the only overlapping years available) and created an average monthly correction
factor. We applied this additive monthly correction factor to all climate projections before
Increasing temperatures in Rocky Mountain lakes
PLOS ONE | https://doi.org/10.1371/journal.pone.0179498 July 6, 2017 3 / 17
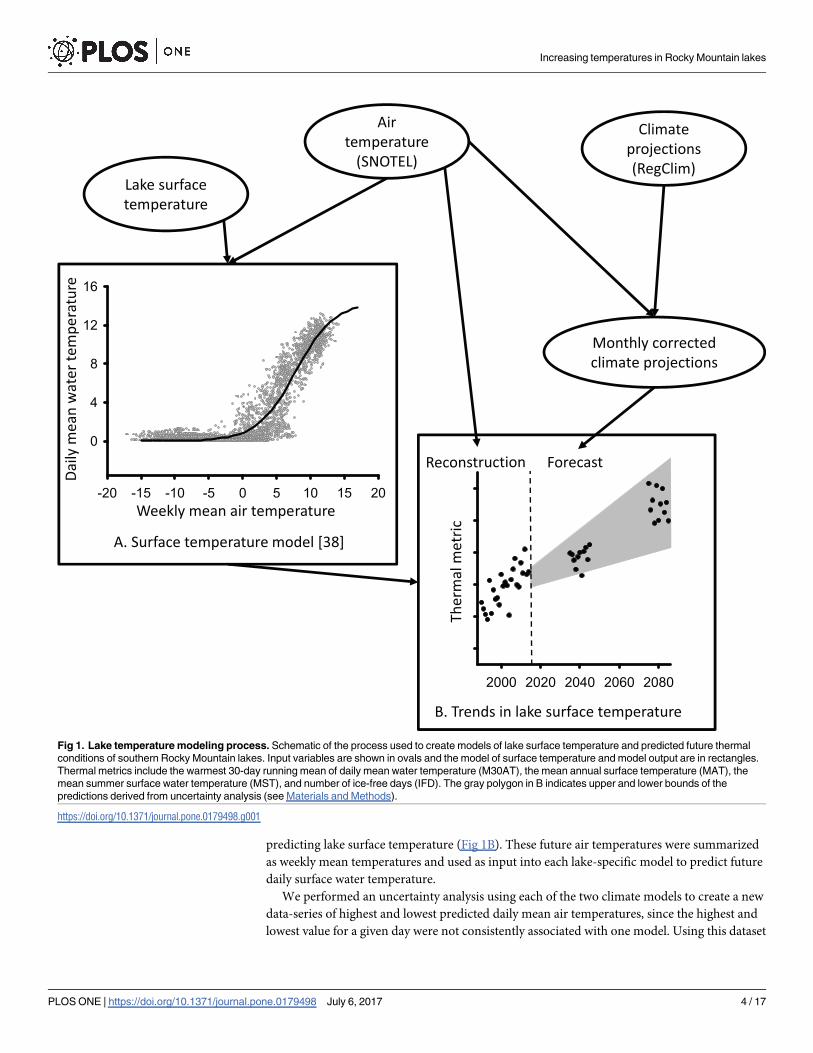
predicting lake surface temperature (Fig 1B). These future air temperatures were summarized
as weekly mean temperatures and used as input into each lake-specific model to predict future
daily surface water temperature.
We performed an uncertainty analysis using each of the two climate models to create a new
data-series of highest and lowest predicted daily mean air temperatures, since the highest and
lowest value for a given day were not consistently associated with one model. Using this dataset
Fig 1. Lake temperature modeling process. Schematic of the process used to create models of lake surface temperature and predicted future thermal
conditions of southern Rocky Mountain lakes. Input variables are shown in ovals and the model of surface temperature and model output are in rectangles.
Thermal metrics include the warmest 30-day running mean of daily mean water temperature (M30AT), the mean annual surface temperature (MAT), the
mean summer surface water temperature (MST), and number of ice-free days (IFD). The gray polygon in B indicates upper and lower bounds of the
predictions derived from uncertainty analysis (see Materials and Methods).
https://doi.org/10.1371/journal.pone.0179498.g001
Increasing temperatures in Rocky Mountain lakes
PLOS ONE | https://doi.org/10.1371/journal.pone.0179498 July 6, 2017 4 / 17
of predicted high and low daily air temperature we calculated mean weekly high and low air
temperatures. We then used these to predict high and low daily surface water temperature for
each lake, which defined the upper and lower bounds of our predictions (Fig 1B).
Lake thermal metrics
We used the daily values of lake surface temperature reconstructed and predicted from fore-
casting to calculate four lake thermal metrics (Fig 1). The first is a measure of fish habitat qual-
ity [31] and represents the warmest 30-day running mean of daily mean water temperature
(M30AT). The other three metrics are the mean annual surface water temperature (MAT), the
mean summer surface water temperature (mean for June-August of each year; MST), and the
number of ice-free days (sum of days with a daily mean lake surface temperature�4˚C for
each year; IFD). This estimate of IFD is based on lake hydrodynamics and assumes that when
the lake surface water is 4˚C (i.e., the value at which liquid water is most dense) the entire
water column is iso-thermal with no ice cover [46]. We summarize these thermal metrics at
three different time horizons: current (2004–2014), 2040s (2035–2045), and 2080s (2075–
2085). We also used the annual predictions of these metrics to examine trends (i.e., rates of
change) in our thermal metrics from 1986–2002 (depending on the record of the closest SNO-
TEL site) through 2085 using linear regression (α = 0.05), with year as the independent vari-
able. We used the slopes from these linear regressions to represent the rate of change for each
temperature metric, and present all results as rates of change �decade-1. These statistical analy-
ses were performed using SYSTAT 12 (Chicago, IL) software.
Fish thermal habitat quality. We assessed the thermal habitat quality for native fishes
(Cutthroat Trout) in these mountain lakes using eco-physiological thresholds defined in the
literature. Roberts et al. [31] related M30AT to growth and recruitment of Cutthroat Trout in
SRM streams and defined five eco-physiological states which are directly relevant to thermal
habitat quality of mountain lakes for these fish. Briefly, a M30AT below 8.0˚C is too cold for
growth and survival of young trout. Temperatures in the 8.0–9.0˚C range are cold enough to
restrict the survival of young trout up to age-1. However, higher temperatures (9.1–18.0˚C) are
optimal for growth and recruitment of trout, while even warmer temperatures (18.1–19.9˚C)
can reduce growth. Finally, temperatures in excess of 20.0˚C limit or stop growth of Cutthroat
Trout [31]. We use these eco-physiological thresholds to evaluate the fish thermal habitat qual-
ity in these 27 mountain lakes and examine changes through the 2080s.
Results
Model development
The models of surface temperature for each of the 27 lakes had an average NSC value of 0.83,
although the model parameters and fit varied among lakes (NSC range 0.68–0.91; S2 Table).
The average model parameter for maximum temperature (α) was 20.1˚C, the average parame-
ter for minimum temperature (μ) was 0.0˚C, the average γ (i.e., parameter defining slope
between α and μ) was 0.3, and the average β (i.e., the parameter defining inflection point) was
12.0˚C (S2 Table; see [38] for more details of model equation and parameters). The variation
of these parameter values among water bodies supports our decision to fit individual models
for each lake.
Lake temperature predictions
We used the measured and predicted air temperature in our models of lake temperature to
predict daily lake surface temperature during past, current, and future periods for each of the
Increasing temperatures in Rocky Mountain lakes
PLOS ONE | https://doi.org/10.1371/journal.pone.0179498 July 6, 2017 5 / 17
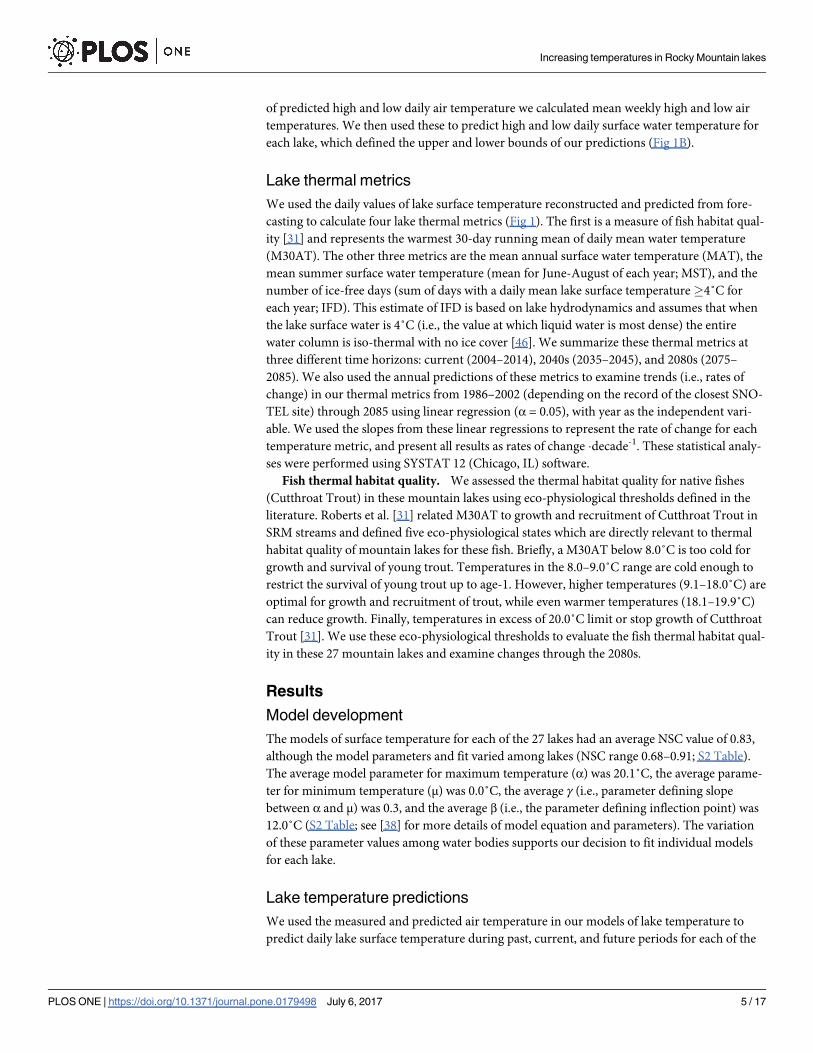
27 lakes, the slopes at all lakes are significant at α = 0.05 (Fig 1B). The current (2004–2014)
MAT among lakes of 3.9˚C (range 2.2–6.4) increased to 5.5˚C (3.4–7.9) by the 2080s. On aver-
age, MAT increased 0.25˚C �decade-1from 1986 through 2085 resulting in a 41% mean increase
over current conditions by the 2080s (Table 1). In contrast, the magnitude of change in MST
was roughly double that predicted for MAT. The current MST of 9.8˚C (5.9–13.7) increased to
12.7˚C (8.3–16.8) by the 2080s, a 30% mean increase, resulting in an overall rate of increase of
0.47˚C �decade-1 (Table 1). Large increases in IFD are also predicted. The current mean IFD of
128 days (86–184) increased to 165 days (131–217) IFD by the 2080s. The mean overall rate of
change for IFD was 5.9 days �decade-1, resulting in 37 more days without ice cover by the
2080s compared to current conditions (2004–2014), a 29% increase (Table 1; Fig 2). Finally,
the thermal suitability of SRM lakes for native fishes also changed. The current M30AT for
these lakes is 12.1˚C on average (7.8–15.8; S1 Table), whereas the mean M30AT predicted for
the 2080s is 15.0˚C, an increase of 2.9˚C or 24% from current conditions (Table 1).
Table 1. Trends in thermal conditions for southern Rocky Mountain lakes. Predicted change in lake surface temperature metrics for 27 southern Rocky
Mountain lakes. Metrics were calculated using the lake-specific non-linear models of daily mean lake surface temperature, mean weekly air temperatures
form SNOTEL sites, and future mean weekly air temperature predicted from climate models [41]. Rates of change �decade-1 were calculated by linear regres-
sion using annual measures of each metric as a function of year. Upper and lower bounds of these predictions from our uncertainty analysis are shown in
parentheses.
Lake Increase per decade M30AT 2080s
(˚C; i.e., Warmest 30days)Mean summer
(˚C; MST)
Mean annual
(˚C; MAT)
Ice free days
(IFD)
Adams Lake 0.52 (0.32, 0.72) 0.27 (0.14, 0.40) 6.4 (3.9, 8.5) 16.1 (14.6, 16.9)
Arrowhead Lake 0.36 (0.15, 0.43) 0.17 (0.09, 0.25) 6.7 (3.9, 8.3) 10.7 (09.3, 11.3)
Bear Lake 0.29 (0.17, 0.38) 0.17 (0.08, 0.25) 5.2 (3.3, 7.1) 11.7 (10.8, 12.1)
Big Cow Lake 0.54 (0.34, 0.72) 0.23 (0.12, 0.31) 6.2 (4.0, 7.5) 13.7 (12.1, 14.5)
Bluebird Lake 0.60 (0.48, 0.71) 0.27 (0.18, 0.36) 6.1 (4.1, 7.1) 13.7 (13.0, 14.1)
Boundary Lake 0.47 (0.31, 0.64) 0.24 (0.13, 0.35) 6.4 (3.9, 8.4) 14.2 (12.9, 14.8)
Caddis Lake 0.42 (0.25, 0.58) 0.21 (0.11, 0.30) 6.5 (4.2, 8.2) 12.7 (11.2, 13.5)
Crystal Lake 0.44 (0.27, 0.60) 0.22 (0.12, 0.32) 6.4 (4.1, 8.2) 13.4 (12.1, 14.1)
Dream Lake 0.43 (0.27, 0.56) 0.25 (0.13, 0.35) 5.3 (3.2, 7.3) 15.8 (14.8, 16.3)
Fern Lake 0.59 (0.37, 0.80) 0.34 (0.21, 0.47) 6.8 (4.1, 9.2) 16.2 (14.7, 17.4)
Gem Lake 0.50 (0.34, 0.67) 0.23 (0.14, 0.33) 6.0 (4.3, 7.2) 14.3 (13.0, 14.9)
Jewel Lake 0.64 (0.39, 0.83) 0.26 (0.15, 0.36) 6.3 (4.1, 7.4) 15.4 (13.5, 16.4)
Lake Husted 0.55 (0.34, 0.75) 0.27 (0.14, 0.39) 5.9 (3.4, 7.9) 16.6 (15.0, 17.4)
Lake Louise 0.46 (0.29, 0.63) 0.22 (0.11, 0.33) 5.9 (3.4, 7.7) 13.8 (12.5, 14.5)
Lake Nanita 0.41 (0.26, 0.56) 0.24 (0.12, 0.36) 4.8 (2.8, 7.1) 16.3 (15.1, 17.0)
Little Cow Lake 0.55 (0.35, 0.74) 0.23 (0.13, 0.33) 5.9 (4.0, 7.3) 14.3 (12.7, 15.1)
Lost Lake 0.48 (0.31, 0.66) 0.26 (0.13, 0.39) 5.4 (3.1, 7.7) 16.7 (15.5, 17.4)
Lower Hutcheson Lake 0.45 (0.28, 0.62) 0.23 (0.12, 0.34) 6.5 (3.9, 8.3) 13.7 (12.4, 14.3)
Odessa Lake 0.33 (0.21, 0.44) 0.19 (0.10, 0.27) 5.5 (3.6, 7.4) 12.4 (11.5, 12.9)
Pear Lake 0.56 (0.37, 0.74) 0.29 (0.16, 0.43) 6.0 (3.5, 8.4) 17.3 (16.0, 18.0)
Pettingell Lake 0.32 (0.23, 0.42) 0.25 (0.13, 0.37) 4.4 (1.5, 7.1) 17.3 (16.7, 17.6)
Sandbeach Lake 0.57 (0.37, 0.77) 0.33 (0.18, 0.48) 5.7 (3.2, 8.2) 19.5 (18.1, 20.2)
Spruce Lake 0.49 (0.31, 0.68) 0.28 (0.14, 0.42) 4.5 (2.0, 6.9) 19.4 (17.8, 20.3)
Timber Lake 0.55 (0.36, 0.78) 0.26 (0.14, 0.39) 5.9 (3.6, 7.7) 17.1 (15.4, 18.0)
Trappers lake 0.43 (0.28, 0.55) 0.28 (0.16, 0.39) 5.8 (2.3, 8.3) 17.6 (15.5, 18.8)
Upper Hutcheson Lake 0.41 (0.25, 0.57) 0.21 (0.11, 0.31) 6.4 (3.8, 8.3) 12.2 (10.1, 14.4)
Ypsilon Lake 0.42 (0.26, 0.57) 0.23 (0.12, 0.34) 5.9 (3.7, 7.9) 14.0 (12.2, 15.8)
Mean (SE) 0.47 (0.02) 0.25 (0.01) 5.9 (0.1) 15.0 (0.4)
https://doi.org/10.1371/journal.pone.0179498.t001
Increasing temperatures in Rocky Mountain lakes
PLOS ONE | https://doi.org/10.1371/journal.pone.0179498 July 6, 2017 6 / 17
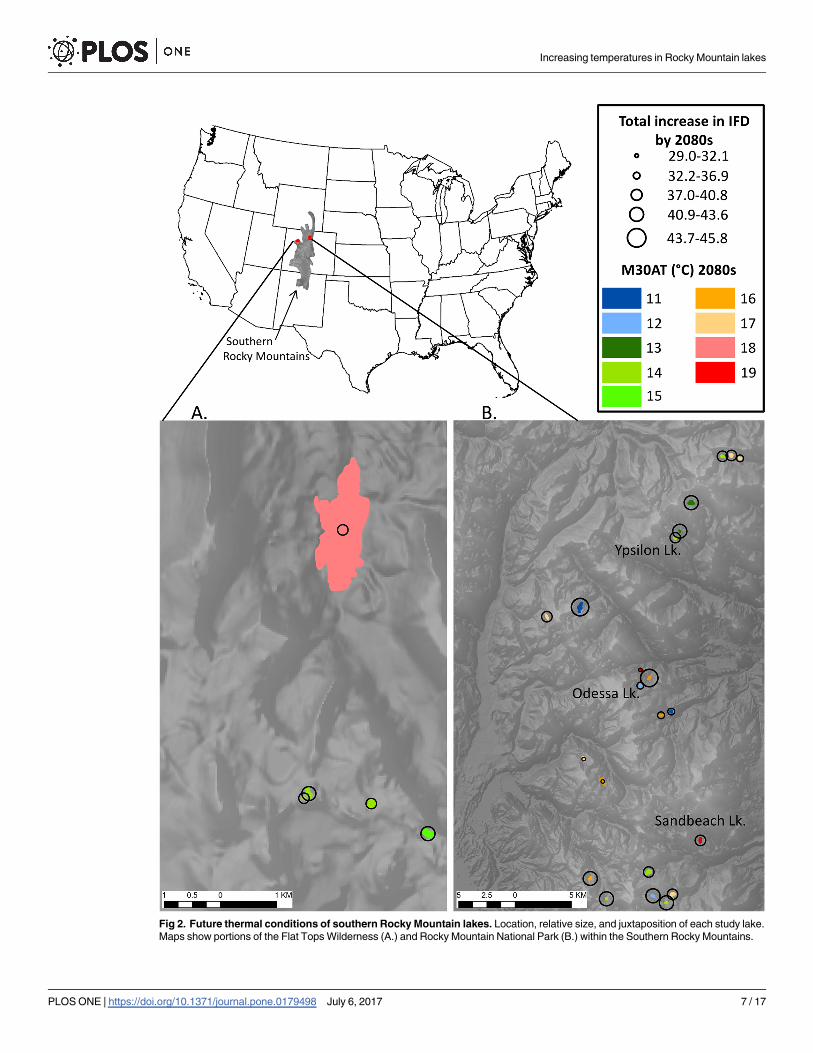
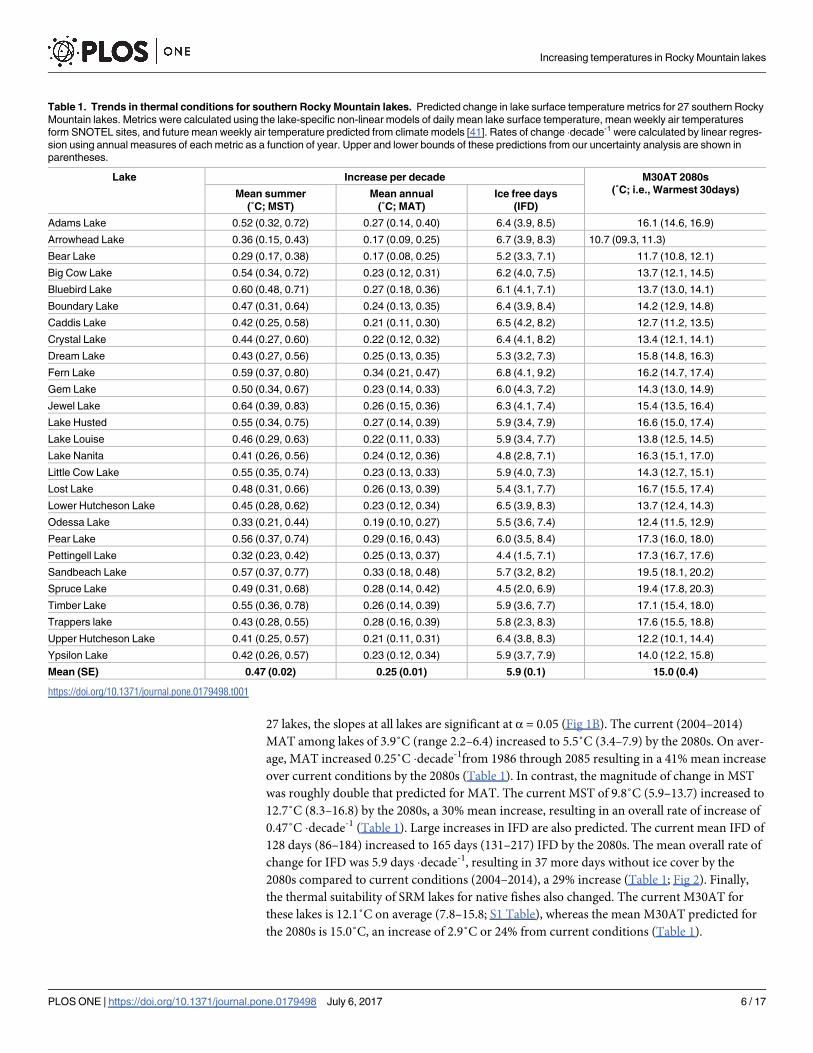
Fig 2. Future thermal conditions of southern Rocky Mountain lakes. Location, relative size, and juxtaposition of each study lake.
Maps show portions of the Flat Tops Wilderness (A.) and Rocky Mountain National Park (B.) within the Southern Rocky Mountains.
Increasing temperatures in Rocky Mountain lakes
PLOS ONE | https://doi.org/10.1371/journal.pone.0179498 July 6, 2017 7 / 17
The uncertainty analysis showed that both the upper and lower bounds for all the thermal
metrics are predicted to increase for all the lakes through the 2080s (Table 1; Fig 3). However,
with time, the spread of the upper and lower bounds also increased about the mean trends for
these three thermal metrics. The variation in the trend was greatest for MAT, for which the
upper and lower bounds averaged ±45% lower and higher (0.13–0.36, respectively), than the
mean rate for all the lakes of 0.25˚C �decade-1. Variation was less for IFD, for which the average
bounds were ±36% lower and higher (3.51–7.79) than the mean rate of 5.9 days �decade-1, and
even less for MST, for which the average bounds were ±35% lower and higher (0.30–0.63) than
the mean rate of 0.47˚C �decade-1. Across the gradient of thermal conditions, the thermal met-
rics of a representative warm lake (Sandbeach Lake) increased at greater rates and were more
variable than a cool (Ypsilon Lake) or cold (Odessa Lake) lake.
Fish thermal habitat quality. Current mean M30AT for these 27 lakes is 12.1˚C, on aver-
age, which is considered optimal [31] for recruitment and growth of native Cutthroat Trout
(S1 Table). However, Arrowhead Lake is currently too cold for young fish survival and Caddis
Lake is currently cold enough to decrease the survival of young fish (S1 Table). By the 2080s
the models predict that none of these 27 lakes will be too cold for growth and survival of young
fish, although two will be too warm. The models predict a mean M30AT of 15.0˚C for the 27
lakes in the 2080s, which is considered optimal for growth and survival. Nevertheless, two indi-
vidual lakes, Spruce Lake and Sandbeach Lake will be warm enough to reduce the growth rate
of adult cutthroat trout by the 2080s (Table 1).
Discussion
The surface temperature and IFD of high-elevation lakes in the SRM have already increased
with warming climatic conditions, and are projected to increase more in the coming decades.
The magnitude of these changes are greater than reported trends for lakes worldwide. For
example, the predicted MST increase of 0.47˚C �decade-1 is more than a 0.10˚C greater than
the predicted increase of 0.34˚C �decade-1 for nighttime summer surface temperature mea-
sured for lakes worldwide [5]. However, our results indicate that temperature increases are
unlikely to be great enough by the 2080s to make most of these lakes thermally unsuitable for
native top predators (i.e., Cutthroat Trout) in these systems. Nevertheless, the magnitude of
these changes is substantial. For example, the 30% and 41% predicted increases in MST and
MAT, respectively, are likely to have unexpected consequences for abiotic characteristics, bio-
geochemical processes, and trophic dynamics of these important SRM headwater habitats, and
hold the potential to cause ecological surprises [47,48] in the food webs of these mountain
lakes.
The most striking thermal change for these high-elevation lakes is the 29% increase (i.e., a
mean increase of 37 days) in IFD by the 2080s. Increasing length of the ice-free season has
been observed and predicted for lakes worldwide, based on long records of lake and river sur-
face freeze and thaw dates [49,50]. For example, a comprehensive assessment of ice cover for
freshwater systems in the northern hemisphere observed (1822–1995) a 1.7 day decade -1
increase in ice free days in 11 lakes (a subset of the water bodies included in the study; [49]).
Our forecasted average increase in ice free days (5.9 days �decade-1) is much greater than that
observed in the recent past; nevertheless, the higher rates we predicted are supported by other
models of future increases, such as an increase of 10–26 ice-free days in Canadian lakes by
Model predictions of M30AT in the 2080s are shown in color for each of the 27 lakes, and the predicted increase in the number of ice-
free days (IFD) over seven decades (circles). The three lakes that are labeled were used to present our uncertainty analysis (see
Fig 3).
https://doi.org/10.1371/journal.pone.0179498.g002
Increasing temperatures in Rocky Mountain lakes
PLOS ONE | https://doi.org/10.1371/journal.pone.0179498 July 6, 2017 8 / 17
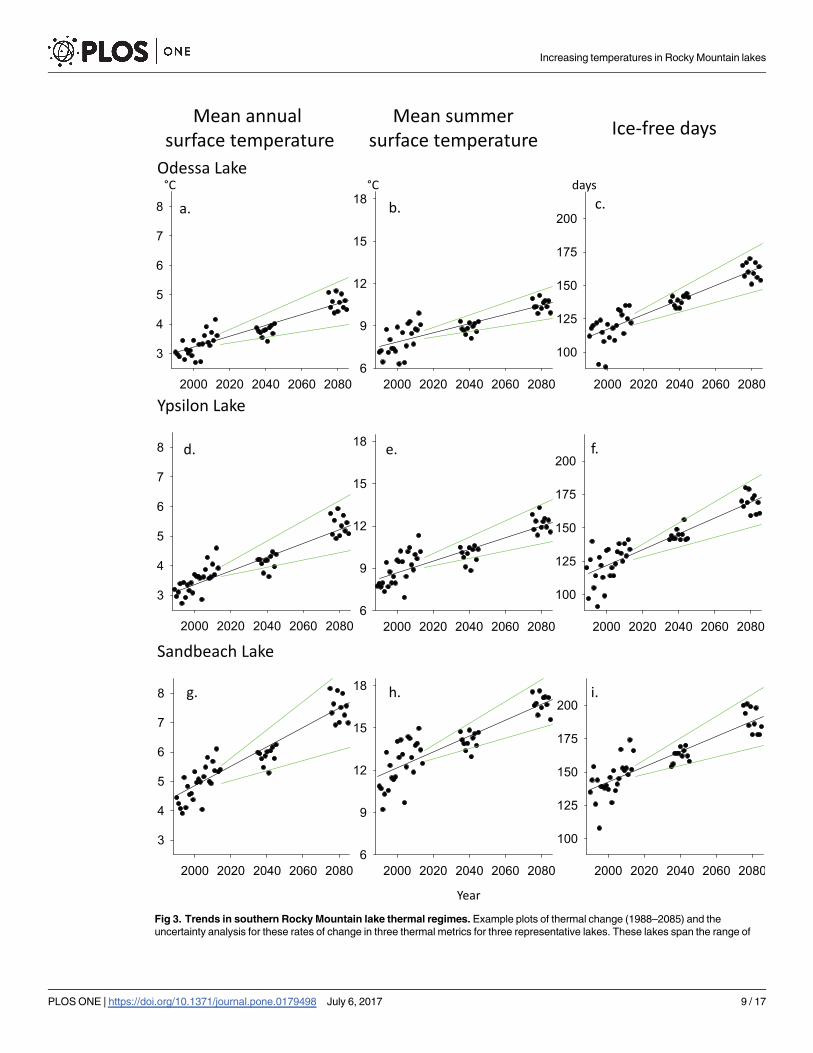
Fig 3. Trends in southern Rocky Mountain lake thermal regimes. Example plots of thermal change (1988–2085) and the
uncertainty analysis for these rates of change in three thermal metrics for three representative lakes. These lakes span the range of
Increasing temperatures in Rocky Mountain lakes
PLOS ONE | https://doi.org/10.1371/journal.pone.0179498 July 6, 2017 9 / 17
2055 [51]. Another study using models of generic lakes across the contiguous United States
predicted that a scenario where atmospheric CO2 concentrations doubled (no time period
specified) from past levels (i.e., 1961–1979) could result in 90 more ice free days in lakes,
depending on location [34]. An empirical study of one watershed in the SRM also supports
our results, reporting that ice is thawing 2.1 days �decade-1 earlier (average decadal rate, 1981–
2014; [36]), which is similar to half (2.95 days �decade-1) the change we predict for IFD. These
changes in length of IFD are also likely to influence important ecological processes occurring
during ice-cover, processes that are understudied and are important drivers of the ecosystem
functions in temperate lakes [52]. Our study is the first to model the change in IFD for rela-
tively cold, high-elevation lakes, and shows that these lakes will also lose ice at a drastic rate,
similar to those predicted for lakes at lower elevations.
Our models predict that these lakes will warm at a faster rate than streams and rivers within
the Rocky Mountain region. The MST in streams in the upper Columbia River drainage
(Northern Rocky Mountains) is predicted to increase 2.1˚C by the 2080s [53], substantially
lower than our model predicted MST increase of 2.9˚C. Likewise, we predict that lake M30AT
will increase 2.9˚C by the 2080s, nearly three-fold higher than the increase of 1.1˚C predicted
for high-elevation streams in the upper Colorado River basin [31]. The greater increase in lake
temperatures when compared to streams and rivers in the SRM underscores the need to deter-
mine which thermal properties are driving ecosystem processes in these high-elevation lakes,
to allow a better understanding of the ecological consequences of these thermal changes.
Although temperature itself is a dominant driver of biological processes [13], the timing
and seasonal fluctuations of water temperature are likely as important, or more important.
Although the predicted average summer temperatures (M30AT) are unlikely to have acute
effects, such as extirpation, for many taxa in SRM lakes, the potential chronic effects of changes
in thermal regime may greatly influence the physical habitats of these biota and ecosystem pro-
cesses that support them. For example, the warming surface water temperatures are unlikely to
influence hypolimnetic temperatures [54], but related abiotic conditions such as hypolimnetic
volume will likely decrease as thermocline depth increases [2,55]. Primary producers, which
form the trophic base of food webs in these lakes, are likely to be strongly influenced by warm-
ing temperatures. Potential consequences include increases in frequency and severity of harm-
ful algal blooms [17,56], and earlier spring phytoplankton blooms [57]. In the SRM, shifts to
earlier ice-off dates are increasing chorophyll a values (an indicator of phytoplankton produc-
tion), suggesting that this thermal metric is an important driver of SRM lake primary produc-
tion [36]. Climate change induced alterations of phytoplankton dynamics [58] can also lead to
decreases in hypolimnetic dissolved oxygen concentration [18,59] and, consequently, reduced
densities of benthic invertebrates [60]. Pelagic invertebrates are also influenced by warming
thermal conditions of lakes through changes in zooplankton phenology [16] and increases in
zooplankton productivity [61,62]. Climate driven thermal changes in SRM lakes may interact
synergistically with elevated rates of atmospheric nitrogen deposition in high-elevation land-
scapes [63,64], with the potential to alter nutrient dynamics [65,66] in these normally oligotro-
phic systems, pushing them toward mesotrophic or eutrophic states [67].
High-elevation lakes, like those in the SRM, provide critical fish habitat, and changes to
thermal characteristics are likely to alter fish life histories. Although it is unknown how many
relative thermal regimes observed which include cold (Odessa Lake; a-c), cool (Ypsilon Lake; d-f), and warm (Sandbeach Lake; g-i).
Thermal metrics presented are the mean annual lake surface temperature (a,d,g), the mean summer lake surface temperature (b,e,h),
and number of ice-free days (c,f,i). Green trend lines represent the upper and lower bounds of future thermal trends. These bounds are
calculated using the highest and lowest projected mean weekly air temperatures from both climate models combined.
https://doi.org/10.1371/journal.pone.0179498.g003
Increasing temperatures in Rocky Mountain lakes
PLOS ONE | https://doi.org/10.1371/journal.pone.0179498 July 6, 2017 10 / 17
of these lakes were naturally fishless, owing to extensive stocking of native and non-native
fishes initiated around the turn of the 20th century [68,69], it is likely that some of the lakes in
our analysis were fishless. Of the 27 lakes in our analysis, 23 currently have fish populations.
One critical life history event for fish in high-elevation lakes is the movement between lakes
and connecting streams for spawning. The phenology of spawning migrations can be shifted
earlier for spring spawning fish [70] and later for fall spawning fish [71] when adult fish are
exposed to increasing temperature in lake-stream networks. Earlier spawning events can result
in a longer growing season for young-of-the-year fish. However, the growth and survival of
young fish is a function of both temperature and prey availability [20,72]. Shifts in the timing
of spawning events could result in a trophic mismatch of prey availability and demand during
early life history events for fish [73,74], but such a phenomenon requires heterogeneity in sea-
sonal warming rates [75]. The differences in warming rates between high-elevation SRM
streams [31] and those reported for SRM lakes in this study indicate heterogeneity in warming
rates and therefore, the potential for climate driven trophic mismatches during early fish life
history. Paradoxically, the growth potential of adult fish in SRM high-elevation lakes may actu-
ally increase because these systems are currently quite cold, but this will vary by species and
also be dictated by how prey (i.e., lower trophic levels) respond to these changing thermal
conditions.
Although our results indicate a warming trend in overall thermal regimes of high-elevation
SRM lakes, our study has potential limitations. First, the rates of change we present are based
on climate projections using a medium to high emission scenario, which may be higher than
those predicted under lower emissions. Using multiple emission scenarios would not influence
the direction of these changes, but could alter the magnitudes of rates of change that our mod-
els predicted. Second, our focus on lake surface temperature does not address potential
changes to other limnological features such as water column stratification and thermocline
depth. Third, collection of more detailed data on drivers of ice cover phenology (e.g., timing
and amount of snowfall or rain; [36]) could help refine predictions of ice dynamics in moun-
tain lakes. Likewise, gathering basic physiographic data for lakes such as detailed bathymetry
and continuous vertical thermal profiles would allow future studies of mountain lake tempera-
ture regimes to include more detailed processes such as water residence time, timing of runoff,
and mixing dynamics (sensu [2,51]). These more detailed processes are particularly important
to ice-off timing in SRM lakes which is likely driven by air temperature along with the timing
and amount of snowfall or rain [36]. Finally, there are potential biases in the SNOTEL air tem-
perature data caused by changes in sensor type and placement at SNOTEL sites, which mainly
influenced daily maximum and minimum air temperature values [76]. This bias was strongest
for minimum temperatures (warmer), whereas the bias in maximum temperature was weaker
and varied by season (cooler in summer and warmer in winter). For our analysis we used
SNOTEL daily mean air temperature, which was not addressed in the previously mentioned
bias analysis [76]. We suggest that this bias is likely small, possibly influencing the magnitude
but not the direction of these trends.
Although our results predict striking changes in the thermal regime of SRM high-elevation
lakes, data were available for a relatively small sample of lakes arrayed in two fairly restricted
regions of the SRM in Colorado. Thus, it is unlikely that we have characterized the full range
of lake thermal response across the SRM landscape. Given the affordability and availability of
commercial temperature loggers, the scope of future studies could be easily expanded to
include collection of continuous lake temperatures. Additionally, new lake temperature data
could easily be added to our predictive model approach (sensu [38]) to further explore the
influence of climate change on high-elevation lakes. Ideally, a more comprehensive database of
continuous temperatures could be used to create models for mountain lakes similar to the
Increasing temperatures in Rocky Mountain lakes
PLOS ONE | https://doi.org/10.1371/journal.pone.0179498 July 6, 2017 11 / 17
useful resources already available for mountain stream networks (e.g., NorWeST; http://www.
fs.fed.us/rm/boise/AWAE/projects/NorWeST.html). Mountain lakes are important headwater
sources of relatively pristine habitat for ecological communities and water for human uses, so
understanding how changing climatic conditions are influencing these lakes is paramount to
creating climate-smart management strategies for water resources and the biota that inhabit
them.
Supporting information
S1 Table. Physio-chemical characteristics of the southern Rocky Mountain lakes in this
analysis. Hydrogeomorphic characteristics of the 27 lakes with continuous records of lake sur-
face temperature. Mean weekly air temperatures from SNOTEL sites were also used with our
models of lake surface temperature to calculate the current (2004–2014) thermal conditions
(M30AT).
(DOCX)
S2 Table. Lake surface temperature model parameters and fit. Summary of lake temperature
data (period of record) used to parameterize models of surface temperature and the parameter
values for lake surface temperature models� (sensu [38]). The Nash-Sutcliff Coefficient (NSC;
1 = perfect fit) is a measure of model fit for non-linear logistic regression models [38].
(DOCX)
S1 File. Daily mean lake surface water temperatures. Water temperatures (˚C) collected
from each of the 27 SRM lakes, summarized as daily mean lake surface water temperature.
These water temperature data were used with air temperature from the closest SNOTEL sta-
tion to fit models of daily lake surface temperature [sensu 38].
(CSV)
S2 File. Mean weekly air temperature values from the closest SNOTEL station for each
study lake. The mean weekly air temperature (˚C) values from the closest SNOTEL station to
each of 27 SRM lakes. This included both observed data (1998–2013) and monthly corrected
projections from downscaled regional climate models (2035–2045, 2075–2085; [41]). These
observed data were used to fit models of daily mean lake surface temperature. Both the observed
and projected air temperature data were also used to reconstruct and forecast daily mean lake
surface temperature.
(CSV)
S3 File. Annual values for the four lake thermal metrics from each study lake. The annual
values of the four lake surface temperature metrics (˚C) used to summarize the response of
each of the 27 SRM lakes to changes climatic conditions. These four metrics include meant
annual lake surface temperature (MAT), mean summer lake surface temperature (MST), num-
ber of ice-free days (IFD), and maximum 30-day mean summer lake surface temperature
(M30AT).
(CSV)
Acknowledgments
We thank C. Kennedy and K. Rogers for providing lake temperature data, and D. Shaw, E.
Martin, and A. Herdrich for database development. We would also like to thank J. Read
(USGS internal reviewer), Joao Miguel Dias (handling editor), and two anonymous reviewers
for providing comments of earlier versions of this manuscript. This research was subjected to
Increasing temperatures in Rocky Mountain lakes
PLOS ONE | https://doi.org/10.1371/journal.pone.0179498 July 6, 2017 12 / 17
USGS review and is approved for publication. Any use of trade, firm, or product names is for
descriptive purposes only and does not imply endorsement by the U.S. Government.
Author Contributions
Conceptualization: JJR KDF TSS DWM.
Data curation: JJR.
Formal analysis: JJR.
Funding acquisition: JJR.
Methodology: JJR.
Project administration: JJR.
Visualization: JJR.
Writing – original draft: JJR.
Writing – review & editing: JJR KDF TSS DWM.
References1. Schneider P, Hook SJ. Space observations of inland water bodies show rapid surface warming since
1985. Geophysical Research Letters. 2010; 37: L22405. https://doi.org/10.1029/2010gl045059
2. Read JS, Wilson LA, Hansen GJA, Hoek JVD, Hanson PC, Bruce LC, et al. Simulating 2368 temperate
lakes reveals weak coherence in stratification phenology. Ecological Modelling. 2014; 291: 142–150.
https://doi.org/10.1016/j.ecolmodel.2014.07.029
3. Leppi J, DeLuca T, Harrar S, Running S. Impacts of climate change on August stream discharge in the
Central-Rocky Mountains. Climatic Change. 2012; 112: 997–1014. https://doi.org/10.1007/s10584-
011-0235-1
4. Isaak DJ, Wollrab S, Horan D, Chandler G. Climate change effects on stream and river temperatures
across the northwest U.S. from 1980–2009 and implications for salmonid fishes. Climatic Change.
2012; 113: 499–524. https://doi.org/10.1007/s10584-011-0326-z
5. O’Reilly CM, Sharma S, Gray DK, Hampton SE, Read JS, Rowley RJ, et al. Rapid and highly variable
warming of lake surface waters around the globe. Geophysical Research Letters. 2015; 42. https://doi.
org/10.1002/2015gl066235
6. Heino J, Virkkala R, Toivonen H. Climate change and freshwater biodiversity detected patterns, future
trends and adaptations in northern regions. Biological Reviews. 2009; 84: 39–54. https://doi.org/10.
1111/j.1469-185X.2008.00060.x PMID: 19032595
7. Schmid M, Hunziker S, Wuest A. Lake surface temperatures in a changing climate: a global sensitivity
analysis. Climatic Change. 2014; 124: 301–315. https://doi.org/10.1007/s10584-014-1087-2
8. Adrian R, O’Reilly CM, Zagarese H, Baines SB, Hessen DO, Keller W, et al. Lakes as sentinels of cli-
mate change. Limnology and Oceanography. 2009; 54: 2283–2297. https://doi.org/10.4319/lo.2009.
54.6_part_2.2283 PMID: 20396409
9. Williamson CE, Saros JE, Schindler DW. Sentinels of change. Science. 2009; 323: 887–888. https://
doi.org/10.1126/science.1169443 PMID: 19213905
10. Williamson CE, Saros JE, Vincent WF, Smol JP. Lakes and reservoirs as sentinels, integrators, and
regulators of climate change. Limnology and Oceanography. 2009; 54: 2273–2282. https://doi.org/10.
4319/lo.2009.54.6_part_2.2273
11. Schneider P, Hook SJ, Radocinski RG, Corlett GK, Hulley GC, Schladow SG, et al. Satellite observa-
tions indicate rapid warming trend for lake in California and Nevada. Geophysical Research Letters.
2009; 36: 1–6. https://doi.org/10.1029/2009GL040846
12. Austin JA, Colman SM. Lake Superior summer water temperatures are increasing more rapidly than
regional air temperatures: A positive ice-albedo feedback. Geophysical Research Letters. 2007; 34: n/
a-n/a. https://doi.org/10.1029/2006GL029021
13. Magnuson JJ, Crowder LB, Medvick PA. Temperature as an ecological resource. American Zoologist.
1979; 19: 331–343. https://doi.org/10.1093/icb/19.1.331
Increasing temperatures in Rocky Mountain lakes
PLOS ONE | https://doi.org/10.1371/journal.pone.0179498 July 6, 2017 13 / 17
14. Paerl HW, Millie DF. Physiological ecology of toxic aquatic cyanobacteria. Phycologia. 1996; 35: 160–
167. https://doi.org/10.2216/i0031-8884-35-6S-160.1
15. Lapierre J-F, Seekell DA, del Giorgio PA. Climate and landscape influence on indicators of lake carbon
cycling through spatial patterns in dissolved organic carbon. Global Change Biology. 2015; 21: 4425–
4435. https://doi.org/10.1111/gcb.13031 PMID: 26150108
16. Williamson CE, Salm C, Cooke SL, Saros JE. How do UV radiation, temperature, and zooplankton influ-
ence the dynamics of alpine phytoplankton communities? Hydrobiologia. 2010; 648: 73–81. https://doi.
org/10.1007/s10750-010-0147-5
17. Michalak AM, Anderson EJ, Beletsky D, Boland S, Bosch NS, Bridgeman TB, et al. Record-setting algal
bloom in Lake Erie caused by agricultural and meteorological trends consistent with expected future
conditions. Proceedings of the National Academy of Sciences of the United States of America. 2013;
110: 6448–6452. https://doi.org/10.1073/pnas.1216006110 PMID: 23576718
18. Jankowski T, Livingstone DM, Buhrer H, Forster R, Niederhauser P. Consequences of the 2003 Euro-
pean heat wave for lake temperature profiles, thermal stability, and hypolimnetic oxygen depletion:
Implications for a warmer world. Limnology and Oceanography. 2006; 51: 815–819. https://doi.org/10.
4319/lo.2006.51.2.0815
19. Sharma S, Vander Zanden MJ, Magnuson JJ, Lyons J. Comparing climate change and species inva-
sions as drivers of coldwater fish population extirpations. Plos One. 2011; 6. https://doi.org/10.1371/
journal.pone.0022906 PMID: 21860661
20. Kao Y- C, Madenjian CP, Bunnell DB, Lofgren BM, Perroud M. Potential effects of climate change on
the growth of fishes from different thermal guilds in Lakes Michigan and Huron. Journal of Great Lakes
Research. 2015; 41: 423–435. https://doi.org/10.1016/j.jglr.2015.03.012
21. Sadro S, Nelson CE, Melack JM. The influence of landscape position and catchment characteristics on
aquatic biogeochemistry in high-elevation lake-chains. Ecosystems. 2012; 15: 363–386. https://doi.
org/10.1007/s10021-011-9515-x
22. Campbell DH, Baron JS, Tonnessen KA, Brooks PD, Schuster PF. Controls on nitrogen flux in alpine/
subalpine watersheds of Colorado. Water Resources Research. 2000; 36: 37–47. https://doi.org/10.
1029/1999wr900283
23. Hartman MD, Baron JS, Ewing HA, Weathers KC. Combined global change effects on ecosystem pro-
cesses in nine US topographically complex areas. Biogeochemistry. 2014; 119: 85–108. https://doi.
org/10.1007/s10533-014-9950-9
24. Clow DW. Changes in the timing of snowmelt and streamflow in Colorado: a response to recent warm-
ing. Journal of Climate. 2010; 23: 2293–2306. https://doi.org/10.1175/2009JCLI2951.1
25. Nijssen B, O’Donnell GM, Hamlet AF, Lettenmaier DP. Hydrologic sensitivity of global rivers to climate
change. Climatic Change. 2001; 50: 143–175. https://doi.org/10.1023/a:1010616428763
26. Barnett TP, Adam JC, Lettenmaier DP. Potential impacts of a warming climate on water availability in
snow-dominated regions. Nature. 2005; 438: 303–309. https://doi.org/10.1038/nature04141 PMID:
16292301
27. Serreze MC, Clark MP, Armstrong RL, McGinnis DA, Pulwarty RS. Characteristics of the western
United States snowpack from snowpack telemetry (SNOTEL) data. Water Resources Research. 1999;
35: 2145–2160. https://doi.org/10.1029/1999WR900090
28. Baron JS, Schmidt TM, Hartman MD. Climate-induced changes in high elevation stream nitrate dynam-
ics. Global Change Biology. 2009; 15: 1777–1789.
29. McGuire CR, Nufio CR, Bowers MD, Guralnick RP. Elevation-dependent temperature trends in the
Rocky Mountain Front Range: changes over a 56- and 20-year record. PLoS One. 2012; 7: e44370.
https://doi.org/10.1371/journal.pone.0044370 PMID: 22970205
30. Muths E, Bailey LL, Watry MK. Animal reintroductions: An innovative assessment of survival. Biological
Conservation. 2014; 172: 200–208. https://doi.org/10.1016/j.biocon.2014.02.034
31. Roberts JJ, Fausch KD, Peterson DP, Hooten MB. Fragmentation and thermal risks from climate
change interact to affect persistence of native trout in the Colorado River basin. Global Change Biology.
2013; 19: 1383–1398. https://doi.org/10.1111/gcb.12136 PMID: 23505098
32. Isaak DJ, Young MK, Luce CH, Hostetler SW, Wenger SJ, Peterson EE, et al. Slow climate velocities of
mountain streams portend their role as refugia for cold-water biodiversity. Proceedings of the National
Academy of Sciences of the United States of America. 2016; 113: 4374–4379. https://doi.org/10.1073/
pnas.1522429113 PMID: 27044091
33. Hostetler SW, Small EE. Response of North American freshwater lakes to simulated future climates.
Journal of the American Water Resources Association. 1999; 35: 1625–1637. https://doi.org/10.1111/j.
1752-1688.1999.tb04241.x
Increasing temperatures in Rocky Mountain lakes
PLOS ONE | https://doi.org/10.1371/journal.pone.0179498 July 6, 2017 14 / 17
34. Fang X, Stefan HG. Simulations of climate effects on water temperature, dissolved oxygen, and ice and
snow covers in lakes of the contiguous United States under past and future climate scenarios. Limnol-
ogy and Oceanography. 2009; 54: 2359–2370. https://doi.org/10.4319/lo.2009.54.6_part_2.2359
35. Fang X, Stefan HG, Eaton JG, McCormick JH, Alam SR. Simulation of thermal/dissolved oxygen habitat
for fishes in lakes under different climate scenarios—Part 2. Cold-water fish in the contiguous US. Eco-
logical Modelling. 2004; 172: 39–54. https://doi.org/10.1016/s0304-3800(03)00285-0
36. Preston DL, Caine N, McKnight DM, Williams MW, Hell K, Miller MP, et al. Climate regulates alpine lake
ice cover phenology and aquatic ecosystem structure. Geophysical Research Letters. 2016; 43: 5353–
5360. https://doi.org/10.1002/2016gl069036
37. Dunham JB, Chandler GL, Rieman BE, Martin D. Measuring stream temperature with digital loggers- A
user’s guide. General Technical Report RMRS-GTR-150WWW. Fort Collins, CO: U.S. Department of
Agriculture, Forest Service, Rocky Mountain Research Station. 2005. pp. 15.
38. Mohseni O, Erickson TR, Stefan HG. Sensitivity of stream termperatures in the United States to air tem-
peratures projected under a global warming scenario. Water Resources Research. 1999; 35: 3723–
3733. https://doi.org/10.1029/1999WR900193
39. Mohseni O, Stefan HG, Erickson TR. A nonlinear regression model for weekly stream temperatures.
Water Resources Research. 1998; 34: 2685–2692. https://doi.org/10.1029/98WR01877
40. Nash JE, Sutcliffe JV. River flow forecasting through conceptual models part I—A discussion of princi-
ples. Journal of Hydrology. 1970; 10: 282–290. https://doi.org/10.1016/0022-1694(70)90255-6
41. Hostetler SW, Alder JR, Allan AM. Dynamically downscaled climate simulations over North America:
methods, evaluation and supporting documentation for users. U.S. Geological Survey Open-File Report
2011–1238. 2011. pp. 64.
42. Alder JR, Hostetler SW, Pollard D, Schmittner A. Evaluation of a present-day climate simulation with a
new coupled atmosphere-ocean model GENMOM. Geoscientific Model Development. 2011; 4: 69–83.
https://doi.org/10.5194/gmd-4-69-2011
43. Roeckner E, Bauml G, Bonaventura L, Brokopf R, Esch M, Giorgetta M, et al. The atmospheric general
circulation model ECHAM5. Part I: Model description. Hamburg, Germany. 2003: Max Planck Institute
for Meterology. 127 p.
44. IPCC. Climate change 2007: the physical science basis. 2007: Intergovernmental Panel on Climate
Change (http://www.ipcc.ch).
45. IPCC, editor Climate change 2013: the physical science basis. contribution of working group I to the fifth
assessment report of the intergovernmental panel on climate change. Cambridge, United Kingdom and
New York, NY. 2013: Cambridge University Press. 1535 p.
46. Wetzel RG. Limnology: Lake and river ecosystems; Wetzel RG, editor. San Diego. 2001: Academic
Press. 1006 p.
47. Lindenmayer DB, Likens GE, Krebs CJ, Hobbs RJ. Improved probability of detection of ecological "sur-
prises". Proceedings of the National Academy of Sciences of the United States of America. 2010; 107:
21957–21962. https://doi.org/10.1073/pnas.1015696107 PMID: 21098660
48. Doak DF, Estes JA, Halpern BS, Jacob U, Lindberg DR, Lovvorn J, et al. Understanding and predicting
ecological dynamics: Are major surprises inevitable? Ecology. 2008; 89: 952–961. https://doi.org/10.
1890/07-0965.1 PMID: 18481520
49. Magnuson JJ, Robertson DM, Benson BJ, Wynne RH, Livingstone DM, Arai T, et al. Historical trends in
lake and river ice cover in the northern hemisphere. Science. 2000; 289: 1743–1746. https://doi.org/10.
1126/science.289.5485.1743 PMID: 10976066
50. Sharma S, Magnuson JJ, Batt RD, Winslow LA, Korhonen J, Aono Y. Direct observations of ice season-
ality reveal changes in climate over the past 320–570 years. Scientific Reports. 2016; 6: 25061. https://
doi.org/10.1038/srep25061 PMID: 27113125
51. Shuter BJ, Minns CK, Fung SR. Empirical models for forecasting changes in the phenology of ice cover
for Canadian lakes. Canadian Journal of Fisheries and Aquatic Sciences. 2013; 70: 982–991. https://
doi.org/10.1139/cjfas-2012-0437
52. Hampton SE, Galloway AW, Powers SM, Ozersky T, Woo KH, Batt RD, et al. Ecology under lake ice.
Ecology Letters. 2017; 20: 98–111. https://doi.org/10.1111/ele.12699 PMID: 27889953
53. Isaak DJ, Young MK, Nagel DE, Horan DL, Groce MC. The cold-water climate shield: delineating refu-
gia for preserving salmonid fishes through the 21st century. Global Change Biology. 2015; 21: 2540–
2553. https://doi.org/10.1111/gcb.12879 PMID: 25728937
54. Winslow LA, Read JS, Hansen GJA, Hanson PC. Small lakes show muted climate change signal in
deepwater temperatures. Geophysical Research Letters. 2015; 42: 355–361. https://doi.org/10.1002/
2014gl062325
Increasing temperatures in Rocky Mountain lakes
PLOS ONE | https://doi.org/10.1371/journal.pone.0179498 July 6, 2017 15 / 17
55. Fang X, Alam SR, Stefan HG, Jiang L, Jacobson PC, Pereira DL. Simulations of water quality and oxy-
thermal cisco habitat in Minnesota lakes under past and future climate scenarios. Water Quality
Research Journal of Canada. 2012; 47: 375–388. https://doi.org/10.2166/wqrjc.2012.031
56. Markensten H, Moore K, Persson I. Simulated lake phytoplankton composition shifts toward cyanobac-
teria dominance in a future warmer climate. Ecological Applications. 2010; 20: 752–767. https://doi.org/
10.1890/08-2109.1 PMID: 20437961
57. Peeters F, Straile D, Lorke A, Livingstone DM. Earlier onset of the spring phytoplankton bloom in lakes
of the temperate zone in a warmer climate. Global Change Biology. 2007; 13: 1898–1909. https://doi.
org/10.1111/j.1365-2486.2007.01412.x
58. Parker BR, Vinebrooke RD, Schindler DW. Recent climate extremes alter alpine lake ecosystems. Pro-
ceedings of the National Academy of Sciences of the United States of America. 2008; 105: 12927–
12931. https://doi.org/10.1073/pnas.0806481105 PMID: 18725641
59. Scavia D, David Allan J, Arend KK, Bartell S, Beletsky D, Bosch NS, et al. Assessing and addressing
the re-eutrophication of Lake Erie: Central basin hypoxia. Journal of Great Lakes Research. 2014; 40:
226–246. https://doi.org/10.1016/j.jglr.2014.02.004
60. Granados I, Toro M. Recent warming in a high mountain lake (Laguna Cimera, Central Spain) inferred
by means of fossil chironomids. Journal of Limnology. 2000; 59: 109–119. https://doi.org/10.4081/
jlimnol.2000.s1.109
61. Gauthier J, Prairie YT, Beisner BE. Thermocline deepening and mixing alter zooplankton phenology,
biomass and body size in a whole-lake experiment. Freshwater Biology. 2014; 59: 998–1011. https://
doi.org/10.1111/fwb.12322
62. Domis LND, Elser JJ, Gsell AS, Huszar VLM, Ibelings BW, Jeppesen E, et al. Plankton dynamics under
different climatic conditions in space and time. Freshwater Biology. 2013; 58: 463–482. https://doi.org/
10.1111/fwb.12053
63. Baron JS, Caine N. Temporal coherence of two alpine lake basins of the Colorado Front Range, USA.
Freshwater Biology. 2000; 43: 463–476. https://doi.org/10.1046/j.1365-2427.2000.00517.x
64. Mast MA, Clow DW, Baron JS, Wetherbee GA. Links between N deposition and nitrate export from a
high-elevation watershed in the Colorado Rront Range. Environmental Science & Technology. 2014;
48: 14258–14265. https://doi.org/10.1021/es502461k PMID: 25383864
65. Elser JJ, Andersen T, Baron JS, Bergstroem A- K, Jansson M, Kyle M, et al. Shifts in lake N:P stoichi-
ometry and nutrient limitation driven by atmospheric nitrogen deposition. Science. 2009; 326: 835–837.
https://doi.org/10.1126/science.1176199 PMID: 19892979
66. Bergstrom AK, Blomqvist P, Jansson M. Effects of atmospheric nitrogen deposition on nutrient limitation
and phytoplankton biomass in unproductive Swedish lakes. Limnology and Oceanography. 2005; 50:
987–994. https://doi.org/10.4319/lo.2005.50.3.0987
67. Wolfe AP, Van Gorp AC, Baron JS. Recent ecological and biogeochemical changes in alpine lakes of
Rocky Mountain National Park (Colorado, USA): a response to anthropogenic nitrogen deposition. Geo-
biology. 2003; 1: 153–168. https://doi.org/10.1046/j.1472-4669.2003.00012.x
68. Love Stowell SM, Kennedy CM, Beals SC, Metcalf JL, Martin AP. The genetic legacy of more than a
century of stocking trout: a case study in Rocky Mountain National Park, Colorado, USA. Canadian
Journal of Fisheries and Aquatic Sciences. 2015; 72: 1565–1574. https://doi.org/10.1139/cjfas-2015-
0009
69. Metcalf JL, Love Stowell S, Kennedy CM, Rogers KB, McDonald D, Epp J, et al. Historical stocking data
and 19th century DNA reveal human-induced changes to native diversity and distribution of cutthroat
trout. Molecular Ecology. 2012; 21: 5194–5207. https://doi.org/10.1111/mec.12028 PMID: 22998121
70. Wedekind C, Kung C. Shift of spawning season and effects of climate warming on developmental
stages of a grayling (Salmonidae). Conservation Biology. 2010; 24: 1418–1423. https://doi.org/10.
1111/j.1523-1739.2010.01534.x PMID: 20561001
71. Warren DR, Robinson JM, Josephson DC, Sheldon DR, Kraft CE. Elevated summer temperatures
delay spawning and reduce redd construction for resident brook trout (Salvelinus fontinalis). Global
Change Biology. 2012; 18: 1804–1811. https://doi.org/10.1111/j.1365-2486.2012.02670.x
72. Penaluna BE, Dunham JB, Railsback SF, Arismendi I, Johnson SL, Bilby RE, et al. Local variability
mediates vulnerability of trout populations to land use and climate change. Plos One. 2015; 10. https://
doi.org/10.1371/journal.pone.0135334 PMID: 26295478
73. Einum S, Fleming IA. Selection against late emergence and small offspring in Atlantic salmon (Salmo
salar). Evolution. 2000; 54: 628–639. https://doi.org/10.1111/j.0014-3820.2000.tb00064.x PMID:
10937238
74. Letcher BH, Dubreuil T, O’Donnell MJ, Obedzinski M, Griswold K, Nislow KH. Long-term consequences
of variation in timing and manner of fry introduction on juvenile Atlantic salmon (Salmo salar) growth,
Increasing temperatures in Rocky Mountain lakes
PLOS ONE | https://doi.org/10.1371/journal.pone.0179498 July 6, 2017 16 / 17

survival, and life-history expression. Canadian Journal of Fisheries and Aquatic Sciences. 2004; 61:
2288–2301. https://doi.org/10.1139/f04-214
75. Straile D, Kerimoglu O, Peeters F. Trophic mismatch requires seasonal heterogeneity of warming. Ecol-
ogy. 2015; 96: 2794–2805. https://doi.org/10.1890/14-0839.1.sm PMID: 26649399
76. Oyler JW, Dobrowski SZ, Ballantyne AP, Klene AE, Running SW. Artificial amplification of warming
trends across the mountains of the western United States. Geophysical Research Letters. 2015; 42:
153–161. https://doi.org/10.1002/2014gl062803
Increasing temperatures in Rocky Mountain lakes
PLOS ONE | https://doi.org/10.1371/journal.pone.0179498 July 6, 2017 17 / 17