Embed Size (px)
Citation preview
Thermal radiation and fragmentation pathways of photo-excited silicon clustersPiero Ferrari, Ewald Janssens, Peter Lievens, and Klavs Hansen Citation: The Journal of Chemical Physics 143, 224313 (2015); doi: 10.1063/1.4936917 View online: http://dx.doi.org/10.1063/1.4936917 View Table of Contents: http://scitation.aip.org/content/aip/journal/jcp/143/22?ver=pdfcov Published by the AIP Publishing Articles you may be interested in Field ionization of high-Rydberg fragments produced after inner-shell photoexcitation and photoionization ofthe methane molecule J. Chem. Phys. 143, 114305 (2015); 10.1063/1.4931105 Photoabsorption spectra of small cationic xenon clusters from time-dependent density functional theory J. Chem. Phys. 131, 214302 (2009); 10.1063/1.3265767 Size dependent fragmentation of argon clusters in the soft x-ray ionization regime J. Chem. Phys. 128, 044317 (2008); 10.1063/1.2821748 The interaction of gold clusters with methanol molecules: Infrared photodissociation of mass-selected Au n +(CH 3 OH) m J. Chem. Phys. 112, 752 (2000); 10.1063/1.480718 Photodissociation of CH stretch overtone excited CH 3 Cl and CHD 2 Cl (v CH =5): Cl spin–orbit branchingand atomic fragment yields J. Chem. Phys. 109, 7810 (1998); 10.1063/1.477427
This article is copyrighted as indicated in the article. Reuse of AIP content is subject to the terms at: http://scitation.aip.org/termsconditions. Downloaded to IP:
83.248.55.112 On: Thu, 10 Dec 2015 00:48:19
THE JOURNAL OF CHEMICAL PHYSICS 143, 224313 (2015)
Thermal radiation and fragmentation pathways of photo-excitedsilicon clusters
Piero Ferrari,1 Ewald Janssens,1 Peter Lievens,1 and Klavs Hansen21Laboratory of Solid State Physics and Magnetism, KU Leuven, 3001 Leuven, Belgium2Department of Physics, University of Gothenburg, 41296 Gothenburg, Sweden and Department of Physicsand Astronomy, Aarhus University, 8000 Aarhus C, Denmark
(Received 6 August 2015; accepted 19 November 2015; published online 9 December 2015)
The fragmentation of laser heated silicon clusters was studied by time-of-flight mass spectrometry.For Si+n (n = 5–19, 21), the lowest energy fragmentation pathways were identified as the metastabledecay channel occurring after the primary acceleration of the ions. The radiative cooling of laserexcited Si+n (n = 5–9, 11, and 13) was quantified via its quenching effect on the amount of metastablefragmentation. The quenching varied strongly with cluster size, from no observable amount forSi+7 to a cooling constant of 3 · 105 s−1 for Si+13. In addition, based on the observed fragmentationchannels, the ionization energies and the relative binding energies of the clusters were partiallyordered, and several ionization energies have been bracketed more precisely. C 2015 AIP PublishingLLC. [http://dx.doi.org/10.1063/1.4936917]
INTRODUCTION
For strongly bound nanoparticles and clusters, thermalradiation can have a very strong stabilizing effect onhighly excited particles, and is potentially an importantfactor in determining their abundances in non-equilibriumproduction processes involving such high excitation energies.Microsecond timescale radiative cooling has been observedfrom clusters of refractory metals1–3 and fullerenes.4 Radiationhas even been measured in a number of fullerene anions,with their relatively loosely bound excess electron, albeiton a much longer timescale (several milliseconds).5,6 Theactivation energy of the lowest energy decay channels, thatindirectly sets the upper limit of the temperature of theparticles, ranges between 2.7 eV for the electron affinity ofC60, to above 10 eV for C2 loss from the neutral C60.
Thermal radiation will tend to enhance the abundancesof the strongly radiating particle sizes at the expense ofless radiative sizes. It will therefore also seriously influencethe conclusions with respect to the stability of clustersone draws from observations of “magic numbers” in massspectra. In spite of the number of materials that areknown to radiate thermally, the quantitative determination ofradiative parameters for size selected clusters has receivedlittle attention, with the notable exception of carbon5,6
and more recently niobium.3 The question is of particularrelevance for the production of technologically interestingsize-selected clusters, because these tend to be composedof refractory materials. Silicon clusters have relatively highbinding energies,7 around 4 eV, albeit reduced in a regionaround n = 20, suggesting that radiative cooling may beimportant for at least some of these particles too. In addition,a correct assignment of the thermal radiation and lowestenergy fragmentation channels as a function of cluster sizewill provide benchmark data for theoretical methods, withrepercussions for calculations also for larger systems.
Historically, silicon clusters have been studied exten-sively, partly because of the material’s technologicalapplications.7–38 The study of small silicon clusters wasonly made possible by the introduction of laser ablationcluster sources. From the first observations of silicon clustersin molecular beams,8,9 their special fragmentation behaviorattracted attention.10–12 It was shown, for instance, that Si+6 isa favored photo-fragmentation product of small Si+n (n ≤ 12)clusters,11 that Si+n (n = 12–30) clusters give daughter ionsof about one half to two thirds of the original size, and thatlarger clusters suffer extensive fragmentation to yield chargedfragments composed of 6–11 atoms.18 Bulk silicon, in contrast,evaporates monomers: 90% of silicon gas is atomic.13
The nature of the fragmentation pattern of siliconclusters was surmised to be largely independent of theexcitation mechanism, because similar, albeit not identical,results were obtained by photo-excitation using differentlaser wavelengths11,18 and by collision induced dissociation(CID).7,20 Experimental dissociation energies could beinferred from disappearance energies in CID experiments,7
demonstrating the enhanced stability of Si+6 and Si+10, andthat the fragmentation channels of Si+n (n = 12–25) arecorrelated with relative stabilities of fragments composedof 6–11 atoms. A study of soft X-ray photo-excitation of Si+n(n = 9–19, 22–27)39 showed multiple charge states, but it wasalso observed that the process produced Si+6 , Si+7 , Si+10, and Si+11fragments for larger clusters.
Computational studies have addressed the fragmentationpathways and dissociation energies,25,31,35 indicating apreference of silicon clusters composed of more than eightatoms to disintegrate by losing relatively large fragments,reproducing the general features of the experimental findingsas they were known at the time.
Efforts have also been made to correlate the size-dependentstability to the geometrical structures of the clusters. Smallsilicon clusters (n = 4, 6, 7) deposited in an inert matrix were
0021-9606/2015/143(22)/224313/9/$30.00 143, 224313-1 © 2015 AIP Publishing LLC
This article is copyrighted as indicated in the article. Reuse of AIP content is subject to the terms at: http://scitation.aip.org/termsconditions. Downloaded to IP:
83.248.55.112 On: Thu, 10 Dec 2015 00:48:19
224313-2 Ferrari et al. J. Chem. Phys. 143, 224313 (2015)
studied by Raman spectroscopy.23 Ion mobility measurementshave provided information on the shapes of charged siliconclusters.26,29 More recently, infrared multiple photon dissoci-ation experiments have provided conclusive structural assign-ments of the neutral (n = 6–10, 15) and cationic (n = 6–11,13-18) clusters.36,38 The same technique has also been used tostudy the influence of a single dopant atom on the structure ofthe clusters.40–44 Density functional theory (DFT) calculationshave been used to explore the lowest energy configurations ofsilicon clusters in different charge states.28,30–34 Second energydifferences, as a measure of the relative stability of clusters,were calculated and provided local maxima for neutral Sin(n = 6, 7, 10)30 and cationic Si+n (n = 6, 7, 11),31 in agreementwith the experimental findings. However, an intuitive correla-tion between stability and structure of silicon clusters is not yetavailable.
In summary, the present study was motivated by the dualpurpose of finding the lowest energy fragmentation channelsand measuring the radiative cooling of small, cationic siliconclusters, providing essential information for understanding oftheir size-dependent properties.
EXPERIMENTAL PROCEDURE
The procedure used here was, in brief, to multi-photonionize and excite neutral clusters, extract the ions with an elec-tric field which is switched on with or without a time delay afterthe laser pulse, and measure the metastable (i.e., delayed) frag-mentation of the ions in the field-free region after acceleration.
The clusters were produced in a laser vaporizationsource,45 operated with a pulsed Nd:YAG laser (532 nm,10 Hz) providing pulse energies of 15-25 mJ. Helium gasat a backing pressure of 7 bars was introduced by a pulsedsupersonic valve into a waiting room just before laser ablationof a silicon target, which was a piece of a commercial, highpurity wafer. The clusters were thermalized by the helium toroom temperature. This left the clusters with an internal energymuch below the threshold for unimolecular dissociation on therelevant experimental timescales. After adiabatic expansion
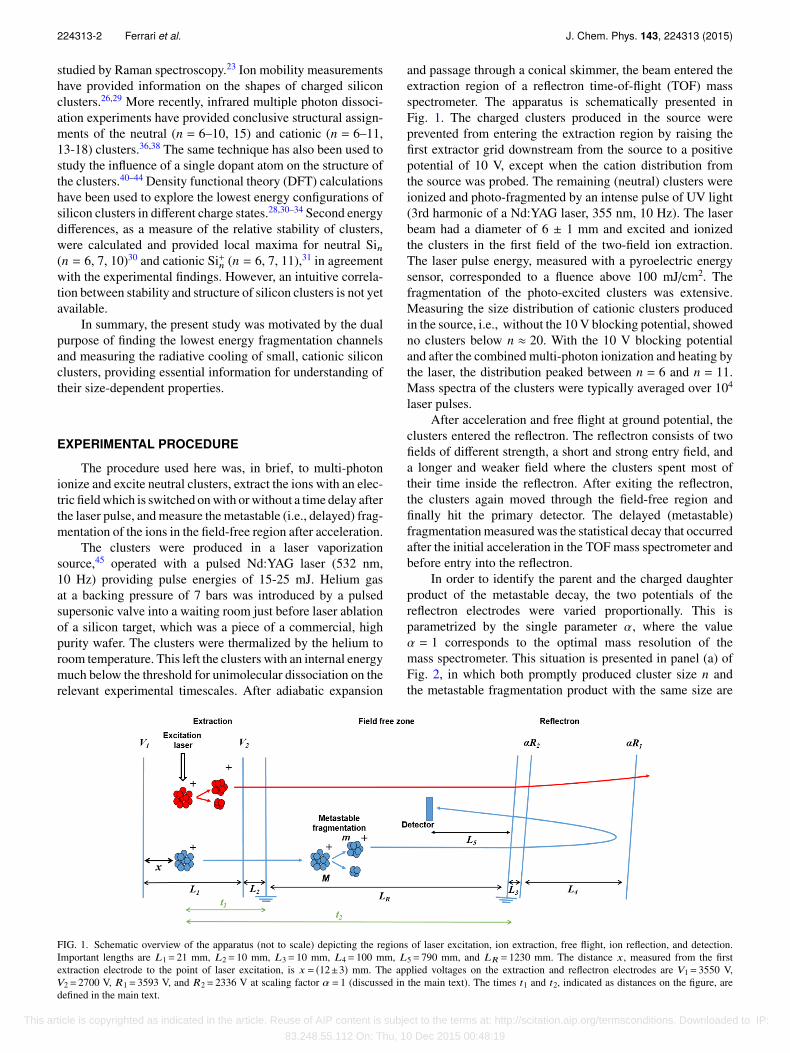
and passage through a conical skimmer, the beam entered theextraction region of a reflectron time-of-flight (TOF) massspectrometer. The apparatus is schematically presented inFig. 1. The charged clusters produced in the source wereprevented from entering the extraction region by raising thefirst extractor grid downstream from the source to a positivepotential of 10 V, except when the cation distribution fromthe source was probed. The remaining (neutral) clusters wereionized and photo-fragmented by an intense pulse of UV light(3rd harmonic of a Nd:YAG laser, 355 nm, 10 Hz). The laserbeam had a diameter of 6 ± 1 mm and excited and ionizedthe clusters in the first field of the two-field ion extraction.The laser pulse energy, measured with a pyroelectric energysensor, corresponded to a fluence above 100 mJ/cm2. Thefragmentation of the photo-excited clusters was extensive.Measuring the size distribution of cationic clusters producedin the source, i.e., without the 10 V blocking potential, showedno clusters below n ≈ 20. With the 10 V blocking potentialand after the combined multi-photon ionization and heating bythe laser, the distribution peaked between n = 6 and n = 11.Mass spectra of the clusters were typically averaged over 104
laser pulses.After acceleration and free flight at ground potential, the
clusters entered the reflectron. The reflectron consists of twofields of different strength, a short and strong entry field, anda longer and weaker field where the clusters spent most oftheir time inside the reflectron. After exiting the reflectron,the clusters again moved through the field-free region andfinally hit the primary detector. The delayed (metastable)fragmentation measured was the statistical decay that occurredafter the initial acceleration in the TOF mass spectrometer andbefore entry into the reflectron.
In order to identify the parent and the charged daughterproduct of the metastable decay, the two potentials of thereflectron electrodes were varied proportionally. This isparametrized by the single parameter α, where the valueα = 1 corresponds to the optimal mass resolution of themass spectrometer. This situation is presented in panel (a) ofFig. 2, in which both promptly produced cluster size n andthe metastable fragmentation product with the same size are
FIG. 1. Schematic overview of the apparatus (not to scale) depicting the regions of laser excitation, ion extraction, free flight, ion reflection, and detection.Important lengths are L1= 21 mm, L2= 10 mm, L3= 10 mm, L4= 100 mm, L5= 790 mm, and LR = 1230 mm. The distance x, measured from the firstextraction electrode to the point of laser excitation, is x = (12±3) mm. The applied voltages on the extraction and reflectron electrodes are V1= 3550 V,V2= 2700 V, R1= 3593 V, and R2= 2336 V at scaling factor α = 1 (discussed in the main text). The times t1 and t2, indicated as distances on the figure, aredefined in the main text.
This article is copyrighted as indicated in the article. Reuse of AIP content is subject to the terms at: http://scitation.aip.org/termsconditions. Downloaded to IP:
83.248.55.112 On: Thu, 10 Dec 2015 00:48:19
224313-3 Ferrari et al. J. Chem. Phys. 143, 224313 (2015)
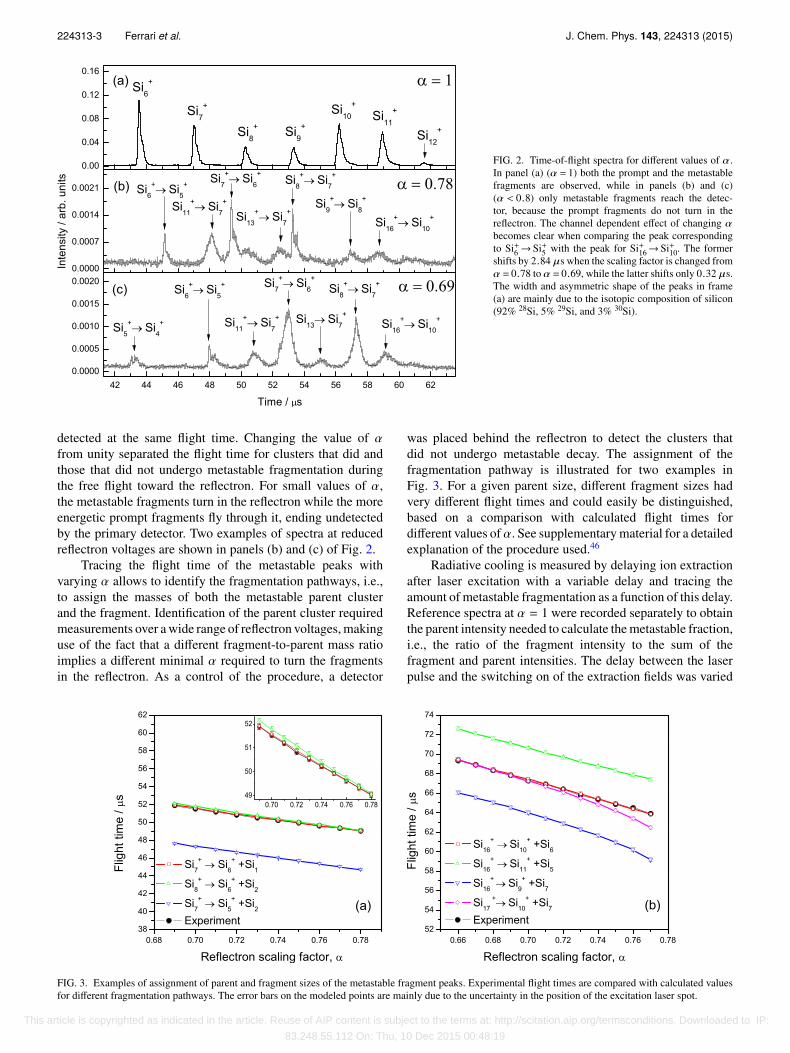
FIG. 2. Time-of-flight spectra for different values of α.In panel (a) (α = 1) both the prompt and the metastablefragments are observed, while in panels (b) and (c)(α < 0.8) only metastable fragments reach the detec-tor, because the prompt fragments do not turn in thereflectron. The channel dependent effect of changing αbecomes clear when comparing the peak correspondingto Si+6 → Si+5 with the peak for Si+16→ Si+10. The formershifts by 2.84 µs when the scaling factor is changed fromα = 0.78 to α = 0.69, while the latter shifts only 0.32 µs.The width and asymmetric shape of the peaks in frame(a) are mainly due to the isotopic composition of silicon(92% 28Si, 5% 29Si, and 3% 30Si).
detected at the same flight time. Changing the value of αfrom unity separated the flight time for clusters that did andthose that did not undergo metastable fragmentation duringthe free flight toward the reflectron. For small values of α,the metastable fragments turn in the reflectron while the moreenergetic prompt fragments fly through it, ending undetectedby the primary detector. Two examples of spectra at reducedreflectron voltages are shown in panels (b) and (c) of Fig. 2.
Tracing the flight time of the metastable peaks withvarying α allows to identify the fragmentation pathways, i.e.,to assign the masses of both the metastable parent clusterand the fragment. Identification of the parent cluster requiredmeasurements over a wide range of reflectron voltages, makinguse of the fact that a different fragment-to-parent mass ratioimplies a different minimal α required to turn the fragmentsin the reflectron. As a control of the procedure, a detector
was placed behind the reflectron to detect the clusters thatdid not undergo metastable decay. The assignment of thefragmentation pathway is illustrated for two examples inFig. 3. For a given parent size, different fragment sizes hadvery different flight times and could easily be distinguished,based on a comparison with calculated flight times fordifferent values of α. See supplementary material for a detailedexplanation of the procedure used.46
Radiative cooling is measured by delaying ion extractionafter laser excitation with a variable delay and tracing theamount of metastable fragmentation as a function of this delay.Reference spectra at α = 1 were recorded separately to obtainthe parent intensity needed to calculate the metastable fraction,i.e., the ratio of the fragment intensity to the sum of thefragment and parent intensities. The delay between the laserpulse and the switching on of the extraction fields was varied
FIG. 3. Examples of assignment of parent and fragment sizes of the metastable fragment peaks. Experimental flight times are compared with calculated valuesfor different fragmentation pathways. The error bars on the modeled points are mainly due to the uncertainty in the position of the excitation laser spot.
This article is copyrighted as indicated in the article. Reuse of AIP content is subject to the terms at: http://scitation.aip.org/termsconditions. Downloaded to IP:
83.248.55.112 On: Thu, 10 Dec 2015 00:48:19
224313-4 Ferrari et al. J. Chem. Phys. 143, 224313 (2015)
between 0 and 1.8 µs. The method has been used previouslyto study the radiative cooling of laser heated fullerenes4
and niobium clusters.3 The two reflectron potentials werereduced to α = 0.69 to separate prompt and metastable ionicfragmentation products. The method is based on the factthat in the absence of radiation, the decay will proceed asa power law in time with power −1,6,47,48 where the time ismeasured from the laser excitation in the extraction region.The metastable decay between t1 and t2 is then proportionalto ln(t2/t1), with ti = ti,0 + ∆t (i = 1,2), where ∆t is the delaybetween the laser pulse and the switching of the extractionvoltage, t1,0 is the time from the start of the accelerationof the cluster ion to the moment of mass selection in theaccelerating stage of the mass spectrometer, and t2,0 is the timefrom the start of the acceleration to the entry intothe reflectron. The mass selection in the accelerationoccurs when the cluster is somewhere between thestarting point and the exit of the acceleration stage. Theoperational point is set to the time where the clustershave reached half their final kinetic energy. Deviationsfrom this logarithmic decay fraction indicate radiativecooling.
RESULTS AND DISCUSSION
Fragmentation pathways
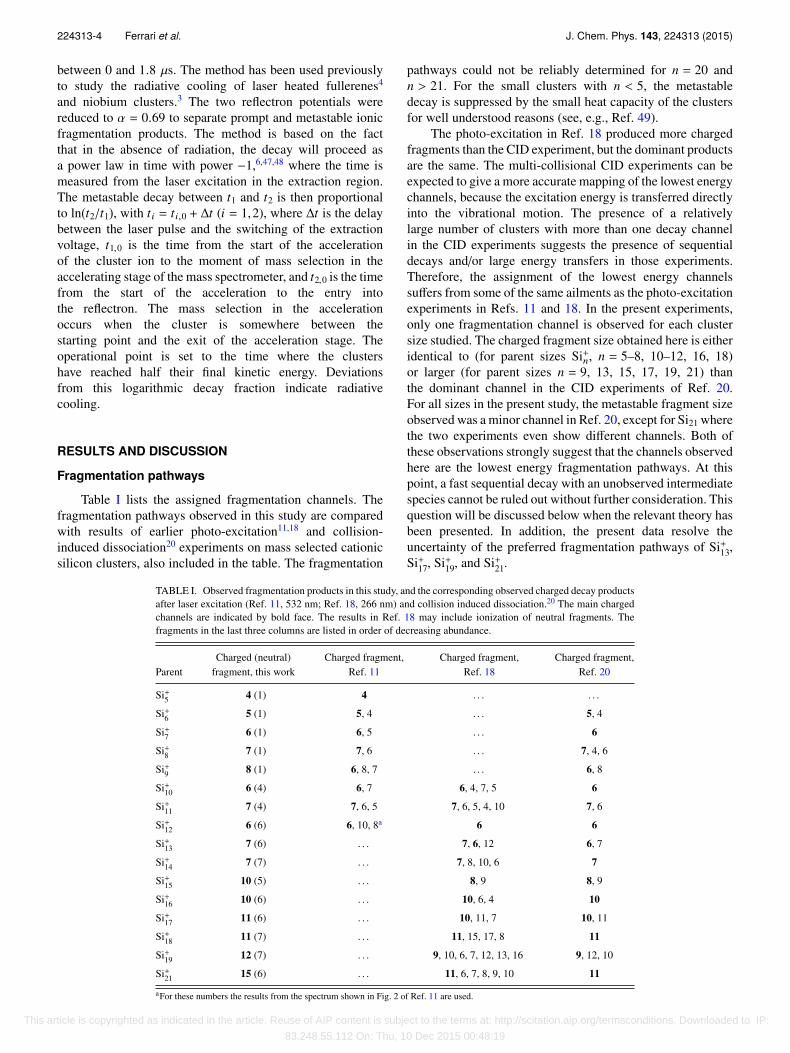
Table I lists the assigned fragmentation channels. Thefragmentation pathways observed in this study are comparedwith results of earlier photo-excitation11,18 and collision-induced dissociation20 experiments on mass selected cationicsilicon clusters, also included in the table. The fragmentation
pathways could not be reliably determined for n = 20 andn > 21. For the small clusters with n < 5, the metastabledecay is suppressed by the small heat capacity of the clustersfor well understood reasons (see, e.g., Ref. 49).
The photo-excitation in Ref. 18 produced more chargedfragments than the CID experiment, but the dominant productsare the same. The multi-collisional CID experiments can beexpected to give a more accurate mapping of the lowest energychannels, because the excitation energy is transferred directlyinto the vibrational motion. The presence of a relativelylarge number of clusters with more than one decay channelin the CID experiments suggests the presence of sequentialdecays and/or large energy transfers in those experiments.Therefore, the assignment of the lowest energy channelssuffers from some of the same ailments as the photo-excitationexperiments in Refs. 11 and 18. In the present experiments,only one fragmentation channel is observed for each clustersize studied. The charged fragment size obtained here is eitheridentical to (for parent sizes Si+n, n = 5–8, 10–12, 16, 18)or larger (for parent sizes n = 9, 13, 15, 17, 19, 21) thanthe dominant channel in the CID experiments of Ref. 20.For all sizes in the present study, the metastable fragment sizeobserved was a minor channel in Ref. 20, except for Si21 wherethe two experiments even show different channels. Both ofthese observations strongly suggest that the channels observedhere are the lowest energy fragmentation pathways. At thispoint, a fast sequential decay with an unobserved intermediatespecies cannot be ruled out without further consideration. Thisquestion will be discussed below when the relevant theory hasbeen presented. In addition, the present data resolve theuncertainty of the preferred fragmentation pathways of Si+13,Si+17, Si+19, and Si+21.
TABLE I. Observed fragmentation products in this study, and the corresponding observed charged decay productsafter laser excitation (Ref. 11, 532 nm; Ref. 18, 266 nm) and collision induced dissociation.20 The main chargedchannels are indicated by bold face. The results in Ref. 18 may include ionization of neutral fragments. Thefragments in the last three columns are listed in order of decreasing abundance.
ParentCharged (neutral)
fragment, this workCharged fragment,
Ref. 11Charged fragment,
Ref. 18Charged fragment,
Ref. 20
Si+5 4 (1) 4 . . . . . .
Si+6 5 (1) 5, 4 . . . 5, 4
Si+7 6 (1) 6, 5 . . . 6
Si+8 7 (1) 7, 6 . . . 7, 4, 6
Si+9 8 (1) 6, 8, 7 . . . 6, 8
Si+10 6 (4) 6, 7 6, 4, 7, 5 6
Si+11 7 (4) 7, 6, 5 7, 6, 5, 4, 10 7, 6
Si+12 6 (6) 6, 10, 8a 6 6
Si+13 7 (6) . . . 7, 6, 12 6, 7
Si+14 7 (7) . . . 7, 8, 10, 6 7
Si+15 10 (5) . . . 8, 9 8, 9
Si+16 10 (6) . . . 10, 6, 4 10
Si+17 11 (6) . . . 10, 11, 7 10, 11
Si+18 11 (7) . . . 11, 15, 17, 8 11
Si+19 12 (7) . . . 9, 10, 6, 7, 12, 13, 16 9, 12, 10
Si+21 15 (6) . . . 11, 6, 7, 8, 9, 10 11
aFor these numbers the results from the spectrum shown in Fig. 2 of Ref. 11 are used.
This article is copyrighted as indicated in the article. Reuse of AIP content is subject to the terms at: http://scitation.aip.org/termsconditions. Downloaded to IP:
83.248.55.112 On: Thu, 10 Dec 2015 00:48:19

224313-5 Ferrari et al. J. Chem. Phys. 143, 224313 (2015)
Finally, a comparison with calculated lowest energychannels by DFT simulations should be made. From themany theoretical studies on silicon clusters, Ref. 31, oncationic clusters, was selected for this purpose. The calculatedminimum energy structures in Ref. 31 agreed well withthe ones assigned by infrared multiple photon dissociationexperiments.36 The studied decay pathways of Si+n (n = 2–13)find that monomer evaporation is the preferred channel forn ≤ 8 and fragmentation into larger pieces for n ≥ 9. Forall sizes, the calculated preferred fragmentation channelagrees with the current experimental observations, except forn > 9, where fragmentation into Si+5 + Si4 is computationallypredicted while monomer evaporation is the observed channelin this study.
Radiative cooling
The power law decay and the consequent logarithmicdependence of the amount of metastable decay are modifiedin the presence of thermal radiation. The quenching effect ofthe radiative cooling on the unimolecular dissociation can bemanifested in two different ways. In one, the radiation can betreated as a continuous loss of internal energy, parametrizedin terms of an emitted power, without any reference to thewavelength of the emitted photons. This type was observed andquantified in experiments on fullerenes.4 The size dependentdecay rate, Rn, was discussed in Ref. 6 and found to be
Rn(t) ∝ 1ewnt − 1
, (1)
where a non-zero value of wn indicates the presence ofradiation. wn is related to the radiatively emitted energy bythe definition3
wn ≡d ln kn
dt, (2)
evaluated at the energy where knt = 1, with kn the rateconstant for unimolecular dissociation. An expression for theright hand side of Eq. (2) will be calculated below.
The other type of radiation pertains to clusters withsmall heat capacities and/or photons with an energy which issufficiently large to quench the unimolecular decay completelyby emission of a single photon. The modification of theevaporative decay rate for this situation is50
Rn(t) ∝ e−kp,nt
t, (3)
where kp,n has a simple interpretation as the photon emissionconstant for cluster size n. This expression is relevant forelectronic transitions with relatively high photon energies andlarge transition matrix elements compared to, e.g., vibrationaltransitions. It should be stressed that the description refersto a situation where one or more electronically excited statesare thermally populated. In particular, it does not refer toclusters that survive in a specific electronically excited stateproduced in the initial photo-excitation. Photon emissionfrom thermally excited electronic states has been observedfrom several different ions, see, e.g., Refs. 5, 51–53, and 50,and there is no reason to exclude this process a priori fromconsideration for silicon clusters.
Note that the nature of the two cooling processes isvery different. The use of different symbols (wn and kp,n)emphasizes this fact. Given the very high radiative rateconstants reported in this study (see below), one may suspectthat Eq. (3) is the relevant equation here, but due to the similarbehavior of the two expressions, this cannot be determined bycurve fitting. Although the interpretation of the fitted constantsis very different in the two cases, the curves are in fact verysimilar. The main difference between the expressions is thatthe numerical value assigned to the constants wn and kp,n
differs by 35% from a fit of the same curve. The metastabledecay can then be expressed with the same equation in thetwo cases. Denoting 1/kp,n or w−1
n by the common symbol τn,the amount of metastable decay3 is given by
Mn = an ln(
1 − e−(t2,0+∆t)/τn
1 − e−(t1,0+∆t)/τn
), (4)
where Mn is the metastable fraction, i.e., as defined in theExperimental Procedure section. The parameters an, τn arepositive and cluster specific constants. Fits of the data for τnwith this expression are the main results for the radiative partof the article. When τn is big, the expression reduces to thesimpler expression
Mn = an
(ln(t2/t1) − 1
2(t2 − t1)/τn
). (5)
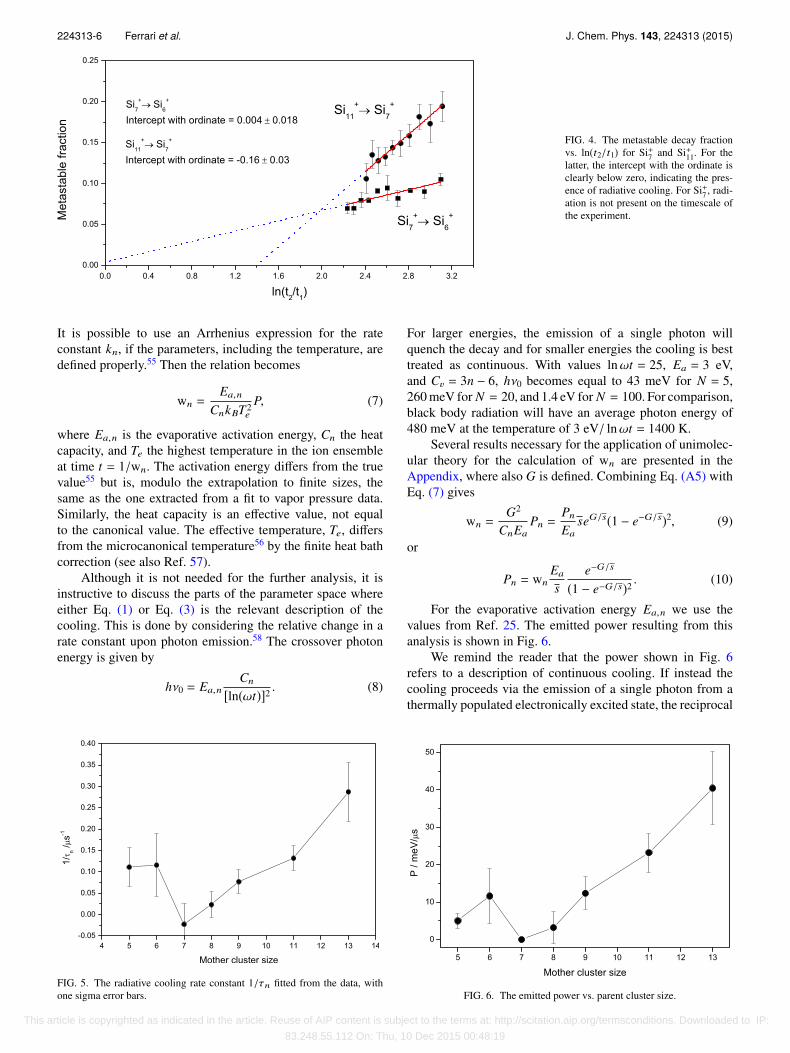
With the delayed extraction protocol used here, the differencet2 − t1 is constant and as a first estimate τn can then bedetermined from a plot of Mn vs. ln(t2/t1). Such plots providea fast and robust signature of radiative cooling on the timescaleof the experiment (about 20–50 µs). Note that the (unlikely)presence of an amount of cold cationic clusters only affectsthe fit of the coefficient an and not the radiative time constants.Fig. 4 shows two examples of a plot of Eq. (5), one with andone without observable radiative cooling.
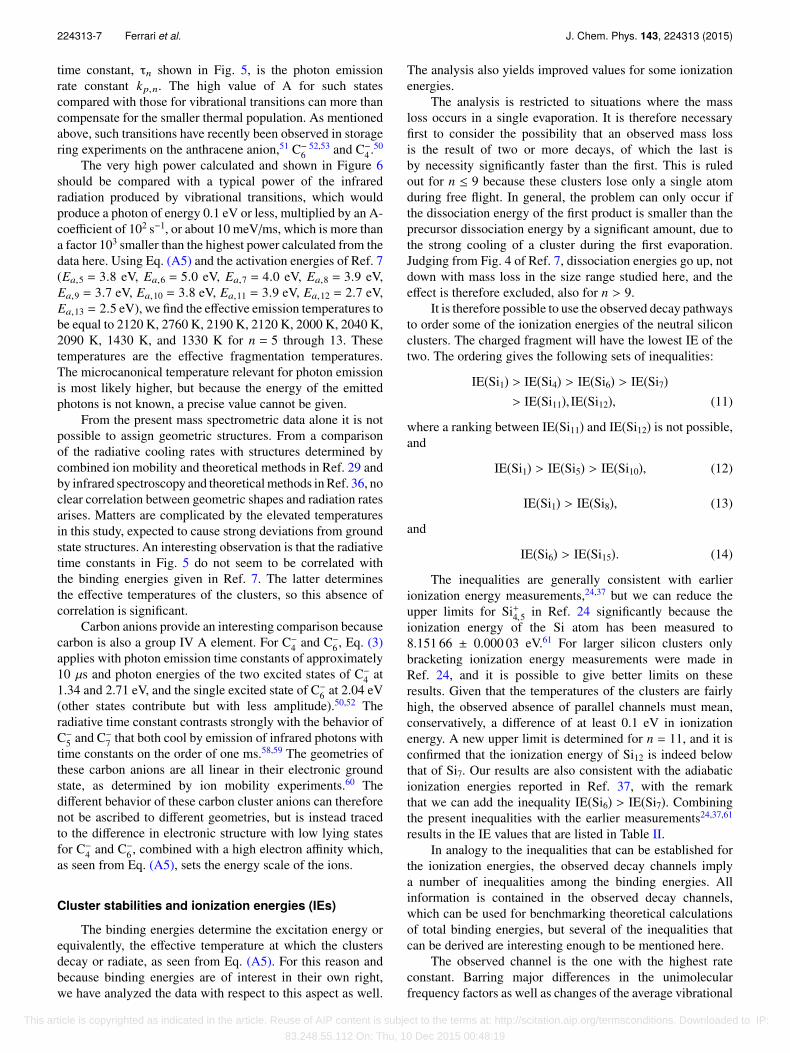
To extract a value for τn, Eq. (4) is used to fit themetastable decay fraction Mn as a function of delay time∆t. The fitted values are shown in Fig. 5. The valuesfor n = 5, 9, 11, 13 are consistent with the emission ofradiation, corresponding to cooling times of 3-13 µs. For thesizes n = 6, 7, 8, no radiation is observed with a 2σ-levelcriterion. The values of cooling times are on the same order ofmagnitude as those measured for cationic niobium clusters inthe same apparatus,3 and also of the ones measured for cationicfullerenes.4,54 This is likely to be related to the high stabilityand concomitant high internal energy at the evaporation pointof all these materials. The cluster temperatures for which theseτn’s are observed are calculated below.
As mentioned, the interpretation of the τn’s depends onthe nature of the emission processes. If, as we suspect, thephotons emitted are of an energy so that a single emissionquenches the unimolecular decay, the measured (reciprocal)times are simply the Einstein A-coefficients of the excitedstate times their thermal population.50
The alternative continuous cooling requires some analysisbefore the emitted power can be given. Rewriting Eq. (2), theradiated power P is related to wn as
wn =∂kn∂T
dTdE
Pn. (6)
This article is copyrighted as indicated in the article. Reuse of AIP content is subject to the terms at: http://scitation.aip.org/termsconditions. Downloaded to IP:
83.248.55.112 On: Thu, 10 Dec 2015 00:48:19
224313-6 Ferrari et al. J. Chem. Phys. 143, 224313 (2015)
FIG. 4. The metastable decay fractionvs. ln(t2/t1) for Si+7 and Si+11. For thelatter, the intercept with the ordinate isclearly below zero, indicating the pres-ence of radiative cooling. For Si+7 , radi-ation is not present on the timescale ofthe experiment.
It is possible to use an Arrhenius expression for the rateconstant kn, if the parameters, including the temperature, aredefined properly.55 Then the relation becomes
wn =Ea,n
CnkBT2e
P, (7)
where Ea,n is the evaporative activation energy, Cn the heatcapacity, and Te the highest temperature in the ion ensembleat time t = 1/wn. The activation energy differs from the truevalue55 but is, modulo the extrapolation to finite sizes, thesame as the one extracted from a fit to vapor pressure data.Similarly, the heat capacity is an effective value, not equalto the canonical value. The effective temperature, Te, differsfrom the microcanonical temperature56 by the finite heat bathcorrection (see also Ref. 57).
Although it is not needed for the further analysis, it isinstructive to discuss the parts of the parameter space whereeither Eq. (1) or Eq. (3) is the relevant description of thecooling. This is done by considering the relative change in arate constant upon photon emission.58 The crossover photonenergy is given by
hν0 = Ea,nCn
[ln(ωt)]2 . (8)
FIG. 5. The radiative cooling rate constant 1/τn fitted from the data, withone sigma error bars.
For larger energies, the emission of a single photon willquench the decay and for smaller energies the cooling is besttreated as continuous. With values lnωt = 25, Ea = 3 eV,and Cv = 3n − 6, hν0 becomes equal to 43 meV for N = 5,260 meV for N = 20, and 1.4 eV for N = 100. For comparison,black body radiation will have an average photon energy of480 meV at the temperature of 3 eV/ lnωt = 1400 K.
Several results necessary for the application of unimolec-ular theory for the calculation of wn are presented in theAppendix, where also G is defined. Combining Eq. (A5) withEq. (7) gives
wn =G2
CnEaPn =
Pn
EaseG/s(1 − e−G/s)2, (9)
or
Pn = wnEa
se−G/s
(1 − e−G/s)2 . (10)
For the evaporative activation energy Ea,n we use thevalues from Ref. 25. The emitted power resulting from thisanalysis is shown in Fig. 6.
We remind the reader that the power shown in Fig. 6refers to a description of continuous cooling. If instead thecooling proceeds via the emission of a single photon from athermally populated electronically excited state, the reciprocal
FIG. 6. The emitted power vs. parent cluster size.
This article is copyrighted as indicated in the article. Reuse of AIP content is subject to the terms at: http://scitation.aip.org/termsconditions. Downloaded to IP:
83.248.55.112 On: Thu, 10 Dec 2015 00:48:19
224313-7 Ferrari et al. J. Chem. Phys. 143, 224313 (2015)
time constant, τn shown in Fig. 5, is the photon emissionrate constant kp,n. The high value of A for such statescompared with those for vibrational transitions can more thancompensate for the smaller thermal population. As mentionedabove, such transitions have recently been observed in storagering experiments on the anthracene anion,51 C−6
52,53 and C−4 .50
The very high power calculated and shown in Figure 6should be compared with a typical power of the infraredradiation produced by vibrational transitions, which wouldproduce a photon of energy 0.1 eV or less, multiplied by an A-coefficient of 102 s−1, or about 10 meV/ms, which is more thana factor 103 smaller than the highest power calculated from thedata here. Using Eq. (A5) and the activation energies of Ref. 7(Ea,5 = 3.8 eV, Ea,6 = 5.0 eV, Ea,7 = 4.0 eV, Ea,8 = 3.9 eV,Ea,9 = 3.7 eV, Ea,10 = 3.8 eV, Ea,11 = 3.9 eV, Ea,12 = 2.7 eV,Ea,13 = 2.5 eV), we find the effective emission temperatures tobe equal to 2120 K, 2760 K, 2190 K, 2120 K, 2000 K, 2040 K,2090 K, 1430 K, and 1330 K for n = 5 through 13. Thesetemperatures are the effective fragmentation temperatures.The microcanonical temperature relevant for photon emissionis most likely higher, but because the energy of the emittedphotons is not known, a precise value cannot be given.
From the present mass spectrometric data alone it is notpossible to assign geometric structures. From a comparisonof the radiative cooling rates with structures determined bycombined ion mobility and theoretical methods in Ref. 29 andby infrared spectroscopy and theoretical methods in Ref. 36, noclear correlation between geometric shapes and radiation ratesarises. Matters are complicated by the elevated temperaturesin this study, expected to cause strong deviations from groundstate structures. An interesting observation is that the radiativetime constants in Fig. 5 do not seem to be correlated withthe binding energies given in Ref. 7. The latter determinesthe effective temperatures of the clusters, so this absence ofcorrelation is significant.
Carbon anions provide an interesting comparison becausecarbon is also a group IV A element. For C−4 and C−6 , Eq. (3)applies with photon emission time constants of approximately10 µs and photon energies of the two excited states of C−4 at1.34 and 2.71 eV, and the single excited state of C−6 at 2.04 eV(other states contribute but with less amplitude).50,52 Theradiative time constant contrasts strongly with the behavior ofC−5 and C−7 that both cool by emission of infrared photons withtime constants on the order of one ms.58,59 The geometries ofthese carbon anions are all linear in their electronic groundstate, as determined by ion mobility experiments.60 Thedifferent behavior of these carbon cluster anions can thereforenot be ascribed to different geometries, but is instead tracedto the difference in electronic structure with low lying statesfor C−4 and C−6 , combined with a high electron affinity which,as seen from Eq. (A5), sets the energy scale of the ions.
Cluster stabilities and ionization energies (IEs)
The binding energies determine the excitation energy orequivalently, the effective temperature at which the clustersdecay or radiate, as seen from Eq. (A5). For this reason andbecause binding energies are of interest in their own right,we have analyzed the data with respect to this aspect as well.
The analysis also yields improved values for some ionizationenergies.
The analysis is restricted to situations where the massloss occurs in a single evaporation. It is therefore necessaryfirst to consider the possibility that an observed mass lossis the result of two or more decays, of which the last isby necessity significantly faster than the first. This is ruledout for n ≤ 9 because these clusters lose only a single atomduring free flight. In general, the problem can only occur ifthe dissociation energy of the first product is smaller than theprecursor dissociation energy by a significant amount, due tothe strong cooling of a cluster during the first evaporation.Judging from Fig. 4 of Ref. 7, dissociation energies go up, notdown with mass loss in the size range studied here, and theeffect is therefore excluded, also for n > 9.
It is therefore possible to use the observed decay pathwaysto order some of the ionization energies of the neutral siliconclusters. The charged fragment will have the lowest IE of thetwo. The ordering gives the following sets of inequalities:
IE(Si1) > IE(Si4) > IE(Si6) > IE(Si7)> IE(Si11), IE(Si12), (11)
where a ranking between IE(Si11) and IE(Si12) is not possible,and
IE(Si1) > IE(Si5) > IE(Si10), (12)
IE(Si1) > IE(Si8), (13)
and
IE(Si6) > IE(Si15). (14)
The inequalities are generally consistent with earlierionization energy measurements,24,37 but we can reduce theupper limits for Si+4,5 in Ref. 24 significantly because theionization energy of the Si atom has been measured to8.151 66 ± 0.000 03 eV.61 For larger silicon clusters onlybracketing ionization energy measurements were made inRef. 24, and it is possible to give better limits on theseresults. Given that the temperatures of the clusters are fairlyhigh, the observed absence of parallel channels must mean,conservatively, a difference of at least 0.1 eV in ionizationenergy. A new upper limit is determined for n = 11, and it isconfirmed that the ionization energy of Si12 is indeed belowthat of Si7. Our results are also consistent with the adiabaticionization energies reported in Ref. 37, with the remarkthat we can add the inequality IE(Si6) > IE(Si7). Combiningthe present inequalities with the earlier measurements24,37,61
results in the IE values that are listed in Table II.In analogy to the inequalities that can be established for
the ionization energies, the observed decay channels implya number of inequalities among the binding energies. Allinformation is contained in the observed decay channels,which can be used for benchmarking theoretical calculationsof total binding energies, but several of the inequalities thatcan be derived are interesting enough to be mentioned here.
The observed channel is the one with the highest rateconstant. Barring major differences in the unimolecularfrequency factors as well as changes of the average vibrational
This article is copyrighted as indicated in the article. Reuse of AIP content is subject to the terms at: http://scitation.aip.org/termsconditions. Downloaded to IP:
83.248.55.112 On: Thu, 10 Dec 2015 00:48:19

224313-8 Ferrari et al. J. Chem. Phys. 143, 224313 (2015)
TABLE II. The new values of ionization energies of neutral silicon clusters,given in bold face. The other values given are from Refs. 24, 37, and 61 (forthe monomer).
n IE(Sin) (eV) n IE(Sin) (eV)1 8.151 66 12 7.17-7.462 >8.49 13 7.17-7.463 >8.49 14 7.17-7.464 8.0-8.05 15 7.17-7.465 8.0-8.05 16 6.80-6.946 7.9 17 7.46-7.537 7.8 18 6.80-6.948 7.46-7.87 19 6.80-6.949 7.46-7.87 20 7.47-7.5310 7.9 21 6.80-6.9411 7.46-7.7 22 5.85-5.95
frequencies with cluster size, the observed channel is the onewith the lowest activation energy or, equivalently, the biggestbinding energy. We will tentatively assume this is the case.For the decay of Si+6 , for example, the observed decay channelprovides the four inequalities
BE(Si+5) + BE(Si1) > BE(Si+6−k) + BE(Sik), k = 2,3,4,5,(15)
where BE(Siqn) is the (total) binding energy of the Siqn cluster.The dataset in Table I gives a total of about 200 suchinequalities which involve 40 different binding energies, fromn = 1 to n = 20 for neutral and positively charged species.
Some of the inequalities derived involve two unknownsplus the neutral dimer binding energy, BE(Si2), which isequal to 3.17 eV.62 Defining the binding energy of the neutralmonomer as zero, we have
BE(Si+4+k) > BE(Si+3) + (k + 1)BE(Si2), k = 0,1,2,3,4.(16)
Similarly, one gets for the charged cluster monomerdissociation energies, i.e., the difference between the bindingenergies D+n,1 ≡ BE(Si+n) − BE(Si+n−1), the following lowerlimits:
D+n,1 > BE(Si2) = 3.17 eV, n = 4,5,6,7,8. (17)
Although these lower limits are not particularly strong (thebulk cohesive energy per atom is 4.6 eV63), they are alsonot completely trivial. From the decay of Si+10 and Si+11, onederives for the neutral clusters
BE(Si4) > 12(BE(Si3) + BE(Si5)) , (18)
and from the decay of Si+18 and Si+19 one has
BE(Si7) > 12(BE(Si6) + BE(Si8)) . (19)
Finally, the decay of Si+12 and Si+13 gives the inequality
BE(Si6) > 12(BE(Si5) + BE(Si7)) . (20)
SUMMARY
The pathways of delayed fragmentation of positivelycharged silicon clusters after laser excitation have beenmeasured in a reflectron time-of-flight mass spectrometerfor clusters composed of 5, 19, and 21 atoms. All clustersdecayed via a single pathway, with higher masses of thecharged fragments than found previously in both collisioninduced dissociation and photo-fragmentation experiments.The channels measured here are most likely the lowestactivated energy channels. The radiative cooling of sevenclusters was measured by the quenching effect on themetastable decay. The shortest radiative cooling time was 3 µs.If the cooling can be considered continuous this correspondsto a radiative power of 40 ± 10 meV/µs, but the values variedstrongly with cluster size. Several binding energy inequalitieswere derived from the data, and previously published bracketson ionization energies could be narrowed. Even though theemitted photons have not been characterized, due to theexperimental challenge to measure photons emitted by adilute and fast moving ion cloud, this work has shown thatthe emission of radiation is an important cooling mechanismin small silicon clusters.
ACKNOWLEDGMENTS
This work is supported by the Research Foundation -Flanders (FWO) and by the KU Leuven Research Council(BOF program and Grant No. GOA/14/007). P. Ferrariacknowledges CONICyT for BECAS CHILE scholarship.
APPENDIX: THE CLUSTER TEMPERATURE
To apply Eq. (7), first the frequency factor in the Arrheniusexpression is determined. For this purpose, the six highestvapor pressure points in Table VII of Ref. 13 are fitted withthe function3
p√
kBT=
(πm8
)1/2Ωe−Ea/kBT , (A1)
where m is the reduced mass of the monomer and daughtercluster, Ω the Arrhenius frequency factor per unit area, and pthe vapor pressure. The fit gives the value 1.8 · 1033 1/s · m2
for Ω. With a geometric capture cross section σ of 8.9 Å2n2/3,calculated from the bulk density, the frequency factor becomes
ω = Ωσ = 1.6 · 1014n2/3 s−1. (A2)
Next, the effective degrees of freedom, s, are calculated.s is the average canonical heat capacity of reactant andproducts, in units of kB. The heat capacity of bulk silicon istemperature dependent, and we use the value, correspondingto the experimentally measured bulk value at 2000 K, of
s = 1.1(3n − 6) = 1.1(3n − 7.5), (A3)
where n is the average number of atoms in the reactant andproduct clusters. This corresponds to the loss of a neutralatom, which is the observed channel for n ≤ 9. For largercluster sizes, the value is slightly different because the neutralfragment is then a molecule which reduces vibrational and
This article is copyrighted as indicated in the article. Reuse of AIP content is subject to the terms at: http://scitation.aip.org/termsconditions. Downloaded to IP:
83.248.55.112 On: Thu, 10 Dec 2015 00:48:19
224313-9 Ferrari et al. J. Chem. Phys. 143, 224313 (2015)
increases rotational degrees of freedom of the product state,giving s = 1.1(3n − 9) + 1.5 from n = 10 and upwards. Forsimplicity, we will use the expression in Eq. (A3) for allsizes. Defining the parameter G ≡ ln(ω/τn) or G ≡ ln(ωt0,1),whichever is the smallest, we can write the effective heatcapacity as55
Cn =G2
se−G/s
(1 − e−G/s
)−2. (A4)
Without any appreciable loss of accuracy we can use the valuesG = 18.9 + 7
6 ln(n), corresponding to a timescale proportionalto n1/2 and an Arrhenius frequency factor proportional to n2/3.
This value is also used in the calculation of the effectivetemperature, viz., wn = ω exp(−Ea/kBTe) (replacing w by1/t0,1 if the former is zero). This gives
Te = Ea,n/ ln(ω/wn) = Ea,n
G. (A5)
1U. Frenzel, U. Hammer, H. Westje, and D. Kreisle, Z. Phys. D: At., Mol.Clusters 40, 108–110 (1997).
2C. Walther, G. Dietrich, W. Dostal, K. Hansen, S. Kruckeberg, K.Lutzenkirchen, and L. Schweikhard, Phys. Rev. Lett. 83, 3816 (1999).
3K. Hansen, Y. Li, V. Kaydashev, and E. Janssens, J. Chem. Phys. 141, 024302(2014).
4K. Hansen and E. E. B. Campbell, J. Chem. Phys. 104, 5012 (1996).5J. U. Andersen, C. Brink, P. Hvelplund, M. O. Larsson, B. B. Nielsen, andH. Shen, Phys. Rev. Lett. 77, 3991 (1996).
6K. Hansen, J. U. Andersen, P. Hvelplund, S. P. Møller, U. V. Pedersen, andV. V. Petrunin, Phys. Rev. Lett. 87, 123401 (2001).
7M. F. Jarrold and E. C. Honea, J. Phys. Chem. 95, 9181 (1991).8C. E. Richter and M. Trapp, Int. J. Mass Spectrom. Ion Phys. 38, 21 (1981).9T. T. Tsong, Appl. Phys. Lett. 45, 1149 (1984).
10J. R. Heath, Y. Liu, S. C. O’Brien, Q. L. Zhang, R. F. Curl, F. K. Tittel, andR. E. Smalley, J. Chem. Phys. 83, 5520 (1985).
11L. A. Bloomfield, R. R. Freeman, and W. L. Brown, Phys. Rev. Lett. 54, 2246(1985).
12T. P. Martin and H. Schaber, J. Chem. Phys. 83, 855 (1985).13P. D. Desai, J. Phys. Chem. Ref. Data 15, 967 (1986).14Y. Liu, Q. L. Zhang, F. K. Tittel, R. F. Curl, and R. E. Smalley, J. Chem.
Phys. 85, 7434 (1986).15D. Tománek and M. A. Schlüter, Phys. Rev. Lett. 56, 1055 (1986).16D. J. Trevor, D. M. Cox, K. C. Reichmann, R. O. Brickman, and A. Kaldor,
J. Phys. Chem. 91, 2598 (1987).17O. Cheshnovsky, S. H. Yang, C. L. Pettiette, M. J. Craycraft, Y. Liu, and R. E.
Smalley, Chem. Phys. Lett. 138, 119 (1987).18Q. Zhang, Y. Liu, R. F. Curl, F. K. Tittel, and R. E. Smalley, J. Chem. Phys.
88, 1670 (1988).19K. Raghavachari and C. M. Rohlfing, J. Chem. Phys. 89, 2219 (1988).20M. F. Jarrold and J. E. Bower, J. Phys. Chem. 92, 5702 (1988).21S. M. Beck and J. M. Andrews, J. Chem. Phys. 91, 4420 (1989).22W. Begemann, R. Hector, Y. Y. Liu, J. Tiggesbäumker, K. H. Meiwes-Broer,
and H. O. Lutz, Z. Phys. D: At., Mol. Clusters 12, 229 (1989).23E. C. Honea, A. Ogura, C. Murray, K. Raghavachari, W. O. Sprenger, M. F.
Jarrold, and W. L. Brown, Nature 366, 42 (1993).24K. Fuke, K. Tsukamoto, F. Misaizu, and M. Sanekata, J. Chem. Phys. 99,
7807 (1993).25A. A. Shvartsburg, M. F. Jarrold, B. Liu, Z.-Y. Lu, C.-Z. Wang, and K.-M.
Ho, Phys. Rev. Lett. 81, 4616 (1998).26K.-M. Ho, A. A. Shvartsburg, B. Pan, Z.-Y. Lu, C.-Z. Wang, J. G. Wacker,
J. L. Fye, and M. F. Jarrold, Nature 392, 582 (1998).27C. Xu, T. R. Taylor, G. R. Burton, and D. M. Neumark, J. Chem. Phys. 108,
1395 (1998).28B. Liu, Z.-Y. Lu, B. Pan, C.-Z. Wang, K.-M. Ho, A. A. Shvartsburg, and M. F.
Jarrold, J. Chem. Phys. 109, 9401 (1998).
29A. A. Shvartsburg, R. R. Hudgins, P. Dugourd, and M. F. Jarrold, Chem. Soc.Rev. 30, 26 (2001).
30X. Zhu and X. C. Zeng, J. Chem. Phys. 118, 3558 (2003).31S. Nigam, C. Majumder, and S. K. Kulshreshtha, J. Chem. Phys. 121, 7756
(2004).32C. Pouchan, D. Bégué, and D. Y. Zhang, J. Chem. Phys. 121, 4628 (2004).33J. Yang, W. Xu, and X. Wensheng, J. Mol. Struct.: THEOCHEM 719, 89
(2005).34M. A. Belkhir, S. Mahtout, M. Belabbas, and I. Samah, Physica E 31, 86
(2006).35W. Qin, W.-C. Lu, L.-Z. Zhao, Q.-J. Zang, C. Z. Wang, and K. M. Ho, J.
Phys.: Condens. Matter 21, 455501 (2009).36J. Lyon, P. Gruene, A. Fielicke, G. Meijer, E. Janssens, P. Claes, and P.
Lievens, J. Am. Chem. Soc. 131, 1115 (2009).37O. Kostko, S. R. Leone, M. A. Duncan, and M. Ahmed, J. Phys. Chem. A
114, 3176 (2010).38M. Haertelt, J. T. Lyon, P. Claes, J. de Haeck, P. Lievens, and A. Fielicke, J.
Chem. Phys. 136, 064301 (2012).39M. Vogel, C. Kasigkeit, K. Hirsch, A. Langeberg, J. Rittmann, V. Zamudio-
Bayer, A. Kulesza, R. Mitric, T. Moller, B. v. Issendorff, and J. T. Lau, Phys.Rev. B 85, 195454 (2012).
40P. Claes, E. Janssens, V. T. Ngan, P. Gruene, J. T. Lyon, D. J. Harding,A. Fielicke, M. T. Nguyen, and P. Lievens, Phys. Rev. Lett. 107, 173401(2011).
41P. Claes, V. T. Ngan, M. Haertelt, J. T. Lyon, A. Fielicke, M. T. Nguyen, P.Lievens, and E. Janssens, J. Chem. Phys. 138, 194301 (2013).
42Y. Li, J. T. Lyon, A. P. Woodham, P. Lievens, A. Fielicke, and E. Janssens,J. Phys. Chem. C 119, 10896 (2015).
43P. Gruene, A. Fielicke, G. Meijer, E. Janssens, V. T. Ngan, M. T. Nguyen,and P. Lievens, ChemPhysChem 9, 703 (2008).
44V. T. Ngan, P. Gruene, P. Claes, E. Janssens, A. Fielicke, M. T. Nguyen, andP. Lievens, J. Am. Chem. Soc. 132, 15589 (2010).
45W. Bouwen, P. Thoen, F. Vanhoutte, S. Bouckaert, F. Despa, H. Weidele,R. E. Silverans, and P. Lievens, Rev. Sci. Instrum. 71, 54 (2000).
46See supplementary material at http://dx.doi.org/10.1063/1.4936917 for de-tails of the fragment size assignment.
47J. U. Andersen, H. Cederquist, J. S. Forster, B. A. Huber, P. Hvelplund, J.Jensen, B. Liu, B. Manil, L. Maunoury, S. Brøndsted Nielsen, U. V. Pedersen,H. T. Schmidt, S. Tomita, and H. Zettergren, Eur. Phys. J. D. 25, 139 (2003).
48J. U. Andersen, E. Bonderup, K. Hansen, P. Hvelplund, B. Liu, U. V.Pedersen, and S. Tomita, Eur. Phys. J. D 24, 191 (2003).
49K. Hansen and U. Näher, Phys. Rev. A 60, 1240 (1999).50N. Kono, T. Furukawa, H. Tanuma, J. Matsumoto, H. Shiromaru, T. Azuma,
K. Najafian, M. S. Pettersson, B. Dynefors, and K. Hansen, Phys. Chem.Chem. Phys. 17, 24732 (2015).
51S. Martin, J. Bernard, R. Brédy, B. Concina, C. Joblin, M. Ji, C. Ortega, andL. Chen, Phys. Rev. Lett. 110, 063003 (2013).
52G. Ito, T. Furukawa, H. Tanuma, J. Matsumoto, H. Shiromaru, T. Majima,M. Goto, T. Azuma, and K. Hansen, Phys. Rev. Lett. 112, 183001 (2014).
53V. Chandrasekaran, B. Kafle, A. Prabhakaran, O. Heber, M. Rappaport, H.Rubinstein, D. Schwalm, Y. Toker, and D. Zajfman, J. Phys. Chem. Lett. 5,4078 (2014).
54S. Tomita, J. U. Andersen, C. Gottrup, P. Hvelplund, and U. V. Pedersen,Phys. Rev. Lett. 87, 073401 (2001).
55K. Hansen, Chem. Phys. Lett. 620, 43 (2015).56J. U. Andersen, E. Bonderup, and K. Hansen, J. Chem. Phys. 114, 6518
(2001).57C. E. Klots, J. Chem. Phys. 90, 4470 (1989).58K. Najafian, M. S. Pettersson, B. Dynefors, H. Shiromaru, J. Matsumoto,
H. Tanuma, T. Furukawa, T. Azuma, and K. Hansen, J. Chem. Phys. 140,104311 (2014).
59M. Goto, A. E. K. Sundén, H. Shiromaru, J. Matsumoto, H. Tanuma, T.Azuma, and K. Hansen, J. Chem. Phys. 139, 054306 (2013).
60G. von Helden, P. R. Kemper, N. G. Gotts, and M. T. Bowers, Science 259,1300 (1993).
61C. M. Brown, S. G. Tilford, R. Tousey, and M. L. Ginter, J. Opt. Soc. Am.64, 1665 (1974).
62M. W. Chase, C. A. Davies, J. R. Downey, Jr., D. J. Frurip, R. A. McDonald,and A. N. Syverud, J. Phys. Chem. Ref. Data 14, 1 (1985).
63B. Farid and R. W. Godby, Phys. Rev. B 43, 14248 (1990).
This article is copyrighted as indicated in the article. Reuse of AIP content is subject to the terms at: http://scitation.aip.org/termsconditions. Downloaded to IP:
83.248.55.112 On: Thu, 10 Dec 2015 00:48:19