Embed Size (px)
Citation preview
Thermal Properties
and
Heat Transfer Characteristics
of Marsh Grapefruit"Si
Technical Bulletin No. 1413 ^\
Agricultural Research Service
UNITED STATES DEPARTMENT OF AGRICULTURE
o

ACKNOWLEDGMENTS
The research was conducted cooperatively by theHandling and Facilities Research Branch of theTransportation and Facilities Research Division,under the general supervision of Joseph F. Herrick,Jr., investigations leader; and the HorticulturalCrops Research Branch of the Market QualityResearch Division, under the general supervision ofPaul L. Harding, horticulturist-in-charge, Horticultural Crops Field Station, Orlando, Fla.
CONTENTSPage
Summary lIntroduction 1Investigations 2
Test fruit 2Experimental procedure 3
Analysis and results 8Effective thermal diffusivity 8Characteristic thermal conductivity of rind and
juice vesicle 15Correlations 17Temperature distribution 18
Multiple regression analysis __ 18Effect of rind on temperature distribution 21Linear regression analysis. 22Mass-average temperature 24
Conclusions 27Literature cited __ 29
Trade names are used in this publicationsolely for the purpose of providing specificinformation. Mention of a trade name does notconstitute a guarantee or warranty of theproduct by the U.S. Department of Agricultureor an endorsement by the Department overother products not mentioned.
Washington, D.C. Issued June 1970
For sale by the Superintendent of Documents, U.S. Government Printing OfficeWashington, D.C. 20402 • Price 20 cents
Thermal Properties and Heat TransfeCharacteristics of Marsh Grapefruit
By A. H. Bennett, research agricultural engineer, Transportation and FacilituResearch Division; and W. G. Chace, Jr., research horticulturist, and R. ICxtbbedge, biological technician, Market Quality Research Division, AgricultunResearch Service
SUMMARY
Investigations of the thermal properties and heat transfer charaiteristics of Marsh grapefruit were conducted on 10 test fruits froieach of five maturity groups. The harvest dates for maturity groujwere: December 1963, April 1964, October 1964, February 1965, anMay 1965. The investigations included tests to determine (1) effe«tive thermal diffusivity of the whole fruit, (2) thermal conductivilof the rind and juice-vesicle components, (3) moisture conten(4) specific gravity, and (5) internal-temperature response—fundimental to response at specified conditions.
Of the properties measured, significant relations were found betweerind thickness, moisture content of both rind and juice vesiclethermal conductivity of both rind and juice vesicles, and specifgravity. By visual inspection these properties also appear to correla-with harvest season. As the harvest season is extended, the fruripens. During the ripening process, the fruit becomes more densits rind becomes thinner, and the rind moisture content decreaseThese changes are consistent with a measured increase in effecththermal diffusivity as the fruit ripens. However, cooling rate is n<significantly affected by differences in the maturing and ripenirof the fruit.
INTRODUCTION
Refrigeration is the basic means for postharvest protection again;decay and deterioration of horticultural crops. The extraction <heat from these living biological products slows their respiratoiactivity, reduces water loss, decreases the chance of invasion of nedecay, and inhibits or slows the growth of incipient infections. Tloptimum rate and magnitude of heat extraction vary dependirupon the physiological nature of the product. Some products a:more perishable thanothers; thus they need to becooled more rapidl;Marsh grapefruit, for example, differs from other citrus fruits in iphysiological response to temperature. It also responds different,at various stages of maturity. In tests with Marsh Seedless arRuby Red grapefruit, Chace and coworkers (3) found that the modesirable transit temperature for early-harvested fruit was 60° ]More mature midseason and late-season fruit kept best in transat 50°. Their findings, substantiated by an abundance of previoi
TECHNICAL BULLETIN NO. 1413, U.S. DEPT. OF AGRICULTURE
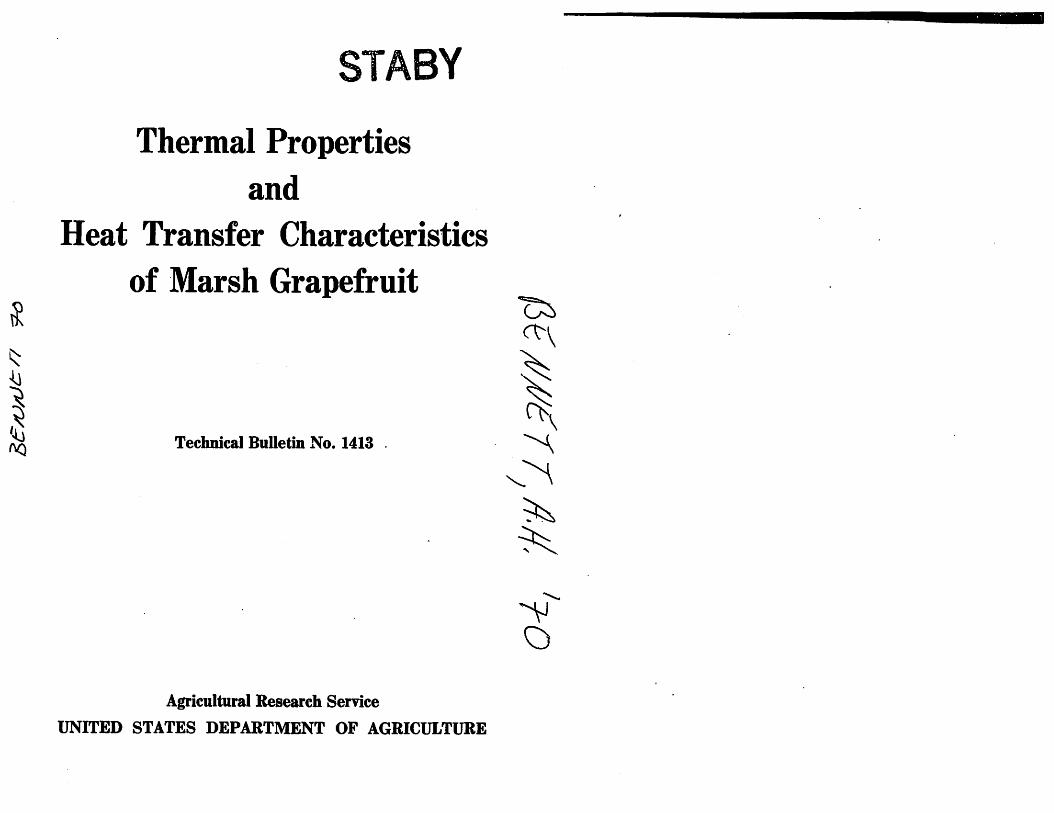
research cited in their report, point out the need for postharvest,preshipment conditioning commensurate with the particular fruitrequirements.
In a 1958 report on hydrocooling Florida citrus, Grierson andHayward (4) stated that—
"The increasing use of automated methods, combined with thedanger from such endemic post-harvest diseases as stem-end rotand Penicillium mold, make the use of such packing methodshazardous unless efficient refrigeration, post-harvest fungicides,or a combination of these two protective methods is used."
They further reported finding increased susceptibility to decay andrind injury on hydrocooled fruit. Yet, precooling, whether throughhydrocooling or through the use of an air-cooling system, is one ofthe essential means of conditioning fruit in preparation for shipment.Precooling implies rapid heat removal, which may be done at thepackinghouse in bulk, in pallet boxes, or in shipping containers.Generally it is done before shipment. Sometimes it is done after thefruit has been loaded into trucks or railcars. Either way, optimumprecooling, i.e., the removal of a specified predetermined quantityof heat in a given period of time, depends upon knowledge of thethermal properties and characteristics of the fruit in question. Thisbasic information will benefit the citrus industry in that it willeventually lead to the development of more efficient andeffective precooling systems.
Published values of thermal properties of grapefruit, reviewed byBennett (1), are inconclusive and questionable. Smith and coworkers(10) and Perry and coworkers (6) reported values of thermal diffusivity of Marsh grapefruit that are accepted by the authors to beaccurate, and they are therefore compared with the results of thework reported herein.
This research was conducted to evaluate the basic heat transferproperties and characteristics of Marsh grapefruit and to investigatethe possible relation of these properties to moisture content, density,and harvest season. Specifically, the research was designed to yieldthe following data:
1. Experimental temperature distribution.2. Effective thermal diffusivity.3. Thermal conductivity of the rind and juice vesicles.4. Moisture content of the rind and juice vesicles.5. Specific gravity of the whole fruit.6. Correlations of the foregoing with seasonal effects.
INVESTIGATIONS
Test Fruit
Samples of Marsh grapefruit were harvested in December 1963,in April and October 1964, and in February and May 1965, fromcommercial groves in Indian River County, Fla. Five maturitygroups, numbers 1 through 5, referred to hereinafter chronologically,correspond with the foregoing harvest dates. Ten test runs were
THERMAL CHARACTERISTICS OF MARSH GRAPEFRUIT I
made for each maturity group on the basis of expected experimentavariation of runs within a group.
The fruit was washed and waxed with a solvent-type wax t<prevent loss of moisture during the short storage period before testingStorage was at 50° F.
Experimental Procedure
Each test fruit was weighed and its diameter measured at severaradial points in both the equatorial and polar planes. The fruit wabrought to a uniform temperature of 85° F., and then it was immerseiin an agitated water bath held at a constant temperature of approximately 35°. Fruit temperature was measured at #-inch intervalalong the radius in the equatorial plane by means of a thermal probconstructed of 36 a.w.g. (American wire gage) copper-constantaithermocouple wire connected to a 24-point recording potentiometeiThe probe consisted of 12 individual thermocouples and was osufficient length to permit insertion along the entire length of thdiameter. This procedure compensated for conduction error, becausthe heat of conduction along the wire tended to flow in an oppositdirection from that of the heat flux in the fruit. Surface temperaturand temperature just beneath the rind were measured with individual thermocouples (fig. 1). The test fruit was cooled to a centetemperature of approximately 40°, removed from the water bath
BN-330:
Figure 1.—Thermal probe positioned in test fruit. Note thermocouple to measurtemperature at interface between rind and juice vesicle.

4 TECHNICAL BULLETIN NO. 1413, U.S. DEPT. OF AGRICULTURE
and reweighed for further tests. The test apparatus is shown infigure 2.
Specific gravity was measured by the water-displacement technique.Thermal conductivity and moisture content of the rind and the juicevesicle were measured from samples of each specimen.
The moisture content was measured by weighing the sample,extracting the water in a vacuum oven at 140° F. for 48 hours, thenweighing the residual solids. Percentage moisture content was calculated on the basis of the wet weight of the sample.
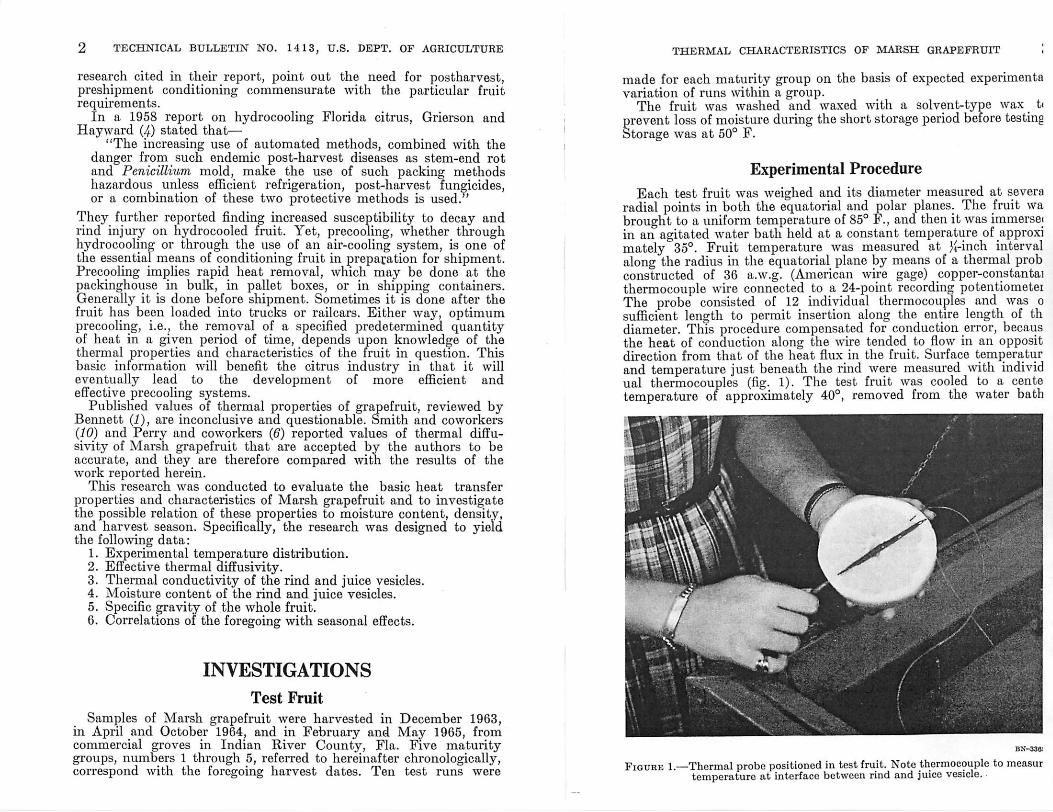
The thermal conductivity was measured by use of an adaptation ofthe Fitch method (fig. 3) for measuring thermal conductivity of poorconductors. Equipment used included the adapted test unit, sensitivetemperature controller, stopwatch, agitator, low-resistance micro-ammeter, laboratory potentiometer, micrometer (fig. 4), and pressuremeter (fig. 5). The experimental technique of Bennett and coworkers(2) was used.
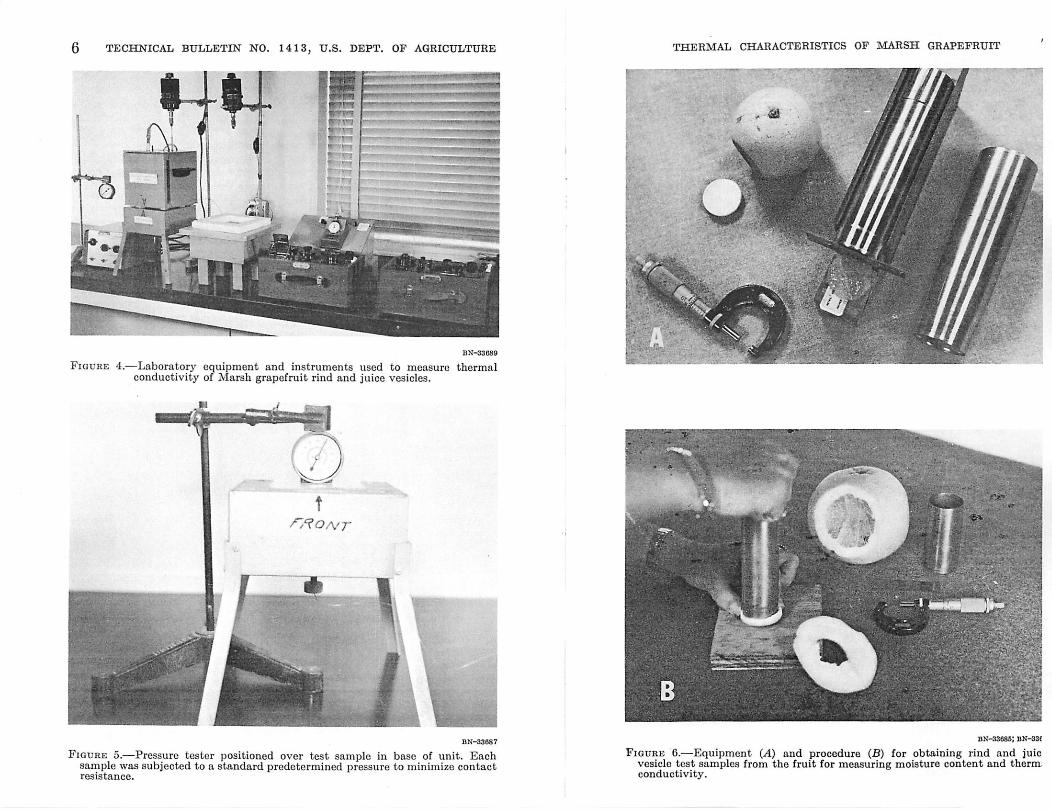
Testspecimens were removed from thefruit by use of a sharp-edged,hollow, stainless steel tube (fig. 6) having an inside diameter of 1.25inches. The sample was cut to the same diameter as the heat sink toeliminate the possibility of heat energy radiating to the sink from theplate. Sample pressure was held standard at 1 p.s.i. (pound persquareinch) for the rind and 0.5 p.s.i. for the juice vesicles. Juice-vesiclesamples were wrapped in thin polyethylene to reduce moistureevaporation and juice losses.
Rind thickness was obtained from an average of nine micrometerreadings taken before and after each run (fig. 7). An average of fivemeasurements was used for juice-vesicle thickness.
Figure 2.—Equipment for evaluating temperature distribution and effectivethermal diffusivity of Marsh grapefruit.
THERMAL CHARACTERISTICS OF MARSH GRAPEFRUIT
COPPER HEAT SINK
COPPER PLATE >£HEAT SOURCE _
THERMOCOUPLE
JUNCTION
ADJUSTABLE COPPERHEAT SINK
INSULATION
COPPER WIRE
CONSTANTAN WIRE
-TEST MATERIAL
1MICROAMMETEF
TEMPERATURE CONTROLLER
INSULATION
COPPER WIRE
MICROAMMETER
Figure 3.—Schematic cross-section of the standard Cenco-Fitch test unit Imeasuring thermal conductivity of poor conductors (above) and the adapttest unit (below).
6 TECHNICAL BULLETIN NO. 1413, U.S. DEPT. OF AGRICULTURE
BN-33089
Figure 4.—Laboratory equipment and instruments used to measure thermalconductivity of Marsh grapefruit rind and juice vesicles.
to**.,1 I
Figure 5.—Pressure tester positioned over test sample in base of unit. Eachsample was subjected to a standard predetermined pressure to minimize contactresistance.
THERMAL CHARACTERISTICS OF MARSH GRAPEFRUIT
Hnmmnmte.
BK-33685; BN-33f
Figure 6.—Equipment (A) and procedure (B) for obtaining rind and juicvesicle test samples from the fruit for measuring moisture content and thermconductivity.
8 TECHNICAL BULLETIN NO. 1413, U.S. DEPT. OF AGRICULTURE
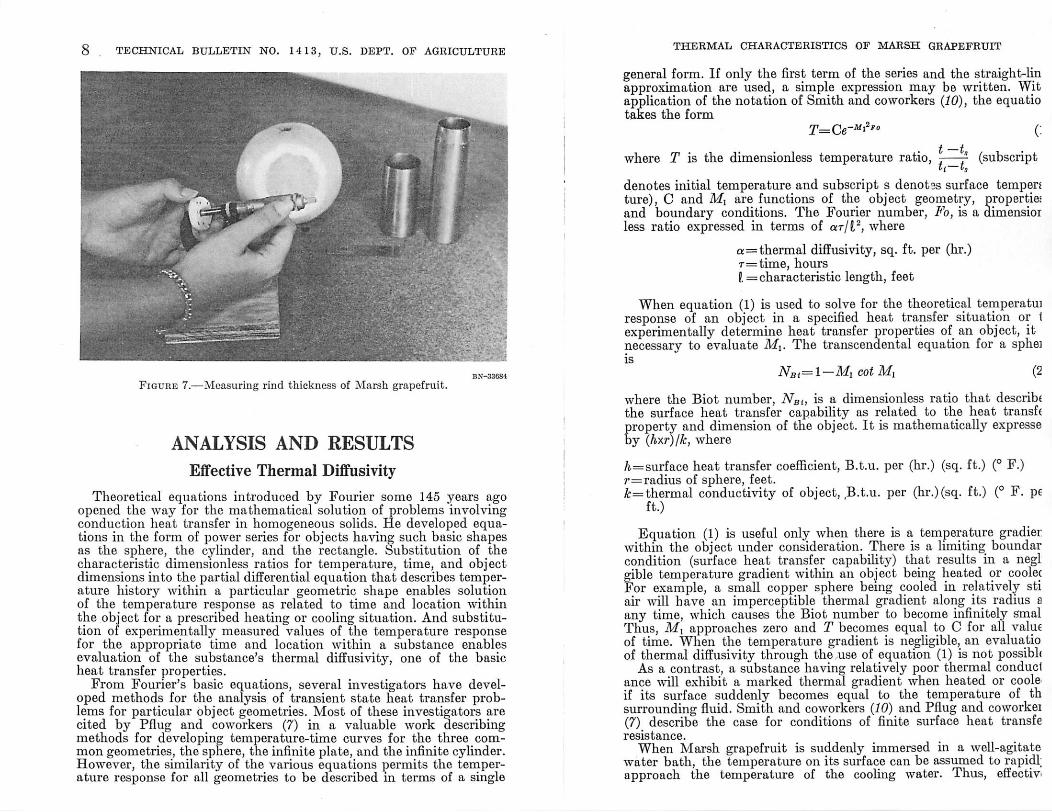
Figure 7.—Measuring rind thickness of Marsh grapefruit.
ANALYSIS AND RESULTS
Effective Thermal Diffusivity
Theoretical equations introduced by Fourier some 145 years agoopened the way for the mathematical solution of problems involvingconduction heat transfer in homogeneous solids. He developed equations in the form of power series for objects having such basic shapesas the sphere, the cylinder, and the rectangle. Substitution of thecharacteristic dimensionless ratios for temperature, time, and objectdimensions into the partial differential equation that describes temperature history within a particular geometric shape enables solutionof the temperature response as related to time and location withinthe object for a prescribed heating or cooling situation. And substitution of experimentally measured values of the temperature responsefor the appropriate time and location within a substance enablesevaluation of the substance's thermal diffusivity, one of the basicheat transfer properties.
From Fourier's basic equations, several investigators have developed methods for the analysis of transient state heat transfer problems for particular object geometries. Most of these investigators arecited by Pflug and coworkers (7) in a valuable work describingmethods for developing temperature-time curves for the three common geometries, the sphere, the infinite plate, and the infinite cylinder.However, the similarity of the various equations permits the temperature response for all geometries to be described in terms of a single
THERMAL CHARACTERISTICS OF MARSH GRAPEFRUIT
general form. If only the first term of the series and the straight-linapproximation are used, a simple expression may be written. Witapplication of the notation of Smith and coworkers (10), the equatiotakes the form
T=Ce-M^F0 (:
where T is the dimensionless temperature ratio,t—t,
tt-ts(subscript
denotes initial temperature and subscript s denotss surface temper*ture), C and Mx are functions of the object geometry, propertiesand boundary conditions. The Fourier number, Fo, is a dimensiorless ratio expressed in terms of ar/l2, where
a = thermal diffusivity, sq. ft. per (hr.)T=time, hoursI = characteristic length, feet
When equation (1) is used to solve for the theoretical temperatuiresponse of an object in a specified heat transfer situation or 1experimentally determine heat transfer properties of an object, itnecessary to evaluate M\. The transcendental equation for a spheiis
Ns^l-M, cot Mt (2
where the Biot number, NBt, is a dimensionless ratio that describethe surface heat transfer capability as related to the heat transfeproperty and dimension of the object. It is mathematically expresseby (hxr)/k, where
&=surface heat transfer coefficient, B.t.u. per (hr.) (sq. ft.) (° F.)r= radius of sphere, feet.k= thermal conductivity of object, B.t.u. per (hr.)(sq. ft.) (° F. pe
ft.)
Equation (1) is useful only when there is a temperature gradierwithin the object under consideration. There is a limiting boundarcondition (surface heat transfer capability) that results in a neglgible temperature gradient within an object being heated or coolecFor example, a small copper sphere being cooled in relatively stiair will have an imperceptible thermal gradient along its radius aany time, which causes the Biot number to become infinitely smalThus, M, approaches zero and T becomes equal to C for all valueof time. When the temperature gradient is negligible, an evaluatioof thermal diffusivity through the use of equation (1) is not possible
As a contrast, a substance having relatively poor thermal conduclance will exhibit a marked thermal gradient when heated or cooleif its surface suddenly becomes equal to the temperature of thsurrounding fluid. Smith and coworkers (10) and Pflug and coworkei(7) describe the case for conditions of finite surface heat transferesistance.
When Marsh grapefruit is suddenly immersed in a well-agitatewater bath, the temperature on its surface can be assumed to rapidl;approach the temperature of the cooling water. Thus, effectiv
10 TECHNICAL BULLETIN NO. 1413, U.S. DEPT. OF AGRICULTURE
thermal diffusivity can be evaluated on the basis of fruit temperatureresponse. Because of the finite heat transfer resistance at the surface,the reciprocal of the Biot number is so small it can be neglected.However, acurate evaluation by the conventional method requires notonly that specified boundary conditions be rigidly adhered to but alsothat the substance be homogeneous and that it conform to one ofthe conventional object geometries.
Whereas, for Marsh grapefruit, the specified boundary conditionscan be easily satisfied, the requirement for homogeneity and objectgeometry is more difficult to satisfy. Actually, Marsh grapefruit iscomposed of constituency having widely varying properties andphysical structure. In these evaluations, it must therefore be considered as a pseudohomogeneous material. In addition, it is shapedas an oblate spheroid. Failure to account for its departure fromsphericity causes an error that is proportional to the magnitude ofdeparture. Normally the equatorial diameter of Marsh grapefruitis 10 to 15 percent larger than the polar diameter. Therefore, themore accurate evaluation of effective thermal diffusivity of Marshgrapefruit is made by conceding its pseudohomogeneous compositionand by making the necessary geometry correction.
Smith and coworkers (10) developed a technique of evaluatingthermal diffusivity that corrects for deviation from the conventionalshapes. The technique incorporates a geometry index, 6, into thebasic Fourier equation for a sphere. The geometry index was obtained"from a measure of two orthogonal areas of the shape." Use of thistechnique provides a means for a more accurate evaluation of effective thermal diffusivity of Marsh grapefruit than has previously beenavailable. It is a significant breakthrough for investigators of thermalproperties of biological materials having anomalous geometries.The equation, as presented by Smith and coworkers, is
a=M2L Ti—T2 J (3)
The ratio of the differences, InT vs. t, is the slope, 0, of the coolingcurve for the corresponding time interval, or
InTx—lnT*0=
Tl—T2
Therefore, the equation may be written
a=MS
(4)
(5)
When Marsh grapefruit is cooled in an agitated water bath, thesurface heat transfer resistance is negligible. Hence,
Ml2=Qir2. (6)
From 13 test runs, Smith and coworkers (10) measured an averagethermal diffusivity of 3.63 X10~3 sq. ft. per hr. for Marsh grapefruit.
THERMAL CHARACTERISTICS OF MARSH GRAPEFRUIT 1
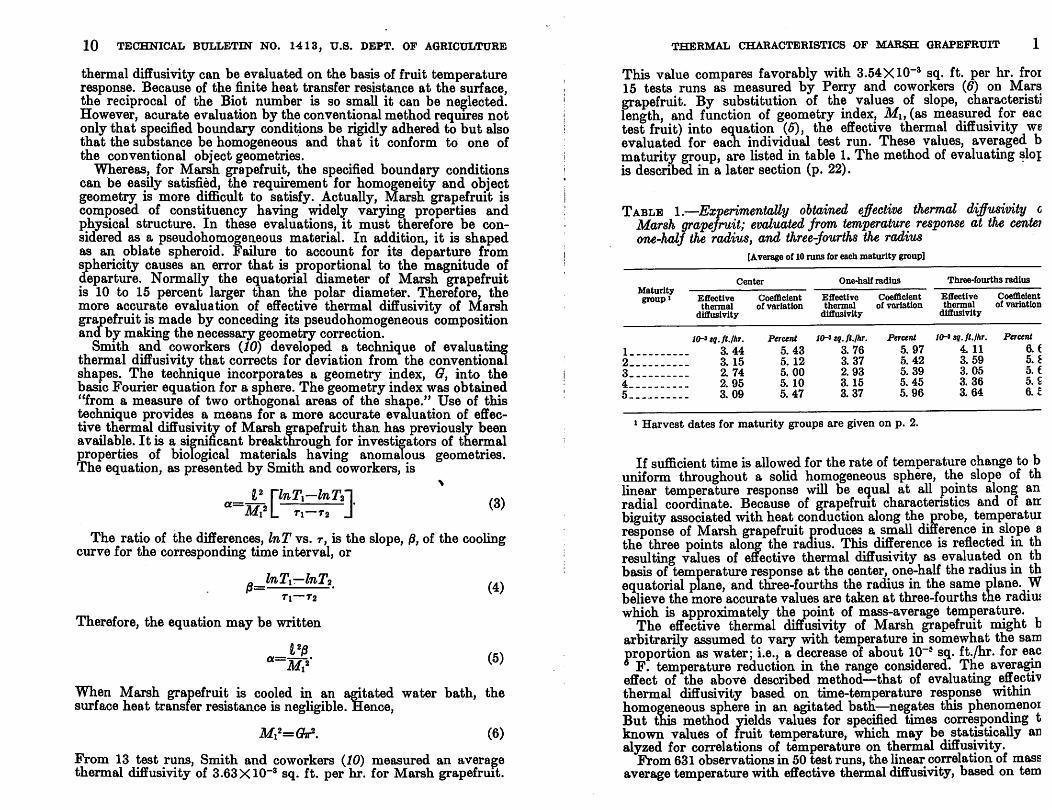
This value compares favorably with 3.54X10"3 sq. ft. per hr. froi15 tests runs as measured by Perry and coworkers (6) on Marsgrapefruit. By substitution of the values of slope, characteristilength, and function of geometry index, Mu (as measured for eactest fruit) into equation (5), the effective thermal diffusivity weevaluated for each individual test run. These values, averaged bmaturity group, are listed in table 1.The method of evaluating slojis described in a later section (p. 22).
Table 1.—Experimentally obtained effective thermal diffusivity cMarsh grapefruit; evaluated from temperature response at the centerone-half the radius, and three-fourths the radius
[Averageof 10runs foreachmaturity group]
MaturityCenter One-half radius Three-fourths radius
Effective Coefficient Effective Coefficient Effective Coefficient
thermal of variation thermal of variation thermal of variation
diffusivity diffusivity diffusivity
10-*tq.ft.lhr. Percent 10-itq.fl.lhr. Percent l0-*sq.ft./hr. Percent
1 3.44 5.43 3.76 5.97 4.11 6.C
?, 3.15 5. 12 3.37 5.42 3.59 5. 1
3 2.74 5.00 2.93 5.39 3.05 5. e
4 2.95 5. 10 3.15 5.45 3.36 5. €
5 3.09 5.47 3.37 5.96 3.64 6.1
1 Harvest dates for maturity groups are given on p. 2.
If sufficient time is allowedfor the rate of temperature change to buniform throughout a solid homogeneous sphere, the slope of thlinear temperature response will be equal at all points along anradial coordinate. Because of grapefruit characteristics and of arcbiguity associated with heat conduction along the probe, temperatuiresponse of Marsh grapefruit produces a small difference in slope athe three points along the radius. This difference is reflected in thresulting values of effective thermal diffusivity as evaluated on thbasis of temperature response at the center, one-half the radius in thequatorial plane, and three-fourths the radius in the same plane. Wbelieve the more accurate values are taken at three-fourths the radiuswhich is approximately the point of mass-average temperature.
The effective thermal diffusivity of Marsh grapefruit might barbitrarily assumed to vary with temperature in somewhat the samproportion as water; i.e., a decrease of about 10~5 sq. ft./hr. for eacs F. temperature reduction in the range considered. The averagineffect of the above described method—that of evaluating effectrvthermal diffusivity based on time-temperature response withinhomogeneous sphere in an agitated bath—negates this phenomenoiBut this method yields values for specified times corresponding tknown values of fruit temperature, which may be statistically analyzed for correlations of temperature on thermal diffusivity.
From 631 observations in 50 test runs, the linear correlation of massaverage temperature with effective thermaldiffusivity, based on tem
12 TECHNICAL BULLETIN NO. 1413, U.S. DEPT. OF AGRICULTURE
perature response at the center, was found to be
<=-7.42+13592.24a. (7)
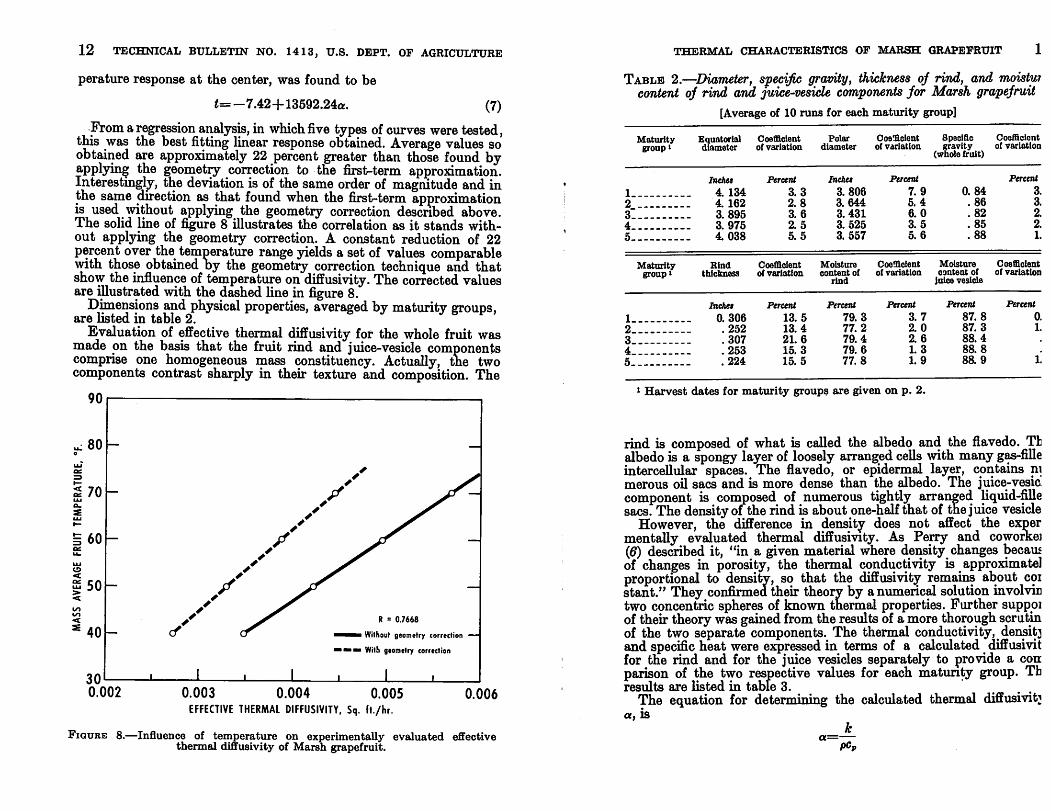
Froma regression analysis, in which five types ofcurves were tested,this was the best fitting linear response obtained. Average values soobtained are approximately 22 percent greater than those found byapplying the geometry correction to the first-term approximation.Interestingly, the deviation is of the same orderof magnitude and inthe same direction as that found when the first-term approximationis used without applying the geometry correction described above.The solid line of figure 8 illustrates the correlation as it stands without applying the geometry correction. A constant reduction of 22percent over the temperature range yields a set of values comparablewith those obtained by the geometry correction technique and thatshow the influence of temperatureon diffusivity. The corrected valuesare illustrated with the dashed line in figure 8.
Dimensions and physical properties, averaged by maturity groups,are listed in table 2.
Evaluation of effective thermal diffusivity for the whole fruit wasmade on the basis that the fruit rind and juice-vesicle componentscomprise one homogeneous mass constituency. Actually, tne twocomponents contrast sharply in their texture and composition. The
90
«;80o
UJ
as
=>
2 70LU
a.
£UJ
*60
50
40
30"—0.002
R = 0.7668
^^^m Without geometry correction
™""« With giometry correction
0.003 0.004 0.005EFFECTIVE THERMAL DIFFUSIVITY, Sq. ft./hr.
0.006
Figure 8.—Influence of temperature on experimentally evaluated effectivethermal diffusivity of Marsh grapefruit.
THERMAL CHARACTERISTICS OP MARSH GRAPEFRUIT 1
Table 2.—Diameter, specific gravity, thickness of rind, and moisturcontent of rind and juice-vesicle components for Marsh grapefruit
[Average of 10 runs for each maturity group]
Maturitygroup'
Equatorial Coefficient Polar Coefficient Specific Coefficientdiameter of variation diameter of variation gravity of variation
(whole fruit)
Inches Percent Inches Percent Percent
1 4. 134 3.3 3.806 7.9 0.84 3.
2 4. 162 2.8 3.644 5.4 .86 3.
3 3.895 3.6 3.431 6.0 .82 2.
4_ 3. 975 2.5 3.525 3.5 .85 2.
5 4.038 5.5 3.557 5.6 .88 1.
Maturitygroup1
Bind Coefficient Moisture Coefficient Moisture Coefficientthickness of variation content of of variation content of of variation
rind Juice vesicle
Inches Percent Percent Percent Percent Percent
1 0.306 13.5 79.3 3.7 87.8 0.
2__ -__ .252 13.4 77.2 2.0 87.3 1.
3 .307 21.6 79.4 2.6 8& 4
4_._ _- .253 15.3 79.6 1.3 88.8
5._ — .224 15.5 77.8 1.9 88.9 1.
1 Harvest dates for maturity groups are given on p. 2.
rind is composed of what is called the albedo and the flavedo. Thalbedo is a spongy layer of loosely arranged cells with many gas-filleintercellular spaces. The flavedo, or epidermal layer, contains nimerous oil sacs and is more dense than the albedo. The juice-vesic.component is composed of numerous tightly arranged liquid-fillesacs.The densityof the rind is about one-half that of thejuice vesicle
However, the difference in density does not affect the expermentally evaluated thermal diffusivity. As Perry and coworkei(6) described it, "in a given material where density changes becausof changes in porosity, the thermal conductivity is approximate!proportional to density, so that the diffusivity remains about coistant." They confirmed their theory by a numerical solution involvirjtwo concentric spheres of known thermal properties. Further suppoiof their theory wasgainedfrom the results of a more thoroughscrutinof the two separate components. The thermal conductivity, densityand specific heat were expressed in terms of a calculated diffusivitfor the rind and for the juice vesicles separately to provide a conparison of the two respective values for each maturity group. Thresults are listed in table 3.
The equation for determining the calculated thermal diffusivit}a, is
a=-
f>Cp
14 TECHNICAL BULLETIN NO. 1413, U.S. DEPT. OF AGRICULTURE
where
k=thermal conductivity, B.t.u. per (hr.) (sq.ft.) (° F. per ft.)p=density of substance, lbs. per (cu. ft.)
Cp=specific heat of substance, B.t.u. per (lb.) (° F.)
Specific heat data were calculated from Siebel's equation1 on thebasis of moisture-content data reported in table 2. Densityvalues were obtained by Otto Jahn,2 during the 1964-65 season, fromfruit other than that used in this work. Thermal-conductivity datawere experimentally evaluated as described later (p. 15).
The similarity in thermal diffusivity of the rind and juice-vesiclecomponents calculated by equation (8) substantiates the logic ofPerry and coworkers (6). Values so obtained are noticeably largerthan those reported in table 1. This difference may be attributableto the influence of temperature on thermal diffusivity; it may be theresult of convection heat transfer in the rind and juice-vesicle samplesduring thermal-conductivity tests; or possibly it may be the resultof both. Table 1 values are based on measurements taken at an average temperature of approximately 55° F. Table 3 values are basedon measurements taken at logarithmic mean temperature of 80° forthe rind and 88°for the juice vesicle. Temperature effectis seen in figure6. The texture and moisture content of the specimen is such that thermally induced fluid movement within the intercellular spaces of therind and within each individual juice vesicle sac can be significant.The high temperature gradient across the sample is certain to inducesome fluid movement. Consequently the convection component couldcause the values to be larger than they would be if heat transferwere by conduction only.
Table 3.—Specific heat, density, and calculated thermal diffusivityof the rind andjuice-vesicle components of Marsh grapefruit
Maturity group'
Specific heat,'B.t.u./lb./°F.
Density,* lb./cu. ft. Thermal diffusivity,*10-» sq. ft./hr.
Bind Juicevesicle
Rind Juicevesicle
Rind
1 0.835 0.901 35.1 63.4 4.802 .818 .898 36.1 63.3 4.653 .835 .906 35.2 63.7 4.754 .837 .910 35.6 62.9 4.795 .822 .911 38.7 62.7 4.34
1Harvest dates for the maturity groups are given on p. 2.2Based upon average of 10 runs within each maturity group.3 Personal communication from Otto Jahn.*Calculated from experimentally obtained thermal conductivity.
1 cp= 0.008 X percent moisture content +0.20.2 Personal communication.
Juicevesicle
4.504.944.954.944.45
THERMAL CHARACTERISTICS OP MARSH GRAPEFRUIT 1
Characteristic Thermal Conductivity of Rind and JuiceVesicle
Characteristic thermal conductivity for the rind and juice-vesiclcomponents was evaluated by use of the equation
4—2 (t
where the constant, O, is a measure of the heat-retaining capacit-of the copper sink that is located in the base of the Cenco-Fitc)apparatus. It has a value of 3.3 B.t.u. per (sq. ft.) (° F.). The slope6, is the coefficient of linear regression of time (hours) on a functioiof the temperature difference between the heat source (upper coppeplate) and the heat sink. Test specimen thickness, L, is expressed iiinches. A more thorough description of the experimental and analytical procedure used may be found in the report of Bennett and coworkers (2). The results, shown as averages by maturity groups, arlisted in table 4.
Table 4.—Measured values of characteristic thermal conductivity, kfor the rind and juice-vesicles components of Marsh grapefruit
[Average of 10 runs for each maturity group]
Maturity group'Rind thermal Coe'ncient Juice-vesicle Coefficientconductivity of variation thermal of variation
conductivity
B.t.u. per (hr.)(sq.ft.)(° F.
perft.)1 0. 14122 . 13713 . 13984 . 14265 1379
lent
11.9
B.t.u. per (hr.)(sq.ft.)("F.
perft.)0. 2562
Percent
9.13.1 .2810 6.6.5 .2848 5.9.6 .2822 9.7.9 .2539 4.
1Harvest dates for maturity groups are given on p. 2.
Because of the conditions discussed in the preceding section, tcsimply call these values "thermal conductivity" would be a misnomer. Instead, it seems appropriate to use the term "characteristicthermal conductivity" to describe the heat transfer property obtainedby the foregoing procedure.
Values of thermal conductivity, specific heat, and density thaicharacterize the total mass constituency are needed for computationof an apparent value of thermal diffusivity for the whole Marshgrapefruit by use of equation (8). Such values would not be accurate
ut they would provide a characteristic measure of the respectiveproperties of the combined components. For this purpose, an apparentthermal conductivity for the whole fruit is calculated by utilizing themeasured values obtained for the separate components. If the juice-vesicle and rind sections are assumed to be two hollow concentric
16 TECHNICAL BULLETIN NO. 1413, U.S. DEPT. OF AGRICULTURE
spheres (fig. 6), the total resistance toheat transfer is
al=0i2+«23 (10)
where, resistance through the juice vesicles is
(n—rx)
through the rind isAurk&rfo
(n—r2)1*23=
4ir&2sr2'*3
and through both the juice vesicles and the rind is
G,=fa-ri)
4akavvT\Tz
(11)
(12)
(13)
Equations (11), (12), and (13) can be combined and simplified to
_ fri2 fraa^fa—T\)apv knr^n-rd+hzrfa-ri)
(14)
This technique is valid and is widely used for computing a smglefactor that denotes the heat transfer characteristic of a heterogeneousmass constituency consisting of several adjoining layers of differentmaterials. Examination of values of apparent thermal conductivity,(table 5) indicates that the effect of the rind is almost negligible. Asignificant bias in favor of the juice-vesicle component is evident.When this factor is used in equation (8) to compute apparent thermaldiffusivity, the inherent bias is reflected in the results.
The product of specific heat and density is a single factor thatdenotes the heat capacity per unit volume of a substance. Valuesgiven in table 5 represent the sum of partial capacities of the rindand juice-vesicle components based upon proportionate volumes oftest fruit. The rind of Marsh grapefruit constitutes 30 to 40 percent
Table 5.—Calculated values of apparent thermal conductivity and apparent thermal diffusivity for the whole Marsh grapefruit, based onmeasured thermal conductivity for the rind and juice-reside components
Maturity group' Heat capacityApparentthermal
conductivity
B.t.u.lcu.ft.r F. B.t.v..lhr.ft.l° F.1 46.0 0. 25132~~ . 45.8 .2755
^ 45 g .2768
4 "I:::::::::::. 47.6 .27545™""!""""" 49-2 -2502
1 Harvest dates for the maturity groups are given on p. 2.
Apparentthermal
diffusivity
THERMAL CHARACTERISTICS OF MARSH GRAPEFRUIT 1
of its total volume. Its unit heat capacity is about half that of tljuice vesicle and, therefore, is only 20 to 25 percent of the tot*Consequently, the weighted heat capacity of Marsh grapefruitapproximately 20 percent less than it would be if the effect of tlrind were neglected. Specific heat and density (table 3) were usefor the weighted computations.
Apparent thermal diffusivity values reported in table 5 are 37percent greater than those reported in table 1. Part of this discrepancmay be attributed to the reasons explained in the preceding sectk(p. 14). However, most of the error seems to be caused by the bi;introduced through use of apparent thermal conductivity in relaticto weighted heat capacity. If specific heat and density for the whograpefruit are used as a basis for computing apparent thermal difusivity, the results are comparable with those reported in table .Hence, the error probably is a product of bias attributable to tltechnique used for obtaining the results.
Correlations
Statistical analysesweremade to ascertaincorrelations, by maturitgroups and over all maturity groups, between the following variables(1) Rind thickness, (2) rind thermal conductivity, (3) juice-vesiclthermal conductivity, (4) effective thermal diffusivity, (5) rinmoisture content, (6) juice-vesicle moisture content, and (7) specifigravity. An analysis of all possible correlations over all maturitgroups revealed five statistically significant correlations. In additiorfour other relations reflected a strong tendency to correlate, buthese were not significant at the 5-percent level of probability. (Sefollowing tabulation.)
CorrtlatiOf,r . ,, , . coefficientsVariable correlation: » (r)»
Rind thickness on specific gravity _ —0. 782Rind moisture content on specific gravity —. 591Rind thickness on rind moisture content . 486Rind moisture content on juice-vesicle moisture content 405Thermal conductivity of juice vesicleon specific gravity —. 304Thermal conductivity of rind on juice-vesicle moisture content . 264Thermal conductivity of rind on rind thickness ___ —. 255Thermal conductivity of rind on rind moisture content . 200Rind thickness on fruit size . 199
1 All maturity groups combined.2 Critical value of r, 5-percent level, 0.273.
From these correlations a considerable interaction between rin<thickness, moisture content of the rind and juice vesicle, thermaconductivity of the rind and juice vesicle, and specific gravity inoted, with the specific gravity having the greatest influence. However, when maturity groups are considered separately, measureceffective thermal diffusivity is found to correlate directlywith specifiigravity and inversely with rind thickness (table 6). In the absence oa clarifying explanation, the seemingly wayward results of maturitygroup 5 must be attributed to experimental error.
18 TECHNICAL BULLETIN NO. 1413, U.S. DEPT. OF AGRICULTURE
Table 6.—Correlation of measured effective thermal diffusivity onspecific gravity and rind thickness for Marsh grapefruit by maturitygroups
Maturity group'
Correlation coefficients (r) *
Thermal Thermaldiffusivity on diffusivity on
specificgravity rind thickness
, ... 0.5218 -0.3814J ... .6339 -.46902 -- 7Q14 -.55986 8295 -.6084f -.1436 .4290
1Harvest dates for the maturity groups are given on p. 2.2Critical value of r, 5-percent level, 0.602.
Another interesting result of this investigation of correlations isthe effect of harvest date on certain of the physical properties. Ihiseffect was not evaluated statistically, but it is apparent from thedata given in table 2. Results ndicate that as the harvest seasonadvances the fruit becomes more dense, its rind becomes thinner,and the moisture content of the rind decreases. Harvest date apparently did not affect moisture content of the juice vesicles. A notabletendency for measured effective thermal diffusivity to correlate withharvest date if maturity group 1 is omitted from consideration(table 1) This omission is considered valid because of experimentalerror encountered in maturity group 1, which caused the valuesto be significantly larger than those in the other four groups.
Temperature Distribution
Multiple regression analysisAs described under "Experimental Procedure," the temperature his
tory of each test fruit was measured at ^-inch intervalsi along theradiusin the equatorial plane. The multiple regression technique of curvefitting was used to compute polynomial coefficients that expresstemperature distribution within the fruit as related to time for eachmaturity group. The model for the prediction equation is of the form
Y^a+blxl-\-b2z2+bzXi2+bixi2+b5xla+b6X23+bjXlX2
where, in this example,
F=the dimensionless temperature variable3i=timeo^=position in the fruita=intercept
ot to 67=constant coefficients
when the temperature and position variables are expressed as nor-
THERMAL CHARACTERISTICS OF MARSH GRAPEFRUIT 1
malized ratios, the resulting coefficients should be essentially equ:in all planes. Computed values for the respective maturity groujare listed in table 7. The coefficient of variation among maturitygroup means for temperature was 5.22 percent.
Temperature distribution during coohng does not differ statistical!between maturity groups or between runs within a maturity grou]Consequently, for practical application, predicted values from any (the fivegroups will adequately describe temperature distribution withiMarsh grapefruit during cooling with negligible surface heat transferesistance. Figure 9 illustrates the internal temperature distributiowithin Marsh grapefruit, initially at 85° F., being cooled in agitateice water at 35°. Data for similar curves may be calculated by sulstituting the appropriate constant coefficients into the regressioequation and solving for temperature ratio for any number of specifieconditions.
80
70
60
<
50
40
30
HOURS:
-"""-H.
^0.50
^^^
",u,'-,*«%
^0.75
^ 1.00^^.
"""«---...uM.liiiMfflii-iJI.50 %>^
—- •#,
0.2 0.4 0.6RADIUS RATIO
0.8 1.C
Figure 9.—Temperature response within a Marsh grapefruit, initially at 85° Fcooled in agitated water at 35°. Calculated from prediction equation for maturity group 4.

20TECHNICAL BULLETIN NO. 1413, U.S. DEPT. OF AGRICULTURE
i«©
o
1
3
$3 v»
I
r2>©
n
Eh
oZ
0IOOOO
e*e»eOTHco
eo co eo CO CO
i-«©»-»oot»
HHHHO
I I I I
NOOOHN(OtOOMOl
ooooo
I I I I
C4OC0 00C0COi-l00U3O»mr-f-oocsilOHOOCQ
^ r f f fCOt»COOCO
oeot^mcoCO CO CO ^ ^
©• • •
cotooOHcaC0»-t»O'-'«O>*^Tj«iOCO
<f r i" f rHonooo
(0CQOHOHHHC4N
^ to COIs* ^t*cs c* o» ci e>«
rH CM CO •* »«
M
THERMAL CHARACTERISTICS OF MARSH GRAPEFRUIT 2
Cooling curves plotted from prediction data do not precisely coiform to actual temperature distribution patterns. The curve-fittiranalysis is an approximating procedure; nence, small irregularitiewhether actually present or experimentally induced, are not show]From figure 9it appears that the temperature distribution from centito surface is smooth, with no sudden change in gradient between tljuice-vesicle and rind components. Actually, because of the relateresistance of heat transfer, there is a noticeable change in gradient ithe interface between the two components. This phenomenon is dicussed in the following section.
Effect of rind on temperature distributionFindings reported in earlier sections have shown that the thr<
Marsh grapefruit rind properties, (1) thermal conductivity, (!specific heat, and (3) density, are not equal to the correspondirjuice-vesicle properties. Heat, during transient cooling, flows througthese two different materials, the rind and the juice vesicles, aloiradial coordinates moving from center to surface (fig. 10).
According to laws of heat transfer, it is possible to have a discoitinuity of temperature and of temperature gradient at the interfaibetween the two materials. It has been shown that the thermdiffusivityof the twocomponents is essentially equal. From Schneider"Temperature Response Charts" (8), it is seen that the temperatu:
RIND
DIRECTION OF
HEAT FLOW
JUICE VESICLES
INTERFAC
DIRECTION <
HEAT FLOW
Figure 10.—Section of Marsh grapefruit illustrating the different propertiesthe rind and juice-vesicle components and the flow of heat through the interfa>between the two components.
22 TECHNICAL BULLETIN NO. 1413, U.S. DEPT. OF AGRICULTURE
at the interface of the two adjoining materials is continuous. Therefore, there is no change inrate of heat transfer through the boundarybetween the two materials. At an instantaneous time, the heat, ayl}that leaves the juice vesicles in the direction of positive x, is equal tothe heat, dQ2, that enters the rind. When these two elemental heatquantities are equated, the equation is
^SOr**®. (15)
From table 4it is noted thatkl9*kt. Therefore to satisfy the conditionof equation (15), the temperature gradient (dtfdx), does not equal thetemperature gradient (dtfdx)2. As Grober and coworkers (5) observed"Since there is a discontinuity in k at the point considered, it followstherefore that there must also be a discontinuity in the temperaturegradient, and this is true not only for the steady state but also forthe unsteady state." . . , . , ,
The cooling of Marsh grapefruit involves unsteady state heattransfer through the juice-vesicle and rind components, bince theproperties of tnese components are different, there is a difference inthe temperature gradient between the two. There *>/he™?re> *"break" in thetemperature distribution curve at theinterface betweenthe two materials. This "break" is not noticeable when the temperature distribution is plotted from the prediction equation. However, when raw experimental data is plotted, the response is evident.This response, representing an average of 10 test runs from maturitygroup 4, is shown in figure 11.
Linear regression analysisSolution of the regression equation containing the polynomial
coefficients listed in table 7 produces a nonlinear response whenplotted on rectangular coordinates. For specified values of time anddistance ratio, a family of curves is generated. When these datapoints are plotted on semilogarithmic coordinates, the result will bea family of straight lines whose slopes are a function of time, position,product geometry, and heat transfer property. This linear responsemay also be evaluated by converting the dimensionless temperaturevariable to logarithms and computing a linear regression. 11 mere isa close "fit" of the data points to a straight line in the graphicalanalysis, the results of the two methods will be comparable; i.e.,essentially equal slopes. , ,. „.
Alinearregression of temperature as related to time—at the center,at one-half the radius, and at three-fourths the radius—was computedfor each Marsh grapefruit test run. The general form of the equationis
Y=a+PXi
where, for this application, Y is log, T, a is the intercept, and 0 isthe constant coefficient corresponding to the slope. 1he slope p isused in equation (5) for computing effective thermal diffusivity. ine
THERMAL CHARACTERISTICS OF MARSH GRAPEFRUIT 23
0.4 0.6RADIUS RATIO
Figure 11.—Internal temperature distribution in Marsh grapefruit plotted fromraw experimental data recorded during transient cooling test runs. Dotted linesshow discontinuity in temperature gradient at interface. Average of 10 testruns from maturity group 4.
intercepts and coefficients are listed in table 8 as maturity-groupmeans. The linear response of maturity group 4 is shown in figure 12.
Pflug and coworkers (7) plotted the actual product temperatureson a logarithmic scale so that the change of temperature per unitchange of time could be read directly. This procedure provides asimple and easily understood way of showing the temperature response within a product during cooling. It, however, has the disadvantage of applying to specific conditions of the product and thesurrounding fluid temperature. In practice, these conditions are
24 TECHNICAL BULLETIN NO. 1413, U.S. DEPT. OF AGRICULTURE
Table 8.—Linear temperature response parameters for Marsh grapefruitcooled in agitated ice water
[Maturitygroupmeans]
Maturity group and location ofresponse i Slope Intercept Coefficient Correlationof variation coefficient
1: a -1.23 0.29 5.44 -0.96a :"::::::: -1.35 .11 5.97 -.95ClIIIIIIII"-"---"- -1.47 -.32 6.67 -.93
2: a _ -1.17 .29 5.12 -.97A 20 542 _Q8g----:::":::::::::: _. -1.33 -.12 5. si -.98
3: a __ -1.14 .26 5.00 -.97B -1.22 .17 5.39 -.97g-------------"~~mil -1.27 -.16 5.65 -.96
4: A -1.17 .29 5.10 -.99b :::: -1.26 .19 5.45 -.99C"IIIII""I""-"" -1.34 -.14 5.94 -.97
5: A t -1.23 .28 5.47 -.96B "" II -1.34 .19 5.96 -.97C"II"I""-I""---"-— -1-46 -.15 6.55 -.95
JHarvest dates for maturity groups are given on p. 2. A, Center of fruit; B,one-half of radius; C, three-fourths of radius.
generally confined to a narrow range, and two curves of upper andlower limits may be used to encompass a band of normally expectedconditions. Temperature-time curves for specified points within thefruit may be plotted from the empirically based coefficients listed intable 7. The parameters listed in table 8 may also be used to plottemperature response at the locations shown.
Mass-average temperature
The concept of mass-average temperature is receiving increasedacceptance among engineers and scientists engaged in the design of,or research toward, development of refrigeration systems for cooling(or heating) perishable food products. This concept is particularlyimportant with rapid precooling where there is likely to be a temperature gradient from the center to the surface of the substance being
The amount of heat stored in or released from a substance in agiven time is ascertained by measuring the temperature. If the temperature throughout the substance is uniform, measurement may bemade without regard to location within the substance. If the temperature is not uniform, however, an average temperature must beused. If the gradient is linear, an average is easily obtained. Wnenthe gradient is not linear, which is usual, a mass-average tempera-
1.00.9
0.8
0.7
0.6
0.5
0.4
0.3
0.2
0.1
16 24 32 40 48 56 64
COOLING TIME, Minutes
Figure 12.—Linear temperature response of Marsh
THERMAL CHARACTERISTICS OF MARSH GRAPEFRUIT
65»r^^"^
"^
"---,. "^
"-•-.,. ^N. ^ ^
"Xf"\ X^
™^™ Cent
_ — Vi R• ••• % R(
Br
odius
"\"\
'»/»..
V.^
idius v\
8580
75
70
65
60
55
50
45
4072 80
~~i a • -x x j • * -----'Ure response of Marsh grapefruit, initially at 85° F.cooled magrtated ice water at 35°. Fruit harvested in February 1965 (maturit:
ture, based on the nonlinear temperature distribution as related totime, should be evaluated.
When Marsh grapefruit at room temperature is immersed in abath of agitated ice water, its surface temperature suddenly becomesessentially equal to the temperature of water. Initially, there is asteep temperature gradient near the surface of the fruit. As coolingprogresses, the gradient moves toward the center and diminishes asit moves inward. Eventually, the gradient vanishes. The fruit is thenat the temperature of the water throughout. This characteristicrelation of surface to internal heat transfer is discussed in the sectionon evaluation of effective thermal diffusivity. The application of thisphenomenon in the evaluation of the magnitude and location ofmass-average temperature during rapid precooling of Marsh grapefruit is described in this section. v
The method of Smith and Bennett (9) for evaluating the mass-average temperature within a substance during transient coolingmakes use of the expression for internal temperature distribution asrelated to time. By substituting specified time values into the polynomial prediction equation, they obtained a set of equations (onefor each time) that express the temperature ratio, Y(R), in termsof the radius ratio, R. The equation takes the form
Y(R) =a+bR-\-cR2+dR* (16)
26 TECHNICAL BULLETIN NO. 1413, U.S. DEPT. OF AGRICULTURE
where a b, c, and d are the constant coefficients of R.The mass-average temperature of a substance denotes a measure
of the heat contained in the substance, above some reference level,at any time during heating or cooling. The heat content of a sphere,whe7tf= 1, was expressed^ Smith and Bennett (9) in the form
KY„<2= (17)
where K is a constant for 4* pcp. By equating, this equation to anequation that expresses the same heat content in terms of the temperature distribution along the radial coordinate, they obtjuned afunction that expresses temperature ratio at the mass-average point%hXCat^ntSTt of the substance is adirect function of its volumeor mass The volume of an oblate spheroid is less than the volumeof asphere whose diameter is equal to the major axis of thef spheroidBased on the average equatorial and polar diameters of the 50 testfrutt used hi this study, the volume coefficient of Marsh grapefruits 0883 Vohime coefficient is the ratio of the volume of the averagerui specimen used in this study to the volume of a^sphere whose
diameter is equal to the equatorial diameter of the fruit, whichmeSfs that the heat content of Marsh.grapefruit is 88.3 percent thatS a corresponding sphere. Introduction of this volume coefficent°nteSonS yieWs ameasure of the heat content of an oblatespherol^whose dimensions correspond to the representative fruitof this study; that is,
^=0.883 KYma^Q 2943 %Y„ (18)
When equation (18) is equated to the expression of heat content interms of the temperature distribution along the equatorial plane ofMarsh grapefruit, the equation obtained is
FW!O=1.132a+0.8486+0.679c+0.566rf. (19)
Substitution of the above constant coefficients into equation (19)yields the solution of mass-average temperature ratio for the speckedtime. The point on the radius where this particular mass-averagetemperature occurs may be found by either graphical or analyticalsolution of equation (16). , i * n •
Application of this method for maturity group 4takes the followingprocedure: . .
Insert the appropriate polynomial coefficients from table 7 intothe model equation and solve for temperature ratio, Xm«, mterms of radius ratio, R. For a cooling time of 30 minutes (0.5hours), compute
Thus
F(#)=0.7708-0.3390E-0.0858B2-0.1548B3 (20)
a=0.7708; 6=-0.3390; c=-0.858; d=-0.1548.
THERMAL CHARACTERISTICS OF MARSH GRAPEFRUIT 2
Substitute the respective coefficients into equation (19) ansolve for Yma.Result:
Fm«=0.4391.
Problem: Initial fruit temperature is 90° F.Surface temperature during cooling is 35°.
Solution:
Y =•*• ma—
0.439190°-35°
«=59.15°F.
The point along the radius in the equatorial plane where th:mass-average temperature occurs can be found by substitutinthe value obtained for Fma into Y(R) of equation (20) ansolving for R. The result is
#=0.699.
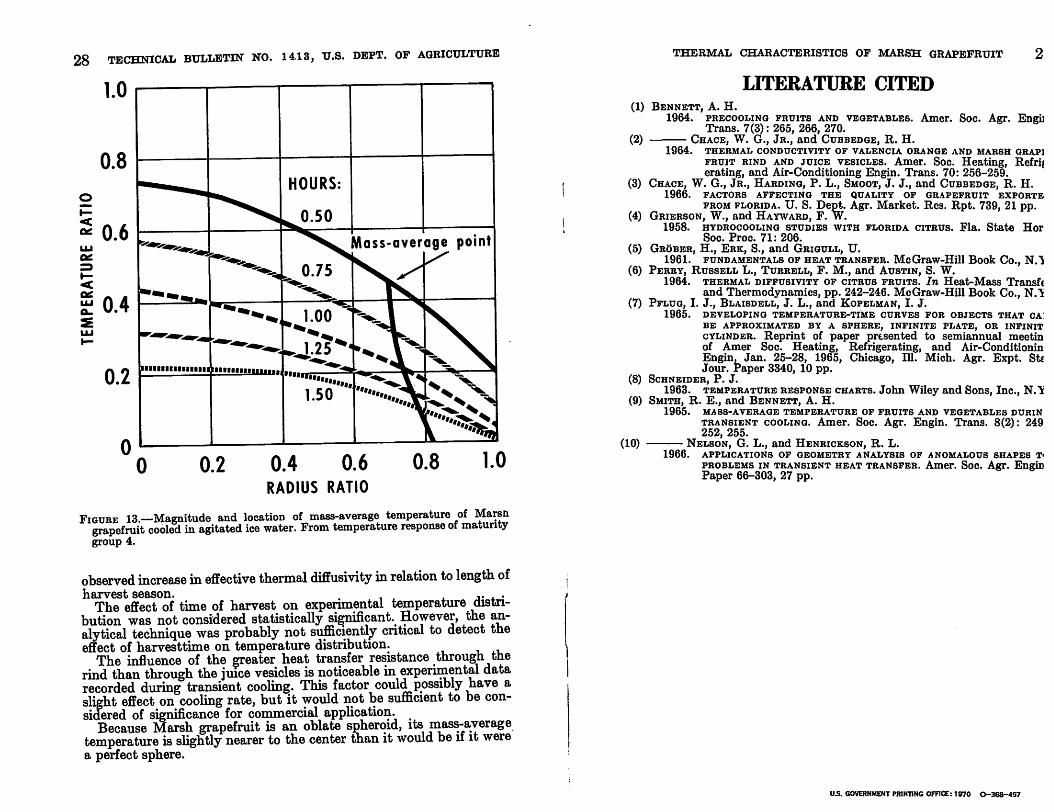
This process is one of trial and error. Values of predicted magnitudand location of mass-average temperature may be similarly computefor other cooling times. Values so computed for maturity group 4 aiillustrated in figure 13.
CONCLUSIONS
The effective thermal diffusivity of Marsh grapefruit may be a<curately evaluated by using the first-term approximation of FourierSine-Series temperature response and applying Smith's correctiofactor.
There is no appreciable difference in the thermal diffusivity of thrind and juice vesicles when calculated from separately measurevalues of thermal conductivity.
The thermal conductivity of the rind of a Marsh grapefruit is aboione-half that of the juice vesicles. When the thermal conductivity :measured by the method cited in this bulletin, a small convectiocomponent of heat transfer causes the resulting values to be high<than if conduction heat transfer alone were involved.
Apparent thermal conductivity, computed by summing the risistances of the rind and the juice-vesicle components, does not provida meaningful measure of the heat transfer characteristic of a wholMarsh grapefruit unless the error introduced by inherent bias icorrected.
Findings have shown a significant interaction between rind thictness, moisture content of the rind and juice vesicles, thermal corductivity of both rind and juice vesicle, and specific gravity; andalso that as the harvest season advances from October through Ma;fruit becomes more dense, its rind becomes thinner, the moisturcontent of the rind decreases. These findings are consistent with th-
28 TECHNICAL BULLETIN NO. 14.13, U.S. DEPT. OF AGRICULTURE
0 0.2 0.4 0.6 0.8 1.0RADIUS RATIO
Figure 13.—Magnitude and location of mass-average temperature of Marsngrapefruit cooled inagitated ice water. From temperature response ofmaturitygroup 4.
observed increase in effective thermal diffusivity inrelation to length ofharvest season. . ,. .
The effect of time of harvest on experimental temperature distribution was not considered statistically significant. However, the analytical technique was probably not sufficiently critical to detect theeffect of harvesttime on temperature distribution.
The influence of the greater heat transfer resistance through therind than through the juice vesicles is noticeable in experimental datarecorded during transient cooling. This factor could possibly have aslight effect on cooling rate, but it would not be sufficient to be considered of significance for commercial application.
Because Marsh grapefruit is an oblate spheroid, its mass-averagetemperature is slightly nearer to the center thanit would be if it werea perfect sphere.
THERMAL CHARACTERISTICS OF MARSH GRAPEFRUIT 2
LITERATURE CITED(1) Bennett, A. H.
1964. precooling fruits and vegetables. Amer. Soc. Agr. EngijTrans. 7(3): 265, 266, 270.
(2) Chace, W. G., Jr., and Cubbedge, R. H.1964. thermal conductivity of Valencia orange and marsh grapi
fruit rind and juice vesicles. Amer. Soc. Heating, Refriferating, and Air-Conditioning Engin. Trans. 70: 256-259.
(3) Chace, W. G., Jr., Harding, P. L., Smoot, J. J., and Cubbedge, R. H.1966. factors affecting the quality of grapefruit exporte
from Florida. U. S. Dept. Agr. Market. Res. Rpt. 739, 21 pp.(4) Grierson, W., and Hayward, F. W.
1958. hydrocooling studies with Florida citrus. Fla. State HorSoc. Proc. 71: 206.
(5) Gr&ber, H., Erk, S., and Grigull, U.1961. FUNDAMENTALS OF HEAT TRANSFER. McGraw-Hill Book Co., N.l
(6) Perry, Russell L., Turrell, F. M., and Austin, S. W.1964. thermal diffusivity of citrus fruits. In Heat-Mass Transft
and Thermodynamics, pp. 242-246. McGraw-Hill Book Co., N.'S(7) Pflug, I. J., Blaisdell, J. L., and Kopelman, I. J.
1965. developing temperature-time curves for objects that ca:be approximated by a sphere, infinite plate, or infinitcylinder. Reprint of paper presented to semiannual meetinof Amer Soc. Heating, Refrigerating, and Air-ConditioninEngin, Jan. 25-28, 1965, Chicago, 111. Mich. Agr. Expt. SteJour. Paper 3340, 10 pp.
(8) Schneider, P. J.1963. temperature response charts. John Wiley and Sons, Inc., N.li
(9) Smith, R. E., and Bennett, A. H.1965. mass-average temperature of fruits and vegetables durin
transient cooling. Amer. Soc. Agr. Engin. Trans. 8(2): 249252, 255.
(10) Nelson, G. L., and Henrickson, R. L.1966. applications of geometry analysis of anomalous shapes t«
problems in transient heat transfer. Amer. Soc. Agr. EnginPaper 66-303, 27 pp.
US. GOVERNMENT PRINTING OFFICE: 1970 0-363-457