Embed Size (px)
Citation preview
Tpa
TD
a
ARR2AA
KPSPCST
1
aaathattsi
Q
i
Ds
0h
Thermochimica Acta 575 (2014) 81– 89
Contents lists available at ScienceDirect
Thermochimica Acta
jo ur nal ho me page: www.elsev ier .com/ locate / tca
hermal properties and structural characterizations of new types ofhase change material: Anhydrous and hydrated palmiticcid/camphene solid dispersions
u Lee ∗, Yu Hsiu Chiu, Yun Lee, Hung Lin Leeepartment of Chemical and Materials Engineering, National Central University, 300 Jhong-Da Road, Jhong-Li City 320, Taiwan, ROC
r t i c l e i n f o
rticle history:eceived 6 August 2013eceived in revised form5 September 2013ccepted 7 October 2013vailable online 30 October 2013
a b s t r a c t
Two new types of phase change material anhydrous and hydrated palmitic acid/camphene soliddispersions (PA1CA1) are prepared and characterized by low-temperature differential scanningcalorimetry, powder X-ray diffraction, small-angle X-ray scattering and temperature–history method.Their microstructures contain nanometer-sized palmitic acid (PA) crystallites with lamellar period-icity dispersed in a partially amorphous plastic crystalline camphene (CA) matrix. The PA phaseapparently possesses a relatively high latent heat value inherited from the pristine crystallinePA of 229.7 ± 0.1 kJ kg−1. The relatively high specific heat of solid, C , for anhydrous PA1CA1 of
eywords:hase change materialolid dispersionalmitic acidamphenemall-angle X-ray scattering
ps
2.17 ± 0.06 kJ kg−1 K−1 is originated from the presence of disordered CA matrix. Hydration of PA1CA1can further increase the Cps to 2.61 ± 0.01 kJ kg−1 K−1. The mixing of partially amorphous CA, some PAand the small amount of water may have turned the matrix into more disorder due to their differentbonding natures, molecular weights, and various molecular shapes and sizes.
© 2013 Elsevier B.V. All rights reserved.
emperature–history method. Introduction
Thermal energy storage (TES) is the most effective utilization ofny intermittent energy source such as solar energy. TES provides
means to store excess energy that would otherwise be wastednd to bridge the gap between energy generation and consump-ion. Some of the examples of solar thermal applications includeeating, hot water, cooling, and air-conditioning. TES can be storeds a change in internal energy of a material such as latent heat whenhe storage material undergoes a phase change mainly from solido liquid or liquid to solid. The storage capacity of the latent heattorage (LHS) system with a phase change material (PCM) mediums given from [1]:
=∫ Tm
Ti
mCpsdT + m�Hls +∫ Tf
Tm
mCpl dT (1)
Although there are three terms in Eq. (1), much of the emphasiss still being placed on the second term of the control of melting
Abbreviations: PCM, phase change material; PA, palmitic acid; CA, camphene; LT-SC, low-temperature differential scanning calorimetry; SAXS, small-angle X-ray
cattering; PXRD, powder X-ray diffraction.∗ Corresponding author. Tel.: +886 3 422 7151x34204; fax: +886 3 425 2296.
E-mail address: [email protected] (T. Lee).
040-6031/$ – see front matter © 2013 Elsevier B.V. All rights reserved.ttp://dx.doi.org/10.1016/j.tca.2013.10.008
points, similar melting point and freezing points, and high latentheats for a good PCM [2].
However, it is rare to find an inexpensive pure material witha high latent heat, �Hls, and an exact phase change temperature,Tm, desired for an application. Most PCMs, in fact, are mixtures ofdifferent chemicals that provide the targeted melting point [2].Among many compounds, organic materials are often preferredbecause they melt and freeze without phase segregation and con-sequent degradation of their latent heat upon thermal cycles [1].Organic PCMs are also known for their negligible superheating andsupercooling [1,3], so that the thermal hysteresis of PCM causing atemperature swing can be minimized during the charging and dis-charging of thermal energy. Proximity of melting to freezing pointsshould be as close as possible – preferably within 3 ◦C betweenpeaks at the heating and cooling rates found in typical applica-tions of about 0.1 ◦C/min. Latent heats are preferably >180 J/g [2].Consequently, eutectic mixtures of two components of A and B areprepared to lower the phase change temperature, Tm. Based on theideal solution model, the melting point of a mixture is always lowerthan that of the pure components [4]:
1
Tm,mix =(1/Tm,i) − ((R ln xi)/�Hls,i)(2)
When the ideal solution curves of the components cross eachother, they will intersect and give a minimum melting temperature
82 T. Lee et al. / Thermochimica
Nomenclature
A, B roman capital letters used to represent componentsAt convective heat-transfer area of a tube (m2)Bi Biot number, ˛R/(2k)Cps specific heat of solid (J kg−1 K−1)Cpl specific heat of liquid (J kg−1 K−1)cpm average specific heat for solid and liquid phases
(kJ kg−1 K−1)cpl mean specific heat of the liquid lipid blends
(kJ kg−1 K−1)cpt mean specific heat of the material of the tube
(kJ kg−1 K−1)cps mean specific heat of the solid lipid blends
(kJ kg−1 K−1)cpw mean specific heat of water (kJ kg−1 K−1)d repeat distance (nm)e eutectic mixtureHls(Hm) liquid–solid enthalpy change (kJ kg−1)�Hls latent heat per unit mass (J kg−1)hw convective heat-transfer coefficient from the tube
to the stirred cool water (kW m−2 K−1)h natural convective heat-transfer coefficient of air
outside a tube (kW m−2 K−1)I scattering intensity (in arbitrary units)i the ith pure componentks effective thermal conductivity of the lipid blends in
the solid state (kW m−1 K−1)m mass of heat storage medium (kg)mp mass of the lipid blends (kg)mt mass of the tube (kg)mw mass of the water (kg)mix subscript for mixturen order of the diffraction peakQ quantity of heat stored (J)q scattering vector (nm−1)R gas constant (8.315 J/K mol)R radius of a tube (m)s q/(2�) = 2 sin �/� = 1/d (nm−1)T temperature (K)Ta reference temperature (◦C)Tf final temperature (K)Ti initial temperature (K)Tm phase change temperature of pure component (K)
or melting temperature of the lipid blends (◦C)Tr temperature of ambient air (◦C)T∞,w temperature of cool water (◦C)tf time of full solidification of the molten lipid blends
(s)x mole fraction
heat-transfer coefficient between the tube and theenvironment (kW m−2 K−1)
� the scattering angle (◦)� thermal conductivity (kW m−1 K−1)�p density of the lipid blends (kg m−3)Ap1
∫ tp10
(T − Ta)dt (◦C s)
Ap2∫ tp2
tp1(T − Ta)dt (◦C s)
Ap3∫ tp3
tp2(T − Ta)dt (◦C s)
Aw1∫ tw1
0(T − Ta)dt (◦C s)
Aw2∫ tw2
t(T − Ta)dt (◦C s)
w1
Aw3∫ tw3
tw2(T − Ta)dt (◦C s)
Acta 575 (2014) 81– 89
for the mixture at eutectic point (xi = xe and Tm,mix = Tm,e) withoutany phase segregation [1,4]. The latent heat of the eutectic mixturewhich falls between the latent heats of pure components may befurther estimated by the relation [5]:
�Hls,mix = Tm,mix
n∑i=1
xi�Hls,i
Tm,i(3)
And yet, heat capacity terms in Eq. (1) are seldom purpose-fully considered in PCM design and the development of phasechange microstructure is not fully understood. Therefore, the aimof our paper is threefold: (1) to prepare new types of PCM mix-tures by a solid dispersion technique [6], which has a higherspecific heat capacity of solid than the ones of a pure com-ponent, and a melting point close to the melting point of thepristine crystalline phase, (2) to characterize the nanostructurein the new PCM mixtures mainly with small-angle X-ray scatter-ing [7], and (3) to measure its thermal properties in a large-scaleby temperature–history method [8]. Although differential ther-mal analysis (DTA) and differential scanning calorimetry (DSC)methods are well-developed for determining the heat of fusionand the specific heat, their shortcomings are: (1) the thermo-physical properties of a very small amount of PCM samplesmay differ from those of the bulk materials in practical systems[9], (2) the phenomena involved supercooling and heat transfermay not be observed, and (3) the instruments are more expen-sive and complicated to operate. However, temperature–historymethod is able to overcome the above-mentioned limitations,and offer a more convenient way for testing the newly devel-oped PCM materials with many repeated temperature cycles.The term solid dispersion in pharmaceutical science refers toa group of solid products consisting of at least two differentcomponents. The matrix is either crystalline or amorphous. Thedrug can be dispersed (1) molecularly, (2) in amorphous particles(clusters), or (3) in crystalline particles. Solid dispersion can beprepared by melting (fusion), solvent or melting solvent method[6].
Two new types of solid dispersion based PCMs: (1) anhydrouspalmitic acid/camphene, and (2) hydrated palmitic acid/camphene,are prepared and studied. Palmitic acid and camphene are chosenbecause they are well known PCMs with reported melting pointsof 55 ◦C and 50 ◦C, and latent heat of 163 kJ kg−1 and 238 kJ kg−1,respectively [1]. Interestingly, palmitic acid has five crystal poly-morphs: A2, Asuper, Bm, C and Em, and the thermodynamically stableform is the C form [10]. Palmitic is also one of the free fatty acidsin stratum corneum (SC) which exists in a hydrated state [7,11].Inspired by SC hydration, palmitic/camphene PCM sample is alsohydrated [12] for further understanding the effect of water onPCM’s thermal behaviors and properties.
2. Materials and methods
2.1. Chemicals
White crystalline palmitic acid (C16H32O2, reagent grade,99%, MW = 256.42, mp = 63.67 ◦C, Lot: SLBD2406V) and transpar-ent viscous racemic dl-camphene (C10H16, reagent grade, 95%,MW = 136.23, mp = 46.02 ◦C, Lot: MKBD1777V) were purchasedfrom Sigma–Aldrich, Co. (St. Louis, MO, USA). Reversible osmosis
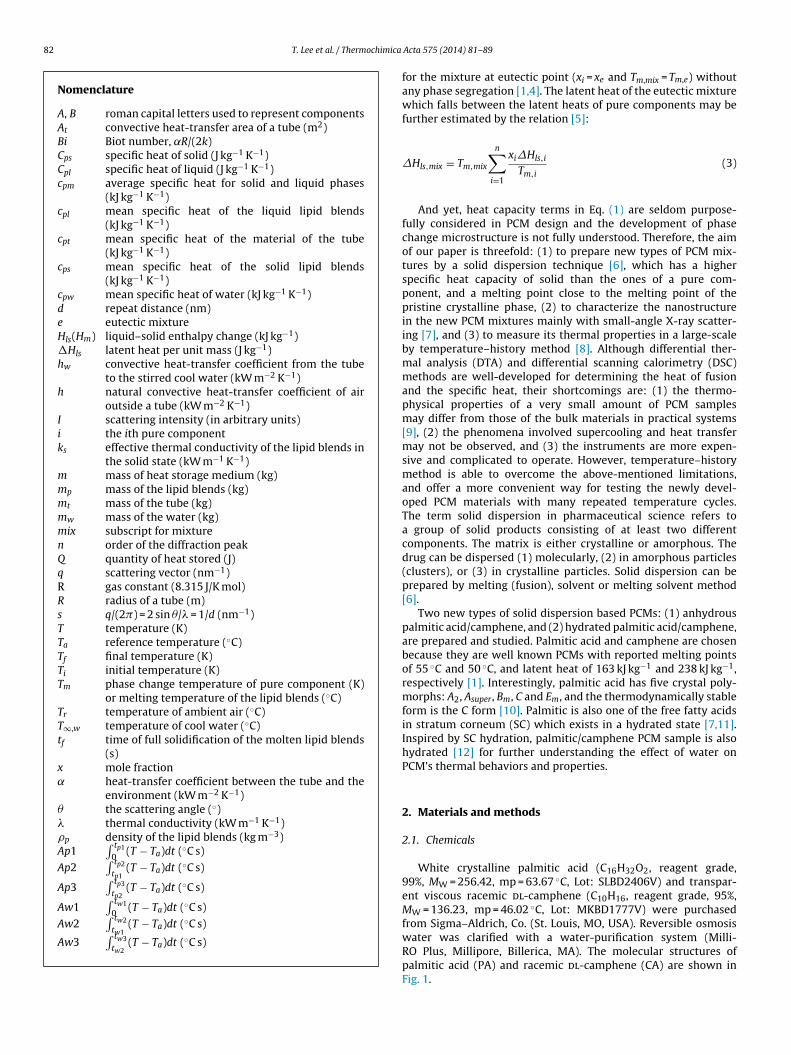
water was clarified with a water-purification system (Milli-RO Plus, Millipore, Billerica, MA). The molecular structures ofpalmitic acid (PA) and racemic dl-camphene (CA) are shown inFig. 1.
T. Lee et al. / Thermochimica
Fc
2
2(
(tac
2(
wddah
2
h
2
is(Ffmrwawdtiec
2
idoph
ig. 1. Molecular structures of (a) palmitic acid and (b) dl-camphene (*denotes thehiral centers).
.2. Experiments
.2.1. Anhydrous palmitic acid/camphene solid dispersionanhydrous PA1CA1)
2.0545 g palmitic acid (8.01 mmol) and 1.0914 g camphene8.01 mmol) with a molar ratio of 1:1 were physically mixed, heatedo 90 ◦C in a water bath for 10 min just to achieve complete melting,nd then naturally cooled to room temperature under an ambientondition to form anhydrous PA1CA1.
.2.2. Hydrated palmitic acid/camphene solid dispersionhydrated PA1CA1)
The test tube containing anhydrous PA1CA1 was filled withater for about 1 week at room temperature. The water wasecanted and the wetted sample was air dried for 2 days. Anhy-rous PA1CA1 underwent hydration to form hydrated PA1CA1. Themount of water uptake was calculated from the weight gain byydrated PA1CA1.
.2.3. Hydrated palmitic acid and hydrated camphenePure palmitic acid and camphene used in Section 2.2.1 were
ydrated using the same treatment in Section 2.2.2.
.2.4. Temperature cycleAll PCM solid dispersion samples were subjected to three
dentical heating-cooling cycles for low temperature differentialcanning calorimetry (LT-DSC) and small-angle X-ray scatteringSAXS) to obtain thermodynamically equilibrated microstructures.or LT-DSC: for each heating-cooling cycle, samples were heatedrom 0 ◦C to 90 ◦C at a heating rate of 1 ◦C/min, hold isother-
ally at 90 ◦C for 5 min, cooled from 90 ◦C to 0 ◦C at a coolingate of 1 ◦C/min, and hold isothermally at 0 ◦C for 5 min. Thehole course of the three thermal heating-cooling cycles took
bout 9.5 h to finish and repeated with three times. For SAXS: dataere collected during the second heating-cooling cycle. All con-itions remained the same as for the LT-DSC except for (1) theemperature range went from 20 ◦C to 90 ◦C due to the cooling lim-tation of the sample holder, and (2) it took about 10 min to collectach diffraction pattern at a preset temperature point during theycle.
.2.5. Temperature–history methodThe temperature–history curves were obtained upon cool-
ng about 3.0 g of anhydrous and hydrated PA1CA1 samples as
escribed in Sections 2.2.1 and 2.2.2 from the initial temperaturef 90 ◦C to the final ambient temperature kept at 15 ◦C. A com-arison of all curves with the temperature history of pure wateraving known thermal properties upon cooling also from 90 ◦CActa 575 (2014) 81– 89 83
to 15 ◦C with the use of a mathematical description of the heattransfer, could allow the determination of the heat capacity, cp,the enthalpy, h, and the conductivity, k, of the anhydrous andhydrated PA1CA1 samples from the known cp of water. All experi-ments were repeated, measured and recorded at least three times.Average values of the results and their standard deviations werecalculated.
The experimental setup (Fig. S1) was consisted of: (i) a glasstest tube having a length of 10 cm, an outer diameter of 1 cm, anda thickness of 0.7 mm (i.e. Biot number; Bi = ˛R/(2k)), where R = theradius of sample, k = its thermal conductivity, and = the heat trans-fer coefficient between the tube and environment) for holding thesample or water, (ii) a heating aluminum block for heating the sam-ple or water to 90 ◦C isothermally for 10 min, (iii) an Erlenmeyerflask-type cool down chamber for cooling the sample or water. Itwas immersed in a water circulating jacket, which was connectedto a water bath set at 15 ◦C, (iv) a type PT 100 ohm thermocou-ple (temperature range: −199.9 ◦C to 850 ◦C, accuracy: ±0.4% + 1 ◦C,thickness: 3 mm) for measuring the temperature of the sample,water and ambient, and (v) a temperature recorder (Lutron Elec-tronics TM-947SD, Taipei, Taiwan).
2.3. Instrumentations
2.3.1. Low-temperature differential scanning calorimetry(LT-DSC)
LT-DSC was mainly used to observe the phase transition tem-perature, TC and measure heat capacity, Cp, and enthalpy change,�H, at the melting or freezing point during the heating and cool-ing process. The measurement of Cp by LT-DSC is required withsapphire as a standard for the calibration (Fig. S3). Thermal anal-ysis was performed with Perkin Elmer DSC 7 (Norwalk, CT, USA)under a constant nitrogen 99.9990% purge. The instrument wascalibrated with cyclohexane and indium 99.999% with referencetemperatures of 6.54 ◦C and 156.6 ◦C, respectively. PCM solid dis-persion sample quantities of about 5 mg were placed and sealedin a perforated aluminum pan. LT-DSC was finally programmed tocarry out the above-mentioned Temperature cycle three times.
2.3.2. Small angle X-ray scattering (SAXS)SAXS was used to analyze the nanostructures of the samples
as a function of temperature. SAXS measurement was performedwith a Nano-Viewer (Rigaku, Japan) using Cu K� X-rays (30 kVand 40 mA) with a wavelength of � = 1.54 A and exposure dura-tions of 15 min. SAXS patterns were collected with PLATUS 100 K of83.8 mm × 33.5 mm at an incidence angle of 0.2◦. 5 mg of samplewere loaded on SAXS capillary tube to go through the above-mentioned Temperature cycle two times. SAXS measurement wasonly started in the second heating-cooling cycle. The scatteringintensity, I (in arbitrary units), was measured as a function ofthe scattering vector, q (in reciprocal nm). q is defined as [13]:q = (4� sin �)/� where � is the scattering angle and � = 1.54 A. Pos-itions of the observed peaks are converted into periodicity, d, orinverse space, s, where [14]: s = 1/d = q/2� after calibration with astandard of well-defined scattering patterns such as silver behenate[15].
2.3.3. Powder X-ray diffraction (PXRD)PXRD diffractograms were detected by Bruker D8 Advance
(Germany). The source of PXRD was Cu K� (� = 1.54 A) and thediffractometer was operated at 40 kV and 40 mA. The X-ray was
passed through a 1 mm slit and the signal a 1 mm slit, a nickel fil-ter, and another 0.1 mm slit. The detector type was a scintillationcounter. The scanning rate was set at 1.0◦ 2�/min ranging from 5◦to 35◦.
84 T. Lee et al. / Thermochimica Acta 575 (2014) 81– 89
Fd
3
6a2oaf5ibiaphbpts
oehmvdspc
ilabpe
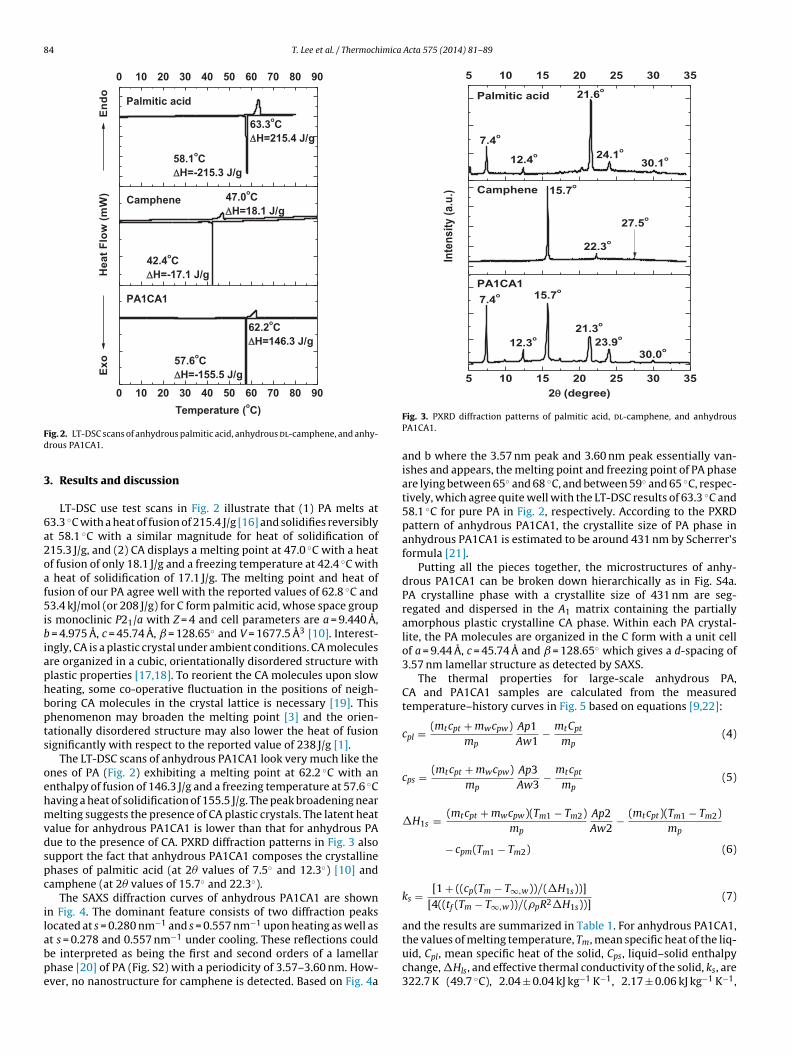
ig. 2. LT-DSC scans of anhydrous palmitic acid, anhydrous dl-camphene, and anhy-rous PA1CA1.
. Results and discussion
LT-DSC use test scans in Fig. 2 illustrate that (1) PA melts at3.3 ◦C with a heat of fusion of 215.4 J/g [16] and solidifies reversiblyt 58.1 ◦C with a similar magnitude for heat of solidification of15.3 J/g, and (2) CA displays a melting point at 47.0 ◦C with a heatf fusion of only 18.1 J/g and a freezing temperature at 42.4 ◦C with
heat of solidification of 17.1 J/g. The melting point and heat ofusion of our PA agree well with the reported values of 62.8 ◦C and3.4 kJ/mol (or 208 J/g) for C form palmitic acid, whose space group
s monoclinic P21/a with Z = 4 and cell parameters are a = 9.440 A, = 4.975 A, c = 45.74 A, = 128.65◦ and V = 1677.5 A3 [10]. Interest-ngly, CA is a plastic crystal under ambient conditions. CA moleculesre organized in a cubic, orientationally disordered structure withlastic properties [17,18]. To reorient the CA molecules upon sloweating, some co-operative fluctuation in the positions of neigh-oring CA molecules in the crystal lattice is necessary [19]. Thishenomenon may broaden the melting point [3] and the orien-ationally disordered structure may also lower the heat of fusionignificantly with respect to the reported value of 238 J/g [1].
The LT-DSC scans of anhydrous PA1CA1 look very much like thenes of PA (Fig. 2) exhibiting a melting point at 62.2 ◦C with annthalpy of fusion of 146.3 J/g and a freezing temperature at 57.6 ◦Caving a heat of solidification of 155.5 J/g. The peak broadening nearelting suggests the presence of CA plastic crystals. The latent heat
alue for anhydrous PA1CA1 is lower than that for anhydrous PAue to the presence of CA. PXRD diffraction patterns in Fig. 3 alsoupport the fact that anhydrous PA1CA1 composes the crystallinehases of palmitic acid (at 2� values of 7.5◦ and 12.3◦) [10] andamphene (at 2� values of 15.7◦ and 22.3◦).
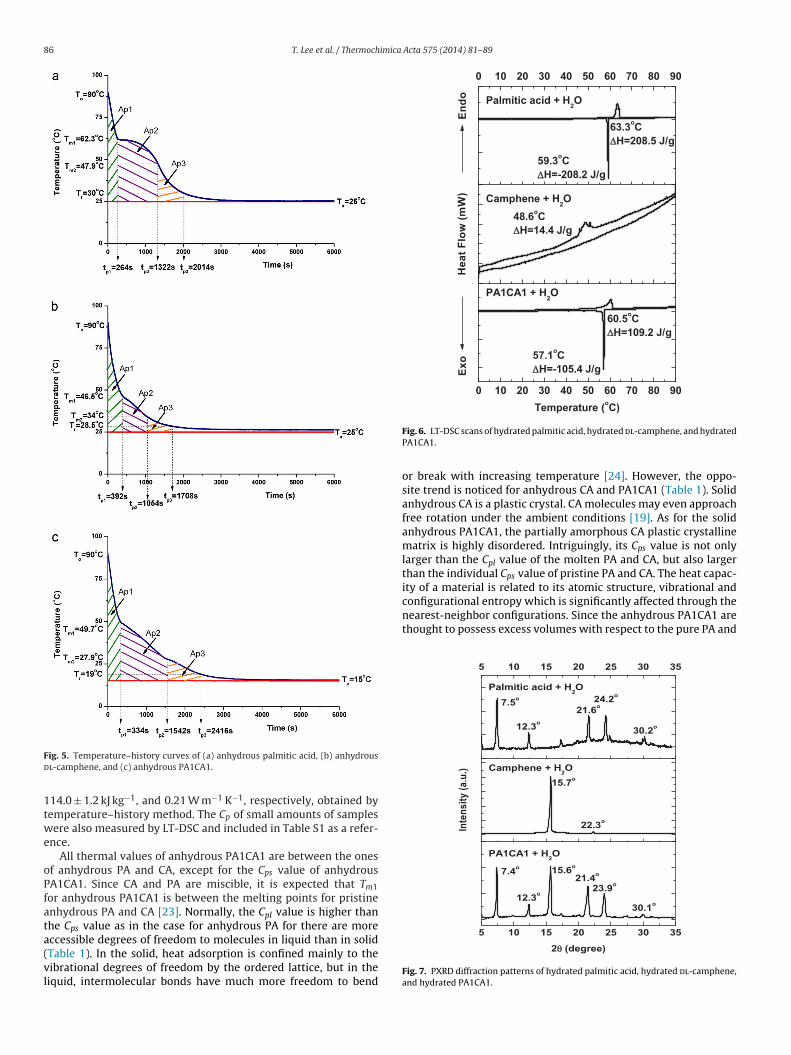
The SAXS diffraction curves of anhydrous PA1CA1 are shownn Fig. 4. The dominant feature consists of two diffraction peaksocated at s = 0.280 nm−1 and s = 0.557 nm−1 upon heating as well as
−1
t s = 0.278 and 0.557 nm under cooling. These reflections coulde interpreted as being the first and second orders of a lamellarhase [20] of PA (Fig. S2) with a periodicity of 3.57–3.60 nm. How-ver, no nanostructure for camphene is detected. Based on Fig. 4aFig. 3. PXRD diffraction patterns of palmitic acid, dl-camphene, and anhydrousPA1CA1.
and b where the 3.57 nm peak and 3.60 nm peak essentially van-ishes and appears, the melting point and freezing point of PA phaseare lying between 65◦ and 68 ◦C, and between 59◦ and 65 ◦C, respec-tively, which agree quite well with the LT-DSC results of 63.3 ◦C and58.1 ◦C for pure PA in Fig. 2, respectively. According to the PXRDpattern of anhydrous PA1CA1, the crystallite size of PA phase inanhydrous PA1CA1 is estimated to be around 431 nm by Scherrer’sformula [21].
Putting all the pieces together, the microstructures of anhy-drous PA1CA1 can be broken down hierarchically as in Fig. S4a.PA crystalline phase with a crystallite size of 431 nm are seg-regated and dispersed in the A1 matrix containing the partiallyamorphous plastic crystalline CA phase. Within each PA crystal-lite, the PA molecules are organized in the C form with a unit cellof a = 9.44 A, c = 45.74 A and = 128.65◦ which gives a d-spacing of3.57 nm lamellar structure as detected by SAXS.
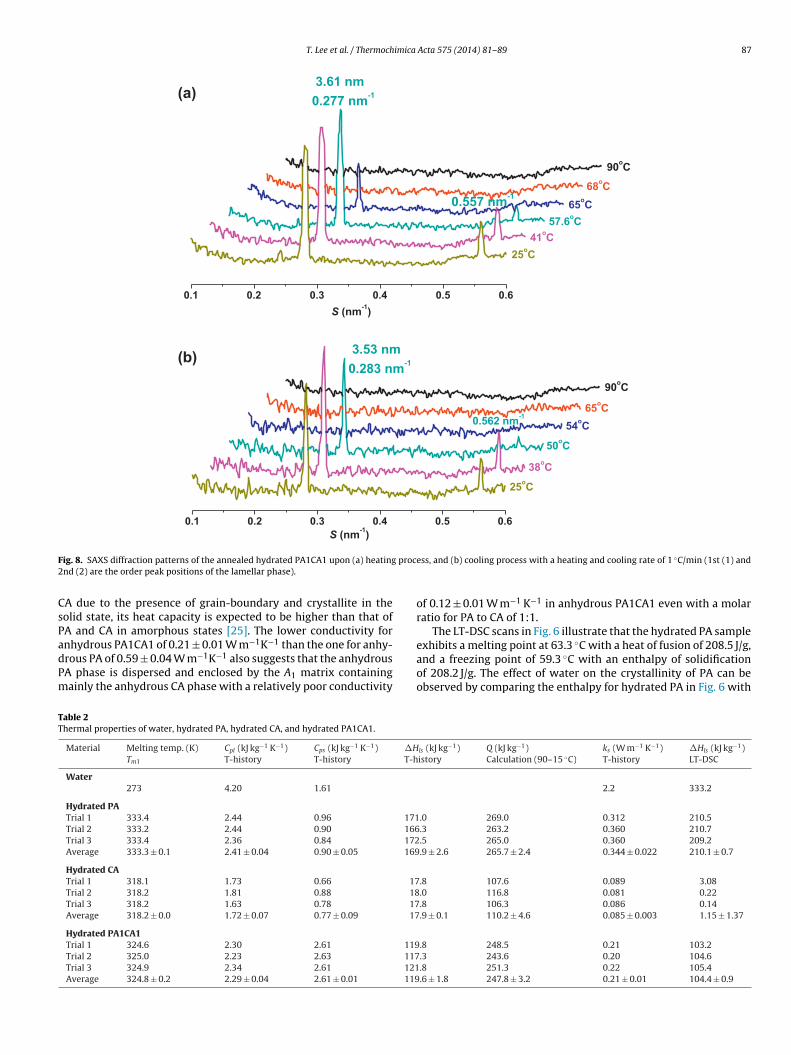
The thermal properties for large-scale anhydrous PA,CA and PA1CA1 samples are calculated from the measuredtemperature–history curves in Fig. 5 based on equations [9,22]:
cpl = (mtcpt + mwcpw)mp
Ap1Aw1
− mtCpt
mp(4)
cps = (mtcpt + mwcpw)mp
Ap3Aw3
− mtcpt
mp(5)
�H1s = (mtcpt + mwcpw)(Tm1 − Tm2)mp
Ap2Aw2
− (mtcpt)(Tm1 − Tm2)mp
− cpm(Tm1 − Tm2) (6)
ks = [1 + ((cp(Tm − T∞,w))/(�H1s))][4((tf (Tm − T∞,w))/(�pR2�H1s))]
(7)
and the results are summarized in Table 1. For anhydrous PA1CA1,
the values of melting temperature, Tm, mean specific heat of the liq-uid, Cpl, mean specific heat of the solid, Cps, liquid–solid enthalpychange, �Hls, and effective thermal conductivity of the solid, ks, are322.7 K (49.7 ◦C), 2.04 ± 0.04 kJ kg−1 K−1, 2.17 ± 0.06 kJ kg−1 K−1,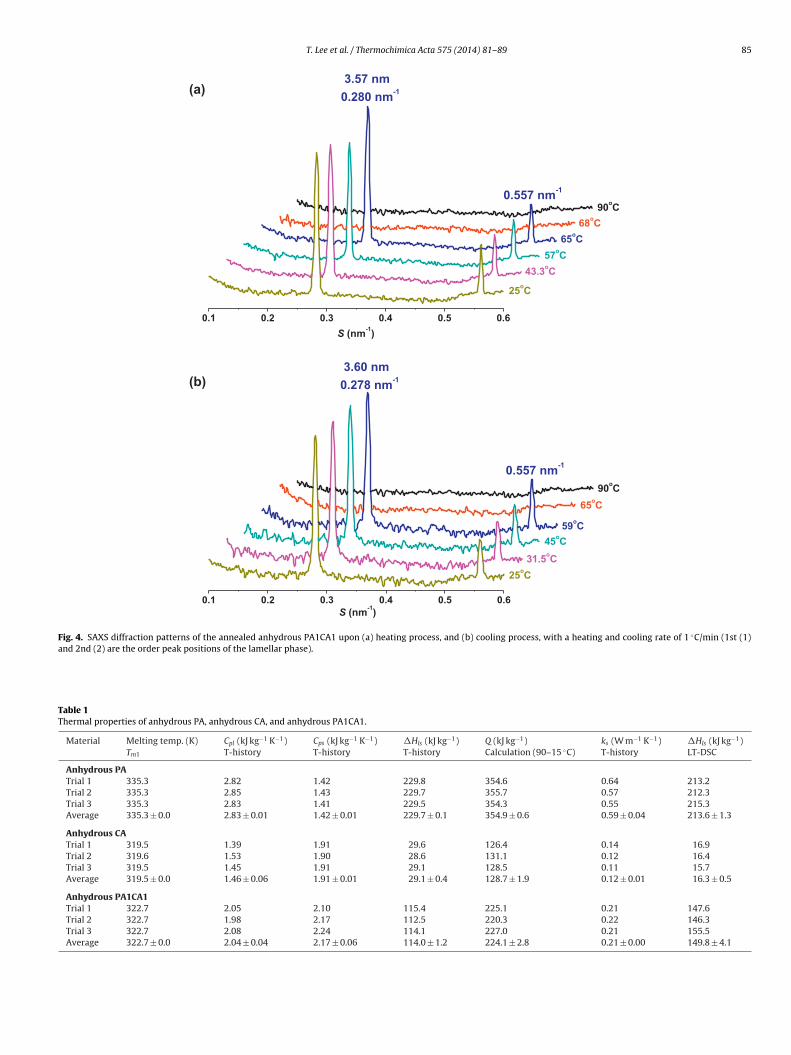
T. Lee et al. / Thermochimica Acta 575 (2014) 81– 89 85
0.1 0.2 0.3 0.4 0.5 0.6
S (nm-1 )
0.557 nm-1
3.57 nm
0.280 nm-1
25oC
43.3oC
57oC
65oC
68oC
90oC
(a)
0.1 0.2 0.3 0.4 0.5 0.6
0.557 nm-1
3.60 nm
0.278 nm-1
25oC
31.5oC
45oC
59oC
65oC
90oC
S (nm-1 )
(b)
Fig. 4. SAXS diffraction patterns of the annealed anhydrous PA1CA1 upon (a) heating process, and (b) cooling process, with a heating and cooling rate of 1 ◦C/min (1st (1)and 2nd (2) are the order peak positions of the lamellar phase).
Table 1Thermal properties of anhydrous PA, anhydrous CA, and anhydrous PA1CA1.
Material Melting temp. (K) Cpl (kJ kg−1 K−1) Cps (kJ kg−1 K−1) �Hls (kJ kg−1) Q (kJ kg−1) ks (W m−1 K−1) �Hls (kJ kg−1)Tm1 T-history T-history T-history Calculation (90–15 ◦C) T-history LT-DSC
Anhydrous PATrial 1 335.3 2.82 1.42 229.8 354.6 0.64 213.2Trial 2 335.3 2.85 1.43 229.7 355.7 0.57 212.3Trial 3 335.3 2.83 1.41 229.5 354.3 0.55 215.3Average 335.3 ± 0.0 2.83 ± 0.01 1.42 ± 0.01 229.7 ± 0.1 354.9 ± 0.6 0.59 ± 0.04 213.6 ± 1.3
Anhydrous CATrial 1 319.5 1.39 1.91 29.6 126.4 0.14 16.9Trial 2 319.6 1.53 1.90 28.6 131.1 0.12 16.4Trial 3 319.5 1.45 1.91 29.1 128.5 0.11 15.7Average 319.5 ± 0.0 1.46 ± 0.06 1.91 ± 0.01 29.1 ± 0.4 128.7 ± 1.9 0.12 ± 0.01 16.3 ± 0.5
Anhydrous PA1CA1Trial 1 322.7 2.05 2.10 115.4 225.1 0.21 147.6Trial 2 322.7 1.98 2.17 112.5 220.3 0.22 146.3Trial 3 322.7 2.08 2.24 114.1 227.0 0.21 155.5Average 322.7 ± 0.0 2.04 ± 0.04 2.17 ± 0.06 114.0 ± 1.2 224.1 ± 2.8 0.21 ± 0.00 149.8 ± 4.1
86 T. Lee et al. / Thermochimica Acta 575 (2014) 81– 89
Fd
1twe
oPfata(vl
configurational entropy which is significantly affected through thenearest-neighbor configurations. Since the anhydrous PA1CA1 arethought to possess excess volumes with respect to the pure PA and
ig. 5. Temperature–history curves of (a) anhydrous palmitic acid, (b) anhydrousl-camphene, and (c) anhydrous PA1CA1.
14.0 ± 1.2 kJ kg−1, and 0.21 W m−1 K−1, respectively, obtained byemperature–history method. The Cp of small amounts of samplesere also measured by LT-DSC and included in Table S1 as a refer-
nce.All thermal values of anhydrous PA1CA1 are between the ones
f anhydrous PA and CA, except for the Cps value of anhydrousA1CA1. Since CA and PA are miscible, it is expected that Tm1or anhydrous PA1CA1 is between the melting points for pristinenhydrous PA and CA [23]. Normally, the Cpl value is higher thanhe Cps value as in the case for anhydrous PA for there are more
ccessible degrees of freedom to molecules in liquid than in solidTable 1). In the solid, heat adsorption is confined mainly to theibrational degrees of freedom by the ordered lattice, but in theiquid, intermolecular bonds have much more freedom to bendFig. 6. LT-DSC scans of hydrated palmitic acid, hydrated dl-camphene, and hydratedPA1CA1.
or break with increasing temperature [24]. However, the oppo-site trend is noticed for anhydrous CA and PA1CA1 (Table 1). Solidanhydrous CA is a plastic crystal. CA molecules may even approachfree rotation under the ambient conditions [19]. As for the solidanhydrous PA1CA1, the partially amorphous CA plastic crystallinematrix is highly disordered. Intriguingly, its Cps value is not onlylarger than the Cpl value of the molten PA and CA, but also largerthan the individual Cps value of pristine PA and CA. The heat capac-ity of a material is related to its atomic structure, vibrational and
Fig. 7. PXRD diffraction patterns of hydrated palmitic acid, hydrated dl-camphene,and hydrated PA1CA1.
T. Lee et al. / Thermochimica Acta 575 (2014) 81– 89 87
0.1 0.2 0.3 0.4 0.5 0.6
0.557 nm-1
3.61 nm
0.277 nm-1
S (nm-1 )
25oC
41oC
57.6oC
65oC
68oC
90oC
(a)
0.1 0.2 0.3 0.4 0.5 0.6
0.562 nm-1
90oC
65oC
54oC
50oC
38oC
25oC
S (nm-1 )
3.53 nm
0.283 nm-1(b)
F proc2
CsPadPm
TT
ig. 8. SAXS diffraction patterns of the annealed hydrated PA1CA1 upon (a) heatingnd (2) are the order peak positions of the lamellar phase).
A due to the presence of grain-boundary and crystallite in theolid state, its heat capacity is expected to be higher than that ofA and CA in amorphous states [25]. The lower conductivity for
nhydrous PA1CA1 of 0.21 ± 0.01 W m−1K−1 than the one for anhy-rous PA of 0.59 ± 0.04 W m−1K−1 also suggests that the anhydrousA phase is dispersed and enclosed by the A1 matrix containingainly the anhydrous CA phase with a relatively poor conductivityable 2hermal properties of water, hydrated PA, hydrated CA, and hydrated PA1CA1.
Material Melting temp. (K) Cpl (kJ kg−1 K−1) Cps (kJ kg−1 K−1) �HTm1 T-history T-history T-h
Water273 4.20 1.61
Hydrated PATrial 1 333.4 2.44 0.96 171Trial 2 333.2 2.44 0.90 166Trial 3 333.4 2.36 0.84 172Average 333.3 ± 0.1 2.41 ± 0.04 0.90 ± 0.05 169
Hydrated CATrial 1 318.1 1.73 0.66 17Trial 2 318.2 1.81 0.88 18Trial 3 318.2 1.63 0.78 17Average 318.2 ± 0.0 1.72 ± 0.07 0.77 ± 0.09 17
Hydrated PA1CA1Trial 1 324.6 2.30 2.61 119Trial 2 325.0 2.23 2.63 117Trial 3 324.9 2.34 2.61 121Average 324.8 ± 0.2 2.29 ± 0.04 2.61 ± 0.01 119
ess, and (b) cooling process with a heating and cooling rate of 1 ◦C/min (1st (1) and
of 0.12 ± 0.01 W m−1 K−1 in anhydrous PA1CA1 even with a molarratio for PA to CA of 1:1.
The LT-DSC scans in Fig. 6 illustrate that the hydrated PA sample
exhibits a melting point at 63.3 ◦C with a heat of fusion of 208.5 J/g,and a freezing point of 59.3 ◦C with an enthalpy of solidificationof 208.2 J/g. The effect of water on the crystallinity of PA can beobserved by comparing the enthalpy for hydrated PA in Fig. 6 withls (kJ kg−1) Q (kJ kg−1) ks (W m−1 K−1) �Hls (kJ kg−1)istory Calculation (90–15 ◦C) T-history LT-DSC
2.2 333.2
.0 269.0 0.312 210.5
.3 263.2 0.360 210.7
.5 265.0 0.360 209.2
.9 ± 2.6 265.7 ± 2.4 0.344 ± 0.022 210.1 ± 0.7
.8 107.6 0.089 3.08
.0 116.8 0.081 0.22
.8 106.3 0.086 0.14
.9 ± 0.1 110.2 ± 4.6 0.085 ± 0.003 1.15 ± 1.37
.8 248.5 0.21 103.2
.3 243.6 0.20 104.6
.8 251.3 0.22 105.4
.6 ± 1.8 247.8 ± 3.2 0.21 ± 0.01 104.4 ± 0.9
8 imica Acta 575 (2014) 81– 89
tpPbsbw
nhaoowonispPp1
FtspPnpPwPPmaltpS
atrvh(amcdoiittcm(isgdohp
8 T. Lee et al. / Thermoch
he one for the pristine anhydrous PA in Fig. 2. As a whole, the PXRDatterns of hydrated PA in Fig. 7 and the one of original anhydrousA in Fig. 3 are almost identical. This implies that the hydropho-ic effect holding the hydrocarbon chains of PA together is muchtronger than the hydrogen bonding interactions among the car-oxyl head groups of PA which is disturbed by the presence ofater.
However, the effect of hydration is quite drastic on the orga-ization of camphene molecules. Although, the LT-DSC scans ofydrated camphene in Fig. 6 do not display any well-defined peaks for the ones of anhydrous camphene in Fig. 2, the PXRD patternf hydrated camphene in Fig. 7 does not differ too much from thene of anhydrous camphene in Fig. 3. Obviously, the involvement ofater in CA plastic crystal has only disrupted its rather weak local
rder domains and left the other crystalline structures intact. Theumerous little spikes in the LT-DSC scans in Fig. 6 for hydrated CA
ndicates the progressive ‘melting’ of the hydrogen-bonded watertructures that form around the non-polar groups of CA [24]. Theeak broadening and the lowering of melting point of hydratedA1CA1 in Fig. 6 may be due to the decrease in crystallinity as sup-orted by the low heat of fusion and solidification of only 109.2 and05.4 J/g as opposed to 146.3 and 155.5 J/g in Fig. 2, respectively.
The SAXS diffraction curves of hydrated PA1CA1 are shown inig. 8. Similar to Fig. 4, the dominant feature consists of two diffrac-ion peaks located at s = 0.277 and 0.557 nm−1 upon heating, and
= 0.283 and 0.562 nm−1 under cooling. These reflections are inter-reted as being the first and second orders of a lamellar phase ofA (Fig. S2) with a periodicity of about 3.61–3.53 nm. Again, noanostructure for camphene is detected. The melting and freezingoint at which the reflections disappear and appear for hydratedA phase are lying between 65–68 ◦C, and 50–54 ◦C, respectively,hich are close to the DSC results of 63.3 ◦C and 59.3 ◦C for hydrated
A in Fig. 6, respectively. According to the PXRD pattern of hydratedA1CA1, the crystallite size of PA phase in hydrated PA1CA1 is esti-ated to be around 222 nm by Scherrer’s formula [21]. Similar to
nhydrous PA1CA1 in Fig. S4a, PA crystalline phase with a crystal-ite size of 222 nm is believed to be segregated and dispersed inhe A2 matrix containing mostly the partially amorphous hydratedlastic crystalline CA phase and may be some amorphous PA (Fig.4b).
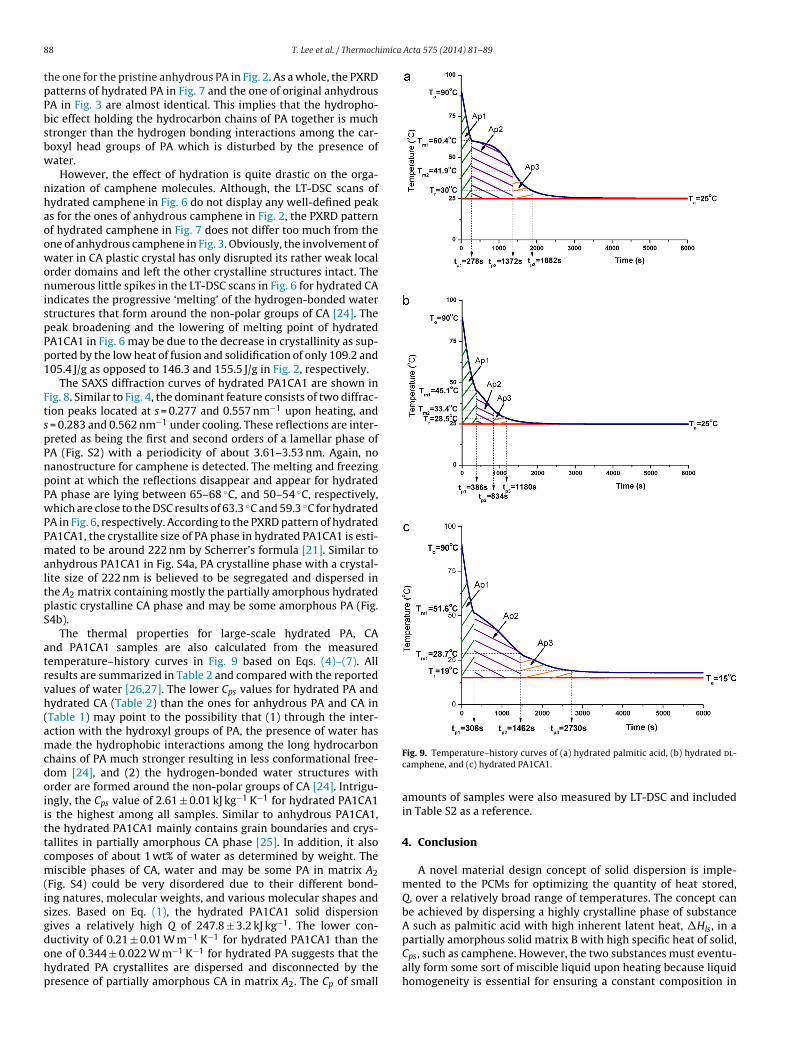
The thermal properties for large-scale hydrated PA, CAnd PA1CA1 samples are also calculated from the measuredemperature–history curves in Fig. 9 based on Eqs. (4)–(7). Allesults are summarized in Table 2 and compared with the reportedalues of water [26,27]. The lower Cps values for hydrated PA andydrated CA (Table 2) than the ones for anhydrous PA and CA inTable 1) may point to the possibility that (1) through the inter-ction with the hydroxyl groups of PA, the presence of water hasade the hydrophobic interactions among the long hydrocarbon
hains of PA much stronger resulting in less conformational free-om [24], and (2) the hydrogen-bonded water structures withrder are formed around the non-polar groups of CA [24]. Intrigu-ngly, the Cps value of 2.61 ± 0.01 kJ kg−1 K−1 for hydrated PA1CA1s the highest among all samples. Similar to anhydrous PA1CA1,he hydrated PA1CA1 mainly contains grain boundaries and crys-allites in partially amorphous CA phase [25]. In addition, it alsoomposes of about 1 wt% of water as determined by weight. Theiscible phases of CA, water and may be some PA in matrix A2
Fig. S4) could be very disordered due to their different bond-ng natures, molecular weights, and various molecular shapes andizes. Based on Eq. (1), the hydrated PA1CA1 solid dispersionives a relatively high Q of 247.8 ± 3.2 kJ kg−1. The lower con-
uctivity of 0.21 ± 0.01 W m−1 K−1 for hydrated PA1CA1 than thene of 0.344 ± 0.022 W m−1 K−1 for hydrated PA suggests that theydrated PA crystallites are dispersed and disconnected by theresence of partially amorphous CA in matrix A2. The Cp of smallFig. 9. Temperature–history curves of (a) hydrated palmitic acid, (b) hydrated dl-camphene, and (c) hydrated PA1CA1.
amounts of samples were also measured by LT-DSC and includedin Table S2 as a reference.
4. Conclusion
A novel material design concept of solid dispersion is imple-mented to the PCMs for optimizing the quantity of heat stored,Q, over a relatively broad range of temperatures. The concept canbe achieved by dispersing a highly crystalline phase of substanceA such as palmitic acid with high inherent latent heat, �Hls, in a
partially amorphous solid matrix B with high specific heat of solid,Cps, such as camphene. However, the two substances must eventu-ally form some sort of miscible liquid upon heating because liquidhomogeneity is essential for ensuring a constant composition in
imica
taHoscasocm
A
CJfN
A
t
R
[
[
[
[
[
[
[
[
[
[
[
[
[
[
[
[
[
[
T. Lee et al. / Thermoch
he binary solid phase from point to point in space upon coolingnd maintaining reproducible thermal properties at large scale.ydration of the hydrophobic system may also enhance its dis-rder which is advantageous for increasing the magnitude of thepecific heat of solid, Cps. The appearance of grain boundary andrystallite are considered to enhance Cps in the cases of anhydrousnd hydrated PA1CA1. The hydrated PCM may be used in passivetorage in bio-climatic building or architecture and application inff-peak electricity for cooling and heating. We speculate that Cps
an be further optimized in the future based on the formation ofulti-component solid solution in the matrix [28].
cknowledgements
We are grateful for the research grant from the National Scienceouncil of Taiwan, ROC (NSC-101-2221-E-008-102). We thank Ms.
ui-Mei Huang for assistance with LT-DSC and Ms. Shew-Jen Wengor SAXS and PXRD. All with the Precision Instrument Center atational Central University are gratefully acknowledged.
ppendix A. Supplementary data
Supplementary material related to this article can be found, inhe online version, at http://dx.doi.org/10.1016/j.tca.2013.10.008.
eferences
[1] A. Sharma, V.V. Tyagi, C.R. Chen, D. Buddhi, Review on thermal energy storagewith phase change materials and applications, Renew. Sustain. Energy Rev. 13(2) (2009) 318–345.
[2] G.J. Suppes, M.J. Goff, S. Lopes, Latent heat characteristics of fatty acid deriva-tives pursuant phase change material applications, Chem. Eng. Sci. 58 (9) (2003)1751–1763.
[3] B. Wunderlich, One hundred years research on supercooling and superheating,Thermochim. Acta 461 (1/2) (2007) 4–13.
[4] P. Kauranen, K. Peippo, P.D. Lund, An organic PCM storage system withadjustable melting temperature, Solar Energy 46 (5) (1991) 275–278.
[5] Y. Yuan, W. Tao, X. Cao, L. Bai, Theoretic prediction of melting temperature andlatent heat for a fatty acid eutectic mixture, J. Chem. Eng. Data 56 (6) (2011)2889–2891.
[6] S. Singh, R.S. Baghel, L. Yadav, A review on solid dispersion, Int. J. Pharm. LifeSci. 2 (9) (2011) 1078–1095.
[7] J.A. Bouwstra, J. Thewalt, G.S. Gooris, N. Kitson, A model membrane approachto the epidermal permeability barrier: an X-ray diffraction study, Biochemistry36 (25) (1997) 7717–7725.
[8] M.A. Rady, E. Arquis, C. Le Bot, Characterization of granular phase changing
composites for thermal energy using the T-history method, Int. J. Energy Res.34 (4) (2010) 333–344.[9] H. Hong, S.K. Kim, Y.-S. Kim, Accuracy improvement of T-history method formeasuring heat of fusion of various materials, Int. J. Refrig. 27 (4) (2004)360–366.
[
Acta 575 (2014) 81– 89 89
10] E. Moreno, R. Cordobilla, T. Calvet, M.A. Cuevas-Diarte, G. Gbabode, P.Negrier, D. Mondieig, H.A.J. Oonk, Polymorphism of even saturated carboxylicacids from n-decanoic to n-eicosanoic acid, New J. Chem. 31 (6) (2007)947–957.
11] X. Wang, M. Ujihara, T. Imae, A. Ishikubo, Y. Sugiyama, T. Okamoto, Char-acterization of mimetic lipid mixtures of stratum corneum, Colloids Surf. BBiointerfaces 78 (1) (2010) 92–100.
12] Y. Zhu, T. Imae, T. Saiwaki, T. Oka, Damage/recovery by additive on lipidmembrane as a mimicry of human stratum corneum, Langmuir 26 (7) (2010)4951–4957.
13] G. Rodríguez, M. Cócera, L. Rubio, C. López-Iglesias, R. Pons, A. de la Maza,O. López, A unique bicellar nanosystem combining two effects on stratumcorneum lipids, Mol. Pharm. 9 (3) (2012) 482–491.
14] S.L. Souza, M.J. Capitán, J. Álvarez, S.S. Funari, M.H. Lameiro, E. Melo, Phasebehavior of aqueous dispersions of mixtures of N-palmitoyl ceramide andcholesterol: a lipid system with ceramide-cholesterol crystalline lamellarphases, J. Phys. Chem. B 113 (5) (2009) 1367–1375.
15] T.C. Huang, H. Toraya, T.N. Blanton, Y. Wu, X-ray powder diffraction analysis ofsilver behenate, a possible low-angle diffraction standard, J. Appl. Cryst. 26 (2)(1998) 180–184.
16] F.O. Cedenoa, M.M. Prieto, A. Espina, J.R. García, Measurements of temperatureand melting heat of some pure fatty acids and their binary and ternary mix-tures by differential scanning calorimetry, Thermochim. Acta 369 (1/2) (2001)39–50.
17] K. Suito, A. Ohta, N. Sakurai, A. Onodera, M. Motoyama, K. Yamada, Phase rela-tions of camphene at high pressure up to 9.5 GPa, J. Chem. Phys. 109 (2) (1998)670–675.
18] K. Holderna-Natkaniec, I. Natkaniec, Study of internal vibrations of dl-camphene by IINS method, Physica B 194–196 (1) (1994) 371–372.
19] W.J. Dunning, Crystallographic studies of plastic crystals, J. Phys. Chem. Solids18 (1) (1961) 21–27.
20] P. Alexandridis, U. Olsson, B. Lindman, A record nine different phases (fourcubic, two hexagonal, and one lamellar lyotropic liquid crystalline and twomicellar solutions) in a ternary isothermal system of an amphiphilic blockcopolymer and selective solvents (water and oil), Langmuir 14 (10) (1998)2627–2638.
21] F. Qian, J. Tao, S. Desikan, M. Hussain, R.L. Smith, Mechanistic investigation ofPluronic® based nano-crystalline drug-polymer solid dispersions, Pharm. Res.24 (8) (2007) 1551–1560.
22] Z. Yinping, J. Yi, J. Yi, A simple method, the T-history method, of determin-ing the heat of fusion, specific heat and thermal conductivity of phase-changematerials, Meas. Sci. Technol. 10 (3) (1999) 201–205.
23] P.J. Marsac, T. Li, L.S. Taylor, Estimation of drug-polymer miscibility andsolubility in amorphous solid dispersions using experimentally determinedinteraction parameters, Pharm. Res. 26 (1) (2009) 139–151.
24] A. Cooper, Heat capacity of hydrogen-bonded networks: an alternative view ofprotein folding thermodynamics, Biophys. Chem. 85 (1) (2000) 25–39.
25] N.X. Sun, K. Lu, Heat-capacity comparison among the nanocrystalline, amor-phous, and coarse-grained polycrystalline states in element selenium, Phys.Rev. B 54 (9) (1996) 6058–6061.
26] C.L. Yaws, Chemical Properties Handbook: Physical, Thermodynamic, Envi-ronmental, Transport, Safety, and Health Related Properties for Organic andInorganic, McGraw-Hill, New York, NY, 1999.
27] D.R. Lide, CRC Handbook of Chemistry and Physics: A Ready-reference Book of
Chemical and Physical Data, 86th ed., CRC Press, Boca Raton, FL, 2005.28] J.-W. Yeh, S.-K. Chen, S.-J. Lin, J.-Y. Gan, T.-S. Chin, T.-T. Shun, C.-H. Tsau,S.-Y. Chang, Nanostructured high-entropy alloys with multiple principal ele-ments. Novel alloy design concepts and outcomes, Adv. Eng. Mater. 6 (5) (2004)299–303.