Embed Size (px)
Citation preview
energies
Article
Thermal Performance for Wet Cooling Tower withDifferent Layout Patterns of Fillings under TypicalCrosswind ConditionsMing Gao *, Chang Guo, Chaoqun Ma, Yuetao Shi and Fengzhong Sun
School of Energy Source and Power Engineering, Shandong University, Jinan 250061, China;[email protected] (C.G.); [email protected] (C.M.); [email protected] (Y.S.); [email protected] (F.S.)* Correspondence: [email protected]; Tel.: +86-531-8839-9008
Academic Editor: Kamel HoomanReceived: 2 December 2016; Accepted: 3 January 2017; Published: 6 January 2017
Abstract: A thermal-state model experimental study was performed in lab to investigate the thermalperformance of a wet cooling tower with different kinds of filling layout patterns under windlessand 0.4 m/s crosswind conditions. In this paper, the contrast analysis was focused on comparing auniform layout pattern and one kind of optimal non-uniform layout pattern when the environmentalcrosswind speed is 0 m/s and 0.4 m/s. The experimental results proved that under windlessconditions, the heat transfer coefficient and total heat rejection of circulating water for the optimalnon-uniform layout pattern can enhance by approximately 40% and 28%, respectively, comparedwith the uniform layout pattern. It was also discovered that the optimal non-uniform pattern candramatically relieve the influence of crosswind on the thermal performance of the tower when thecrosswind speed is equal to 0.4 m/s. For the uniform layout pattern, the heat transfer coefficientunder 0.4 m/s crosswind conditions decreased by 9.5% compared with the windless conditions,while that value lowered only by 2.0% for the optimal non-uniform layout pattern. It has beendemonstrated that the optimal non-uniform layout pattern has the better thermal performance under0.4 m/s crosswind condition.
Keywords: wet cooling tower; non-uniform layout filling; thermal performance; crosswind
1. Introduction
Cooling towers are widely used to extract heat from warm water to the atmosphere in mostpower stations, refrigeration, and air conditioning industries [1,2]. They can be classified by meansof contacting mode into dry [3,4] and wet types. Moreover, they can also be classified by the drivingforce of air stream as mechanical-draft [5,6] and natural-draft types. As one of the main types, thenatural-draft wet cooling towers play an important role to cool the circulating water from the condenserin thermal power plants or some inland nuclear power plants, and the cooling towers can directlyaffect the total power generation capacity [7]. Based on prior studies, 70% of heat extraction capacityoccurs in the filling zone [8]. Therefore, it is extremely necessary to study the thermal performance ofthe filling zone.
Many researchers have focused on the thermal performance of fillings for wet cooling towers,and early research traces back to the 1940s [9–11]. Briefly, the research regarding fillings can bedivided into three aspects, which are theoretical mathematical model research [12–15], lab-basedmodel experiments [16–19], and numerical computation [20–23].
However, the prior studies failed to discuss the height difference of the filling layout, and regardedfillings as the same height in different radii inside the tower. Actually, a uniform layout fillings patternis obviously unreasonable due to the non-uniform air dynamic field inside the tower. Thus, studies
Energies 2017, 10, 65; doi:10.3390/en10010065 www.mdpi.com/journal/energies
Energies 2017, 10, 65 2 of 8
regarding the layout pattern of fillings are extremely crucial to further energy-saving research forwet cooling towers. Gao et al. [24] performed a thermal-state model experiment to investigate theinfluence of filling layout pattern on thermal performance of a wet cooling tower, including the coolingtemperature difference, cooling efficiency, Merkel number, Lewis number, and ratio of evaporative heatrejection, and obtained one kind of optimal non-uniform pattern. However, Gao et al. did not researchthe change rules of heat transfer coefficient and total heat rejection of circulating water—which areextremely significant for analysis of the thermal performance of wet cooling towers—and furthermore,their study did not consider crosswind conditions.
Consequently, in this paper, studies of filling layout patterns inside wet cooling towers areconducted via a basic thermal-state model experiment to reveal the change rules of heat transfercoefficient and total heat rejection of circulating water under windless and typical crosswind conditions,with the further aim of determining the influence of filling layout patterns on the thermal performanceof wet cooling towers under a typical crosswind speed value of 0.4 m/s.
2. Experimental Study Design
2.1. Experimental Setup and Operating Conditions
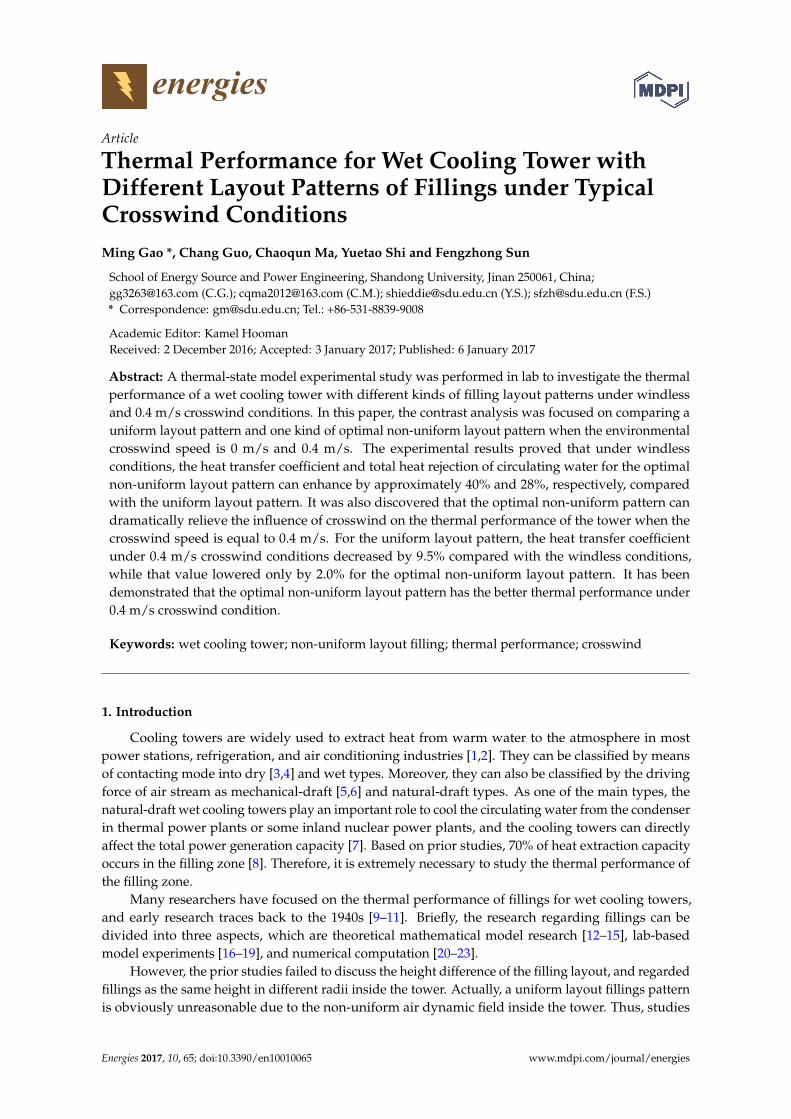
The experimental setup is displayed via the schematic diagram depicted in Figure 1.
Energies 2017, 10, 65 2 of 8
research for wet cooling towers. Gao et al. [24] performed a thermal-state model experiment to investigate the influence of filling layout pattern on thermal performance of a wet cooling tower, including the cooling temperature difference, cooling efficiency, Merkel number, Lewis number, and ratio of evaporative heat rejection, and obtained one kind of optimal non-uniform pattern. However, Gao et al. did not research the change rules of heat transfer coefficient and total heat rejection of circulating water—which are extremely significant for analysis of the thermal performance of wet cooling towers—and furthermore, their study did not consider crosswind conditions.
Consequently, in this paper, studies of filling layout patterns inside wet cooling towers are conducted via a basic thermal-state model experiment to reveal the change rules of heat transfer coefficient and total heat rejection of circulating water under windless and typical crosswind conditions, with the further aim of determining the influence of filling layout patterns on the thermal performance of wet cooling towers under a typical crosswind speed value of 0.4 m/s.
2. Experimental Study Design
2.1. Experimental Setup and Operating Conditions
The experimental setup is displayed via the schematic diagram depicted in Figure 1.
Figure 1. Schematic diagram of the experimental cooling tower.
The model tower adopted in this experiment is designed to simulate a typical wet cooling tower in large-scale power plants in terms of the geometry similarity, Froude number similarity, and wind velocity scale similarity, which are detailed in [25–28]. Additionally, the relevant scale measure of model to prototype tower is 1:100, and the details of the primary measurement setup and instruments are listed in Table 1.
Table 1. Monitored parameters and measurement instruments.
Items Measuring Instruments Accuracy Atmospheric pressure Hot-wire manometer (KA31) ±3%
Inlet dry and wet bulb temperature Psychrometer ±0.1 °C Outlet air temperature Copper-constantan thermocouple ±0.3 °C Inlet and outlet water temperature Mercury thermometer ±0.1 °C Air humidity Hygrometer (HI8564) ±2% Circulating water flow rate Rotameter ±1.5%
During the whole experiment, the circulating water inlet temperatures were 50 °C, 55 °C, and 60 °C. The circulating water rates were 4 L/min, 6 L/min, and 8 L/min, and the crosswind speed was chosen to be 0.4 m/s, which was monitored by the lower fan marked in Figure 1. Additionally, five types of filling layout patterns [24] used in this study are detailed in Section 2.2.
Figure 1. Schematic diagram of the experimental cooling tower.
The model tower adopted in this experiment is designed to simulate a typical wet cooling towerin large-scale power plants in terms of the geometry similarity, Froude number similarity, and windvelocity scale similarity, which are detailed in [25–28]. Additionally, the relevant scale measure ofmodel to prototype tower is 1:100, and the details of the primary measurement setup and instrumentsare listed in Table 1.
Table 1. Monitored parameters and measurement instruments.
Items Measuring Instruments Accuracy
Atmospheric pressure Hot-wire manometer (KA31) ±3%Inlet dry and wet bulb temperature Psychrometer ±0.1 ◦C
Outlet air temperature Copper-constantan thermocouple ±0.3 ◦CInlet and outlet water temperature Mercury thermometer ±0.1 ◦C
Air humidity Hygrometer (HI8564) ±2%Circulating water flow rate Rotameter ±1.5%
During the whole experiment, the circulating water inlet temperatures were 50 ◦C, 55 ◦C, and60 ◦C. The circulating water rates were 4 L/min, 6 L/min, and 8 L/min, and the crosswind speed
Energies 2017, 10, 65 3 of 8
was chosen to be 0.4 m/s, which was monitored by the lower fan marked in Figure 1. Additionally,five types of filling layout patterns [24] used in this study are detailed in Section 2.2.
2.2. The Determination of Typical Crosswind Speed
According to the research works [25–28] from Group Gao, the performance parameters of wetcooling towers—such as cooling efficiency, cooling temperature difference, Merkel number, Lewisnumber, heat transfer coefficient, etc.—showed a shifting point when the experimental crosswindspeed reached 0.4 m/s, indicating that this wind speed is a special crosswind working condition.Therefore, in this paper, the typical crosswind speed was chosen to be 0.4 m/s during the experiment,and the corresponding actual field crosswind speed was 4 m/s based on the similarity criterion.
2.3. Filling Layout Patterns inside the Model Tower
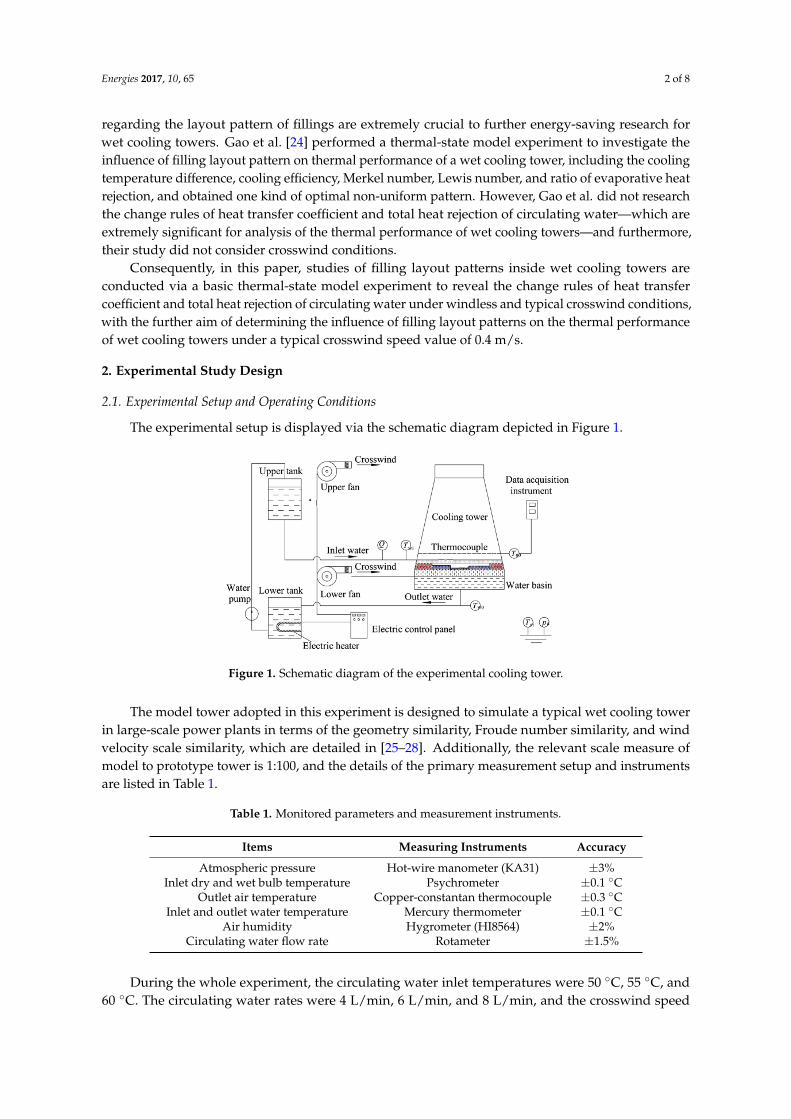
In this experiment, five kinds of layout patterns were chosen to study the change rules oftwo performance parameters for a wet cooling tower: heat transfer coefficient and total heat rejectionof circulating water. The block plan is shown in Figure 2, and the details of different layout patternsare pointed out in detail in Table 2, where P1–P5 represent five pattern types. Additionally, the wateris uniformly distributed using nozzle spray, the same distribution system in use in natural draft wetcooling towers.
Energies 2017, 10, 65 3 of 8
2.2. The Determination of Typical Crosswind Speed
According to the research works [25–28] from Group Gao, the performance parameters of wet cooling towers—such as cooling efficiency, cooling temperature difference, Merkel number, Lewis number, heat transfer coefficient, etc.—showed a shifting point when the experimental crosswind speed reached 0.4 m/s, indicating that this wind speed is a special crosswind working condition. Therefore, in this paper, the typical crosswind speed was chosen to be 0.4 m/s during the experiment, and the corresponding actual field crosswind speed was 4 m/s based on the similarity criterion.
2.3. Filling Layout Patterns inside the Model Tower
In this experiment, five kinds of layout patterns were chosen to study the change rules of two performance parameters for a wet cooling tower: heat transfer coefficient and total heat rejection of circulating water. The block plan is shown in Figure 2, and the details of different layout patterns are pointed out in detail in Table 2, where P1–P5 represent five pattern types. Additionally, the water is uniformly distributed using nozzle spray, the same distribution system in use in natural draft wet cooling towers.
Figure 2. Block plan for non-uniform layout fillings.
Table 2. Details for five different layout patterns.
Item P1 P2 P3 P4 P5 Uniform Layout Pattern Non-Uniform Layout Patterns
ra (cm) 29.5 9 11 13 15 rb (cm) 29.5 24.7 23.2 21 19 rc (cm) 29.5 29.5 29.5 29.5 29.5
ra/rc - 0.31 0.37 0.44 0.51 rb/rc - 0.84 0.79 0.71 0.64
H1 (cm) 8 4 4 4 4 H2 (cm) 8 8 8 8 8 H3 (cm) 8 10 10 10 10
P1: uniform layout pattern; P2–P5: non-uniform layout patterns.
2.4. Experimental Object
Based on the cooling temperature difference, cooling efficiency, Merkel number, Lewis number, and ratio of evaporative heat rejection, Gao et al. [24] obtained the optimal non-uniform layout pattern for which the radius ratio of ra/rc is approximately 0.44 and rb/rc is around 0.71 (refer to Figure 2 and Table 2). Higher heat transfer coefficient and total heat rejection indicate stronger cooling performance. Thus, this study focused mainly on the change rules of the heat transfer coefficient and total heat rejection of circulating water under the different layout patterns, and on analyzing the effect of optimal non-uniform fillings on these two parameters under windless and 0.4 m/s crosswind conditions.
3. Experimental Results and Analysis
3.1. Influence of Filling Layout Patterns on Performance Parameters under Windless Conditions
Figure 2. Block plan for non-uniform layout fillings.
Table 2. Details for five different layout patterns.
Item P1 P2 P3 P4 P5
Uniform Layout Pattern Non-Uniform Layout Patterns
ra (cm) 29.5 9 11 13 15rb (cm) 29.5 24.7 23.2 21 19rc (cm) 29.5 29.5 29.5 29.5 29.5ra/rc - 0.31 0.37 0.44 0.51rb/rc - 0.84 0.79 0.71 0.64
H1 (cm) 8 4 4 4 4H2 (cm) 8 8 8 8 8H3 (cm) 8 10 10 10 10
P1: uniform layout pattern; P2–P5: non-uniform layout patterns.
2.4. Experimental Object
Based on the cooling temperature difference, cooling efficiency, Merkel number, Lewis number,and ratio of evaporative heat rejection, Gao et al. [24] obtained the optimal non-uniform layout patternfor which the radius ratio of ra/rc is approximately 0.44 and rb/rc is around 0.71 (refer to Figure 2 andTable 2). Higher heat transfer coefficient and total heat rejection indicate stronger cooling performance.Thus, this study focused mainly on the change rules of the heat transfer coefficient and total heatrejection of circulating water under the different layout patterns, and on analyzing the effect of optimalnon-uniform fillings on these two parameters under windless and 0.4 m/s crosswind conditions.
Energies 2017, 10, 65 4 of 8
3. Experimental Results and Analysis
3.1. Influence of Filling Layout Patterns on Performance Parameters under Windless Conditions
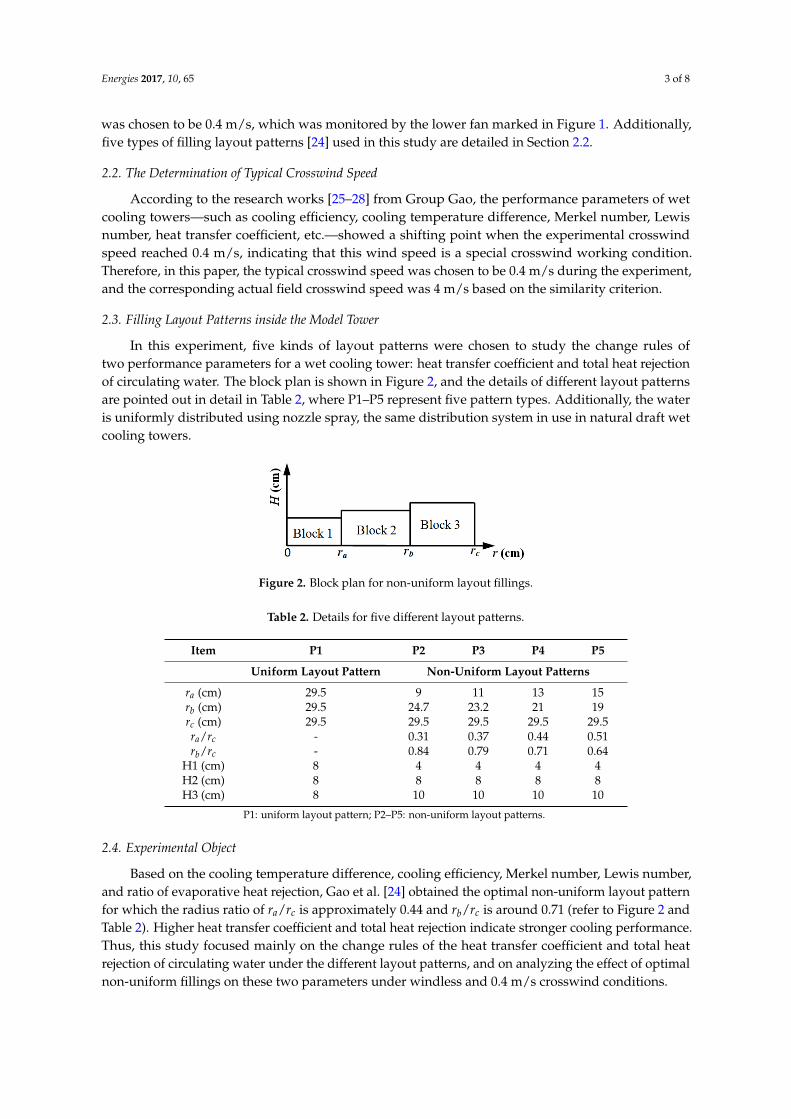
Under the windless conditions, the relationship curves between heat transfer coefficient, totalheat rejection of circulating water, and five kinds of layout patterns are shown in Figures 3 and 4 fortwo different operating conditions, with the circulating water inlet temperature being 50 ◦C and 60 ◦C,and the circulating water rate being 6 L/min.
In this thermal-state model study, drift losses are slight and can be neglected, so the heat transfercoefficient αv is defined by
αv =Cma · G(θ2 − θ1)
(tm − θm) · V(1)
In the formula above, Cma is the specific heat of wet air at the outlet of the model tower (kJ/kg ◦C);G is the airflow rate (kg/s); and θ1 and θ2 represent the inlet and outlet air temperature of the modeltower (◦C). Additionally, tm is the average value of inlet and outlet circulating water temperature, andθm is the average value of θ1 and θ2. Finally, V represents the exit area of fillings (m2).
Figure 3 describes the change rules of heat transfer coefficient under five kinds of layout patterns.The heat transfer coefficient under non-uniform fillings is obviously higher than that under the uniformpattern, and pattern P4 is the optimal non-uniform layout pattern. Experimental results demonstratethat—compared with the uniform layout pattern (P1)—the heat transfer coefficient in P4 pattern canincrease by approximately 40%.
Energies 2017, 10, 65 4 of 8
Under the windless conditions, the relationship curves between heat transfer coefficient, total heat rejection of circulating water, and five kinds of layout patterns are shown in Figures 3 and 4 for two different operating conditions, with the circulating water inlet temperature being 50 °C and 60 °C, and the circulating water rate being 6 L/min.
In this thermal-state model study, drift losses are slight and can be neglected, so the heat transfer coefficient vα is defined by
( )2 1
( )ma
vm m
C Gt V
θ θα
θ⋅ −
=− ⋅
(1)
In the formula above, maC is the specific heat of wet air at the outlet of the model tower (kJ/kg °C); G is the airflow rate (kg/s); and 1θ and 2θ represent the inlet and outlet air temperature of the model tower (°C). Additionally, mt is the average value of inlet and outlet circulating water temperature, and mθ is the average value of 1θ and 2θ . Finally, V represents the exit area of fillings (m2).
Figure 3 describes the change rules of heat transfer coefficient under five kinds of layout patterns. The heat transfer coefficient under non-uniform fillings is obviously higher than that under the uniform pattern, and pattern P4 is the optimal non-uniform layout pattern. Experimental results demonstrate that—compared with the uniform layout pattern (P1)—the heat transfer coefficient in P4 pattern can increase by approximately 40%.
Figure 3. Relationship curves between heat transfer coefficient and filling layout patterns. OC1: Operating conditions 1 (50 °C, 6 L/min); OC2: Operating conditions 2 (60 °C, 6 L/min).
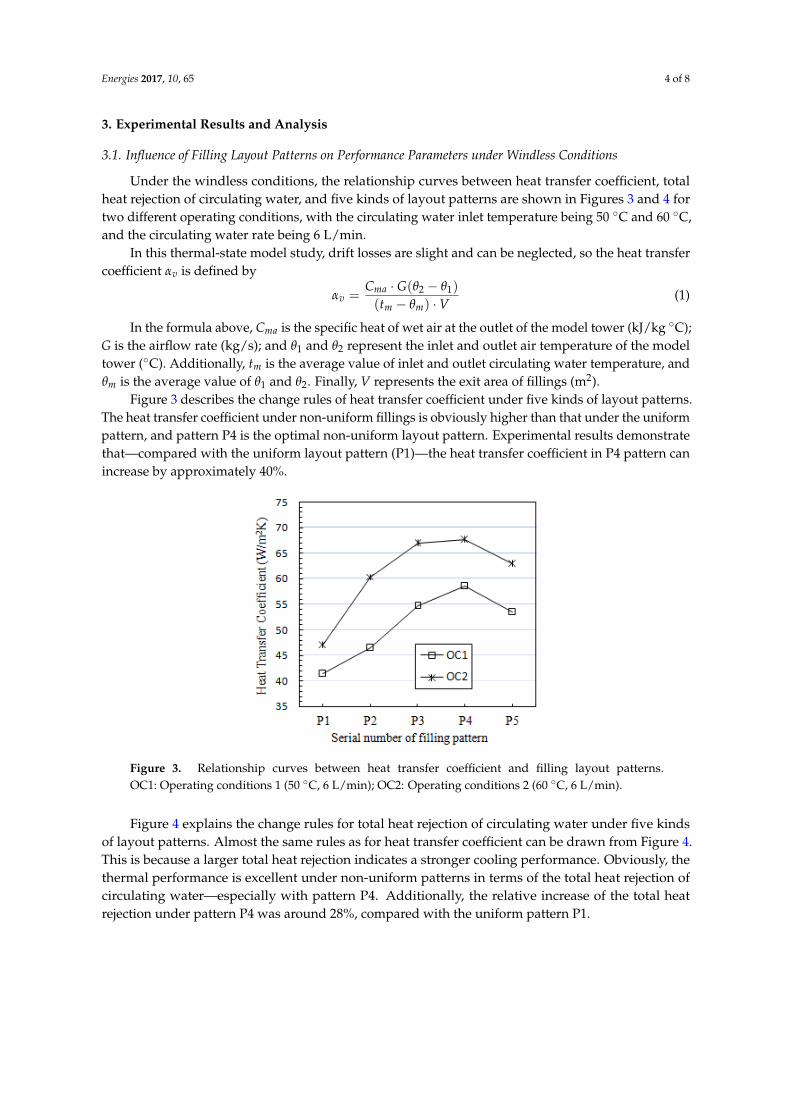
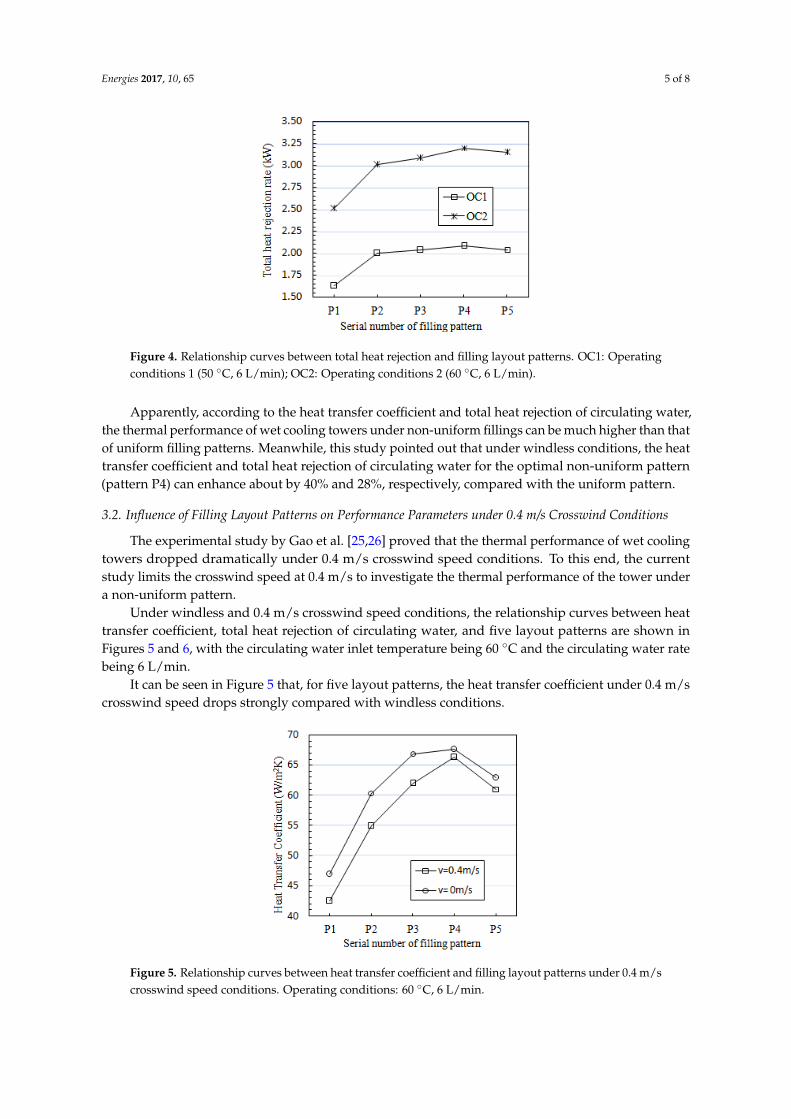
Figure 4 explains the change rules for total heat rejection of circulating water under five kinds of layout patterns. Almost the same rules as for heat transfer coefficient can be drawn from Figure 4. This is because a larger total heat rejection indicates a stronger cooling performance. Obviously, the thermal performance is excellent under non-uniform patterns in terms of the total heat rejection of circulating water—especially with pattern P4. Additionally, the relative increase of the total heat rejection under pattern P4 was around 28%, compared with the uniform pattern P1.
Figure 3. Relationship curves between heat transfer coefficient and filling layout patterns.OC1: Operating conditions 1 (50 ◦C, 6 L/min); OC2: Operating conditions 2 (60 ◦C, 6 L/min).
Figure 4 explains the change rules for total heat rejection of circulating water under five kindsof layout patterns. Almost the same rules as for heat transfer coefficient can be drawn from Figure 4.This is because a larger total heat rejection indicates a stronger cooling performance. Obviously, thethermal performance is excellent under non-uniform patterns in terms of the total heat rejection ofcirculating water—especially with pattern P4. Additionally, the relative increase of the total heatrejection under pattern P4 was around 28%, compared with the uniform pattern P1.
Energies 2017, 10, 65 5 of 8Energies 2017, 10, 65 5 of 8
Figure 4. Relationship curves between total heat rejection and filling layout patterns. OC1: Operating conditions 1 (50 °C, 6 L/min); OC2: Operating conditions 2 (60 °C, 6 L/min).
Apparently, according to the heat transfer coefficient and total heat rejection of circulating water, the thermal performance of wet cooling towers under non-uniform fillings can be much higher than that of uniform filling patterns. Meanwhile, this study pointed out that under windless conditions, the heat transfer coefficient and total heat rejection of circulating water for the optimal non-uniform pattern (pattern P4) can enhance about by 40% and 28%, respectively, compared with the uniform pattern.
3.2. Influence of Filling Layout Patterns on Performance Parameters under 0.4 m/s Crosswind Conditions
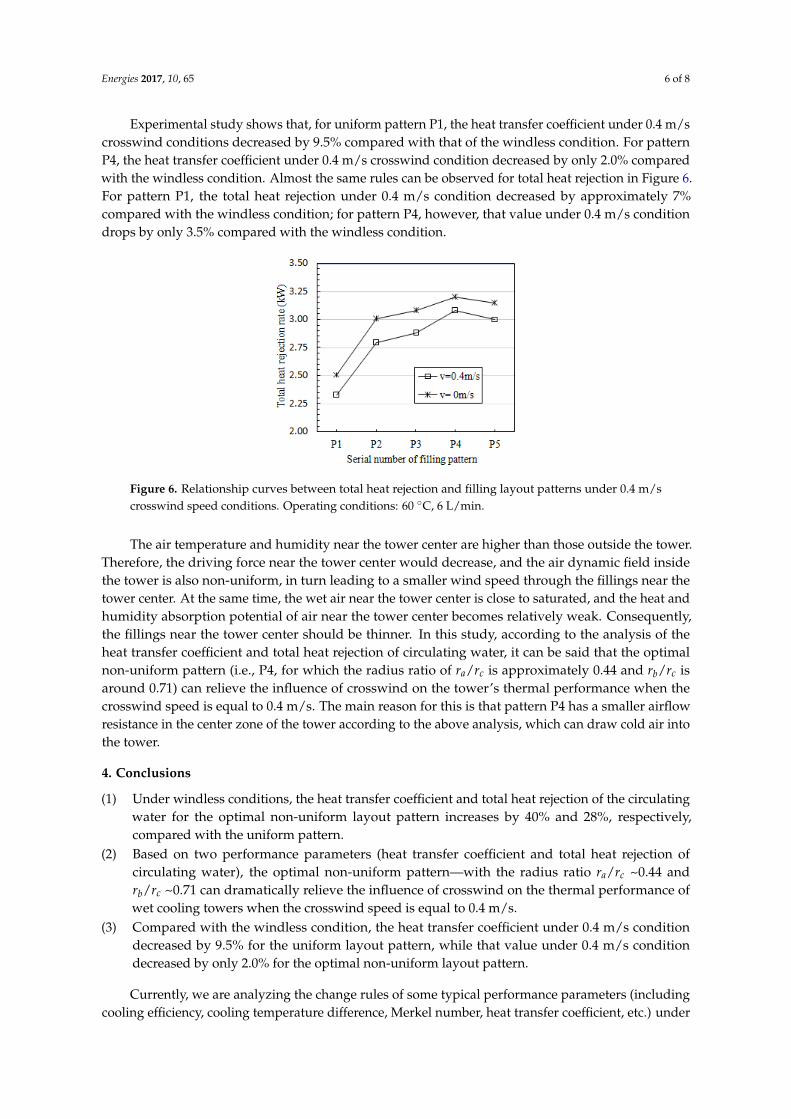
The experimental study by Gao et al. [25,26] proved that the thermal performance of wet cooling towers dropped dramatically under 0.4 m/s crosswind speed conditions. To this end, the current study limits the crosswind speed at 0.4 m/s to investigate the thermal performance of the tower under a non-uniform pattern.
Under windless and 0.4 m/s crosswind speed conditions, the relationship curves between heat transfer coefficient, total heat rejection of circulating water, and five layout patterns are shown in Figures 5 and 6, with the circulating water inlet temperature being 60 °C and the circulating water rate being 6 L/min.
It can be seen in Figure 5 that, for five layout patterns, the heat transfer coefficient under 0.4 m/s crosswind speed drops strongly compared with windless conditions.
Figure 5. Relationship curves between heat transfer coefficient and filling layout patterns under 0.4 m/s crosswind speed conditions. Operating conditions: 60 °C, 6 L/min.
Experimental study shows that, for uniform pattern P1, the heat transfer coefficient under 0.4 m/s crosswind conditions decreased by 9.5% compared with that of the windless condition. For
Figure 4. Relationship curves between total heat rejection and filling layout patterns. OC1: Operatingconditions 1 (50 ◦C, 6 L/min); OC2: Operating conditions 2 (60 ◦C, 6 L/min).
Apparently, according to the heat transfer coefficient and total heat rejection of circulating water,the thermal performance of wet cooling towers under non-uniform fillings can be much higher than thatof uniform filling patterns. Meanwhile, this study pointed out that under windless conditions, the heattransfer coefficient and total heat rejection of circulating water for the optimal non-uniform pattern(pattern P4) can enhance about by 40% and 28%, respectively, compared with the uniform pattern.
3.2. Influence of Filling Layout Patterns on Performance Parameters under 0.4 m/s Crosswind Conditions
The experimental study by Gao et al. [25,26] proved that the thermal performance of wet coolingtowers dropped dramatically under 0.4 m/s crosswind speed conditions. To this end, the currentstudy limits the crosswind speed at 0.4 m/s to investigate the thermal performance of the tower undera non-uniform pattern.
Under windless and 0.4 m/s crosswind speed conditions, the relationship curves between heattransfer coefficient, total heat rejection of circulating water, and five layout patterns are shown inFigures 5 and 6, with the circulating water inlet temperature being 60 ◦C and the circulating water ratebeing 6 L/min.
It can be seen in Figure 5 that, for five layout patterns, the heat transfer coefficient under 0.4 m/scrosswind speed drops strongly compared with windless conditions.
Energies 2017, 10, 65 5 of 8
Figure 4. Relationship curves between total heat rejection and filling layout patterns. OC1: Operating conditions 1 (50 °C, 6 L/min); OC2: Operating conditions 2 (60 °C, 6 L/min).
Apparently, according to the heat transfer coefficient and total heat rejection of circulating water, the thermal performance of wet cooling towers under non-uniform fillings can be much higher than that of uniform filling patterns. Meanwhile, this study pointed out that under windless conditions, the heat transfer coefficient and total heat rejection of circulating water for the optimal non-uniform pattern (pattern P4) can enhance about by 40% and 28%, respectively, compared with the uniform pattern.
3.2. Influence of Filling Layout Patterns on Performance Parameters under 0.4 m/s Crosswind Conditions
The experimental study by Gao et al. [25,26] proved that the thermal performance of wet cooling towers dropped dramatically under 0.4 m/s crosswind speed conditions. To this end, the current study limits the crosswind speed at 0.4 m/s to investigate the thermal performance of the tower under a non-uniform pattern.
Under windless and 0.4 m/s crosswind speed conditions, the relationship curves between heat transfer coefficient, total heat rejection of circulating water, and five layout patterns are shown in Figures 5 and 6, with the circulating water inlet temperature being 60 °C and the circulating water rate being 6 L/min.
It can be seen in Figure 5 that, for five layout patterns, the heat transfer coefficient under 0.4 m/s crosswind speed drops strongly compared with windless conditions.
Figure 5. Relationship curves between heat transfer coefficient and filling layout patterns under 0.4 m/s crosswind speed conditions. Operating conditions: 60 °C, 6 L/min.
Experimental study shows that, for uniform pattern P1, the heat transfer coefficient under 0.4 m/s crosswind conditions decreased by 9.5% compared with that of the windless condition. For
Figure 5. Relationship curves between heat transfer coefficient and filling layout patterns under 0.4 m/scrosswind speed conditions. Operating conditions: 60 ◦C, 6 L/min.
Energies 2017, 10, 65 6 of 8
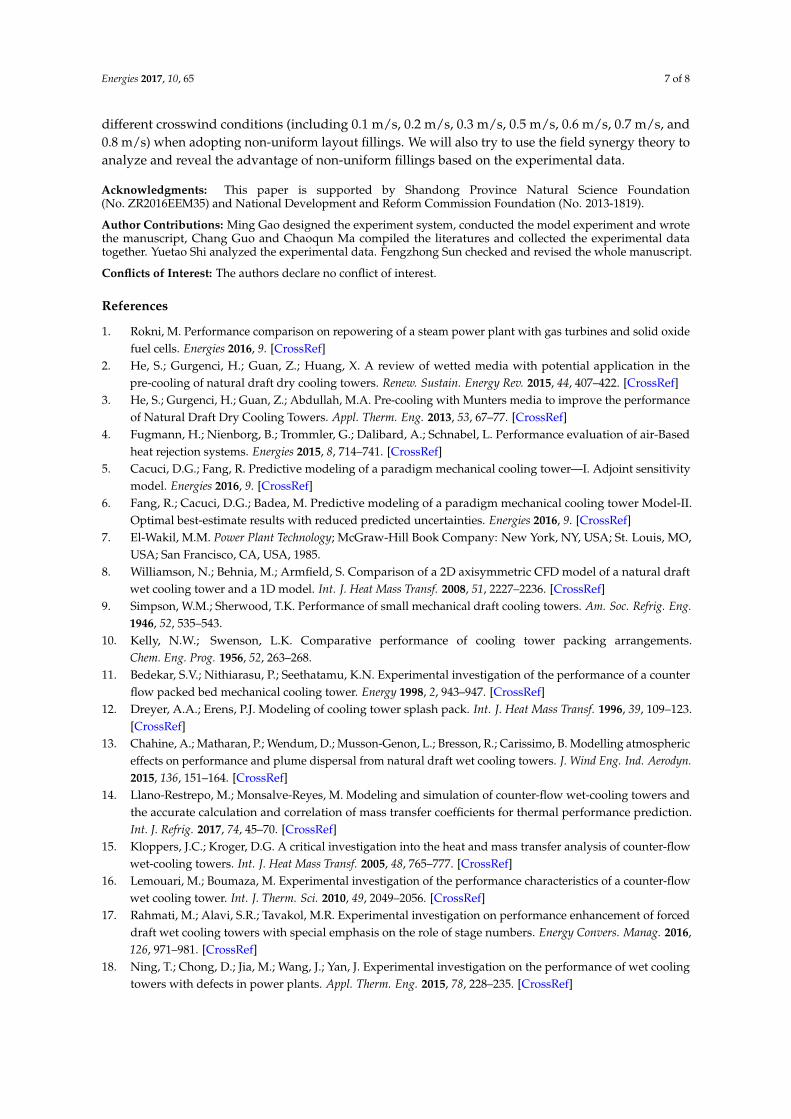
Experimental study shows that, for uniform pattern P1, the heat transfer coefficient under 0.4 m/scrosswind conditions decreased by 9.5% compared with that of the windless condition. For patternP4, the heat transfer coefficient under 0.4 m/s crosswind condition decreased by only 2.0% comparedwith the windless condition. Almost the same rules can be observed for total heat rejection in Figure 6.For pattern P1, the total heat rejection under 0.4 m/s condition decreased by approximately 7%compared with the windless condition; for pattern P4, however, that value under 0.4 m/s conditiondrops by only 3.5% compared with the windless condition.
Energies 2017, 10, 65 6 of 8
pattern P4, the heat transfer coefficient under 0.4 m/s crosswind condition decreased by only 2.0% compared with the windless condition. Almost the same rules can be observed for total heat rejection in Figure 6. For pattern P1, the total heat rejection under 0.4 m/s condition decreased by approximately 7% compared with the windless condition; for pattern P4, however, that value under 0.4 m/s condition drops by only 3.5% compared with the windless condition.
Figure 6. Relationship curves between total heat rejection and filling layout patterns under 0.4 m/s crosswind speed conditions. Operating conditions: 60 °C, 6 L/min.
The air temperature and humidity near the tower center are higher than those outside the tower. Therefore, the driving force near the tower center would decrease, and the air dynamic field inside the tower is also non-uniform, in turn leading to a smaller wind speed through the fillings near the tower center. At the same time, the wet air near the tower center is close to saturated, and the heat and humidity absorption potential of air near the tower center becomes relatively weak. Consequently, the fillings near the tower center should be thinner. In this study, according to the analysis of the heat transfer coefficient and total heat rejection of circulating water, it can be said that the optimal non-uniform pattern (i.e., P4, for which the radius ratio of ra/rc is approximately 0.44 and rb/rc is around 0.71) can relieve the influence of crosswind on the tower’s thermal performance when the crosswind speed is equal to 0.4 m/s. The main reason for this is that pattern P4 has a smaller airflow resistance in the center zone of the tower according to the above analysis, which can draw cold air into the tower.
4. Conclusions
(1) Under windless conditions, the heat transfer coefficient and total heat rejection of the circulating water for the optimal non-uniform layout pattern increases by 40% and 28%, respectively, compared with the uniform pattern.
(2) Based on two performance parameters (heat transfer coefficient and total heat rejection of circulating water), the optimal non-uniform pattern—with the radius ratio ra/rc ~ 0.44 and rb/rc ~ 0.71 can dramatically relieve the influence of crosswind on the thermal performance of wet cooling towers when the crosswind speed is equal to 0.4 m/s.
(3) Compared with the windless condition, the heat transfer coefficient under 0.4 m/s condition decreased by 9.5% for the uniform layout pattern, while that value under 0.4 m/s condition decreased by only 2.0% for the optimal non-uniform layout pattern.
Currently, we are analyzing the change rules of some typical performance parameters (including cooling efficiency, cooling temperature difference, Merkel number, heat transfer coefficient, etc.) under different crosswind conditions (including 0.1 m/s, 0.2 m/s, 0.3 m/s, 0.5 m/s, 0.6 m/s, 0.7 m/s, and 0.8 m/s) when adopting non-uniform layout fillings. We will also try to use the field synergy theory to analyze and reveal the advantage of non-uniform fillings based on the experimental data.
Figure 6. Relationship curves between total heat rejection and filling layout patterns under 0.4 m/scrosswind speed conditions. Operating conditions: 60 ◦C, 6 L/min.
The air temperature and humidity near the tower center are higher than those outside the tower.Therefore, the driving force near the tower center would decrease, and the air dynamic field insidethe tower is also non-uniform, in turn leading to a smaller wind speed through the fillings near thetower center. At the same time, the wet air near the tower center is close to saturated, and the heat andhumidity absorption potential of air near the tower center becomes relatively weak. Consequently,the fillings near the tower center should be thinner. In this study, according to the analysis of theheat transfer coefficient and total heat rejection of circulating water, it can be said that the optimalnon-uniform pattern (i.e., P4, for which the radius ratio of ra/rc is approximately 0.44 and rb/rc isaround 0.71) can relieve the influence of crosswind on the tower’s thermal performance when thecrosswind speed is equal to 0.4 m/s. The main reason for this is that pattern P4 has a smaller airflowresistance in the center zone of the tower according to the above analysis, which can draw cold air intothe tower.
4. Conclusions
(1) Under windless conditions, the heat transfer coefficient and total heat rejection of the circulatingwater for the optimal non-uniform layout pattern increases by 40% and 28%, respectively,compared with the uniform pattern.
(2) Based on two performance parameters (heat transfer coefficient and total heat rejection ofcirculating water), the optimal non-uniform pattern—with the radius ratio ra/rc ~0.44 andrb/rc ~0.71 can dramatically relieve the influence of crosswind on the thermal performance ofwet cooling towers when the crosswind speed is equal to 0.4 m/s.
(3) Compared with the windless condition, the heat transfer coefficient under 0.4 m/s conditiondecreased by 9.5% for the uniform layout pattern, while that value under 0.4 m/s conditiondecreased by only 2.0% for the optimal non-uniform layout pattern.
Currently, we are analyzing the change rules of some typical performance parameters (includingcooling efficiency, cooling temperature difference, Merkel number, heat transfer coefficient, etc.) under
Energies 2017, 10, 65 7 of 8
different crosswind conditions (including 0.1 m/s, 0.2 m/s, 0.3 m/s, 0.5 m/s, 0.6 m/s, 0.7 m/s, and0.8 m/s) when adopting non-uniform layout fillings. We will also try to use the field synergy theory toanalyze and reveal the advantage of non-uniform fillings based on the experimental data.
Acknowledgments: This paper is supported by Shandong Province Natural Science Foundation(No. ZR2016EEM35) and National Development and Reform Commission Foundation (No. 2013-1819).
Author Contributions: Ming Gao designed the experiment system, conducted the model experiment and wrotethe manuscript, Chang Guo and Chaoqun Ma compiled the literatures and collected the experimental datatogether. Yuetao Shi analyzed the experimental data. Fengzhong Sun checked and revised the whole manuscript.
Conflicts of Interest: The authors declare no conflict of interest.
References
1. Rokni, M. Performance comparison on repowering of a steam power plant with gas turbines and solid oxidefuel cells. Energies 2016, 9. [CrossRef]
2. He, S.; Gurgenci, H.; Guan, Z.; Huang, X. A review of wetted media with potential application in thepre-cooling of natural draft dry cooling towers. Renew. Sustain. Energy Rev. 2015, 44, 407–422. [CrossRef]
3. He, S.; Gurgenci, H.; Guan, Z.; Abdullah, M.A. Pre-cooling with Munters media to improve the performanceof Natural Draft Dry Cooling Towers. Appl. Therm. Eng. 2013, 53, 67–77. [CrossRef]
4. Fugmann, H.; Nienborg, B.; Trommler, G.; Dalibard, A.; Schnabel, L. Performance evaluation of air-Basedheat rejection systems. Energies 2015, 8, 714–741. [CrossRef]
5. Cacuci, D.G.; Fang, R. Predictive modeling of a paradigm mechanical cooling tower—I. Adjoint sensitivitymodel. Energies 2016, 9. [CrossRef]
6. Fang, R.; Cacuci, D.G.; Badea, M. Predictive modeling of a paradigm mechanical cooling tower Model-II.Optimal best-estimate results with reduced predicted uncertainties. Energies 2016, 9. [CrossRef]
7. El-Wakil, M.M. Power Plant Technology; McGraw-Hill Book Company: New York, NY, USA; St. Louis, MO,USA; San Francisco, CA, USA, 1985.
8. Williamson, N.; Behnia, M.; Armfield, S. Comparison of a 2D axisymmetric CFD model of a natural draftwet cooling tower and a 1D model. Int. J. Heat Mass Transf. 2008, 51, 2227–2236. [CrossRef]
9. Simpson, W.M.; Sherwood, T.K. Performance of small mechanical draft cooling towers. Am. Soc. Refrig. Eng.1946, 52, 535–543.
10. Kelly, N.W.; Swenson, L.K. Comparative performance of cooling tower packing arrangements.Chem. Eng. Prog. 1956, 52, 263–268.
11. Bedekar, S.V.; Nithiarasu, P.; Seethatamu, K.N. Experimental investigation of the performance of a counterflow packed bed mechanical cooling tower. Energy 1998, 2, 943–947. [CrossRef]
12. Dreyer, A.A.; Erens, P.J. Modeling of cooling tower splash pack. Int. J. Heat Mass Transf. 1996, 39, 109–123.[CrossRef]
13. Chahine, A.; Matharan, P.; Wendum, D.; Musson-Genon, L.; Bresson, R.; Carissimo, B. Modelling atmosphericeffects on performance and plume dispersal from natural draft wet cooling towers. J. Wind Eng. Ind. Aerodyn.2015, 136, 151–164. [CrossRef]
14. Llano-Restrepo, M.; Monsalve-Reyes, M. Modeling and simulation of counter-flow wet-cooling towers andthe accurate calculation and correlation of mass transfer coefficients for thermal performance prediction.Int. J. Refrig. 2017, 74, 45–70. [CrossRef]
15. Kloppers, J.C.; Kroger, D.G. A critical investigation into the heat and mass transfer analysis of counter-flowwet-cooling towers. Int. J. Heat Mass Transf. 2005, 48, 765–777. [CrossRef]
16. Lemouari, M.; Boumaza, M. Experimental investigation of the performance characteristics of a counter-flowwet cooling tower. Int. J. Therm. Sci. 2010, 49, 2049–2056. [CrossRef]
17. Rahmati, M.; Alavi, S.R.; Tavakol, M.R. Experimental investigation on performance enhancement of forceddraft wet cooling towers with special emphasis on the role of stage numbers. Energy Convers. Manag. 2016,126, 971–981. [CrossRef]
18. Ning, T.; Chong, D.; Jia, M.; Wang, J.; Yan, J. Experimental investigation on the performance of wet coolingtowers with defects in power plants. Appl. Therm. Eng. 2015, 78, 228–235. [CrossRef]
Energies 2017, 10, 65 8 of 8
19. Lavasani, A.M.; Baboli, Z.N.; Zamanizadeh, M.; Zareh, M. Experimental study on the thermal performanceof mechanical cooling tower with rotational splash type packing. Energy Convers. Manag. 2014, 87, 530–538.[CrossRef]
20. Klimanek, A.; Bialecki, R.A. Solution of heat and mass transfer in counter-flow wet-cooling tower fills.Int. Commun. Heat Mass Transf. 2009, 36, 547–553. [CrossRef]
21. Williamson, N.; Armfield, S.; Behnia, M. Numerical simulation of flow in a natural draft wet coolingtower-The effect of radial thermos-fluid fields. Appl. Therm. Eng. 2008, 28, 178–189. [CrossRef]
22. Nicolas, B.; Antoine, B.; Matthieu, M. Development and validation of a CFD model for numerical simulationof a large natural draft wet cooling tower. Appl. Therm. Eng. 2016, 105, 953–960.
23. Bilal, A.Q.; Syed, M.Z. A complete model of wet cooling towers with fouling in fills. Appl. Therm. Eng. 2006,26, 1982–1989.
24. Gao, M.; Zhang, L.; Wang, N.; Shi, Y.; Sun, F. Influence of non-uniform layout fillings on thermal performancefor wet cooling tower. Appl. Therm. Eng. 2016, 93, 549–555. [CrossRef]
25. Gao, M.; Shi, Y.; Wang, N.; Zhao, Y.; Sun, F. Artificial neural network model research on effects of cross-windto performance parameters of wet cooling tower based on level Froude number. Appl. Therm. Eng. 2013, 51,1226–1234. [CrossRef]
26. Gao, M.; Sun, F.; Wang, K.; Shi, Y.; Zhao, Y. Experimental research of heat transfer performance on naturaldraft counter flow wet cooling tower under cross-wind conditions. Int. J. Therm. Sci. 2008, 47, 935–941.[CrossRef]
27. Gao, M.; Sun, F.; Turan, A. Experimental study regarding the evolution of temperature profiles inside wetcooling tower under crosswind conditions. Int. J. Therm. Sci. 2014, 86, 284–291. [CrossRef]
28. Gao, M.; Sun, F.; Wang, N.; Zhao, Y. Experimental research on circumferential inflow air and vortexdistribution for wet cooling tower under crosswind conditions. Appl. Therm. Eng. 2014, 64, 93–100.[CrossRef]
© 2017 by the authors; licensee MDPI, Basel, Switzerland. This article is an open accessarticle distributed under the terms and conditions of the Creative Commons Attribution(CC-BY) license (http://creativecommons.org/licenses/by/4.0/).