Embed Size (px)
Citation preview
Thermal Model of the Build Environment for Polyamide Powder
Selective Laser Sintering
Timothy T. Diller∗ Rameshwar Sreenivasan Joseph Beaman David BourellJanna LaRocco
Laboratory for Freeform FabricationDepartment of Mechanical Engineering
The University of Texas at AustinAustin, Texas
Abstract
Precise thermal control of selective laser sintering(SLS) is desirable for improving geometric accuracy,mechanical properties, and surface finish of nylon, orpolyamide (PA) parts. A modeling and measurementsystem was set up to facilitate development of ther-mal control strategies to improve these characteris-tics. A SinterStation 2500 SLS machine was used asa test machine for studying builds of parts made ofDuraformTM PM nylon powder. Internal tempera-ture measurements of the process were made usingresistance temperature detectors (RTDs) embeddedin the part bed powder. Surface temperature wasmeasured with an infra-red camera aimed throughthe front window. A macro-scale time-dependentthermal numerical model of the build chamber andpowder bins was developed as a means of evaluatingtemperature control of the build process. By compar-ing the measured and predicted temperature profiles,various estimates of the thermal diffusivity of the ny-lon powder were evaluated.
∗Address all correspondence to this author [email protected].
Background
Build quality of parts made by SLS is determined byseveral critical criteria, including material strength,surface finish, and dimensional tolerances. These arestrongly influenced by the thermal history and geo-metric details of the part.
Modification of build geometry to accommodatefor thermal shrinkage has largely been done basedon empirical observation of part deformation afteran initial build. Part shrinkage is a function of thethermal gradients in the X-Y plane, that is, in theplane of the build. Manetsberger et al [1] developeda model to predict part shrinkage based on geometryand the thermal environment. Shrinkage in a givenbuild layer is a function of time, temperature, andpressure from the weight of powder above the givenlayer.
Previous efforts to model thermal aspects of SLSprocesses with finite-element methods have focusedon the small-scale sintering process in the immediateneighborhood of the laser-beam [2–5].
In this work, we broaden the previous work on ther-mal modeling of SLS processes by taking a macro-scopic view of the process and through simulation ofthe entire thermal environment of the build cham-ber with the goal of refining the modeled boundarycondition at the surface of the part bin.
Material Properties
Several approaches have been used to form an ef-fective thermal conductivity, kef , for SLS powders[3, 6–8].
Dong et al made an estimate based on porosity, ε,shown in Eq (1). [3]
kef = ks (1 − Cε) (1)
where ks = 0.28(
WmK
)is the thermal conductivity of
the solid material, C = 1.11 is an empirical constantand ε is defined in terms of the densities of the powderρpowder and the solid ρsolid:
ε = 1 − ρpowder
ρsolid(2)
The density of the Duraform PATM powder wasmeasured by building a cubic shell and carefully mea-suring its mass and volume. The cube was emp-tied and carefully cleaned, and the shell’s mass andinternal volume were measured again. The den-sity of the powder in the cake surrounding a sin-tered part was found to be ρpowder = 490
(kg/m3
).
ρpowder = 1010(kg/m3
)was used for the density of
solid nylon. This yielded a relative part bed porosityof ε = 49%.
Thus, using the porosity method, the estimate ofthe thermal conductivity of the powder according toEquation (1) was kef = 0.17 (W/mK). This methodis considered an upper limit on kef since it assumes abulk solid with pores and is valid over higher rangesof ε that might be found in a sintered part.
The method used by Gusarov et al is based onthermal contact between spherical particles but doesnot account for the conductivity of the interstitialgas [6]. The estimate of kef is given in Eq (3):
kef = ks
(pnπ
)x (3)
where p is the relative density, p = 1 − ε, n is thecoordination number based on the packing configu-ration, and x is the contact surface ratio, x = a
R ,where a is the radius of the circular contact regionbetween particles, and R is the particle radius. Therelative density for nylon-12 powder in this study wasp = 0.49 which fell between the calculated relative
densities for simple-cubic and diamond packing con-figurations. The coordination number was estimateby performing a linear interpolation based on the rel-ative densities and coordination numbers of the sim-ple cubic and diamond packing configurations to findnest = 0.88.
By this method, kef is dependent on the contactsurface ratio, which was unknown at the time of thestudy:
kef = 0.88ksx (4)
This relation is valid for 0 < x < 0.3, which is given asa reasonable range for non-sintered powders. Thus,a reasonable upper limit on kef by this method iskef = 0.074
(WmK
). The contact surface ratio in-
creases during heating as the powder particles deformand begin to sinter, so that the conductivity may bemuch lower at the beginning of the build than it is atthe end.
Other, more detailed models [7–10] include the ef-fects of interstitial gas and require less empirical fit-ting but require much more detailed physical char-acterization of the particles, such as particle surfaceroughness and deformation properties. At the timeof publication, the necessary data for commercial PApowders for SLS was not available in the literature.
A reasonable lower limit for kef is the ther-mal conductivity of the interstitial gas: kN2 =
0.033 (W/mK). The specific heat of c = 1800(
JkgK
)was assumed to be the same for powder and solidnylon.
In recent work by Dong et al [3], the heat flux atthe part bin powder surface was modeled as a poroussolid as in Eq (5):
−ke∂T
∂z
∣∣∣∣surf
= h (Ta − Tsurf ) + εRσ(T 4surf − T 4
∞)(5)
with the convective coefficient assumed to be h =25 W
m2K .
Method
Equipment
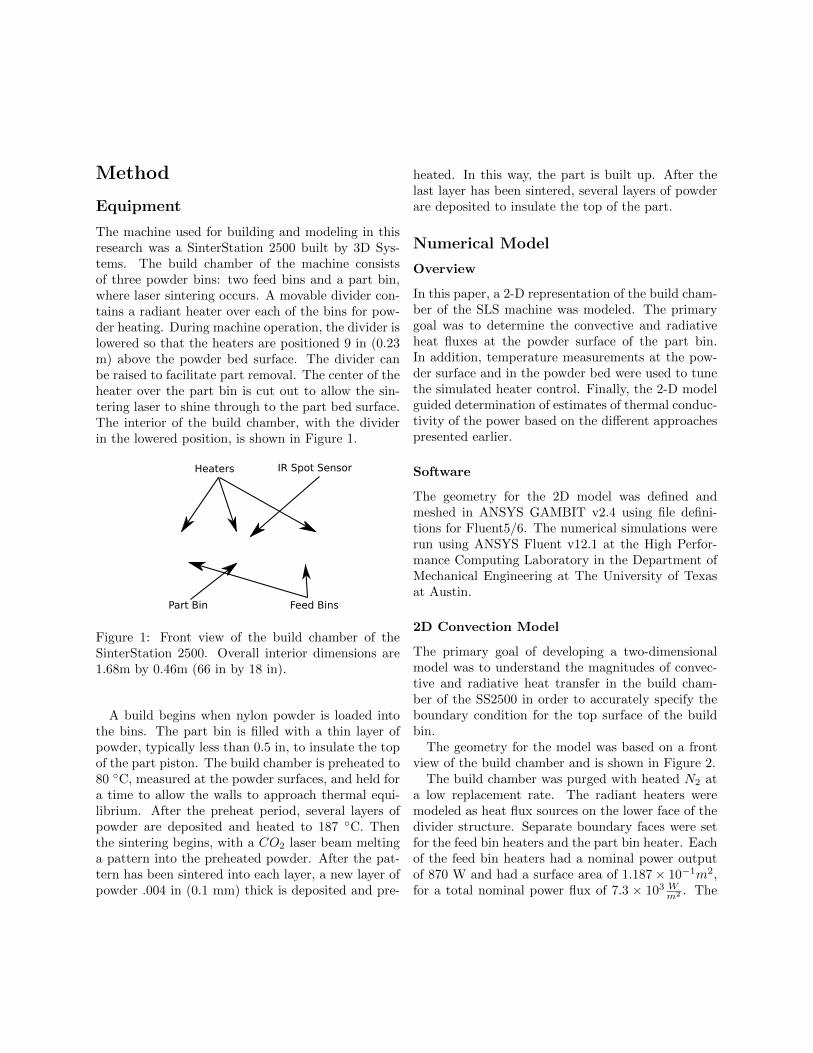
The machine used for building and modeling in thisresearch was a SinterStation 2500 built by 3D Sys-tems. The build chamber of the machine consistsof three powder bins: two feed bins and a part bin,where laser sintering occurs. A movable divider con-tains a radiant heater over each of the bins for pow-der heating. During machine operation, the divider islowered so that the heaters are positioned 9 in (0.23m) above the powder bed surface. The divider canbe raised to facilitate part removal. The center of theheater over the part bin is cut out to allow the sin-tering laser to shine through to the part bed surface.The interior of the build chamber, with the dividerin the lowered position, is shown in Figure 1.
Figure 1: Front view of the build chamber of theSinterStation 2500. Overall interior dimensions are1.68m by 0.46m (66 in by 18 in).
A build begins when nylon powder is loaded intothe bins. The part bin is filled with a thin layer ofpowder, typically less than 0.5 in, to insulate the topof the part piston. The build chamber is preheated to80 C, measured at the powder surfaces, and held fora time to allow the walls to approach thermal equi-librium. After the preheat period, several layers ofpowder are deposited and heated to 187 C. Thenthe sintering begins, with a CO2 laser beam meltinga pattern into the preheated powder. After the pat-tern has been sintered into each layer, a new layer ofpowder .004 in (0.1 mm) thick is deposited and pre-
heated. In this way, the part is built up. After thelast layer has been sintered, several layers of powderare deposited to insulate the top of the part.
Numerical Model
Overview
In this paper, a 2-D representation of the build cham-ber of the SLS machine was modeled. The primarygoal was to determine the convective and radiativeheat fluxes at the powder surface of the part bin.In addition, temperature measurements at the pow-der surface and in the powder bed were used to tunethe simulated heater control. Finally, the 2-D modelguided determination of estimates of thermal conduc-tivity of the power based on the different approachespresented earlier.
Software
The geometry for the 2D model was defined andmeshed in ANSYS GAMBIT v2.4 using file defini-tions for Fluent5/6. The numerical simulations wererun using ANSYS Fluent v12.1 at the High Perfor-mance Computing Laboratory in the Department ofMechanical Engineering at The University of Texasat Austin.
2D Convection Model
The primary goal of developing a two-dimensionalmodel was to understand the magnitudes of convec-tive and radiative heat transfer in the build cham-ber of the SS2500 in order to accurately specify theboundary condition for the top surface of the buildbin.
The geometry for the model was based on a frontview of the build chamber and is shown in Figure 2.
The build chamber was purged with heated N2 ata low replacement rate. The radiant heaters weremodeled as heat flux sources on the lower face of thedivider structure. Separate boundary faces were setfor the feed bin heaters and the part bin heater. Eachof the feed bin heaters had a nominal power outputof 870 W and had a surface area of 1.187 × 10⁻¹m2,for a total nominal power flux of 7.3 × 10³ W
m2 . The
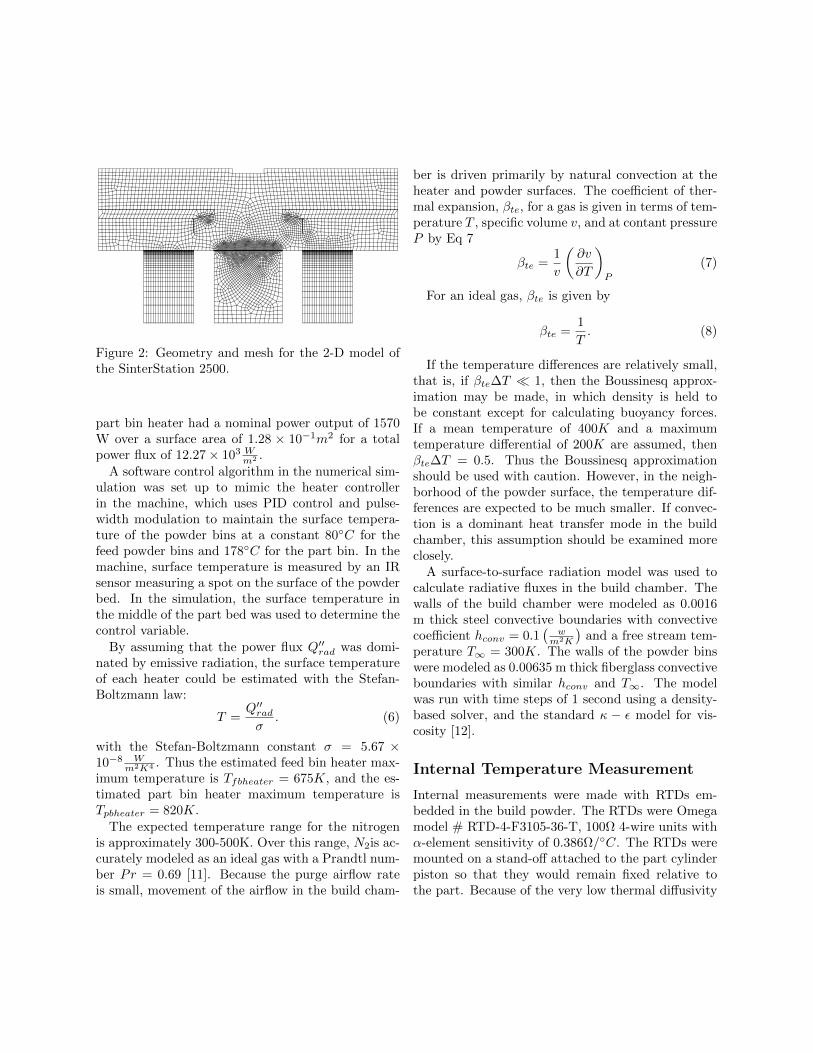
Figure 2: Geometry and mesh for the 2-D model ofthe SinterStation 2500.
part bin heater had a nominal power output of 1570W over a surface area of 1.28 × 10⁻¹m2 for a totalpower flux of 12.27 × 10³ W
m2 .
A software control algorithm in the numerical sim-ulation was set up to mimic the heater controllerin the machine, which uses PID control and pulse-width modulation to maintain the surface tempera-ture of the powder bins at a constant 80C for thefeed powder bins and 178C for the part bin. In themachine, surface temperature is measured by an IRsensor measuring a spot on the surface of the powderbed. In the simulation, the surface temperature inthe middle of the part bed was used to determine thecontrol variable.
By assuming that the power flux Q′′rad was domi-nated by emissive radiation, the surface temperatureof each heater could be estimated with the Stefan-Boltzmann law:
T =Q′′radσ
. (6)
with the Stefan-Boltzmann constant σ = 5.67 ×10⁻⁸ W
m2K4 . Thus the estimated feed bin heater max-imum temperature is Tfbheater = 675K, and the es-timated part bin heater maximum temperature isTpbheater = 820K.
The expected temperature range for the nitrogenis approximately 300-500K. Over this range, N2is ac-curately modeled as an ideal gas with a Prandtl num-ber Pr = 0.69 [11]. Because the purge airflow rateis small, movement of the airflow in the build cham-
ber is driven primarily by natural convection at theheater and powder surfaces. The coefficient of ther-mal expansion, βte, for a gas is given in terms of tem-perature T , specific volume v, and at contant pressureP by Eq 7
βte =1
v
(∂v
∂T
)P
(7)
For an ideal gas, βte is given by
βte =1
T. (8)
If the temperature differences are relatively small,that is, if βte∆T 1, then the Boussinesq approx-imation may be made, in which density is held tobe constant except for calculating buoyancy forces.If a mean temperature of 400K and a maximumtemperature differential of 200K are assumed, thenβte∆T = 0.5. Thus the Boussinesq approximationshould be used with caution. However, in the neigh-borhood of the powder surface, the temperature dif-ferences are expected to be much smaller. If convec-tion is a dominant heat transfer mode in the buildchamber, this assumption should be examined moreclosely.
A surface-to-surface radiation model was used tocalculate radiative fluxes in the build chamber. Thewalls of the build chamber were modeled as 0.0016m thick steel convective boundaries with convectivecoefficient hconv = 0.1
(w
m2K
)and a free stream tem-
perature T∞ = 300K. The walls of the powder binswere modeled as 0.00635 m thick fiberglass convectiveboundaries with similar hconv and T∞. The modelwas run with time steps of 1 second using a density-based solver, and the standard κ − ε model for vis-cosity [12].
Internal Temperature Measurement
Internal measurements were made with RTDs em-bedded in the build powder. The RTDs were Omegamodel # RTD-4-F3105-36-T, 100Ω 4-wire units withα-element sensitivity of 0.386Ω/C. The RTDs weremounted on a stand-off attached to the part cylinderpiston so that they would remain fixed relative tothe part. Because of the very low thermal diffusivity
of the nylon powder, it was critical to minimize thethermal conductivity of the support structure. Thus,a cork standoff was used to support the RTDs.
The RTD signal was recorded every second with aNational Instruments NI 9217 data acquisition sys-tem with analog to digital conversion resolution of 24bits. With the temperature range set to 300-500K,the resolution was 1.2 × 10⁻²K.
Surface Temperature Measurement
Measurements of the temperature at the surface ofthe part bin were made by means of an infrared (IR)camera. The camera was a FLIR model A325 ther-mal imaging camera, with a 320X240 pixel resolutionand 16-bit resolution. The sensor in the camera mea-sured long-wave (8 − 12µm) IR radiation. For themeasurements, the camera temperature range was setto 0-500C, yielding a thermal resolution of about0.03C. Absolute accuracy of the camera was 2 Cfor surfaces of known emissivity. Image acquisitionrate was adjustable from one-time frame acquisitions(0 Hz) up to 60 times per second. A wide-field lenswas fitted to the camera to allow a 90 field of view.
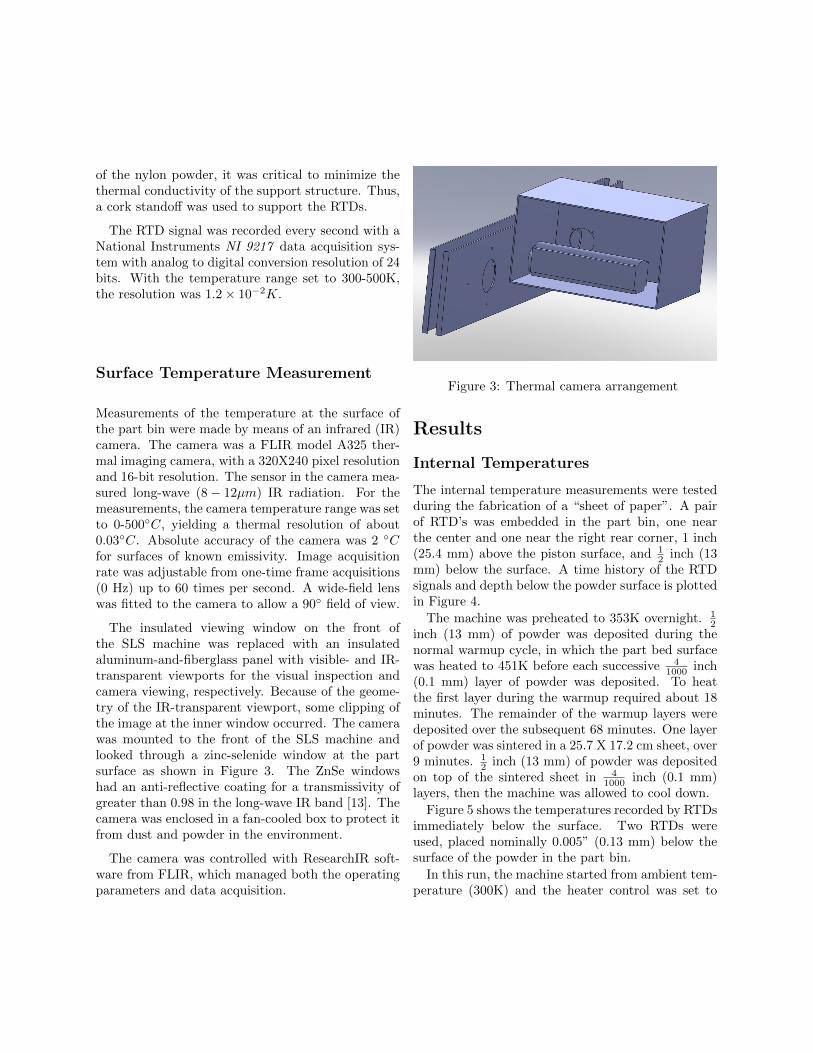
The insulated viewing window on the front ofthe SLS machine was replaced with an insulatedaluminum-and-fiberglass panel with visible- and IR-transparent viewports for the visual inspection andcamera viewing, respectively. Because of the geome-try of the IR-transparent viewport, some clipping ofthe image at the inner window occurred. The camerawas mounted to the front of the SLS machine andlooked through a zinc-selenide window at the partsurface as shown in Figure 3. The ZnSe windowshad an anti-reflective coating for a transmissivity ofgreater than 0.98 in the long-wave IR band [13]. Thecamera was enclosed in a fan-cooled box to protect itfrom dust and powder in the environment.
The camera was controlled with ResearchIR soft-ware from FLIR, which managed both the operatingparameters and data acquisition.
Figure 3: Thermal camera arrangement
Results
Internal Temperatures
The internal temperature measurements were testedduring the fabrication of a “sheet of paper”. A pairof RTD’s was embedded in the part bin, one nearthe center and one near the right rear corner, 1 inch(25.4 mm) above the piston surface, and 1
2 inch (13mm) below the surface. A time history of the RTDsignals and depth below the powder surface is plottedin Figure 4.
The machine was preheated to 353K overnight. 12
inch (13 mm) of powder was deposited during thenormal warmup cycle, in which the part bed surfacewas heated to 451K before each successive 4
1000 inch(0.1 mm) layer of powder was deposited. To heatthe first layer during the warmup required about 18minutes. The remainder of the warmup layers weredeposited over the subsequent 68 minutes. One layerof powder was sintered in a 25.7 X 17.2 cm sheet, over9 minutes. 1
2 inch (13 mm) of powder was depositedon top of the sintered sheet in 4
1000 inch (0.1 mm)layers, then the machine was allowed to cool down.
Figure 5 shows the temperatures recorded by RTDsimmediately below the surface. Two RTDs wereused, placed nominally 0.005” (0.13 mm) below thesurface of the powder in the part bin.
In this run, the machine started from ambient tem-perature (300K) and the heater control was set to
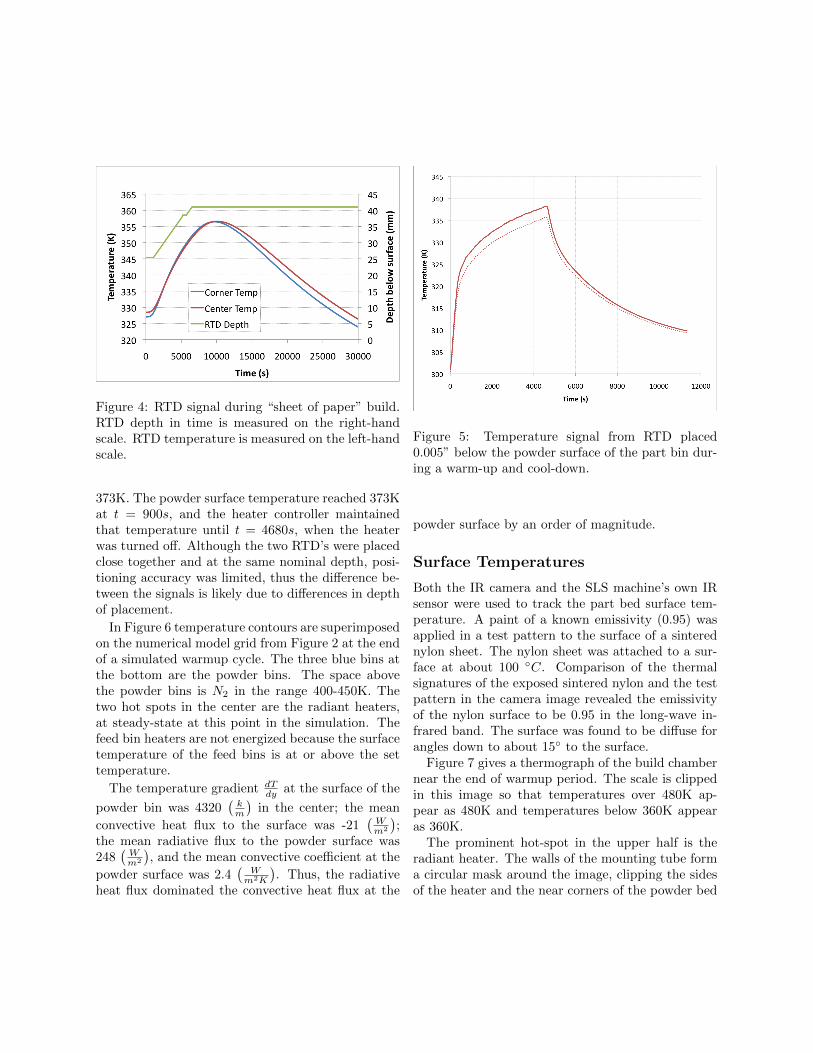
Figure 4: RTD signal during “sheet of paper” build.RTD depth in time is measured on the right-handscale. RTD temperature is measured on the left-handscale.
373K. The powder surface temperature reached 373Kat t = 900s, and the heater controller maintainedthat temperature until t = 4680s, when the heaterwas turned off. Although the two RTD’s were placedclose together and at the same nominal depth, posi-tioning accuracy was limited, thus the difference be-tween the signals is likely due to differences in depthof placement.
In Figure 6 temperature contours are superimposedon the numerical model grid from Figure 2 at the endof a simulated warmup cycle. The three blue bins atthe bottom are the powder bins. The space abovethe powder bins is N2 in the range 400-450K. Thetwo hot spots in the center are the radiant heaters,at steady-state at this point in the simulation. Thefeed bin heaters are not energized because the surfacetemperature of the feed bins is at or above the settemperature.
The temperature gradient dTdy at the surface of the
powder bin was 4320(
km
)in the center; the mean
convective heat flux to the surface was -21(Wm2
);
the mean radiative flux to the powder surface was248
(Wm2
), and the mean convective coefficient at the
powder surface was 2.4(
Wm2K
). Thus, the radiative
heat flux dominated the convective heat flux at the
Figure 5: Temperature signal from RTD placed0.005” below the powder surface of the part bin dur-ing a warm-up and cool-down.
powder surface by an order of magnitude.
Surface Temperatures
Both the IR camera and the SLS machine’s own IRsensor were used to track the part bed surface tem-perature. A paint of a known emissivity (0.95) wasapplied in a test pattern to the surface of a sinterednylon sheet. The nylon sheet was attached to a sur-face at about 100 C. Comparison of the thermalsignatures of the exposed sintered nylon and the testpattern in the camera image revealed the emissivityof the nylon surface to be 0.95 in the long-wave in-frared band. The surface was found to be diffuse forangles down to about 15 to the surface.
Figure 7 gives a thermograph of the build chambernear the end of warmup period. The scale is clippedin this image so that temperatures over 480K ap-pear as 480K and temperatures below 360K appearas 360K.
The prominent hot-spot in the upper half is theradiant heater. The walls of the mounting tube forma circular mask around the image, clipping the sidesof the heater and the near corners of the powder bed
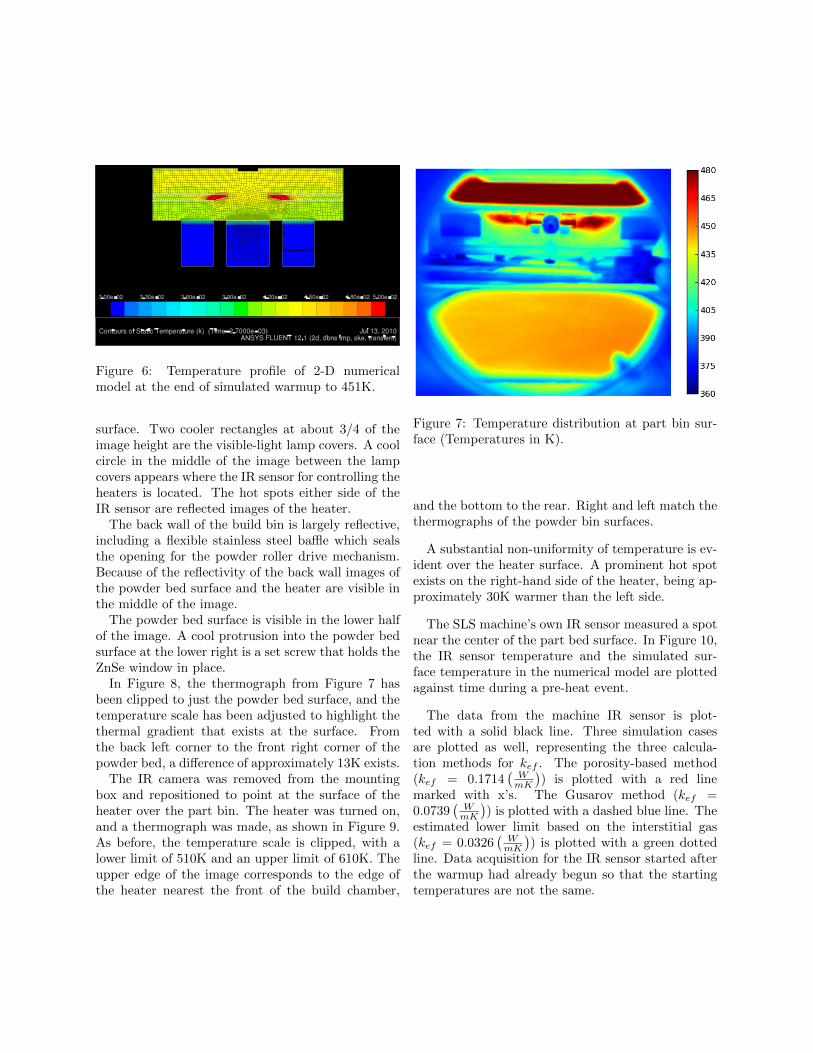
Figure 6: Temperature profile of 2-D numericalmodel at the end of simulated warmup to 451K.
surface. Two cooler rectangles at about 3/4 of theimage height are the visible-light lamp covers. A coolcircle in the middle of the image between the lampcovers appears where the IR sensor for controlling theheaters is located. The hot spots either side of theIR sensor are reflected images of the heater.
The back wall of the build bin is largely reflective,including a flexible stainless steel baffle which sealsthe opening for the powder roller drive mechanism.Because of the reflectivity of the back wall images ofthe powder bed surface and the heater are visible inthe middle of the image.
The powder bed surface is visible in the lower halfof the image. A cool protrusion into the powder bedsurface at the lower right is a set screw that holds theZnSe window in place.
In Figure 8, the thermograph from Figure 7 hasbeen clipped to just the powder bed surface, and thetemperature scale has been adjusted to highlight thethermal gradient that exists at the surface. Fromthe back left corner to the front right corner of thepowder bed, a difference of approximately 13K exists.
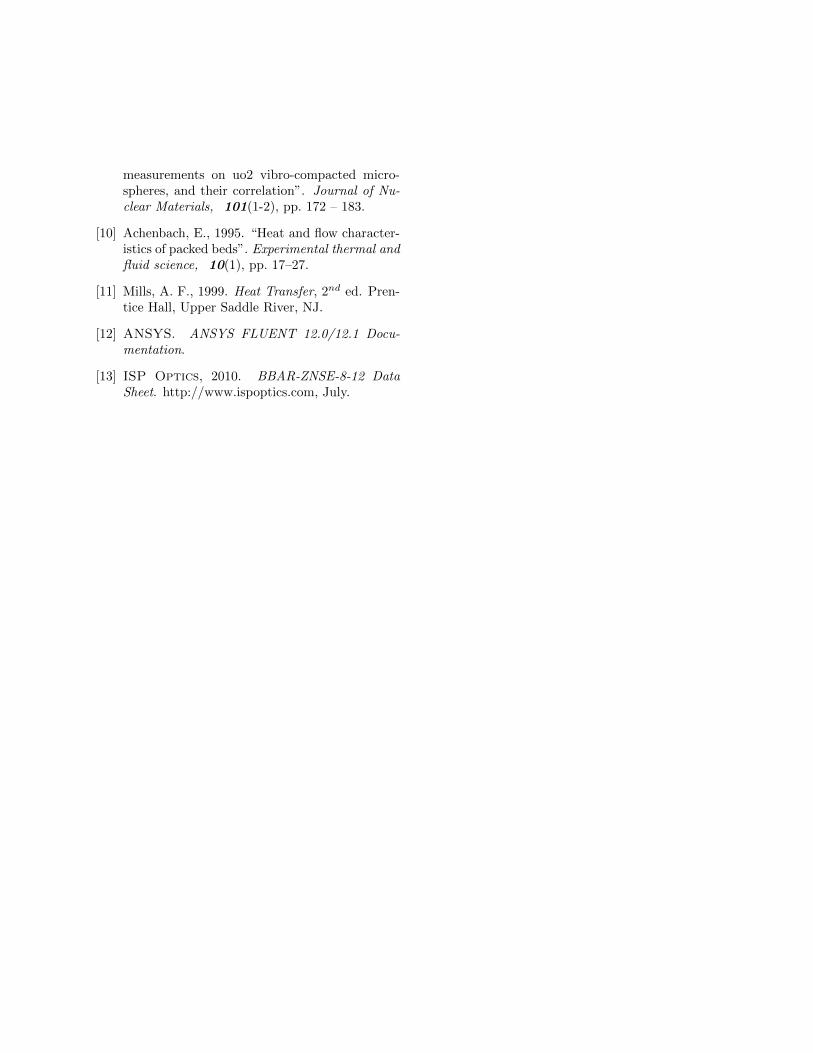
The IR camera was removed from the mountingbox and repositioned to point at the surface of theheater over the part bin. The heater was turned on,and a thermograph was made, as shown in Figure 9.As before, the temperature scale is clipped, with alower limit of 510K and an upper limit of 610K. Theupper edge of the image corresponds to the edge ofthe heater nearest the front of the build chamber,
Figure 7: Temperature distribution at part bin sur-face (Temperatures in K).
and the bottom to the rear. Right and left match thethermographs of the powder bin surfaces.
A substantial non-uniformity of temperature is ev-ident over the heater surface. A prominent hot spotexists on the right-hand side of the heater, being ap-proximately 30K warmer than the left side.
The SLS machine’s own IR sensor measured a spotnear the center of the part bed surface. In Figure 10,the IR sensor temperature and the simulated sur-face temperature in the numerical model are plottedagainst time during a pre-heat event.
The data from the machine IR sensor is plot-ted with a solid black line. Three simulation casesare plotted as well, representing the three calcula-tion methods for kef . The porosity-based method(kef = 0.1714
(WmK
)) is plotted with a red line
marked with x’s. The Gusarov method (kef =0.0739
(WmK
)) is plotted with a dashed blue line. The
estimated lower limit based on the interstitial gas(kef = 0.0326
(WmK
)) is plotted with a green dotted
line. Data acquisition for the IR sensor started afterthe warmup had already begun so that the startingtemperatures are not the same.
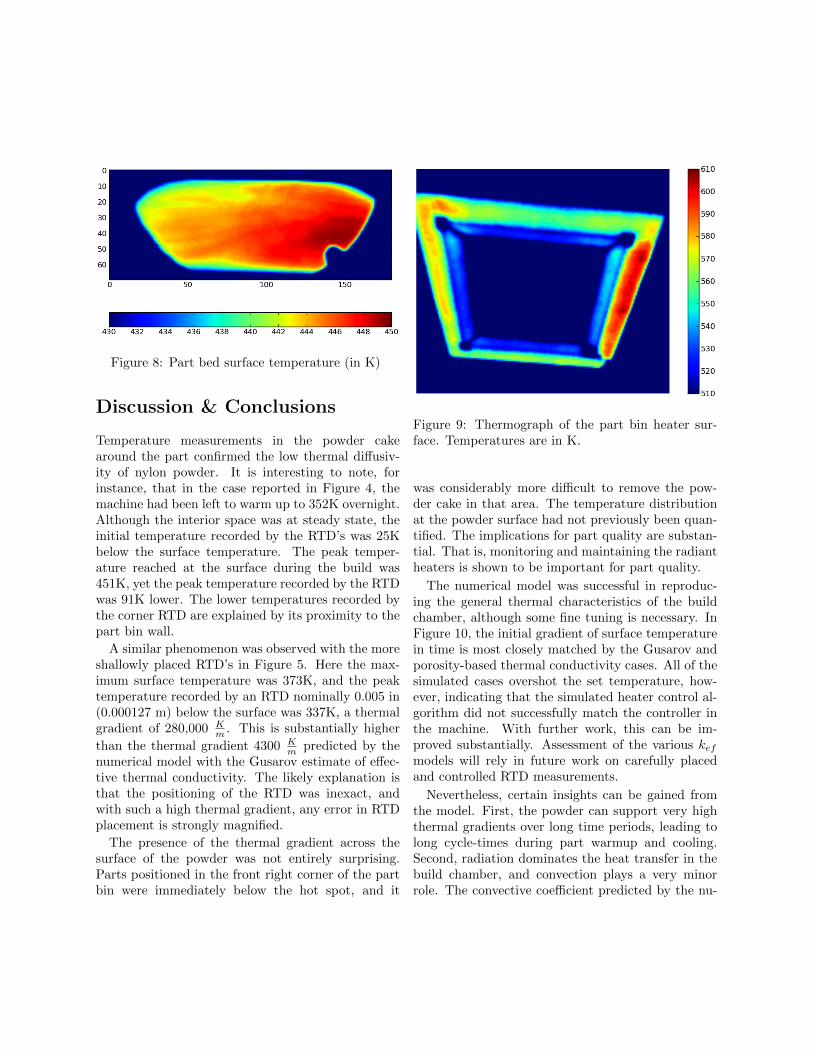
Figure 8: Part bed surface temperature (in K)
Discussion & Conclusions
Temperature measurements in the powder cakearound the part confirmed the low thermal diffusiv-ity of nylon powder. It is interesting to note, forinstance, that in the case reported in Figure 4, themachine had been left to warm up to 352K overnight.Although the interior space was at steady state, theinitial temperature recorded by the RTD’s was 25Kbelow the surface temperature. The peak temper-ature reached at the surface during the build was451K, yet the peak temperature recorded by the RTDwas 91K lower. The lower temperatures recorded bythe corner RTD are explained by its proximity to thepart bin wall.
A similar phenomenon was observed with the moreshallowly placed RTD’s in Figure 5. Here the max-imum surface temperature was 373K, and the peaktemperature recorded by an RTD nominally 0.005 in(0.000127 m) below the surface was 337K, a thermalgradient of 280,000 K
m . This is substantially higher
than the thermal gradient 4300 Km predicted by the
numerical model with the Gusarov estimate of effec-tive thermal conductivity. The likely explanation isthat the positioning of the RTD was inexact, andwith such a high thermal gradient, any error in RTDplacement is strongly magnified.
The presence of the thermal gradient across thesurface of the powder was not entirely surprising.Parts positioned in the front right corner of the partbin were immediately below the hot spot, and it
Figure 9: Thermograph of the part bin heater sur-face. Temperatures are in K.
was considerably more difficult to remove the pow-der cake in that area. The temperature distributionat the powder surface had not previously been quan-tified. The implications for part quality are substan-tial. That is, monitoring and maintaining the radiantheaters is shown to be important for part quality.
The numerical model was successful in reproduc-ing the general thermal characteristics of the buildchamber, although some fine tuning is necessary. InFigure 10, the initial gradient of surface temperaturein time is most closely matched by the Gusarov andporosity-based thermal conductivity cases. All of thesimulated cases overshot the set temperature, how-ever, indicating that the simulated heater control al-gorithm did not successfully match the controller inthe machine. With further work, this can be im-proved substantially. Assessment of the various kefmodels will rely in future work on carefully placedand controlled RTD measurements.
Nevertheless, certain insights can be gained fromthe model. First, the powder can support very highthermal gradients over long time periods, leading tolong cycle-times during part warmup and cooling.Second, radiation dominates the heat transfer in thebuild chamber, and convection plays a very minorrole. The convective coefficient predicted by the nu-
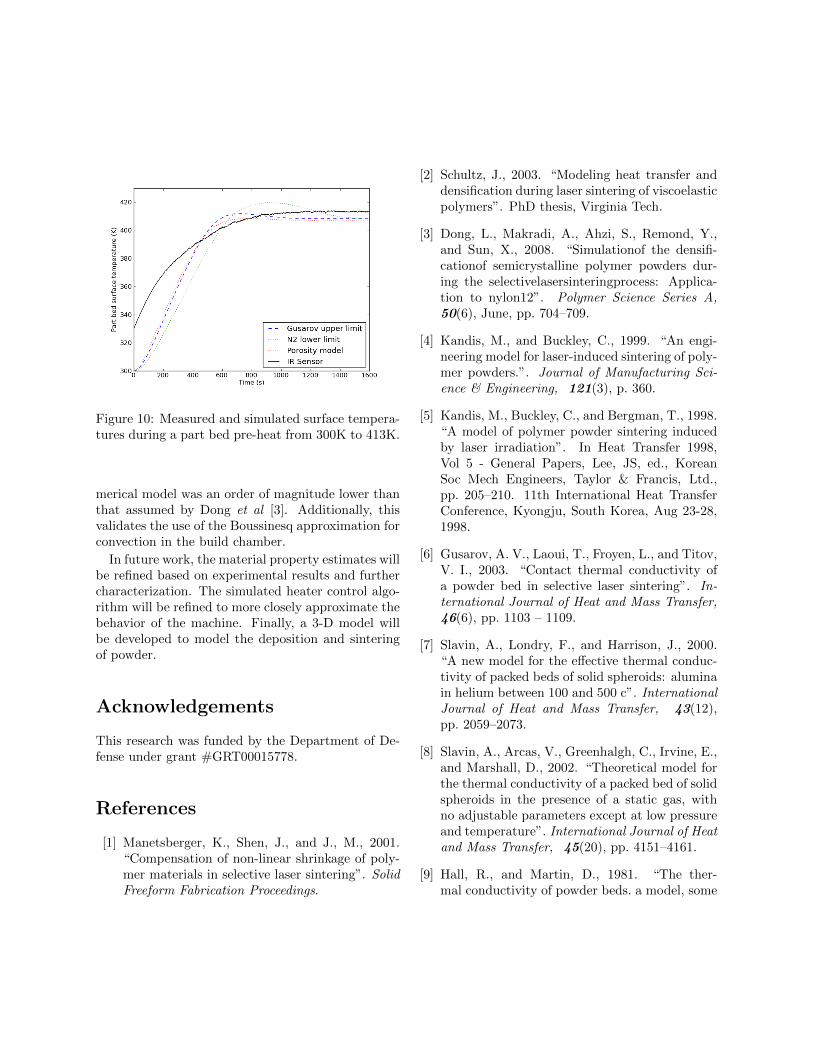
Figure 10: Measured and simulated surface tempera-tures during a part bed pre-heat from 300K to 413K.
merical model was an order of magnitude lower thanthat assumed by Dong et al [3]. Additionally, thisvalidates the use of the Boussinesq approximation forconvection in the build chamber.
In future work, the material property estimates willbe refined based on experimental results and furthercharacterization. The simulated heater control algo-rithm will be refined to more closely approximate thebehavior of the machine. Finally, a 3-D model willbe developed to model the deposition and sinteringof powder.
Acknowledgements
This research was funded by the Department of De-fense under grant #GRT00015778.
References
[1] Manetsberger, K., Shen, J., and J., M., 2001.“Compensation of non-linear shrinkage of poly-mer materials in selective laser sintering”. SolidFreeform Fabrication Proceedings.
[2] Schultz, J., 2003. “Modeling heat transfer anddensification during laser sintering of viscoelasticpolymers”. PhD thesis, Virginia Tech.
[3] Dong, L., Makradi, A., Ahzi, S., Remond, Y.,and Sun, X., 2008. “Simulationof the densifi-cationof semicrystalline polymer powders dur-ing the selectivelasersinteringprocess: Applica-tion to nylon12”. Polymer Science Series A,50(6), June, pp. 704–709.
[4] Kandis, M., and Buckley, C., 1999. “An engi-neering model for laser-induced sintering of poly-mer powders.”. Journal of Manufacturing Sci-ence & Engineering, 121(3), p. 360.
[5] Kandis, M., Buckley, C., and Bergman, T., 1998.“A model of polymer powder sintering inducedby laser irradiation”. In Heat Transfer 1998,Vol 5 - General Papers, Lee, JS, ed., KoreanSoc Mech Engineers, Taylor & Francis, Ltd.,pp. 205–210. 11th International Heat TransferConference, Kyongju, South Korea, Aug 23-28,1998.
[6] Gusarov, A. V., Laoui, T., Froyen, L., and Titov,V. I., 2003. “Contact thermal conductivity ofa powder bed in selective laser sintering”. In-ternational Journal of Heat and Mass Transfer,46(6), pp. 1103 – 1109.
[7] Slavin, A., Londry, F., and Harrison, J., 2000.“A new model for the effective thermal conduc-tivity of packed beds of solid spheroids: aluminain helium between 100 and 500 c”. InternationalJournal of Heat and Mass Transfer, 43(12),pp. 2059–2073.
[8] Slavin, A., Arcas, V., Greenhalgh, C., Irvine, E.,and Marshall, D., 2002. “Theoretical model forthe thermal conductivity of a packed bed of solidspheroids in the presence of a static gas, withno adjustable parameters except at low pressureand temperature”. International Journal of Heatand Mass Transfer, 45(20), pp. 4151–4161.
[9] Hall, R., and Martin, D., 1981. “The ther-mal conductivity of powder beds. a model, some
measurements on uo2 vibro-compacted micro-spheres, and their correlation”. Journal of Nu-clear Materials, 101(1-2), pp. 172 – 183.
[10] Achenbach, E., 1995. “Heat and flow character-istics of packed beds”. Experimental thermal andfluid science, 10(1), pp. 17–27.
[11] Mills, A. F., 1999. Heat Transfer, 2nd ed. Pren-tice Hall, Upper Saddle River, NJ.
[12] ANSYS. ANSYS FLUENT 12.0/12.1 Docu-mentation.
[13] ISP Optics, 2010. BBAR-ZNSE-8-12 DataSheet. http://www.ispoptics.com, July.


![Build Your Own Flat Panel Solar Thermal Collector[1]](https://img.pdfslide.us/doc/110x75/552a6e354a79597b6d8b45e5/build-your-own-flat-panel-solar-thermal-collector1.jpg)