Embed Size (px)
Citation preview
POSIVA OY
Working Report 2004-04
Thermal fxpansion Properties of Rocks: literature Survey and fstimation of Thermal fxpansion Coefficient
for Olkiluoto Mica Gneiss
Taija Huotari
llmo Kukkonen
February 2004
FIN-27160 OLKILUOTO, FINLAND
Tel . +358-2-8372 31
Fax +358-2-8372 3709
AUTHOR ORGANIZATION:
ORDERER:
NUMBER OF THE ORDER:
CONTACT PERSON OF THE ORDERER:
CONTACT PERSON OF THE AUTHOR ORGANIZATION:
Geological Survey of Finland P.O. Box 96 FIN -02151 Espoo Finland
Posiva Oy FIN-27160 Olkiluoto Finland
9705/02/ AJH
Aimo Hautojarvi
Ilmo Kukkonen
WORKINGREPORT~ JooV- ()y
THERMAL EXPANSION PROPERTIES OF ROCKS: LITERATURE SURVEY AND ESTIMATION OF THERMAL EXPANSION COEFFICIENT FOR OLKILUOTO MICA GNEISS
NAMES OF THE AUTHORS:
EXAMINER OF THE AUTHOR ORGANIZATION:
Viv.- 3;a;ro Ta~uotari, M.Sc. (Eng.)
Ilmo Kukkonen, Dr. Tech.
L,~ Lauri Eskola Research Professor Geophysical Research
Working Report 2004-04
Thermal fxpansion Properties of Rocks: literature Survey and fstimation of Thermal fxpansion Coefficient .
for Olkiluoto Mica Gneiss
Taija Huotari
llmo Kukkonen
February 2004
Working Report 2004-04
Thermal fxpansion Properties of Rocks: literature Survey and fstimation of Thermal fxpansion Coefficient
for Olkiluoto Mica Gneiss
Taija Huotari
llmo Kukkonen
Geological Survey of Finland
February 2004
Working Reports contain information on work in progress
or pending completion.
The conclusions and viewpoints presented in the report
are those of author(s) and do not necessarily
coincide with those of Posiva.
THERMAL EXPANSION PROPERTIES OF ROCKS: LITERATURE SURVEY AND ESTIMATION OF THERMAL EXPANSION COEFFICIENT FOR OLKILUOTO MICA GNEISS
ABSTRACT
The aim of this study is to present the theoretical basis of thermal expansion properties for rocks particularly considering the needs of the final disposal of spent nuclear fuel. The knowledge of behaviour of thermal expansion in rocks will be needed to define the effect of thermal expansion in rock mass under changing conditions. While temperature rises the rock mass will expand and cause increase in thermal stresses. That may lead to a situation where the rock exceeds some characteristic strength values.
The thermal expansion properties of rocks were studied by using data found in the literature. The data in the literature included basic theory, methods of measurement and values of thermal expansion coefficients of minerals and rocks. The phenomenon of thermal expansion in rocks and minerals has not been discussed very often in the literature. A few equipment suitable for measuring the thermal expansion of rocks were found to be used in measurements of thermal expansion of rocks. Estimations of the thermal expansion coefficient were also made to define the thermal expansion of the rock in the final disposal site. The estimation was mainly made with a few simple theoretical models, but also more complex particle mechanical models were used in estimation with a numerical modelling program PFC20 (Particle F1ow Code in 2 Dimensions).
In this study, it was found that the thermal expansion in the rocks is influenced by a number of factors, such as texture, constituent minerals, relative proportions of different minerals, mineral orientations, pore space, pressure, and temperature. The most suitable methods for measuring thermal expansion in rocks seem to be dilatometric and strain gauge methods. In dilatometric methods the expansion cannot be measured under load, but in strain gauge systems moderate loads can be applied. The use of weighted arithmetic means in theoretical estimation seems to give the closest value for thermal expansion coefficient compared to the measured coefficients in the literature. In the final disposal site at Olkiluoto the main rock type in the area is migmatitic mica gneiss. There the highest thermal expansion coefficient values are met with quartz and biotite. The theoretical estimation indicates that the linear thermal expansion coefficient of the Olkiluoto mica gneiss is 7-10 (1 o-6 !°C) in the temperatures between 20-60°C.
Keywords: thermal expansion, measurement methods, estimation, models, minerals, crystalline rocks, Olkiluoto, final disposal of spent fuel.
KIVIEN LAMPOLAAJENEMISOMINAISUUDET: KIRJALLISUUSTUTKIMUS SEKA OLKILUODON KIILLEGNEISSIN LAMPOLAAJENEMISKERTOIMEN ESTIMOINTI
TIIVISTELMA
Taman kirjallisuusraportin selvityskohteena on kivien lampolaajenemisominaisuudet huomioiden ydinjatteen loppusijoitussuunnittelun tarpeet. Tietoa kivien lampolaajenemisominaisuuksista tarvitaan, jotta voidaan maarittaa olosuhteiden muutosten vaikutus kivessa tapahtuvaan lampolaajenemiseen. Lampotilan noustessa kivi laajenenee ja lampojannitykset siina kasvavat, mika saattaajohtaa kiven rikkoutumiseen.
Kivien lampolaajenemisominaisuuksia tutkittiin kirjallisuudesta loytyvan tiedon avulla. Kirjallisuudesta saatu tieto sisalsi teoriaa, lampolaajenemisen mittausmenetelmia seka kiville ja mineraaleille maaritettyja lampolaajenemiskertoimen arvoja. Mineraalien ja kivien lampolaajenemista koskevia tietoja on raportoitu maailmalta varsin vahan. Tyossa kartoitettavia kivien lampolaajenemisen mittaukseen sopivia laitteita loytyi muutamia. Kirjallisuuden tutkimisen lisaksi tyossa kaytettiin estimointia loppusijoituskohteen paakivilajin lampolaajenemisen maarittamiseksi. Kivien lampolaajenemiskerrointa estimoitiin yksinkertaisilla teoreettisilla malleilla seka hieman monimutkaisemmilla partikkelimekaanisilla malleilla eli numeerisella mallinnusohj elmalla PFC2D (Particle Flow Code in 2 Dimensions).
Kivissa tapahtuva lampolaajeneminen on monen tekijan summa. Kivissa lampolaajenemiseen vaikuttavat mm. tekstuuri, mineraalikoostumus, eri mineraalien osuudet, mineraalien suuntautuneisuus, huokostilavuus, ymparoiva paine, lampotila jne. Kivien lampolaajenemiskertoimen maarittamiseen parhaiten soveltuviksi laboratoriomenetelmiksi todettiin dilatometrit ja venymaliuskat. Dilatometreilla ei tavallisesti voida mitata lampolaajenemista kuormituksen alaisena, kun taas venymaliuskojen kanssa voidaan kayttaa kohtuullista kuormaa. Kaytetty kuorma jaljittelee puristusta kallioperassa. Estimoinnissa kaytetty painotettu aritmeettinen keskiarvo antoi luotettavimman arvion lampolaajenemiskertoimelle kirjallisuudessa esiintyviin arvoihin verrattuna. Olkiluodossa yleisin kivilaji on migmatiittinen kiillegneissi, jossa suurimman lampolaajenemisen aiheuttavat kvartsi ja biotiitti. Teoreettisen estimoinnin perusteella Olkiluodon kiillegneissin pituuden lampolaajenemiskerroin on 7-10 (10-6/°C), kun lampotila on 20-60°C.
Avainsanat: lampolaajeneminen, mittausmenetelmat, estimointi, mallit, mineraalit, kiteiset kivilajit, Olkiluoto, kaytetyn ydinpolttoaineen loppusijoitus.
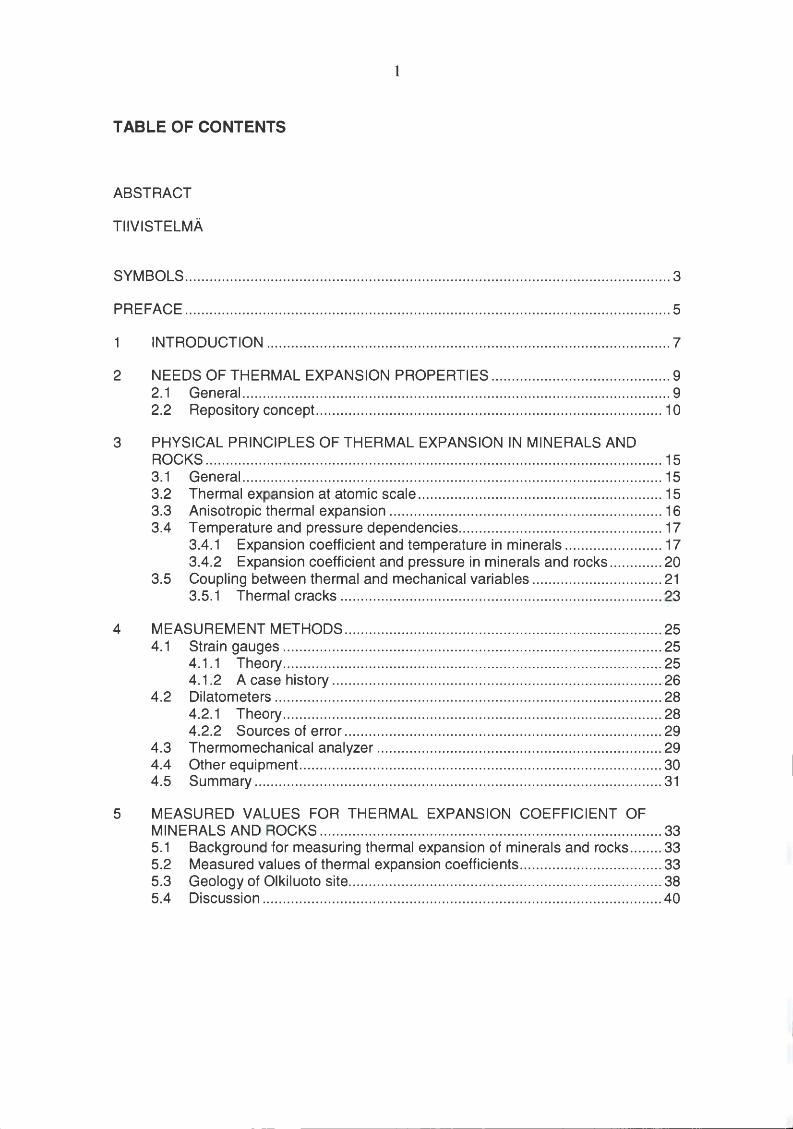
TABLE OF CONTENTS
ABSTRACT
TIIVISTELMA
1
SYMBOLS ....................................................................................................................... 3
PREFACE ....................................................................................................................... 5
1 INTRODUCTION ................................................................................................... 7
2 NEEDS OF THERMAL EXPANSION PROPERTIES ............................................ 9 2.1 General ......................................................................................................... 9 2.2 Repository concept ..................................................................................... 10
3 PHYSICAL PRINCIPLES OF THERMAL EXPANSION IN MINERALS AND ROCKS ................................................................................................................ 15 3.1 General ....................................................................................................... 15 3.2 Thermal expansion at atomic scale ............................................................ 15 3.3 Anisotropic thermal expansion ................................................................... 16 3.4 Temperature and pressure dependencies .................................................. 17
3.4.1 Expansion coefficient and temperature in minerals ........................ 17 3.4.2 Expansion coefficient and pressure in minerals and rocks ............. 20
3.5 Coupling between thermal and mechanical variables ................................ 21 3.5.1 Thermal cracks ............................................................................... 23
4 MEASUREMENT METHODS .............................................................................. 25 4.1 Strain gauges ............................................................................................. 25
4.1.1 Theory ............................................................................................. 25 4.1.2 A case history ................................................................................. 26
4.2 Dilatometers ............................................................................................... 28 4.2.1 Theory ............................................................................................. 28 4.2.2 Sources of error .............................................................................. 29
4.3 Thermomechanical analyzer ...................................................................... 29 4.4 Other equipment ......................................................................................... 30 4.5 Summary .................................................................................................... 31
5 MEASURED VALUES FOR THERMAL EXPANSION COEFFICIENT OF MINERALS AND ROCKS .................................................................................... 33 5.1 Background for measuring thermal expansion of minerals and rocks ........ 33 5.2 Measured values of thermal expansion coefficients ................................... 33 5.3 Geology of Olkiluoto site ............................................................................. 38 5.4 Discussion .................................................................................................. 40
2
6 ESTIMATION OF THERMAL EXPANSION COEFFICIENT WITH MODELS FOR OLKILUOTO MICA GNEISS ....................................................................... 43 6.1 Calculation of different mean values ............................... ........................... 43 6.2 Theoretical models ..................................................................................... 44
6.2.1 Model 1; linear expansion of one layer with different minerals ....... 44 6.2.2 Model 2; linear expansion of layers ................................................ 46 6.2.3 Model 3; volume expansion ............................................................ 47
6.3 Estimation with particle mechanical models ............................................... 51 6.3.1 Background of the modelling program PFC20
................................. 51 6.3.2 Single-mineral and three-mineral models ....................................... 52
7 CONCLUSIONS .............................................................................................. .... 55
ACKNOWLEDGEMENTS ............................................................................................. 57
REFERENCES ............................................................................................................. 59
3
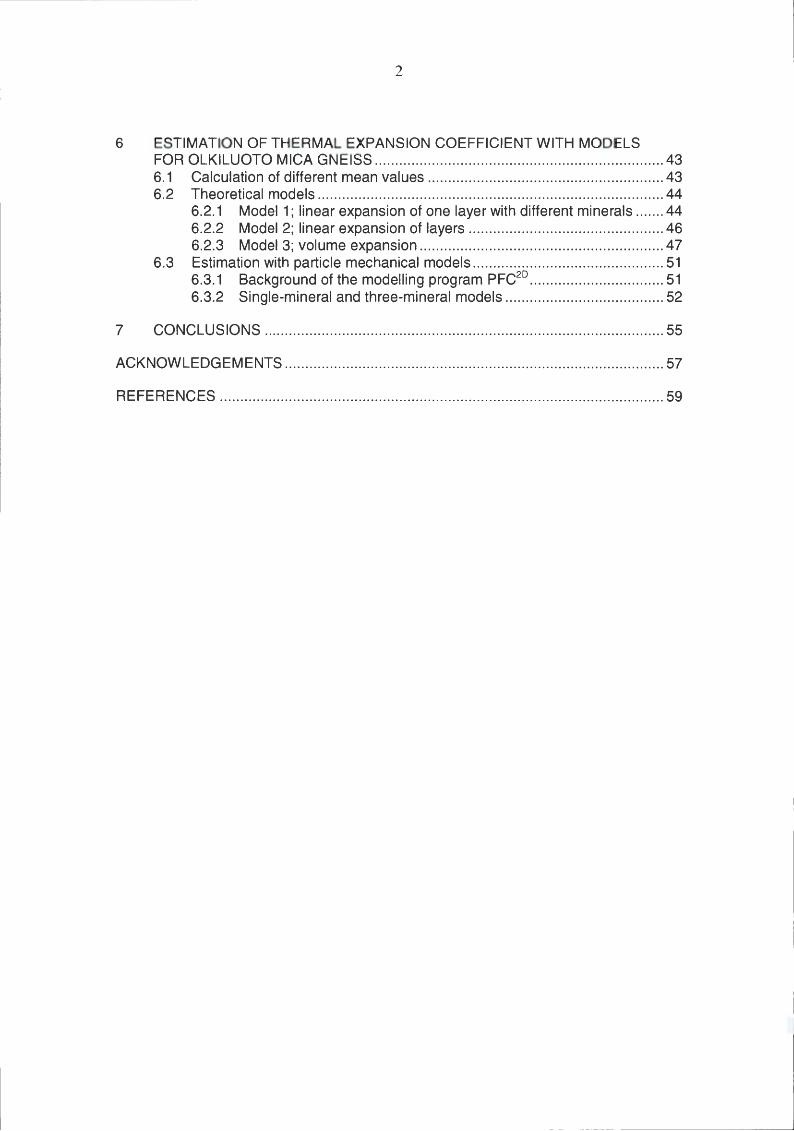
SYMBOLS
a Coefficient of linear thermal expansion [ 1/°C] or [ 1/K] at Theoretical lower bound of linear thermal expansion [1/°C] or [1/K] au Theoretical upper bound of linear thermal expansion [l/°C] or [1/K] f3 Coefficient of volume expansion [1fOC] or [1/K] y Grtineisen parameter Yth Grtineisen parameter: thermodynamic gamma 8r Anderson-Grtineisen parameter £ Strain 8v Debye temperature [K] p Resistivity [Qm] P Specific mass [kglm3
]
a Stress [Pa] A Area [m2
]
c Stiffness tensor Cp Specific heat in constant pressure [J kg-1 K-1]
Cv Specific heat in constant volume [J kg-1 K-1]
D Diameter [m] E Modulus of elasticity (Young's rn'odulus) [N/m2
]
E Energy of lattice vibrations [ J] GF Gauge factor K Bulk modulus (compressibility) [Pa] Kr Isothermal bulk modulus [Pa] L Length [m] n Number of atoms in chemical formula [mol] N Axial force [N] P Pressure [Pa] R Resistance [ Q] R Gas constant, 8.314·[J mor1 K-1]
S Entropy [J mor1 K-1]
T Temperature [°C] or [K] U Internal energy [ J] V Volume [ m3
]

4
5
PREFACE
This study has been made in Geological Survey of Finland as a part of Posiva Oy's investigations of the final disposal for spent nuclear fuel. The project was ordered and funded by Posiva Oy. The work has been supervised by Aimo Hautojarvi at Posiva and Erik Johansson at Saanio & Riekkola Consulting Engineers.

6
7
1 INTRODUCTION
This study is a part of the Posiva's nuclear waste program for planning a final repository for spent nuclear fuel. The spent nuclear fuel will be placed into the Finnish bedrock in Olkiluoto. The repository will be located approximately at depth of 400-500 in the bedrock of migmatitic mica gneiss.
The aim of this study is to present the theoretical basis of thermal expansion properties for rocks, from the literature, particularly considering the needs of the final disposal planning of the spent nuclear fuel. Thermal expansion measurements of rock samples from Posiva study sites have been reported by Kj0rholt (1992). Other thermal properties of rocks, such as thermal conductivity, specific heat capacity and thermal diffusivity, have been discussed earlier in several reports of Posiva. Kukkonen & Lindberg (1995), (1998), and Kukkonen (2000) have reported results of laboratory measurements of drill core samples involving thermal properties of rocks. Development of in situ measurements of thermal properties of rocks (Kukkonen & Suppala 1999, Kukkonen et al. 2000, Kukkonen et al. 2001) has been carried out since 1999. Raiko (1996) has discussed the thermal optimisation of the final disposal of spent nuclear fuel.
Chapter 2 of the present report, presents background information concerning thermal expansion of rocks and final disposal of spent fuel. Chapter 3 includes the basic theory of the thermal expansion as well as discussion on the properties affecting the expansion. Chapter 4 introduces the measurement methods of thermal expansion. In chapter 5 the thermal expansion coefficient values for minerals and rocks from literature are tabulated. Further the thermal expansion coefficient values of rocks are estimated with theoretical models. A few simple analytical estimation models are presented in chapter 6 for calculation of the thermal expansion coefficient for Olkiluoto mica gneiss. Numerical modelling of bulk thermal expansion coefficients of rocks was done with the aid of the modelling program PFC20 (Particle Flow Code in 2 Dimensions).

8
9
2 NEEDS OF THERMAL EXPANSION PROPERTIES
2.1 General
Evidently there will be temperature changes in the final repository of spent nuclear fuel due to radiogenic heat generation. Materials involved, such as rock, water, buffer materials and waste canister materials will react according to their temperaturedependent physical properties during temperature changes. Thermal stresses are generated when temperature rises, which may affect the final disposal conditions. Temperature changes have an impact on all materials. The problem is further complicated by the pore-filling ground water, the fluid properties of which differ essentially from the rock matrix. In the temperatures above 4°C both water and rock forming minerals expand. Due to differences in thermal properties of materials, considerable variation is expected by variations in rock type and mineral constituents.
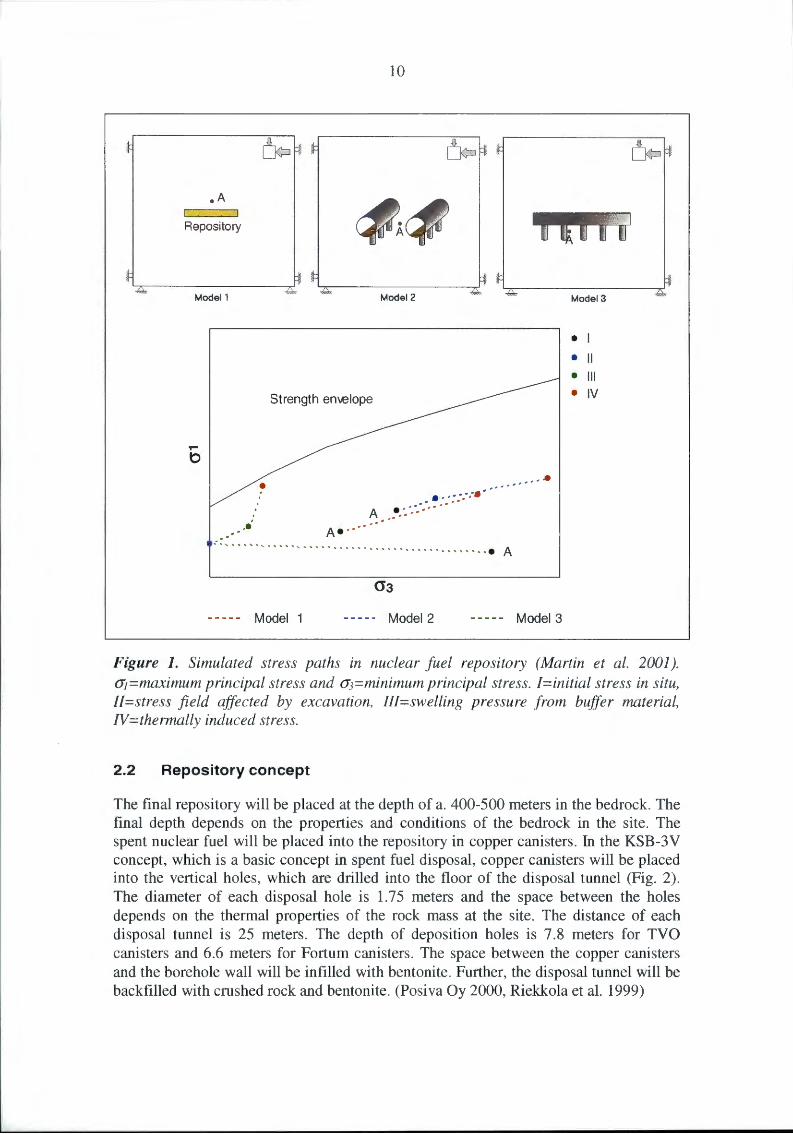
The knowledge of the coefficient of thermal expansion is needed because the thermal expansion induces thermal stresses. Depending on temperature increase and thermal expansion coefficient of rock, there may be thermal stresses, which exceed the breaking point. Impacts of some factors affecting stresses in the final disposal of spent nuclear fuel is illustrated in Fig. 1 (Martin et al. 2001).
Heating of rocks under conditions of increasing stresses, generally leads to changes in the structure and physical properties of the rocks (Somerton 1992). Irreversible changes in properties can be expected to perform if the rock will be cooled back to the original temperature after heating.
There are several factors of thermal alteration in rocks (Somerton 1992). The most important factor is probably the structural damage caused by differential thermal expansion of the constituent minerals of the rock. Thermal expansion coefficients differ between minerals, and further, thermal expansion is anisotropic and dependent on the different crystallographic orientation of minerals. The differences in thermal expansion result in stress concentrations at grain boundaries and contact points. Thus, heating of the rock may lead to fracturing of individual mineral grains, which may further lead to disaggregation of the rock. Other factors of thermal alteration of rocks include desorption, decomposition and phase-change reactions. Mineralogical changes may occur in hydrothermal environments. (Somerton 1992)
10
. A
Repository
Model1 Model2
Strength en\€1ope
,... b
-•'
----- Model 1
A• ··
. . ........ . A • . ·.·:: •• •••• . . ,. ~. ...
....... ..
····················• A
----- Model 2 Model 3
Model3
• I • 11
• Ill
• IV
Figure 1. Simulated stress paths in nuclear fuel repository (Martin et al. 2001 ). (J"1=maximum principal stress and (J"3=minimum principal stress. !=initial stress in situ, !!=stress field affected by excavation, Ill=swelling pressure from buffer material, N=thermally induced stress.
2.2 Repository concept
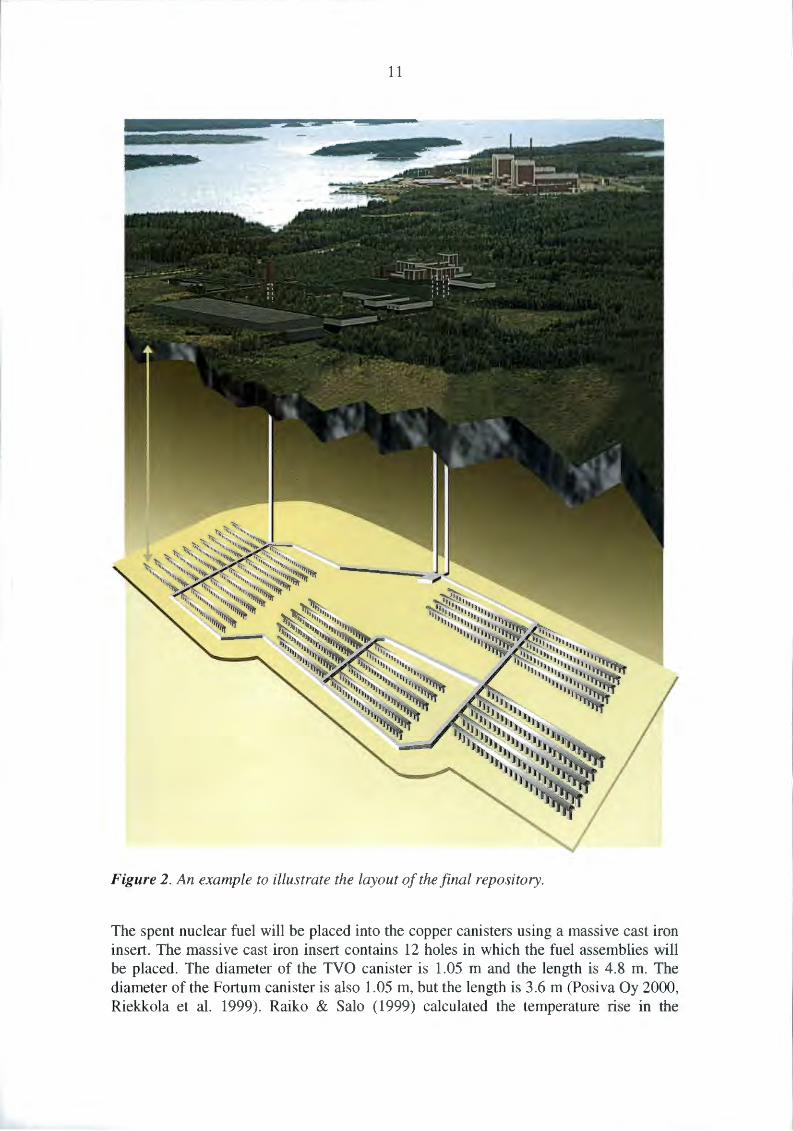
The final repository will be placed at the depth of a. 400-500 meters in the bedrock. The final depth depends on the properties and conditions of the bedrock in the site. The spent nuclear fuel will be placed into the repository in copper canisters. In the KSB-3V concept, which is a basic concept in spent fuel disposal, copper canisters will be placed into the vertical holes, which are drilled into the floor of the disposal tunnel (Fig. 2). The diameter of each disposal hole is 1. 7 5 meters and the space between the holes depends on the thermal properties of the rock mass at the site. The distance of each disposal tunnel is 25 meters. The depth of deposition holes is 7.8 meters for TVO canisters and 6.6 meters for Fortum canisters. The space between the copper canisters and the borehole wall will be infilled with bentonite. Further, the disposal tunnel will be backfilled with crushed rock and bentonite. (Posiva Oy 2000, Riekkola et al. 1999)
~--~-·~ -
11
Figure 2. An example to illustrate the layout of the final repository.
The spent nuclear fuel will be placed into the copper canisters using a massive cast iron insert. The massive cast iron insert contains 12 holes in which the fuel assemblies will be placed. The diameter of the TVO canister is 1.05 m and the length is 4.8 m. The diameter of the Fortum canister is also 1.05 m, but the length is 3.6 m (Posiva Oy 2000, Riekkola et al. 1999). Raiko & Salo (1999) calculated the temperature rise in the
12
canister surface, on the edge of the deposition hole and bedrock between the disposal tunnels. The temperature at the surface of the copper canisters reaches its maximum after 20 years from the final repository, when the temperature is about 90°C (calculated for dry bentonite). On the wall of the deposition hole the maximum temperature will be attained in 50 years, when the temperature is about 66°C. The bedrock between the disposal tunnels will attain the maximum temperature in slightly over 50 years, when the temperature will rise to about over 60°C.
The differences in thermal expansion properties between the different rock formations may cause cracks and spalling. In the confining environment, when the thermal expansion is limited, the thermal stresses will occur. The thermally-induced stresses will hydrostatically increase the principal stresses, which will affect the disposal rooms (Johansson & Rautakorpi 2000). Nevertheless, after Johansson & Rautakorpi (2000) the thermal stresses are unlikely to have a very significant effect on the overall stability near the repository.
Thermal stresses due to thermal expansion in rocks are generally 15-30 MPa at the repository scale and in the vicinity of the deposition holes the maximum stress increase can be 40-45 MPa (Johansson & Rautakorpi 2000). These stresses above could result, if the maximum values of the expected temperatures are 50-55°C (Raiko & Salo 1999).
Geotechnical research and development has been done in the Underground Research Laboratory (URL) in Canada (Read et al. 1997). In situ research into mechanical response of the rock mass to excavation has been ongoing at URL since 1989. In the URL has been done the Heated Failure Tests, which are one way to visualize the impact of the temperature changes, and further, the thermal expansion in rock. The URL was constructed into the depth of 420 meters in Lac du Bonnet granite batholith. The Heated Failure Tests were done in four stages for five observation holes (diameter 600 mm) where the rock mass temperature in the periphery of the holes was to be heated to 85°C. The heating of the rock mass around the observation holes was done with four heaters installed in a square array of 32-mm-diameter boreholes, so that each heater located 1 meter from the wall of the observation hole. (Read et al. 1997 .)
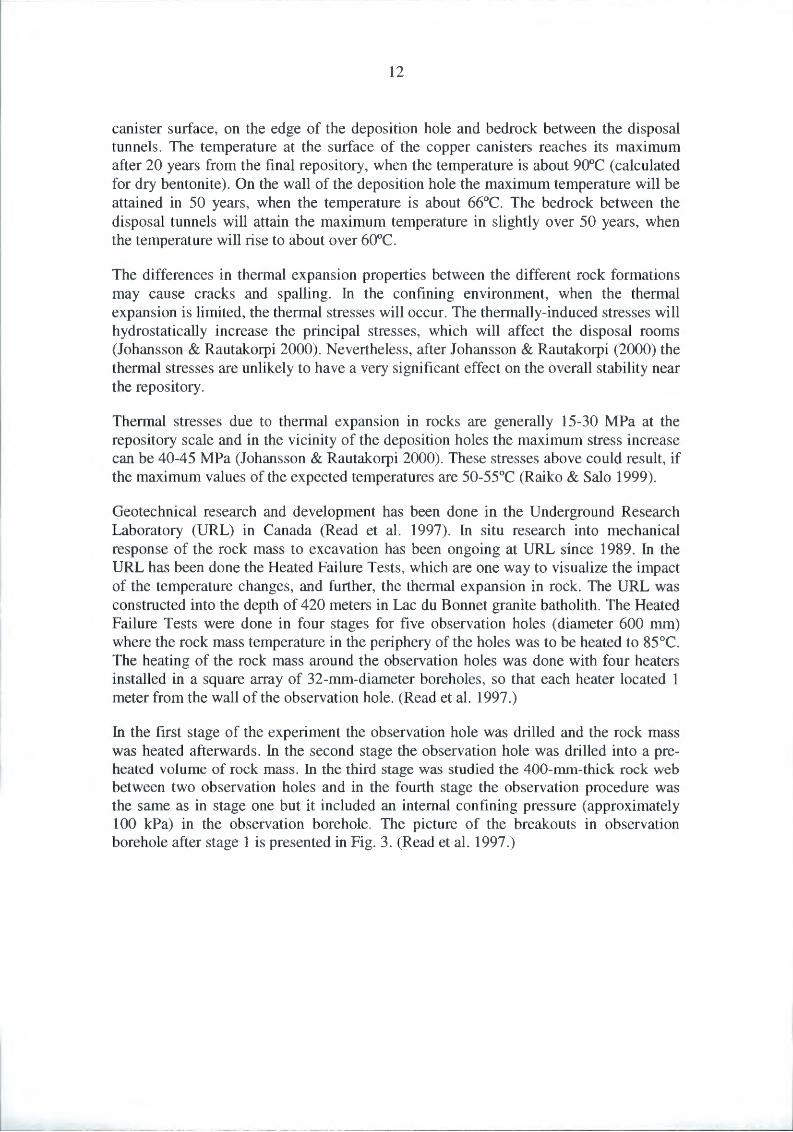
In the first stage of the experiment the observation hole was drilled and the rock mass was heated afterwards. In the second stage the observation hole was drilled into a preheated volume of rock mass. In the third stage was studied the 400-mm-thick rock web between two observation holes and in the fourth stage the observation procedure was the same as in stage one but it included an internal confining pressure (approximately 100 kPa) in the observation borehole. The picture of the breakouts in observation borehole after stage 1 is presented in Fig. 3. (Read et al. 1997.)
13
Figure 3. Breakouts in observation borehole at the end of stage 1 after heating the rock (Read et al. 1997).

14
15
3 PHYSICAL PRINCIPLES OF THERMAL EXPANSION IN MINERALS AND ROCKS
3.1 General
Thermal expansion is a phenomenon, which occurs under increasing temperature, in all substances, and in all forms of matter. The phenomenon includes also contraction of matter in decreasing temperature. During the thermal expansion shape, length and volume of the substance change as the temperature changes. The average coefficient of linear thermal expansion a is:
1 f:,L a=--
L0 11T (1)
where La is the reference length before thermal expansion and M is the change in length for the temperature change 11T (Keller et al. 1993).
The true coefficient of volume expansion f3 for isotropic substances and cubic crystals is:
13 = J__(avJ v ar p
(2a)
which expresses the volume (V) change due to the temperature change, when the pressure (P) remains constant (Skinner 1966). The most commonly reported coefficient for thermal volume expansion is the mean coefficient:
(2b)
where Vo is the volume at the reference temperature and To is the reference temperature (Skinner 1966). For cubic compounds the coefficient of volume expansion is very closely f3=3a and for anisotropic compounds f3=a1+a2+a3 . The unit for thermal expansion coefficient is l/°C or 1/K.
Properties that have an influence on thermal expansion of minerals include crystal form, temperature and heat capacity. Properties that affect thermal expansion of rocks are mineral composition, texture, porosity, properties of the fluid in pores, microcracks (Siegesmund et al. 2000), pressure and temperature among others.
3.2 Thermal expansion at atomic scale
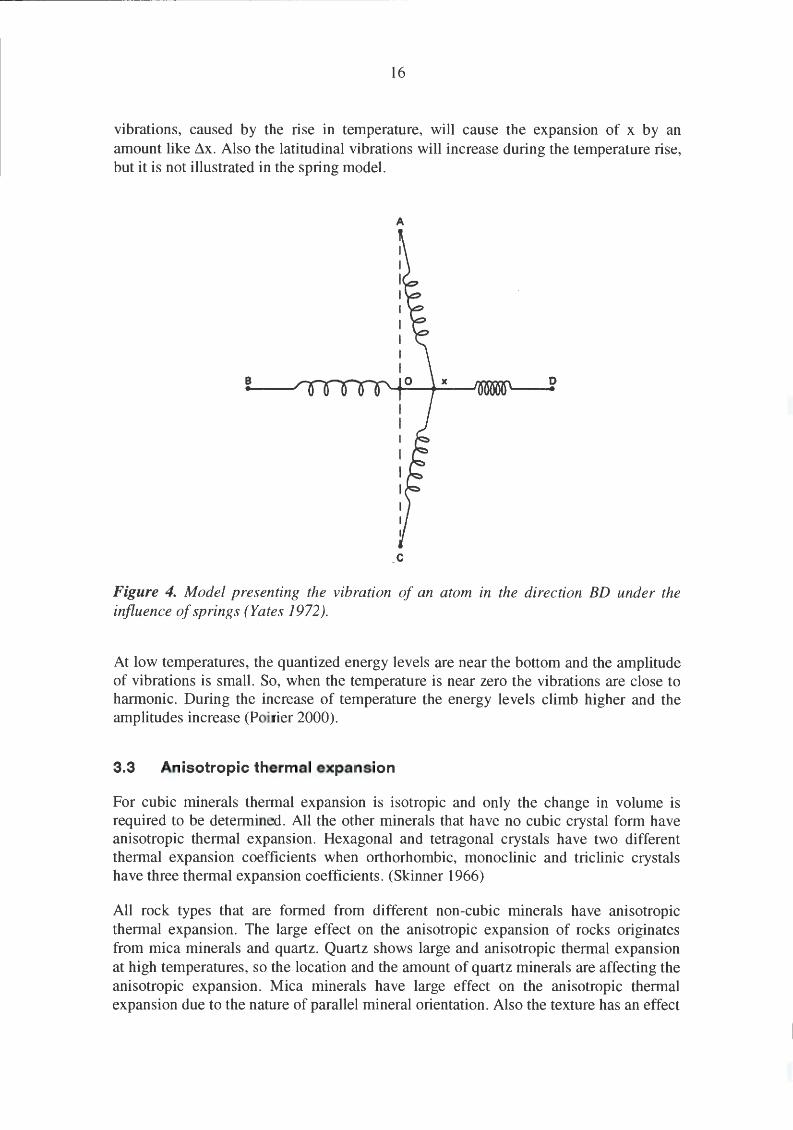
The origin of thermal expansion is related to the anharmonic nature of lattice vibrations (Yates 1972). During the rise of temperature the amplitude of lattice vibrations increases, which causes the expansion in a substance. In Fig. 4 Yates (1972) has represented a model for the vibrations of a particle (an atom), which is under the influence of springs obeying Hooke's law. The increase in the energy of longitudinal
----------------------------- -----.--- -~
16
vibrations, caused by the rise in temperature, will cause the expansion of x by an amount like ~x. Also the latitudinal vibrations will increase during the temperature rise, but it is not illustrated in the spring model.
A
B 0
c
Figure 4. Model presenting the vibration of an atom in the direction BD under the influence of springs (Yates 1972).
At low temperatures, the quantized energy levels are near the bottom and the amplitude of vibrations is small. So, when the temperature is near zero the vibrations are close to harmonic. During the increase of temperature the energy levels climb higher and the amplitudes increase (Poirier 2000).
3.3 Anisotropic thermal expansion
For cubic minerals thermal expansion is isotropic and only the change in volume is required to be determined. All the other minerals that have no cubic crystal form have anisotropic thermal expansion. Hexagonal and tetragonal crystals have two different thermal expansion coefficients when orthorhombic, monoclinic and triclinic crystals have three thermal expansion coefficients. (Skinner 1966)
All rock types that are formed from different non-cubic minerals have anisotropic thermal expansion. The large effect on the anisotropic expansion of rocks originates from mica minerals and quartz. Quartz shows large and anisotropic thermal expansion at high temperatures , so the location and the amount of quartz minerals are affecting the anisotropic expansion. Mica minerals have large effect on the anisotropic thermal expansion due to the nature of parallel mineral orientation. Also the texture has an effect
-----------------------~-- ------ ~-
17
on anisotropic thermal expansion. The presence of pores and cracks may cause or modify the anisotropy of thermal expansion (Cooper & Simmons 1977). Cooper & Simmons (1977) noticed in their study that the granite, which had the greatest anisotropy in crack distribution, had also the greatest anisotropy in thermal expansion of the rocks they had studied. Nevertheless, they found that anisotropy of the linear expansion coefficient decreases with increasing temperature. It is probably due to formation of cracks, which are conceivably not as anisotropicly orientated as the original cracks.
3.4 Temperature and pressure dependencies
Both temperature and pressure have an impact on the thermal expansion coefficient. As earlier mentioned the rise in temperature increases the expansion of the most substances. In most cases the expansion coefficient increases with increasing temperature. The pressure effect is the opposite to the temperature effect. With increasing confining pressure, the linear and volumetric thermal expansion coefficients decrease (Jumikis 1983). However, Larsson (2001) discovered that both axial and volumetric thermal expansion coefficients of diorite were larger under a load, whereas for granite the expansion coefficients were smaller with the load. This may be due to fracturing effects. In both diorite and granite the fracture effect may have caused the expansion of grains and fractures , but in granite the grains are may have expanded into pores and fractures.
3.4.1 Expansion coefficient and temperature in minerals
We can relate thermal expansion to thermal pressure by considering that heating a solid at constant volume increases the internal pressure (Poirier 2000). If the constraint of constant volume were lifted, the internal pressure would cause the solid to expand. This can be expressed by Griineisen parameter /1h (thermodynamic gamma) in equation (3)
(~~l = fJKT = Yrh pCV
where the thermal expansion coefficient can be solved:
f3 = Yth PCv KT
(3)
(4)
Cv is specific heat, Kr isothermal bulk modulus and pis specific mass. The definition of Yth can be expressed after Anderson (2000) also by
(5)
where U is internal energy, which is generally proportional to absolute temperature T. Typical values of Griineisen parameter are around 2 (lbach & Liith, 1991).
18
By quasi-harmonic approximation of lattice dynamics, the effect of temperature through the volume change can be taken into account due to thermal expansion only (Poirier 2000). The effect of increase in volume on the elastic properties can be calculated through quantities like
dlnK dK
dln V dP (6) --=
This quasi -harmonic approximation assumes that the lattice vibrations are considered to be harmonic around the new equilibrium positions of the atoms in the new expanded state (Poirier 2000).
Kirby et al. (1972) have expressed the approximate relation between the coefficient of volume expansion (equation (2a)) and the temperature by Griineisen equation
(7)
where C v is the molar heat capacity at constant volume, E is the energy of the lattice vibrations, and Qo and k are constants. The constant Qo is related to the volume (V a) and bulk modulus (Ko) at zero Kelvin and the Griineisen parameter by Qo=Ko V c/r (Fei 1995). The constant k can be obtained by fitting to the experimental data (Fei 1995). The use of this equation (7) requires that the Debye temperature 8D is known for the studied material so that both C v and E could be calculated at any temperature T from the equations (8) and (9)
(8)
and
(9)
If table values of eD, Q0 and k are known, the P can be calculated. R in the formula is the gas constant.
The volume dependence on the temperature can be expressed by equation (10) (Fei 1995):
V(T)=- 1+2k- 1--V0
[ ~kEl 2k Q0
(10)
19
The relation between volume and temperature is derived from the Grtineisen theory of thermal expansion. The lattice vibration energy (E) in equation (10) can be calculated in the Debye model of solids by equation (11)
(11)
where n is the number of atoms in the chemical formula (Fei 1995). The Debye model requires four parameters, 8 0 , Q0, k and V0, which are known to describe the thermal expansion of a solid. The thermal expansion coefficient f3 can be solved by differentiating the equation (10) with respect to T, and substituting Eq. (10) into Ps definition (Eq. (2a)), the thermal expansivity is explicitly after Helffrich (1999):
(12)
The divergence arises in the square root term. This can be approximated as 1 +x/2, and equation (12) becomes a modified Suzuki's thermal expansivity:
(13)
This formulation leads to expression, which behaves well with all values of T. This method is difficult to be solved for rocks that contain different minerals and have separate physical properties, when all of the values are not known. More details i.e. about Grtineisen parameters, Debye's approximation and the physics involved with wide temperature range approximations can be found i.e. from the Poirier (2000).
When Debye model cannot be uniquely defined for the fitting of experimental data over a certain temperature range, a polynomial approximation can be used for the thermal expansion coefficient
(14)
20
where ao, a1 and a2 are constants determined by fitting the experimental data (Fei 1995). The measured volume above room temperature can be reproduced by
T
J a(T)dT
V(T) = v T, eT, (15)
where V rr is the volume at reference temperature T,.
3.4.2 Expansion coefficient and pressure in minerals and rocks
Effect of pressure for thermal expansion coefficient of minerals can be calculated by the Anderson -Grtineisen parameter ( 8r)
f3(P,T) = [V(P,T)] 8r
f3(T) V(T) (16)
This often-used DLA parameter (Dimensionless Logarithmic Anharmonic) can be calculated by 8r or ~:
§T = (aln J3) = _ _!_(aln KT) = (aln KT J a 1n v T f3 ar p a 1n p p
(17)
8s = (aln P) = _ _!_(aln Ks) = (aln K s J a 1n v s f3 ar p a 1n p p
(18)
Ks is adiabatic bulk modulus. The equation (19) has been used for determining the pressure dependence of thermal expansion coefficient of MgO and forsterite (Poirier 2000) The equation is
(19)
which was calculated by putting experimentally determined values of thermodynamic parameters in the equation. For many minerals an average value of Anderson-Grtineisen parameter is 5r--5 .5±0.5 (Poirier 2000). It has been also found that 8r is proportional to compression VIVo, so the value of 8r decreases at high pressure (Poirier 2000).
Compressive pressure lowers the thermal expansion of rock (Wong & Brace 1979 and Somerton 1992). Wong and Brace have formed a linear relationship for the pressure effect of thermal expansion by
a .. (P)=a~ +(j_KT)p ll ll aT I
(20)
21
where CXi/ is the room-pressure thermal expansion tensor, Pis the pressure and Kt is the isothermal linear compressibility.
3.5 Coupling between thermal and mechanical variables
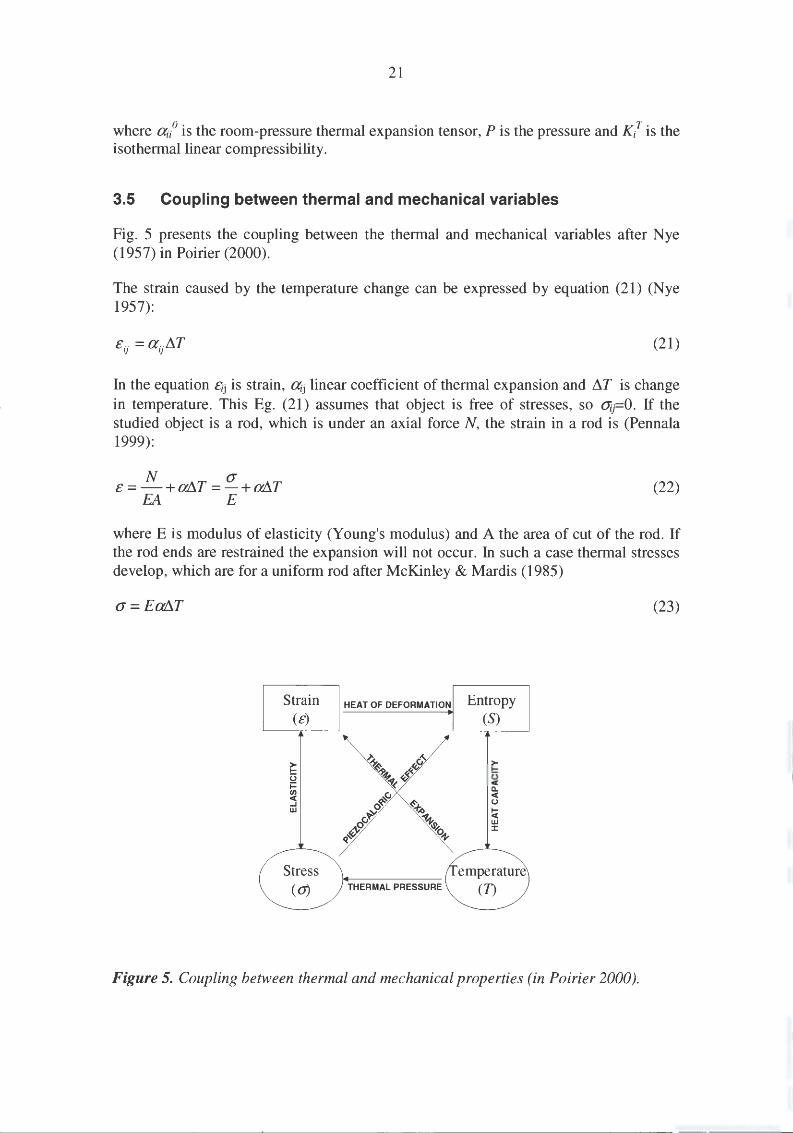
Fig. 5 presents the coupling between the thermal and mechanical variables after Nye (1957) in Poirier (2000).
The strain caused by the temperature change can be expressed by equation (21) (Nye 1957):
(21)
In the equation tij is strain, lltj linear coefficient of thermal expansion and 11T is change in temperature. This Eg. (21) assumes that object is free of stresses, so ot1=0. If the studied object is a rod, which is under an axial force N, the strain in a rod is (Pennala 1999):
N a £ = -+fYAT = -+fYAT
EA E (22)
where E is modulus of elasticity (Young's modulus) and A the area of cut of the rod. If the rod ends are restrained the expansion will not occur. In such a case thermal stresses develop, which are for a uniform rod after McKinley & Mardis (1985)
a=E~T
Strain (£)
> 1-
u i= en <( ..J w
HEAT OF DEFORMATION
THERMAL PRESSURE
Entropy (S)
> 1-u <( c.. <( (.)
~ w :I:
Figure 5. Coupling between thermal and mechanical properties (in Poirier 2000).
(23)
22
A method for calculating upper ( au) and lower bounds ( aL) of the linear thermal expansion coefficient by the equations (24) and (25) with internal stresses, when only composition of the rocks and elastic constants of the constituents are known, was proposed by Walsh (1973).
(24)
(25)
where a,n and ~a are
3am =(a)+ Ku - K ( 3(ca ) _ (a )J Ku -KL (c)
(26)
~K-K ~K -K 3~a= L u .
Ku -KL (K -K {(ca)2- (ca)2J - ( 3(ca ) - (a )J2
u Lll (c) (c) (27)
and c is the stiffness tensor, a the thermal expansion tensor and K is the bulk modulus (compressibility). Ku = (s) , (s) is the compliance tensor and KL=91 (c) .Angle brackets
denote a volume-weighted average over all constituents. To calculate the theoretical bounds, only the single crystal stiffness tensor, thermal expansion tensor and the partial volumes of the constituent minerals need to be defined. Bulk compressibility, K, of the rock has to be known (Wong & Brace 1979). Parameters for CiJ and K can be found i.e. from tables collected by Bass (1995).
Cooper and Sirnrnons (1977) has compared measured and calculated volume coefficients of thermal expansion by obtaining their calculated values by Turner's formula:
"fl.E.V. fJ= ~ I I I
IEiVi (28)
where Et and Vt are the Young's modulus and volume fraction of the ith phase. Thermal expansion values and Young's modulus values they took from tables found in the literature. The Turner's formula originates from the ceramics, but it can be used also for polycrystalline aggregates.
In measuring of the thermal expansion of a polycrystalline material Walsh (1973) discovered that the thermal expansion was greater than the predicted value. That was possibly an effect on resulted rnicrocracks formed because of high thermal stresses.
23
3.5.1 Thermal cracks
According to Cooper and Simmons (1977) changes in temperature produce two kinds of cracks, which are 1) thermal gradient cracks formed due to inhomogeneous strain produced by inhomogeneous temperature and 2) thermal cycling cracks formed due to inhomogeneous strain by the mismatch of thermal expansion at grain boundaries. The cracks of type 1 can be avoided by the use of low temperature rates, but the cracks of type 2 cannot be avoided.
Cooper and Simmons (1977) studied the effect of microcracks on the thermal expansion of rocks. They discovered that at the atmospheric pressure, cracks affect thermal expansion by increasing considerably the thermal expansion due to the production of thermal cycling cracks after the temperature rise over the predicted value by the constituent minerals. Another discovery was that the presence of cracks tends to decrease thermal expansion by allowing some mineral grains to expand into the cracks.
Cooper and Simmons ( 1977) also found that in the rocks they studied the thermal expansion coefficient was smallest in the direction perpendicular to the plane of greatest crack concentration. If increase in temperature is slow the formation of cracks can be prevented.

24
25
4 MEASUREMENT METHODS
Most of the measurement systems have been developed to determine the linear coefficient of thermal expansion for specimens of relatively small size at low temperatures (Yates 1972). When the measured specimen is small (A-size to mm-size) sophisticated measurement methods with high accuracy are needed. The methods with very high resolution are optical methods and meant for samples near the absolute zero (Yates 1972). Such methods are not relevant here. Single crystal specimens and minerals can be measured for example by x-ray diffractometers (e.g. Molin et al. 2001, Ala-Vainio 1996, Xu et al. 2001, Vocadlo et al. 2002, Zhang 2000 and Knight et al. 1999), interferometers (e.g. Masuda et al. 2000, Schmitt & Hunt 1999) and vibrational spectroscopy (Chopelas 2000). Thermal expansion measurements for larger (mm-size) specimens can be applied by dilatometers (e.g. Arndt et al. 1997), strain gauges (e.g. Wong & Brace 1979 and Larsson 2001) and TMA (ThermoMechanical Analysis) equipment. Also instruments that measure distance changes of fixed points in core samples can be applied in measurements (Kjfl}rholt 1992). The strain gauge method, dilatometry, thermomechanical analysis and the method of measuring distance changes of fixed points are discussed here in more detail.
4.1 Strain gauges
4.1.1 Theory
The strain can be measured by mechanical sensors, electrical methods (capacitive, inductive and resistance strain sensors), or by using acoustical, pneumatic or optical strain sensors (Pennala 1999). By these strain measurement sensors the strain can be measured in a certain point and direction. One commonly used way is to measure the strain by electric resistance strain gauges. When the strain gauge has been glued well into the sample, the strain of the gauge is the same as in the sample (Pennala 1999). The amount of the strain can be solved due to the change of resistance, when electric current has been transmitted through the gauge. In order to measure this resistance change, a suitable circuit must be employed and the resistance change will relate to strain by the relationship (Kirkwood 1985):
M MlR £=-=--
L GF (29)
where GF is the gauge factor. A fundamental parameter of the strain gauge is its sensitivity to strain, expressed quantitatively as the gauge factor GF (National Instruments 1998):
GF=M/R=MIR M/L £
(30)
Typical values for gauge factor are between 2-4 (Pennala 1999). The resistance R of the strain gauge is
R- 4L - p nD2
26
(31)
where pis resistivity of the strain gauge wire, L length and D diameter (Pennala 1999). The thermal expansion coefficient in case without a load can be solved i.e. by the equation (21) and (29)
MlR
a=_!____= GF ~T ~T
(32)
The method has been used for rock measurements i.e. Wong & Brace (1979) and Larsson (200 1). Larsson (200 1) noticed in her studies that no significant difference could be seen between the unloaded and loaded condition, when testing the influence of the load to the thermal expansion.
4.1.2 A case history
Test set-up
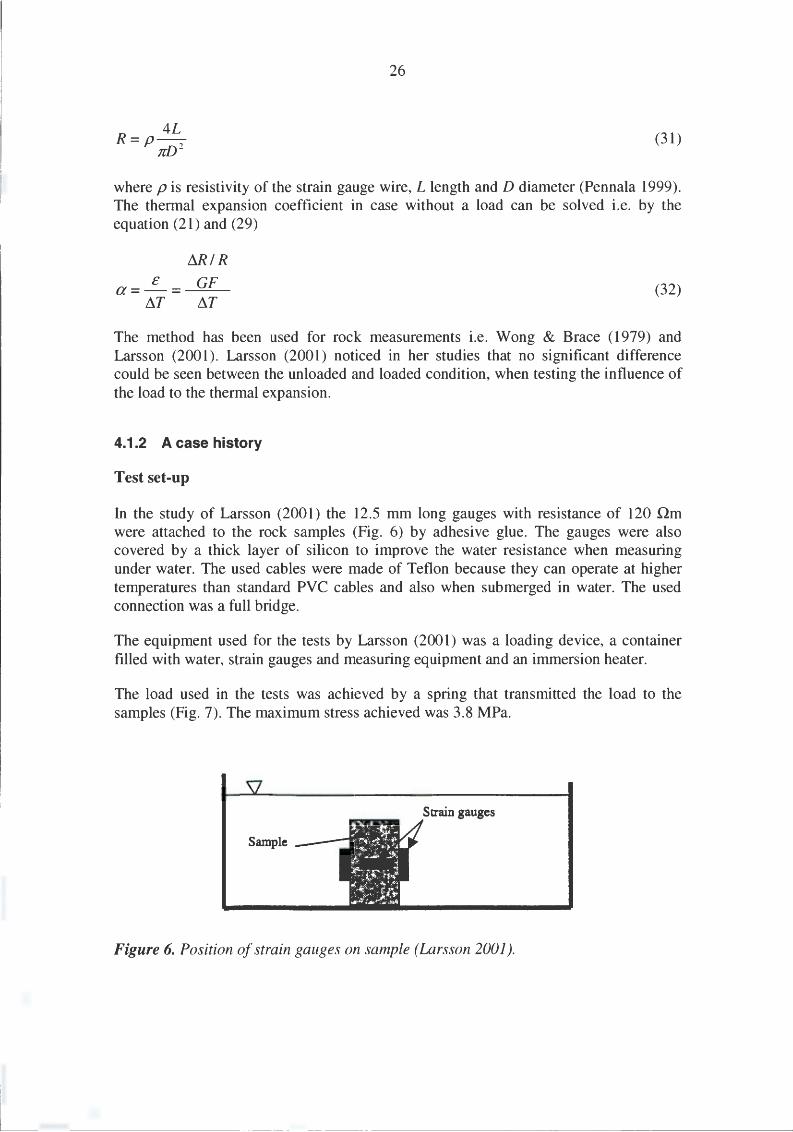
In the study of Larsson (2001) the 12.5 mm long gauges with resistance of 120 Qm were attached to the rock samples (Fig. 6) by adhesive glue. The gauges were also covered by a thick layer of silicon to improve the water resistance when measuring under water. The used cables were made of Teflon because they can operate at higher temperatures than standard PVC cables and also when submerged in water. The used connection was a full bridge.
The equipment used for the tests by Larsson (2001) was a loading device, a container filled with water, strain gauges and measuring equipment and an immersion heater.
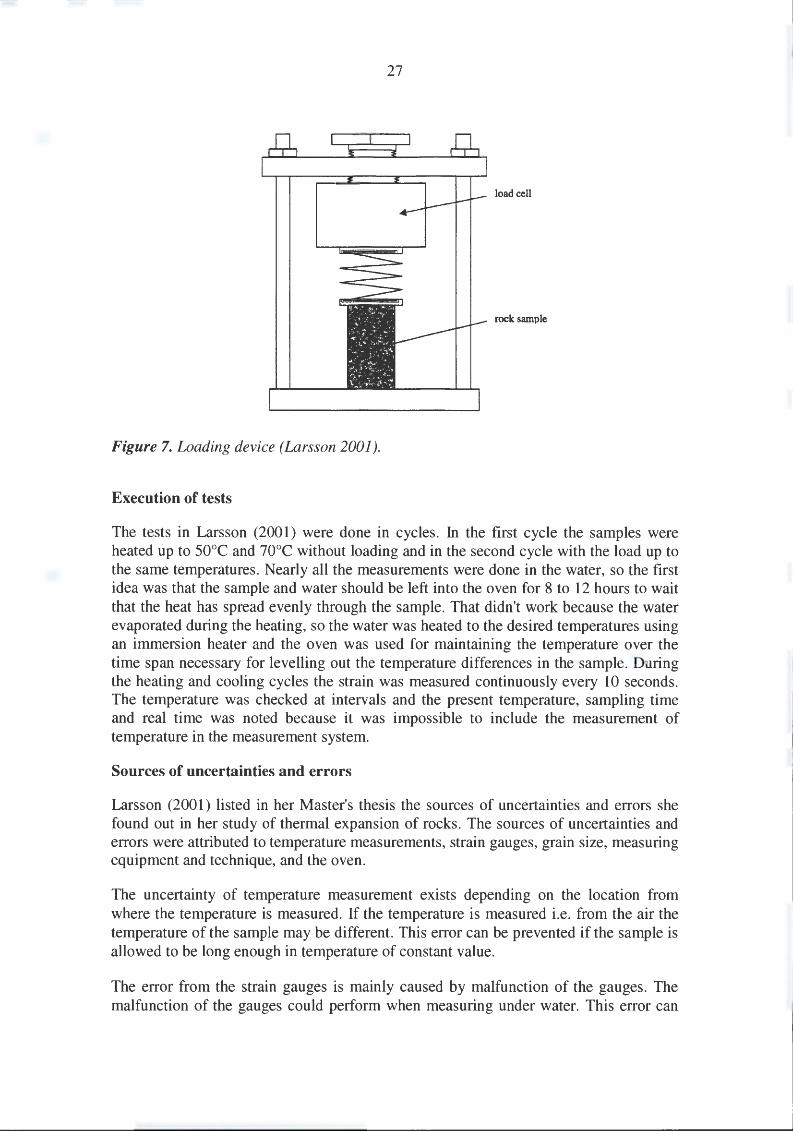
The load used in the tests was achieved by a spring that transmitted the load to the samples (Fig. 7). The maximum stress achieved was 3.8 MPa.
Strain gauges
Sample
Figure 6. Position of strain gauges on sample (Larsson 2001 ).
27
load cell
rock sample
Figure 7. Loading device (Larsson 2001 ).
Execution of tests
The tests in Larsson (2001) were done in cycles. In the first cycle the samples were heated up to 50°C and 70°C without loading and in the second cycle with the load up to the same temperatures. Nearly all the measurements were done in the water, so the first idea was that the sample and water should be left into the oven for 8 to 12 hours to wait that the heat has spread evenly through the sample. That didn't work because the water evaporated during the heating, so the water was heated to the desired temperatures using an immersion heater and the oven was used for maintaining the temperature over the time span necessary for levelling out the temperature differences in the sample. During the heating and cooling cycles the strain was measured continuously every 10 seconds. The temperature was checked at intervals and the present temperature, sampling time and real time was noted because it was impossible to include the measurement of temperature in the measurement system.
Sources of uncertainties and errors
Larsson (2001) listed in her Master's thesis the sources of uncertainties and errors she found out in her study of thermal expansion of rocks. The sources of uncertainties and errors were attributed to temperature measurements, strain gauges, grain size, measuring equipment and technique, and the oven.
The uncertainty of temperature measurement exists depending on the location from where the temperature is measured. If the temperature is measured i.e. from the air the temperature of the sample may be different. This error can be prevented if the sample is allowed to be long enough in temperature of constant value.
The error from the strain gauges is mainly caused by malfunction of the gauges. The malfunction of the gauges could perform when measuring under water. This error can
28
be avoided by the measurements in air. According to Larsson (2001) the accuracy of the whole measurement system was about 1 % when taking into account the problems of keeping the temperature absolutely constant.
The grain size caused an error when gauges were placed poorly. The strain gauges should be placed over as many grains as possible to prevent the result from only one mineral due to different expansions of minerals.
The errors from the measuring equipment and technique depend from the used bridge connection and measuring method. Larsson (2001) used a full-bridge connection, which measured the average expansion over both sides of the sample. If one axial gauge failed no axial measurement data was collected after. To prevent the lost of whole data it would be better to measure the strain on all gauges directly and calculate the average afterwards.
The used oven caused an error when measuring with load under water. The whole system with water container and loading device needed to be placed in the large oven. If the water was heated with the immersion heater, the temperature of water had time to decrease about 5 degrees before the oven started to heat the water again.
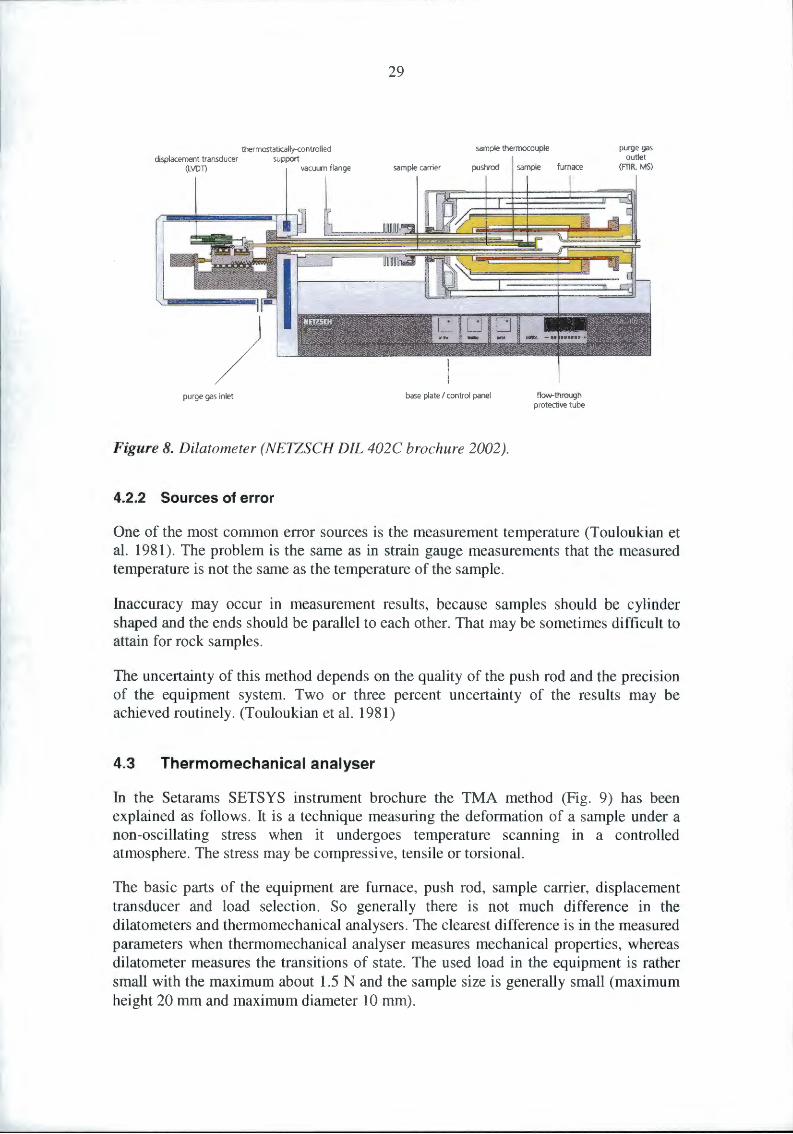
4.2 Di latometers
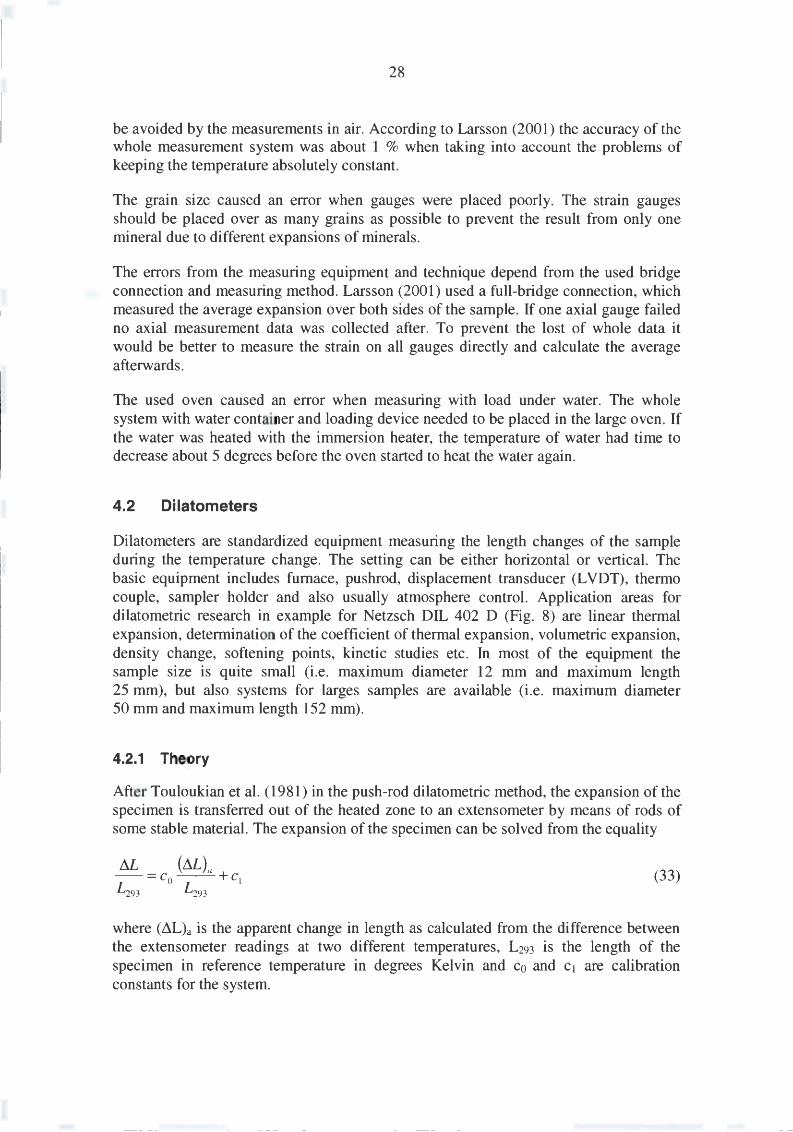
Dilatometers are standardized equipment measuring the length changes of the sample during the temperature change. The setting can be either horizontal or vertical. The basic equipment includes furnace, pushrod, displacement transducer (L VDT), thermo couple, sampler holder and also usually atmosphere control. Application areas for dilatometric research in example for Netzsch DIL 402 D (Fig. 8) are linear thermal expansion, determination of the coefficient of thermal expansion, volumetric expansion, density change, softening points, kinetic studies etc. In most of the equipment the sample size is quite small (i.e. maximum diameter 12 mm and maximum length 25 mm), but also systems for larges samples are available (i.e. maximum diameter 50 mm and maximum length 152 mm).
4.2.1 Theory
After Touloukian et al. (1981) in the push-rod dilatometric method, the expansion of the specimen is transferred out of the heated zone to an extensometer by means of rods of some stable material. The expansion of the specimen can be solved from the equality
(33)
where (~L)a is the apparent change in length as calculated from the difference between the extensometer readings at two different temperatures, L293 is the length of the specimen in reference temperature in degrees Kelvin and c0 and c1 are calibration constants for the system.
thermostatically-<.ontrolled displacement transducer support
(LVDT) vacuum f lange
purge gas inlet
29
sample thermocouple
sample carrier pushrod sample furnace
base plate I control panel flow-through protective tube
Figure 8. Dilatometer (NETZSCH DIL 402C brochure 2002).
4.2.2 Sources of error
purge gas outlet
(FTIR. MS)
One of the most common error sources is the measurement temperature (Touloukian et al. 1981). The problem is the same as in strain gauge measurements that the measured temperature is not the same as the temperature of the sample.
Inaccuracy may occur in measurement results, because samples should be cylinder shaped and the ends should be parallel to each other. That may be sometimes difficult to attain for rock samples.
The uncertainty of this method depends on the quality of the push rod and the precision of the equipment system. Two or three percent uncertainty of the results may be achieved routinely. (Touloukian et al. 1981)
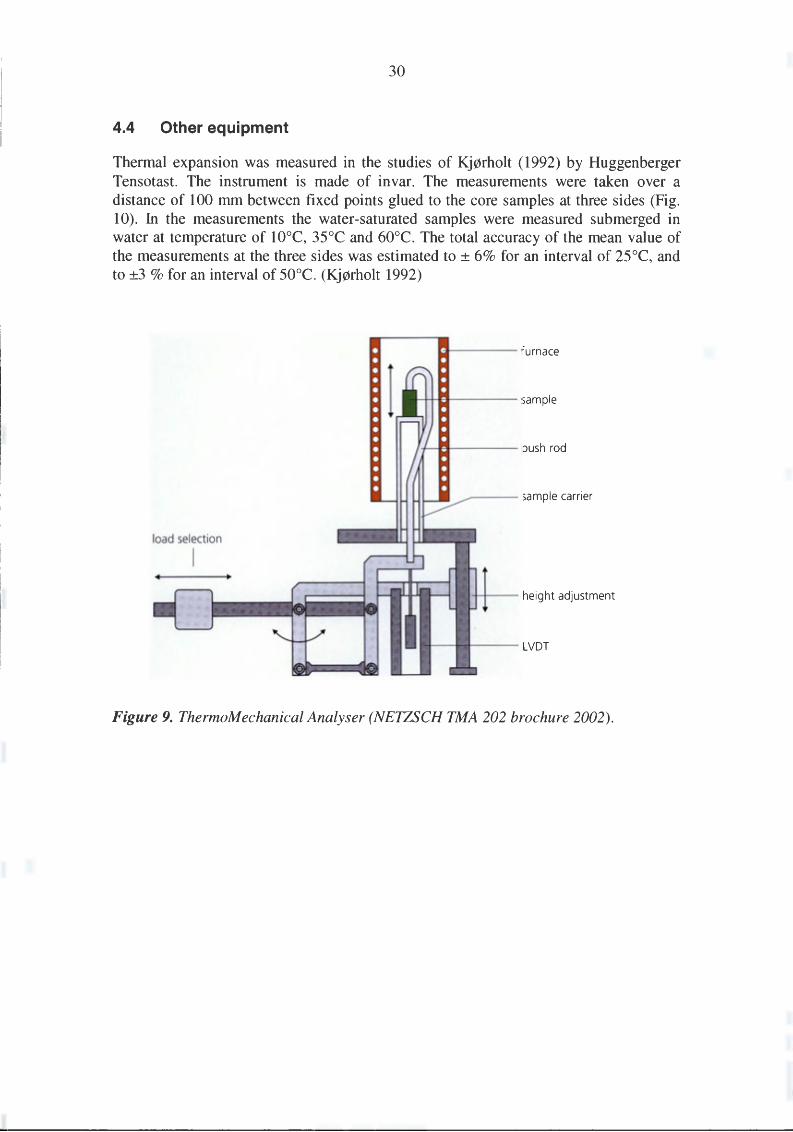
4.3 Thermomechanical analyser
In the Setarams SETSYS instrument brochure the TMA method (Fig. 9) has been explained as follows. It is a technique measuring the deformation of a sample under a non -oscillating stress when it undergoes temperature scanning in a controlled atmosphere. The stress may be compressi ve, tensile or torsional.
The basic parts of the equipment are furnace, push rod, sample carrier, displacement transducer and load selection. So generally there is not much difference in the dilatometers and thermomechanical analysers. The clearest difference is in the measured parameters when thermomechanical analyser measures mechanical properties, whereas dilatometer measures the transitions of state. The used load in the equipment is rather small with the maximum about 1.5 N and the sample size is generally small (maximum height 20 mm and maximum diameter 10 mm).
30
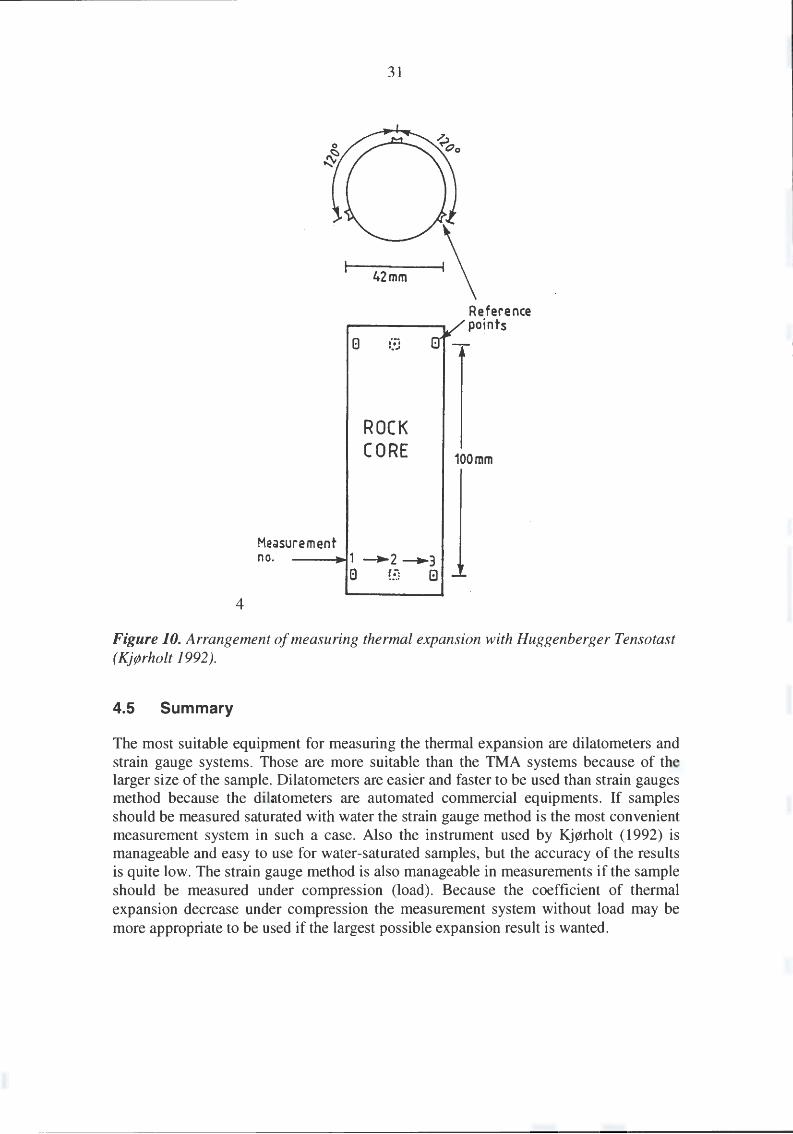
4.4 Other equipment
Thermal expansion was measured in the studies of Kj~rholt (1992) by Huggenberger Tensotast. The instrument is made of invar. The measurements were taken over a distance of 100 mm between fixed points glued to the core samples at three sides (Fig. 10). In the measurements the water-saturated samples were measured submerged in water at temperature of l0°C, 35°C and 60°C. The total accuracy of the mean value of the measurements at the three sides was estimated to ± 6% for an interval of 25°C, and to ±3 %for an interval of 50°C. (Kj~rholt 1992)
a-- -- furnace
...----- sample carrier
load selection
I
+-+--- height adjustment
--- LVDT
Figure 9. ThermoM echanical Analyser (NETZSCH TMA 202 brochure 2002).
4
Medsurement
31
Reference r-------v paints 8 .·;i r.r -.... u
ROCK CORE
-
100mm
no. p 1 _..2 --..3 8 L~: El --
Figure 10. Arrangement of measuring thermal expansion with Huggenberger Tensotast (Kj,Prholt 1992).
4.5 Summary
The most suitable equipment for measuring the thermal expansion are dilatometers and strain gauge systems. Those are more suitable than the TMA systems because of the larger size of the sample. Dilatometers are easier and faster to be used than strain gauges method because the dilatometers are automated commercial equipments. If samples should be measured saturated with water the strain gauge method is the most convenient measurement system in such a case. Also the instrument used by Kj0rholt (1992) is manageable and easy to use for water-saturated samples, but the accuracy of the results is quite low. The strain gauge method is also manageable in measurements if the sample should be measured under compression (load). Because the coefficient of thermal expansion decrease under compression the measurement system without load may be more appropriate to be used if the largest possible expansion result is wanted.

32
33
5 MEASURED VALUES FOR THERMAL EXPANSION COEFFICIENT OF MINERALS AND ROCKS
5.1 Background for measuring thermal expansion of minerals and rocks
According to lbach and Li.ith (1991) the expansion coefficient can only be measured if the sample is maintained in a stress-free state. That can be solved for minerals, but for rock samples in high temperatures and atmosphere pressure that doesn't hold. Rocks, formed of different minerals, buried even to moderate depths have little relation with their thermal expansion measured in a laboratory (Dane Jr. 1942). In the stress-free measurements the orientation and composition of rock-forming minerals have the biggest effect on the thermal expansion.
After Dane Jr. (1942) during the heating of a rock specimen the grains that have the largest thermal dilatation are the ones that tend to determine the change of length of the whole specimen and creating internal fractures and increasing the porosity.
Dane Jr. (1942) proposes that a better sense of the mean expansion of any rock type under the conditions found deep in the earth would be achieved by averaging the weighted volumetric expansions of its rock forming minerals. Nevertheless, coefficient of thermal expansion of rock is typically much larger than the average coefficients for the rock forming minerals (Wong & Brace 1979).
5.2 Measured values of thermal expansion coefficients
Measured values of thermal expansion coefficients of rocks are quite rare in the literature. Thermal expansion coefficient of minerals is discussed more often instead (e.g. Fei 1995, Dane Jr. 1942 and Skinner 1966). Even so, detailed thermal expansion coefficients even for the most common minerals appear to be missing. Most of the thermal expansion values reported here, were compiled from articles published already in the 1930-1970's.
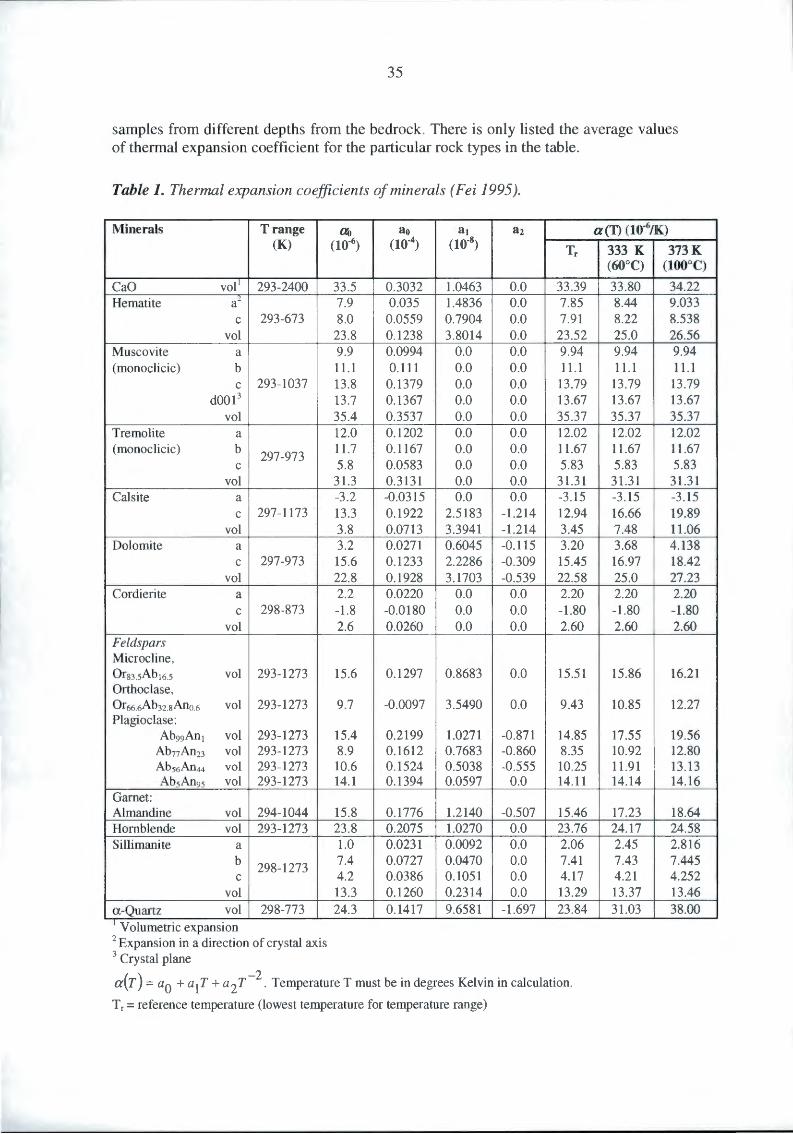
Thermal expansion coefficients have been presented in a few different ways in the literature. Fei (1995) has used in listed values a polynomial expression for the thermal expansion coefficient for fitting the measured experimental data over a specific temperature range. The form of polynomial expression is found from Eq. (14). The method is used when the accuracy of thermal expansion measurement is not sufficiently high or temperature range of measurements is limited. The temperature values in Eq. (14) must be in degrees Kelvin. Dane Jr. (1942) and Skinner (1966) presented the volume expansion as percents proportional to the original size of the sample.
The values listed in Table 1 are after Fei (1995). QD is the thermal expansion coefficient independent over the measured temperature range, which can be converted from the mean coefficient (a), listed in the literature, according to equations (34) and (35)
(34)
34
V(T) = Vr, [1 + a(T- T,)] (35)
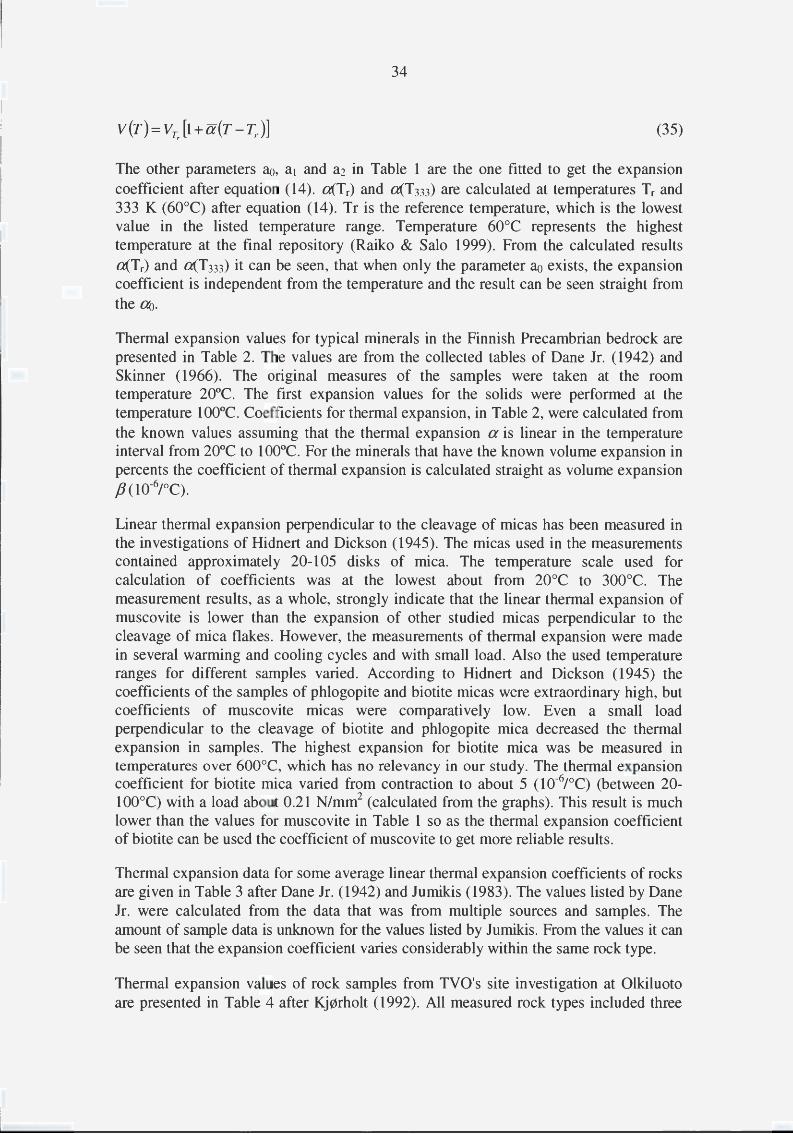
The other parameters ao, a1 and a2 in Table 1 are the one fitted to get the expansion coefficient after equation (14). a(Tr) and a(T333) are calculated at temperatures Tr and 333 K (60°C) after equation (14). Tr is the reference temperature, which is the lowest value in the listed temperature range. Temperature 60°C represents the highest temperature at the final repository (Raiko & Salo 1999). From the calculated results a(Tr) and a(T333) it can be seen, that when only the parameter ao exists, the expansion coefficient is independent from the temperature and the result can be seen straight from the QD.
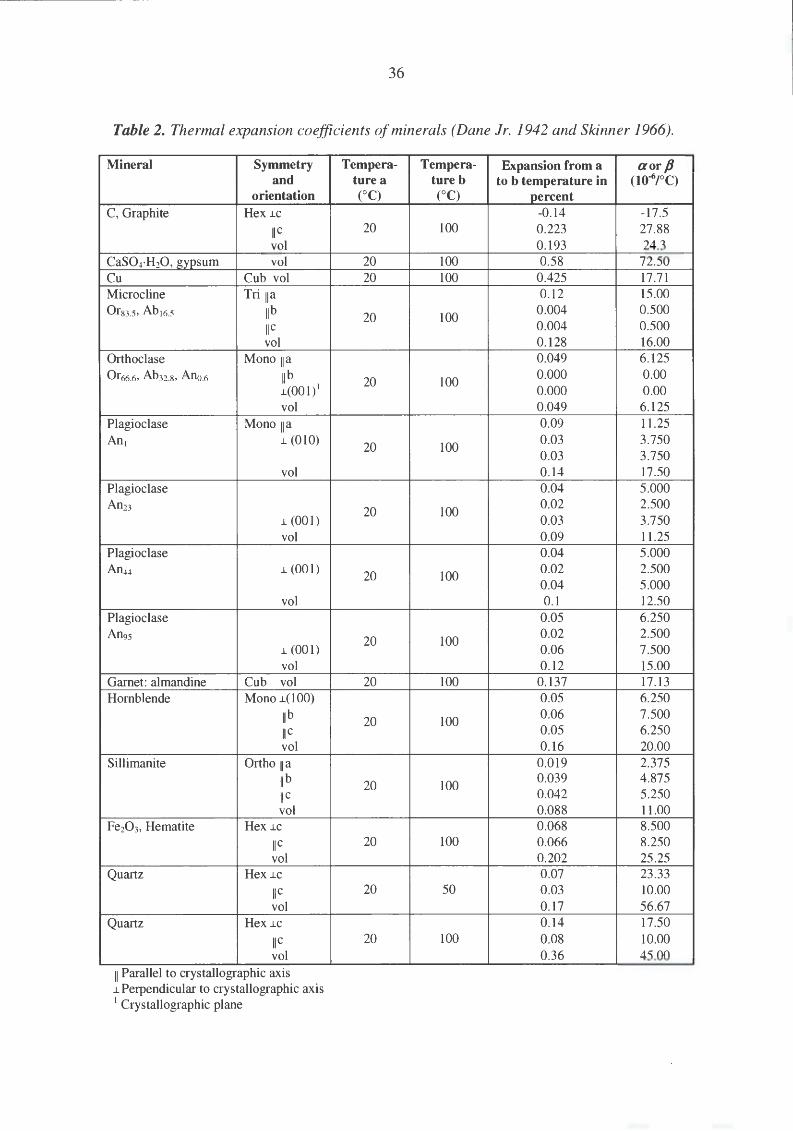
Thermal expansion values for typical minerals in the Finnish Precambrian bedrock are presented in Table 2. The values are from the collected tables of Dane Jr. (1942) and Skinner ( 1966). The original measures of the samples were taken at the room temperature 20°C. The first expansion values for the solids were performed at the temperature 1 00°C. Coefficients for thermal expansion, in Table 2, were calculated from the known values assuming that the thermal expansion a is linear in the temperature interval from 20°C to 1 00°C. For the minerals that have the known volume expansion in percents the coefficient of thermal expansion is calculated straight as volume expansion fJ (10-6/°C).
Linear thermal expansion perpendicular to the cleavage of micas has been measured in the investigations of Hidnert and Dickson (1945). The micas used in the measurements contained approximately 20-105 disks of mica. The temperature scale used for calculation of coefficients was at the lowest about from 20°C to 300°C. The measurement results, as a whole, strongly indicate that the linear thermal expansion of muscovite is lower than the expansion of other studied micas perpendicular to the cleavage of mica flakes. However, the measurements of thermal expansion were made in several warming and cooling cycles and with small load. Also the used temperature ranges for different samples varied. According to Hidnert and Dickson (1945) the coefficients of the samples of phlogopite and biotite micas were extraordinary high, but coefficients of muscovite micas were comparatively low. Even a small load perpendicular to the cleavage of biotite and phlogopite mica decreased the thermal expansion in samples. The highest expansion for biotite mica was be measured in temperatures over 600°C, which has no relevancy in our study. The thermal expansion coefficient for biotite mica varied from contraction to about 5 (10-6/°C) (between 20-1000C) with a load about 0.21 N/mm2 (calculated from the graphs). This result is much lower than the values for muscovite in Table 1 so as the thermal expansion coefficient of biotite can be used the coefficient of muscovite to get more reliable results.
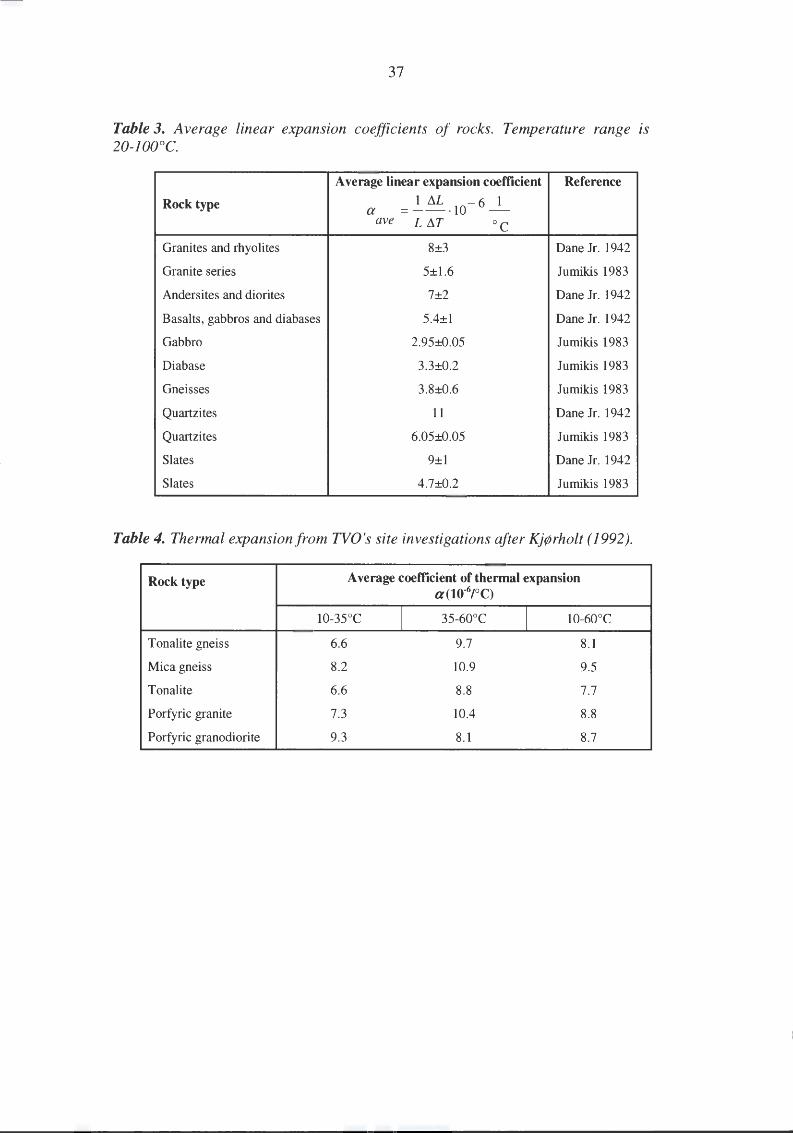
Thermal expansion data for some average linear thermal expansion coefficients of rocks are given in Table 3 after Dane Jr. (1942) and Jumikis (1983). The values listed by Dane Jr. were calculated from the data that was from multiple sources and samples. The amount of sample data is unknown for the values listed by Jumikis. From the values it can be seen that the expansion coefficient varies considerably within the same rock type.
Thermal expansion values of rock samples from TVO's site investigation at Olkiluoto are presented in Table 4 after Kj0rholt (1992). All measured rock types included three
35
samples from different depths from the bedrock. There is only listed the average values of thermal expansion coefficient for the particular rock types in the table.
Table 1. Thermal expansion coefficients of minerals (Fei 1995).
Minerals T range ~ ao a1 a2 (K) (10-6) (10-4) (10-8)
Tr
CaO vol1 293-2400 33.5 0.3032 1.0463 0.0 33.39 Hematite az 7.9 0.035 1.4836 0.0 7.85
c 293-673 8.0 0.0559 0.7904 0.0 7.91 vol 23 .8 0.1238 3.8014 0.0 23 .52
Muscovite a 9.9 0.0994 0.0 0.0 9.94 (monoclicic) b 11.1 0.111 0.0 0.0 11.1
c 293-1037 13.8 0.1379 0.0 0.0 13.79 d0013 13.7 0.1367 0.0 0.0 13.67
vol 35.4 0.3537 0.0 0.0 35.37 Tremolite a 12.0 0.1202 0.0 0.0 12.02 (monoclicic) b
297-973 11.7 0.1167 0.0 0.0 11.67
c 5.8 0.0583 0.0 0.0 5.83 vol 31.3 0.3131 0.0 0.0 31.31
Calsite a -3 .2 -0.0315 0.0 0.0 -3.15 c 297-1173 13.3 0.1922 2.5183 -1.214 12.94
vol 3.8 0.0713 3.3941 -1.214 3.45 Dolomite a 3.2 0.0271 0.6045 -0.115 3.20
c 297-973 15.6 0.1233 2.2286 -0.309 15.45 vol 22.8 0.1928 3.1703 -0.539 22.58
Cordierite a 2.2 0.0220 0.0 0.0 2.20 c 298-873 -1.8 -0.0180 0.0 0.0 -1 .80
vol 2.6 0.0260 0.0 0.0 2.60 Feldspars Microcline, Ors3.sAbt6.s vol 293-1273 15.6 0.1297 0.8683 0.0 15.51 Orthoclase, Or66.6Ab32.sAno.6 vol 293-1273 9.7 -0.0097 3.5490 0.0 9.43 Plagioclase:
Ab99An1 vol 293-1273 15.4 0.2199 1.0271 -0.871 14.85 Abn An23 vol 293-1273 8.9 0.1612 0.7683 -0.860 8.35 Abs6An44 vol 293-1273 10.6 0.1524 0.5038 -0.555 10.25 AbsAn9s vol 293-1273 14.1 0.1394 0.0597 0.0 14.11
Garnet: Almandine vol 294-1044 15.8 0.1776 1.2140 -0.507 15.46 Hornblende vol 293-1273 23.8 0.2075 1.0270 0.0 23.76 Sillimanite a 1.0 0.0231 0.0092 0.0 2.06
b 298-1273 7.4 0.0727 0.0470 0.0 7.41
c 4.2 0.0386 0.1051 0.0 4.17 vol 13.3 0.1260 0.2314 0.0 13.29
a-Quartz vol 298-773 24.3 0.1417 9.6581 -1.697 23 .84 l V olumetnc expansiOn 2 Expansion in a direction of crystal axis 3 Crystal plane
a(T) = a0 + a1 T + a2T-2 . Temperature T must be in degrees Kelvin in calculation.
Tr =reference temperature (lowest temperature for temperature range)
a(T) (10-6/K)
333 K 373K (60°C) (100°C)
33.80 34.22 8.44 9.033 8.22 8.538 25.0 26.56 9.94 9.94 11.1 11.1 13.79 13.79 13.67 13.67 35.37 35.37 12.02 12.02 11.67 11.67 5.83 5.83
31.31 31.31 -3.15 -3.15 16.66 19.89 7.48 11.06 3.68 4.138 16.97 18.42 25.0 27.23 2.20 2.20 -1.80 -1.80 2.60 2.60
15.86 16.21
10.85 12.27
17.55 19.56 10.92 12.80 11.91 13.13 14.14 14.16
17.23 18.64 24.17 24.58 2.45 2.816 7.43 7.445 4.21 4.252 13.37 13.46 31.03 38.00
36
Table 2. Thermal expansion coefficients of minerals (Dane Jr. 1942 and Skinner 1966).
Mineral Symmetry and
orientation C, Graphite Hex .LC
IIC vol
CaS04·H20 , gypsum vol Cu Cub vol Microcline Tri 11a Ors3.s, Ab16.s lib
IIC vol
Orthoclase Mono 11a Or66.6. Ab32.s. Ano.6 lib
.L(001)1
vol Plagioclase Mono 11a Anl .L (010)
vol Plagioclase An23
.L (001) vol
Plagioclase An44 .L (001)
vol Plagioclase An95
.L (001) vol
Garnet: almandine Cub vol Hornblende Mono .L(100)
lib IIC vol
Sillimanite Ortho 11a lib IIC vol
Fe20 3, Hematite Hex .LC
IIC vol
Quartz Hex .LC
IIC vol
Quru.tz Hex .LC
IIC vol
11 Parallel to crystallograph1c ax1s .L Perpendicular to crystallographic axis 1 Crystallographic plane
Tempera- Tempera- Expansion from a aorp ture a ture b to b temperature in (10"6/QC) (QC) (QC) percent
-0.14 -17.5 20 100 0.223 27.88
0.193 24.3 20 100 0.58 72.50 20 100 0.425 17.71
0.12 15.00
20 100 0.004 0.500 0.004 0.500 0.128 16.00 0.049 6.125
20 100 0.000 0.00 0.000 0.00 0.049 6.125 0.09 11 .25
20 100 0.03 3.750 0.03 3.750 0.14 17.50 0.04 5.000
20 100 0.02 2.500 0.03 3.750 0.09 11.25 0.04 5.000
20 100 0.02 2.500 0.04 5.000 0.1 12.50
0.05 6.250
20 100 0.02 2.500 0.06 7.500 0.12 15.00
20 100 0.137 17.13 0.05 6.250
20 100 0.06 7.500 0.05 6.250 0.16 20.00
0.019 2.375
20 100 0.039 4.875 0.042 5.250 0.088 11.00 0.068 8.500
20 100 0.066 8.250 0.202 25.25 0.07 23 .33
20 50 0 .03 10.00 0.17 56.67 0.14 17.50
20 100 0.08 10.00 0.36 45.00
37
Table 3. Average linear expanslon coefficients of rocks. Temperature range lS 20-100°C.
Average linear expansion coefficient Reference
Rock type a 1 !J.L -6 1
=---10 -ave L !J.T oC
Granites and rhyolites 8±3 Dane Jr. 1942
Granite series 5±1.6 Jumikis 1983
Andersites and diorites 7±2 Dane Jr. 1942
Basalts , gabbros and diabases 5.4±1 Dane Jr. 1942
Gabbro 2.95±0.05 Jumikis 1983
Diabase 3.3±0.2 Jumikis 1983
Gneisses 3.8±0.6 Jumikis 1983
Qurutzites 11 Dane Jr. 1942
Quartzites 6.05±0.05 Jumikis 1983
Slates 9±1 Dane Jr. 1942
Slates 4.7±0.2 Jumikis 1983
Table 4. Thermal expansion from TVO's site investigations after KjrjJrholt (1992).
Rock type Average coefficient of thermal expansion a(10"6/°C)
10-35°C I 35-60°C l 10-60°C
Tonalite gneiss 6.6 9.7 8.1
Mica gneiss 8.2 10.9 9.5
Tonalite 6.6 8.8 7.7
Porfyric granite 7.3 10.4 8.8
Porfyric granodiorite 9.3 8.1 8.7
---------------------------------------- --
38
5.3 Geology of Olkiluoto site
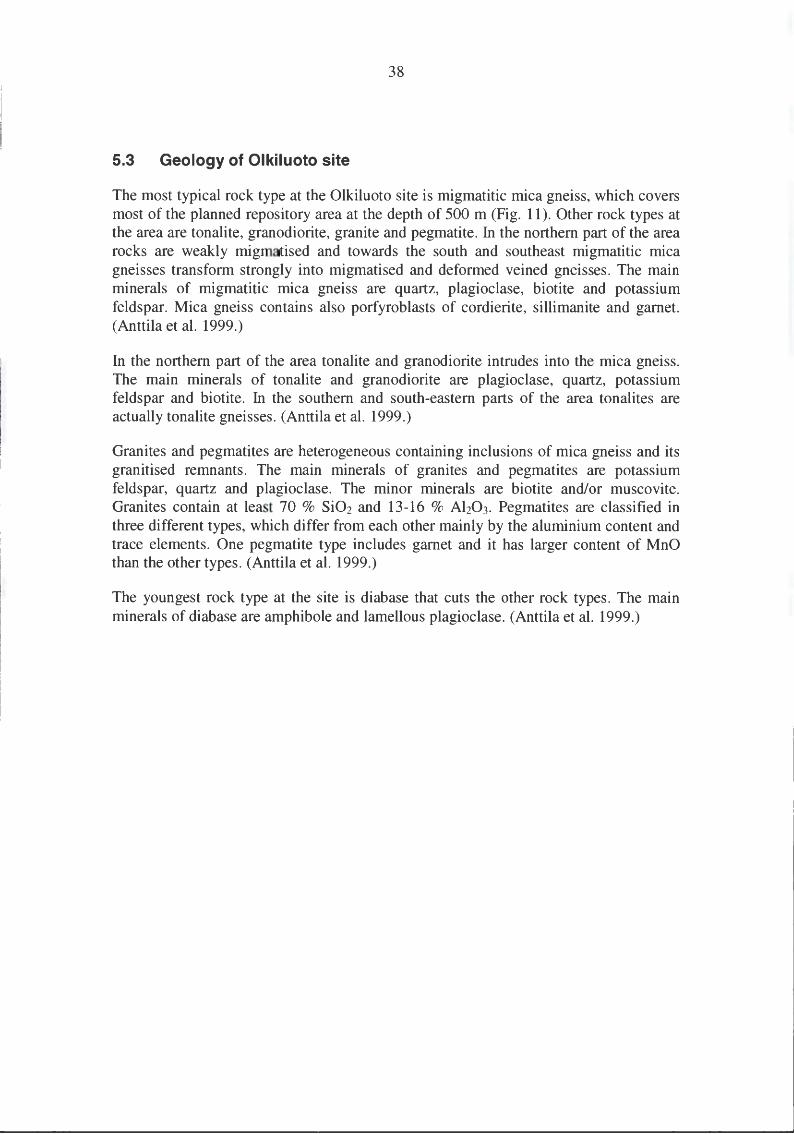
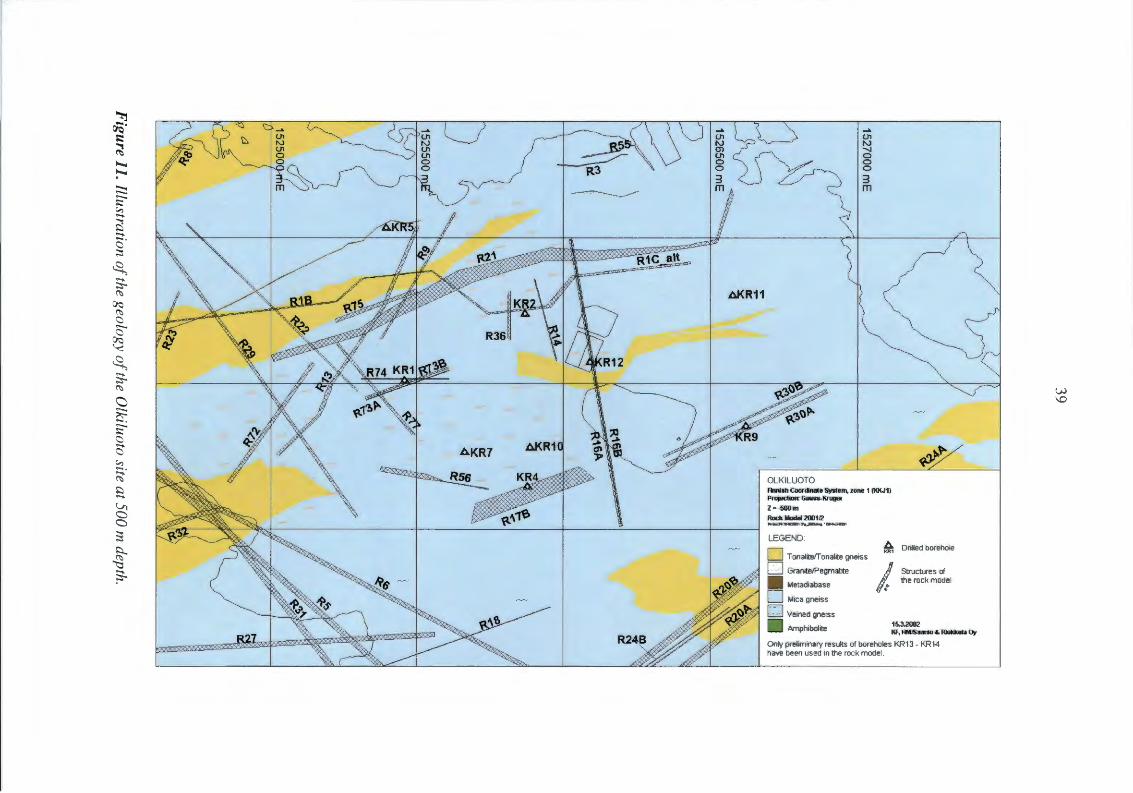
The most typical rock type at the Olkiluoto site is migmatitic mica gneiss, which covers most of the planned repository area at the depth of 500 m (Fig. 11). Other rock types at the area are tonalite, granodiorite, granite and pegmatite. In the northern part of the area rocks are weakly migmatised and towards the south and southeast migmatitic mica gneisses transform strongly into migmatised and deformed veined gneisses. The main minerals of migmatitic mica gneiss are quartz, plagioclase, biotite and potassium feldspar. Mica gneiss contains also porfyroblasts of cordierite, sillimanite and garnet. (Anttila et al. 1999.)
In the northern part of the area tonalite and granodiorite intrudes into the mica gneiss. The main minerals of tonalite and granodiorite are plagioclase, quartz, potassium feldspar and biotite. In the southern and south-eastern parts of the area tonalites are actually tonalite gneisses. (Anttila et al. 1999 .)
Granites and pegmatites are heterogeneous containing inclusions of mica gneiss and its granitised remnants. The main minerals of granites and pegmatites are potassium feldspar, quartz and plagioclase. The minor minerals are biotite and/or muscovite. Granites contain at least 70 % Si02 and 13-16 o/o Ah03. Pegmatites are classified in three different types, which differ from each other mainly by the aluminium content and trace elements. One pegmatite type includes garnet and it has larger content of MnO than the other types. (Anttila et al. 1999.)
The youngest rock type at the site is diabase that cuts the other rock types. The main minerals of diabase are amphibole and lamellous plagioclase. (Anttila et al. 1999.)
~ ~· ;::: ~ ~ ~
~ ..._ ~ ~ ~
~ ~ cs· ~
~ s. ~
0\:) ~ <::l a ~ ~ s. ~
a ..._ ~ ..._ ~ <::l a-~
~· ~ ~
v-. 0 0
~ ~
~ ~
R36
AKR7
OLKILUOTO
..... 01 "-.) ......... 0 0 0
3 m
Flmlsh Coordinate System, zone 1 (KKJ 1) Projllctlon: Gauss-Kruger
z- -soom Rock Model 200112 ftnKn:'D~1~ ... · ~ZDI
~ ...
LEGEND:
D Tonaliteffonalite gneiss
D GraniteJPegmatite
~ Drilled borehole
• Metadiabase
D Mica gneiss ' Structures of the rock model
[] Veined gneiss
D Amphibolite 15.3.2002 KF, HMISaanlo & Rillkkola ~
Only preliminary results of boreholes KR13- KR14 have been used in the rock modeL
w \0
40
5.4 Discussion
In Tables 1 and 2 can be seen that the expansion values calculated after Dane Jr. (1942) and Skinner (1966) and after Fei (1995) for the same minerals differ from each other at the same temperature. That may be a result from the calculation method, measurement method, the inaccuracy of the measurements or the mineralogical impurities/differences of the sample etc. The largest volume expansion is measured for gypsum in Table 2. The largest directional linear expansion coefficient is measured for the graphite parallel to the crystallographic axis c. Also the largest negative expansion coefficient is measured for the graphite (Table 2). The largest directional expansion for typical mineral at the disposal site can be found for quartz in the temperature range between 20-100°C from Table 2.
When comparing the average expansion values of the rocks in Tables 3 and 4 it can be seen that there is a lot of differences for the values from the different sources. The values listed after Jumikis (1983) are always lower than the values after Dane Jr. (1942). The main reasons for differences are clearly the amount of constituent minerals, different rock forming minerals (i.e. slate) and different texture. Also differences in measurement methods and errors in measurement procedure may result some separation in to the results. The results after Kj0rholt (1992) are closer to the values after Dane Jr. (1942) even though the temperature range is different. The rocks in Table 4 are nearly the same as at the disposal site, so those values are representative as the values at Table 3. Also the measured temperature range is the same as the temperature range in the disposal site rocks is expected to be. The highest average expansion coefficient in Table 4 is measured for the mica gneiss in the temperature range between 35-60°C.
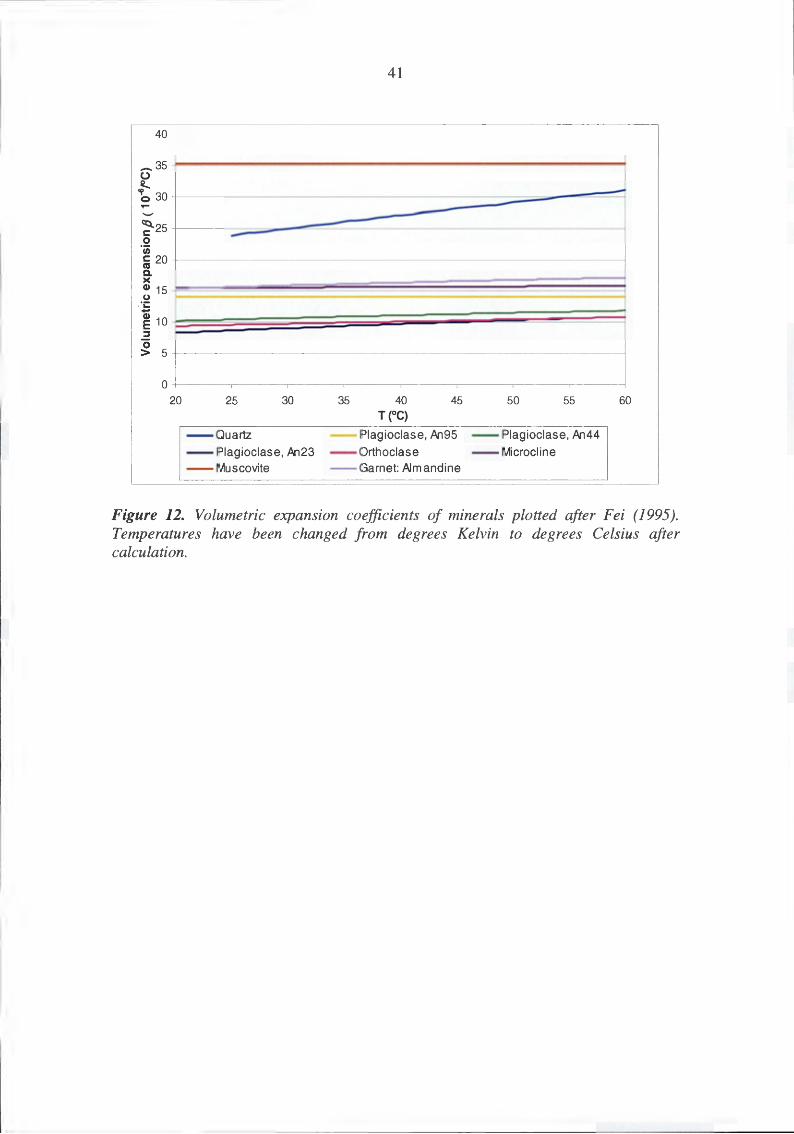
In the Fig. 12 are plotted volume expansion graphs for different minerals after equation ( 14) in temperature range between ambient to 60°C. The temperature scale is chosen considering the maximum temperatures in the rocks at the repository. From the graph can be seen the difference in character of thermal expansion in different minerals after Fei (1995). For example the volume expansion for quartz increases regularly during the temperature rise, but for muscovite the volume expansion remains the same. So the volume of quartz increases non-linearly as the volume of muscovite increases linearly as the temperature rises. Though, the total expansion of muscovite is highest in the primary temperature scale of interest. Some coefficient values may stay apparently constant due to the measurement method of the original source.
Considering the final disposal of nuclear waste at Olkiluoto the most interesting minerals due to the thermal expansion coefficient values are biotite/muscovite, feldspars and quartz (Tables 1 and 2). The thermal expansion coefficient for biotite was measured only perpendicular to the cleavage of mica flakes so the values of muscovite were used instead. Other minerals listed in the tables are presented at the Olkiluoto site in smaller amounts.
41
40
_35 u t 30 -~ -'-' --~25 -c: ---0 ·u; ~ 20 c. >< Cl) 15 u 'i: -~ 10
::::J
0 > 5
0 20 25 30 35 40 45 50 55 60
T(OC)
--Quartz Plagioclase, An95 --Plagioclase, An44
--Plagioclase, An23 --Orthoclase --Microcline --Muscovite --Garnet: Almandine
Figure 12. Volumetric expansion coefficients of minerals plotted after Fei (1995). Temperatures have been changed from degrees Kelvin to degrees Celsius after calculation.

42
43
6 ESTIMATION OF THERMAL EXPANSION COEFFICIENT WITH MODELS FOR OLKILUOTO MICA GNEISS
The estimation of thermal expansion coefficient for Olkiluoto mica gneiss was made with theoretical and particle mechanical models . The estimation of theoretical models was made by arithmetic, harmonic and geometric means of constituent mineral expansion coefficients weighted by the volumetric proportions of each mineral. The particle mechanical models were used to compare the estimation results and to test the possibilities of numerical modelling to estimate the coefficient of thermal expansion. The estimation of particle mechanical models was made by the numerical modelling program PFC2
D. The values used in the estimation are from Table 1 and 2. Because the accurate thermal expansion coefficient of biotite was not found from the literature, the coefficient of muscovite was used in the calculation. The linear thermal expansion perpendicular to the cleavage of biotite is larger than corresponding expansion of muscovite (Hidnert & Dickson 1945). This has not been taken into account e.g. because of the inappropriate temperature scale used in the study of biotite (cf. chapter 5.2).
6.1 Calculation of different mean values
The calculation of mean values is applied after Ferguson's (1988) calculation examples for thermal conductivity. The weighted arithmetic mean by the constituent minerals gives the maximum estimate for thermal expansivity of the rock. The weighted arithmetic mean can be calculated from the applied equation
n
a a = a max =I pia i i=l
and the weighted harmonic mean ah from the equation
(36)
(37)
which gives the minimum estimate of the expansivity. The ~is the thermal expansion coefficient of the ith mineral species, Pi is the volume proportion (percentage) of the occurrence of the ith mineral species and n is the number of the constituent minerals. The geometrical mean can be calculated from the equation (Schon 1996)
n
a =rra.Pi g I
(38) i=l
The same equations can be used applied to calculate the mean values of the linear thermal expansi vity and the volume expansi vity. Harmonic and geometric means can be calculated if the calculated thermal expansion coefficient values are not negative (contraction during the rise in temperature).
44
If the thermal expansion is anisotropic, the mean values can be calculated after Ferguson (1988) from the equations
(39)
3 (40)
and
(41)
where ax and ay are horizontal directions and lXz vertical direction of the thermal expansi vity.
In general form the arithmetic, harmonic and geometric means are given by
(42)
(43)
and
(44)
6.2 Theoretical models
In the calculation of the models, the varying parameters are the mineral composition, the amounts of different minerals, thermal expansion coefficient of the minerals, the orientation of the minerals etc. There are some parameters like pore space and grain size, which cannot be taken into account in simple calculations.
6.2.1 Model 1; linear expansion of one layer with different minerals
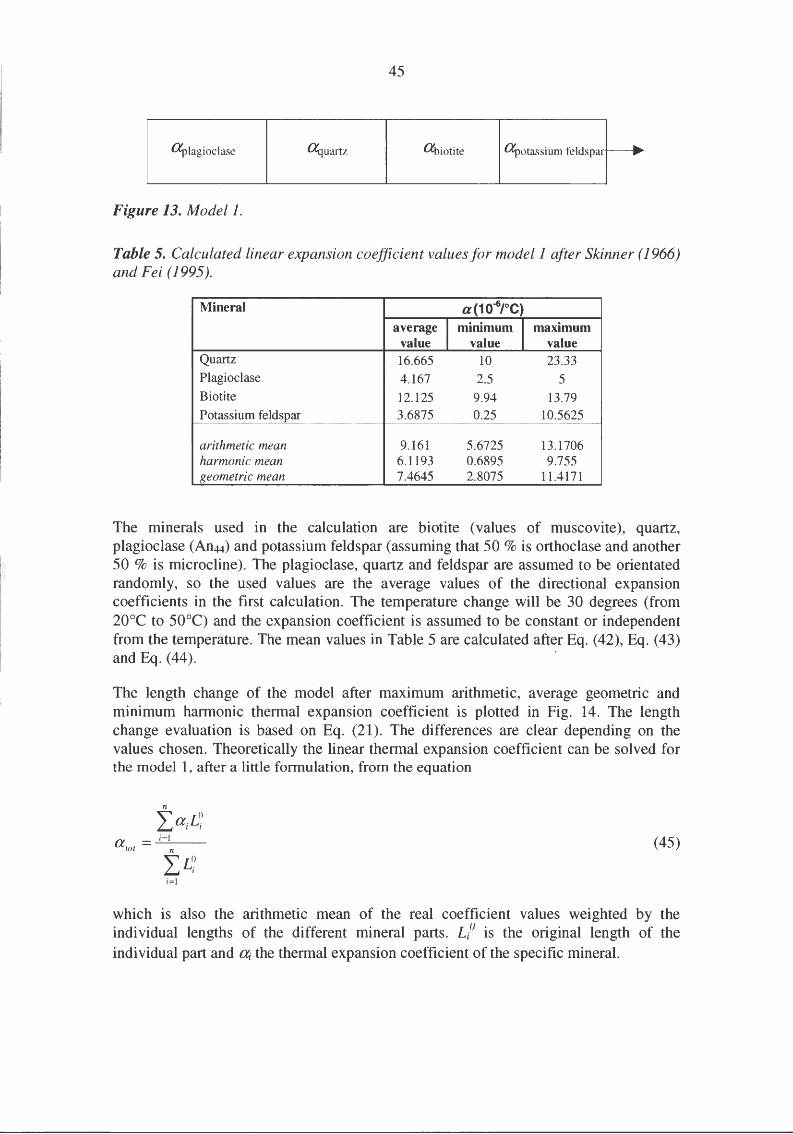
The first estimation model is a really simple one. The idea is to demonstrate the effect of the linear thermal expansion when equal amounts of constituent minerals are joined one after another (Fig. 13). The change in the length will be calculated while changing the expansion coefficient values in the tabulated limits (Table 5).
45
~ lagioclase llquartz lXbiotite ~otassium feldspar ______.
Figure 13. Model].
Table 5. Calculated linear expansion coefficient values for model] after Skinner ( 1966) and Fei (1995).
Mineral a(10-6JCC)
average I minimum I maximum value value value
Quartz 16.665 10 23.33 Plagioclase 4.167 2.5 5 Biotite 12. 125 9.94 13.79 Potassium feldspar 3.6875 0.25 10.5625
arithmetic mean 9.161 5.6725 13.1706 harmonic mean 6.1193 0.6895 9.755 geometric mean 7.4645 2.8075 11.4171
The minerals used in the calculation are biotite (values of muscovite), quartz, plagioclase (An44) and potassium feldspar (assuming that 50 % is orthoclase and another 50 % is microcline). The plagioclase, quartz and feldspar are assumed to be orientated randomly, so the used values are the average values of the directional expansion coefficients in the first calculation. The temperature change will be 30 degrees (from 20°C to 50°C) and the expansion coefficient is assumed to be constant or independent from the temperature. The mean values in Table 5 are calculated after Eq. (42), Eq. (43) and Eq. (44). ·
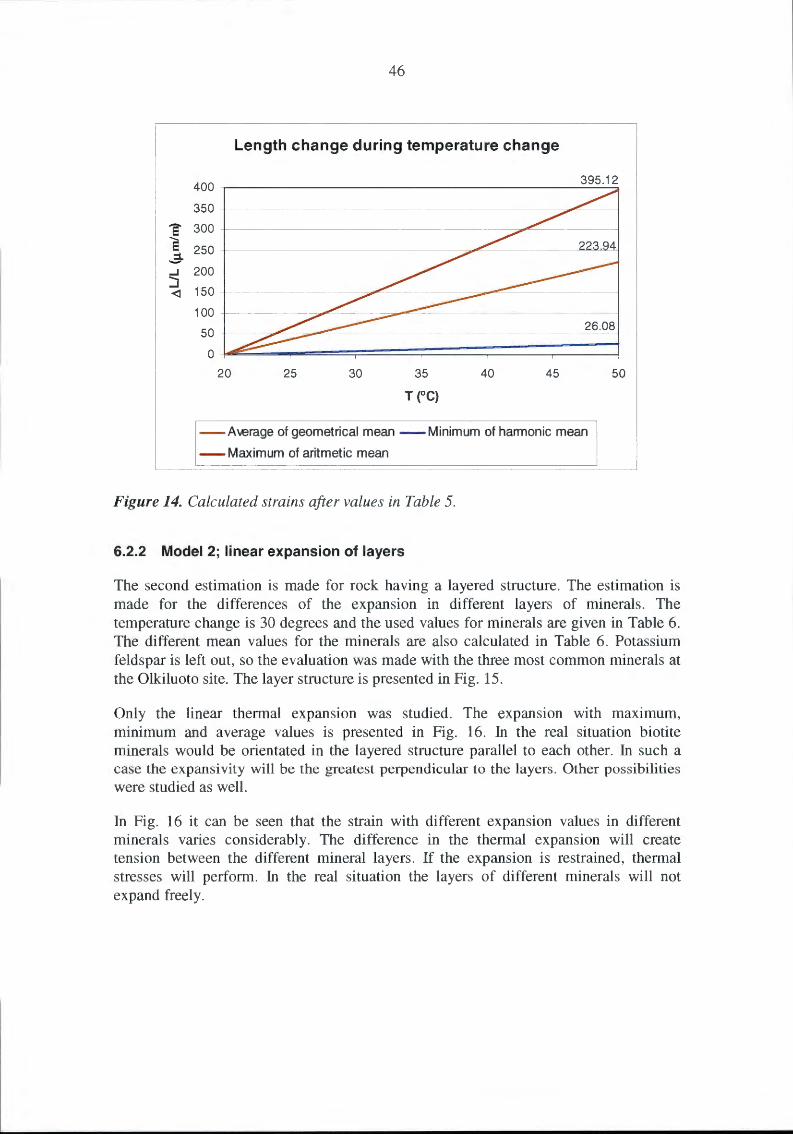
The length change of the model after maximum arithmetic, average geometric and minimum harmonic thermal expansion coefficient is plotted in Fig. 14. The length change evaluation is based on Eq. (21). The differences are clear depending on the values chosen. Theoretically the linear thermal expansion coefficient can be solved for the model 1, after a little formulation, from the equation
n
LaiL~ a = _:_i=_.::.l __
tot n (45)
LL~ i=l
which is also the arithmetic mean of the real coefficient values weighted by the individual lengths of the different mineral parts. LF is the original length of the individual part and ~the thermal expansion coefficient of the specific mineral.
46
Length change during temperature change
400 395.12
350
1' 300
s 250 :::1. -...J 200 -...J
150 <J
100
50
0
20 25 30 35 40 45 50
--A\€rage of geometrical mean --Minimum of harmonic mean
--Maximum of aritmetic mean
Figure 14. Calculated strains after values in Table 5.
6.2.2 Model 2; linear expansion of layers
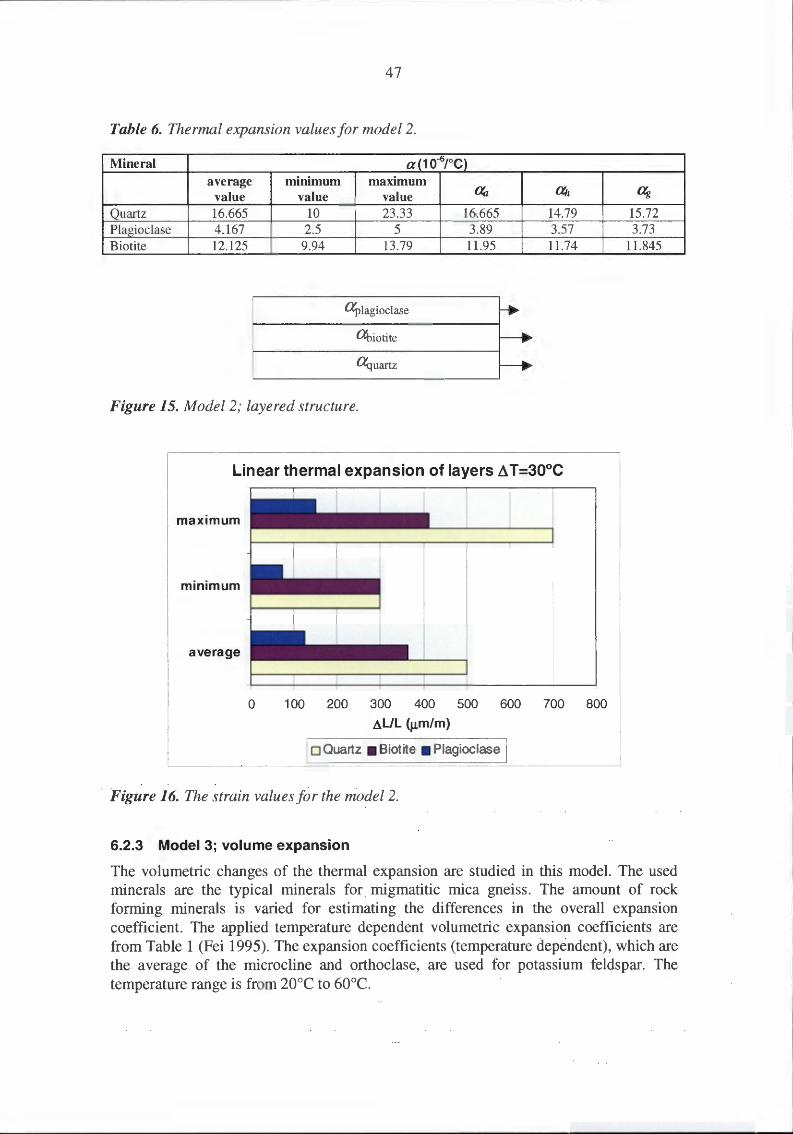
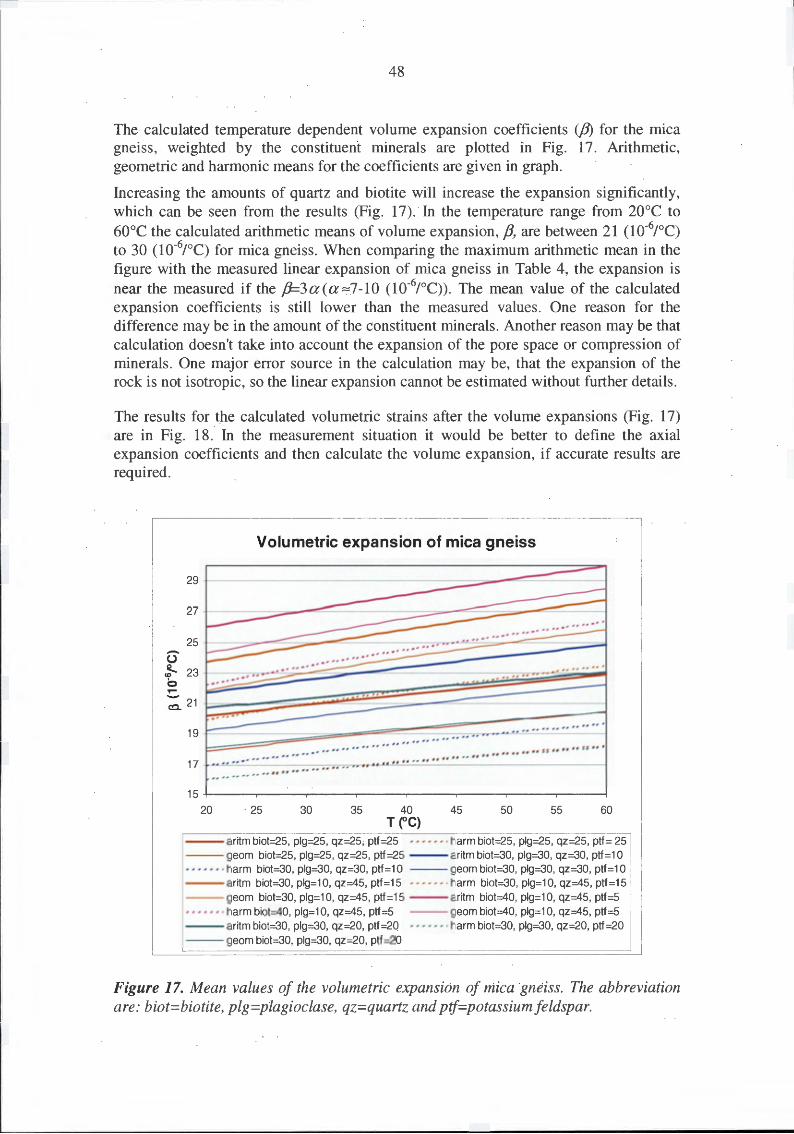
The second estimation is made for rock having a layered structure. The estimation is made for the differences of the expansion in different layers of minerals. The temperature change is 30 degrees and the used values for minerals are given in Table 6. The different mean values for the minerals are also calculated in Table 6. Potassium feldspar is left out, so the evaluation was made with the three most common minerals at the Olkiluoto site. The layer structure is presented in Fig. 15.
Only the linear thermal expansion was studied. The expansion with maximum, minimum and average values is presented in Fig. 16. In the real situation biotite minerals would be orientated in the layered structure parallel to each other. In such a case the expansivity will be the greatest perpendicular to the layers. Other possibilities were studied as well.
In Fig. 16 it can be seen that the strain with different expansion values in different minerals varies considerably. The difference in the thermal expansion will create tension between the different mineral layers. If the expansion is restrained, thermal stresses will perform. In the real situation the layers of different minerals will not expand freely.
47
Table 6. Thermal expansion values for model 2.
Mineral a(10-6JCC) average minimum maximum
value value value aa a, Quartz 16.665 10 23.33 16.665 14.79 Plagioclase 4.167 2.5 5 3.89 3.57 Biotite 12.125 9.94 13.79 11 .95 11.74
ilplagioclase
a biotite
ilquartz
Figure 15. Model 2; layered structure.
Linear thermal expansion of layers AT =30°C
maximum
minimum
average
0 100 200 300 400 500 600 700 800
al/L (~m/m)
I o Quartz • Biotite • Plagioclase I
Figure 16. The strain values for the model 2.
6.2.3 Model 3; volume expansion
Ug
15.72 3.73
11.845
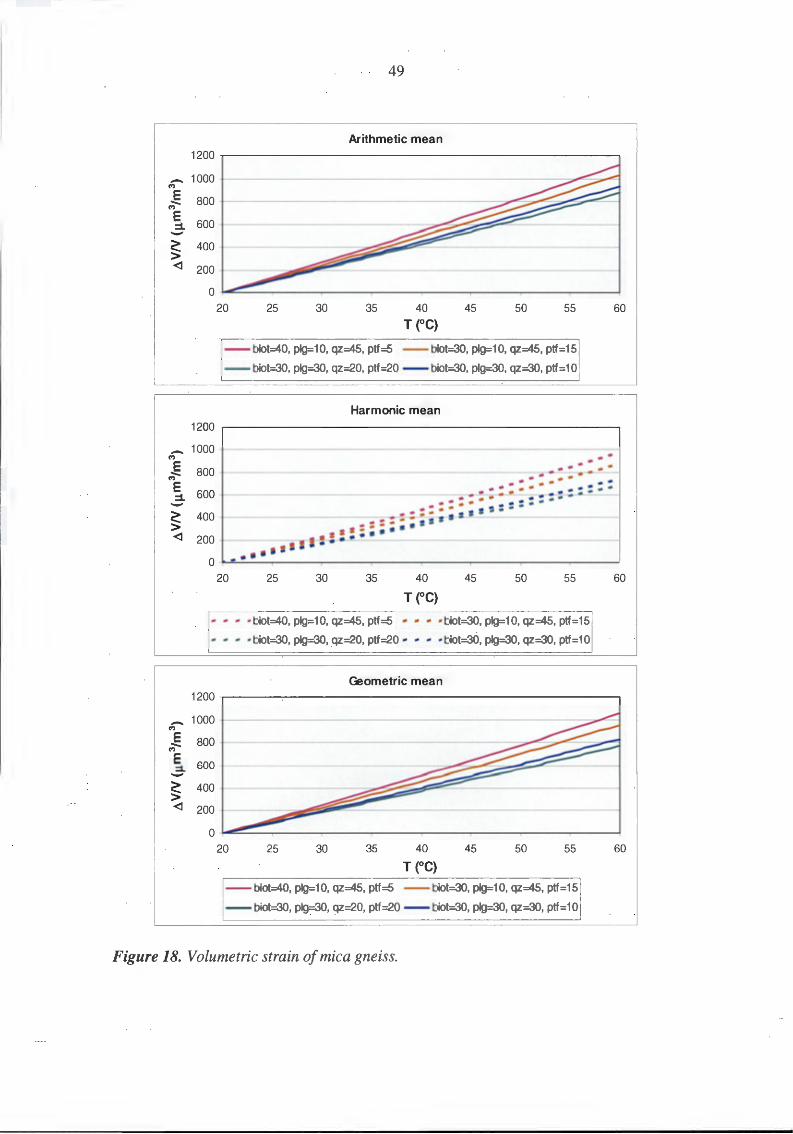
The volumetric changes of the thermal expansion are studied in this model. The used minerals are the typical minerals for migmatitic mica gneiss. The amount of rock forming minerals is varied for estimating the differences in the overall expansion coefficient. The applied temperature dependent volumetric expansion coefficients are from Table 1 (Fei 1995). The expansion coefficients (temperature dependent), which are the average of the microcline and orthoclase, are used for potassium feldspar. The temperature range is from 20°C to 60°C.
48
The calculated temperature dependent volume expansion coefficients (/3) for the mica gneiss, weighted by the constituent minerals are plotted in Fig. 17. Arithmetic, geometric and harmonic means for the coefficients are given in graph.
Increasing the amounts of quartz and biotite will increase the expansion significantly, which can be seen from the results (Fig. 17). In the temperature range from 20°C to 60°C the calculated arithmetic means of volume expansion, f3, are between 21 (1 o-6 /°C) to 30 (10-6/°C) for mica gneiss. When comparing the maximum arithmetic mean in the figure with the measured linear expansion of mica gneiss in Table 4, the expansion is near the measured if the f3=3a(a~7-10 (10-6/°C)). The mean value of the calculated expansion coefficients is still lower than the measured values. One reason for the difference may be in the amount of the constituent minerals. Another reason may be that calculation doesn't take into account the expansion of the pore space or compression of minerals. One major error source in the calculation may be, that the expansion of the rock is not isotropic, so the linear expansion cannot be estimated without further details.
The results for the calculated volumetric strains after the volume expansions (Fig. 17) are in Fig. 18. In the measurement situation it would be better to define the axial expansion coefficients and then calculate the volume expansion, if accurate results are required.
Volumetric expansion of mica gneiss
29
27
25 -u ~ 23 b ~ -ea. 21
19
17
15
20 25 30 35 40 45 50 55 60 Tee>
--aritm biot=25, plg=25, qz=25, ptf=25 ······ · harm biot=25, plg=25, qz=25, ptf= 25 --geom biot=25, plg=25, qz=25, ptf=25 --aritm biot=30, plg=30, qz=30, ptf=1 0 • • • • • • · harm biot=30, plg=30, qz=30, ptf=1 0 --geom biot=30, plg=30, qz=30, ptf=1 0 --aritm biot=30, plg=1 0, qz=45, ptf=15 ······ · harm biot=30, plg=1 0, qz=45, ptf=15 --geom biot=30, plg=1 0, qz=45, ptf=15 --aritm biot=40, plg=1 0, qz=45, ptf=5 ······· harm biot=40, plg=1 0, qz=45, ptf=5 --geom biot=40, plg=1 0, qz=45, ptf=5 --aritm biot=30, plg=30, qz=20, ptf=20 ······ · harm biot=30, plg=30, qz=20, ptf=20 --geom biot=30, plg=30, qz=20, ptf=20
Figure 17. Mean values of the volumetric expansion of mica gneiss. The abbreviation are: biot=biotite, plg=plagioclase, qz=quartz and pif=potassiumfeldspar.
-M
E -M
E :1. -~ <l
-M
E -M
E :1. -~ <l
-M
E -M
E :::l -~ > <l
49
Arithmetic mean 1200
1000
800
600
400
200
0
20 25 30 35 40 45 50 55
Tee> --biot=40, plg=1 0, qz=45, ptf=5 --biot=30, plg=1 0, qz=45, ptf=15
--biot=30, plg=30, qz=20, ptf=20 --biot=30, plg=30, qz=30, ptf=1 0
Harmonic mean 1200
1000 -
800
600
400
200
0 -20
...... ...... ·=;5-·= -:··· -·• !··· ··= ······-25 30 35 40
Tee> 45
...... ---· --_ .. ---_ .. -- -.-- .-- .-:: --
50 55
.. .. .. .. biot=40, plg=1 0, qz=45, ptf=5 .. .. .... biot=30, plg=1 0, qz=45, ptf=15
.. .. .. .. biot=30, plg=30, qz=20, ptf=20 ........ biot=30, plg=30, qz=30, ptf=1 0
Geometric mean 1200
1000
800
400
200
0
20 25 30 35 40 45 50 55
Tee> --biot=40, plg=1 0, qz=45, ptf=5 --biot=30, plg=1 0, qz=45, ptf=15
-- biot=30, plg=30, qz=20, ptf=20 --biot=30, plg=30, qz=30, ptf=1 0
Figure 18. Volumetric strain of mica gneiss.
60
60
60
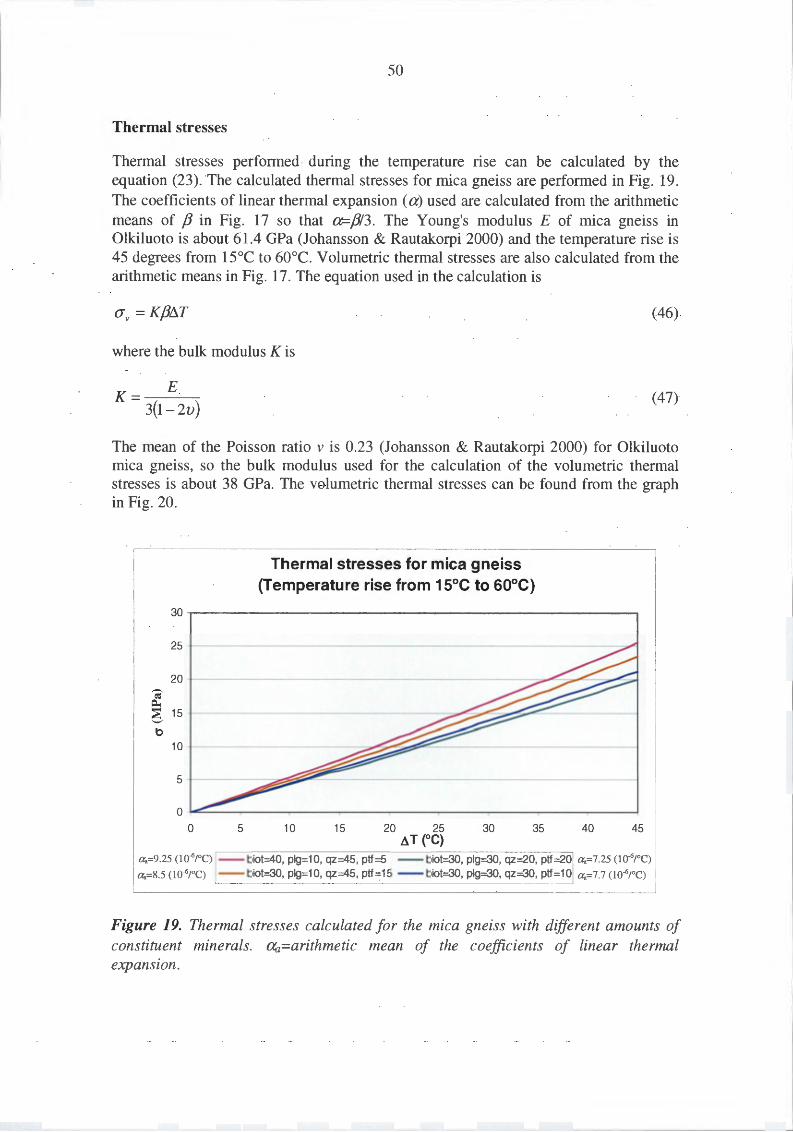
50
Thermal stresses
Thermal stresses performed during the temperature rise can be calculated by the equation (23). The calculated thermal stresses for mica gneiss are performed in Fig. 19. The coefficients of linear thermal expansion (a) used are calculated from the arithmetic means of f3 in Fig. 17 so that a=fJ/3 . The Young's modulus E of mica gneiss in Olkiluoto is about 61.4 GPa (Johansson & Rautakorpi 2000) and the temperature rise is 45 degrees from 15°C to 60°C. Volumetric thermal stresses are also calculated from the arithmetic means in Fig. 17. The equation used in the calculation is
(j V = Kf311T (46)
where the bulk modulus K is
K= E 3(1- 2v)
(47)
The mean of the Poisson ratio v is 0.23 (Johansson & Rautakorpi 2000) for Olkiluoto mica gneiss, so the bulk modulus used for the calculation of the volumetric thermal stresses is about 38 GPa. The volumetric thermal stresses can be found from the graph in Fig. 20.
30
25
20 -.. ~ ~
6 15
t)
10
5
0
0 5
Thermal stresses for mica gneiss (Temperature rise from 15°C to 60°C)
10 15 20 25 30 35 AT (°C)
40 45
a..=9.25 (10.6/0 C) -- biot=40, plg=1 0, qz=45, ptf=5 --biot=30, plg=30, qz=20, ptf=20 a..=7.25 (10.6/
0 C)
a..=8.5 (10"6/ 0 C) -- biot=30, plg=1 0, qz=45, ptf=15 --biot=30, plg=30, qz=30, ptf=1 0 a..=7.7 oo-6/ 0 C)
Figure 19. Thermal stresses calculated f or the mica gneiss with different amounts of constituent minerals. aa=arithmetic mean of the coefficients of linear thermal expansion .
____ _ _ ___ ___________ _______________ ____J
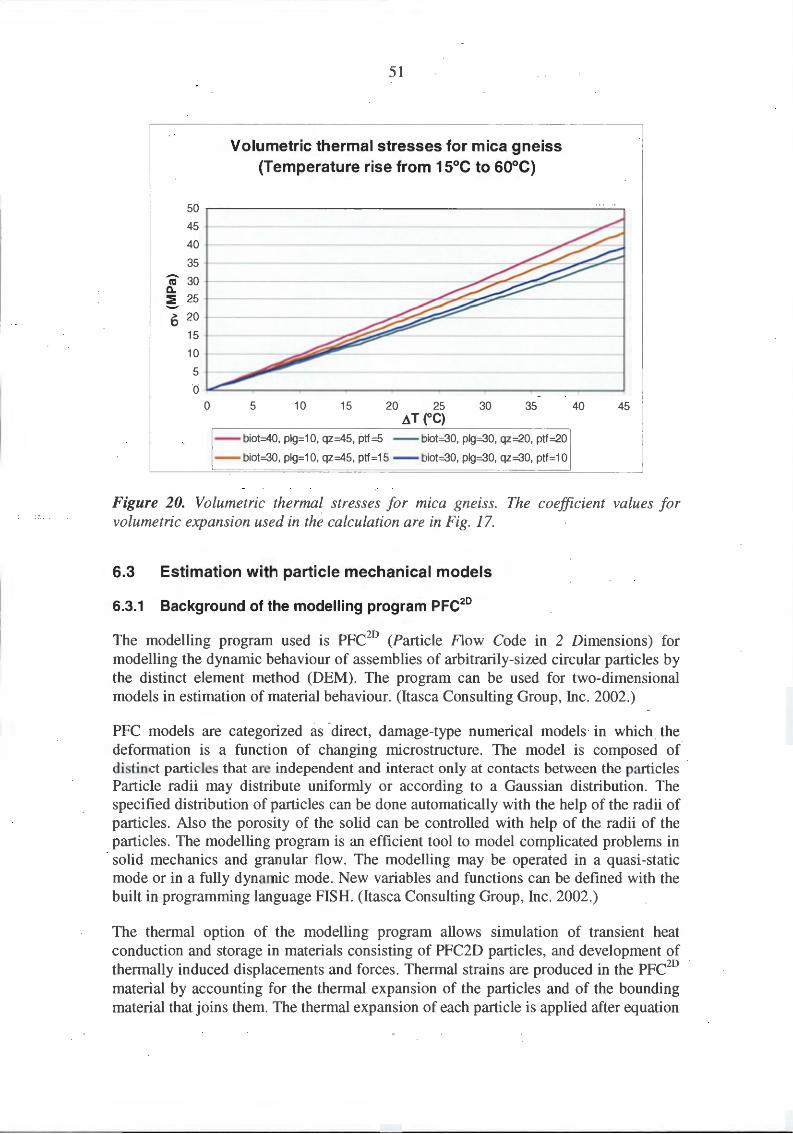
50
45
40
35
Ci 30 a. :!: 25 -> 20 b
15
10
5
0
0
51
Volumetric thermal stresses for mica gneiss (Temperature rise from 15°C to 60°C)
5 10 15 20 25 30 35 AT (°C)
--biot=40, plg=1 0, qz=45, ptf=5 --biot=30, plg=30, qz=20, ptf=20
--biot=30, plg=1 0, qz=45, ptf=15 --biot=30, plg=30, qz=30, ptf=1 0
40 45
Figure 20. Volumetric thermal stresses for mica gneiss. The coefficient values for volumetric expansion used in the calculation are in Fig. 17.
6.3 Estimation with particle mechanical models
6.3.1 Background of the modelling program PFC20
The modelling program used is PFC2D (Particle Flow Code in 2 Dimensions) for
modelling the dynamic behaviour of assemblies of arbitrarily-sized circular particles by the distinct element method (DEM). The program can be used for two-dimensional models in estimation of material behaviour. (ltasca Consulting Group, Inc. 2002.)
PFC models are categorized as direct, damage-type numerical models in which the deformation is a function of changing microstructure. The model is composed of distinct particles that are independent and interact only at contacts between the particles Particle radii may distribute uniformly or according to a Gaussian distribution. The specified distribution of particles can be done automatically with the help of the radii of particles. Also the porosity of the solid can be controlled with help of the radii of the particles. The modelling program is an efficient tool to model complicated problems in solid mechanics and granular flow. The modelling may be operated in a quasi -static mode or in a fully dynamic mode. New variables and functions can be defined with the built in programming language FISH. (ltasca Consulting Group, Inc. 2002.)
The thermal option of the modelling program allows simulation of transient heat conduction and storage in materials consisting of PFC2D particles, and development of thermally induced displacements and forces. Thermal strains are produced in the PFC2
D
material by accounting for the thermal expansion of the particles and of the bounding material that joins them. The thermal expansion of each particle is applied after equation
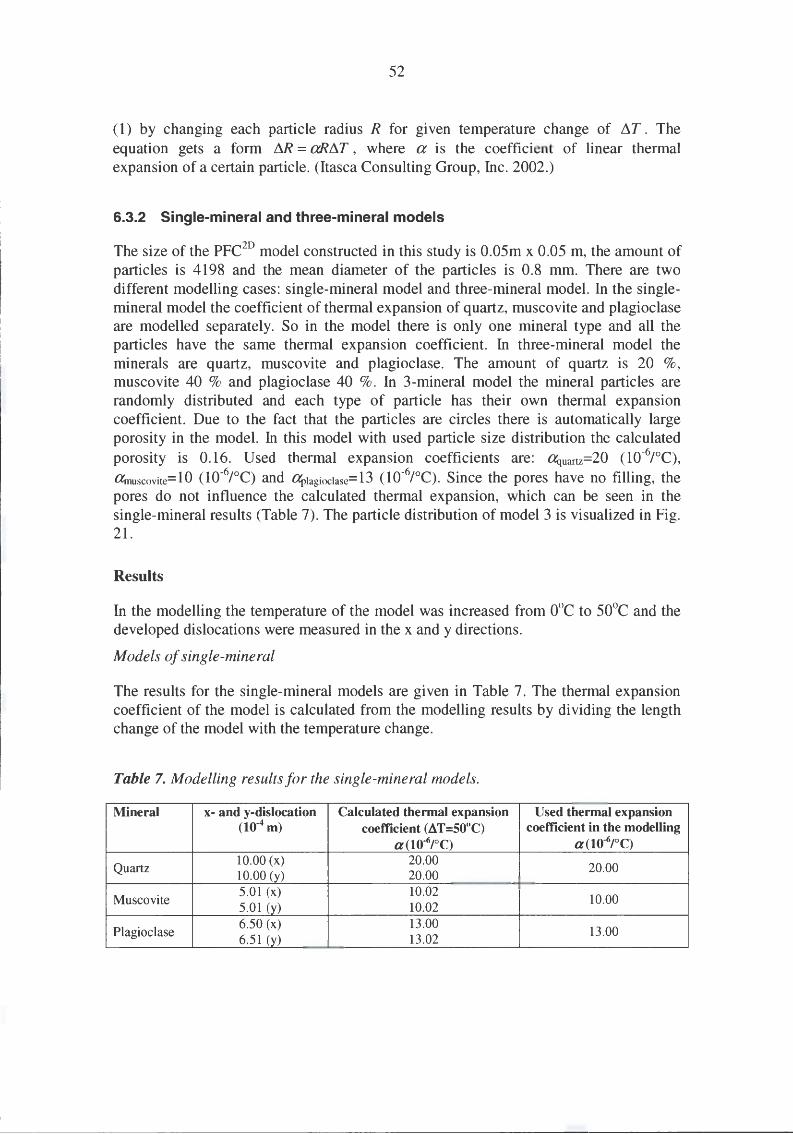
52
( 1) by changing each particle radius R for given temperature change of 11T . The equation gets a form M = aRI'1.T , where a is the coefficient of linear thermal expansion of a certain particle. (ltasca Consulting Group, Inc. 2002.)
6.3.2 Single-mineral and three-mineral models
The size of the PFC2D model constructed in this study is 0.05m x 0.05 m, the amount of
particles is 4198 and the mean diameter of the particles is 0.8 mm. There are two different modelling cases: single-mineral model and three-mineral model. In the singlemineral model the coefficient of thermal expansion of quartz, muscovite and plagioclase are modelled separately. So in the model there is only one mineral type and all the particles have the same thermal expansion coefficient. In three-mineral model the minerals are quartz, muscovite and plagioclase. The amount of quartz is 20 %, muscovite 40 % and plagioclase 40 %. In 3-mineral model the mineral particles are randomly distributed and each type of particle has their own thermal expansion coefficient. Due to the fact that the particles are circles there is automatically large porosity in the model. In this model with used particle size distribution the calculated porosity is 0.16. Used thermal expansion coefficients are: aquartz=20 (10-6/°C), arnuscovite=10 (10-6JOC) and Clptagioclase=13 (10-6JOC). Since the pores have no filling, the pores do not influence the calculated thermal expansion, which can be seen in the single-mineral results (Table 7). The particle distribution of model 3 is visualized in Fig. 21.
Results
In the modelling the temperature of the model was increased from 0°C to 50°C and the developed dislocations were measured in the x and y directions.
Models of single-mineral
The results for the single-mineral models are given in Table 7. The thermal expansion coefficient of the model is calculated from the modelling results by dividing the length change of the model with the temperature change.
Table 7. Modelling results for the single-mineral models.
Mineral x- and y-dislocation Calculated thermal expansion Used thermal expansion (10-4 m) coefficient (AT=50°C) coefficient in the modeUing
a(10-6/°C) a(10-6JCC)
Quartz 10.00 (x) 20.00
20.00 10.00 (y) 20.00
Muscovite 5.01 (x) 10.02
10.00 5.01 (y) 10.02
Plagioclase 6.50 (x) 13.00
13.00 6.51 (y) 13.02
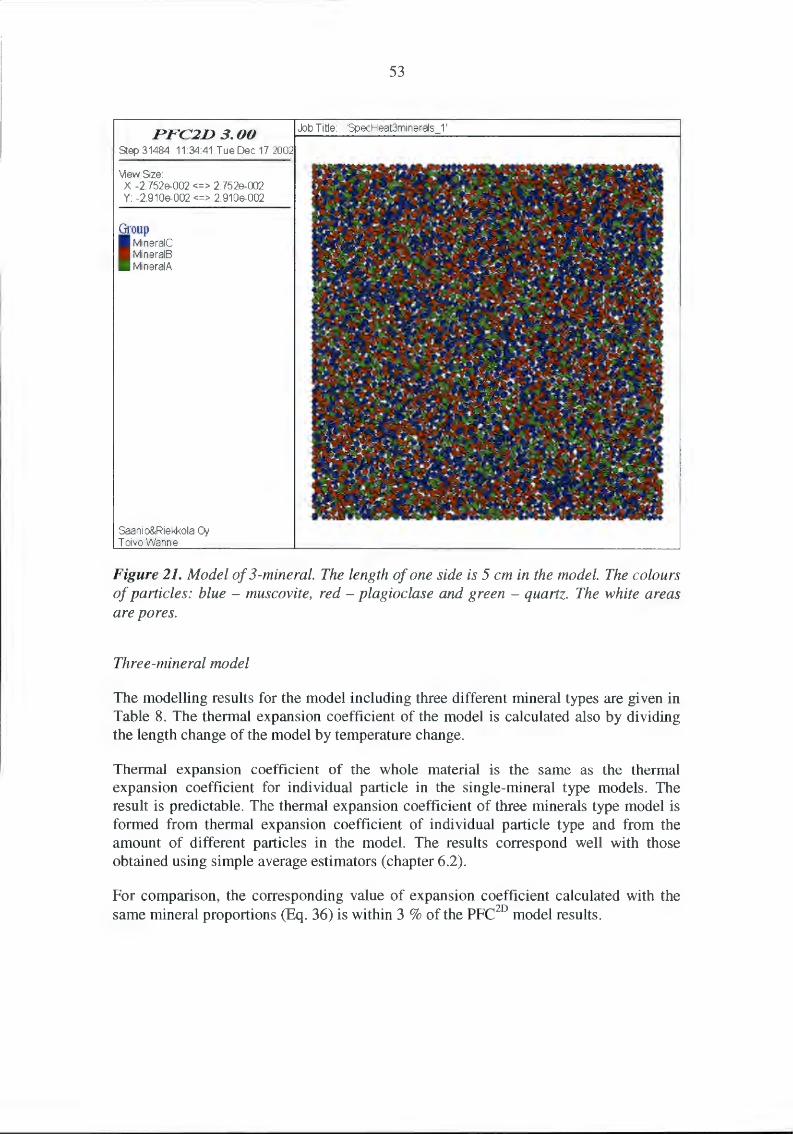
PFC2D3.00 Step 31484 11 ·34:41 Tue Dec 17 2002
View Size X -2 . 752~002 <=> 2.752e-002 Y: -2 .910~002 <=> 2.910~002
Group MineraiC MineralS Mi neraiA
Saani o&R ie~o la Oy Toivo Wanne
53
Job Title: 'SpecHeat3minerals_1 '
Figure 21. Model of 3-mineral. The length of one side is 5 cm in the model. The colours of particles: blue - muscovite, red - plagioclase and green - quartz. The white areas are pores.
Three-mineral model
The modelling results for the model including three different mineral types are given in Table 8. The thermal expansion coefficient of the model is calculated also by dividing the length change of the model by temperature change.
Thermal expansion coefficient of the whole material is the same as the thermal expansion coefficient for individual particle in the single-mineral type models. The result is predictable. The thermal expansion coefficient of three minerals type model is formed from thermal expansion coefficient of individual particle type and from the amount of different particles in the model. The results correspond well with those obtained using simple average estimators (chapter 6.2).
For comparison, the corresponding value of expansion coefficient calculated with the same mineral proportions (Eq. 36) is within 3 % of the PFC2
D model results .
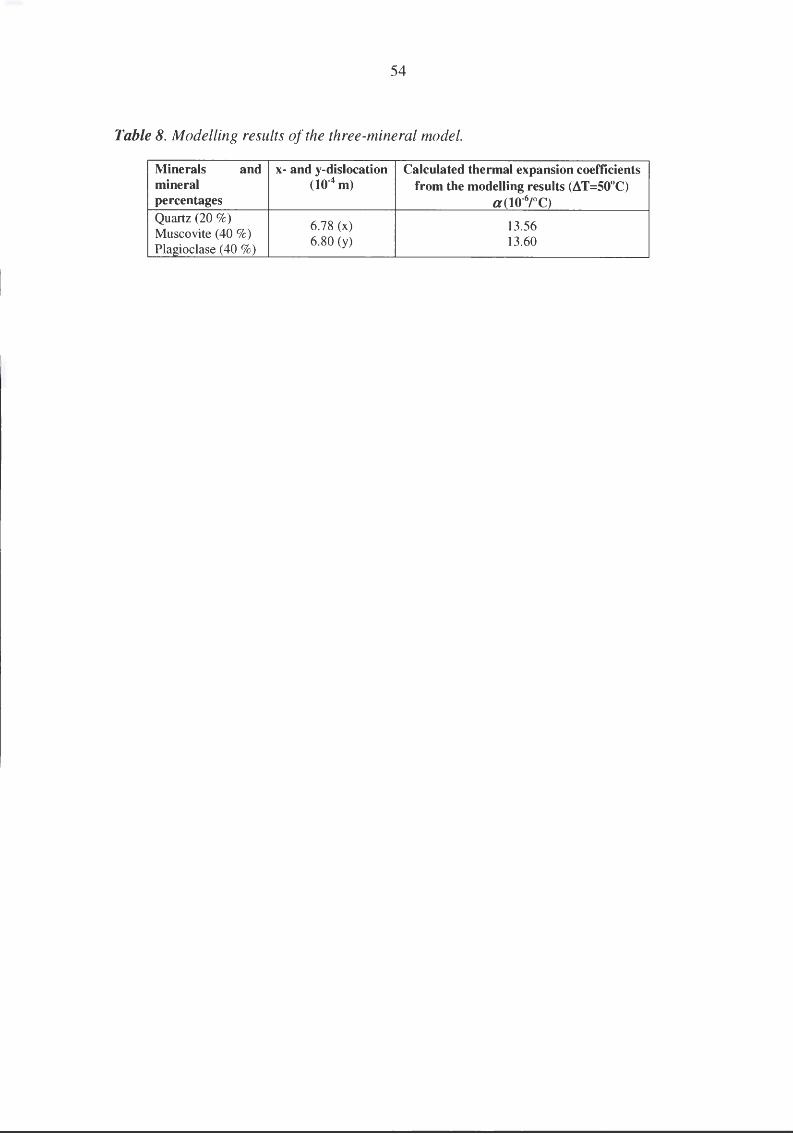
54
Table 8. Modelling results of the three-mineral model.
Minerals and mineral percentages Quartz (20 %) Muscovite ( 40 %) Plagioclase ( 40 %)
x- and y-dislocation (10-4 m)
6.78 (x) 6.80 (y)
Calculated thermal expansion coefficients from the modelling results (AT=50°C)
a(10-6/°C)
13.56 13.60
55
7 CONCLUSIONS
The difficulty with the estimation of thermal expansion coefficient with different parameters is that there often seems to be one parameter whose behaviour cannot be predicted accurately. In the thermomechanical sense of thermal expansion both the thermal and mechanical parameters should be determined, especially when the study area is in 500 meters depth in the bedrock. Deeper in the bedrock the confining pressure increases, which will increase the total stresses (mechanical stress + thermal stress) in the rock when the rock is heated.
The main rock type in the Olkiluoto site is migmatttlc mica gneiss. The thermal expansion of the migmatitic mica gneiss is heterogeneous and anisotopic due to the nature of the rock structure and the constituent minerals . The average linear thermal expansion coefficients for the minerals are: llquartz=16.67 (10-6/°C), Q};>Iagioclase(An44)=4.17 (10-6/oC), arnuscovite!biotite=12.13 (10-6/oC) and Q};>otassium felct par=3.69 (10-6/oC) (after Skinner 1966 and Fei 1995). Measured thermal expansivities of the rocks differ significantly between different sources. The thermal expansion can change considerably even within the same rock type from the same area. That may be a result from the changes in texture, constituent minerals, mineral proportions, pore space, grain sizes, orientation of minerals, fractures etc. The difference can be explained in many cases also by the measurement method of strain, because the thermal expansion is non-linear in most of the cases.
The amount of quartz and biotite/muscovite in the rock has the most significant role causing large thermal expansion, because those minerals have the greatest thermal expansion coefficients and the expansivity is anisotropic, particularly for quartz. According to Fei (1995) the volumetric expansion of muscovite (biotite) is higher than the expansion of quartz in the temperature range of up to 60°C (maximum temperature in rock), but the volumetric expansion of quartz increases during the temperature rise and the volumetric expansion of quartz is only a little smaller than the expansion of muscovite (biotite) in the highest temperatures (about 60°C) to be expected of the rocks at the site.
The thermal expansion coefficient usually increases simultaneously with the rise in temperature and decreases with decreasing temperature. The effect of pressure change is the opposite to the temperature change. When pressure increases the thermal expansivity decreases. If the confining pressure is high enough it can prevent the expansion caused by the temperature rise. When the natural thermal expansion is prevented thermal stresses will be produced in the rock. These thermal stresses may cause thermal cracks and even failures in the rock. In the final disposal situation the temperature change is so small that large thermal expansion in the rock will not occur. The compression in the depths of 500 meters (except at the excavation boundaries) will reduce the expansion to be smaller than in a load-free situation.
The most common and suitable methods for laboratory measurements of thermal expansion in rocks are dilatometric and strain gauge methods. Dilatometers are commercial standardized equipment, whereas strain gauge systems can be constructed relatively easily by the user. In dilatometric equipment the compression (load) cannot be applied into the measurements without difficulties, but for the strain gauge system the
56
compression can be produced for instance applying a static load. In the future it may be relevant to measure thermal expansion with and without compression to find out, whether distinct differences between the results exist. On the other hand, if the sample is allowed to expand freely the thermal expansion derived from the measurements is the highest possible and can be used as a conservative value.
In laboratory tests the measured thermal expansion is usually larger than the predicted one. This can be attributed to the fact that thermal cracks will be originated due to the temperature rise, which will increase the thermal expansion. Thermal cycling cracks can be avoided by the use of low temperature rates, but the cracks formed by the mismatch of the thermal expansion in the grain boundaries cannot be avoided. If thermal cracks occur the thermal expansion coefficient of the rock will increase because the rock will not compress back to the original size after cooling. On the other hand, large porosity may lower the thermal expansion because grains will expand into the cracks.
The estimation with theoretical models will give a hint of the real thermal expansion. However, since accurate directional or volumetric thermal expansion coefficients even for the common minerals are missing the estimation is only an approximation at best. Weighted arithmetic mean values provide a simple estimator, which gives the highest values of expansion coefficient (conservative estimator). The particle mechanical models are a valuable addition to the estimation of the thermal expansion of rocks, although its not very fast technique at the moment. Laboratory measurements with dilatometer should possibly be made in the future to get more knowledge of the behaviour of thermal expansion properties of different rock types.
According to theoretical calculations the volumetric thermal expansion for Olkiluoto mica gneiss is about 21-30 (10-6/°C) from the temperatures between 20-60°C. The linear thermal expansion in the same temperature scale is about 7-10 (1 o-6 fDC). The linear thermal expansion coefficient received with PFC2D for Olkiluoto mica gneiss is about 13-14 (10-6/°C) in the temperature scale from ooc to 50°C. The thermal expansion coefficients from particle mechanical models differ from the results of theoretical model, which is basically due to differences in applied thermal expansion coefficients of minerals, constituent minerals and the amounts of different minerals used in calculation.
57
ACKNOWLEDGEMENTS
The authors are very grateful to Toivo Wanne (Saanio & Riekkola Consulting Engineers), who participated to this project and made the particle mechanical models included into this report in chapter 6.3.

58
59
REFERENCES
Ala-Vainio, I. 1996. Rontgendiffraktio (in Finnish). In: Kojonen K. & Laukkanen J. (eds.), Sovellettu mineralogia kaivos- ja metallurgisessa teollisuudessa. Vuorimiesyhdistys-Bergsmannaforeningen, Sarja B, No. 62, pp. 47-52.
Anderson, O.L. 2000. The Grtineisen ratio for the last 30 years. Geophysical Journal International, Vol. 143, No. 2. pp. 279-294.
Anttila, P. , Ahokas, H. , Front, K., Hinkkanen, H., Johansson, E. , Paulamak:i, S., Riekkola, R. , Saari, J. , Saksa, P., Snellman, M. , Wikstrom, L. & Ohberg, A. 1999. Final disposal of spent nuclear fuel in Finnish bedrock - Olkiluoto site report. Helsinki, Finland: Posiva Oy. 206 p. POSIV A 99-10
Arndt, J., Bartel, T., Scheuber, E. & Schilling, F. 1997. Thermal and rheological properties of granodioritic rocks from the Central Andes, North Chile. Tectonophysics, Vol. 201, No. 1-2, pp. 75-88.
Bass, J.D. 1995. Elasticity of Minerals, Glasses, and Melts. In: Ahrens T.J. (ed.). Mineral physics and crystallography - A Handbook of Physical Constants, AGU Reference shelf 2. American Geophysical Union. pp. 45-63.
Chopelas, A. 2000. Thermal expansivity of mantle relevant magnesium silicates derived from vibrational spectroscopy at high pressure. American Mineralogist, Vol. 85, No. 2, pp. 270-278.
Cooper, H.W. & Simmons, G. 1977. The Effect of Cracks on the Thermal Expansion of Rocks. Earth and Planetary Science Letters, Vol. 36, No. 3, pp. 404-412.
Dane, Jr., E.B. 1942. Density at High Temperature; Thermal Expansion. In : Birch F., Schairer J.F. & Spicer H. C. (eds.). Handbook of Physical Constants. Geological Society of America Special Papers, Number 36, pp. 27-37.
Fei, Y. 1995. Thermal expansion. In: Ahrens T.J. (ed.). Mineral physics and crystallography - A Handbook of Physical Constants, AGU Reference shelf 2. Washington, USA: American Geophysical Union. pp. 29-44.
Ferguson, J. 1988. Mathematics in Geology. London, United Kingdom: Alien & Unwin. 299 p.
Helffrich, G. 1999. Practical use of Suzuki's thermal expansivity formulation . Physics of the Earth and Planetary Interiors, Vol. 116, Nos. 1-4, pp. 133-136.
Hidnert, P. & Dickson, P. 1945. Some physical properties of mica. Research paper RP1675. Journal of Research of the National Bureau of Standards, Vol. 35, No. 4, pp. 309-353.
Ibach, H. & Liith, H. 1991. Solid-State Physics - An Introduction to Theory and Experiment. Berlin, Germany: Springer-Verlag. 341 p.
--------------------- --
60
ltasca Consulting Group, Inc. 2002. PFC2D (Particle Flow Code in 2 Dimensions). Version 3.0. Minneapolis, USA.
Johansson, E. & Rautakorpi, J. 2000. Rock mechanics stability at Olkiluoto, Hastholmen, Kivetty and Romuvaara. Helsinki, Finland: Posiva Oy. 101 p. POSN A 2000-02.
Jumikis, A.R. 1983. Rock Mechanics, Second Edition. Clausthal-Zellerfeld, Federal Republic of Germany: Trans Tech Publications. 613 p.
Keller, F.J., Gettys, W.E. & Skove, M.J. 1993. Physics, Classical and Modern. 2nd Ed., International Edition. New York, USA: McGraw-Hilllnc. 1147 p.
Kirby, R.K., Hahn, T.A. & Rothrock, B.D. 1972. Thermal expansion. In: Gray D.E. (coord. ed.). American Institute of Physics handbook. Third edition. American Institute of Physics, New York, USA: McGraw-Hill Book Company. pp. 4-119- 4-142.
Kirkwood, W.F. 1985. Experimental stress analysis. In: Blake A. (ed.). Handbook of Mechanics, Materials, and Structures. A Wiley-Interscience Publication, John Wiley and Sons. pp. 397-444. (Wiley series in mechanical engineering practice).
Kj~rholt, H. 1992. Thermal properties of rock. Helsinki, Finland: Teollisuuden Voima Oy. 15 p. + 4 appendices. Site investigation, Work report 92-56.
Knight, K.S., Stretton, I.C. & Schofield, P.F. 1999. Temperature evolution between 50 K and 320 K of the thermal expansion tensor of gypsum derived from neutron powder diffraction data, Phys Chem Minerals, Vol26, No. 6, pp. 477-483.
Kukkonen, I. 2000. Thermal properties of the Olkiluoto mica gneiss: Results of laboratory measurements. Helsinki, Finland: Posiva Oy. 28 p. Working Report 2000-40.
Kukkonen, I. & Lindberg, A. 1995. Thermal conductivity of rocks at the TVO investigation sites Olkiluoto, Romuvaara and Kivetty. Helsinki, Finland: Nuclear Waste Commission of Finnish Power Companies. 29 p. YJT-95-08
Kukkonen, 1., & Lindberg, A. 1998. Thermal properties of rocks at the investigation sites: measured and calculated thermal conductivity, specific heat capacity and thermal diffusivity. Helsinki, Finland: Posiva Oy. 29 p. Working Report 98-09e.
Kukkonen, I. & Suppala, I. 1999. Measurement of thermal conductivity and diffusivity in situ: Literature survey and theoretical modelling of measurements. Helsinki, Finland: Posiva Oy. 69 p. POSIV A 99-01.
Kukkonen, 1., Suppala, 1., Sulkanen, K. & Koskinen, T. 2000. Measurement of thermal conductivity and diffusivity in situ: measurements and results obtained with a test instrument. Helsinki, Finland: Posiva Oy. 28 p. Working Report 2000-25.
Kukkonen, 1., Suppala, I. & Koskinen, T. 2001. Measurement of rock thermal properties in situ: numerical models of borehole measurements and development of calibration techniques. Helsinki, Finland: Posiva Oy. 47 p. Working Report 2001-13.
61
Larsson, K. 2001. Determination of the coefficient of thermal expansion for two Aspo rocks, diorite and granite. Master's thesis, Luldi University of Technology, Department of Civil and Mining Engineering, Division of Rock Mechanics. 35 p. + 3 appendices.
Martin, C.D., Christiansson, R. & Soderhall, J. 2001. Rock stability considerations for siting and constructing a KBS-3 repository - Based on experiences from Aspo HRL, AECL's URL, tunneling and mining. Stockholm, Sweden: Swedish Nuclear Fuel and Waste Management Company. 85 p. SKB Technical Report TR-01-38.
Masuda, K., Erskine, D. & Anderson, O.L. 2000. Differentiallaser-diffractometer for thermal expansion measurements. American Mineralogist, Vol. 85, No. 2, pp. 279-282.
McKinley, J.W. & Mardis, L.D. 1985. Strength of Materials. In: Blake A. (ed.). Handbook of Mechanics, Materials, and Structures. A Wiley-Interscience Publication, John Wiley and Sons. pp. 173-278. (Wiley series in mechanical engineering practice).
Molin, G., Martignago, F. & Dal Negro, A. 2001. A new radiative microfurnace for Xray single-crystal diffractometry. Eur. J. Mineral., Vol. 13, pp. 557-563.
National Instruments 1998. Strain Gauge Measurement - A Tutorial, Application note 078. National Instruments Corporation. 12 p.
Nye, J.P. 1957. Physical Properties of Crystals. London, United Kingdom: Oxford University Press. 322 p.
Pennala, E. 1999. Lujuusopin perusteet (in Finnish). 9th revised edition. Otaniemi, Espoo, Finland: Otatieto Oy. 400 p.
Poirier, J-P. 2000. Introduction to the physics of the Earth's interior. Cambridge, United Kingdom: Cambridge University Press. 312 p.
Posiva Oy 2000. Disposal of spent fuel in Olkiluoto bedrock. Programme for research, development and technical design for the pre-construction phase. Helsinki, Finland: Posiva Oy. 147 p. POSIV A 2000-14.
Raiko, H. 1996. Kaytetyn polttoaineen loppusijoituksen lampotekninen optimo1nt1 (Thermal optimization of the final disposal of spent nuclear fuel) (in Finnish with English abstract). Helsinki, Finland: Posiva Oy. 54 p. POSIV A 96-03.
Raiko, H. & Salo, J-P. 1999. Design report of the disposal canister for twelve fuel assemblies. Helsinki, Finland: Posiva Oy. 64 p. POSIV A 99-18.
Read, R.S., Martino, J.B., Dzik, E.J., Oliver, S., Falls, S. & Young, R.P. 1997. Analysis and Interpretation of AECL's Heated Failure Tests. Whiteshell Laboratories Toronto, Ontario, Canada: Atomic Energy of Canada Ltd. 167 p. AECL Report No: 06819-RP-01200-0070 ROO.
Riekkola, R., Saanio, T., Autio, J., Raiko, H. & Kukkola, T. 1999. Kaytetyn ydinpolttoaineen loppusijoitustilojen kuvaus (in Finnish). Helsinki, Finland: Posiva Oy. Working Report 99-46.
62
Schmitt, D.R. & Hunt, R.W. 1999. Time-Lapse Speckle Interferometry. Geophys. Res. Lett. , Vol. 26, No. 16, pp. 2589-2592.
Schon, J.H. 1996. Physical properties of rocks: fundamentals and principles of petrophysics. Handbook of geophysical exploration, Seismic exploration: volume 18. Oxford, United Kingdom: Pergamon. 583 p.
Siegesmund, S. , Ullemeyer, K. , Weiss, T. & Tschegg, E.K. 2000. Physical weathering of marbles caused by anisotropic thermal expansion. Int J Earth Sci, Vol. 89, No. 1, pp. 170-182.
Skinner, B.J. 1966. Thermal Expansion. In: Clark, JR. S.P. (ed.), Handbook of Physical Constants. Revised Edition. The Geological Society of America, Inc. , Memoir 97. pp. 75-96.
Somerton, W.H. 1992. Thermal properties and temperature-related behavior of rock/fluid systems. Developments in petroleum science, 37. Amsterdam, Netherlands: Elsevier Science publishers B.V. 257 p.
Touloukian, Y.S ., Judd, W.R. & Roy, R.F. 1981. Physical Properties of Rocks and Minerals. USA: Purdue Research Foundation. 548 p. (McGraw-Hill/ CINDAS Data Series on Material Properties; v. II-2).
Vocadlo, L., Knight, K.S ., Price, G.D. & Wood, I.G. 2002. Thermal expansion and crystal structure of FeSi between 4 and 1173 K determined by time-of-flight neutron powder diffraction. Phys Chem Minerals, Vol. 29, No. 2, pp. 132-139.
Walsh, J. B. 1973. Theoretical Bounds for Thermal Expansion, Specific Heat, and Strain Energy Due to Internal Stress. Journal of Geophysical Research, Vol. 78, No. 32, pp. 7637-7646.
Wong, T-F. & Brace, W.F. 1979. Thermal expansion of rocks: some measurements at high pressure. Tectonophysics , 57, Nos. 2-4, pp. 95-117.
Xu, H. , Heaney, P.K. & Navrostky, A. 2001. Thermal expansion and structural transformations of stuffed derivatives of quartz along the LiAlSi04-Si02 join: a variable-temperature powder synchrotron XRD study. Phys Chem Minerals, Vol. 28, No. 5, pp. 302-312.
Yates, B. 1972. Thermal Expansion. New York, USA: Plenum Press. 121 p.
Zhang, J., 2000. Effect of pressure on thermal expansion of MgO up to 8.2 GPa. Phys Chem Minerals, Vol. 27, No. 3, pp. 145-148.