Embed Size (px)
Citation preview

PNNL-17491
Thermal Flammable Gas Production from Bulk Vitrification Feed R. D. Scheele B. M. McNamara L. M. Bagaasen May 2008 Prepared for the U.S. Department of Energy under Contract DE-AC05-76RL01830
DISCLAIMER This report was prepared as an account of work sponsored by an agency of the United States Government. Neither the United States Government nor any agency thereof, nor Battelle Memorial Institute, nor any of their employees, makes any warranty, express or implied, or assumes any legal liability or responsibility for the accuracy, completeness, or usefulness of any information, apparatus, product, or process disclosed, or represents that its use would not infringe privately owned rights. Reference herein to any specific commercial product, process, or service by trade name, trademark, manufacturer, or otherwise does not necessarily constitute or imply its endorsement, recommendation, or favoring by the United States Government or any agency thereof, or Battelle Memorial Institute. The views and opinions of authors expressed herein do not necessarily state or reflect those of the United States Government or any agency thereof. PACIFIC NORTHWEST NATIONAL LABORATORY operated by BATTELLE for the UNITED STATES DEPARTMENT OF ENERGY under Contract DE-ACO5-76RL01830
Printed in the United States of America
Available to DOE and DOE contractors from the Office of Scientific and Technical Information,
P.O. Box 62, Oak Ridge, TN 37831-0062; ph: (865) 576-8401 fax: (865) 576 5728
email: [email protected]
Available to the public from the National Technical Information Service, U.S. Department of Commerce, 5285 Port Royal Rd., Springfield, VA 22161
ph: (800) 553-6847 fax: (703) 605-6900
email: [email protected] online ordering: http://www.ntis.gov/ordering.htm

PNNL-17491
Thermal Flammable Gas Production from Bulk Vitrification Feed R. D. Scheele B. M. McNamara L. M. Bagaasen May 2008 Prepared for the U.S. Department of Energy under Contract DE-AC05-76RL01830 Pacific Northwest National Laboratory Richland, Washington 99352

iii
Summary
The baseline bulk-vitrification (BV) process (also known as in-container vitrification ICV™) includes a mixer/dryer to convert liquid low-activity waste (LAW) into a dried, blended feed for vitrification. Feed preparation includes blending LAW with glass-forming minerals (GFMs) and cellulose and drying the mixture to a suitable dryness, consistency, and particle size for transport to the ICVTM container. The cellulose is to be added to the BV feed at a rate sufficient to destroy 75% of the nitrogen present as nitrate or nitrite based on Smith et al.’s (1999) postulated cellulose/nitrate reaction stoichiometry (C:N ratio = 1.0) provided in Equation S-1.
C6H10O5 + 6 NaNO3 → 3 Na2CO3 + 3 CO2 + 5 H2O + 2 N2 + N2O + O2 (S-1)
Concern exists that flammable gases may be produced during drying operations at levels that could pose a risk. The drying process is conducted under vacuum in the temperature range of 60 to 80°C. These flammable gases could be produced either through thermal decomposition of cellulose or waste organics or as a by-product of the reaction of cellulose and/or waste organics with nitrate or the postulated small amount of nitrite present in the waste.
To help address the concern about flammable gas production during drying, Pacific Northwest National Laboratory (PNNL) performed studies to identify the gases produced at dryer temperatures and at possible process upset conditions. These studies combined simultaneous thermogravimetric and differential thermal analysis (TG/DTA) with Fourier transform infrared spectroscopy (TG/DTA/FTIR) of gases evolved up to 525°C and isothermal studies up to 120°C with mass spectrometry (MS) analysis of evolved gases to determine flammable gas production from the cellulose and organic constituents in simulated BV feed.
In the TG/DTA/FTIR studies, we investigated the effects of water and the amount of stoichiometric cellulose added on the evolved gases from simulated S-109 BV feed containing both cellulose and acetate (chosen as the representative waste organic). Water was tested at 4 and 12 wt%. Cellulose was tested at 75 and 100% of the Smith et al. postulated stoichiometry (C:N ratios of 0.75:1 and 1.0:1.0, respectively).
In the TG/DTA/FTIR studies, we found that added water (free water) evolved by 120°C well before any TG/DTA/FTIR-detected reactions between cellulose and nitrate and/or nitrite began. The BV feed did not produce any flammable hydrocarbon gases such as methane or ethane at concentrations sufficient to be observed by FTIR. FTIR cannot see hydrogen or other symmetrical molecules such as nitrogen or oxygen. Based on the FTIR evolved gas analyses, the reaction between nitrate and/or nitrite with cellulose qualitatively produces CO2, N2O, NO, and NO2. Water was not observed, although it was expected based on Equation S-1. The presence of NO and NO2 in trace quantities indicates that secondary reactions are occurring; the FTIR analyses were not quantitative.
In the isothermal studies, we investigated the effects of temperature, initial water content, cellulose presence, and waste organics as acetate presence. We tested simulated S-109 BV feed with cellulose and without acetate at room temperature (22°C), 80 and 120°C; and with acetate and without cellulose at 80°C. When present, the cellulose was added at a C:N ratio of 0.75:1.0.
In the isothermal room-temperature test, the BV feed produced CO2 at a rate of 0.02 µmol/g/d and H2 at a rate of 0.001 µmol/g/d. The MS did not observe any other gases at detectable levels.

iv
In the 80°C isothermal test with cellulose and without acetate, the BV feed produced CO2 at a rate of 0.31 and 0.0072 µmol/g/d and H2 at a rate of 0.005 and 0.002 µmol/g/d after 1 and 5 days, respectively. N2O and NOx were produced at a rate of 0.175 and 0.004 µmol/g/d over the course of 5 days; the MS detected neither of these gases after 1 day. The MS did not observe any other gases at detectable levels.
In the 80°C isothermal test with acetate and without cellulose, this BV feed produced CO2 at a rate of 0.06 and 0.05 µmol/g/d and H2 at a rate of 0.004 and 0.001 µmol/g/d after 1 and 6 days, respectively. CH4 was produced at a rate of 0.001 µmol/g/d over 6 days but was observed only in the sample taken after 6 days. N2O and NOx were produced at nominal rates of 0.06 and 0.1 µmol/g/d over the course of 6 days.
The gas production increased significantly for the 120°C isothermal test with cellulose and without acetate. This BV feed produced CO2 at a rates of 0.2 and 0.1 µmol/g/d, CO at 0.1 and 0.03 µmol/g/d, CH4 at an average of 0.01 µmol/g/d, higher alkanes at an average of 0.02 µmol/g/d, N2O at 1.6 and 1 µmol/g/d, and NOx at 0.03 and 0.23 µmol/g/d after 1 and 5 days, respectively. The MS observed H2 only in the day 1 sample, and it was produced at a rate of 0.002 µmol/g/d. This experiment indicates that in addition to the Smith et al. postulated reaction between cellulose and nitrate and/or nitrite, other reactions are occurring that produce the flammable gases CO, CH4, and higher alkanes with H2 produced only initially.
The coarse pressure measurements support the total gas-generation rates from the MS measurements with some indications that additional gas not observed by MS was generated in the 80°C tests. For the 120°C experiments, the pressure-based measure of gas production nominally agrees with that of the MS-measured gas production whereas for the 80°C experiments, the gas-production ratios based on pressure and MS analysis range from 3, which represents a reasonably good agreement, to 20, which may indicate that additional gases might be present in these samples that are not detectable by our mass spectrometer. However, there are enough uncertainties in these coarse pressure measurements that additional experiments are recommended to confirm these higher gas-generation rates at lower temperatures.
From these TG/DTA/FTIR and isothermal BV feed studies, we conclude that
• CO2, N2O, NO, and NO2 are produced from cellulose denitration of BV feed consistent with the Smith et al. postulated reaction but with some additional secondary reactions
• acetate appears to be more reactive in the early stages of reaction than cellulose while increased reactivity occurs for cellulose with longer times
• the C:N cellulose-to-nitrate ratio has little effect on the nature of the cellulose reaction with nitrate or nitrite
• increasing temperatures change the predominant flammable gas produced from H2 to CO and alkanes
• initial water content does not affect the major cellulose denitration reaction that is TG-observable near 300°C.
In summary, these flammable gas production studies found that flammable gases are produced from cellulose-containing BV feeds at rates ranging from 0.001 µmol total/g/d at room temperature to 0.1 µmol total/g/d at 120°C. At temperatures greater than 80°C, the flammables are produced in the company of oxides of nitrogen.

v
Acronyms
ARC accelerating rate calorimeter
BV bulk vitrification
DTA differential thermal analysis
DTG differential thermal gravimetric analysis
EGA evolved gas analysis
FTIR Fourier transform infrared spectroscopy
GFM glass-forming mineral
ICV™ in-container vitrification
IR infrared
LAW low-activity waste
MS mass spectrometry
PNNL Pacific Northwest National Laboratory
TG thermogravimetric
TGA thermogravimetric analyzer
UHP ultra-high purity


vii
Contents
Summary ......................................................................................................................................................... iii
Acronyms......................................................................................................................................................... v
1.0 Introduction......................................................................................................................................... 1.1
2.0 Experimental ....................................................................................................................................... 2.1
2.1 Experimental Strategy and Design ............................................................................................ 2.1
2.2 Simulated Bulk Vitrification Feed Used for Testing ................................................................ 2.2
2.3 Thermogravimetric Analysis/Differential Thermal Analysis/Fourier Transform Infrared Spectroscopy Testing ................................................................................................................. 2.3
2.4 Isothermal Testing...................................................................................................................... 2.4
3.0 Results and Discussion ....................................................................................................................... 3.1
3.1 Cellulose Decomposition........................................................................................................... 3.1 3.1.1 Literature Review on Cellulose Decomposition ........................................................... 3.1 3.1.2 Thermal Decomposition of Cellulose Studies............................................................... 3.2
3.2 Gas Production from Bulk Vitrification Feeds ......................................................................... 3.3 3.2.1 Literature Review on Flammable Gas Production by Organic/Nitrate and/or
Nitrite Mixtures.............................................................................................................. 3.4 3.2.2 BV Feed TG/DTA/FTIR Results................................................................................... 3.5 3.2.3 BV Feed Isothermal Gas-Production Studies.............................................................. 3.12
4.0 Conclusions......................................................................................................................................... 4.1
5.0 References........................................................................................................................................... 5.1

viii
Figures
2.1. Schematic of Columbia Scientific (Austin, TX) ARC....................................................................... 2.4
2.2. Picture of Columbia Scientific ARC ................................................................................................. 2.4
3.1. Thermal Behavior of Cellulose as Measured by TG/DTA at 5°C/min in Argon .............................. 3.3
3.2. Arrhenius Plot of Thermal Behavior of 2.4 g Cellulose as Measured by ARC Using a Titanium Sample Container ................................................................................................................................ 3.4
3.3. Thermal Behavior of 4 mass% Water; 100% Stoichiometric Cellulose BV Feed Without Waste Organics as Measured by TG/DTA at 20°C/min in Argon................................................................ 3.6
3.4. IR Spectrum of Thermally Evolved Gases from 4% H2O; 100% Stoichiometric Cellulose BV Feed Without Waste Organics at 35 Minutes..................................................................................... 3.7
3.5. IR-Observed Thermally Released Gases from 4 wt% H2O 100% Stoichiometric Cellulose (C:N =1.0) BV Feed Without Waste Organics................................................................................... 3.8
3.6. Thermal Behavior of 12 mass% Water, 100% Stoichiometric Cellulose BV Feed Without Waste Organics as Measured by TG/DTA at 20°C/min in Argon..................................................... 3.9
3.7. IR-Measured Gases Evolved During 20°C/min TG/DTA Test of 12 wt% Water, 100% Stoichiometric Cellulose BV Feed in an Argon Purge ...................................................................... 3.9
3.8. Thermal Behavior of 4 mass% Water, 75% Stoichiometric Cellulose BV Feed as Measured by TG/DTA at 5°C/min in Argon ..................................................................................................... 3.10
3.9. Thermal Behavior of 4 mass% Water, 100% Stoichiometric Cellulose BV Feed as Measured by TG/DTA at 5°C/min in Argon ..................................................................................................... 3.10
3.10. Thermal Behavior of 12 mass% Water, 75% Stoichiometric Cellulose BV Feed as Measured by TG/DTA at 5°C/min in Argon ..................................................................................................... 3.11
3.11. Thermal Behavior of 12 mass% Water, 100% Stoichiometric Cellulose BV Feed as Measured by TG/DTA at 5°C/min in Argon ..................................................................................................... 3.11
3.12. Observed Gases from Room Temperature (22°C) BV Feed Without Waste Organics .................. 3.13
3.13. Observed Gases Evolved from Simulated BV Feed Without Waste Organics at 80°C.................. 3.14
3.14. Observed Gases Evolved from Simulated BV Feed Without Waste Organics at 120°C................ 3.16
3.15. Observed Gases Evolved from Simulated BV Feed with Waste Organics and Without Cellulose at 80°C............................................................................................................................... 3.17

ix
3.16. Pressure During 1-Day 120°C Isothermal BV Feed with Cellulose and Without Waste Organics............................................................................................................................................. 3.19
3.17. Pressure During 5-day 120°C Isothermal BV Feed with Cellulose and Without Waste Organics............................................................................................................................................. 3.19
3.18. Pressure During 1-Day Isothermal 80°C BV Feed with Cellulose and Without Waste Organics (during the test, the temperature increased from 78°C to 85°C)...................................... 3.20
3.19. Pressure During 5-Day 80°C Isothermal Exposure of BV Feed with Cellulose and Without Waste Organics.................................................................................................................................. 3.21
3.20. Pressure During 1-day 80°C Isothermal Exposure of BV Feed Without Cellulose and with Waste Organics.................................................................................................................................. 3.22
3.21. Pressure During 5 Additional Days of 80°C Isothermal Exposure of BV Feed Without Cellulose and with Waste Organics .................................................................................................. 3.22
3.22. Hydrogen Generation from BV Feed with Cellulose and Without Waste Organics and with Waste Organics and Without Cellulose ............................................................................................ 3.24
3.23. Carbon Dioxide Generation from BV Feed with Cellulose and Without Waste Organics and with Waste Organics and Without Cellulose.................................................................................... 3.25
3.24. Carbon Monoxide Generation from BV Feed with Cellulose and Without Waste Organics and with Waste Organics and Without Cellulose............................................................................. 3.25
3.25. Methane Generation from BV Feed with Cellulose and Without Waste Organics and with Waste Organics and Without Cellulose ............................................................................................ 3.26
3.26. Nitrous Oxide Generation Rate from BV Feed with Cellulose and Without Waste Organics and with Waste Organics and Without Cellulose............................................................................. 3.27
3.27. Oxides of Nitrogen (excluding N2O) Generation Rate from BV Feed with Cellulose and Without Waste Organics and with Waste Organics and Without Cellulose ................................... 3.28

x
Tables
2.1. Test Matrix for TG/DTA/FTIR Studies of S-109 Simulated BV Feed ............................................. 2.1
2.2. Isothermal Studies Test Matrix ........................................................................................................... 2.1
2.3. Dry-Basis Composition of Simulated LAW BV Feed with Cellulose (0.75 C/N) and Without Waste Organics (new S-109 formulation) .......................................................................................... 2.2
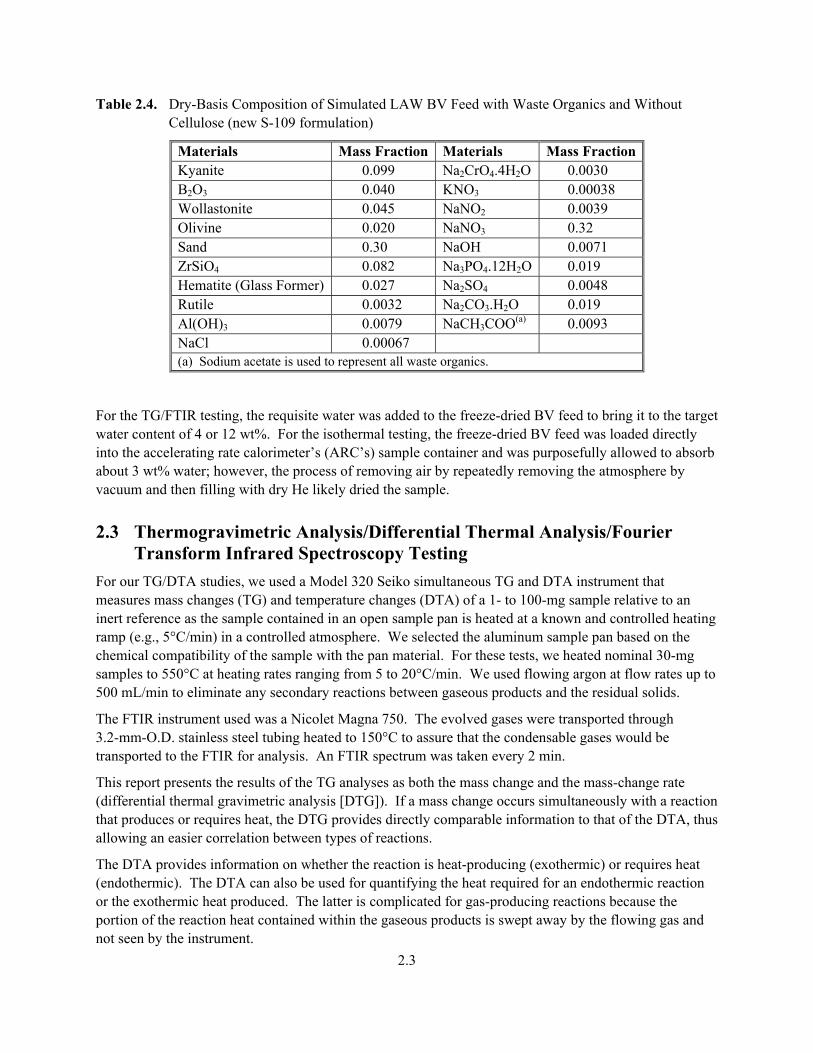
2.4. Dry-Basis Composition of Simulated LAW BV Feed with Waste Organics and Without Cellulose (new S-109 formulation)..................................................................................................... 2.3
2.5. MS-Measured Compositions UHP He Used for Isothermal Tests .................................................... 2.5
2.6. MS-Measured Composition of Air ..................................................................................................... 2.6
3.1. Gas Production by Room Temperature BV Feed Without Waste Organics ................................... 3.13
3.2. Gas Production by 80°C BV Feed Without Waste Organics........................................................... 3.14
3.3. Production by 120°C BV Feed with Cellulose and Without Waste Organics................................. 3.15
3.4. Gas Production by 80°C BV Feed with Waste Organics and Without Cellulose ........................... 3.16
3.5. Comparison of Gas Production from BV Feed with and Without Cellulose or Waste Organics Based on Pressure Increase and Based on MS Analysis .................................................................. 3.18

1.1
1.0 Introduction
The baseline bulk-vitrification (BV) process (also known as in-container vitrification ICV™) includes a mixer/dryer to convert liquid low-activity waste (LAW) into a dried, blended feed for vitrification. Feed preparation includes blending LAW with glass-forming minerals (GFMs) and cellulose and drying the mixture to a suitable dryness, consistency, and particle size for transport to the ICVTM container. The cellulose is to be added to the BV feed at a rate sufficient to destroy 75% of the nitrogen present as nitrate or nitrite.
Concern exists that flammable gases may be produced during drying operations at levels that could pose a risk. The drying process is conducted under vacuum in the temperature range of 60 to 80°C. These flammable gases could be produced either through thermal decomposition of cellulose or waste organics or as a by-product of the reaction of cellulose and/or waste organics with nitrate or the postulated small amount of nitrite present in the waste.
To help address the concern about flammable-gas production during drying, Pacific Northwest National Laboratory (PNNL) performed studies to identify the gases produced at dryer temperatures and at possible process-upset conditions. Studies used a thermogravimetric analyzer (TGA) up to 525°C and isothermal testing up to 120°C to determine flammable gas production resulting from the cellulose and organic constituents in BV feed. This report provides the results of those studies to determine the effects of cellulose and waste organics on flammable gas evolution.

2.1
2.0 Experimental
To determine flammable gas production by BV feed at dryer temperatures, we used 1) simultaneous thermogravimetric (TG) and differential thermal analysis (DTA) up to 550°C with evolved gas analysis (EGA) by Fourier transform infrared spectroscopy (FTIR) and 2) 5-day long isothermal tests with gas analysis by mass spectrometry (MS) to quantitatively measure the evolved gases after 1 day and 5 days. This section provides the experimental design, the composition of the BV Feeds tested, and the equipment used for testing and characterization.
2.1 Experimental Strategy and Design To determine flammable gas production from BV Feed during potential vacuum-drying upset conditions, we characterized gases evolved 1) during a series of screening TG/DTA tests up to 550°C using FTIR (TG/DTA/FTIR studies) and 2) during a series of isothermal tests at temperatures ranging from 22 to 120°C using MS (isothermal studies).
For this study, we used a simulated feed consisting of a mixture of simulated S-109 LAW with and without waste organics, GFMs, and with and without cellulose. The TG/DTA/FTIR studies tested both 75% and 100% (C:N ratios of 0.75:1 and 1.0:1, respectively) of Smith et al.’s (1999) postulated stoichiometric cellulose (see Equation 2.1); the simulated feed also contained acetate as the representative waste organic. Table 2.1 provides the test matrix for the TG/DTA/FTIR studies and Table 2.2 provides the test matrix for the isothermal studies. The composition of the simulated BV feeds tested is provided in Section 2.2.
C6H10O5 + 6 NaNO3 → 3 Na2CO3 + 3 CO2 + 5 H2O + 2 N2 + N2O + O2 (2.1)
Table 2.1. Test Matrix for TG/DTA/FTIR Studies of S-109 Simulated BV Feed (with cellulose and with waste organics)
Water Content, wt% Carbon: Nitrate (C:N) Ratio4 0.75:1 4 1.0:1
12 0.75:1 12 1.0:1
Table 2.2. Isothermal Studies Test Matrix
Simulated BV Feed (C:N = 0.75:1) Temperature, °C S-109 Simulant with glass formers, with cellulose, and without waste organics 22
(Room Temperature)S-109 Simulant with glass formers, with cellulose, and without waste organics 80 S-109 Simulant with glass formers, with cellulose, and without waste organics 120 S-109 Simulant with glass formers, without cellulose, and with waste organics 80

2.2
In the TG/DTA/FTIR studies, we investigated the effects of water content and C:N ratios on production of infrared (IR)-active flammable gases. IR-active gases include alkanes such as methane and ethane, CO, CO2, water, and the nitrogen oxides N2O, NO, and NO2, which are commonly identified as NOx. Unfortunately, IR is not sensitive to H2 and N2, the latter being the postulated major nitrogen-containing product (Smith et al. 1999). Studies were performed up to 550°C at heating rates ranging from 5 to 20°C/min in an argon purge even though the dryer operating temperature is nominally 60 to 80°C with the potential to reach 120°C, the maximum temperature of the steam heating jacket. In this testing, we investigated 4 and 12 wt% water content and C:N molar ratios of 0.75: and 1.0:1, the latter being Smith et al.’s postulated stoichiometry (1999).
The target strategy for the isothermal testing was to sample the gas on days 1 and 5. Unfortunately in a couple of experiments the system developed a leak after the 1-day sample and a fresh sample was started and sampled on day 5. In another instance rather than taking the second sample after 4 more days, it was taken after an additional 5 days.
The 5- and 6-day isothermal testing determined the effects of temperature and the presence of waste organics on flammable gas production. The simulated BV feed in the room temperature (nominally 22°C), 80°C, and 120°C experiments described in Table 2.2 used 75% stoichiometric cellulose. We sampled the evolved gas at days 1 and 5 or 6 and analyzed it using gas MS. The MS used can not quantitatively measure water but can measure H2, O2, N2, the NOx’s (N2O, NO, NO2), CO2, CO, methane (CH4), and higher alkanes, such as CxHy. The gas atmosphere was ultra-high-purity helium (He), which provided a tool for eliminating air’s contribution to the measured gas composition.
2.2 Simulated Bulk Vitrification Feed Used for Testing We prepared our simulated BV feeds by freeze drying a mixture of simulated S-109 waste with or without waste organics, with glass formers, and with cellulose (as needed) provided in Table 2.3 and Table 2.4. We added cellulose at a rate of 0.75 or 1.0 mole C/mole N (nitrate or nitrite). After freeze drying, the prepared simulated BV feed was stored in a 5°C refrigerator until ready for use.
Table 2.3. Dry-Basis Composition of Simulated LAW BV Feed with Cellulose (0.75 C/N) and Without Waste Organics (new S-109 formulation)
Materials Mass Fraction Materials Mass Fraction Kyanite 0.092 Na2CrO4.4H2O 0.0028 B2O3 0.037 KNO3 0.00036 Wollastonite 0.042 NaNO2 0.0036 Olivine 0.019 NaNO3 0.30 Sand 0.278 NaOH 0.0067 ZrSiO4 0.076 Na3PO4.12H2O 0.018 Hematite (Glass Former) 0.027 Na2SO4 0.0044 Rutile 0.003 Na2CO3.H2O 0.018 Al(OH)3 0.00073 NaCH3COO(a) 0 NaCl 0.00062 Cellulose 0.072(b) (a) Sodium acetate is used to represent all waste organics. (b) C:N = 0.75:1.0
2.3
Table 2.4. Dry-Basis Composition of Simulated LAW BV Feed with Waste Organics and Without Cellulose (new S-109 formulation)
Materials Mass Fraction Materials Mass Fraction Kyanite 0.099 Na2CrO4.4H2O 0.0030 B2O3 0.040 KNO3 0.00038 Wollastonite 0.045 NaNO2 0.0039 Olivine 0.020 NaNO3 0.32 Sand 0.30 NaOH 0.0071 ZrSiO4 0.082 Na3PO4.12H2O 0.019 Hematite (Glass Former) 0.027 Na2SO4 0.0048 Rutile 0.0032 Na2CO3.H2O 0.019 Al(OH)3 0.0079 NaCH3COO(a) 0.0093 NaCl 0.00067 (a) Sodium acetate is used to represent all waste organics.
For the TG/FTIR testing, the requisite water was added to the freeze-dried BV feed to bring it to the target water content of 4 or 12 wt%. For the isothermal testing, the freeze-dried BV feed was loaded directly into the accelerating rate calorimeter’s (ARC’s) sample container and was purposefully allowed to absorb about 3 wt% water; however, the process of removing air by repeatedly removing the atmosphere by vacuum and then filling with dry He likely dried the sample.
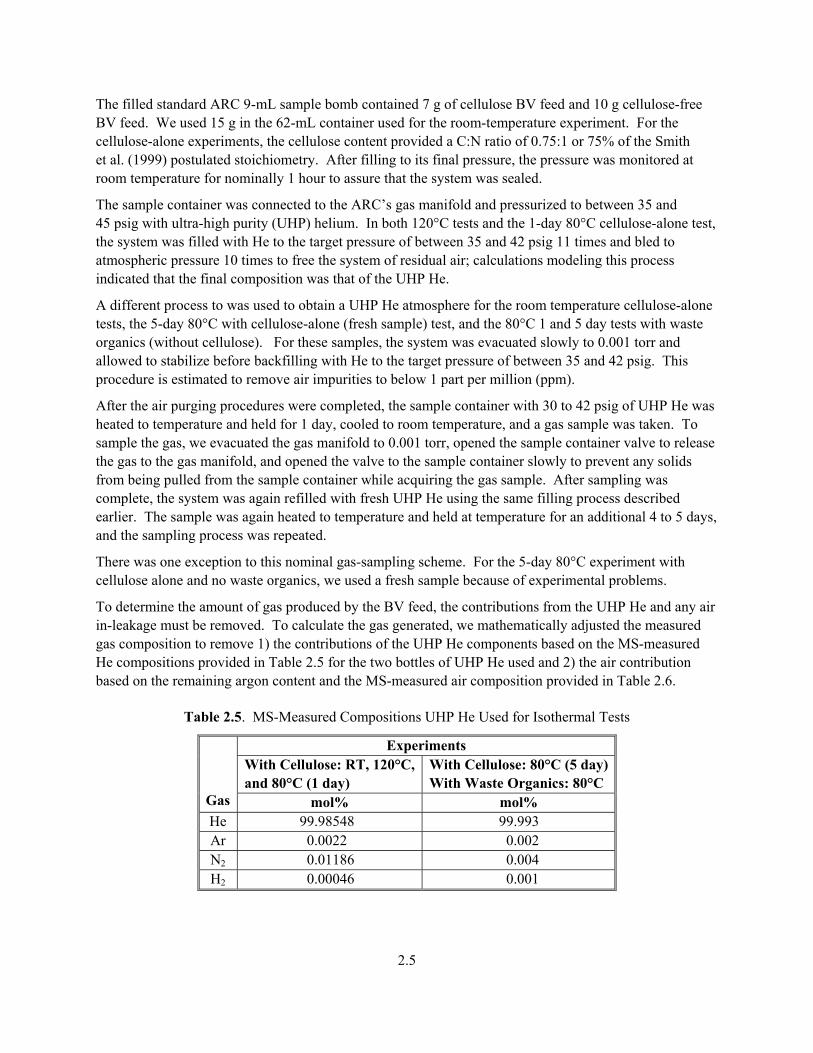
2.3 Thermogravimetric Analysis/Differential Thermal Analysis/Fourier Transform Infrared Spectroscopy Testing
For our TG/DTA studies, we used a Model 320 Seiko simultaneous TG and DTA instrument that measures mass changes (TG) and temperature changes (DTA) of a 1- to 100-mg sample relative to an inert reference as the sample contained in an open sample pan is heated at a known and controlled heating ramp (e.g., 5°C/min) in a controlled atmosphere. We selected the aluminum sample pan based on the chemical compatibility of the sample with the pan material. For these tests, we heated nominal 30-mg samples to 550°C at heating rates ranging from 5 to 20°C/min. We used flowing argon at flow rates up to 500 mL/min to eliminate any secondary reactions between gaseous products and the residual solids.
The FTIR instrument used was a Nicolet Magna 750. The evolved gases were transported through 3.2-mm-O.D. stainless steel tubing heated to 150°C to assure that the condensable gases would be transported to the FTIR for analysis. An FTIR spectrum was taken every 2 min.
This report presents the results of the TG analyses as both the mass change and the mass-change rate (differential thermal gravimetric analysis [DTG]). If a mass change occurs simultaneously with a reaction that produces or requires heat, the DTG provides directly comparable information to that of the DTA, thus allowing an easier correlation between types of reactions.
The DTA provides information on whether the reaction is heat-producing (exothermic) or requires heat (endothermic). The DTA can also be used for quantifying the heat required for an endothermic reaction or the exothermic heat produced. The latter is complicated for gas-producing reactions because the portion of the reaction heat contained within the gaseous products is swept away by the flowing gas and not seen by the instrument.

2.4
The instrument was routinely calibrated to assure the accuracy of the temperature, the enthalpy, and the mass measurements. The temperature and heat-measurement response of the DTA was calibrated with the melting-point and enthalpy standards for indium, lead, and tin metals. The accuracy and precision of the analytical balance in the instrument was checked with standard weights. These procedures were performed before and after a batch set of thermal analyses was completed.
2.4 Isothermal Testing For the isothermal testing, we used the ARC, used in our earlier thermal sensitivity studies (Scheele et al. 2008), in its isothermal mode. The ARC is an adiabatic calorimeter originally developed by Dow Chemical to determine safe process operating temperatures for tested materials. The ARC is a gas-tight system that can operate isothermally up to 450°C while monitoring temperature and pressure.
As shown schematically in Figure 2.1 and pictured in Figure 2.2, the ARC is simply a sample container (bomb) surrounded by a calorimeter (Figure 2.2 items 1 and 5) having multiple zone heating elements. The heating is controlled by type N thermocouples distributed to assure uniform temperature throughout the calorimetric chamber. The oven’s temperature is maintained at the same temperature as the sample and bomb to provide an adiabatic (no heat loss from the sample) environment for the sample. The combined sample and bomb temperature is measured at the 9-mL bomb’s equator (3) or at the bottom with a type N thermocouple; we mounted the thermocouple on the bottom. In the room-temperature experiment, we attached a 62-mL sample container to the ARC manifold. The ARC uses a pressure transducer (2) to measure pressure. The volume above the bomb to the pressure transducer is about 5 mL. Gas was obtained through a gas manifold using a nominal 25-mL stainless steel gas-tight gas-sampling container.
Figure 2.1. Schematic of Columbia Scientific
(Austin, TX) ARC
Figure 2.2. Picture of Columbia
Scientific ARC
2.5
The filled standard ARC 9-mL sample bomb contained 7 g of cellulose BV feed and 10 g cellulose-free BV feed. We used 15 g in the 62-mL container used for the room-temperature experiment. For the cellulose-alone experiments, the cellulose content provided a C:N ratio of 0.75:1 or 75% of the Smith et al. (1999) postulated stoichiometry. After filling to its final pressure, the pressure was monitored at room temperature for nominally 1 hour to assure that the system was sealed.
The sample container was connected to the ARC’s gas manifold and pressurized to between 35 and 45 psig with ultra-high purity (UHP) helium. In both 120°C tests and the 1-day 80°C cellulose-alone test, the system was filled with He to the target pressure of between 35 and 42 psig 11 times and bled to atmospheric pressure 10 times to free the system of residual air; calculations modeling this process indicated that the final composition was that of the UHP He.
A different process to was used to obtain a UHP He atmosphere for the room temperature cellulose-alone tests, the 5-day 80°C with cellulose-alone (fresh sample) test, and the 80°C 1 and 5 day tests with waste organics (without cellulose). For these samples, the system was evacuated slowly to 0.001 torr and allowed to stabilize before backfilling with He to the target pressure of between 35 and 42 psig. This procedure is estimated to remove air impurities to below 1 part per million (ppm).
After the air purging procedures were completed, the sample container with 30 to 42 psig of UHP He was heated to temperature and held for 1 day, cooled to room temperature, and a gas sample was taken. To sample the gas, we evacuated the gas manifold to 0.001 torr, opened the sample container valve to release the gas to the gas manifold, and opened the valve to the sample container slowly to prevent any solids from being pulled from the sample container while acquiring the gas sample. After sampling was complete, the system was again refilled with fresh UHP He using the same filling process described earlier. The sample was again heated to temperature and held at temperature for an additional 4 to 5 days, and the sampling process was repeated.
There was one exception to this nominal gas-sampling scheme. For the 5-day 80°C experiment with cellulose alone and no waste organics, we used a fresh sample because of experimental problems.
To determine the amount of gas produced by the BV feed, the contributions from the UHP He and any air in-leakage must be removed. To calculate the gas generated, we mathematically adjusted the measured gas composition to remove 1) the contributions of the UHP He components based on the MS-measured He compositions provided in Table 2.5 for the two bottles of UHP He used and 2) the air contribution based on the remaining argon content and the MS-measured air composition provided in Table 2.6.
Table 2.5. MS-Measured Compositions UHP He Used for Isothermal Tests
Experiments With Cellulose: RT, 120°C, and 80°C (1 day)
With Cellulose: 80°C (5 day) With Waste Organics: 80°C
Gas mol% mol% He 99.98548 99.993 Ar 0.0022 0.002 N2 0.01186 0.004 H2 0.00046 0.001

2.6
Table 2.6. MS-Measured Composition of Air
Air mol% Ar 0.934 CO2 0.033 N2 78.084 O2 20.946

3.1
3.0 Results and Discussion
Flammable gases can be produced from BV feeds by thermal decomposition of cellulose or waste organics or by reactions of cellulose or waste organics with nitrate and/or nitrite or other feed constituents. We reviewed the literature and performed TG/DTA, TG/DTA coupled with FTIR gas analysis, ARC, and isothermal studies in the ARC coupled with MS analysis of the evolved gases to investigate the production of flammable gases from BV feeds. Simulated feeds with cellulose and without waste organics were studied along with feeds with waste organics and without cellulose. This section provides the results of the literature review on cellulose thermal decomposition and gas production by nitrate/organic mixtures and our experimental studies.
3.1 Cellulose Decomposition Thermal decomposition of cellulose is one of the potential mechanisms for producing flammable gases from BV feed during drying operations. To investigate cellulose thermal decomposition, we reviewed cellulose pyrolysis literature and used TG/DTA and ARC to study the thermal decomposition of cellulose. We did not do any studies to determine the product gases from thermal decomposition of cellulose in the absence of waste constituents.
3.1.1 Literature Review on Cellulose Decomposition
Because cellulose is a potential biological feedstock for fuels, many have studied the pyrolysis of cellulose and its thermally evolved gases but have done so at temperatures much higher than those expected in the dryer (max 120°C).
Shafizadeh and Fu (1973) report that pyrolysis of cellulose under vacuum or atmospheric pressure at 300°C produces a char, a tar fraction, and volatiles. The tars are a complex mixture consisting of Levoglucosan, 1,6-Anhydro-β-D-glucofuanose, ketones, and aldehydes. Later work by this University of Montana research group (Bradbury et al. 1979) describes the cellulose decomposition process that occurs between 260 and 340°C as a two-step process with the first producing an “activated” cellulose. The activated cellulose decomposes to produce the volatile tars and a gaseous fraction including water, carbon dioxide, and carbon monoxide.
Alves and Figueiredo (1989) in their studies using isothermal thermogravimetry between 300 and 350°C concluded that cellulose decomposes via a series/parallel set of reactions. The first reaction is the formation of an activated cellulose that can dehydrate to form anhydrocellulose or depolymerize to levoglucosan tar. The anhydrocellulose then decomposes to form char and volatiles. The levoglucosan tar decomposes to form volatiles. The former reaction occurs at lower temperatures around 220°C and the latter at temperatures above 280°C. No mention is made of volatile hydrocarbons or hydrogen formation at dryer temperatures.
Pouwels et al. (1989), in their summary of previous work, describe the thermal decomposition of cellulose at 300°C and above as the formation of activated cellulose, an “anhydro-cellulose,” produced by dehydration followed by the depolymerization yielding primarily levoglucosan. The former is important at lower temperatures and the latter at higher temperatures and high heating rates. In their own work Pouwels et al. (1989) used a 510°C Curie-point temperature wire to pyrolyze cellulose and gas
3.2
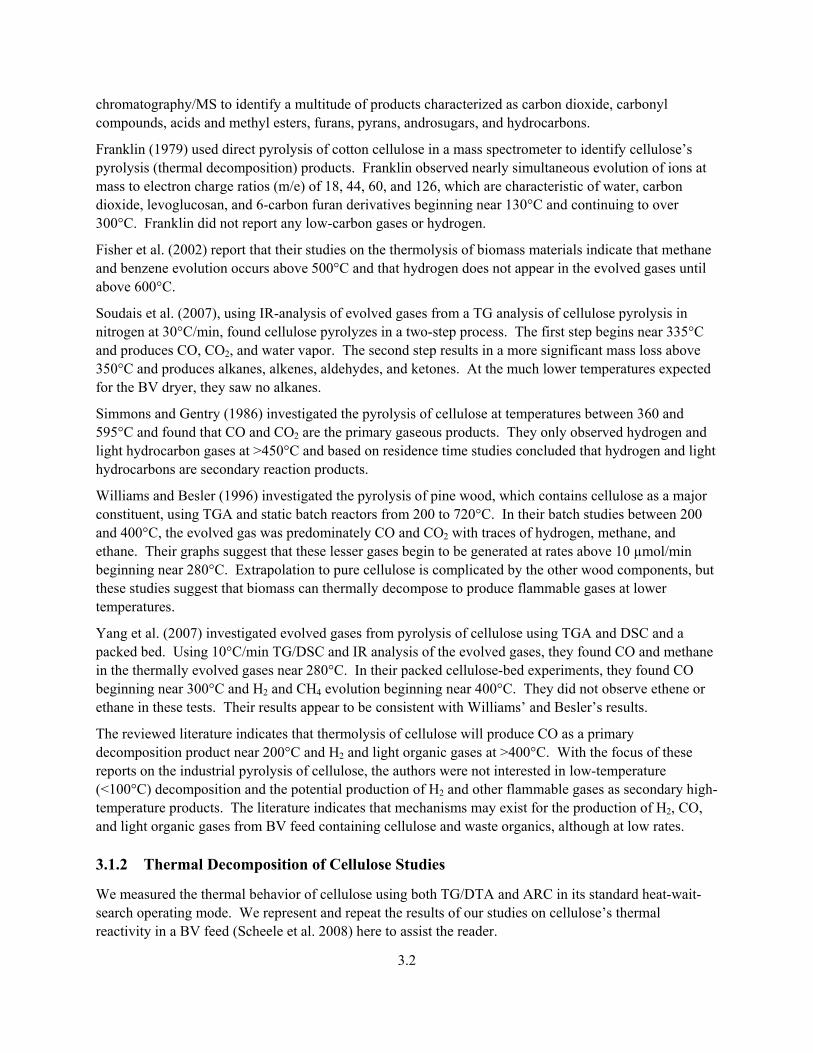
chromatography/MS to identify a multitude of products characterized as carbon dioxide, carbonyl compounds, acids and methyl esters, furans, pyrans, androsugars, and hydrocarbons.
Franklin (1979) used direct pyrolysis of cotton cellulose in a mass spectrometer to identify cellulose’s pyrolysis (thermal decomposition) products. Franklin observed nearly simultaneous evolution of ions at mass to electron charge ratios (m/e) of 18, 44, 60, and 126, which are characteristic of water, carbon dioxide, levoglucosan, and 6-carbon furan derivatives beginning near 130°C and continuing to over 300°C. Franklin did not report any low-carbon gases or hydrogen.
Fisher et al. (2002) report that their studies on the thermolysis of biomass materials indicate that methane and benzene evolution occurs above 500°C and that hydrogen does not appear in the evolved gases until above 600°C.
Soudais et al. (2007), using IR-analysis of evolved gases from a TG analysis of cellulose pyrolysis in nitrogen at 30°C/min, found cellulose pyrolyzes in a two-step process. The first step begins near 335°C and produces CO, CO2, and water vapor. The second step results in a more significant mass loss above 350°C and produces alkanes, alkenes, aldehydes, and ketones. At the much lower temperatures expected for the BV dryer, they saw no alkanes.
Simmons and Gentry (1986) investigated the pyrolysis of cellulose at temperatures between 360 and 595°C and found that CO and CO2 are the primary gaseous products. They only observed hydrogen and light hydrocarbon gases at >450°C and based on residence time studies concluded that hydrogen and light hydrocarbons are secondary reaction products.
Williams and Besler (1996) investigated the pyrolysis of pine wood, which contains cellulose as a major constituent, using TGA and static batch reactors from 200 to 720°C. In their batch studies between 200 and 400°C, the evolved gas was predominately CO and CO2 with traces of hydrogen, methane, and ethane. Their graphs suggest that these lesser gases begin to be generated at rates above 10 µmol/min beginning near 280°C. Extrapolation to pure cellulose is complicated by the other wood components, but these studies suggest that biomass can thermally decompose to produce flammable gases at lower temperatures.
Yang et al. (2007) investigated evolved gases from pyrolysis of cellulose using TGA and DSC and a packed bed. Using 10°C/min TG/DSC and IR analysis of the evolved gases, they found CO and methane in the thermally evolved gases near 280°C. In their packed cellulose-bed experiments, they found CO beginning near 300°C and H2 and CH4 evolution beginning near 400°C. They did not observe ethene or ethane in these tests. Their results appear to be consistent with Williams’ and Besler’s results.
The reviewed literature indicates that thermolysis of cellulose will produce CO as a primary decomposition product near 200°C and H2 and light organic gases at >400°C. With the focus of these reports on the industrial pyrolysis of cellulose, the authors were not interested in low-temperature (<100°C) decomposition and the potential production of H2 and other flammable gases as secondary high-temperature products. The literature indicates that mechanisms may exist for the production of H2, CO, and light organic gases from BV feed containing cellulose and waste organics, although at low rates.
3.1.2 Thermal Decomposition of Cellulose Studies
We measured the thermal behavior of cellulose using both TG/DTA and ARC in its standard heat-wait-search operating mode. We represent and repeat the results of our studies on cellulose’s thermal reactivity in a BV feed (Scheele et al. 2008) here to assist the reader.
3.3
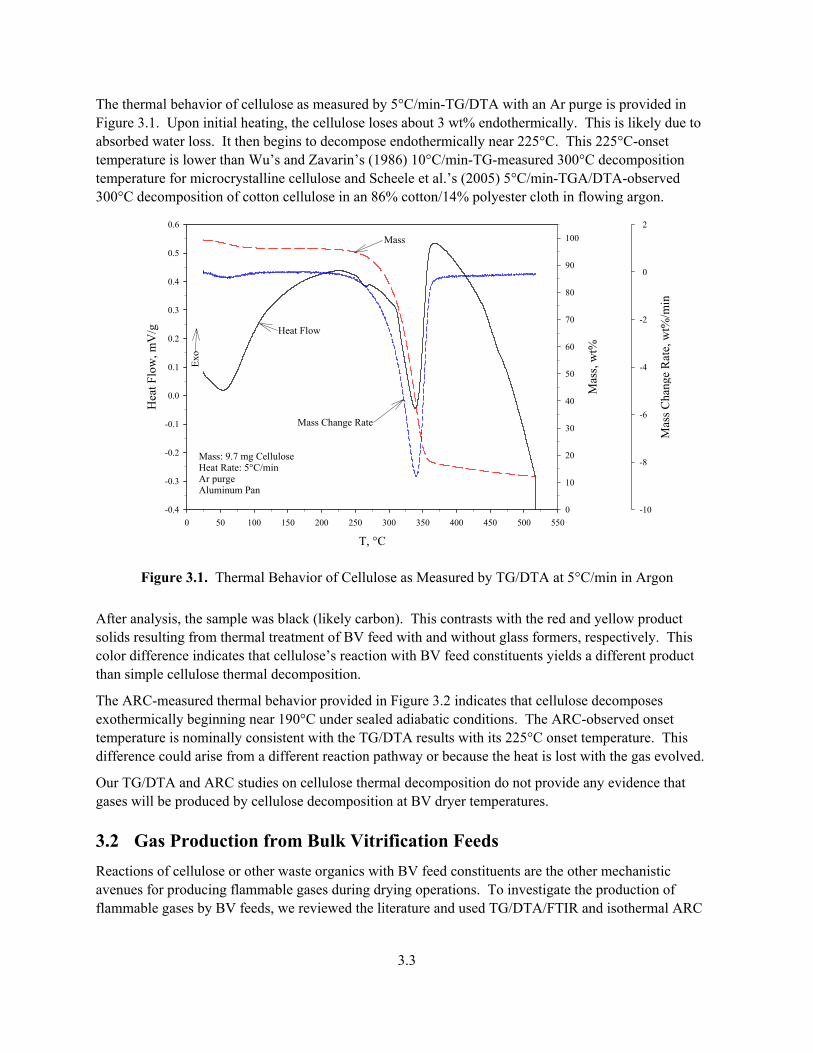
The thermal behavior of cellulose as measured by 5°C/min-TG/DTA with an Ar purge is provided in Figure 3.1. Upon initial heating, the cellulose loses about 3 wt% endothermically. This is likely due to absorbed water loss. It then begins to decompose endothermically near 225°C. This 225°C-onset temperature is lower than Wu’s and Zavarin’s (1986) 10°C/min-TG-measured 300°C decomposition temperature for microcrystalline cellulose and Scheele et al.’s (2005) 5°C/min-TGA/DTA-observed 300°C decomposition of cotton cellulose in an 86% cotton/14% polyester cloth in flowing argon.
T, °C0 50 100 150 200 250 300 350 400 450 500 550
Hea
t Flo
w, m
V/g
-0.4
-0.3
-0.2
-0.1
0.0
0.1
0.2
0.3
0.4
0.5
0.6
Mas
s, w
t%
0
10
20
30
40
50
60
70
80
90
100
Mas
s Cha
nge
Rat
e, w
t%/m
in
-10
-8
-6
-4
-2
0
2
Exo
Heat Flow
Mass
Mass Change Rate
Mass: 9.7 mg CelluloseHeat Rate: 5°C/minAr purgeAluminum Pan
Figure 3.1. Thermal Behavior of Cellulose as Measured by TG/DTA at 5°C/min in Argon
After analysis, the sample was black (likely carbon). This contrasts with the red and yellow product solids resulting from thermal treatment of BV feed with and without glass formers, respectively. This color difference indicates that cellulose’s reaction with BV feed constituents yields a different product than simple cellulose thermal decomposition.
The ARC-measured thermal behavior provided in Figure 3.2 indicates that cellulose decomposes exothermically beginning near 190°C under sealed adiabatic conditions. The ARC-observed onset temperature is nominally consistent with the TG/DTA results with its 225°C onset temperature. This difference could arise from a different reaction pathway or because the heat is lost with the gas evolved.
Our TG/DTA and ARC studies on cellulose thermal decomposition do not provide any evidence that gases will be produced by cellulose decomposition at BV dryer temperatures.
3.2 Gas Production from Bulk Vitrification Feeds Reactions of cellulose or other waste organics with BV feed constituents are the other mechanistic avenues for producing flammable gases during drying operations. To investigate the production of flammable gases by BV feeds, we reviewed the literature and used TG/DTA/FTIR and isothermal ARC

3.4
Temperature, °C
200 225 250 275
Φ-N
orm
aliz
edSe
lf-H
eat R
ate,
°C/m
in
10-1
100
101
Pres
sure
, psi
a
0
200
400
600
800
1000
Self-Heat Rate
Pressure
2.39 g CelluloseΦ = 1.7AirOnset Detection 0.1°C/min
Figure 3.2. Arrhenius Plot of Thermal Behavior of 2.4 g Cellulose as Measured by ARC Using a
Titanium Sample Container
with MS gas analyses of evolved gases to determine the effects of temperature, time, and the nature of organics on gas production.
3.2.1 Literature Review on Flammable Gas Production by Organic/Nitrate and/or Nitrite Mixtures
As an alternative to or in combination with thermal cellulose decomposition, chemical interactions between cellulose and/or waste organics (e.g., acetate in the waste formulation used for this study) with nitrate and/or nitrite in the cellulose-containing BV feed at dryer temperatures could produce flammable gases. The other ingredients in the waste could encourage or facilitate the production of these gases.
Although, as discussed earlier, many have studied the pyrolysis of cellulose and its evolved gases but have done so at temperatures higher than those expected in the dryer. Other than Smith et al. (1999), we found no reports providing thermally evolved gases from mixtures of cellulose and nitrate or nitrite, though there are studies on thermal gas production from Hanford wastes that may provide some insights on flammable gas production from BV feed.
As a result of Smith et al.’s (1999) investigations on the use of cellulose as a denitrating agent, they postulated the denitration reaction stoichiometry
C6H10O5 + 6 NaNO3 → 3 Na2CO3 + 3 CO2 + 5 H2O + 2 N2 + N2O + O2
or a 1:1 C:N molar ratio. In this reaction, there are no flammable gases produced. Another reaction mechanism would be required for a reaction between cellulose and nitrate or nitrite to produce hydrogen, organic gases, or carbon monoxide. The reaction mechanism can be temperature sensitive, similar to the

3.5
temperature sensitivity for the flammable gas-producing reaction between glycolate and nitrate/nitrite (Barefield 1995, 1996)
PNNL and the Georgia Institute of Technology investigated gas production from Hanford wastes. Bryan and coworkers investigated thermal and radiolytic gas production from Hanford tank wastes (Bryan et al. 1996; Bryan and King 1998; King and Bryan 1999; King et al. 1997; Pederson and Bryan 1996; Bryan and Pederson 1995). The Georgia Institute of Technology team investigated mechanisms for gas production from Hanford 241-SY tank wastes (Ashby et al. 1994; Barefield et al. 1995, 1996). Direct correlation of Hanford tank waste studies with hydrogen and light organic gases production and the BV feed during drying is complicated by differences between cellulose and the waste organics. The Hanford waste organics arose principally from degradation of amine-based complexants and some carboxylate complexants such as citrate.
Ashby et al. (1994) describe a mechanism for producing hydrogen and nitrous oxide from 90 and 120°C aqueous 2 M hydroxide glycolate mixtures containing aluminate, sodium carbonate, sodium nitrite, and sodium nitrate. These studies performed in support of Hanford’s efforts to understand and control the production of flammable gas mixtures from high-level radioactive tank wastes determined that the consumption of glycolate (HOCH2CO2
-) was dependent on the aluminum hydroxide, nitrite, and hydroxide concentrations with a pseudo-first order reaction rate constant of between 4 and 7 × 10⁻⁴/hr in the presence of glass and between 6 and 11 × 10-3/hr in the absence of glass. They measured an activation energy of 120 kJ/mol for H2 production. Although extrapolating Ashby et al.’s results for glycolate to the very complex carboxylate polymer cannot be done directly, their work illustrates that carboxylates can react with nitrite in the presence of Hanford waste constituents to produce hydrogen.
To provide a rough idea of thermally-generated gas-generation rates from Hanford wastes, King and Bryan (1999) report thermal generation rates from Tank 241-U-103 (U-103) waste of 0.003, 0.02, and 0.55 µmol H2/g/d and 0.0001, 0.005, and 0.4 µmol CH4/g/d at 60, 90, and 120°C, respectively.
Again, it must be recognized that the tank wastes tested by Bryan and co-workers were aqueous systems with an amalgam of organics present and thus differ significantly from BV feed containing cellulose and traces of tank wastes.
The literature describing gas production from organic-bearing Hanford radioactive aqueous wastes or aqueous slurry wastes indicate that carboxylates (such as cellulose and acetate) can react with waste nitrates and nitrites in the presence of other constituents to produce H2. The literature indicates that mechanisms may exist for the production of H2, CO, and light organic gases from BV feed containing cellulose and waste organics, although at low rates.
3.2.2 BV Feed TG/DTA/FTIR Results
We tested mixtures containing cellulose at C:N ratios of 0.75 and 1:1 at water contents of 4 and 12 wt% using TG/DTA studies and characterized the evolved gases using FTIR. In general, the FTIR saw CO2, N2O, NO, and NO2 and did not see any organic gases such as CH4.
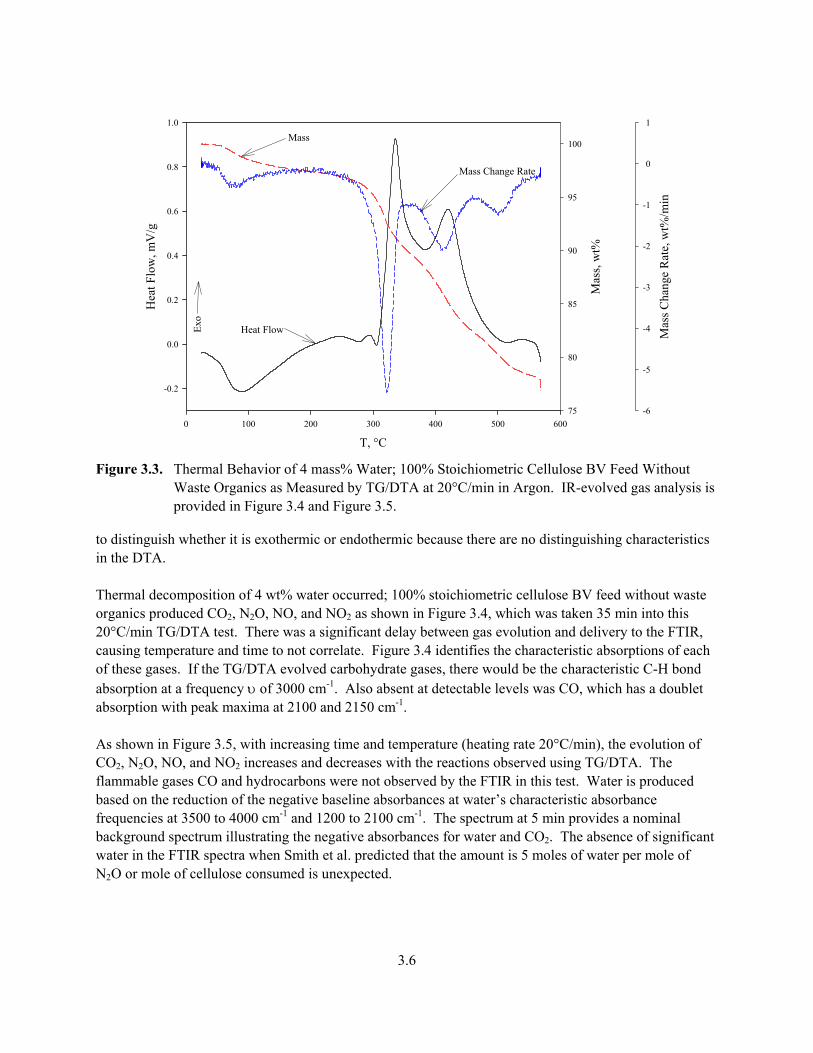
The TG/DTA analyses used to evolve gases from a 4 wt% water, 100% cellulose stoichiometric BV feed without waste organics is provided in Figure 3.3. As in previous work (Scheele et al. 2008), the initial reaction is endothermic and begins essentially immediately and is likely the loss of the 4 wt% water. It is followed by a small exothermic reaction at 290°C and two stronger exothermic reactions beginning at 300 and 380°C. The TG and DTG measurements indicate that another reaction begins at 470°C; it is difficult
3.6
T, °C0 100 200 300 400 500 600
Hea
t Flo
w, m
V/g
-0.2
0.0
0.2
0.4
0.6
0.8
1.0
Mas
s, w
t%
75
80
85
90
95
100
Mas
s Cha
nge
Rat
e, w
t%/m
in
-6
-5
-4
-3
-2
-1
0
1
Exo
Heat Flow
Mass
Mass Change Rate
Figure 3.3. Thermal Behavior of 4 mass% Water; 100% Stoichiometric Cellulose BV Feed Without
Waste Organics as Measured by TG/DTA at 20°C/min in Argon. IR-evolved gas analysis is provided in Figure 3.4 and Figure 3.5.
to distinguish whether it is exothermic or endothermic because there are no distinguishing characteristics in the DTA. Thermal decomposition of 4 wt% water occurred; 100% stoichiometric cellulose BV feed without waste organics produced CO2, N2O, NO, and NO2 as shown in Figure 3.4, which was taken 35 min into this 20°C/min TG/DTA test. There was a significant delay between gas evolution and delivery to the FTIR, causing temperature and time to not correlate. Figure 3.4 identifies the characteristic absorptions of each of these gases. If the TG/DTA evolved carbohydrate gases, there would be the characteristic C-H bond absorption at a frequency υ of 3000 cm-1. Also absent at detectable levels was CO, which has a doublet absorption with peak maxima at 2100 and 2150 cm-1. As shown in Figure 3.5, with increasing time and temperature (heating rate 20°C/min), the evolution of CO2, N2O, NO, and NO2 increases and decreases with the reactions observed using TG/DTA. The flammable gases CO and hydrocarbons were not observed by the FTIR in this test. Water is produced based on the reduction of the negative baseline absorbances at water’s characteristic absorbance frequencies at 3500 to 4000 cm-1 and 1200 to 2100 cm-1. The spectrum at 5 min provides a nominal background spectrum illustrating the negative absorbances for water and CO2. The absence of significant water in the FTIR spectra when Smith et al. predicted that the amount is 5 moles of water per mole of N2O or mole of cellulose consumed is unexpected.

3.7
ν, cm-1
5001000150020002500300035004000
Abs
orba
nce
0.00
0.05
0.10
0.15
0.20
0.25
CO2
N2O
NO N2ONO2
CO2
Figure 3.4. IR Spectrum of Thermally Evolved Gases from 4% H2O; 100% Stoichiometric Cellulose BV
Feed Without Waste Organics at 35 Minutes. See Figure 3.3 for TG/DTA analysis that produced these gases.
Unfortunately, we were unable to eliminate the lag time between the TG-observed mass loss events and the observation of the gases observed by the FTIR. We believe this difference arises from transport issues, even though we increased the purge gas flow rates and accelerated the heating rate. It is important to recognize that the results are qualitative since we have not measured the coefficients of absorbance for each of the individual gases.
Because we do not have the Beer’s Law absorbance coefficients, we are unable to quantify the gas concentration in the TG/DTA evolved gas. Qualitatively, Figure 3.5 suggests that N2O is the predominant nitrogen-containing oxidation product with some production of NO and NO2. The qualitative predominance of N2O supports Smith et al.’s postulated reaction path with the production of 5 moles of water produced per mole of cellulose consumed. The presence of NO and NO2 indicates that denitration proceeds via additional reaction pathways other than that postulated by Smith et al. (1999).
Figure 3.6 provides the 20°C/min TG/DTA test of 12 wt% water, 100% cellulose stoichiometric BV feed without waste organics that evolved the gases analyzed by FTIR. The major and only significant difference between the 4 and 12 wt% water BV feed tests was the mass loss that occurred between room temperature and 150°C (20°C/min), which is based on the mass loss, and the expected behavior is water loss.

3.8
-0.05
0.00
0.05
0.10
0.15
0.20
0.25
10
20
30
4050
60
10002000
30004000
Abs
orba
nce
time,
min
Frequency, cm -1
CO2
NO2N2ONO
H2O
Figure 3.5. IR-Observed Thermally Released Gases from 4 wt% H2O 100% Stoichiometric Cellulose
(C:N =1.0) BV Feed Without Waste Organics. See Figure 3.3 for 20°C/min TG/DTA analysis that produced the gases analyzed by FTIR.
As with the 4 wt% water BV feed without waste organics, Figure 3.7 shows that CO2, N2O, NO, and NO2 are produced. The spectra provided in Figure 3.7 indicate more strongly the production of water during the high-temperature cellulose denitration steps. Qualitatively, the predominant nitrogen-containing gas was again N2O indicating that reaction proposed by Smith et al. (1999) was the main reaction pathway. Again the flammable gases CO and hydrocarbons such as methane were not observed in this test.
These two thermal stability tests of BV containing 4 and 12 wt% water and 100% of the stoichiometric cellulose indicate that absorbed water does not affect the character of the denitration reaction on a qualitative basis. The IR analyses qualitatively suggest that cellulose denitration proceeds primarily via the Smith et al. (1999) pathway with production of N2O, CO2, and water as products. NO and NO2 also indicate that secondary denitration pathways also occur. The stoichiometry of the reaction pathways is not possible to determine from our qualitative approach to these experiments.
These two experiments were part of a larger set of TG/DTA/FTIR screening studies where we investigated the effects of water and cellulose concentrations. The FTIR analysis of the evolved gases observed the same behavior with no flammable gases observed in the test. The TG/DTA thermal analyses of BV feed with waste organics performed at 5°C/min are provided in Figure 3.8 through Figure 3.11.

3.9
T, °C0 100 200 300 400 500 600
Hea
t Flo
w, m
V/g
-0.8
-0.6
-0.4
-0.2
0.0
0.2
0.4
0.6
0.8
1.0
1.2
Mas
s, w
t%
70
75
80
85
90
95
100
Mas
s Cha
nge
Rat
e, w
t%/m
in
-5
-4
-3
-2
-1
0
Exo
Heat Flow
Mass
Mass Change Rate
12% H2O100% Cellulose20°C/minAr Purge
Figure 3.6. Thermal Behavior of 12 mass% Water, 100% Stoichiometric Cellulose BV Feed Without
Waste Organics as Measured by TG/DTA at 20°C/min in Argon. IR evolved gas analysis is provided in Figure 3.7.
-0.05
0.00
0.05
0.10
0.15
0.20
0
10
20
3040
5060
10002000
30004000
Abs
orba
nce
time,
min
Frequency, cm -1
CO2
NO2
N2O
NO
H2O
H2O
Figure 3.7. IR-Measured Gases Evolved During 20°C/min TG/DTA Test of 12 wt% Water, 100%
Stoichiometric Cellulose BV Feed in an Argon Purge. See Figure 3.6 for the TG/DTA test generating the gases analyzed.

3.10
T, °C0 100 200 300 400 500
Hea
t Flo
w, m
V/g
-0.6
-0.4
-0.2
0.0
0.2
0.4
0.6
0.8
1.0
1.2
1.4
1.6
Mas
s, w
t%
75
80
85
90
95
100
Mas
s Cha
nge
Rat
e, w
t%/m
in
-2.5
-2.0
-1.5
-1.0
-0.5
0.0
Exo
Heat Flow
Mass
Mass Change Rate
Figure 3.8. Thermal Behavior of 4 mass% Water, 75% Stoichiometric Cellulose BV Feed as Measured
by TG/DTA at 5°C/min in Argon
T, °C0 100 200 300 400 500
Hea
t Flo
w, m
V/g
-0.2
0.0
0.2
0.4
0.6
Mas
s, w
t%
70
75
80
85
90
95
100
Mas
s Cha
nge
Rat
e, w
t%/m
in
-1.6
-1.4
-1.2
-1.0
-0.8
-0.6
-0.4
-0.2
0.0
0.2
Figure 3.9. Thermal Behavior of 4 mass% Water, 100% Stoichiometric Cellulose BV Feed as Measured
by TG/DTA at 5°C/min in Argon

3.11
T, °C0 100 200 300 400 500
Hea
t Flo
w, m
V/g
-0.6
-0.4
-0.2
0.0
0.2
0.4
0.6
Mas
s, w
t%
70
75
80
85
90
95
100
Mas
s Cha
nge
Rat
e, w
t%/m
in
-1.2
-1.0
-0.8
-0.6
-0.4
-0.2
0.0
Exo
Heat Flow
MassMass Change Rate
Figure 3.10. Thermal Behavior of 12 mass% Water, 75% Stoichiometric Cellulose BV Feed as
Measured by TG/DTA at 5°C/min in Argon
T, °C0 100 200 300 400 500
Hea
t Flo
w, m
V/g
-0.5
0.0
0.5
1.0
1.5
2.0
Mas
s, w
t%
65
70
75
80
85
90
95
100
Mas
s Cha
nge
Rat
e, w
t%/m
in
-4.0
-3.5
-3.0
-2.5
-2.0
-1.5
-1.0
-0.5
0.0
Exo
Heat Flow
Mass Mass Change Rate
Figure 3.11. Thermal Behavior of 12 mass% Water, 100% Stoichiometric Cellulose BV Feed as
Measured by TG/DTA at 5°C/min in Argon
3.12
The effects of the C:N ratio are illustrated by comparing Figure 3.8 with Figure 3.9 and Figure 3.10 with Figure 3.11. Both of the 0.75:1 C:N ratio BV Feeds DTA peaks have a shoulder (270 to 300°C) on the major exothermic peak with a maxima near 310°C while the C:N of 1:1 does not. We have insufficient information to understand why an excess of nitrate would cause this shoulder to exist. Otherwise, the qualitative behavior of the two C:N ratio BV feeds is nearly the same.
The effect of adsorbed water is manifested in the initial mass loss. The nominal 4 wt% water BV feeds lost between 4 and 6 wt% between room temperature and 150°C while the nominal 12 wt% lost about 13 wt%. The extra water probably comes from water that the BV feed adsorbs while work is being performed in room air since the BV feed acts as a desiccant.
In summary, the TG/DTA/FTIR testing of the BV feeds containing 4 and 12 wt% water and C:N ratios of 0.75:1 and 1:1 indicate no differences in gas production with only CO2, N2O, NO, and NO2 and water being formed by the cellulose denitration reactions with the flammable gases CO and organics, such as CH4, not being observed. Differences in water content cause differences in the initial mass loss. Differences in C:N ratios cause a shoulder to be added to the initial significant cellulose nitrate reaction at the lower cellulose content.
3.2.3 BV Feed Isothermal Gas-Production Studies
This section provides the results of our isothermal studies performed at room temperature, 80, and 120°C to determine the effects of temperature and waste organics on the generation of flammable gases from BV feeds during drying and during drying process upsets where the feed remains in the dryer for a period of time. Gas samples were obtained using one of two different strategies, either 1) taken after 1 day and 4 additional days or 2) after 1 day and then after 5 days using a fresh sample. Single tests were performed with no duplicate testing or analyses.
In this section, we first provide the amounts of each gas produced as measured by MS. Second, we provide a comparison of the total gas produced as measured by MS and as determined from the ARC-measured pressure increases. Third, we compare the effect of temperature on the production of each individual gas produced and measured.
In general, the amount of oxygen after correcting for air in-leakage based on argon content in the gas sample was less than zero, indicating that it had been consumed. Because of the typically negative amount of oxygen and the wide variability in measured nitrogen amounts after adjusting for air in-leakage, we do not report either.
3.2.3.1 Gas Production from Room Temperature BV Feed with Cellulose and Without Waste Organics
In this experiment, a single sample of BV feed with cellulose and without waste organics was used. A gas sample was taken after 1 day and then again after an additional 4 days. As provided in Table 3.1 and Figure 3.12, the mass spectrometer found only CO2 and H2 at detectable levels in the gases produced by the room temperature. No nitrogen oxides were found, suggesting cellulose thermal decomposition rather than reactions with nitrate. As Table 3.1 and Figure 3.12 show, the production of these two gases is essentially constant over the course of 5 days.

3.13
Table 3.1. Gas Production by Room Temperature BV Feed Without Waste Organics
1-Day +4-Day Total (5 days)
Gas µmol/g Feed
Production Rate, µmol/g/d
µmol/g feed
Production Rate, µmol/g/d
µmol/g Feed
Production Rate,
µmol/g/d CO2 0.039 0.02 0.064 0.016 0.1 0.02 CO <0.04 <0.03 <0.05 <0.01 <0.1 <0.02 H2 0.002 0.001 0.003 0.0007 0.005 0.001
CH4 <0.004 <0.003 <0.005 <0.001 <0.01 <0.002 C2Hx <0.004 <0.003 <0.01 <0.002 <0.01 <0.003 N2O <0.04 <0.03 <0.02 <0.006 <0.07 <0.01 NOx <0.004 <0.003 <0.02 <0.006 <0.03 <0.005
time, day
0 1 2 3 4 5 6
Gas
Pro
duct
ion
Rat
e, µ
mol
/g fe
ed/d
0.0001
0.001
0.01
0.1
CO2
H2
Figure 3.12. Observed Gases from Room Temperature (22°C) BV Feed Without Waste Organics
(e.g., oxalate and acetate)
The room temperature BV feed with cellulose and without waste organics suggests that the H2 and CO2 production mechanisms remain essentially constant with time. A longer test would be required to discern more about gas production at this temperature.
3.2.3.2 Gas Production from 80°C BV Feed with Cellulose and Without Waste Organics In the 80°C BV feed with cellulose and without waste organics, we used a different sample for each gas sampling. As provided in Table 3.2 and Figure 3.13, only CO2, and H2 were generated at detectable levels after 1 day. After 5 days, the BV feed without waste organics produced CO2, H2, N2O, and NO2 at

3.14
detectable levels. As Figure 3.13 shows that at 80°C, the CO2 production rate decreases, the H2 production rate remains essentially constant, possibly decreasing slightly; the N2O production rate increases over 5 days from <0.003 to 0.175 µmol/g/d, and NOx is produced. Because the other gases were below detectable levels in the 1-day samples, the production rate with time is not possible to determine.
Table 3.2. Gas Production by 80°C BV Feed Without Waste Organics
1 Day 5 Day (Fresh Sample)
Gas µmol/g Feed
Production Rate, µmol/g/d
µmol/g Feed
Production Rate, mmol/g/d
CO2 0.31 0.31 0.036 0.0072 CO <0.03 <0.03 <0.03 <0.01 H2 0.005 0.005 0.01 0.002
CH4 <0.003 <0.003 <0.003 <0.001 C2Hx <0.003 <0.003 <0.003 <0.001 N2O <0.003 <0.003 0.873 0.175 NOx <0.003 <0.003 0.02 0.004
time, day
0 1 2 3 4 5 6
Gas
Pro
duct
ion
Rat
e, µ
mol
/g fe
ed/d
0.001
0.01
0.1
1
CO2
H2
N2O
NOx
Figure 3.13. Observed Gases Evolved from Simulated BV Feed Without Waste Organics at 80°C
The 80°C BV feed with cellulose and without waste organics suggests that the H2 production mechanism remains essentially constant, that the production of oxides of nitrogen has an incubation period or is a

3.15
multiple step process between cellulose and nitrate and/or nitrite, and that the mechanism for production of CO2 changes. This experiment also indicates that cellulose is reacting with nitrate and/or nitrite in the waste although at a very slow rate.
3.2.3.3 Gas Production from 120°C BV Feed with Cellulose and Without Waste Organics In the 120°C BV Feed with cellulose and without waste organics, the same sample was used for both samplings. As provided in Table 3.3 and Figure 3.14, the 120°C BV feed with cellulose and without waste organics produced CO2, CO, H2, CH4, C2Hx, N2O, and NOx. All these gases were found in the 1-day sample. However, in the +4-day gas sample, all except H2 were found above detectable levels. As Figure 3.14 shows, the production rate of all these gases except H2 is essentially constant over the course of 5 days while the H2 production rate appears to a product of initial reactions and not those after 1 day.
Table 3.3. Production by 120°C BV Feed with Cellulose and Without Waste Organics
1 Day +4 Day Total (5 day)
Gas µmol/g
feed Production
Rate, µmol/g/d µmol/g
feed Production
Rate, µmol/g/d µmol/g
feed Production
Rate, µmol/g/dCO2 0.178 0.178 0.345 0.0862 0.52 0.10 CO 0.07 0.07 0.1 0.02 0.2 0.03 H2 0.002 0.002 <0.002 <0.0004 <0.003 <0.0007 CH4 0.01 0.01 0.052 0.013 0.06 0.01 C2Hx 0.02 0.02 0.074 0.019 0.10 0.02 N2O 1.581 1.581 3.40 0.850 4.98 1.00 NOx 0.034 0.034 1.13 0.28 1.17 0.23
The 120°C BV feed with cellulose and without waste organics suggests that the H2 production reaction is rapidly spent or supplanted by another and that the mechanisms producing the other gases (except NOx) remain essentially unperturbed by the course of the reaction(s) that is occurring within the 120°C BV feed. The increase in the NOx production rate suggests that the reaction that produces it has an incubation period or is a multiple step process between cellulose and nitrate and/or nitrite.
3.2.3.4 Gas Production from 80°C BV Feed Without Cellulose and with Waste Organics In the 80°C BV feed without cellulose and with waste organics, we used a single BV Feed sample and collected gas samples after 1 day and an additional 5 days. As provided in Table 3.4 and Figure 3.15, the 80°C BV feed without cellulose and with waste organics produced CO2, H2, CH4, N2O, and NOx. The 1-day sample contained CO2, H2, N2O, and NOx. In the +5-day gas sample, the mass spectrometer found CO2, H2, CH4, N2O and NOx. As Figure 3.15 shows, the production rate of all the detected gases except H2 remained essentially constant; H2 decreased over the 6 days. The amount of H2 produced decreased significantly to roughly a factor of 0.0025 of that released in the first day.
The 80°C BV feed without cellulose and with waste organic suggests that the H2 production reaction is rapidly spent or supplanted by another and that the mechanisms producing the other gases remain essentially unperturbed by the course of the reaction(s) that is occurring within the 80°C BV feed.

3.16
time, day
0 1 2 3 4 5 6
Gas
Pro
duct
ion
Rat
e, µ
mol
/g fe
ed/d
0.001
0.01
0.1
1
10
CO2
H2
N2O
CO
NOx
CH4
C2Hx
Figure 3.14. Observed Gases Evolved from Simulated BV Feed Without Waste Organics at 120°C.
Less than (<) indicates less than detection limit.
Table 3.4. Gas Production by 80°C BV Feed with Waste Organics and Without Cellulose
1-Day Sampling +5-Day Sampling Total (Sum)
Gas µmol/g Feed
Production Rate, µmol/g/d
µmol/g Feed
Production Rate, µmol/g/d
µmol/g Feed
Production Rate, µmol/g/d
CO2 0.059 0.059 0.25 0.050 0.31 0.052 CO <0.02 <0.02 <0.02 <0.004 <0.04 <0.006 H2 0.004 0.004 0.00001 0.000002 0.004 0.001
CH4 <0.002 <0.002 0.004 0.001 <0.005 <0.001 C2Hx <0.002 <0.002 <0.002 <0.0004 <0.004 <0.0006 N2O 0.07 0.07 0.25 0.051 0.33 0.055 NOx 0.1 0.1 0.33 0.065 0.42 0.069
3.2.3.5 Gas Production based on Pressure Increase Pressure potentially provides an independent measure of the amount of gas produced by BV feed, assuming ideal gas behavior where the amount of gas in moles equals PV/RT where P is pressure, V is volume, R is the gas constant, and T is temperature. In our isothermal testing to measure produced gases at room temperature, 80, and 120°C, we monitored pressure using a pressure transducer capable of measuring up to 4000 psig and having a sensitivity of 0.1 psi primarily as a safety measure to guard against unexpected gas-generation quantities that might over pressurize the ARC system.

3.17
time, day
0 1 2 3 4 5 6 7
Gas
Pro
duct
ion
Rat
e, µ
mol
/g fe
ed/d
0.0001
0.001
0.01
0.1
CO2
H2
N2O
CH4
NOx
Figure 3.15. Observed Gases Evolved from Simulated BV Feed with Waste Organics and Without
Cellulose at 80°C
There was, however, a need to have a secondary measurement that supported the total gas-generation estimates determined from the mass spectrometer measurements. This was necessary to address concerns that the mass spectrometer was missing a substantial quantity of the generated gas and that the relative concentrations of the flammable gases were overstated. The pressure data obtained in these tests were used as a coarse check to determine if substantially more gas was produced than that estimated from mass spectrometer measurements. This report provides the results of the pressure measurements in terms of gas produced and compares these to those obtained based on mass spectrometer measurements of produced gases.
The apparatus used for the isothermal experiments was the ARC. In the ARC, the sample is contained within a calorimeter designed to maintain the sample at the target temperature. The sample container is connected to a nominal 6-mL manifold external to the heated calorimeter with a 4000-psig pressure transducer attached. The manifold is within a thick metal shrapnel shell that will insulate the manifold. With the manifold outside the heated calorimeter, the average temperature of the outside gas should be slightly less than the sample. This configuration confounds the interpretation of pressure data with respect to the true amount of gas present at elevated temperatures above room temperature.
This configuration results in a measured pressure lower than would be expected for an ideal gas at the BV feed’s temperature. This configuration also could allow for some pressure rise that is not associated with gas generation after the sample container has been heated to the isothermal temperature. When the sample vessel first reaches temperature, the remaining manifold is likely to be near room temperature, and the average gas temperature will be less than the isothermal temperature. As the sample vessel remains at the elevated temperature, thermal convection would tend to move the hotter gases to the unheated regions of the manifold and increase the manifold temperature. Over a multiday test, the manifold temperature

3.18
could increase several degrees, leading to a higher average gas temperature and a higher overall pressure. These possibilities need to be considered when interpreting the results of the pressure data calculations.
Table 3.5 summarizes the measured pressure changes for the 80 and 120°C experiments, the amount of gas produced assuming ideal gas behavior (nP), the gas production based on the MS-measured gas composition (nMS), and the molar ratio of the pressure-based gas and the MS-based gas. We did not monitor pressure for the room-temperature experiment. The comparative ratios of the gas produced based on pressure and MS analysis range from 0.5 to 20.
Table 3.5. Comparison of Gas Production from BV Feed with and Without Cellulose or Waste Organics Based on Pressure Increase and Based on MS Analysis
Test Material T, °C Time, d ∆P, psi nP, µmol nMS, µmol nP:nMS, mol/mol BV Feed with cellulose without organics 120 1 0.2 7 13 0.5 BV Feed with cellulose without organics 120 +4 0.6 20 35 0.6 BV Feed with cellulose without organics 80 1 0.6 20 2 10 BV Feed with cellulose without organics 80 5 0.7 20 6 3 BV Feed without cellulose with organics 80 1 0.7 20 1 20 BV Feed without cellulose with organics 80 +5 0.3 9 1 9
As Figure 3.16 shows, the pressure increased by 0.25 psia during the 1-day 120°C BV feed in the test with cellulose and without waste organics after the sample reached a temperature of 120°C. A 0.25 psia increase at 120°C corresponds to 7 µmol gas produced. Based on the MS gas analysis, at 120°C, the BV feed with cellulose produced 13 µmol of gas. This np:nMS of 0.5 (Table 3.5) shows reasonably good agreement given the coarse nature of the pressure measurement.
For example, Figure 3.16 illustrates that the transducer has a measurement sensitivity of ±0.1 psia and the limitations of the pressure measurement in this system. The final pressure is between 55.7 and 55.8 psig while the initial pressure is between 55.5 and 55.6 psig.
As Figure 3.17 shows, after the initial 1.8 psia pressure drop during the first 1000 min, the pressure increased 0.6 psia during the +4-day 120°C BV feed test with cellulose and without waste organics. The initial drop in pressure during the first 1000 min is not understood and likely introduces significant error into the gas-production estimate based on the pressure increase. This 0.6 psia increase at 120°C corresponds to 20 µmol gas produced. In comparison, the MS gas analysis indicated that at 120°C, the BV feed with cellulose produced 35 µmol of gas or an np:nMS of 0.6. Again, this is relatively good agreement given the coarse nature of the pressure measurement and the uncertainties associated with the initial pressure drop.
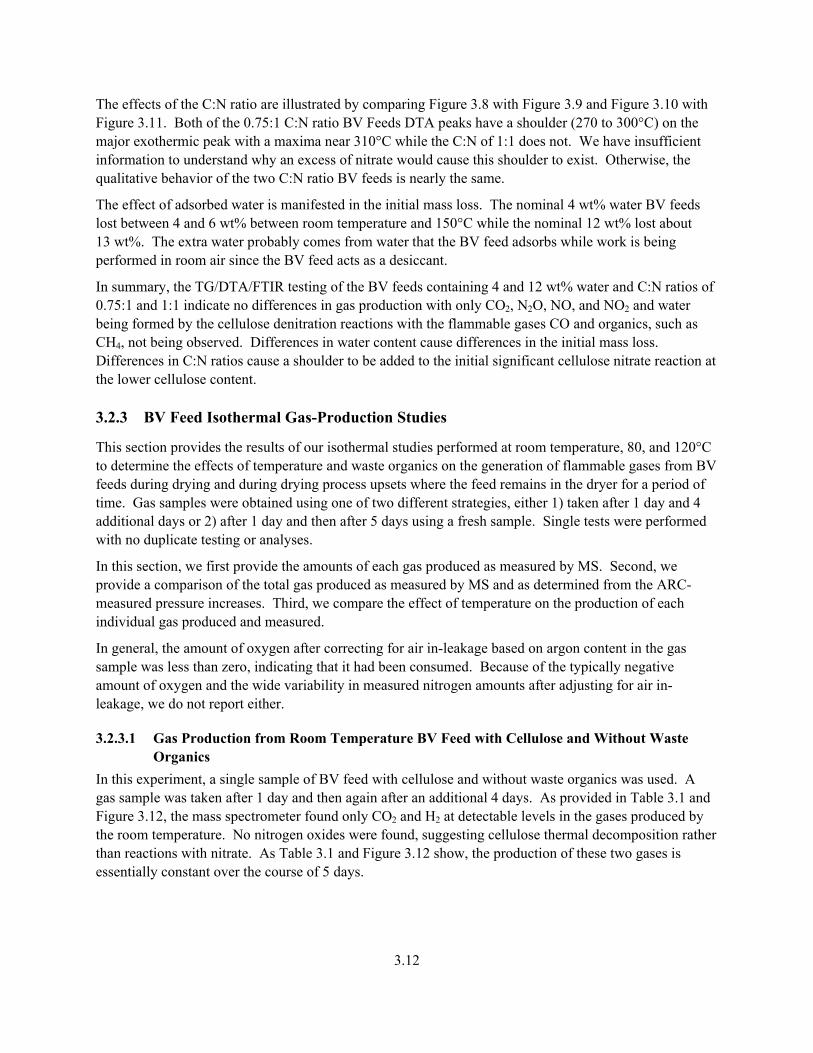
As Figure 3.18 shows, the pressure increased 1.2 psia during the 1-day 80°C BV feed test with cellulose and without waste organics after the sample temperature reached 78°C. In this experiment, the temperature increased from 78°C to 85°C for some unknown reason rather than remaining truly isothermal. The temperature increase contributes 0.6 psia to the 1.2-psia pressure increase, leaving 0.6-psia of produced gas. This 0.6-psia increase at 80°C corresponds to 20 µmol gas produced. Based on the MS gas analysis, at 80°C, the BV feed with cellulose produced 2 µmol of gas assuming that no N2 was produced. In this experiment, the pressure indicates a nominal factor of 10 more gas than the MS analysis of produced gases.

3.19
time, min
200 400 600 800 1000 1200 1400 1600
Pres
sure
, psi
g
55.5
55.6
55.7
55.8
Figure 3.16. Pressure During 1-Day 120°C Isothermal BV Feed with Cellulose and Without Waste
Organics
time, min
1000 2000 3000 4000 5000 6000
Pres
sure
, psi
g
53.6
53.8
54.0
54.2
54.4
54.6
54.8
55.0
55.2
55.4
Figure 3.17. Pressure During 5-day 120°C Isothermal BV Feed with Cellulose and Without Waste
Organics
3.20
time, min
0 200 400 600 800 1000 1200 1400 1600
Pres
sure
, psi
g
40.8
41.0
41.2
41.4
41.6
41.8
42.0
42.2
42.4
42.6
Figure 3.18. Pressure During 1-Day Isothermal 80°C BV Feed with Cellulose and Without Waste
Organics (during the test, the temperature increased from 78°C to 85°C)
The higher pressure-measured gas production could arise from the production of N2, which we did not include in the MS-measured gases or water arising from the oxidation of the cellulose, which we cannot measure with our MS or air in-leakage. We did not include N2 because the N2 contribution from air based on the measured Ar content was typically significantly higher than the measured N2 content. We know of no N2-consuming reaction in this system given that N2 is a near-inert gas under most conditions. Water production is a possibility but not measurable using our existing experimental apparatus or our MS system. Air in-leakage is not considered a reasonable possibility because the only driving force for air in-leakage is diffusion into a 40-psig system. It is also possible that the lower temperature test (80°C compared to 120°C) took longer to come to equilibrium and resulted in pressure rises that were associated with thermal equilibrium rather than gas generation. In summary, numerous experimental uncertainties prevent us from interpreting these data to indicate that significantly more gas was produced than that measured by the mass spectrometer.
As Figure 3.19 shows, the pressure increased 0.7 psia during the 5-day 80°C BV feed test with cellulose and without waste organics after the sample temperature reached 80°C. This 0.7 psia increase at 80°C corresponds to 20 µmol gas produced. Based on the MS gas analysis, the 80°C of the BV feed with cellulose produced 6 µmol of gas, assuming that no N2 was produced. In this experiment, the pressure indicates a nominal factor of 3 more gas than the MS analysis, which is in reasonably good agreement given the coarse nature of the pressure measurement.
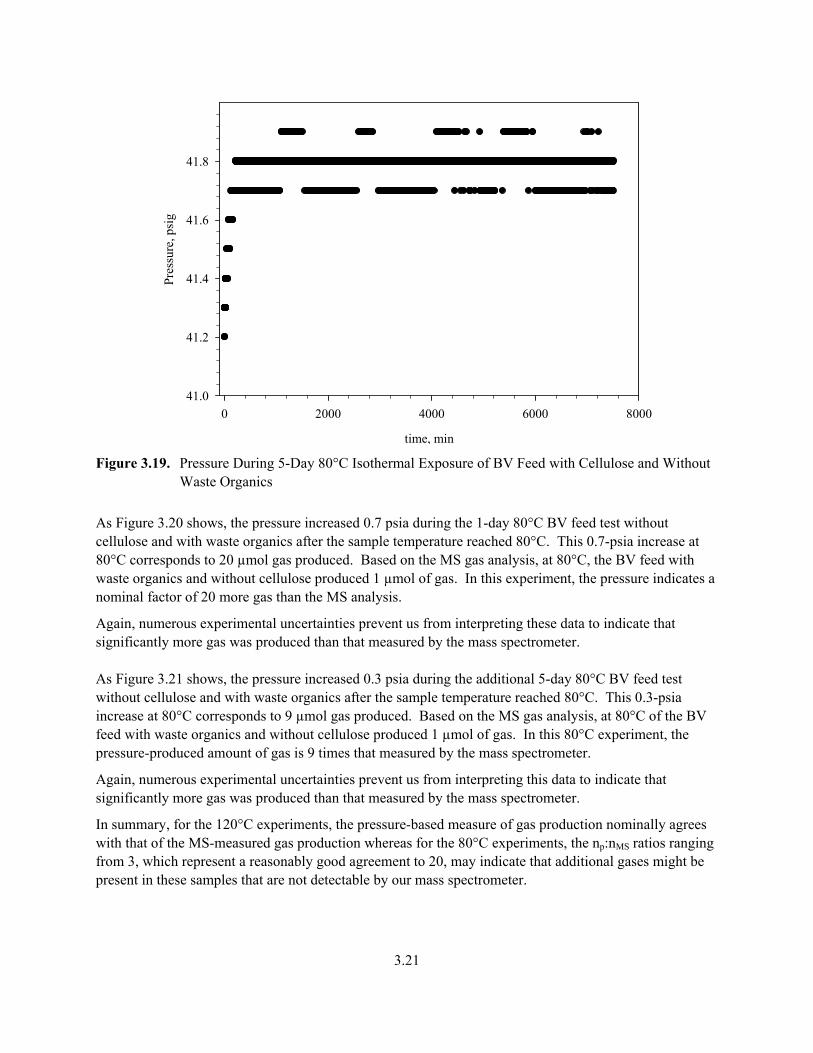
3.21
time, min
0 2000 4000 6000 8000
Pres
sure
, psi
g
41.0
41.2
41.4
41.6
41.8
Figure 3.19. Pressure During 5-Day 80°C Isothermal Exposure of BV Feed with Cellulose and Without
Waste Organics
As Figure 3.20 shows, the pressure increased 0.7 psia during the 1-day 80°C BV feed test without cellulose and with waste organics after the sample temperature reached 80°C. This 0.7-psia increase at 80°C corresponds to 20 µmol gas produced. Based on the MS gas analysis, at 80°C, the BV feed with waste organics and without cellulose produced 1 µmol of gas. In this experiment, the pressure indicates a nominal factor of 20 more gas than the MS analysis.
Again, numerous experimental uncertainties prevent us from interpreting these data to indicate that significantly more gas was produced than that measured by the mass spectrometer. As Figure 3.21 shows, the pressure increased 0.3 psia during the additional 5-day 80°C BV feed test without cellulose and with waste organics after the sample temperature reached 80°C. This 0.3-psia increase at 80°C corresponds to 9 µmol gas produced. Based on the MS gas analysis, at 80°C of the BV feed with waste organics and without cellulose produced 1 µmol of gas. In this 80°C experiment, the pressure-produced amount of gas is 9 times that measured by the mass spectrometer.
Again, numerous experimental uncertainties prevent us from interpreting this data to indicate that significantly more gas was produced than that measured by the mass spectrometer.
In summary, for the 120°C experiments, the pressure-based measure of gas production nominally agrees with that of the MS-measured gas production whereas for the 80°C experiments, the np:nMS ratios ranging from 3, which represent a reasonably good agreement to 20, may indicate that additional gases might be present in these samples that are not detectable by our mass spectrometer.

3.22
time, min
0 200 400 600 800 1000 1200 1400
Pres
sure
, psi
g
42.0
42.2
42.4
42.6
42.8
Figure 3.20. Pressure During 1-day 80°C Isothermal Exposure of BV Feed Without Cellulose and with
Waste Organics
time, min
0 2000 4000 6000 8000
Pres
sure
, psi
g
42.15
42.20
42.25
42.30
42.35
42.40
42.45
42.50
42.55
Figure 3.21. Pressure During 5 Additional Days of 80°C Isothermal Exposure of BV Feed Without
Cellulose and with Waste Organics

3.23
Possibilities to explain a higher pressure-measured gas production include N2 production, or water arising from the oxidation of the cellulose, which we cannot measure with our mass spectrometer, or air in-leakage. Extra N2 production is unlikely because the N2 air contribution based on the MS-measured Ar content was typically significantly higher than the measured N2 content. With no or few reactions consuming N2 at these temperatures and pressures, its disappearance would not be predicted. Water production is not measurable using our existing experimental apparatus and our MS system, but water amounts based on Smith et al.’s stoichiometry are inadequate to explain observed pressure increases. Air in-leakage is not considered a reasonable possibility because the only driving force for air in-leakage is diffusion into a 40-psig system.
Other possibilities to explain the higher calculated gas quantities from the pressure data from the 80°C tests include experimental measurement differences. It is also possible that the lower temperature test (80°C compared to 120°C) took longer to come to equilibrium and resulted in pressure rises that were associated with thermal equilibrium rather than gas generation.
In summary, the coarse pressure measurements support the total gas-generation rates from the MS measurements with some indications that additional gas was generated in the 80°C tests. However, there are enough uncertainties in these coarse pressure measurements that additional experiments are recommended to confirm the higher gas-generation rates at lower temperatures. Such experiments would provide uniform temperatures throughout the system, adding gas-sampling systems and analytical tools to permit real-time monitoring of gas composition at temperature.
3.2.3.6 Effect of Temperature and Presence of Waste Organics Both temperature and the presence of waste organics have the potential to affect the production of flammable gases from BV feed. The following provides comparisons of the production rates of individual gases at different temperatures from the BV Feeds with and without cellulose and with and without waste organics. If the reaction mechanism remains constant, an increase in temperature should cause an increase in the production rate. Even though it would have been interesting and potentially valuable, we did not estimate activation energies from our temperature data because that effort is outside of the current work scope.
3.2.3.6.1 The Effect of Temperature and Waste Organics on H2 Production As Figure 3.22 shows, increasing the temperature from room temperature (22°C) to 80°C increases the H2 production rate from the BV feed with cellulose; however, increasing from 80°C to 120°C decreases the H2 production rate. The production-rate increase with the increase from 22 to 80°C would be expected. The production-rate decrease with the increase 80 to 120°C indicates that the production mechanism changes. The observed H2 production-rate changes with temperature suggest complex chemical reactions within this mixture.
As shown in Figure 3.22, the cellulose-bearing BV feed (0.005 µmol H/g/d) produced nominally 25% more H2 after 1 day than the acetate-bearing BV feed (0.0034 µmol H/g/d). After another 4 days, the production rate is nominally a factor of 2 greater for the cellulose-bearing feed. The 1-day results suggest that H2 production from acetate is relatively faster than from cellulose because of the factor of 13 greater cellulose-hydrogen content. The 5-day sample is more consistent with the differences in hydrogen content.
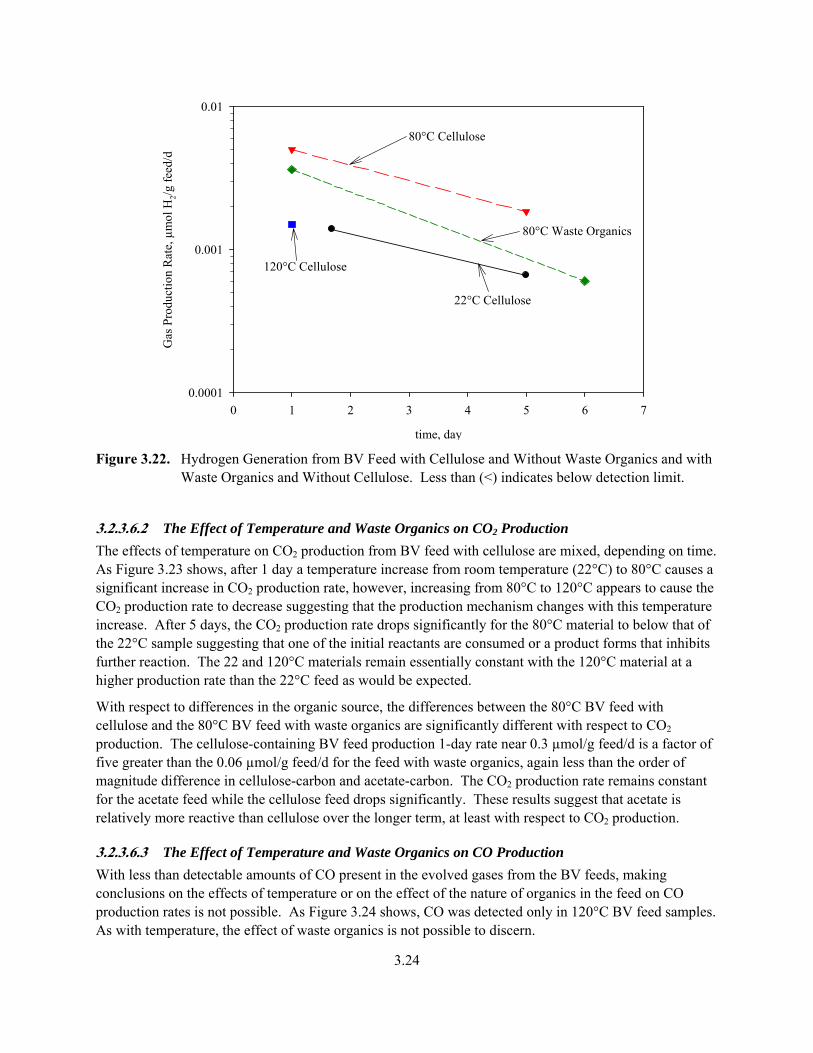
3.24
time, day
0 1 2 3 4 5 6 7
Gas
Pro
duct
ion
Rat
e, µ
mol
H2/g
feed
/d
0.0001
0.001
0.01
80°C Cellulose
22°C Cellulose
120°C Cellulose
80°C Waste Organics
Figure 3.22. Hydrogen Generation from BV Feed with Cellulose and Without Waste Organics and with
Waste Organics and Without Cellulose. Less than (<) indicates below detection limit.
3.2.3.6.2 The Effect of Temperature and Waste Organics on CO2 Production The effects of temperature on CO2 production from BV feed with cellulose are mixed, depending on time. As Figure 3.23 shows, after 1 day a temperature increase from room temperature (22°C) to 80°C causes a significant increase in CO2 production rate, however, increasing from 80°C to 120°C appears to cause the CO2 production rate to decrease suggesting that the production mechanism changes with this temperature increase. After 5 days, the CO2 production rate drops significantly for the 80°C material to below that of the 22°C sample suggesting that one of the initial reactants are consumed or a product forms that inhibits further reaction. The 22 and 120°C materials remain essentially constant with the 120°C material at a higher production rate than the 22°C feed as would be expected.
With respect to differences in the organic source, the differences between the 80°C BV feed with cellulose and the 80°C BV feed with waste organics are significantly different with respect to CO2 production. The cellulose-containing BV feed production 1-day rate near 0.3 µmol/g feed/d is a factor of five greater than the 0.06 µmol/g feed/d for the feed with waste organics, again less than the order of magnitude difference in cellulose-carbon and acetate-carbon. The CO2 production rate remains constant for the acetate feed while the cellulose feed drops significantly. These results suggest that acetate is relatively more reactive than cellulose over the longer term, at least with respect to CO2 production.
3.2.3.6.3 The Effect of Temperature and Waste Organics on CO Production With less than detectable amounts of CO present in the evolved gases from the BV feeds, making conclusions on the effects of temperature or on the effect of the nature of organics in the feed on CO production rates is not possible. As Figure 3.24 shows, CO was detected only in 120°C BV feed samples. As with temperature, the effect of waste organics is not possible to discern.
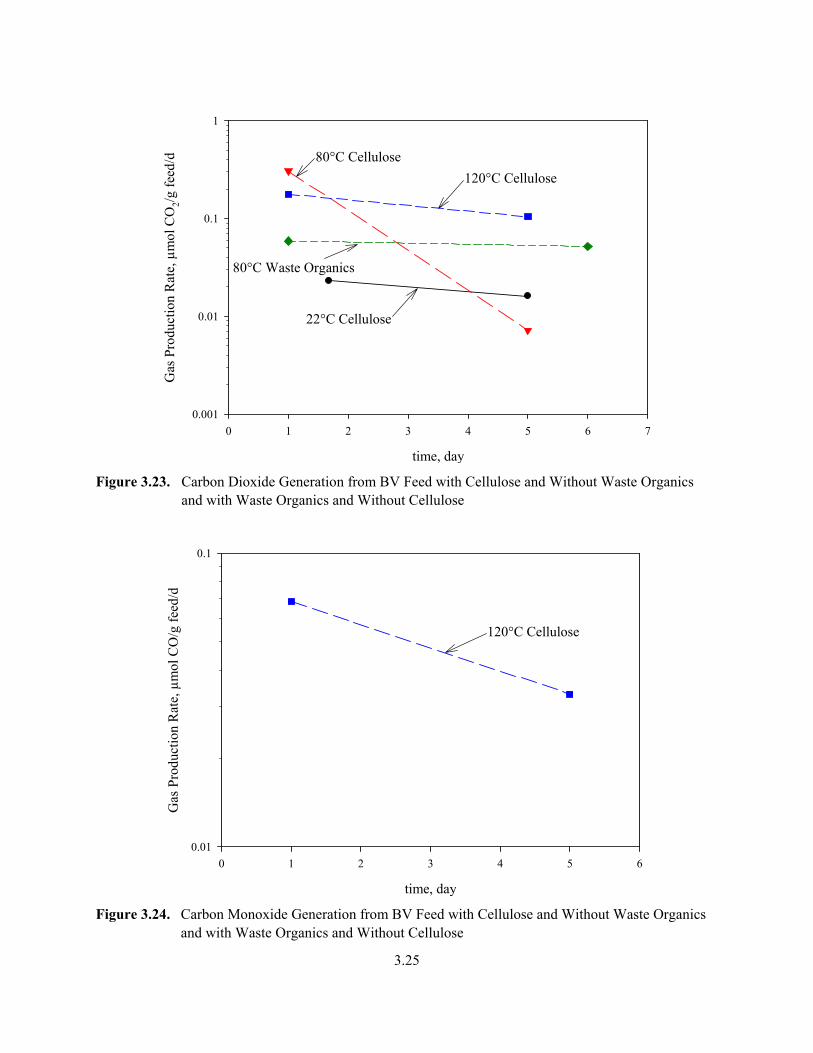
3.25
time, day
0 1 2 3 4 5 6 7
Gas
Pro
duct
ion
Rat
e, µ
mol
CO
2/g fe
ed/d
0.001
0.01
0.1
1
80°C Cellulose
22°C Cellulose
120°C Cellulose
80°C Waste Organics
Figure 3.23. Carbon Dioxide Generation from BV Feed with Cellulose and Without Waste Organics
and with Waste Organics and Without Cellulose
time, day
0 1 2 3 4 5 6
Gas
Pro
duct
ion
Rat
e, µ
mol
CO
/g fe
ed/d
0.01
0.1
120°C Cellulose
Figure 3.24. Carbon Monoxide Generation from BV Feed with Cellulose and Without Waste Organics
and with Waste Organics and Without Cellulose

3.26
3.2.3.6.4 The Effect of Temperature and Waste Organics on CH4 Production As shown in Figure 3.25, only the 120°C BV feed with cellulose produced any detectable amounts of CH4. Table 3.4 shows that the 80°C feed with waste organics produced a detectable amount of CH4 in the +5 day sample. Because of the detection limits, it can be said that increasing the temperature from 22°C and 80°C to 120°C causes an increase in the CH4 production rate.
With respect to the effects of organic, little can be said because the production rates are below detection or in the same range as detection.
3.2.3.6.5 The Effect of Temperature and Waste Organics on N2O Production With respect to temperature effects, Figure 3.26 shows that increasing the temperature causes the N2O production rate from BV feed with cellulose to increase. Although not obvious from the 1-day samples, the 5-day sample shows that increasing from 22°C to 80°C to 120°C causes the production rate to progressively increase with increasing temperature.
There is a significant difference between the two different 80°C organic-bearing feeds. Initially, the N2O production rate from the acetate-containing feed is at least a factor of 20 greater than the cellulose. After 5-days, the N2O production rate for the cellulose-containing feed has exceeded the interpolated rate for the acetate-feed. This indicates a greater initial susceptibility for acetate to reaction with nitrate or nitrite for acetate compared to cellulose with respect to N2O production. After incubating for at least 5-days, the cellulose’s reaction with nitrate and/or nitrite to produce N2O begins. This is not surprising given the polymeric nature of the cellulose and the small molecular size of acetate.
time, day
0 1 2 3 4 5 6
Gas
Pro
duct
ion
Rat
e, µ
mol
CH
4/g fe
ed/d
0.01
0.1
120°C Cellulose
Figure 3.25. Methane Generation from BV Feed with Cellulose and Without Waste Organics and with
Waste Organics and Without Cellulose. Less than (<) indicates below detection limit.

3.27
time, day
0 1 2 3 4 5 6 7
Gas
Pro
duct
ion
Rat
e, µ
mol
N2O
/g fe
ed/d
0.01
0.1
1
10
80°C Cellulose
120°C Cellulose
80°C Waste Organics
Figure 3.26. Nitrous Oxide Generation Rate from BV Feed with Cellulose and Without Waste Organics
and with Waste Organics and Without Cellulose
3.2.3.6.6 The Effect of Temperature and Waste Organics on NOx Production With respect to temperature effects, Figure 3.27 shows that at 5 days, increasing the temperature from 22°C and 80°C to 120°C increases the NOx production rate from the BV feed with cellulose. Because the room-temperature feed concentrations of NOx were less than detectable and NOx was detected only in the 5-day sample from the 80°C cellulose-feed, we cannot determine whether there was a similar temperature effect with an increase from 22 to 80°C.
There is a significant difference between the two different 80°C organic-bearing feeds. The N2O production rate from the acetate-containing feed is at least a factor of 30 greater than the cellulose. This indicates a greater susceptibility to reaction with nitrate or nitrite for acetate compared to cellulose. This is not surprising given the polymeric nature of the cellulose and the small molecular size of acetate.

3.28
time, day
0 1 2 3 4 5 6 7
Gas
Pro
duct
ion
Rat
e, µ
mol
NO
x/g fe
ed/d
0.001
0.01
0.1
1
80°C Cellulose
120°C Cellulose
80°C Waste Organics
Figure 3.27. Oxides of Nitrogen (excluding N2O) Generation Rate from BV Feed with Cellulose and
Without Waste Organics and with Waste Organics and Without Cellulose

4.1
4.0 Conclusions
In conclusion, our TG/DTA/FTIR studies and isothermal BV feed studies to determine the effect of cellulose on the production of flammable gases from BV feeds at dryer temperatures or at dryer process upset conditions found that
• CO2, H2O, N2O, NO, and NO2 are produced from cellulose denitration of BV feed.
• CO2, CO, H2, CH4, and N2O are products of low-temperature (≤ 120°C) reactions between components of BV feed and cellulose and waste organics (acetate).
• The H2 production rates after 1 day range from 0.001 µmol/g feed/d for the room-temperature BV feed with cellulose to 0.005 µmol/g feed/d for 80°C BV feed with cellulose alone; 80°C BV feed with waste organics produced a comparable 0.004 µmol/g/d.
• Increasing the temperature has a mixed effect on H2 production with the highest production rate at 80°C and with room temperature and 120°C having similar production rates.
o Chemical mechanisms for H2 production change between 80 and 120°C.
• For the BV feeds with cellulose, only the 120°C BV feed produced observable amounts of CH4 at a production rate of 0.01 µmol/g/d; the production rate for room temperature and 80°C BV feed was <0.003 µmol/g/d. The +5-day sample of BV feed with acetate was the only other feed to produce measurable CH4 at a rate of 0.001 µmol/g/d.
• The initial water content does not affect the major cellulose denitration reaction that is TG-observable near 300°C.
• The C:N cellulose-to-nitrate ratio has little effect on the nature of the cellulose reaction with nitrate or nitrite.
• Acetate appears to be more reactive in the early stages of a reaction than cellulose while increased reactivity occurs for cellulose with longer times.
• The coarse pressure measurements support the total gas-generation rates from the MS measurements with some indications that additional gas was generated in the 80°C tests. However, there are enough uncertainties in these coarse pressure measurements that additional experiments are recommended to confirm the higher gas-generation rates at lower temperatures.

5.1
5.0 References
Alves SS, and JL Figueiredo. 1989. “Kinetics of Cellulose Pyrolysis Modelled by Three Consecutive First-Order Reactions.” Journal of Analytical and Applied Pyrolysis 17:37–46.
Ashby EC, A Annis, EK Barefield, D Boatright, F Doctorovich, CL Liotta, HM Neumann, A Konda, CF Yao, and K Zhang. 1994. Synthetic Waste Chemical Mechanism Studies. WHC-EP-0823, Westinghouse Hanford Company, Richland, Washington.
Barefield EK, D Boatright, A Deshpande, F Doctorovich, CL Liotta, HM Neumann, and S Seymore. 1996. Mechanisms of Gas Generation from Simulated SY Tank Farm Wastes: FY 1995 Progress Report. PNNL-11247, Pacific Northwest National Laboratory, Richland, Washington.
Barefield EK, D Boatright, A Deshpande, F Doctorovich, CL Liotta, HM Neumann, and S Seymore. 1995. Mechanisms of Gas Generation from Simulated SY Tank Farm Wastes: FY 1994 Progress Report. PNNL-11247, Pacific Northwest National Laboratory, Richland, Washington.
Bradbury AG, Y Sakai, and F Shafizadeh. 1979. “A Kinetic Model for Pyrolysis of Cellulose.” Journal of Applied Polymer Science 23:3271–3280.
Bryan SA, CM King, LR Pederson, SV Forbes, and RL Sell. 1996. Gas Generation from Tank 241-SY-103 Waste. PNNL-10978, Pacific Northwest National Laboratory, Richland, Washington.
Bryan SA, and CM King. 1998. Thermal and Radiolytic Gas Generation from Tank 241-A-101 Waste: Status Report. TWS98.78, Pacific Northwest National Laboratory, Richland, Washington.
Bryan SA, and LR Pederson. 1995. Thermal and Combined Thermal and Radiolytic Reactions Involving Nitrous Oxide, Hydrogen, and Nitrogen in the Gas Phase; Comparison of Gas from Tank 241-A-101 Waste: Status Report. Pacific Northwest National Laboratory, Richland, Washington.
Fisher T, M Hajaligol, B Waymack, and D Kellogg. 2002. “Pyrolysis behavior and kinetics of biomass derived materials.” Journal of Analytical and Applied Pyrolysis 62:331–349.
Franklin WE. 1979. “Direct Pyrolysis of Cellulose and Cellulose Derivatives in a Mass Spectrometer with a Data System.” Analytical Chemistry 51(7):992-996.
King CM, and SA Bryan. 1999. Thermal and Radiolytic Gas Generation Tests on Material from Tank 241-U-103, 241-AW-101, 241-S-106, and 241-S-102: Status Report. PNNL-12181, Pacific Northwest National Laboratory, Richland, Washington.
King CM, LR Pederson, and SA Bryan. 1997. Thermal and Radiolytic Gas Generation from Tank 241-S-102 Waste. PNNL-11600, Pacific Northwest National Laboratory, Richland, Washington.
Pederson LR, and SA Bryan. 1996. Status and Integration of Studies of Gas Generation in Hanford Wastes. PNNL-11297, Pacific Northwest National Laboratory, Richland, Washington.
Pouwels AD, GB Eijkel, and JJ Boon. 1989. “Curie-Point Pyrolysis-Capillary Gas Chromatography-High Resolution Mass Spectrometry of Microcrystalline Cellulose.” Journal of Analytical and Applied Pyrolysis 14:237–280.
Scheele RD, TD Cooper, SA Jones, JR Ewalt, JA Compton, DS Trent, MK Edwards, AE Kozelisky, PA Scott, MJ Minette. 2005. Thermal Stability Studies of Candidate Decontamination Agents for Hanford’s

5.2
Plutonium Finishing Plant Plutonium-Contaminated Gloveboxes. PNNL-15410, Pacific Northwest National Laboratory, Richland, Washington.
Scheele RD, BK McNamara, LM Bagaasen, SJ Bos, AE Kozelisky, and PK Berry. 2008. Evaluation of Exothermic Reactions from Bulk-Vitrification Melter Feeds Containing Cellulose. PNNL-16677, Pacific Northwest National Laboratory, Richland, Washington.
Shafizadeh F, and YL Fu. 1973. “Pyrolysis of cellulose.” Carbohydrate Research 29(1):113–122.
Simmons GM, and M Gentry. 1986. “Kinetic Formation of CO, CO2, H2, and Light Hydrocarbon Gases from Cellulose Pyrolysis.” Journal of Analytical and Applied Pyrolysis 10:129-138.
Smith HD, EO Jones, AJ Schmidt, AH Zacher, MD Brown, MR Elmore, and SR Gano. 1999. Denitration of High Nitrate Salts Using Reductants. PNNL-12144, Pacific Northwest National Laboratory, Richland, Washington.
Soudais Y, L Moga, J Blazek, and F Lemort. 2007. “Coupled DTA-DTA-FT-IR investigation of pyrolytic decomposition of EVA, PVC and cellulose.” Journal of Analytical and Applied Pyrolysis 78:46–57.
Williams PT, and S Besler. 1996. “The Influence of Temperature and Heating Rate on the Slow Pyrolysis of Biomass.” Renewable Energy 7(3):233–250.
Wu KT, and E Zavarin. 1986. “Thermal Analysis of Mixtures of Nitrates and Lignocellulosic Materials.” Thermochimica Acta 107:131–148.
Yang H, R Yan, H Chen, DH Lee, and C Zheng. 2007. “Characteristics of hemicellulose, cellulose, and Lignin Pyrolysis.” Fuel 86:1781–1788.

PNNL-17491
Distr. 1
Distribution No. of Copies OFFSITE
No. of Copies ONSITE
2 AMEC K. S. Witwer B2-67 B. Campbell B2-67 ONSITE 9 CH2M HILL P.K. Brockman H6-03 J.E. Meacham R2-58 F.R. Miera H6-03 R.E. Raymond R2-58 D. Shuford S7-67 J.P. Harris S7-90 J.E. Van Beek (3) S7-67
4 U.S. Department of Energy/Office of River Protection
B. J. Harp H6-60 D. H. Irby H6-60 B. M. Mauss H6-60 J-S Shuen H6-60 11 Pacific Northwest National Laboratory L. M. Bagaasen (5) K6-28 T.M. Brouns K9-69 J. Matyas K6-24 B.K. McNamara P7-25 R.D. Scheele (2) P7-25 M. J. Schweiger K6-24