Embed Size (px)
Citation preview

Thermalevolutionand shale gaspotential estimationof theWealdenand Posidonia Shale in NW-Germanyand the Netherlands: a 3D basinmodellingstudyB. Bruns,* R. Littke,* M. Gasparik,* J.-D. van Wees†,‡ and S. Nelskamp†
*Institute for Geology and Geochemistry of Petroleum and Coal, Energy and Mineral Resources (EMR),RWTH Aachen University, Aachen, Germany†Netherlands Institute for Applied Geosciences TNO, Utrecht, the Netherlands‡Department of Earth Sciences, Utrecht University, Utrecht, the Netherlands
ABSTRACT
Sedimentary basins in NW-Germany and the Netherlands represent potential targets for shale gas
exploration in Europe due to the presence of Cretaceous (Wealden) and Jurassic (Posidonia) marl-
stones/shales as well as various Carboniferous black shales. In order to assess the regional shale gas
prospectivity of this area, a 3D high-resolution petroleum system model has been compiled and used
to reconstruct the source-rock maturation based on calibrated burial and thermal histories. Different
basal heat flow scenarios and accordingly, different high-resolution scenarios of erosional amount
distribution were constructed, incorporating all major uplift events that affected the study area. The
model delivers an independent 3D reappraisal of the tectonic and thermal history that controlled the
differential geodynamic evolution and provides a high-resolution image of the maturity distribution
and evolution throughout the study area and the different basins. Pressure, temperature and TOC-
dependent gas storage capacity and gas contents of the Posidonia Shale and Wealden were calculated
based on experimentally derived Langmuir sorption parameters and newly compiled source-rock
thickness maps indicating shale gas potential of the Lower Saxony Basin, southern Gifhorn Trough
and West Netherlands Basin.
INTRODUCTION
Sedimentary basins in NW-Germany and the Nether-
lands represent potential targets for shale gas/shale oil
exploration due to the presence of Lower Cretaceous
lacustrine (Wealden; Rippen et al., 2013) and Jurassic
marine (Posidonia Shale) organic-rich marlstones and
shales as well as various Carboniferous black shales (Lit-
tke et al., 2011; Andruleit et al., 2012; Uffmann et al.,2012). The Lower Jurassic Posidonia Shale is the most
important source rock for conventional oil exploration in
this area (Leythaeuser et al., 1988; Wehner, 1997; Blu-
menstein et al., 2008) but is also one of the most promis-
ing candidates for unconventional shale gas/oil
exploration (Andruleit et al., 2012) besides the Lower
Cretaceous Wealden Shale.
Unlike in conventional reservoirs in which gas is stored
primarily as compressed (‘free’) gas in the intragranular
pore space and fractures, a significant proportion of gas in
shales can be stored as ‘sorbed’ gas. The sorption of
hydrocarbon gas (mostly methane) in shales provides gas
storage capacity in addition to the ‘free gas’ capacity in
the pore system. The methane sorption is considered to
take place predominantly within the microporous organic
matter (kerogen) and is controlled by the Total Organic
Carbon (TOC), kerogen type, maturity, water saturation
and to some extent by the inorganic constituents (clay
minerals).
Numerous basin modelling studies have been per-
formed in that area, comprising 1D, 2D and 3D model-
ling approaches (e.g. Petmecky et al., 1999; Senglaub
et al., 2005; Uffmann et al., 2010; Nelskamp, 2011). In
these studies, the tectonic evolution as well as source-rock
maturation has been investigated partly in order to ana-
lyse the conventional petroleum systems. Whereas 3D
modelling studies covering the whole area have been lack-
ing a detailed resolution sufficient enough for exploration
and prospect evaluation, 1D and 2D models are generally
missing important influence factors on pressure, tempera-
ture and hydrocarbon migration that can only be accu-
rately addressed in three dimensions (Bruns et al., 2013).Quantification of the total storage capacity, including
sorbed gas and free gas is a prerequisite for estimations
of resource potential and technically recoverable
amounts of gas at given reservoir conditions. In early
exploration phases, 3D basin modelling with integrated
sorption modules together with the simulation of the
burial history, gas generation/expulsion and consider-
ation of organic matter-hosted porosity is a valuable tool
Correspondence: R. Littke, Energy and Mineral ResourcesGroup, Institute of Geology and Geochemistry of Petroleumand Coal, RWTH Aachen University, Lochnerstr. 4-20, 52056Aachen, Germany. E-mail: [email protected]
© 2014 The AuthorsBasin Research © 2014 John Wiley & Sons Ltd, European Association of Geoscientists & Engineers and International Association of Sedimentologists2
Basin Research (2016) 28, 2–33, doi: 10.1111/bre.12096
EAGE

to reduce the exploration risk. In addition, an accurate
reconstruction of the source-rock maturation through
geologic time and within the different basins is crucial
for the assessment of petroleum generation and storage.
This study was performed in order to improve the
understanding of shale gas potential in the study area by
linking experimental petrophysical work addressing the
source-rock sorption capacity with high-resolution 3D
basin modelling addressing the reconstruction of the tec-
tonic and thermal evolution. Therefore, a 3D basin model
of the present-day configuration of NW-Germany and
the Netherlands was compiled and used as a base for for-
ward simulation of the basin evolution. The burial as well
as the erosion histories have been calibrated and con-
strained by well data at 731 locations. Being based on dif-
ferent basal heat flow scenarios, this study provides
different high-resolution scenarios of erosional amount
distribution, incorporating all major uplift events that
affected the study area. The different heat flow and ero-
sion scenarios in this model provide further constraints
on the maturity evolution of the different basins in the
study area. Thus, based on the thermally calibrated geo-
dynamic evolution, petroleum generation, migration and
accumulation in the Posidonia Shale and Wealden, the
evolution of gas storage capacity and sorbed gas masses
have been modelled using refined kinetic data and experi-
mentally derived Langmuir sorption parameters deliver-
ing important qualitative information on the regional
distribution of shale gas potential.
GEODYNAMIC EVOLUTION
The differentiation between basins, highs and platforms in
the study area (Fig. 1) developed in response to global
plate movement and responding changes in lithosphere
structure and stress field (Cloetingh & Ziegler, 2007;
Maystrenko et al., 2008). The main tectonic events that
affected the Netherlands and NW-Germany comprise the
Caledonian and Variscan orogenies due to amalgamation
of Pangaea during the Paleozoic, Mesozoic rifting accom-
panying the breakup of Pangaea, the Alpine orogeny
induced by the collision of Europe and Africa during the
Upper Cretaceous/Lower Tertiary and the Oligocene to
recent rifting of the Rhine Graben system (Senglaub
et al., 2006; de Jager, 2007). As a result, multiple phases
of uplift and basin inversion occurred in different parts of
the study area. The following description will focus on the
major tectonic events that induced uplift and basin inver-
sion. A more detailed summary of tectonic processes and
their influence on the structural evolution of NW-Ger-
many has already been provided in Bruns et al. (2013).During the Middle to Upper Devonian the conver-
gence of Gondwana and Laurussia started, resulting in
full-scale Himalayan-type collision forming the Variscan
orogeny during the Visean (Franke, 2000). The Variscan
fold-and-thrust belt propagated northwards reaching its
final position just south of the Netherlands (Oncken
et al., 2000). Today the Variscan Deformation Front
strikes approximately E-W through Belgium and SW-NE
into Germany. Crustal shortening and inversion ceased
during the Upper Pennsylvanian (Ziegler, 1990). Wrench
tectonics created several structural features, e.g. the
Campine Basin and Roer Valley Graben (Duin et al.,2006) and induced erosion of Upper Carboniferous
deposits in different areas. The Hunze Formation (West-
phalian D – Stephanian) was eroded in most parts of the
Netherlands except the Campine Basin (future Zeeland
Platform – West Netherlands Basin). In NW-Germany,
Stephanian strata are unconformably overlying partly
Fig. 1. Structural elements and Upper Cretaceous tectonic evolution (modified from Doornenbal & Stevenson, 2010; van Balen
et al., 2005).
© 2014 The AuthorsBasin Research © 2014 John Wiley & Sons Ltd, European Association of Geoscientists & Engineers and International Association of Sedimentologists 3
Shale gas in the Wealden and Posidonia Shale

eroded Westphalian C-D deposits. In the study area,
uplift was most dominant in the M€unsterland Basin and
eastern Lower Saxony Basin, the central part of the West
Netherlands Basin, the Zandvoort Ridge, and the Fries-
land Platform (Fig. 1; Littke et al., 1994; Nelskamp,
2011).
Rifting related to the Mesozoic breakup of Pangaea and
opening of the Atlantic induced transtensional develop-
ment of sub-basins including the Lower Saxony Basin,
the Roer Valley Graben, West Netherlands, Central
Netherlands, Broad Fourteens, and Vlieland basins dur-
ing the Middle Jurassic to Lower Cretaceous (Upper
Kimmerian) rifting. Simultaneously, adjacent platforms
were uplifted and deeply truncated resulting in the widely
recognized Upper Kimmerian Unconformity (Lower
Cretaceous) which was accompanied by a regional sea-
level low-stand (de Jager, 2007). This uplift affected, e.g.
the Pompeckj Basin and M€unsterland Basin. Whereas in
NW-Germany quite homogeneous sediment thicknesses
can be observed in the areas of the Pompeckj Basin and
Lower Saxony Basin, basin differentiation in the Nether-
lands already started during the Upper Triassic indicated
by increased sediment thicknesses in the area of the
basins, especially in the Central and West Netherlands
basins and decreased thicknesses in the surrounding highs
(Geluk, 2007).
During the Upper Cretaceous the convergence of
Africa and Europe, closing the Tethys system of oceanic
basins, induced the gradual development of the Alpine
orogeny. Most authors (e.g. Ziegler et al., 1995; Marotta
et al., 2001; Krzywiec, 2006) have interpreted the Subh-
ercynian and Laramide compressional/transpressional
inversion of Mesozoic extensional/transtensional basins
as a consequence of the collision of the Alpine-Carpa-
thian Orogeny with Europe’s southern margin in a clas-
sic orogenic foreland collision model. Kley & Voigt
(2008), however, have presented an alternative hypothe-
sis, in which the Upper Cretaceous kinematic history of
the two regions does not seem to be compatible. The
location of the Adria Plate and evolving Alpine chain in
recent plate reconstructions (e.g. Stampfli & Borel,
2004) indicate that the distance to central Europe was
too far, incorporating an oceanic basin in between. They
proposed that this event only reflects the onset of the
Africa-Iberia-Europe convergence as the Alpine collision
with southern Europe did not commence until Paleo-
cene or Eocene times. Instead, basin inversion during
the Cretaceous was caused by the West-Central Eur-
ope’s thin lithosphere being pinched between the East
European Platform and Africa (Doornenbal & Steven-
son, 2010). East of the Netherlands (Polish Trough,
North German and Lower Saxony basins) the inversion
ceased during the Upper Cretaceous to earliest Tertiary.
In the Netherlands (Broad Fourteens and West Nether-
lands basins), it continued until Upper Oligocene to
Lower Miocene times (van Hoorn, 1987; Ziegler, 1990;
Ziegler et al., 1995; de Lugt et al., 2003; de Jager, 2007)which might be related to a delayed mechanical coupling
of the collisional system towards the west, i.e. between
the Pyrenean Orogeny and central Europe (Doornenbal
& Stevenson, 2010). Despite the difference in timing of
this erosion event between Germany and the Nether-
lands, it is summarized and named ‘Subhercynian’ in
the following.
METHODS
The emphasis of this study was to build a 3D basin
model of the study area in order to test different burial
history scenarios. This procedure leads to a best-fit set-
ting which in turn can be used for creating scenarios of
petroleum generation, adsorption and accumulation con-
strained by the tectonic evolution and source-rock matu-
ration. Numerical modelling was performed using the
PETROMOD� software suite v.2012.1 (Schlumberger
AaTC, Aachen, Germany). Numerical basin modelling
provides an integrated approach to understand and
reconstruct significant geological developments occur-
ring during the basin evolution and can be understood
as a dynamic forward modelling approach of these geo-
logical processes in sedimentary basins over geological
time periods. The simulation starts with the deposition
of the oldest layer and continues until the present-day
geometry is reached. During simulation various geologi-
cal, geochemical and petrophysical processes are calcu-
lated and updated at each defined time step and for each
model grid cell. This simulation covers, i.e. (de-)com-
paction, pore pressure calculation as well as temperature
and heat flow analysis based on the evolution of thermal
maturity parameters (e.g. vitrinite reflectance, biomar-
kers), modelling of hydrocarbon generation and accumu-
lation, fluid migration and petroleum compositional
analysis (Hantschel & Kauerauf, 2009).
Basin geometry reconstruction
The reconstruction of the present-day geometry of a
joint basin model of the Dutch and NW-German area
has been accomplished by merging different depth hori-
zon interpretations into a single 3D interpretation
(Table 1). Additionally, an underlying basement layer
with an average thickness of 10 000 m and a base depth
of 17 000 m has been added. A varying vertical pseudo-
resolution or maximum cell thickness (up to 400 m) has
been applied to the model, which is particularly impor-
tant when modelling transfer of effective stress, hydro-
carbon migration, etc. from one cell to another. The
model consists of 23 different stratigraphic layers
excluding the basement layer, covering a present-day
depth interval of up to 12 km from top to bottom. The
model comprises an area of 74 660 km2 with a lateral
extent up to 476 9 255 km and an overall grid cell size
of 1 9 1 km (Fig. 2). The combination of horizontal
and vertical resolution as well as study area size sums
up to a total number of ca. 8 Mio. grid cells.
© 2014 The AuthorsBasin Research © 2014 John Wiley & Sons Ltd, European Association of Geoscientists & Engineers and International Association of Sedimentologists4
B. Bruns et al.

Depositional (palaeo) layer thicknesses have been cal-
culated based on porosity controlled backstripping of
present-day thicknesses. Calculated present-day thick-
nesses based on backstripping are initially not identical
with the given present-day thicknesses. These thickness
differences, however, assist in an improved estimation of
the depositional layer thicknesses in the next simulation
runs. During this optimization procedure, multiple for-
ward simulations are combined and calibrated against the
present-day basin geometry until a geometry match has
been realized (Hantschel & Kauerauf, 2009). In order to
achieve a sufficient match with present-day layer thick-
nesses and applied erosion amounts, a number of four
consecutive simulation runs needed to be applied.
Lithology/Facies
For the different stratigraphic layers included in the
basin model, lithological information and lateral facies
distribution need to be assigned. This dataset is based
on the palaeogeographic map compilations of Ziegler
(1990), Gerling et al. (1999a) and Doornenbal & Steven-
son (2010). Lithologies in numerical basin modelling
(PETROMOD�) are defined by a number of petrophysical
properties. This includes porosity vs. depth, permeabil-
ity vs. porosity, chemical compaction parameters, seal
properties, fracture limits, geomechanical behaviour,
thermal conductivity vs. temperature, radiogenic heat
production and heat capacity vs. temperature. A number
of user-defined lithologies have been created by mixing
of the standard lithologies in relation to the stratigraphic
descriptions and map compilations. Above mentioned
lithological properties have been automatically assigned
according to the defined rock mix. Table 2 illustrates
the different stratigraphic units and their depositional
timing as well as the petrophysical properties of the
user-defined lithologies applied in this model.
Source-rock properties and kinetics
Stratigraphic framework
Four different stratigraphic units have source-rock
properties (Table 3). Source rocks of economic impor-
tance are Carboniferous coals and black shales as well as
Jurassic (Toarcian/Posidonia Shale) and Cretaceous
(Berriasian/Wealden) marlstones/shales. For the sake of
completeness we also included the ‘Kupferschiefer’
Table 1. Source, resolution and applied areas of the different
stratigraphic units included in the 3D model
Stratigraphic
units Sources
Initial
resolution
(m) Area
Surface
topography
GEBCO Digital
Atlas (IOC,
IHO, BODC
2003)
4000 the Netherlands
and Germany
Mesozoic and
Cenozoic (incl.
Permian)
NLOG
(www.nlog.nl,
v. 01/2012)
250 the Netherlands
Geotectonic
Atlas of NW-
Germany
(Baldschuhn
et al. 1996)
150 Germany
Staßfurt
carbonate,
Permo-
Carboniferous
volcanics,
sedimentary
Rotliegend
Maystrenko
et al. (2010)4000 the Netherlands
and Germany
Upper
Carboniferous
Gerling et al.(1999a,b)
2000 the Netherlands
and Germany
018 000
12 000
6000
0
3200
3300
3400
3500
3600 5900
5800
57000
Quaternary-NeogenePaleogene
Cretaceous
Jurassic
Triassic
Permian
Upper Carboniferous
6000
12 000
18 0000
400
300
200
200
200
100
100
100
100
00
0
Fig. 2. View into the 3D basin model from southwest illustrating the present-day layer geometry (basement excluded, yellow arrow
points to the north, vertical scale in meter, top horizontal scale in Gauss-Kr€uger (Zone 3) coordinates, bottom horizontal scale in km).
© 2014 The AuthorsBasin Research © 2014 John Wiley & Sons Ltd, European Association of Geoscientists & Engineers and International Association of Sedimentologists 5
Shale gas in the Wealden and Posidonia Shale

Table
2.Stratigraphicageassignmentandpetrophysicalproperties
oftheuser-defined
lithologies
StratigraphicNom
enclature
Depositional
Age
[Ma]
Lithologies
Thermal
Conductivity
at20°C
/300°C
[W/(m
*K)]
RadiogenicElements
HeatCapacity
at20°C
/300°C
[kcal/(kg*K
)]
MechanicalProperties
U [ppm]
Th
[ppm]
K[%
]
Density
[kg/m^3]
Initial
Porosity[%
]
Athy’sfactor
k
[km-1]
Quaternary–Neogene
0–23
Sandstone(clayrich)
3.35/2.43
1.5
5.1
3.6
0.2/0.29
2760
400.32
Paleogene
23–65
Sandstone(clayrich)
3.35/2.43
1.5
5.1
3.6
0.2/0.29
2760
400.32
SubhercynianUplift
65–89
UpperCretaceous
89–99
Lim
estone(Chalk),Marl,Shale
(organiclean,silty)
2.38/2.05
2.25
3.8
1.19
0.2/0.29
2690
620.73
Low
erCretaceous
99–137.5
Sandstone,Shale,Siltstone
(organiclean),Lim
estone(shaly)
2.24/2.00
2.37
6.6
1.57
0.2/0.29
2716
550.56
Low
erCretaceous–Wealden
137.5–142
Shale(organicrich),Marl,
Lim
estone
1.41/1.67
4.55
10.75
2.59
0.21/0.3
2617
670.78
UpperJurassic–Malmian
142–147
Shale(organicrich),Marl,
Lim
estone
1.41/1.67
4.55
10.75
2.59
0.21/0.3
2617
670.78
Kim
merianUplift
147–161
MiddleJurassic–Dogger
161–177
Sandstone(clayrich)
3.35/2.44
1.5
5.1
3.6
0.2/0.29
2760
400.32
Low
erJurassic–Liassic–
PosidoniaShale
177–179
Marl,Lim
estone(m
icrite)
1.44/1.68
10.5
7.5
1.75
0.21/0.3
2615
590.67
Low
erJurassic–Liassic
179–200
Shale(organicrich,typical)
1.25/1.61
515
2.8
0.21/0.3
2600
700.83
UpperTriassic–Keuper
200–235
Shale,Marl,Gypsum,Anhydrite,
Sandstone(clayrich)
2.34/2.03
2.52
7.56
2.18
0.2/0.29
2695
490.55
MiddleTriassic–Muschelkalk
235–244
Lim
estone(shaly),Shale,
Sandstone,Lim
eEvap
2.13/1.95
2.17
5.9
1.47
0.18/0.26
2446
480.51
Low
erTriassic–Buntsandstein
244–251
Sandstone,Shale(organiclean),
Siltstone(organiclean)
3.55/2.51
1.49
4.08
1.34
0.2/0.29
2719
440.36
UpperPermian–Zechstein
251–256
Salt
6.50/3.66
0.02
0.01
0.1
0.2/0.29
2740
1Not
compactable
UpperPermian–Zechstein
Carbonate
256–257.9
Lim
estone(ooidgrainstone),
Lim
estone(organicrich),
Lim
estone(shaly),Lim
estone
(micrite)
2.75/2.19
1.75
1.52
0.33
0.2/0.28
2729
420.24
UpperPermian–Kupferschiefer
257.9–258
Shale(organicrich,typical)
1.25/1.61
515
2.8
0.21/0.3
2600
700.83
Low
erPermian–Rotliegend
258–277
Sandstone,Conglom
erate
3.01/2.30
2.08
5.3
1.74
0.2/0.28
2710
350.3
Low
erPermian–Permo–
CarboniferousVolcanics
277–285
Basalt(weathered)
2.01/1.94
0.9
2.7
0.8
0.19/0.27
2870
15Not
compactable
UpperCarboniferous–
Stephanian
285–290
Sandstone,Siltstone(organiclean),
Shale
3.17/2.36
1.68
4.65
1.38
0.22/0.3
2718
470.4
VariscanUplift
295–290
(continued)
© 2014 The AuthorsBasin Research © 2014 John Wiley & Sons Ltd, European Association of Geoscientists & Engineers and International Association of Sedimentologists6
B. Bruns et al.

(base of Zechstein1 cycle) and ‘Stinkkalk-Stinkschiefer’
(basinal equivalents to the Staßfurt Carbonate/Zechstein
2) which play a rather inferior role in this region, but
are of great importance in the northeastern Central
European Basin System (Resak et al., 2008).The Upper Carboniferous Westphalian is marked by
thick cyclothemic layers of coal, sand-, silt- and claystones
deposited in a fluvial and deltaic environment on a coastal
plain and in a tropical climate. Numerous coal seams as
well as large amounts of dispersed organic matter are
characteristic for Westphalian deposits (Scheidt & Littke,
1989). This Upper Carboniferous (Pennsylvanian) coal-
bearing sequence is known to act as major source rock for
gas in the study area (Littke et al., 1995).During the Upper Permian Zechstein five depositional
cycles (Z1–Z5) can be distinguished, caused by repeated
cut-off and reconnection to the Palaeotethys. Each is rep-
resented by marine clays, overlain by carbonates and
finally salt. The stratigraphic boundaries of the Zechstein
era are marked by the Kupferschiefer as the first basin-
wide marine layer and the Zechstein Upper Claystone
Formation (ZEUC) (Nelskamp, 2011). Within the Zech-
stein, two layers have minor source-rock potential, the Z1
Kupferschiefer and the Z2 Stinkkalk. The salt acts as
important regional seal for hydrocarbon gas within Rot-
liegend sandstones and Zechstein carbonates (Glennie,
1986).
In the Upper Triassic Rhaetian, global sea-level rise re-
established epicontinental marine conditions in NW-Eur-
ope. The accumulated sedimentary succession of the Al-
tena Group (Sleen, Aalburg, Posidonia Shale,
Werkendam, Brabant Formations) in the Netherlands
and Liassic – Dogger Group in Germany comprises
marls, carbonates, sands, and shales and culminated in the
deposition of the organic-rich Toarcian black shales (Posi-
donia Shale).
During the uppermost Jurassic and lowermost Creta-
ceous (Wealden), the depositional conditions in the Ger-
man part of the Lower Saxony Basin were predominantly
shallow marine with some terrestrial influx (Petmecky
et al., 1999). In the Aptian marine sedimentation gradu-
ally overstepped the basin margins inundating the previ-
ous highs and resulting in an overall deposition of dark
coloured clastic sediments with increased concentrations
of organic matter (Littke et al., 1998).Table2(continued)
StratigraphicNom
enclature
Depositional
Age
[Ma]
Lithologies
Thermal
Conductivity
at20°C
/300°C
[W/(m
*K)]
RadiogenicElements
HeatCapacity
at20°C
/300°C
[kcal/(kg*K
)]
MechanicalProperties
U [ppm]
Th
[ppm]
K[%
]
Density
[kg/m^3]
Initial
Porosity[%
]
Athy’sfactor
k
[km-1]
UpperCarboniferous–
WestphalianD
295–309
Sandstone,Shale(organicrich),
Coal,Siltstone(organicrich)
3.00/2.29
1.98
5.06
1.58
0.22/0.3
2642
490.42
UpperCarboniferous–
WestphalianC
309–312
Sandstone,Shale(organicrich),
Coal,Siltstone(organicrich)
3.00/2.29
1.98
5.06
1.58
0.22/0.3
2642
490.42
UpperCarboniferous–
WestphalianA+B
312–316
Sandstone,Shale(organicrich),
Coal,Siltstone(organicrich)
3.00/2.29
2.71
6.76
1.88
0.22/0.31
2620
550.52
UpperCarboniferous–
Nam
urian
316–326
Sandstone,Siltstone(organicrich),
Shale
2.79/2.21
1.65
4.15
1.14
0.22/0.3
2714
500.44
For
layerswithlaterallithofaciesdifferentiation,themainlithologieshavebeenlisted.
Table 3. Assigned source-rock properties
Stratigraphic
unit
Initial total
organic
carbon (%)
Initial hydrogen
index (mgHC g�1 TOC)
Posidonia Shale 12 700
Wealden 2 550
Westphalian 2 250
Kupferschiefer &
Stinkkalk-
Stinkschiefer
0.3 150
© 2014 The AuthorsBasin Research © 2014 John Wiley & Sons Ltd, European Association of Geoscientists & Engineers and International Association of Sedimentologists 7
Shale gas in the Wealden and Posidonia Shale

Kinetic data
For these source-rock units, hydrocarbon generation
was simulated using phase-predictive compositional
kinetic models (di Primio & Horsfield, 2006), consisting
of a 14 component scheme and including secondary
cracking (these types of compositional kinetic models
are termed PhaseKinetics). The PhaseKinetics approach
links source-rock organic facies to the petroleum type
it generates. Using a combination of open- and closed-
system pyrolysis techniques, bulk kinetic and composi-
tional information is acquired; gas compositions are
tuned based on a GOR-gas wetness correlation from
natural petroleum fluids; corrected compositions are
integrated into a 14-component compositional kinetic
model (C1, C2, C3, i-C4, n-C4, i-C5, n-C5, C6, C7–C15, C16–C25, C26–C35, C36–C45, C46–C55 and C55+)
which allows the prediction of petroleum properties.
The components with more than six carbon atoms can
be subjected to secondary cracking, with the assump-
tion that the only compound generated is methane
(Pepper & Corvi, 1995a,b). The calculation of petro-
leum phase behaviour under the subsurface conditions
of hydrocarbon migration and entrapment is possible
using these methods in combination with modern basin
modelling software.
Source-rock thickness
A recent depth and distribution interpretation of the
Lower Jurassic (Liassic) Posidonia Shale Formation has
been included which is not yet available in the public
domain. For the Posidonia Shale Formation, a constant
thickness of 30 m has been used.
Based on the cross-sections provided by Baldschuhn
et al. (1996) and well data provided by TNO, a thickness
map of the Wealden in Germany and the equivalent
Dutch Coevorden Formation has been compiled. Based
on 2140 data points in correlation with the lateral thick-
ness distribution of the Latest Jurassic (Baldschuhn et al.,1996) this map presents the newest re-appraisal for thick-
ness of the Wealden (Fig. 3).
Sorption
Input parameters for methane sorption on the PosidoniaShale
Gasparik et al. (2014) recently reported experimental
high-pressure/high-temperature methane sorption data
for Posidonia Shale samples from the studied area of the
Hils Syncline, NW-Germany. In their work, excess
sorption isotherms at pressures up to 25 MPa and tem-
peratures up to 150°C have been measured on a suite of
Posidonia Shale samples with varying maturities. In
addition, unpublished sorption data of the Wealden has
been added to this study. The excess sorption isotherms
were parameterized using a three-parameter (nL, pL,qads) excess sorption function based on the Langmuir
function for the absolute sorption (Gasparik et al.,2014). The sorption parameters for the ‘HAD-119’ sam-
ple (VRr = 1.5%) presented in Table 4 were used in
this study. The sorption parameters – Langmuir volume
(vL) and Langmuir pressure (pL) – were used in the
PETROMOD� simulation. The TOC content of the sam-
ple is needed to scale the isotherm to the amount of
kerogen available. The desorption energy parameter
(Edes) describes the temperature dependence of sorption
Fig. 3. Present-day Wealden thickness map (based on Baldschuhn et al., 1996; NLOG).
© 2014 The AuthorsBasin Research © 2014 John Wiley & Sons Ltd, European Association of Geoscientists & Engineers and International Association of Sedimentologists8
B. Bruns et al.

(change in Langmuir pressure pL with temperature)
with respect to an arbitrarily chosen reference tempera-
ture T0 (in this case T0 = 65°C) and was obtained from
sorption isotherms measured over a wide range of tem-
peratures (38–150°C).
Salt movement
Due to the presence of salt diapirs and further halokinetic
structures in the study area and their importance concern-
ing, e.g. petroleum entrapment, sealing capacity, over-
pressure generation below the salt, heat conductivity and
respective influence on rock maturation in the vicinity, it
was of utmost importance to model the geometrical evolu-
tion of halokinetic salt diapirism. For this, PETROMOD�
provides two basic approaches or primary tools respec-
tively: ‘Salt Piercing’ and ‘Salt Movement’. ‘Salt Piercing’
substitutes parts of other layers which must not necessar-
ily be connected to salt layers by assigning a salt facies in
the geometrical frame of the present-day salt body and at
suitable time steps in order to mimic salt movement. ‘Salt
Movement’ changes the geometry of the salt layer, while
the layer volume remains constant, meaning that the salt
layer moves through other layer over time, directly influ-
encing the model geometry. This, however, often results
in distortions, which have to be manually fixed. Here, the
‘Salt Movement’ approach has been chosen, enabling
sediment load-driven linear salt thickness interpolation
through time. In addition, an assemblage of 13 palaeo-
thickness maps defining the lateral salt thickness distribu-
tion at certain points of time has been applied in order to
correct palaeo-geometries based on the interpolation and
to consider the different timing of salt movement in the
study area.
Heat flowanalysis
As a prerequisite for the determination of geochemical
reaction rates, the heat flow analysis aims to determine the
temperatures in the basin. For this, heat convection and
conduction as well as radiogenic heat production need to
be considered and the thermal boundary conditions need
to be defined (Hantschel & Kauerauf, 2009). In order to
calculate the temperature gradient and resulting heat flow
within a basin, information on the thermal conductivity of
the basin infill and the top and base thermal boundary
conditions are needed. Basal heat flow is related to
processes such as crustal heat production, crustal thin-
ning/mantle upwelling or volcanic activity. The sedi-
ment-water interface temperature (SWIT) at the top of
the basin is calculated based on the palaeo water depth
and palaeo latitude. Finally, radiogenic heat production of
the basin infill itself is calculated. This process has often
been neglected in the past and hence former studies often
overestimated basal heat flow.
Sediment-water interface temperature + Paleo water depth
The evolution of the SWIT used for the model was
defined using the latitude dependent standard model from
PETROMOD� based on Wygrala (1989) in correlation with
palaeo water depth data based on and modified from van
Adrichem Boogaert & Kouwe (1993), Kockel (2002),
Miller et al. (2005) and Littke et al. (2008).Palaeo water depth does not only influence the interface
temperature, but is also important for compaction and
pressure implications. Palaeo water depths assigned to the
model, however, do not exceed 200 m and therefore, in
comparison to the much larger burial depths due to depo-
sitional loading, play only an inferior role to the compac-
tion of rock strata.
Basal heat flow
In this study, both classical semi-static McKenzie
approach (Scenario 2; Fig. 4; McKenzie, 1978) based on
and modified from former studies (Petmecky et al., 1999;Senglaub et al., 2005, 2006; Bruns et al., 2013) and the
(multi-)1D probabilistic tectonic heat flow modelling
approach (Scenario 1; Fig. 5) presented in van Wees et al.(2009) have been applied to the study area. Scenario 2,
following the classical heat flow calculations as presented
in McKenzie (1978), displays typically elevated heat flow
responses during rifting events.
In contrast, the heat flow model presented in van Wees
et al. (2009) also incorporates effects of sedimentation
and erosion as well as transient effects of surface tempera-
ture and radiogenic heat production. It comprises a vari-
ety of tectonic scenarios including McKenzie and two-
layered stretching/mantle upwelling and is capable of
backstripping burial histories, calibrated to palaeo and
present-day temperature data. To model the basal and
surface heat flow, a simulation is performed for multi-1D
synthetic wells which have been constructed from the
Table 4. Assigned Langmuir sorption parameters
TOC*
(wt %) VRr (%)
Langmuir sorption capacity* Langmuir
pressure*Adsorbed
phase density
Desorption
energy*
nL (mmol g�1) vL (STP m3 t�1) vL (scf t�1) pL (MPa) qads (kg m�3) Edes (kcal mol�1)
Posidonia
Shale
7.7 1.5 0.21 4.8 175 8.95 423 3.24
Wealden 7.1 2.2 0.33 7.5 275 17.3 421 2.27
*PETROMOD� input parameter; STP = 273.2 K and 0.1 MPa; data on Posidonia Shale from Gasparik et al. (2014).
© 2014 The AuthorsBasin Research © 2014 John Wiley & Sons Ltd, European Association of Geoscientists & Engineers and International Association of Sedimentologists 9
Shale gas in the Wealden and Posidonia Shale

correlated joint model. In this study, a well spacing of
ca. 4 km has been used, resulting in over 4000 synthetic
wells. For each of these wells, the backstripped tectonic
subsidence is forward modelled with a McKenzie stretch-
ing model. The forward modelled lithosphere deforma-
tion of the synthetic wells can be depicted in crustal
stretching maps (Fig. 6). From these maps, we can derive
the spatial and temporal variation in deformation as linked
to orientation of the stress tensor.
The crustal stretching factors used as basis for crustal
thinning and heat flow implications of a rift model, how-
ever, neglect the effects of sediment infill and change in
heat production in the crust. As proposed by van Wees
et al. (2009), continental heat flow is very sensitive to sed-
imentation rates during tectonic processes. As a conse-
quence, the typical heat flow response during a rifting
phase is decreasing of heat flow because of rapid sedimen-
tation. Heat flow is most strongly elevated during rapid
inversion, due to removal and exhumation of relatively
hot rocks close to the surface. These heat flow responses
are very well visible when plotting the heat flow at the end
of a rapid subsidence phase (Fig. 5; e.g. at 309, 89 Ma).
In order to test the sensitivity of modelled erosional
thickness which is dependent on basal heat flow during
time of deepest burial, these two basal heat flow scenarios
have been applied to the 3D model. The exemplary heat
flow trends, representing the two scenarios, as illustrated
in Fig. 7, differ significantly. At time of deepest burial
prior to the Upper Cretaceous uplift (89 Ma), the basal
heat flow can differ by up to 17 mW m�2, e.g. in the
Lower Saxony Basin, strongly influencing the amount of
palaeo burial depth needed to achieve a match with avail-
able palaeo-temperature calibration data.
Calibration data
A large amount of palaeo- and present-day temperature
data could be utilized to calibrate the thermal evolution
of the sedimentary succession. The dataset consists of
vitrinite reflectance (VRr) data from outcrops, mines
and well cores including own measurements and inter-
nal data (mainly based on numerous unpublished bach-
elor and master theses at RWTH Aachen University),
published data (Hecht et al., 1962; Bartenstein et al.,1971; Teichm€uller et al., 1979; Altebaeumer, 1982;
Teichm€uller & Teichm€uller, 1985; Schwarzkopf, 1987;Littke et al., 1988, 1998; Leischner et al., 1993; Leisch-ner, 1994; B€uker et al., 1995; Neunzert et al., 1996;
Petmecky, 1998; Senglaub et al., 2006; Schwarzer &
Littke, 2007; Blumenstein et al., 2008; Nelskamp et al.,2008; Uffmann et al., 2010), TNO (Dutch Organization
for Applied Scientific Research) data and the VIDABA
(vitrinite database of the Federal Institute for Geo-
sciences and Natural Resources, BGR) as well as down-
hole temperature (DHT) data from internal data and
partly provided by ExxonMobil (Hannover, Germany).
In total, calibration data at 731 locations in the study
area was available, covering a stratigraphic interval from
the Pennsylvanian to the Tertiary. This dataset has
been quality-checked and categorized (Table 5, Fig. 8):
The most reliable category (I) consists of VRr pro-
files covering deep wells and including Carboniferous
samples containing coals or dispersed coaly material.
Also, wells with both VRr and DHT profiles are listed
here. The second category (II) includes isolated
Carboniferous samples or VRr profiles excluding the
Carboniferous. The third category (III) represents data
with only few values excluding the Carboniferous, and
the fourth and lowest quality category (IV) consists of
only one single non-Carboniferous value. An additional
category (V) has been implemented to account for loca-
tions with only DHT data available. In general, vitri-
nite reflectance measurements on coals are more
reliable and show a much smaller scatter than those on
dispersed coaly particles (Scheidt & Littke, 1989). This,
however, does not mean that measurements on sedi-
ments other than coals are of less quality. Thus, despite
the fractionation into different quality categories all
available data was initially utilized for the calibration
process. Only, if data of neighbouring wells or the
locally observed lateral maturity trend, respectively,
would show discrepancies, further analysis was per-
formed. If maturity shifts between neighbouring wells,
e.g. due to fault bounded block separation, could be
discarded as explanation, off-limit data was excluded
from the calibration process.
It is possible to calculate and predict vitrinite
reflectance values by the modelling software through
determination of the timing and magnitude of maxi-
mum temperatures. The prediction of maturation rep-
resented by vitrinite reflectance is based on
temperature sensitive Arrhenius type reaction rates and
simple conversion equations (Hantschel & Kauerauf,
2009) so that the temperatures (based on the defined
thermal boundary conditions and burial depths) and
respective reflectance data can be compared to the mea-
sured calibration data.
Fig. 4. Heat flow assignment map of scenario 2. Heat flow
trends have been presented in Bruns et al. (2013): Area 1 ¼ HF
Plot: Pompeckj Block, Area 2 ¼ HF Plot: Lower Saxony Basin.
Both heat flow trends incorporate early Permian rift-related
peaks of 80–90 mW m�2. In Area 2, an additional Late Jurassic
rift-related peak of 85 mW m�2 was included.
© 2014 The AuthorsBasin Research © 2014 John Wiley & Sons Ltd, European Association of Geoscientists & Engineers and International Association of Sedimentologists10
B. Bruns et al.

Fig. 5. Basal heat flow maps (scenario 1) based on the approach presented in van Wees et al. (2009).
© 2014 The AuthorsBasin Research © 2014 John Wiley & Sons Ltd, European Association of Geoscientists & Engineers and International Association of Sedimentologists 11
Shale gas in the Wealden and Posidonia Shale

Erosion
In accordance with the tectonic evolution of NW-
Europe, three major uplift/erosion events have been
identified in the study area and were included in the
modelling by erosion maps. The compilation of these
erosion maps followed the multi-1D approach described
in Bruns et al. (2013) (Fig. 9): 1D models at 731
(a)
(b)
Fig. 6. Top: Total crustal stretching map. Note the gradual increase of cumulative stretching towards the north-east (in particular
for the Pompeckj Basin). Bottom: Incremental stretching for the Upper Cretaceous inversion.
Fig. 7. Exemplary heat flow trends extracted from the central Lower Saxony Basin. Trends taken from the different heat flow scenar-
ios 1 (blue) and 2 (red).
© 2014 The AuthorsBasin Research © 2014 John Wiley & Sons Ltd, European Association of Geoscientists & Engineers and International Association of Sedimentologists12
B. Bruns et al.

locations were extracted from the 3D model. The erosion
amounts and palaeo burial depths, respectively, were
modelled taking the different basal heat flow scenarios as
basis. The erosion amounts were constrained and cali-
brated by vitrinite reflectance and DHT data and
obtained by means of 1D temperature and pressure sim-
ulations. These modelled erosion amounts were manu-
ally transferred into erosion maps and used as data
points for finalizing the maps by inverse distance inter-
polation. The quality of the resulting erosion maps,
hence, highly depends on the lateral distribution density
of the calibration data itself. In the area of the Nether-
lands, only a comparably small amount of locations with
calibration data was made available. The compiled ero-
sion maps might therefore show qualitative deficits con-
cerning the interpolation of erosional amounts in the
Dutch area in comparison to Germany where the data
density is much higher. In order to finalize these erosion
maps they were used in 3D simulations. As maturity
calculations can differ between 3D and 1D simulations
despite being based on the same input a quality check of
the calculated maturities based on a 3D temperature and
pressure simulation approach needed to be performed
(Bruns et al., 2013). The amounts of eroded overburden
and respective erosion maps (based on 1D simulation
results) were therefore, if needed, slightly refined to
match the available calibration data.
RESULTS
Burialanderosion
The Variscan (Asturian) tectonic phase induced uplift
throughout most parts of the study area leading to erosion
rates of up to 760 m Ma�1 and erosional thicknesses of
up to 3800 m of Westphalian deposits in the M€unsterlandBasin as well as northeastern future Lower Saxony Basin
and up to 2400 m with rates up to 480 m Ma�1 in the
northern onshore Netherlands during the Upper Carbon-
iferous/Lower Permian (Fig. 10). Van Wees et al. (2000)stated that a combination of wrench-related lithospheric
deformation, thermal erosion of the mantle lithosphere,
and magmatic inflation of the lithosphere during the Au-
tunian caused volcanic activity and uplift in the Nether-
lands. De Jager & Geluk (2007) added that Stephanian
and Westphalian deposits were subject to a maximum
amount of erosion of ca. 1800 m of Westphalian sedi-
ments. Our erosion map is based on maps of initial (Dro-
zdzewski & Wrede, 1994) and present-day thickness
distribution of the Westphalian (Gerling et al., 1999b).The erosion map was compiled by subtracting the
present-day Westphalian thickness from the initial
Table 5. Summary and quality categorization of the calibration
dataset
Category Locations % Color
I 112 15.32
II 156 21.34
III 104 14.22
IV 319 43.64
V 40 5.48
Total 731 100
Fig. 8. Locations with available palaeo and present-day temperature calibration data. Colours represent different quality categories
(see Table 5).
© 2014 The AuthorsBasin Research © 2014 John Wiley & Sons Ltd, European Association of Geoscientists & Engineers and International Association of Sedimentologists 13
Shale gas in the Wealden and Posidonia Shale

thickness map. In areas where at present-day Westphalian
D is still present, no or little erosion took place (western
Lower Saxony Basin).
During the latest Jurassic parts of the (from East to
West) Pompeckj Basin, Groningen Platform, Lauwerszee
Trough, Friesland Platform, Vlieland Basin, Texel-Ijssel-
meer High and Noord-Holland Platform in the North of
the study area as well as the (from East to West) Krefeld
High, Peel-Maasbommel Complex and Zeeland High in
the South were uplifted during the Kimmerian tectonic
phase. On average, 1100 m (Scenario 1) and 800 m (Sce-
nario 2) with maxima of 4500 m (Scenario 1) and 4200 m
(Scenario 2) of basin infill has been eroded. The erosion
affected a large stratigraphic column, locally even the
Carboniferous. Modelled uplift rates vary but can reach
up to 300 m Ma�1 in areas where strongest uplift and
erosion is observed (Fig. 11a). This erosion phase mainly
affected structural highs or platforms.
The last major erosion phase (Subhercynian) that
affected the study area is related to the Alpine Orogeny
during the Upper Cretaceous to Paleogene. This erosion
phase mainly influenced the basins and caused severe
uplift and erosion. Inversion and modelled erosion
amounts have been strongest during this phase removing
large amounts of Cretaceous to Triassic and even Paleo-
zoic deposits in the (from East to West) southern part of
the Gifhorn Trough, Lower Saxony Basin, Central and
West Netherlands basins. Maximum uplift rates of up to
370 m Ma�1 induced erosion of up to 8950 m (Scenario
1) and 6700 m (Scenario 2) in the Lower Saxony Basin
near Osnabr€uck. On average, 1920 m (Scenario 1) and
1535 m (Scenario 2) of the initial layer thickness has been
removed during this period (Fig. 11b, c). Burial in the
southwestern part of the West Netherlands Basin is deep-
est at present day; only the northeastern flank and the
Central Netherlands Basin have been influenced by
moderate uplift during the Upper Cretaceous. Observed
present-day maturities in the study area which are due to
increased palaeo burial depth differ significantly between
the basins in Germany and the Netherlands. Former
burial depths in the Dutch basins were much lower than
in parts of the Lower Saxony Basin.
Dep
th [m
]
Dep
th [m
]
Time [Ma]
25 km 25 km
VRr [%] Temperature [°C]
Fig. 9. Workflow chart of the erosion map compilation. 1D basin models extracted from the 3D model were used to model eroded
thicknesses (upper left). Data were plotted in multi-1D maps (lower left). Erosion maps were compiled by interpolation of the multi-
1D maps (lower right). A final 3D model was created, in which minor refinements of eroded thicknesses were performed until an opti-
mal calibration (upper right) was achieved (modified from Bruns et al., 2013).
© 2014 The AuthorsBasin Research © 2014 John Wiley & Sons Ltd, European Association of Geoscientists & Engineers and International Association of Sedimentologists14
B. Bruns et al.

Maturityevolution
Posidonia Shale
At the Jurassic/Cretaceous boundary the top of the Posido-
nia Shale had been buried to average depths of 2000–3000 m (max. 3600 m) in the Lower Saxony Basin centre,
1000–1700 m (max. 2700 m) in the Gifhorn Trough,
500 m in the Pompeckj Basin (max. 1200 m) and 1000–1700 m (max. 2600 m) in the West Netherlands Basin.
Areas affected by Kimmerian uplift (see Fig. 11a) had for-
merly been buried to maximum depths of 4500 m (Scenario
1) and 4000 m (Scenario 2) in the Pompeckj Basin, 2850 m
(Scenario 1) and 2650 m (Scenario 2) in the Friesland Plat-
form as well as 1950 m (Scenario 1) and 1600 m (Scenario
2) in the Peel-Maasbommel Complex and Krefeld High.
Lower Cretaceous deposition increased the burial
depth of the Posidonia Shale in the Lower Saxony Basin
significantly. During the Upper Cretaceous the end of
sedimentation (89 Ma) was characterized by greatest bur-
ial depths as deep as 10 000 m (Scenario 1) and 7800 m
(Scenario 2) resulting in temperatures of up to 330°C.Maturities in some parts of the Lower Saxony Basin de-
pocentre reached the overmature state partly exceeding
4.66% VRr [the kinetic of Sweeney & Burnham (1990),
used for maturity calculation in this model, allows calcula-
tions only up to 4.66% VRr]. The average maturation in
the basin centre reached the dry gas stage (>2.3% VRr)
whereas the basin margin maturities remained in the oil
window. Maturation of the Pompeckj Basin also pro-
gressed, especially in the rim basins of salt diapirs and salt
walls, reaching the early to main oil generation stage
(Fig. 12). In the eastern Gifhorn Trough, burial reached
maximum depths of up to 4400 m (Scenario 1) and
3800 m (Scenario 2). Temperatures ranged between 80
and 120°C but were locally higher reaching up to 180°C,resulting in maturities within the oil generation window.
At small confined spots often associated with salt struc-
tures maturities increased up to the wet gas stage (1.3–2.3% VRr).
Since then maturities in the Lower Saxony Basin did
not increase. The Subhercynian inversion induced uplift
and erosion of the Lower Saxony Basin removing up to
8950 m (Scenario 1) and 6800 m (Scenario 2) of basin in-
fill. Today, the top of the Posidonia Shale can be found at
depths between 0 and 3600 m with deepest locations in
the northwestern West Netherlands Basin, northern
Lower Saxony Basin and northeastern Pompeckj Basin.
During uplift of the Lower Saxony Basin the deposition
in the Pompeckj Basin and the northern part of the Gif-
horn Trough proceeded leading to maximum burial
depths of up to 3600 m in the Pompeckj Basin and
3000 m in the Gifhorn Trough. Thus, more areas in the
Pompeckj Basin and Gifhorn Trough have nowadays
reached the oil generation stage (Fig. 12).
Prior to the Subhercynian erosion during the Upper
Cretaceous the end of sedimentation in the Netherlands
was only partly characterized by greatest burial depths.
Average burial depths in the West Netherlands Basin
equalled 2600 m in the centre and 1600 m at the basin
flanks. The Central Netherlands Basin shows burial
depths of 1800 m on average. Temperatures ranged
between 75 and 120°C resulting in maturities of 0.4–1.2%VRr; thus, large parts of the basins reached the oil genera-
tion stage (Fig. 12).
Fig. 10. Total amount of eroded overburden removed during the Variscan/Asturian (Upper Carboniferous) inversion.
© 2014 The AuthorsBasin Research © 2014 John Wiley & Sons Ltd, European Association of Geoscientists & Engineers and International Association of Sedimentologists 15
Shale gas in the Wealden and Posidonia Shale

The Subhercynian erosion removed up to 2900 m
(Scenario 1) and 2200 m (Scenario 2) of basin infill and
most of the Posidonia Shale in the area of the Central
Netherlands Basin. Therefore, at present day the Posido-
nia Shale in the Netherlands is only widespread in the
West Netherlands Basin, where erosion was not as dis-
tinct. Burial, especially in the southwestern part of the
West Netherlands Basin, continued until present day.
(a)
(b)
(c)
Fig. 11. Scenario 1: Total amount of eroded overburden removed during the Kimmerian (Upper Jurassic) inversion (a), Scenario 1:
Total amount of eroded overburden removed during the Subhercynian (Upper Cretaceous) inversion (b), Scenario 2: Total amount of
eroded overburden removed during the Subhercynian (Upper Cretaceous) inversion (c).
© 2014 The AuthorsBasin Research © 2014 John Wiley & Sons Ltd, European Association of Geoscientists & Engineers and International Association of Sedimentologists16
B. Bruns et al.
Burial depths of up to 3600 m result in temperatures of
up to 140°C and maturities up to the late oil-early gas
generation stage (1.3% VRr) (Fig. 12).
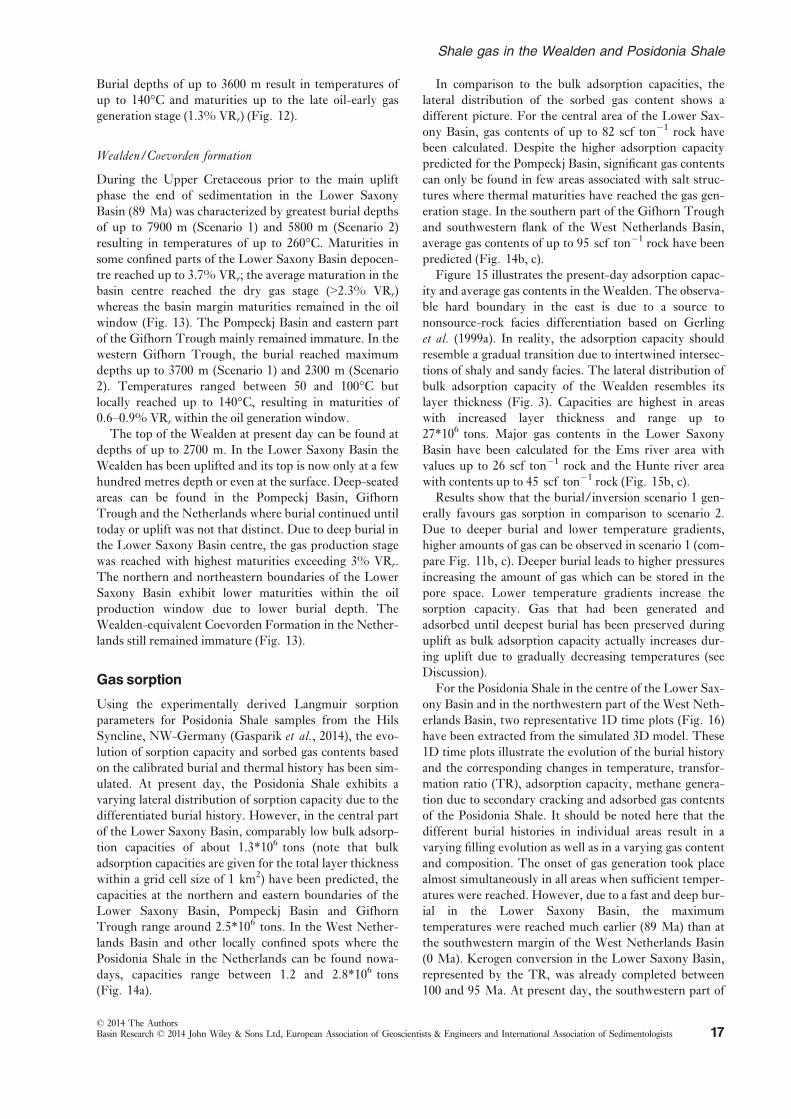
Wealden/Coevorden formation
During the Upper Cretaceous prior to the main uplift
phase the end of sedimentation in the Lower Saxony
Basin (89 Ma) was characterized by greatest burial depths
of up to 7900 m (Scenario 1) and 5800 m (Scenario 2)
resulting in temperatures of up to 260°C. Maturities in
some confined parts of the Lower Saxony Basin depocen-
tre reached up to 3.7% VRr; the average maturation in the
basin centre reached the dry gas stage (>2.3% VRr)
whereas the basin margin maturities remained in the oil
window (Fig. 13). The Pompeckj Basin and eastern part
of the Gifhorn Trough mainly remained immature. In the
western Gifhorn Trough, the burial reached maximum
depths up to 3700 m (Scenario 1) and 2300 m (Scenario
2). Temperatures ranged between 50 and 100°C but
locally reached up to 140°C, resulting in maturities of
0.6–0.9% VRr within the oil generation window.
The top of the Wealden at present day can be found at
depths of up to 2700 m. In the Lower Saxony Basin the
Wealden has been uplifted and its top is now only at a few
hundred metres depth or even at the surface. Deep-seated
areas can be found in the Pompeckj Basin, Gifhorn
Trough and the Netherlands where burial continued until
today or uplift was not that distinct. Due to deep burial in
the Lower Saxony Basin centre, the gas production stage
was reached with highest maturities exceeding 3% VRr.
The northern and northeastern boundaries of the Lower
Saxony Basin exhibit lower maturities within the oil
production window due to lower burial depth. The
Wealden-equivalent Coevorden Formation in the Nether-
lands still remained immature (Fig. 13).
Gas sorption
Using the experimentally derived Langmuir sorption
parameters for Posidonia Shale samples from the Hils
Syncline, NW-Germany (Gasparik et al., 2014), the evo-lution of sorption capacity and sorbed gas contents based
on the calibrated burial and thermal history has been sim-
ulated. At present day, the Posidonia Shale exhibits a
varying lateral distribution of sorption capacity due to the
differentiated burial history. However, in the central part
of the Lower Saxony Basin, comparably low bulk adsorp-
tion capacities of about 1.3*106 tons (note that bulk
adsorption capacities are given for the total layer thickness
within a grid cell size of 1 km2) have been predicted, the
capacities at the northern and eastern boundaries of the
Lower Saxony Basin, Pompeckj Basin and Gifhorn
Trough range around 2.5*106 tons. In the West Nether-
lands Basin and other locally confined spots where the
Posidonia Shale in the Netherlands can be found nowa-
days, capacities range between 1.2 and 2.8*106 tons(Fig. 14a).
In comparison to the bulk adsorption capacities, the
lateral distribution of the sorbed gas content shows a
different picture. For the central area of the Lower Sax-
ony Basin, gas contents of up to 82 scf ton�1 rock have
been calculated. Despite the higher adsorption capacity
predicted for the Pompeckj Basin, significant gas contents
can only be found in few areas associated with salt struc-
tures where thermal maturities have reached the gas gen-
eration stage. In the southern part of the Gifhorn Trough
and southwestern flank of the West Netherlands Basin,
average gas contents of up to 95 scf ton�1 rock have been
predicted (Fig. 14b, c).
Figure 15 illustrates the present-day adsorption capac-
ity and average gas contents in the Wealden. The observa-
ble hard boundary in the east is due to a source to
nonsource-rock facies differentiation based on Gerling
et al. (1999a). In reality, the adsorption capacity should
resemble a gradual transition due to intertwined intersec-
tions of shaly and sandy facies. The lateral distribution of
bulk adsorption capacity of the Wealden resembles its
layer thickness (Fig. 3). Capacities are highest in areas
with increased layer thickness and range up to
27*106 tons. Major gas contents in the Lower Saxony
Basin have been calculated for the Ems river area with
values up to 26 scf ton�1 rock and the Hunte river area
with contents up to 45 scf ton�1 rock (Fig. 15b, c).
Results show that the burial/inversion scenario 1 gen-
erally favours gas sorption in comparison to scenario 2.
Due to deeper burial and lower temperature gradients,
higher amounts of gas can be observed in scenario 1 (com-
pare Fig. 11b, c). Deeper burial leads to higher pressures
increasing the amount of gas which can be stored in the
pore space. Lower temperature gradients increase the
sorption capacity. Gas that had been generated and
adsorbed until deepest burial has been preserved during
uplift as bulk adsorption capacity actually increases dur-
ing uplift due to gradually decreasing temperatures (see
Discussion).
For the Posidonia Shale in the centre of the Lower Sax-
ony Basin and in the northwestern part of the West Neth-
erlands Basin, two representative 1D time plots (Fig. 16)
have been extracted from the simulated 3D model. These
1D time plots illustrate the evolution of the burial history
and the corresponding changes in temperature, transfor-
mation ratio (TR), adsorption capacity, methane genera-
tion due to secondary cracking and adsorbed gas contents
of the Posidonia Shale. It should be noted here that the
different burial histories in individual areas result in a
varying filling evolution as well as in a varying gas content
and composition. The onset of gas generation took place
almost simultaneously in all areas when sufficient temper-
atures were reached. However, due to a fast and deep bur-
ial in the Lower Saxony Basin, the maximum
temperatures were reached much earlier (89 Ma) than at
the southwestern margin of the West Netherlands Basin
(0 Ma). Kerogen conversion in the Lower Saxony Basin,
represented by the TR, was already completed between
100 and 95 Ma. At present day, the southwestern part of
© 2014 The AuthorsBasin Research © 2014 John Wiley & Sons Ltd, European Association of Geoscientists & Engineers and International Association of Sedimentologists 17
Shale gas in the Wealden and Posidonia Shale

(a)
(b)
(c)
Fig. 12. Temperature during deepest burial at 89 Ma (a), present-day maturity (b) and present-day temperature (c) at the top of the
Posidonia Shale.
© 2014 The AuthorsBasin Research © 2014 John Wiley & Sons Ltd, European Association of Geoscientists & Engineers and International Association of Sedimentologists18
B. Bruns et al.

(a)
(b)
(c)
Fig. 13. Temperature during deepest burial at 89 Ma (a), present-day maturity (b) and present-day temperature (c) at the top of the
Wealden.
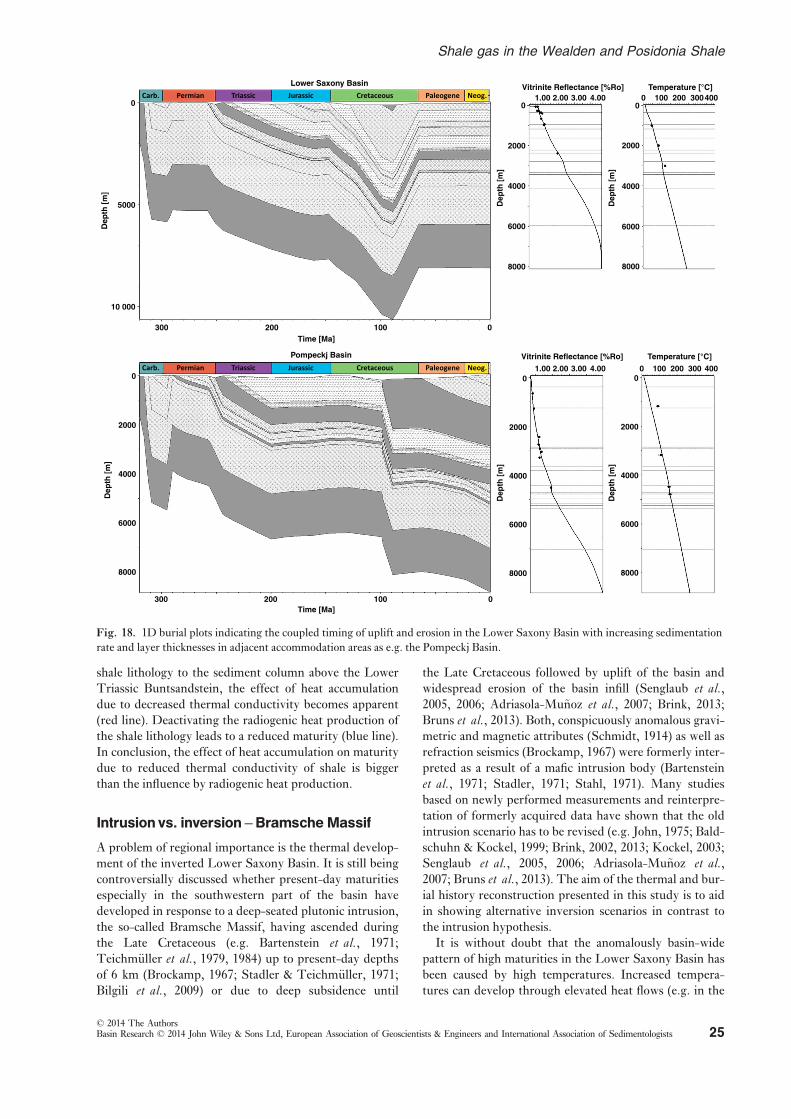
© 2014 The AuthorsBasin Research © 2014 John Wiley & Sons Ltd, European Association of Geoscientists & Engineers and International Association of Sedimentologists 19
Shale gas in the Wealden and Posidonia Shale

(a)
(b)
(c)
Fig. 14. Present-day total bulk adsorption capacity (a; 106*tons per layer thickness within a grid cell size of 1 km2), and average vol-
ume of methane at standard conditions per mass of rock (b = Scenario 1; c = Scenario 2; scf ton�1 rock) of the Posidonia Shale.
© 2014 The AuthorsBasin Research © 2014 John Wiley & Sons Ltd, European Association of Geoscientists & Engineers and International Association of Sedimentologists20
B. Bruns et al.

the West Netherlands Basin is at its maximum burial
depth. Only the northeastern flank has been influenced by
moderate uplift during the Upper Cretaceous. The bulk
adsorption capacities in the West Netherlands Basin pre-
dicted by the model are increasing up to certain tempera-
ture and pressure conditions and decrease thereafter with
further burial. On the other hand, since the beginning of
uplift in the Lower Saxony Basin, the bulk adsorption
capacities remained almost constant until present day.
The onset of gas generation is marked by the increase in gas
content. It should be noted that microbial gas generation
has not been included into the model and cannot be ruled
out as an additional contributor.
DISCUSSION AND SENSITIVITYANALYSIS
Erosion
Due to the high amount of modelled erosion during the
Upper Cretaceous (Subhercynian) uplift questions may
arise whether the respective uplift rates are plausible and
whether enough accommodation space in adjacent areas
was available. The modelled erosion rates range between
100 and 370 m Ma�1 and therefore represent a rather
moderate uplift scenario which is certainly plausible for a
transpressional tectonic regime in combination with a
humid climate at that time. Layer thickness maps of the
Upper Cretaceous and Paleogene indicate that the general
regional transport direction was N-NW-oriented
(Fig. 17). A mass balance analysis comparing accumu-
lated Upper Cretaceous and Paleogene deposits with
eroded sediment volumes taking into account time of ero-
sion and sedimentation (Figs. 17 and 18) indicates a cor-
relation of increased sedimentation rates in adjacent areas
during and after erosion in, e.g. the Lower Saxony Basin
as well as between eroded and accumulated volumes. In
the study area, about 69 900 km3 (Scenario 1) or
58 600 km3 (Scenario 2) of eroded deposits were mod-
elled. In comparison, 34 600 km3 of Upper Cretaceous
and 26 400 km3 of Paleogene layer volume can be
observed at present day. Although lithological differences
(e.g. clastics vs. carbonates) as well as carbonate dissolu-
tion, water currents and additional accommodation space
further north in the North Sea sector also have to be con-
sidered, it is still obvious that there was sufficient accom-
modation space for the eroded sediment volume.
Assigned lithologies/facies of the eroded deposits also
affect calculated temperatures/maturity but this effect is
mainly controlled by the differential heat conductivity
and only marginally by differential compaction rates. The
comparison of pure shale, pure limestone and the original
user-defined lithologies for the eroded deposits of, e.g.
2700 m yields a difference in initial thickness of only
100 m for shales in comparison to carbonates, therefore
not taking significant influence on the burial depth.
Instead, the decreased thermal conductivity of a shaly (in
contrast to a limestone or sandstone) lithology results in
additional heat accumulation and elevated temperatures/
maturity. Figure 19d shows this effect for one well. In
the modelling runs, only the lithologies of eroded Lower
and Upper Cretaceous strata have been replaced resulting
in a significant change in temperature and maturity. In
reality, the lithologies are constrained by preserved layers
e.g. in the Pompeckj Basin just north of the Lower
Saxony Basin and/or by palaeogeographic information
(e.g. Ziegler, 1990). Nevertheless, the analysis (Fig. 19d)
implies that lithologies (petrophysical properties) of
now eroded layers lead to major uncertainties in tempera-
ture history modelling.
Maturityand thermal calibration
The presented heat flow and erosion scenarios are based
on a thermal calibration utilizing vitrinite reflectance
(palaeo-temperature) and DHT data. Hereby, measured
and simulated vitrinite reflectance and temperature vs.
depth trends are being matched by adjusting the amount
of basal heat flow as well as palaeo burial depth and
erosion, respectively. The modelled erosion scenarios
already present a sensitivity analysis on a basin wide-scale
showing their dependency on differing basal heat flow. In
order to further illustrate the calibration procedure and
the sensitivity of modelling results to changing input
data Fig. 19 displays several scenarios developed for the
representative well of the Lower Saxony Basin shown
in Fig. 18 (top). A best-fit model has been created assum-
ing basal heat flow scenario 2 as displayed in Fig. 7 in
combination with an erosion amount of 2700 m (Scenario
2; Fig. 18). Using basal heat flow scenario 2 with
59 mW m�2 at the time of deepest burial different
amounts of palaeo burial depth and erosion (ranging
between 2300 and 3300 m) during the following Subh-
ercynian Inversion were tested (Fig. 19a). In an alterna-
tive scenario, leaving the amount of eroded deposits at a
constant value of 2700 m, differing assumptions on basal
heat flow during time of deepest burial were applied rang-
ing from 68 to 48 mW m�2 (Fig. 19b).
The lower thermal boundary is defined by the basal
heat flux into the basin. The underlying artificial base-
ment layer with an average thickness of 10 000 m also
features a radiogenic matrix heat production of
1 lW m�3. Thus, the actual lower thermal boundary of
the 3D model is a combination of the assigned basal heat
flow through time and the radiogenic heat production of
the basement layer. The basement layer thickness there-
fore influences the needed amount of basal heat flow and
the assigned heat flow trends would exhibit slightly higher
values if the basement layer had been excluded. This is
shown in Fig. 19e, where simulated vitrinite reflectance
trends based on incorporation and exclusion of this
basement layer have been compared using the same basal
heat flow trend and erosion amount.
The implementation of natural radiogenic heat produc-
tion of the basin infill itself has shown that a reassessment
of former basin modelling studies is generally needed.
© 2014 The AuthorsBasin Research © 2014 John Wiley & Sons Ltd, European Association of Geoscientists & Engineers and International Association of Sedimentologists 21
Shale gas in the Wealden and Posidonia Shale

(a)
(b)
(c)
Fig. 15. Present-day total bulk adsorption capacity (a; 106*tons per layer thickness within a grid cell size of 1 km2) and average vol-
ume of methane at standard conditions per mass of rock (b = Scenario 1; c = Scenario 2; (scf ton�1 rock) of the Wealden.
© 2014 The AuthorsBasin Research © 2014 John Wiley & Sons Ltd, European Association of Geoscientists & Engineers and International Association of Sedimentologists22
B. Bruns et al.

The possibility to implement this additional heat input
within a basin especially effects former assumptions on
basal heat flow which have been overestimated if radio-
genic heat production had not been considered. As Ura-
nium, Thorium and Potassium as major contributors to
radiogenic heat can mainly be found in shales, the gener-
ated heat and effect on maturation strongly depends on
the existing amount of shale or shaly lithologies in the
(a)
(b)
Fig. 16. Representative 1D time plots for the Lower Saxony Basin (a) and West Netherlands Basin (b) illustrating the differential
evolution of the burial history and the corresponding changes in temperature, transformation ratio (TR), adsorption capacity, methane
generation due to secondary cracking and total adsorbed gas contents of the Posidonia shale [bulk adsorption capacity (106*tons);depth (m); TR (%); secondary cracking products (106*tons); sorbed volume of methane at standard conditions per mass of rock
(scf ton�1 rock); temperature (°C)].
© 2014 The AuthorsBasin Research © 2014 John Wiley & Sons Ltd, European Association of Geoscientists & Engineers and International Association of Sedimentologists 23
Shale gas in the Wealden and Posidonia Shale

sedimentary column. Systematical comparison of model-
ling results regarding basal heat flows during time of
deepest burial with former studies (e.g. Petmecky, 1998)
in the Lower Saxony Basin has shown some differences.
Basal heat flows (as well as burial depth) at these critical
moments during deepest burial could be reduced and
still yielding the same results regarding the present-day
maturity level. This difference of course is only valid for
the Lower Saxony Basin with its unique distribution of
shale content and cannot necessarily be applied for other
basins. Figure 19c illustrates this difference of deacti-
vated radiogenic heat production of the original mix of
user-defined lithologies (green line). Using basal heat flow
scenario 2 and leaving the erosion amount constant the
vitrinite reflectance trend has been simulated with and
without radiogenic heat production. Results indicate that
VRr values differ on average by 20%; that is higher basal
heat flow and/or deeper burial is required to match the
VRr values if no internal radiogenic heat production is
taken into account. In addition, the influence of shale con-
tent and its radiogenic heat production on the tempera-
ture field has been tested (Fig. 19c). By applying a pure
(a)
(b)
Fig. 17. Present-day Paleogene (a; 26 400 km3) and Upper Cretaceous thickness (b; 34 600 km3).
© 2014 The AuthorsBasin Research © 2014 John Wiley & Sons Ltd, European Association of Geoscientists & Engineers and International Association of Sedimentologists24
B. Bruns et al.
shale lithology to the sediment column above the Lower
Triassic Buntsandstein, the effect of heat accumulation
due to decreased thermal conductivity becomes apparent
(red line). Deactivating the radiogenic heat production of
the shale lithology leads to a reduced maturity (blue line).
In conclusion, the effect of heat accumulation on maturity
due to reduced thermal conductivity of shale is bigger
than the influence by radiogenic heat production.
Intrusionvs. inversion –BramscheMassif
A problem of regional importance is the thermal develop-
ment of the inverted Lower Saxony Basin. It is still being
controversially discussed whether present-day maturities
especially in the southwestern part of the basin have
developed in response to a deep-seated plutonic intrusion,
the so-called Bramsche Massif, having ascended during
the Late Cretaceous (e.g. Bartenstein et al., 1971;
Teichm€uller et al., 1979, 1984) up to present-day depths
of 6 km (Brockamp, 1967; Stadler & Teichm€uller, 1971;Bilgili et al., 2009) or due to deep subsidence until
the Late Cretaceous followed by uplift of the basin and
widespread erosion of the basin infill (Senglaub et al.,2005, 2006; Adriasola-Mu~noz et al., 2007; Brink, 2013;Bruns et al., 2013). Both, conspicuously anomalous gravi-
metric and magnetic attributes (Schmidt, 1914) as well as
refraction seismics (Brockamp, 1967) were formerly inter-
preted as a result of a mafic intrusion body (Bartenstein
et al., 1971; Stadler, 1971; Stahl, 1971). Many studies
based on newly performed measurements and reinterpre-
tation of formerly acquired data have shown that the old
intrusion scenario has to be revised (e.g. John, 1975; Bald-
schuhn & Kockel, 1999; Brink, 2002, 2013; Kockel, 2003;
Senglaub et al., 2005, 2006; Adriasola-Mu~noz et al.,2007; Bruns et al., 2013). The aim of the thermal and bur-
ial history reconstruction presented in this study is to aid
in showing alternative inversion scenarios in contrast to
the intrusion hypothesis.
It is without doubt that the anomalously basin-wide
pattern of high maturities in the Lower Saxony Basin has
been caused by high temperatures. Increased tempera-
tures can develop through elevated heat flows (e.g. in the
300
0 0
2000
4000
6000
8000
0
2000
4000
6000
8000
00
2000
4000
6000
8000
01.00 2.00 3.00 4.00 100 200 300 400
01.00 2.00Vitrinite Reflectance [%Ro] Temperature [°C]
Vitrinite Reflectance [%Ro] Temperature [°C]
3.00 4.00 100 200 300400
2000
4000
6000
8000
5000
10 000
0
2000
4000
Dep
th [
m]
Dep
th [
m]
Dep
th [
m]
Dep
th [
m]
Dep
th [
m]
Dep
th [
m]
6000
8000
300 200Time [Ma]
Time [Ma]
100 0
Carb. Permian Triassic Jurassic Cretaceous Paleogene
Carb.
Neog.
Permian Triassic JurassicPompeckj Basin
Lower Saxony Basin
Cretaceous Paleogene
200
Neog.
100 0
Fig. 18. 1D burial plots indicating the coupled timing of uplift and erosion in the Lower Saxony Basin with increasing sedimentation
rate and layer thicknesses in adjacent accommodation areas as e.g. the Pompeckj Basin.
© 2014 The AuthorsBasin Research © 2014 John Wiley & Sons Ltd, European Association of Geoscientists & Engineers and International Association of Sedimentologists 25
Shale gas in the Wealden and Posidonia Shale

vicinity of a plutonic intrusion or due to crustal thinning)
and/or through deep subsidence. These high maturities,
however, cannot only be observed in corresponding
depths where they would be expected regarding the regio-
nal temperature gradient but also near the surface of the
basin mirroring reduced or even missing layer thicknesses
in the basin area which are still present in the surrounding
areas of the Lower Saxony Basin (Bruns et al., 2013).Here, especially in the southern part of the basin strati-
graphically older strata had been uplifted to shallow
depths and partly eroded. In addition, expected high VRr
gradients which would suit elevated heat flows caused by
an intrusion can generally not be observed; most of the
available vitrinite datasets of the Lower Saxony Basin (see
VIDABA; Bruns et al., 2013) rather match a temperature
evolution that was caused by deep subsidence. In addi-
tion, modelling approaches have shown that it is difficult
to reach observed surface maturities with a large intrusion
body at 6–10 km depth. Seismic velocity logs show high
velocities indicating strongly compacted strata in and
especially outside of that area (John, 1975; Brink, 2002)
resulting in similar magnitudes of uplift as presented
here. The observable density and gravitational anomaly in
the area of the Bramsche Massif does not necessarily have
to be an effect of a magmatic body (Bilgili et al., 2009) butcould e.g. also hint towards compacted high-density strata
and/or integrated granulitized/eclogitized lower crust
which was uplifted to lower depths (Brink, 2013). New
magnetotelluric measurements (Hoffmann et al., 2008;
Brink, 2010, 2012) show no indication of a plutonic body
exhibiting low electric conductivities and high electric
impedance, respectively, above 15 km depth. Brink
(2013), therefore, proposed further alternative scenarios
which could be held responsible for the observed anoma-
lous attributes. High electric conductivities in close
proximity to the seismic refractor and the specific seismic
15 000
10 000
5000
0
8000
6000
3300 m
2300 m
2700 m
3300 m
2300 m
2700 m
Jurassic Cretaceous Paleogene Neogene
59 mW/m2
With Basement
No Basement
48 mW/m2
68 mW/m2
Original-No Radio.
Shale-No Radio. Shaly
Carbonate
Original
Shale-Radio.
Original
4000
Dep
th [
m]
Dep
th [
m]
2000
01 2 3 4
1 2
Vitrinite Reflectance [%]
3 4
150 100
Time [Ma]
50 00
0.1
0.2
Mas
s [M
ton
s]
0.3
0.4
0.5
1 2 3 4 1 2 3 4 1 2 3 4
(a)
(e) (f)
(b) (c) (d)
Vitrinite Reflectance [%]
Lower Cretaceous
Upper Jurassic - Malmian
Upper Triassic
Lower Triassic
Lower Jurassic
Upper Permian - Zechstein
Upper Carboniferous - Westphalian C
Upper Carboniferous - Westphalian A+B
Upper Carboniferous - Namurian
Lower Cretaceous
Lower Jurassic
Upper Permian - ZechsteinUpper Carboniferous - Westphalian C
Upper Carboniferous - Westphalian A+B
Upper Carboniferous - Namurian
Basement
Fig. 19. Vitrinite reflectance vs. depth calibration plots (a–e) and bulk adsorption capacity vs. erosion/burial depth plot (f) for the
well presented in Fig. 18 (top). Measured vitrinite reflectance data (points) and calibration curves (lines) have been calculated for (a)
different erosional thickness with the heat flow trend displayed in Fig. 7 (Scenario 2); (b) different basal heat flow at time of deepest
burial with an erosional thickness of 2700 m; (c) the best-fit model in comparison to deactivated radiogenic heat production of the
user-defined lithology mix and of a pure shale lithology for the sediment column above the Lower Triassic Buntsandstein; (d) the
best-fit model including a single shale or carbonate lithology in comparison to the user-defined lithology applied to the eroded depos-
its; (e) the best-fit model with and without the radiogenic heat producing basement.
© 2014 The AuthorsBasin Research © 2014 John Wiley & Sons Ltd, European Association of Geoscientists & Engineers and International Association of Sedimentologists26
B. Bruns et al.

velocities in that refractor, originally interpreted as
the roof of the intrusion, might also indicate Lower
Carboniferous/Upper Devonian shelf carbonates (Hoff-
mann et al., 2008; Doornenbal & Stevenson, 2010) to
which the observed seismic velocities would suit more.
On top of these carbonates, Upper Carboniferous deposits
with high organic content had been deposited. The elec-
tric conductivity of these organic-rich deposits has then
been altered and increased during graphitization. This
carbonate platform, however, would probably not solely
be responsible for the gravimetric and magnetic anomalies
observed. Therefore, supported by modelling studies of
Petrini & Podladchikov (2000) and Scheibe et al. (2005),Brink (2013) suggested an additional eclogite body of high
density and magnetic susceptibility beneath the carbonate
platform. This body would have been uplifted as part of
the lower crust implying an incorporation of the basement
into the inversion of the Lower Saxony Basin.
On the other hand, the possibility of partial melting
of the lower/middle crust and a Permo-Carboniferous
magmatic intrusion during the Permian extensional phase
cannot be suspended. Vast and thick Permian volcanics
can be found especially north and east of the basin
(Breitkreuz et al., 2008; Maystrenko et al., 2010). It is,however, unlikely that high present-day maturities of
strata deposited until then (e.g. Carboniferous for which
calibration data was available) had already been reached at
that time. Maturities of the Meso- and Cenozoic overbur-
den could not have been reached by post-Permian burial
to observed present-day depths. This burial anomaly indi-
cates much higher temperatures than at present day to
match the palaeo-temperature calibration data. Addition-
ally, increased temperatures due to rising geothermally
heated water at the Jurassic/Cretaceous boundary during
rifting and initiation of the basin are common but the
heating effect would be locally constrained and following
the fault system. This could not cause the high maturities
visible on such a basin-wide scale. During the Upper Cre-
taceous the Lower Saxony Basin underwent compres-
sion/transpression due to the Africa-Iberia-Europe
convergence but extrusives, rising geothermally heated
water and magmatic intrusions are statistically more com-
mon in extensional regimes (Chaussard & Amelung, 2014)
rendering the hypothesis of a magmatic intrusion devel-
oping during the Upper Cretaceous even more unlikely.
Sorption
Methane sorption capacity and its implementation inPETROMOD
�
In this study, the experimental methane sorption data for
the Posidonia shale from the Hils syncline, NW-Germany
(Gasparik et al., 2014) and unpublished sorption data for
the Wealden were used to derive the input Langmuir
parameters for the PETROMOD� simulation (Table 4).
While in Gasparik et al. (2014) the adsorbed phase
density (qads) was used as a fitting parameter, here the
value for qads was fixed to 423 kg m�3 (i.e. liquid methane
density at the boiling point; Table 4). This value is often
used in the literature as an approximation for the
adsorbed phase density (Busch & Gensterblum, 2011).
Although in the current version of the PETROMOD� soft-
ware qads is not explicitly implemented as an input param-
eter, the value of qads significantly influences the other
two parameters, vL and pL. This is obvious from the rela-
tionship between the excess sorption (experimentally
determined quantity) and the absolute sorption:
vexcessads ¼ vabsoluteads 1� qgðT ; pÞqads
� �
¼ vLp
pþ pLðTÞ 1� qgðT ; pÞqads
� �ð1Þ
where qg(T, p) is the bulk (free) gas density at given tem-
perature (T) and pressure (p). The meaning of the ‘excess’
sorption is simply the amount of gas present within the
pores that is in excess to the amount that would have been
present if no sorption took place (this ‘non-sorption’ case
is experimentally determined by helium expansion). The
absolute sorption, on the other hand, designates the
amount of condensed gas phase defined by its density
(qads) and occupying the volume (vads) at the gas-solid
interface. The excess sorption is determined experimen-
tally and can be unambiguously represented by the three
fitted nL, pL and qads parameters using Eqn (1). Different
combinations of the three parameters can be obtained for
a single isotherm depending on whether the qads is fixed(to some ‘meaningful’ value) or used as a free fitting
parameter. On the other hand, the absolute sorption can-
not be determined experimentally as there is no current
technology that would allow qads and vads to be measured
directly. At low pressures or at subcritical conditions, the
absolute sorption can be reasonably approximated by the
measured excess sorption as the bulk gas density qg(T, p)is negligibly small compared to the adsorbed phase den-
sity qads (i.e. the ratio qg(T, p)/qads in Eqn 1 is ca. 0). Atsupercritical conditions, however, with increasing pres-
sure the absolute sorption deviates increasingly from the
measured excess sorption due to a significantly large qg(T,p). For methane at pressures >8 MPa, the excess sorption
isotherms on shales often exhibit a maximum followed by
a downward trend of excess sorption with increasing pres-
sure (Gasparik et al., 2012, 2014) meaning that the bulk
density qg(T, p) increases with pressure at higher rates
than the adsorbed phase density qads. Such isotherms with
maxima can only be represented by the three-parameter
excess sorption function (nL, pL, qads) which is a direct
approximation to the experimental data (irrespective of
the true physical meaning of the parameters). The sorp-
tion data (vL and pL) as implemented in the PETROMOD�
software, thus represent the absolute sorption and are no
longer unambiguous for the reasons discussed above.
In geologic situations, as a first-order approxima-
tion, the sorption capacity of a given shale (other rock
properties being constant) is controlled by pressure
© 2014 The AuthorsBasin Research © 2014 John Wiley & Sons Ltd, European Association of Geoscientists & Engineers and International Association of Sedimentologists 27
Shale gas in the Wealden and Posidonia Shale

and temperature. The simultaneous effect of pressure
(increases the sorption capacity) and temperature
(decreases the sorption capacity) can be illustrated in
sorption capacity vs. depth plots. Such a plot for the Posi-
donia Shale (VRr = 1.5%) is shown in Fig. 20 for both
absolute and excess sorption using the data in Table 4. A
geothermal and hydrostatic gradient of 30°C km�1 and
10 MPa km�1, respectively and a surface temperature of
20°C were assumed. Figure 20 shows several important
features. Firstly, the limit of experimental conditions is
indicated as a corresponding depth interval at maximum
experimental pressure (25 MPa ~ 2500 m) and tempera-
ture (150°C ~ 5000 m). The ‘representativeness’ of the
experimental conditions for high-pressure/high-tempera-
ture sorption in gas shales is accordingly limited more by
the extent of maximum experimental pressures than
maximum experimental temperatures. Above this depth
interval, the calculated sorption capacity must be extrapo-
lated. Secondly, the figure shows clearly the difference
between the excess and the absolute sorption capacity.
The excess sorption capacity exhibits a maximum of
89 scf t�1 or 2.6 m3 t�1 (standard cubic metres ton�1 for
gas at 101.325 kPa and 20°C) at a depth of ca. 1000 m
and falls steadily thereafter with further increase in depth.
The absolute sorption capacity exceeds significantly the
excess sorption capacity and reaches a maximum at a
depth of ca. 2600 m followed by only a slight decrease
with further increase in depth.
The use of absolute vs. excess sorption data has impor-
tant implications for the uncertainties in estimation of
Gas-In-Place (GIP) as already discussed by Ambrose
et al. (2012). Using the definition of excess sorption, the
total gas storage capacity is simply a sum of the excess
sorption capacity and the free gas capacity which is a
function of gas-filled porosity Φ0:
vtotalðT ; pÞ ¼ vexcessads ðT ; pÞ þ vfreeðT ; p;U0Þ ð2Þ
However, when the absolute sorption data is used for
calculating GIP instead, the calculation of the free gas
storage capacity has to explicitly consider the reducing
effect of the adsorbed molecules on the pore volume avail-
able for the free gas:
vtotalðT ; pÞ ¼ vabsoluteads ðT ; pÞ þ vfreeðT ; p;U0 � UadsÞ ð3Þ
where Φads is the portion of the total gas-filled porosity
taken up by the sorbed molecules. If this effect is ignored,
the calculated total gas storage capacity will be overesti-
mated by the amount equal to the difference between the
absolute and the excess sorption capacity. Accordingly,
and also referring to the discussion by Ambrose et al.(2012), the use of excess sorption should be preferred over
absolute sorption in basin modelling or reservoir simula-
tors as it is the closest representation of the experimental
data and no volumetric corrections need to be made to the
free gas component.
Adsorption capacity and gas content during burial history
The present-day gas quantities in a particular shale gas
play result from a complex interplay between the amount
of gas generated from the breakdown of organic matter
(through thermogenic or biogenic processes) and the
capacity of the rock to retain this gas. Basin modelling
provides an effective tool to study gas generation and the
evolution of the adsorption capacity and the gas content
through burial history. It should be stressed here that the
complexity of the unconventional petroleum system can
hardly be captured by the model and therefore, the quan-
titative results should be interpreted with caution. In
addition to the uncertainties related to the use of ‘abso-
lute’ sorption discussed in the previous section, the char-
acteristics of the pore system and hence the sorption
capacity will change during the thermal maturation. For
coals, these are well established observations (e.g. Hilden-
brandt et al., 2006; Gensterblum et al., 2014). Recentlypublished data on organic-rich shales by Gasparik et al.(2014) and Zhang et al. (2012) have shown that the sorp-
tion capacity and the thermodynamic sorption parameters
change systematically with maturity. In addition, the
presence of moisture has a strong impact reducing the
sorption capacity due to a competitive sorption between
the water and the gas (methane) molecules. In PETRO-
MOD�, only the TOC is used as a scaling parameter and
the influence of maturity and moisture on the sorption
capacity is not captured by the model. As the input
Fig. 20. Methane sorption capacity (excess and absolute) as a
function of depth calculated from the experimental sorption data
for the Posidonia Shale (VRr = 1.5%). A significant deviation
between the excess and the absolute sorption (as used by PETRO-
MOD�) can be observed. The shaded area indicates the limit of
experimental data. The geothermal and hydrostatic gradients as
well as the surface temperature are indicated below the plot.
© 2014 The AuthorsBasin Research © 2014 John Wiley & Sons Ltd, European Association of Geoscientists & Engineers and International Association of Sedimentologists28
B. Bruns et al.

experimental sorption data by Gasparik et al. (2014) arebased on overmature (VRr = 1.5%) Posidonia Shale sam-
ples at dry conditions, the calculated sorption capacity
should be regarded as a maximum scenario.
Based on the changes in pressure and temperature dur-
ing the burial evolution in the Lower Saxony Basin and
West Netherlands Basin, the results for the Posidonia
Shale (Fig. 16) show that the sorption capacity increases
initially up to a depth of ca. 1000 m for the Lower Sax-
ony Basin and the West Netherlands Basin (compare with
Fig. 20) and thereafter decreases reaching a minimum
value at the maximum burial depth. In the Lower Saxony
Basin where a significant uplift took place during the
Upper Cretaceous the sorption capacity has remained
rather constant since. This reflects the fact that the abso-
lute sorption changes less with depth after reaching its
maximum value (Fig. 20). This is also shown in Fig. 19f,
where different maximum burial depths or erosion
amounts, respectively and their influence on sorption
capacity have been tested. Here, using the same basal heat
flow trend, varying amounts between 2300 and 3300 m of
layer thickness removed during the Subhercynian inver-
sion of the Lower Saxony Basin illustrate the sensitivity
of sorption capacity to changes in burial depth and respec-
tive compaction and porosity as well as burial temperature
(compare with Fig. 20).
The gas content and the relative proportion of
adsorbed and free gas depends on the amount of gas
generated (TR) and the total storage capacity (sorbed
gas + free gas). In PETROMOD� simulation, the accumu-
lation of adsorbed gas precedes that of free gas which
starts accumulating when the generated gas exceeds the
sorption capacity. In reality, however, the sorbed gas can
only coexist in a thermodynamic equilibrium with the free
gas component in the pore space (or dissolved gas in
liquid). When the pore space is initially saturated with
water, a free gas phase may form from the early gas as the
dissolution of methane in water is very small and the sorp-
tion capacity can be as low as 40–50% of that for a dry
shale. Within the oil generation window, the produced
hydrocarbons drive the water out of the shale and the pore
space becomes increasingly saturated with oil which can
contain significant quantities of dissolved gas. The
increasing partial gas pressure drives the oil expulsion as
the maturation continues. Finally, due to secondary
cracking of the retained oil and pyrobitumen, additional
pore space is created for the free gas phase. Generation of
secondary porosity due to thermal breakdown of organic
matter is considered in PETROMOD�, but the influence of
core plugging by bitumen within the oil window and
secondary porosity inside the kerogen and solid bitu-
men network are not. Further uncertainties in estimated
porosity arise from mineral precipitation, as well as
thermo-mechanical effects on the pore system dur-
ing hydrocarbon generation and under the influence of
effective stress. Such effects are still poorly understood
and up to now very few experimental data have been pub-
lished for shales (e.g. Eseme et al., 2007, 2012).
Implications for shale gas potential and exploration risk
Hao et al. (2013) have discussed the potential risks for
shale gas exploration in China and indicated that the pres-
ent-day gas amounts in gas-mature shales are primarily
controlled by the loss of free gas during and after the peak
gas window. Hence, relatively low expulsion efficiency
during the maximum burial and little or no tectonic fault-
ing during the uplift phase (for inverted basins) are bene-
ficial for decreased exploration risk for shale gas. In fact,
most of the high-maturity productive shales in the US
have behaved as closed or semi-closed systems during and
after the peak gas generation and have remained over-
pressured up to present.
The outcome of a petroleum system model simulation
with respect to the present-day gas content and the rela-
tive abundance of free and adsorbed gas will therefore
strongly depend on the properties of the adjacent litholo-
gies and whether the source rock is modelled as open or
closed (perfect seal) system. At great depths, the free gas
component will be the dominant contributor to the total
gas content as the sorption capacity is reduced at high
temperatures. Hence, the adsorption cannot preserve this
gas which can be expelled during the maximum burial or
during subsequent uplift. Significant losses of free gas can
lead to under-saturation during the uplift stage (Genst-
erblum et al., 2014).The results presented in this study were obtained
under the assumption of an open system (relatively per-
meable seals above the source rocks & open model bound-
aries) and therefore represent a rather conservative
scenario (under the aspect of open/closed-system behav-
iour). Figure 16 shows that the present-day gas content
in the Posidonia Shale in that area of the Lower Saxony
Basin is preserved at roughly the same level as at the end
of hydrocarbon generation (TR = 100%) before the max-
imum burial stage (100–89 Ma) prior to the uplift phase.
The calculated portion of the adsorbed gas relative to the
total gas is almost 100%. However, this value should not
be regarded as meaningful and the real value is likely to be
<60% at a given depth. The reason for this, as already
mentioned earlier, is that PETROMOD� treats the adsorbed
gas as an independent phase and the free gas can only exist
when the adsorption capacity is exceeded. While this
should not affect the total gas content, the relative propor-
tion of free gas can be considerably underestimated. A
similar situation exists in the West Netherlands Basin
which has experienced much less uplift than the Lower
Saxony Basin and for which the ratio of sorbed over total
gas calculated is also almost 1.
CONCLUSIONS
● Major prospective areas within the study area showing
shale gas potential at present day are confined to the
Lower Saxony Basin, southern Gifhorn Trough and
West Netherlands Basin.
© 2014 The AuthorsBasin Research © 2014 John Wiley & Sons Ltd, European Association of Geoscientists & Engineers and International Association of Sedimentologists 29
Shale gas in the Wealden and Posidonia Shale
● The distribution and thickness of the Wealden and
Posidonia Shale has been reassessed, providing new
source-rock thickness maps.
● Temperature history reconstruction and source-rock
maturity evaluation are based on two different tec-
tonic and thermal evolution scenarios incorporating
major uplift events that affected the study area. Sce-
nario 2 takes heat flow trends from published litera-
ture into account (higher heat flows during rifting/
thinning of the crust), whereas Scenario 1 has been
compiled considering in addition the effect of
uplifted hot crust during inversion and cooling by
thick sedimentary piles during rapid sedimentation.
At time of deepest burial prior to the Upper Creta-
ceous uplift the basal heat flow can differ by up to
17 mW m�2.
● High-resolution erosion maps are now available, espe-
cially for the Late Cretaceous inversion.
● During the Upper Cretaceous (89 Ma) the Posidonia
Shale in the Lower Saxony Basin was characterized
by burial depths as deep as 10 000 m (Scenario 1) and
7800 m (Scenario 2) resulting in temperatures of up
to 330°C. Maturities in some parts of the Lower Sax-
ony Basin depocentre reached the overmature state.
The average maturation in the basin centre reached
the dry gas stage (>2.3% VRr), whereas the basin
margin maturities remained in the oil window.
● Prior to the Subhercynian erosion the end of sedimen-
tation in the West Netherlands Basin was only partly
characterized by greatest burial depths. Average bur-
ial depths of the Posidonia Shale equalled 2600 m in
the centre and 1600 m at the basin flanks. Tempera-
tures ranged between 75 and 120°C resulting in matu-
rities of 0.4–1.2% VRr. Thus, large parts of the basin
had reached the oil generation stage.
● The Subhercynian inversion induced strongest uplift
and erosion of the Lower Saxony Basin removing up
to 8950 m (Scenario 1) and 6800 m (Scenario 2) of
basin infill. Today, the top of the Posidonia Shale can
be found at depths of up to 3600 m with deepest loca-
tions in the northwestern West Netherlands Basin,
northern Lower Saxony Basin and northeastern Pom-
peckj Basin.
● In the Central and West Netherlands basins the
Subhercynian erosion removed up to 2900 m (Sce-
nario 1) and 2200 (Scenario 2) of basin infill. Burial of
the Posidonia Shale, especially in the southwestern
part of the West Netherlands Basin, continued until
present day. Burial depths of up to 3600 m result in
temperatures of up to 140°C and maturities up to the
late oil-early gas generation stage (1.3% VRr).
● The Wealden in the Lower Saxony Basin was charac-
terized by greatest burial depths of up to 7900 m
(Scenario 1) and 5800 m (Scenario 2) resulting in
temperatures of up to 260°C. Maturities in some con-
fined parts of the Lower Saxony Basin depocenter
reached up to 3.7% VRr; the average maturation in
the basin centre reached the dry gas stage (>2.3%
VRr), whereas the basin margin maturities remained
in the oil window. The Wealden-equivalent Coevor-
den Formation in the Netherlands still remained
immature. The top of the Wealden at present day can
be found at depths of up to 2700 m. In large parts of
the Lower Saxony Basin the top has been uplifted and
is now only at a few hundred metres depth or even at
the surface.
● Burial/inversion scenario 1 generally favours gas
sorption in comparison to scenario 2. Due to deeper
burial and lower temperature gradients, higher
amounts of gas are expected.
● For the Posidonia Shale in the Lower Saxony Basin
bulk adsorption capacities (note that bulk adsorption
capacities are given for the total layer thickness within
a grid cell size of 1 km2) of about 1.3*106 tons and gas
contents of up to 82 scf ton�1 rock have been pre-
dicted. The capacities at the northern and eastern
boundaries of the Lower Saxony Basin, Pompeckj
Basin and Gifhorn Trough range around 2.5*106 tons.
In the West Netherlands Basin, capacities range
between 1.2 and 2.8*106 tons. In the southern area of
the Gifhorn Trough and southwestern flank of the
West Netherlands Basin, average gas contents of up to
95 scf ton�1 rock have been predicted.
● Bulk adsorption capacity of the Wealden is highest in
areas with increased layer thickness and ranges up to
27*106 tons. Gas contents calculated for the Ems
river area reach values up to 26 scf ton�1 rock and for
the Hunte river area up to 45 scf ton�1 rock.
ACKNOWLEDGEMENTS
This work was financially supported by the GASH – Gas
Shales in Europe Initiative. The authors thank Schlum-
berger for providing an academic license of the PETRO-
MOD� software package as well as Prof. Cynthia Ebinger,
Dr. H.-J. Brink and an anonymous reviewer for providing
constructive comments.
REFERENCESADRIASOLA-MU~NOZ, Y., LITTKE, R. & BRIX, M.R. (2007) Fluid
systems and basin evolution of the western Lower Saxony
Basin, Germany.Geofluids, 7, 335–355.van ADRICHEM BOOGAERT, H.A. & KOUWE, W.F.P. (1993) Strati-
graphic nomenclature of the Netherlands, revision and update
by RGD and NOGEPA.Meded. Rijks Geol. Dienst, 50, 1–40.ALTEBAEUMER, F.J. (1982) Studies on hydrocarbon genesis in
clay stones of the Upper Jurassic Delta (Pliensbachium) in the
North West German Basin, with particular regard to the
influence of the hot intrusive masses of Bramsche and Vlotho.
Dissertation, RWTH Aachen University, Aachen.
AMBROSE, R.J., HARTMAN, R.C. & DIAZ-CAMPOS, M. (2012)
Shale gas-in-place calculations part I: new pore-scale consid-
erations. SPE J., 17(1), 219–229.
© 2014 The AuthorsBasin Research © 2014 John Wiley & Sons Ltd, European Association of Geoscientists & Engineers and International Association of Sedimentologists30
B. Bruns et al.

ANDRULEIT, H., BAHR, A., B€ONNEMANN, C., ERBACHER, J.,
FRANKE, D., GERLING, J.P., GESTERMANN, N., HIMMELSBACH,
T., KOSINOWSKI, M., KRUG, S., PIERAU, R., PLETSCH, T.,
ROGALLA, U., SCHL€OMER, S. & Niko-Projekt-Team (2012)
Abschätzung des Erdgaspotenzials aus dichten Tongesteinen(Schiefergas) in Deutschland. Bundesanstalt fur Geowissens-
chaften und Rohstoffe (BGR), Hannover.
BALDSCHUHN, R. & KOCKEL, F. (1999) Das Osning-Lineament
am Sudrand des Niedersachsen-Beckens. Zeitschrift der Deuts-chen Geologischen Gesellschaft, 150(4), 673–695.
BALDSCHUHN, R., KOCKEL, F., BEST, G., DENEKE, E., FRISCH,
U., JUERGENS, U., SCHMITZ, J., SATTLER–KOSINOWSKI, S.,
STANCU–KRISTOFF, G. & ZIRNGAST, M. (1996) GeotektonischerAtlas von NW–Deutschland/Tectonic Atlas of NW–Germany1:300 000. Bundesanstalt fur Geowissenschaften und Rohst-
offe (BGR), Hannover.
van BALEN, R.T., HOUTGAST, R.F. & CLOETINGH, S.A.P.L.
(2005) Neotectonics of the Netherlands; a review. In: Neotec-tonics and Quaternary Fault-Reactivation in Europe’s IntraplateLithosphere (Ed. by S.A.P.L. Cloetingh & T.G.M. Cornu),
pp. 439–454. Pergamon, Oxford.
BARTENSTEIN, H., TEICHMULLER, M. & TEICHMULLER, R. (1971)
Die Umwandlung der organischen Substanz im Dach des
Bramscher Massivs. Fortschr. Geol. Rheinl. u. Westf., 18, 501–538.
BILGILI, F., G€OTZE, H.-J., PASTEKA, R., SCHMIDT, S. & HACK-
NEY, R. (2009) Intrusion versus inversion – a 3D density
model of the southern rim of the Northwest German Basin.
Int. J. Earth Sci., 98(3), 571–583.BLUMENSTEIN, I.O., KROOSS, B.M., di PRIMIO, R., ROTTKE, W.,
MULLER, E., WESTERLAGE, C. & LITTKE, R. (2008) Biodegra-
dation in numerical basin modelling: a case study from the
Gifhorn Trough, N-Germany. Int. J. Earth Sci., 97, 1115–1129.
BREITKREUZ, C., GEISSLER, M., SCHNEIDER, J. & KIERSNOWSKI,
H. (2008) Basin initiation: volcanism and sedimentation. In:
Dynamics of Complex Intracontinental Basins (Ed. by R. Littke,U. Bayer, D. Gajewski & S. Nelskamp), pp. 173–180.Springer-Verlag, Berlin.
BRINK, H.-J. (2002) Die Anomalien von Bramsche, wieder eine
offene Frage? Erdol Erdgas Kohle, 118(1), 18–22.BRINK, H.-J. (2010) Classification of the Central European
Basin System (CEBS). DGMK Research Report, 577-2/4,
pp. 63.
BRINK, H.-J. (2012) Kosmische Wurfelspiele und die Entwick-
lung der Erde. Dinslaken (Athene Media), pp. 120.
BRINK, H.-J. (2013) Die Intrusion von Bramsche – ein Irr-
tum im invertierten Niedersachsischen Becken? Zeitschr.D. Ges. Geowiss., 164(1), 33–48.
BROCKAMP, B. (1967) Kurzbericht uber die im Gebiet um Os-
nabruck durchgefuhrten seismischen Arbeiten des Instituts
fur Reine und Angewandte Geophysik der Universitat Mun-
ster. Veroff. Dt. Geodat. Komm., B153, 1–12.BRUNS, B., di PRIMIO, R., BERNER, U. & LITTKE, R. (2013) Petro-
leum system evolution in the inverted Lower Saxony Basin,
northwest Germany: a 3D basin modeling study. Geofluids, 13(2), 246–271.
BUKER, C., LITTKE, R. & WELTE, D.H. (1995) 2D–modeling
of the thermal evolution of Carboniferous and Devonian
sedimentary rocks of the eastern Ruhr basin and northern
Rhenish Massif, Germany. Zeitschr. D. Ges. Geowiss., 146,321–339.
BUSCH, A. & GENSTERBLUM, Y. (2011) CBM and CO2-ECBM
related sorption processes in coal: a review. Int. J. Coal Geol.,87, 49–71.
CHAUSSARD, E. & AMELUNG, F. (2014) Regional controls on
magma ascent and storage in volcanic arcs. Geochem. Geophys.Geosyst., 15(4), 1407–1418.
CLOETINGH, S. & ZIEGLER, P.A. (2007) Tectonic models for the
evolution of sedimentary basins. In: Crust and LithosphereDynamics. Treatise on Geophysics, Vol. 6 (Ed. by A.B. Watts),
pp. 485–611. Elsevier B.V., Amsterdam.
De JAGER, J. & GELUK, M.C. (2007) Petroleum geology. In:
Geology of the Netherlands: Royal Netherlands Academy of Artsand Science (Ed. by T.E. Wong, D.A.J. Batjes & J. De Jager),
pp. 241–264. Elsevier, Netherlands.
DOORNENBAL, H. & STEVENSON, A., editors. (2010) PetroleumGeological Atlas of the Southern Permian Basin Area. EAGE
Publications, b.v., Houten.
DROZDZEWSKI, G. & WREDE, V. (1994) Faltung und Bruchtekto-
nik – Analyse der Tektonik im Subvariscikum. Fortschr. Geol.Rheinl. u. Westf., 38, 7–187.
DUIN, E.J.T., DOORNENBAL, J.C., RIJKERS, R.H.B., VERBEEK,
J.W. & WONG, T.E. (2006) Subsurface structure of the Neth-
erlands – results of recent onshore and offshore mapping.
Netherlands J. Geosci., 85, 245–276.ESEME, E., URAI, J.L., KROOSS, B.M. & LITTKE, R. (2007)
Review of mechanical properties of oil shales: implications for
exploitation and basin modelling. Oil Shale, 24(2), 159–174.ESEME, E., KROOSS, B.M. & LITTKE, R. (2012) Evolution of pe-
trophysical properties of oil shales during high-temperature
compaction tests: implications for petroleum expulsion. Mar.Pet. Geol., 31, 110–124.
FRANKE, W. (2000) The mid-European segment of the Varis-
cides: tectonostratigraphic units, terrane boundaries and plate
tectonic evolution.Geol. Soc. Spec. Publ., 179, 35–61.GASPARIK, M., GHANIZADEH, A., BERTIER, P., GENSTERBLUM, Y.,
BOUW, S. & KROOSS, B.M. (2012) High-pressure methane
sorption isotherms of Black Shales from The Netherlands.
Energy Fuels, 26(8), 4995–5004.GASPARIK, M., BERTIE, R.P., GENSTERBLUM, Y., GHANIZADEH,
A., KROOSS, B.M. & LITTKE, R. (2014) Geological controls on
the methane storage capacity in organic-rich shales. Int. J.Coal Geol., 123, 34–51.
GELUK, M.C. (2007) Triassic. In: Geology of the Netherlands(Ed. by T.E. Wong, D.A.J. Batjes & J. de Jager), pp. 85–106.Royal Netherlands Academy of Arts and Science, Nether-
lands.
GENSTERBLUM, Y., MERKEL, A., BUSCH, A., KROOSS, B.M. &
LITTKE, R. (2014) Gas saturation and CO2 enhancement
potential of coalbed methane reservoirs as a function of depth.
Am. Assoc. Pet. Geol. Bull., 98(2), 395–420.GERLING, P., GELUK, M.C., KOCKEL, F., LOKHORST, A., LOTT,
G.K. & NICHOLSON, R.A. (1999a) NW European Gas Atlas
– new implications for the Carboniferous gas plays in the
western part of the Southern Permian Basin. Geol. Soc.Lond., Petr. Geol. Conf. Ser., 5, 799–808.
GERLING, P., KOCKEL, F. & KRULL, P. (1999b) Das Kohlenwass-
erstoff–Potential des Pr€Awestfals im norddeutschen Becken –Eine Synthese. DGMK Research Report, 433, Hamburg.
GLENNIE, K.W. (1986) Development of N.W. Europe’s South-
ern Permian gas basin. Geol. Soc. Spec. Publ., 23, 3–22.HANTSCHEL, T. & KAUERAUF, A.I. (2009) Fundamentals of Basinand Petroleum Systems Modeling. Springer, Dordrecht.
© 2014 The AuthorsBasin Research © 2014 John Wiley & Sons Ltd, European Association of Geoscientists & Engineers and International Association of Sedimentologists 31
Shale gas in the Wealden and Posidonia Shale
HAO, F., ZOU, H. & LU, Y. (2013) Mechanisms of shale gas stor-
age: implications for shale gas exploration in China. Am. As-soc. Pet. Geol. Bull., 97(8), 1325–1346.
HECHT, F., HERING, O. & KNOBLOCK, J. (1962) Stratigraphie,
Speichergesteins-Ausbildung und Kohlenwasserstoff-Fuh-
rung im Rotliegenden und Karbon der Tiefbohrung Hoya
Z1. Fortschr. Geol. Rheinl. u. Westf., 3, 1061–1074.HILDENBRANDT, A., KROOS, B.M., BUSCH, A. & GASCHNITZ, R.
(2006) Evolution of methane sorption capacity of coal seams
as a function of burial history – a case study from the Campine
Basin, NE Belgium. Int. J. Coal Geol., 66(3), 179–203.HOFFMANN, N., HENGESBACH, L., FRIEDRICHS, B. & BRINK, H.-J.
(2008) The contribution of magnetotellurics to an improved
understanding of the geological evolution of the North Ger-
man Basin – review and new results. Zeitschrift der DeutschenGesellschaft fur Geowissenschaften, 159(4), 591–606.
van HOORN, B. (1987) Structural evolution, timing and tectonic
style of the Sole Pit inversion. Tectonophysics, 137, 309–334.de JAGER, J. (2007) Geological development. In: Geology of theNetherlands: Royal Netherlands Academy of Arts and Science(Ed. by T.E. Wong, D.A.J. Batjes & J. de Jager), pp. 5–26.Elsevier, Netherlands.
JOHN, H. (1975) Hebungs- und Senkungsvorgange in Nord-
westdeutschland. Erdol u. Kohle, Erdgas, Petrochemie, 28 (6),
273–277.KLEY, J. & VOIGT, T. (2008) Late Cretaceous intraplate thrust-
ing in central Europe: effect of Africa-Europe-Iberia conver-
gence, not Alpine collision. Geology, 36, 839–842.KOCKEL, F. (2002) Rifting processes in NW–Germany and the
German North Sea Sector.Neth. J. Geosci., 81, 149–158.KOCKEL, F. (2003) Inversion structures in Central Europe –expressions and reasons, an open discussion. Neth. J. Geosci.,82(4), 367–382.
KRZYWIEC, P. (2006) Structural inversion of the Pomeranian and
Kuiavian segments of the Mid-Polish Trough – lateral varia-
tions in timing and structural style.Geol. Q., 51(1), 151–168.LEISCHNER, K. (1994) Kalibration simulierter Temperaturges-
chichten. Dissertation, Berichte des Forschungszentrums
Julich, Julich.
LEISCHNER, K., WELTE, D.H. & LITTKE, R. (1993) Fluid inclu-
sions and organic maturity parameters as calibration tools in
basin modeling. Spec. Pub. - Norw. Petrol. Soc., 3, 161–172.LEYTHAEUSER, D., LITTKE, R., RADKE, M. & SCHAEFER, R.G.
(1988) Geochemical effects of petroleum migration and
expulsion from Toarcian source rocks in the Hils syncline
area, NW-Germany. Org. Geochem., 13(1–3), 489–502.LITTKE, R., BAKER, D.R. & LEYTHAEUSER, D. (1988) Micro-
scopic and sedimentologic evidence for the generation and
migration of hydrocarbons in Toarcian source rocks of differ-
ent maturities. Org. Geochem., 13, 549–559.LITTKE, R., BUEKER, C., LUECKGE, A., SACHSENHOFER, R.F. &
WELTE, D.H. (1994) A new evaluation of palaeo-heat flows
and eroded thicknesses for the Carboniferous Ruhr basin,
western Germany. Int. J. Coal Geol., 26(3–4), 155–183.LITTKE, R., KROOSS, B.M., IDIZ, E. & FRIELINGSDORF, J. (1995)
Molecular nitrogen in natural gas accumulations: generation
from sedimentary organic matter at high temperature. Am.Assoc. Pet. Geol. Bull., 79, 410–430.
LITTKE, R., JENDRZEJEWSK, I.L., LOKAY, P., SHUANGQING, W. &
RULLK€OTTER, J. (1998) Organic geochemistry and deposi-
tional history of the Barremian-Aptian boundary interval in
the Lower Saxony Basin, northern Germany. Cretac. Res., 19,581–614.
LITTKE, R., BAYER, U., GAJEWSKI, D. & NELSKAMP, S. (2008)
Dynamics of Complex Intracontinental Basins, 519 pp.
Springer-Verlag, Berlin, Heidelberg.
LITTKE, R., KROOSS, B., UFFMANN, A.K., SCHULZ, H.M. &
HORSFIELD, B. (2011) Unconventional gas resources in the
Paleozoic of Central Europe. Oil Gas Sci. Technol., 66 (6),
953–977.de LUGT, I.R., VAN WEES, J.D. & WONG, T.E. (2003) The tec-
tonic evolution of the southern Dutch North Sea during the
Paleogene: basin inversion in distinct pulses. Tectonophysics,373, 141–159.
MAROTTA, A.M., BAYER, U., SCHECK, M. & THYBO, H. (2001)
The stress field below the NE German Basin: effects indeuced
by the Alpine collision. Geophys. J. Int., 144(2), F8–F12.MAYSTRENKO, Y., BAYER, U., BRINK, H.-J. & LITTKE, R. (2008)
The Central European basin system – an overview. In:
Dynamics of Complex Intracontinental Basins (Ed. by R. Littke,U. Bayer, D. Gajewski & S. Nelskamp), pp. 15–34. Springer-Verlag, Berlin.
MAYSTRENKO, Y., BAYER, U. & SCHECK–WENDEROTH, M. (2010)
Structure and evolution of the Central European Basin Sys-
tem according to 3D modeling. DGMK Research Report, 577–2/2, Hamburg.
MCKENZIE, D. (1978) Some remarks on the development of sed-
imentary basins. Earth Planet. Sci. Lett., 40, 25–32.MILLER, K.G., KOMINZ, M.A., BROWNING, J.V., WRIGHT, J.D.,
MOUNTAIN, G.S., KATZ, M.E., SUGARMAN, P.J., CRAMER,
B.S., CHRISTIE–BLICK, N. & PEKAR, S.F. (2005) The Phanero-
zoic record of global sea–level change. Science, 310, 1293–1298.
NELSKAMP, S. (2011) Structural evolution, temperature and
maturity of sedimentary rocks in the Netherlands: results of
combined structural and thermal 2D modeling. Dissertation,
RWTH Aachen University, Aachen.
NELSKAMP, S., DAVID, P. & LITTKE, R. (2008) A comparison of
burial, maturity and temperature histories of selected wells
from sedimentary basins in The Netherlands. Int. J. EarthSci., 97, 931–953.
NEUNZERT, G.H., GAUPP, R. & LITTKE, R. (1996) Absenkungs–und Temperaturgeschichte palaozoischer und mesozoischer
Formationen im Nordwestdeutschen Becken. Zeitschrift derDeutschen Geologischen Gesellschaft, 147, 183–208.
ONCKEN, O., PLESCH, A., WEBER, J., RICKEN, W. & SCHRADER, S.
(2000) Passive margin detachment during arc-continent colli-
sion (Central European Variscides). Geol. Soc. Spec. Publ.,179, 199–216.
PEPPER, A.S. & CORVI, P.J. (1995a) Simple kinetic models of
petroleum formation. Part I: oil and gas generation from kero-
gen.Mar. Pet. Geol., 12(3), 291–319.PEPPER, A.S. & CORVI, P.J. (1995b) Simple kinetic models of
petroleum formation. Part II: oil-gas cracking. Mar. Pet.Geol., 12(3), 321–340.
PETMECKY, S.P. (1998) Numerische Simulation der Ent-
wicklungsgeschichte des zentralen Niedersachsischen
Beckens unter besonderer Berucksichtigung der Erdgaslag-
erstatten–Bildung. Dissertation, Berichte des Forschungszen-
trums Julich, Julich.
PETMECKY, S.P., MEIER, L., REISER, H. & LITTKE, R. (1999)
High thermal maturity in the Lower Saxony Basin: intrusion
or deep burial? Tectonophysics, 304, 317–344.PETRINI, K. & PODLADCHIKOV, Y. (2000) Lithospheric pressure-
depth relationship in compressive regions of thickened crust.
J. Metamorph. Geol., 18, 67–77.
© 2014 The AuthorsBasin Research © 2014 John Wiley & Sons Ltd, European Association of Geoscientists & Engineers and International Association of Sedimentologists32
B. Bruns et al.

di PRIMIO, R. & HORSFIELD, B. (2006) From petroleum type org-
anofacies to hydrocarbon phase prediction. Am. Assoc. Pet.Geol. Bull., 90(7), 1031–1058.
RESAK, M., NARKIEWICZ, M. & LITTKE, R. (2008) New basin
modeling results from the Polish part of the Central Euro-
pean Basin system: implications for the Late Cretaceous-
Early Paleogene structural inversion. Int. J. Earth Sci., 97,955–972.
RIPPEN, D., LITTKE, R., BRUNS, B. & MAHLSTEDT, N. (2013)
Organic geochemistry and petrography of Lower Cretaceous
Wealden black shales of the Lower Saxony Basin: the transi-
tion from lacustrine oil shales to gas shales. Org. Geochem., 63,18–36.
SCHEIBE, R., SEIDEL, K., VORMBAUM, M. & HOFFMANN, N.
(2005) Magnetic and gravity modelling of the crystalline base-
ment in the North German Basin. Zeitschrift der DeutschenGesellschaft fur Geowissenschaften, 156(2), 291–298.
SCHEIDT, G. & LITTKE, R. (1989) Comparative organic petrology
of interlayered sandstones, siltstones, mudstones and coals in
the Upper Carboniferous Ruhr basin, Northwest Germany,
and their thermal history and methane generation. Geol. Run-dsch., 78, 375–390.
SCHMIDT, A. (1914) Die magnetische Vermessung I. Ordnung desKonigreichs Preußen 1898–1903 nach den Beobachtungen vonM. Eschenhagen und J. Edler, Vol. 276, pp. 43. Veroffentli-chung des Koniglich-Preussischen Meteorologischen Instit-
uts, Berlin (Behrend).
SCHWARZER, D. & LITTKE, R. (2007) Petroleum generation and
migration in the ‘Tight Gas’ area of the German Rotliegend
natural gas play: a basin modeling study. Petrol. Geosci., 13,37–62.
SCHWARZKOPF, T. (1987) Herkunft und Migration des Erdols in
ausgewahlten Dogger beta Lagerstatten des Gifhorner Tro-
ges: Wechselwirkungen zwischen Kohlenwasserstoffgenese
und Sandsteindiagense. Dissertation, RWTH Aachen,
Aachen.
SENGLAUB, Y., BRIX, M.R., ADRIASOLA, A.C. & LITTKE, R.
(2005) New information on the thermal history of the
southwestern Lower Saxony Basin, northern Germany,
based on fission track analysis. Int. J. Earth Sci., 95(5–6),876–896.
SENGLAUB, Y., LITTKE, R. & BRIX, M.R. (2006) Numerical mod-
elling of burial and temperature history as an approach for an
alternative interpretation of the Bramsche anomaly, Lower
Saxony Basin. Int. J. Earth Sci., 95, 204–224.STADLER, G. (1971) Die Vererzung im Bereich des Bramscher
Massivs und seiner Umgebung. Fortschr. Geol. Rheinl. Westf.,18, 439–500.
STADLER, G. & TEICHMULLER, R. (1971) Zusammenfassender€Uberblick uber die Entwicklung des Bramscher Massivs und
des Niedersachsischen Tektogens. Fortschr. Geol. Rheinl. u.Westf., 18, 547–564.
STAHL, W. (1971) Isotopen-Analysen an Carbonaten und Kohl-
endioxid-Proben aus dem Einflußbereich und der weiteren
Umgebung des Bramscher Intrusivs und an hydrothermalen
Carbonaten aus dem Siegerland. Fortschr. Geol. Rheinl. u.Westf., 18, 429–438.
STAMPFLI, G.M. & BOREL, G.D. (2004) The TRANSMED
Transects in space and time: constraints on the Paleotectonic
evolution of the Mediterranean domain. In: The TRANS-MED Atlas, the Mediterranean Region from Crust to Mantle(Ed. by W. Cavazza, F.M. Roure, G.M. Stampfli & P.A. Zie-
gler), pp. 52–80. Springer, Berlin, Heidelberg.
SWEENEY, J.J. & BURNHAM, A.K. (1990) Evaluation of a simple
model of vitrinite reflectance based on chemical kinetics. Am.Assoc. Pet. Geol. Bull., 74, 1559–1570.
TEICHMULLER, R. & TEICHMULLER, M. (1985) Inkohlungsgradi-
enten in der Anthrazitfolge des Ibbenburener Karbons. Forts-chr. Geol. Rheinl. u. Westf., 33, 231–253.
TEICHMULLER, M., TEICHMULLER, R. & BARTENSTEIN, H. (1979)
Inkohlung und Erdgas in Nordwestdeutschland. Eine Ink-
ohlungskarte der Oberflache des Oberkarbons. Fortschr. Geol.Rheinl. u. Westf., 27, 137–170.
TEICHMULLER, M., TEICHMULLER, R. & BARTENSTEIN, H. (1984)
Inkohlung und Erdgas – eine neue Inkohlungskarte der Kar-
bon-Oberflache in Nordwestdeutschland. Fortschr. Geol.Rheinl. u. Westf., 32(1), 4–34.
UFFMANN, A.K., BRUNS, B. & LITTKE, R. (2010) Dynamics of
the Central European Basin System (CEBS): large scale mod-
els of the Paleozoic petroleum system in the North German
Basin. DGMK Research Report, 577-2/3, Hamburg.
UFFMANN, A.K., LITTKE, R. & RIPPEN, D. (2012) Mineralogy
and geochemistry of Mississippian and Lower Pennsylvanian
Black Shales at the Northern Margin of the Variscan Moun-
tain Belt (Germany and Belgium). Int. J. Coal Geol., 103, 92–108.
Van WEES, J.D., STEPHENSON, R.A., ZIEGLER, P.A., BAYER, U.,
MCCANN, T., DADLEZ, R., GAUPP, R., NARKIEWICZ, M., BIT-
ZER, F. & SCHECK, M. (2000) On the origin of the southern
Permian Basin, Central Europe.Mar. Pet. Geol., 17, 43–59.van WEES, J.D., Van BERGEN, F., DAVID, P., NEPVEU, M.,
BEEKMAN, F., CLOETINGH, S. & BONT�E, D. (2009) Probabi-
listic tectonic heat flow modeling for basin maturation:
assessment method and applications. Mar. Pet. Geol., 26,
536–551.WEHNER, H. (1997) Source and maturation of crude oils in
northern and eastern Germany – an organic geochemical
approach. Geol. Jahrb., Reihe D., 103, 85–102.WYGRALA, B.P. (1989) Integrated Study of an Oil Field in theSouthern Po Basin, Northern Italy, pp. 2313. Berichte Kernf-
orschungsanlage Julich, Julich.
ZHANG, T., ELLIS, G.S., RUPPEL, S.C., MILLIKEN, K. & YANG,
R. (2012) Effect of organic-matter type and thermal maturity
on methane adsorption in shale-gas systems. Org. Geochem.,47, 120–131.
ZIEGLER, P.A. (1990)Geological Atlas of Western and Central Eur-ope. 2nd edn, Shell International, The Hague.
ZIEGLER, P.A., CLOETINGH, S. & van WEES, J.D. (1995) Dynam-
ics of intra-plate compressional deformation: the Alpine fore-
land and other examples. Tectonophysics, 252, 7–59.
Manuscript received 5 May 2014; In revised form 13 October2014; Manuscript accepted 16 October 2014.
© 2014 The AuthorsBasin Research © 2014 John Wiley & Sons Ltd, European Association of Geoscientists & Engineers and International Association of Sedimentologists 33
Shale gas in the Wealden and Posidonia Shale