Embed Size (px)
Citation preview
47th International Conference on Environmental Systems ICES-2017-193 16-20 July 2017, Charleston, South Carolina
Thermal design of the Air Temperature Sensor (ATS) and
the Thermal InfraRed Sensor (TIRS) of the Mars
Environmental Dynamics Analyzer (MEDA) for Mars 2020
I. Pérez Grande1, L. Peinado2, A. Chamorro3, I. Torralbo4, G. Alonso5
Universidad Politécnica de Madrid, Madrid, 28040, Spain
and
José Antonio Rodríguez Manfredi6, Alain Lepinette7, Eduardo Sebastián8
Centro de Astrobiología, Torrejón de Ardoz, Madrid, 28850, Spain
The Mars Environmental Dynamics Analyzer (MEDA) is a suite of sensors that will
operate on the NASA Mars 2020 Rover. Two of the sensors are the Air Temperature Sensor
(ATS) and the Thermal InfraRed Sensor (TIRS).
The main aim of ATS is to measure the atmosphere temperature. It consists of five units
located in different parts of the rover, each including three chromel-constantan
thermocouples. The thermocouples’ wires are subjected to free and natural convection, Sun
illumination and receive infrared radiation from the planet’s surface. The prediction of
accurate temperatures of the wires is crucial for the verification of the correct performance
of the sensor. The main goal of TIRS is to measure the radiative flux emitted by the planet
surface, the sky and the surrounding CO2 atmosphere. It consists of a set of five sensors,
assembled in a common case, working in four wavelength bands. TIRS has a quite strict
thermal requirement in terms of thermal gradients in the sensors, which cannot exceed
24 mK. TIRS will be located in the Remote Sensing Mast (RSM) of the Mars 2020 Rover.
Both sensors are very sensitive from a thermal point of view and require detailed thermal
analysis. Solar, albedo and planetary infrared radiation was considered in the analysis,
together with the convective heat transfer, either natural or forced. For the solar
illumination the effect of the dust was taken into account, including the opacity factor and
the scattering of light. In this work, the results of these thermal analyses are presented. In
particular, the temperatures obtained for the worst case scenarios are given, as well as the
heat fluxes between the relevant elements. Both steady-state and transient cases were
analyzed.
Nomenclature
ATS = Air Temperature Sensor
CAD = Computer Aided Design
GL = Conductive Coupling
GMM = Geometrical Mathematical Model
GR = Radiative Coupling
I/F = Interface
MCRT = Monte Carlo Ray Tracing
1 Full Professor, Instituto de Microgravedad “Ignacio Da Riva”, [email protected].
ORCID: 000-0002-7145-2835. 2 Aerospace Engineer, Instituto de Microgravedad “Ignacio Da Riva”, [email protected]. 3 Thermal Engineer, Instituto de Microgravedad “Ignacio Da Riva”, [email protected]. 4 Thermal Engineer, Instituto de Microgravedad “Ignacio Da Riva”, [email protected]. 5 Associate Professor, Instituto de Microgravedad “Ignacio Da Riva”, [email protected]. 6 Researcher, Centro de Astrobiología (CSIC-INTA), [email protected] 7 Researcher, Centro de Astrobiología (CSIC-INTA), [email protected] 8 Researcher, Centro de Astrobiología (CSIC-INTA), [email protected]
International Conference on Environmental Systems
2
MMRTG = Multi-Mission Radioisotope Thermoelectric Generator
PCB = Printed Circuit Board
PI = Proportional-integral
RSM = Remote Sensing Mast
TIRS = Thermal Infrared Sensor
TMM = Thermal Mathematical Model
WCC = Worst cold case
WHC = Worst hot case
α = Absorptance [dimensionless]
β = Coefficient of thermal expansion [K-1]
C = Constant for Hilpert correlation [dimensionless]
D = Diameter [m]
ε = Emissivity [dimensionless]
Gr = Grashof number [dimensionless]
gM = Mars gravity [m/s2]
h = Heat transfer coefficient [W/m2K]
hc = Thermal contact conductance coefficient [W/m2K]
kCO2 = CO2 thermal conductivity [W/m·K]
Lc = Characteristic length [m]
m = Constant for Hilpert correlation [dimensionless]
ν = Kinematic viscosity [s/m2]
Nu = Nusselt number [dimensionless]
NuD = Nusselt number based on diameter [dimensionless]
Pr = Prandtl number [dimensionless]
Ra = Raleigh number [dimensionless]
Re = Reynolds number [dimensionless]
Tfilm = Film temperature [K]
Ts = Surface temperature [K]
T∞ = Flow temperature [K]
τ = Optical depth or dust opacity [dimensionless]
I. Introduction
HE Mars 2020 mission is a future rover
designed to investigate the habitability of Mars.
The mission is part of NASA's Mars Exploration
Program, a long-term effort of robotic
exploration of the Red Planet. Mars 2020 rover
will be launched in of July 2020 and will land on
Mars in February of 2021. The landing place is
not selected yet, therefore, the worst scenario
among the landing site candidates is used for the
design. The rover will investigate the geology of
the site, assess its habitability and look for signs
of ancient life in Mars. In order to achieve these
scientific goals the rover is equipped with 7
instruments1.
The Mars Environmental Dynamics Analyzer
(MEDA) is one of the Mars 2020 rover
instruments currently being developed for the
mission. This paper is focused on the thermal
design and analysis of two of the sensors of
MEDA instrument. These sensors are the Air
Temperature Sensor (ATS) and the Thermal
InfraRed Sensor (TIRS).
I. T
RSM
TIRS (75°)
X
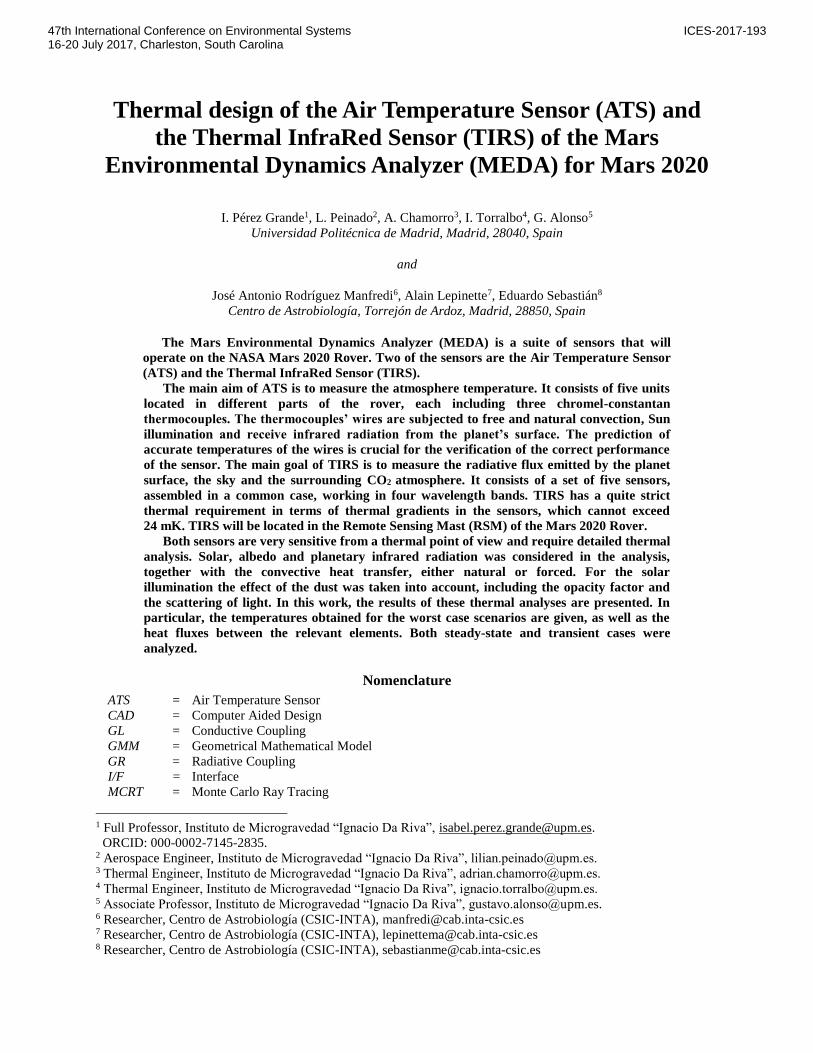
Figure 1. ATS and TIRS locations on rover. ATS1, ATS2,
ATS3 and TIRS are mounted in the Remote Sensing Mast (RSM)
at orientations 50º, 155º, 290º and 75º respectively (clockwise
angles from rover chassis X axis) and ATS4 and ATS5 are
assembled on left and right chassis corners.
International Conference on Environmental Systems
3
II. MEDA Instrument: ATS and TIRS
MEDA instrument is a suite of sensors that will monitor the environmental conditions of the landing site. It is an
evolution of the Rover Environmental Monitoring Station (REMS) of the Mars Science Laboratory (MSL) mission2.
MEDA sensors will measure the Mars near-surface atmosphere and ground temperatures, wind speed and direction,
pressure and relative humidity. A camera pointing to sky is assembled in MEDA and also a set of photo-detectors
for sky imaging and measurement of ultra-violet, visible and near infrared irradiations at several bands that will
allow characterization of the atmospheric dust. ATS and TIRS are externally mounted on the Mars 2020 rover as it
can be observed in Figure 1.
a. ATS
The objective of ATS is to determine
the temperature of Martian atmosphere
close to the rover. There are 5 units that
will be externally accommodated on the
Mars 2020 rover. Three of them are
mounted on the Remote Sensing Mast
(RSM) of the rover, and another two
sensors are mounted on vertical surfaces
of the rover chassis corners.
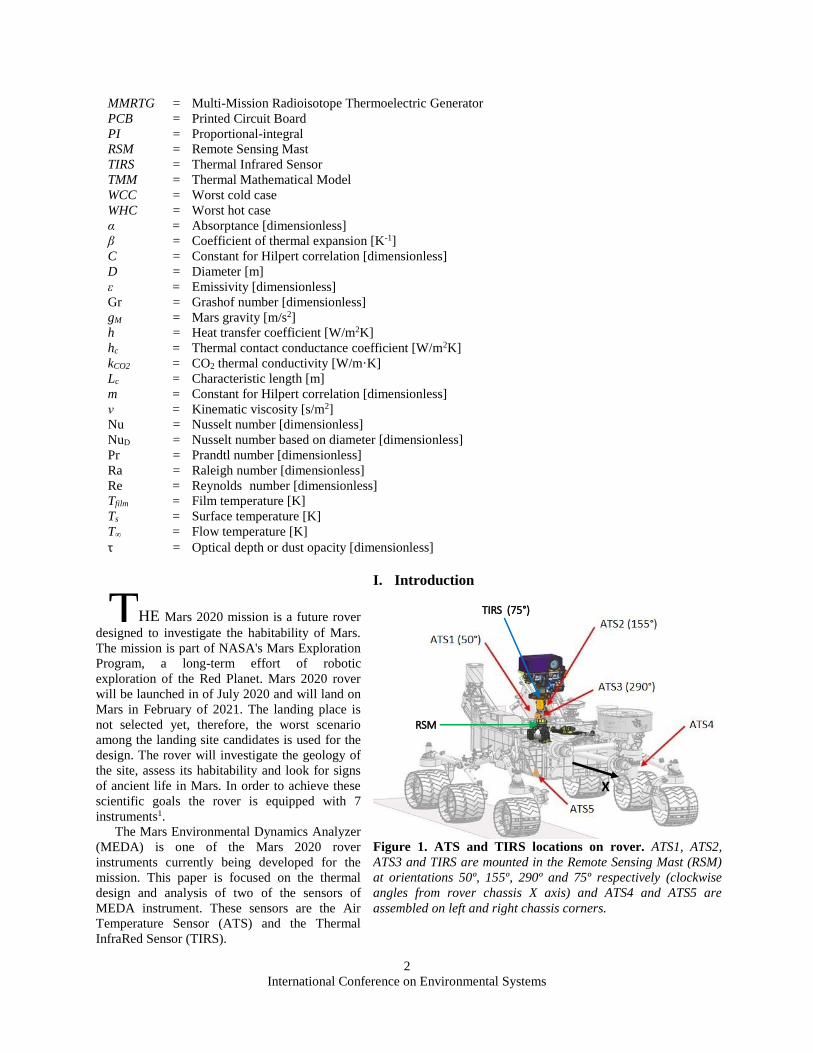
ATS is a passive instrument, based on
3 redundant thermocouples mounted in
parallel and vertically in a FR4 structure,
as can be seen in Figure 2. The
thermocouple thin-wires are constantan-
chromel (E-type) of 0.075 mm diameter with butt-welded junction. The reference junctions are the junctures of the
thermocouple wires to copper wires. Those junction blocks (cold junctions) consist of two alumina pieces housed
into an isothermal block of aluminum located in the base support of ATS whose temperature is measured with a
Pt1000 thermistor. Each sensor is within a volume of 23.9 mm x 57.4 mm x 65 mm.
Since the main goal of ATS is to properly measure the temperature of the Martian atmosphere the thermal design
must guarantee that the thermocouple wires are as close as possible to the temperature of the air. This objective is
carried out by thermally insulating the sensor from the rover, by reducing the absorbed external radiation and by
exposing the thermocouple wires directly to the atmosphere to allow proper convection in the wires.
The structure of ATS is made of FR4 composite which has low thermal conductivity. The external FR4 structure
of ATS is painted white (except for the FR4 back cover), as well as TIRS and the rover chassis, to minimize the
solar radiation absorption.
b. TIRS
The purpose of TIRS is to measure the
thermal infrared radiation emitted by the
ground, sky and atmosphere, as well as
solar reflected radiation on the ground.
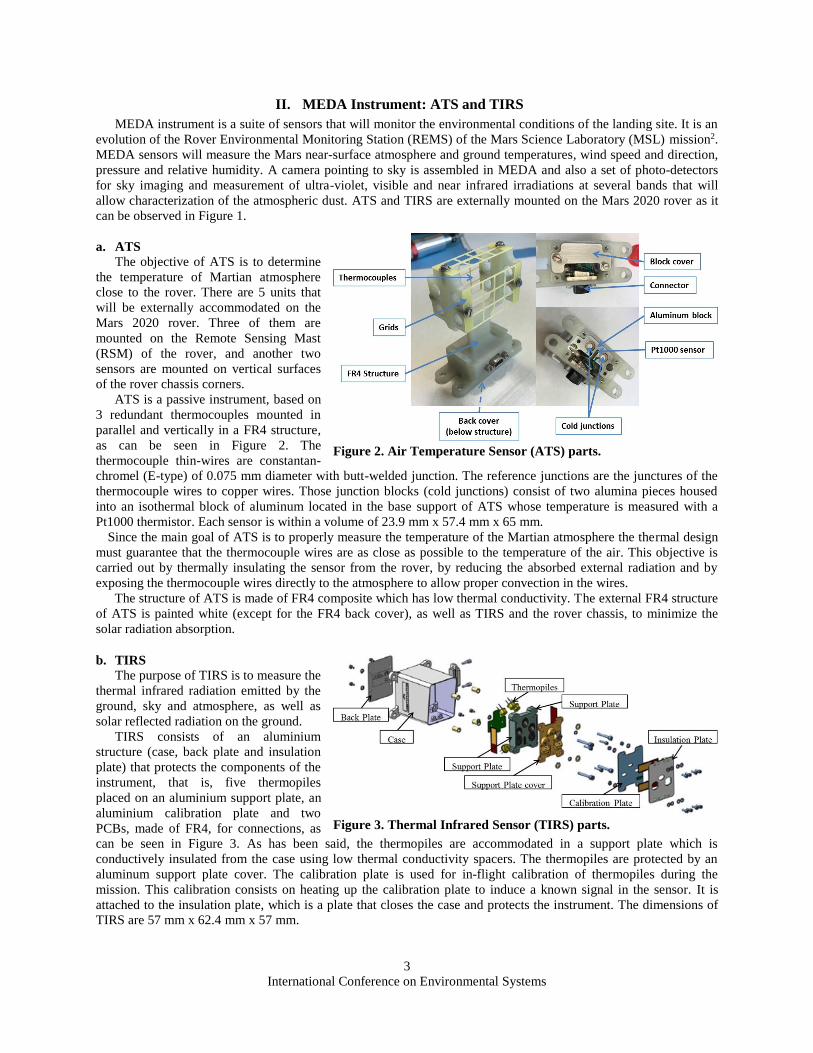
TIRS consists of an aluminium
structure (case, back plate and insulation
plate) that protects the components of the
instrument, that is, five thermopiles
placed on an aluminium support plate, an
aluminium calibration plate and two
PCBs, made of FR4, for connections, as
can be seen in Figure 3. As has been said, the thermopiles are accommodated in a support plate which is
conductively insulated from the case using low thermal conductivity spacers. The thermopiles are protected by an
aluminum support plate cover. The calibration plate is used for in-flight calibration of thermopiles during the
mission. This calibration consists on heating up the calibration plate to induce a known signal in the sensor. It is
attached to the insulation plate, which is a plate that closes the case and protects the instrument. The dimensions of
TIRS are 57 mm x 62.4 mm x 57 mm.
Figure 2. Air Temperature Sensor (ATS) parts.
Figure 3. Thermal Infrared Sensor (TIRS) parts.
International Conference on Environmental Systems
4
TIRS will be placed on the RSM of the Mars 2020 rover. The position of TIRS has been selected in order to
reduce the perturbation produced by the Multi-Mission Radioisotope Thermoelectric Generator (MMRTG) footprint
in the measurements.
The thermal design of TIRS has the goal of providing stable conditions for the thermopiles. The uncertainty of
the measurements of the thermopiles is affected by the spatial and temporal gradients3, so the thermal design of
TIRS is focused on the reduction of such gradients. According to the requirements of TIRS, the spatial gradient in
the thermopiles shall be lower than 24 mK and the temporal gradients in the thermopile shall be lower than 9 mK/s.
These requirements were extracted from the error budget of the instrument, taking into account all the sources of
uncertainty in the measurements. The thermal gradients in the calibration plate shall be lower than 226 mK for the
Area 1 and lower than 700 mK for the Area 2, these areas are defined in Figure 13. This requirement is needed to
guarantee the validity of the assumption used during the calibration (the temperature difference between the data to
be provided by the Pt1000 of the calibration plate and the areas that obstruct partially the FOV of the sensors is
considered negligible).
The design for fulfilling the stability requirements is based on insulating the support plate from the case. The
conductive coupling is reduced by using FR4 spacers, which have low thermal conductivity. The internal surfaces of
the instrument have low ε and low α finish, which is characteristic of the Alodine 1200 treatment. Using this surface
finish the radiative coupling between the support plate and the rest of the instrument is also reduced. The external
surfaces of TIRS are painted white, using the same paint as the rover, to reduce the solar heat load.
Finally, in order to reduce the power needed to heat the calibration plate, it is attached to the insulation plate. The
insulation plate is made of FR4, therefore the conductive coupling between the calibration plate and the instrument
is small.
III. Thermal design cases
Taking into account that the landing site has not been selected at the time this paper is being written, it is needed
to consider the worst scenario to assess the thermal design. Among the different options, Holden Crater area has
been considered as the worst thermal scenario for both cold case and hot case. In the following subsections the
thermal environment corresponding to Holden Crater is described.
a. Mission scenarios
The main parameters that define
the worst case scenarios for thermal
analysis, Worst Cold Case (WCC) and
Worst Hot Case (WHC) are strongly
influenced by the season. These
parameters are:
1) Solar constant and albedo
coefficient.
2) Planetary infrared and sky
temperature.
3) Rover temperature.
4) Atmospheric temperature,
pressure, and wind speed (if
any).
5) Thermo-optical properties,
either degraded due to dust or
pristine.
6) Rover orientation.
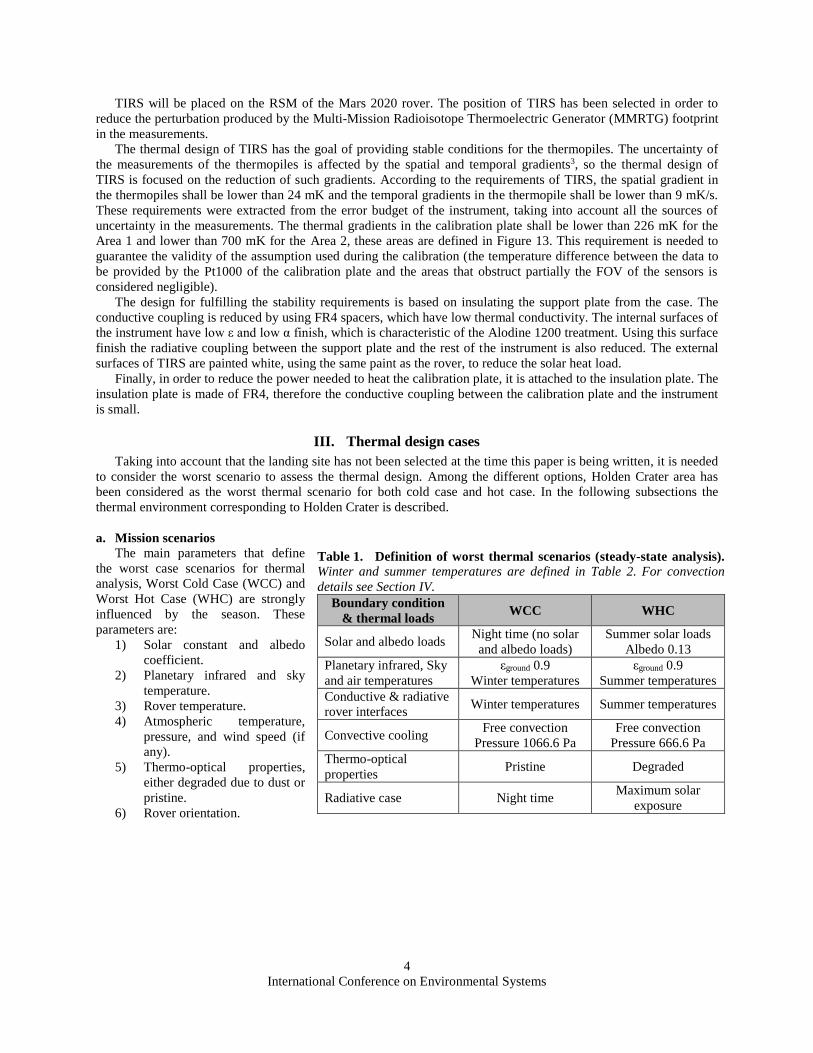
Table 1. Definition of worst thermal scenarios (steady-state analysis).
Winter and summer temperatures are defined in Table 2. For convection
details see Section IV.
Boundary condition
& thermal loads WCC WHC
Solar and albedo loads Night time (no solar
and albedo loads)
Summer solar loads
Albedo 0.13
Planetary infrared, Sky
and air temperatures
εground 0.9
Winter temperatures
εground 0.9
Summer temperatures
Conductive & radiative
rover interfaces Winter temperatures Summer temperatures
Convective cooling Free convection
Pressure 1066.6 Pa
Free convection
Pressure 666.6 Pa
Thermo-optical
properties Pristine Degraded
Radiative case Night time Maximum solar
exposure
International Conference on Environmental Systems
5
Dust deposition effect is to
increase the solar absorptance of the
surface, while its effect in the
emissivity is negligible. Therefore, in
order to define the worst case
scenarios, the absorptance value for
pristine thermo-optical properties
shall be applied in Worst Cold Case
(WCC) whereas the value degraded
by dust deposition shall be used in the
Worst Hot Case (WHC).
On the basis of defining the above
points, it is possible to draw up two
worst case scenarios that are
summarized in Table 1.
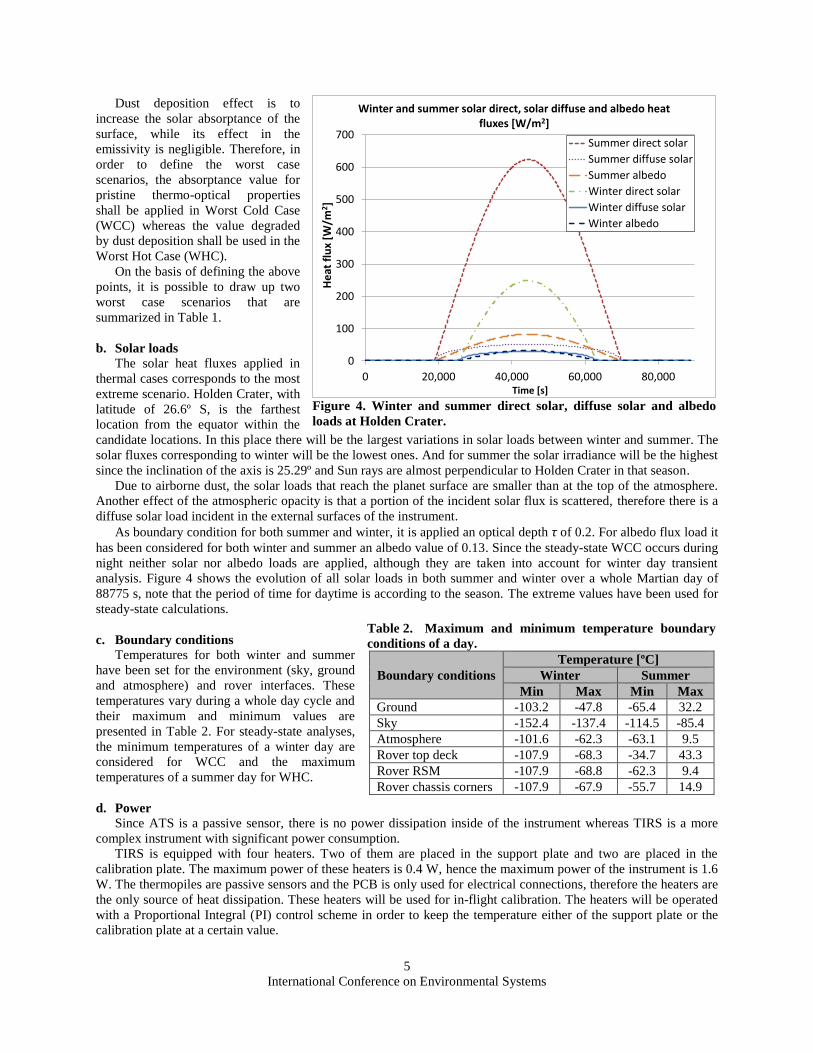
b. Solar loads
The solar heat fluxes applied in
thermal cases corresponds to the most
extreme scenario. Holden Crater, with
latitude of 26.6º S, is the farthest
location from the equator within the
candidate locations. In this place there will be the largest variations in solar loads between winter and summer. The
solar fluxes corresponding to winter will be the lowest ones. And for summer the solar irradiance will be the highest
since the inclination of the axis is 25.29º and Sun rays are almost perpendicular to Holden Crater in that season.
Due to airborne dust, the solar loads that reach the planet surface are smaller than at the top of the atmosphere.
Another effect of the atmospheric opacity is that a portion of the incident solar flux is scattered, therefore there is a
diffuse solar load incident in the external surfaces of the instrument.
As boundary condition for both summer and winter, it is applied an optical depth τ of 0.2. For albedo flux load it
has been considered for both winter and summer an albedo value of 0.13. Since the steady-state WCC occurs during
night neither solar nor albedo loads are applied, although they are taken into account for winter day transient
analysis. Figure 4 shows the evolution of all solar loads in both summer and winter over a whole Martian day of
88775 s, note that the period of time for daytime is according to the season. The extreme values have been used for
steady-state calculations.
c. Boundary conditions
Temperatures for both winter and summer
have been set for the environment (sky, ground
and atmosphere) and rover interfaces. These
temperatures vary during a whole day cycle and
their maximum and minimum values are
presented in Table 2. For steady-state analyses,
the minimum temperatures of a winter day are
considered for WCC and the maximum
temperatures of a summer day for WHC.
d. Power
Since ATS is a passive sensor, there is no power dissipation inside of the instrument whereas TIRS is a more
complex instrument with significant power consumption.
TIRS is equipped with four heaters. Two of them are placed in the support plate and two are placed in the
calibration plate. The maximum power of these heaters is 0.4 W, hence the maximum power of the instrument is 1.6
W. The thermopiles are passive sensors and the PCB is only used for electrical connections, therefore the heaters are
the only source of heat dissipation. These heaters will be used for in-flight calibration. The heaters will be operated
with a Proportional Integral (PI) control scheme in order to keep the temperature either of the support plate or the
calibration plate at a certain value.
0
100
200
300
400
500
600
700
0 20,000 40,000 60,000 80,000
He
at f
lux
[W/m
2]
Time [s]
Winter and summer solar direct, solar diffuse and albedo heat fluxes [W/m2]
Summer direct solar
Summer diffuse solar
Summer albedo
Winter direct solar
Winter diffuse solar
Winter albedo
Figure 4. Winter and summer direct solar, diffuse solar and albedo
loads at Holden Crater.
Table 2. Maximum and minimum temperature boundary
conditions of a day.
Boundary conditions
Temperature [ºC]
Winter Summer
Min Max Min Max
Ground -103.2 -47.8 -65.4 32.2
Sky -152.4 -137.4 -114.5 -85.4
Atmosphere -101.6 -62.3 -63.1 9.5
Rover top deck -107.9 -68.3 -34.7 43.3
Rover RSM -107.9 -68.8 -62.3 9.4
Rover chassis corners -107.9 -67.9 -55.7 14.9
International Conference on Environmental Systems
6
IV. Geometrical Mathematical Model and Thermal Mathematical Model
The Geometrical Mathematical Models (GMM) of ATS and TIRS contain the main elements the instruments
consist of. The software tool for the analysis is ESATAN-TMS r7 and 2017 releases. Radiative calculations have
been performed with Monte Carlo Ray Tracing (MCRT) method. The details of each model are provided in this
section.
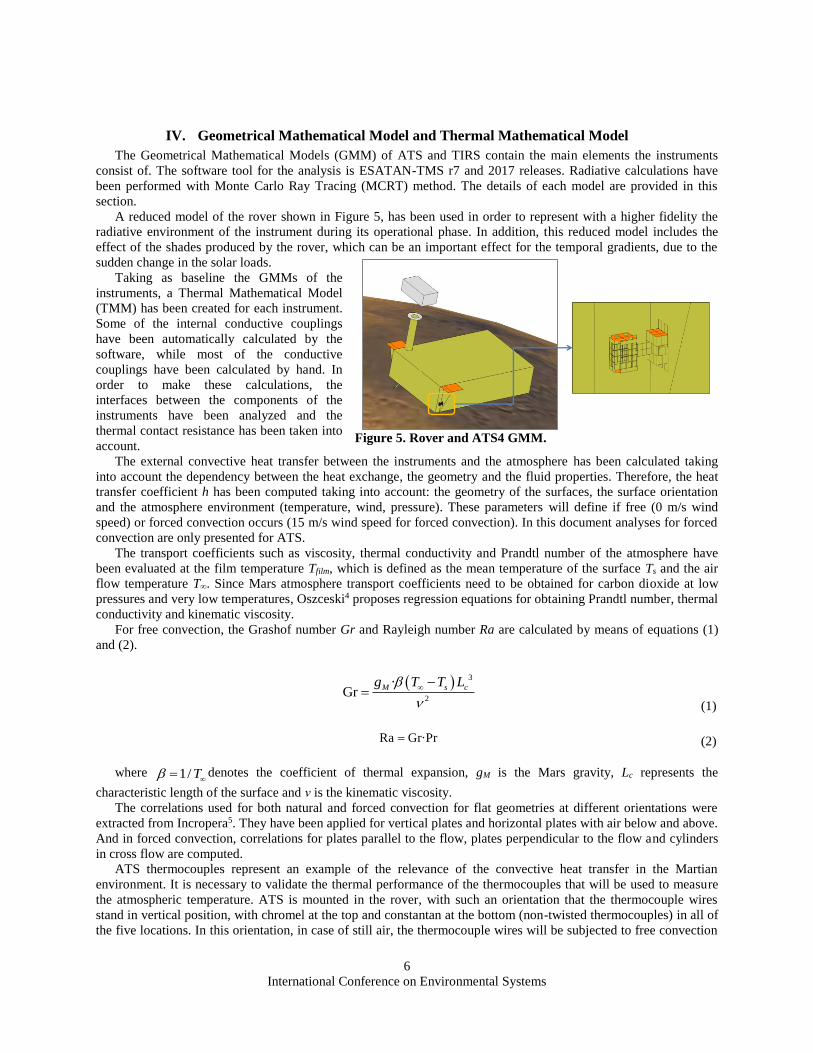
A reduced model of the rover shown in Figure 5, has been used in order to represent with a higher fidelity the
radiative environment of the instrument during its operational phase. In addition, this reduced model includes the
effect of the shades produced by the rover, which can be an important effect for the temporal gradients, due to the
sudden change in the solar loads.
Taking as baseline the GMMs of the
instruments, a Thermal Mathematical Model
(TMM) has been created for each instrument.
Some of the internal conductive couplings
have been automatically calculated by the
software, while most of the conductive
couplings have been calculated by hand. In
order to make these calculations, the
interfaces between the components of the
instruments have been analyzed and the
thermal contact resistance has been taken into
account.
The external convective heat transfer between the instruments and the atmosphere has been calculated taking
into account the dependency between the heat exchange, the geometry and the fluid properties. Therefore, the heat
transfer coefficient h has been computed taking into account: the geometry of the surfaces, the surface orientation
and the atmosphere environment (temperature, wind, pressure). These parameters will define if free (0 m/s wind
speed) or forced convection occurs (15 m/s wind speed for forced convection). In this document analyses for forced
convection are only presented for ATS.
The transport coefficients such as viscosity, thermal conductivity and Prandtl number of the atmosphere have
been evaluated at the film temperature Tfilm, which is defined as the mean temperature of the surface Ts and the air
flow temperature T∞. Since Mars atmosphere transport coefficients need to be obtained for carbon dioxide at low
pressures and very low temperatures, Oszceski4 proposes regression equations for obtaining Prandtl number, thermal
conductivity and kinematic viscosity.
For free convection, the Grashof number Gr and Rayleigh number Ra are calculated by means of equations (1)
and (2).
3
2
·Gr
M s cg T T L
(1)
Ra Gr·Pr (2)
where 1/ T denotes the coefficient of thermal expansion, gM is the Mars gravity, Lc represents the
characteristic length of the surface and ν is the kinematic viscosity.
The correlations used for both natural and forced convection for flat geometries at different orientations were
extracted from Incropera5. They have been applied for vertical plates and horizontal plates with air below and above.
And in forced convection, correlations for plates parallel to the flow, plates perpendicular to the flow and cylinders
in cross flow are computed.
ATS thermocouples represent an example of the relevance of the convective heat transfer in the Martian
environment. It is necessary to validate the thermal performance of the thermocouples that will be used to measure
the atmospheric temperature. ATS is mounted in the rover, with such an orientation that the thermocouple wires
stand in vertical position, with chromel at the top and constantan at the bottom (non-twisted thermocouples) in all of
the five locations. In this orientation, in case of still air, the thermocouple wires will be subjected to free convection
Figure 5. Rover and ATS4 GMM.
International Conference on Environmental Systems
7
along their length. In case of incident wind, it is only considered wind
parallel to ground, which means that the thermocouple wires are always in
cross flow.
The correlation for vertical thin cylinders in free convection obtained
from Kyte6, in equation (3), is specially selected for the thermocouples
wires since they are the most sensitive part of ATS. In forced convection
for cylinders in cross flow, Hilpert correlation7 in equation (4), is used
with the adequate constants of the Table 3.
D
0.26
D
2Nu
4.47ln 1
Gr ·Prc
D
L
(3)
1 3
D DNu ·Re ·PrmC (4)
Apart from the external convection, both ATS and TIRS have small cavities in their structure, where the internal
parts are allocated. The effect of the Martian atmosphere in the interior of the instruments is not negligible. The
internal cavities of ATS and TIRS have a characteristic longitude lower than 40 mm. Therefore, an analysis of the
convection parameters determines that the conduction through the CO2 gaps is the dominant phenomenon. Internal
conduction through CO2 gap shall be computed between internal surfaces of the cavities, taking into account that the
conductivity of the CO2 is dependent on the temperature. In addition, since the sensors are mounted with stand-offs,
there is a small gap between instrument back cover and rover in which thermal conduction through CO2 instead of
convection has been also computed.
Some of the internal conductive couplings between FR4 nodes have been manually calculated taking into
account the two different thermal conductivities of this material, either longitudinal or crosswise. Conductive
couplings in bolted unions, simple contact, contact by glue, etc. have been estimated by similarity. The thermal
interface between the instruments and rover consists of four contact regions, each one with a bolted union with M4
screw and washer. The bolted unions have not been represented geometrically in the thermal model but they have
been taken into account for the thermal conductance with the rover interface, either the RSM or the chassis corners.
In these contact regions no radiative exchange has been computed. This conductive coupling has been estimated by
similarity as well. Subsequently, uncertainty and sensibility analyses have been performed for these estimated
calculations.
The TMM has been completed with the addition of the solar loads, the convective exchange factor calculation
and the boundary conditions described in previous sections. The details of the TMM of each instrument are provided
in this section.
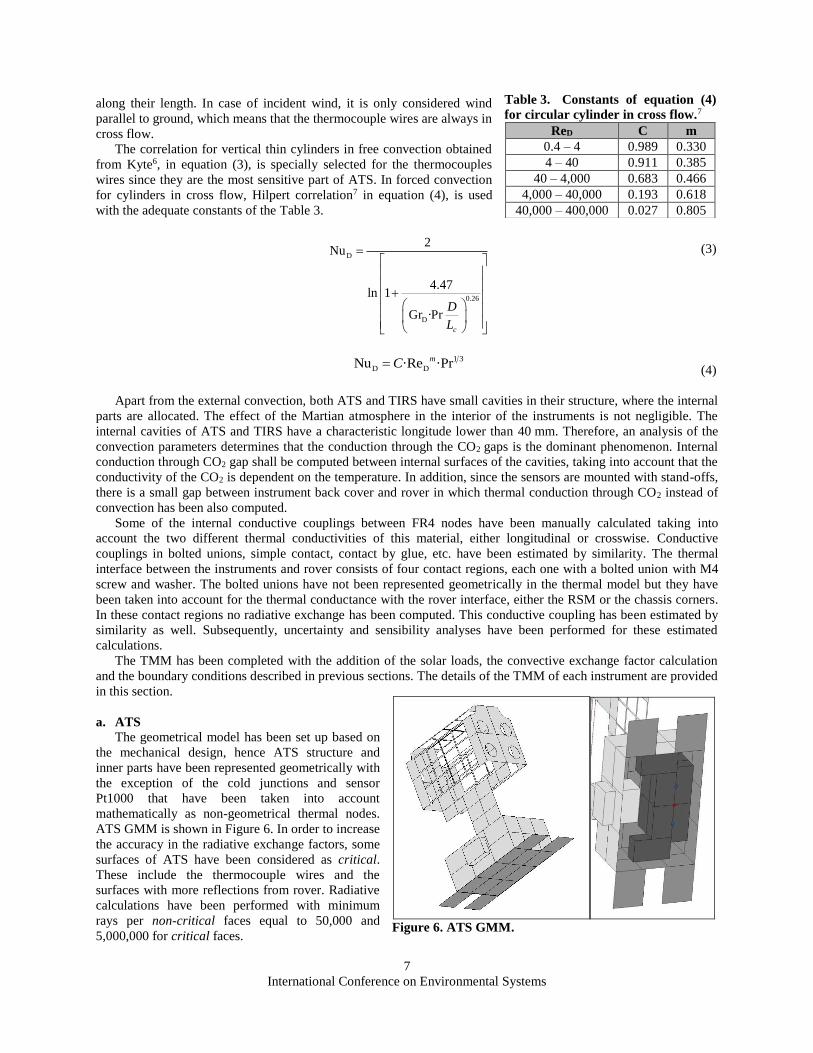
a. ATS
The geometrical model has been set up based on
the mechanical design, hence ATS structure and
inner parts have been represented geometrically with
the exception of the cold junctions and sensor
Pt1000 that have been taken into account
mathematically as non-geometrical thermal nodes.
ATS GMM is shown in Figure 6. In order to increase
the accuracy in the radiative exchange factors, some
surfaces of ATS have been considered as critical.
These include the thermocouple wires and the
surfaces with more reflections from rover. Radiative
calculations have been performed with minimum
rays per non-critical faces equal to 50,000 and
5,000,000 for critical faces.
Figure 6. ATS GMM.
Table 3. Constants of equation (4)
for circular cylinder in cross flow.7
ReD C m
0.4 – 4 0.989 0.330
4 – 40 0.911 0.385
40 – 4,000 0.683 0.466
4,000 – 40,000 0.193 0.618
40,000 – 400,000 0.027 0.805
International Conference on Environmental Systems
8
The Thermal Mathematical Model of ATS consists of 306 nodes, 6 of them
are non-geometrical thermal nodes. These nodes include the rover model and
environment. In order to get enough accuracy in the thermocouple wires, they
have been discretized in 20 nodes per wire, note that each node is 1.25 mm long.
Conductive coupling between nodes of the same piece of material and butt-
welded unions of thermocouples have been calculated as ‘fused’ type. Other
conductive couplings such as bolted unions, thermal conduction through wires,
glued parts or simple contact have been estimated by similarity taking into
account a thermal contact conductance coefficient hc.
The thermal capacitances automatically calculated by ESATAN-TMS in
the TMM have been adjusted to the real value according to the volumes and
materials of the CAD model. The total capacitance of ATS is 39.3 J/K.
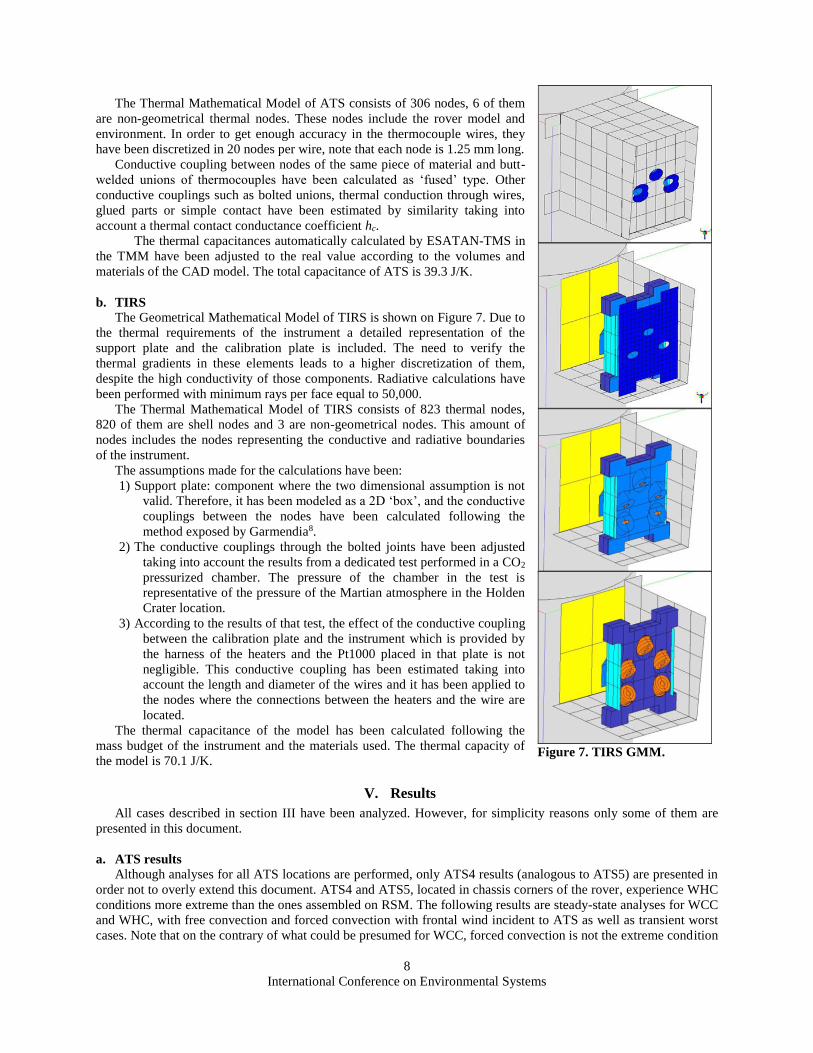
b. TIRS
The Geometrical Mathematical Model of TIRS is shown on Figure 7. Due to
the thermal requirements of the instrument a detailed representation of the
support plate and the calibration plate is included. The need to verify the
thermal gradients in these elements leads to a higher discretization of them,
despite the high conductivity of those components. Radiative calculations have
been performed with minimum rays per face equal to 50,000.
The Thermal Mathematical Model of TIRS consists of 823 thermal nodes,
820 of them are shell nodes and 3 are non-geometrical nodes. This amount of
nodes includes the nodes representing the conductive and radiative boundaries
of the instrument.
The assumptions made for the calculations have been:
1) Support plate: component where the two dimensional assumption is not
valid. Therefore, it has been modeled as a 2D ‘box’, and the conductive
couplings between the nodes have been calculated following the
method exposed by Garmendia8.
2) The conductive couplings through the bolted joints have been adjusted
taking into account the results from a dedicated test performed in a CO2
pressurized chamber. The pressure of the chamber in the test is
representative of the pressure of the Martian atmosphere in the Holden
Crater location.
3) According to the results of that test, the effect of the conductive coupling
between the calibration plate and the instrument which is provided by
the harness of the heaters and the Pt1000 placed in that plate is not
negligible. This conductive coupling has been estimated taking into
account the length and diameter of the wires and it has been applied to
the nodes where the connections between the heaters and the wire are
located.
The thermal capacitance of the model has been calculated following the
mass budget of the instrument and the materials used. The thermal capacity of
the model is 70.1 J/K.
V. Results
All cases described in section III have been analyzed. However, for simplicity reasons only some of them are
presented in this document.
a. ATS results
Although analyses for all ATS locations are performed, only ATS4 results (analogous to ATS5) are presented in
order not to overly extend this document. ATS4 and ATS5, located in chassis corners of the rover, experience WHC
conditions more extreme than the ones assembled on RSM. The following results are steady-state analyses for WCC
and WHC, with free convection and forced convection with frontal wind incident to ATS as well as transient worst
cases. Note that on the contrary of what could be presumed for WCC, forced convection is not the extreme condition
Figure 7. TIRS GMM.
International Conference on Environmental Systems
9
since the air turns out to be warmer than radiative boundary conditions for winter. In forced convection analyses,
forced convection has been computed in surfaces with incident wind whereas for faces behind the incident flow the
heat exchange computed is by means of free convection.
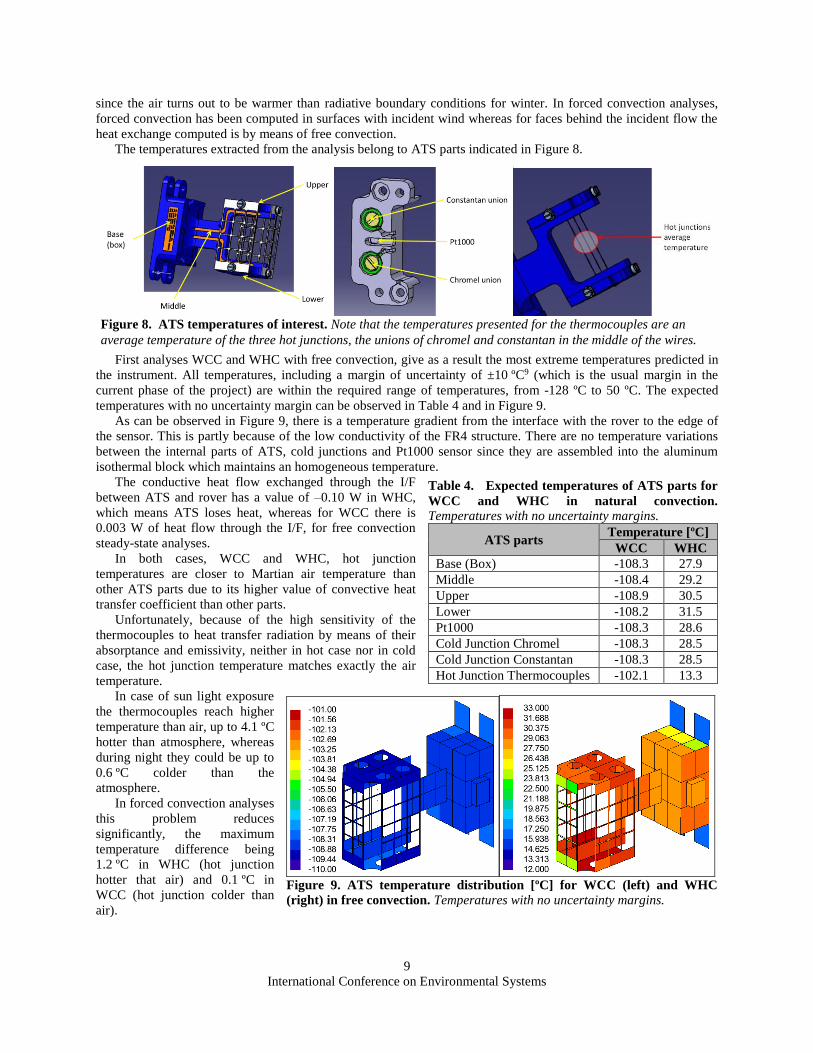
The temperatures extracted from the analysis belong to ATS parts indicated in Figure 8.
First analyses WCC and WHC with free convection, give as a result the most extreme temperatures predicted in
the instrument. All temperatures, including a margin of uncertainty of ±10 ºC9 (which is the usual margin in the
current phase of the project) are within the required range of temperatures, from -128 ºC to 50 ºC. The expected
temperatures with no uncertainty margin can be observed in Table 4 and in Figure 9.
As can be observed in Figure 9, there is a temperature gradient from the interface with the rover to the edge of
the sensor. This is partly because of the low conductivity of the FR4 structure. There are no temperature variations
between the internal parts of ATS, cold junctions and Pt1000 sensor since they are assembled into the aluminum
isothermal block which maintains an homogeneous temperature.
The conductive heat flow exchanged through the I/F
between ATS and rover has a value of –0.10 W in WHC,
which means ATS loses heat, whereas for WCC there is
0.003 W of heat flow through the I/F, for free convection
steady-state analyses.
In both cases, WCC and WHC, hot junction
temperatures are closer to Martian air temperature than
other ATS parts due to its higher value of convective heat
transfer coefficient than other parts.
Unfortunately, because of the high sensitivity of the
thermocouples to heat transfer radiation by means of their
absorptance and emissivity, neither in hot case nor in cold
case, the hot junction temperature matches exactly the air
temperature.
In case of sun light exposure
the thermocouples reach higher
temperature than air, up to 4.1 ºC
hotter than atmosphere, whereas
during night they could be up to
0.6 ºC colder than the
atmosphere.
In forced convection analyses
this problem reduces
significantly, the maximum
temperature difference being
1.2 ºC in WHC (hot junction
hotter that air) and 0.1 ºC in
WCC (hot junction colder than
air).
Figure 8. ATS temperatures of interest. Note that the temperatures presented for the thermocouples are an
average temperature of the three hot junctions, the unions of chromel and constantan in the middle of the wires.
Table 4. Expected temperatures of ATS parts for
WCC and WHC in natural convection.
Temperatures with no uncertainty margins.
ATS parts Temperature [ºC]
WCC WHC
Base (Box) -108.3 27.9
Middle -108.4 29.2
Upper -108.9 30.5
Lower -108.2 31.5
Pt1000 -108.3 28.6
Cold Junction Chromel -108.3 28.5
Cold Junction Constantan -108.3 28.5
Hot Junction Thermocouples -102.1 13.3
Figure 9. ATS temperature distribution [ºC] for WCC (left) and WHC
(right) in free convection. Temperatures with no uncertainty margins.
International Conference on Environmental Systems
10
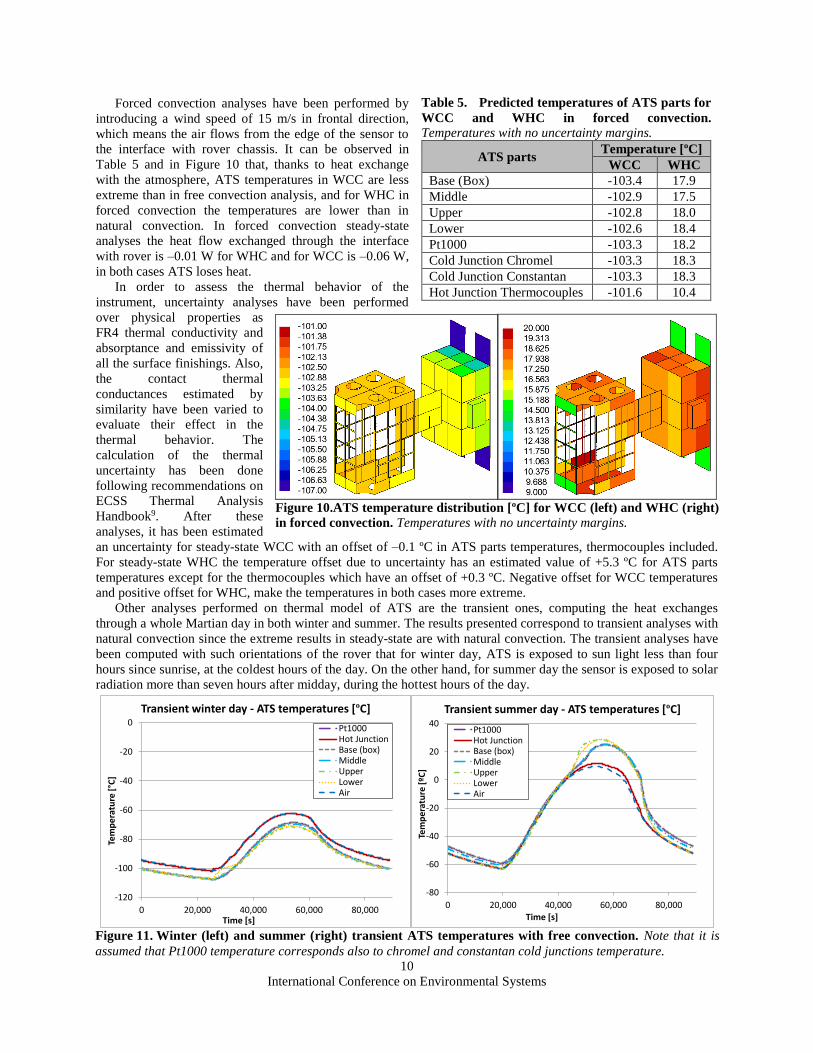
Forced convection analyses have been performed by
introducing a wind speed of 15 m/s in frontal direction,
which means the air flows from the edge of the sensor to
the interface with rover chassis. It can be observed in
Table 5 and in Figure 10 that, thanks to heat exchange
with the atmosphere, ATS temperatures in WCC are less
extreme than in free convection analysis, and for WHC in
forced convection the temperatures are lower than in
natural convection. In forced convection steady-state
analyses the heat flow exchanged through the interface
with rover is –0.01 W for WHC and for WCC is –0.06 W,
in both cases ATS loses heat.
In order to assess the thermal behavior of the
instrument, uncertainty analyses have been performed
over physical properties as
FR4 thermal conductivity and
absorptance and emissivity of
all the surface finishings. Also,
the contact thermal
conductances estimated by
similarity have been varied to
evaluate their effect in the
thermal behavior. The
calculation of the thermal
uncertainty has been done
following recommendations on
ECSS Thermal Analysis
Handbook9. After these
analyses, it has been estimated
an uncertainty for steady-state WCC with an offset of –0.1 ºC in ATS parts temperatures, thermocouples included.
For steady-state WHC the temperature offset due to uncertainty has an estimated value of +5.3 ºC for ATS parts
temperatures except for the thermocouples which have an offset of +0.3 ºC. Negative offset for WCC temperatures
and positive offset for WHC, make the temperatures in both cases more extreme.
Other analyses performed on thermal model of ATS are the transient ones, computing the heat exchanges
through a whole Martian day in both winter and summer. The results presented correspond to transient analyses with
natural convection since the extreme results in steady-state are with natural convection. The transient analyses have
been computed with such orientations of the rover that for winter day, ATS is exposed to sun light less than four
hours since sunrise, at the coldest hours of the day. On the other hand, for summer day the sensor is exposed to solar
radiation more than seven hours after midday, during the hottest hours of the day.
Figure 10.ATS temperature distribution [ºC] for WCC (left) and WHC (right)
in forced convection. Temperatures with no uncertainty margins.
Table 5. Predicted temperatures of ATS parts for
WCC and WHC in forced convection.
Temperatures with no uncertainty margins.
ATS parts Temperature [ºC]
WCC WHC
Base (Box) -103.4 17.9
Middle -102.9 17.5
Upper -102.8 18.0
Lower -102.6 18.4
Pt1000 -103.3 18.2
Cold Junction Chromel -103.3 18.3
Cold Junction Constantan -103.3 18.3
Hot Junction Thermocouples -101.6 10.4
-120
-100
-80
-60
-40
-20
0
0 20,000 40,000 60,000 80,000
Tem
pe
ratu
re [
°C]
Time [s]
Transient winter day - ATS temperatures [ºC]
Pt1000Hot JunctionBase (box)MiddleUpperLowerAir
-80
-60
-40
-20
0
20
40
0 20,000 40,000 60,000 80,000
Tem
pe
ratu
re [
ºC]
Time [s]
Transient summer day - ATS temperatures [ºC]
Pt1000Hot JunctionBase (box)MiddleUpperLowerAir
Figure 11. Winter (left) and summer (right) transient ATS temperatures with free convection. Note that it is
assumed that Pt1000 temperature corresponds also to chromel and constantan cold junctions temperature.
International Conference on Environmental Systems
11
It can be observed in Figure 11 the effect of the solar incidence over ATS in the sudden increase of temperature
of some parts in the summer analysis. The heat flow between ATS and rover varies between –0.09 W and +0.04 W
in case of transient WHC, whereas for transient WCC it varies between –0.01 W and +0.02 W.
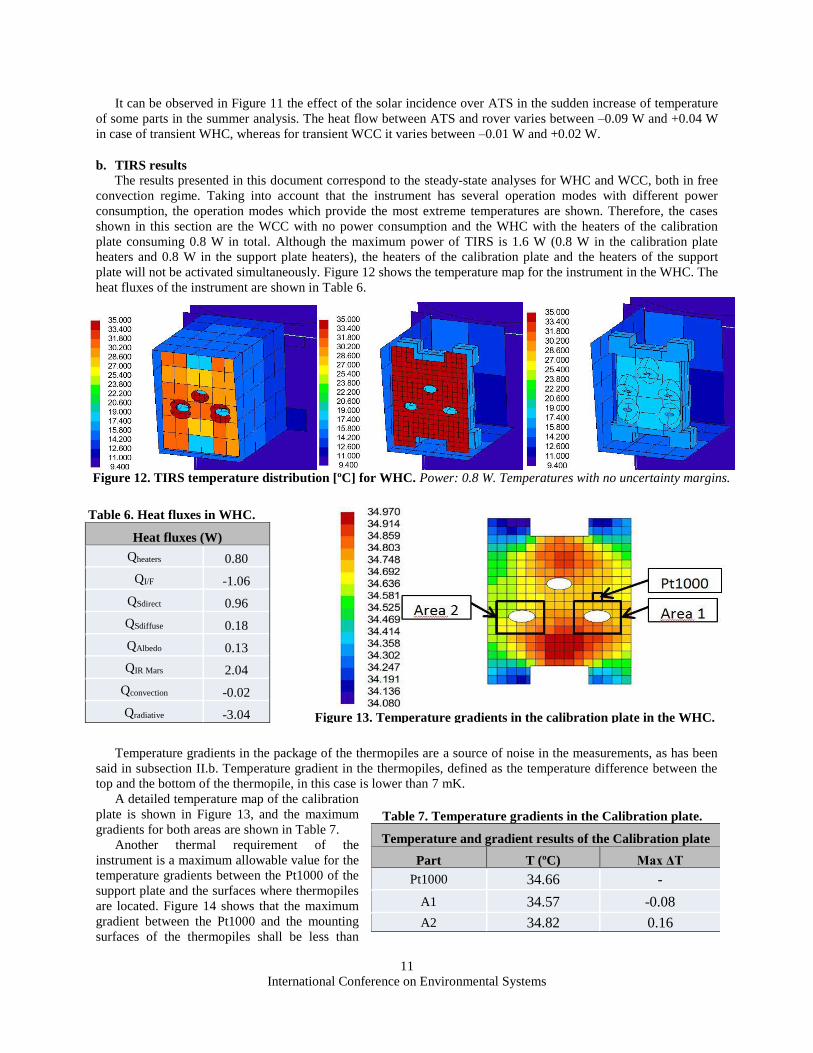
b. TIRS results
The results presented in this document correspond to the steady-state analyses for WHC and WCC, both in free
convection regime. Taking into account that the instrument has several operation modes with different power
consumption, the operation modes which provide the most extreme temperatures are shown. Therefore, the cases
shown in this section are the WCC with no power consumption and the WHC with the heaters of the calibration
plate consuming 0.8 W in total. Although the maximum power of TIRS is 1.6 W (0.8 W in the calibration plate
heaters and 0.8 W in the support plate heaters), the heaters of the calibration plate and the heaters of the support
plate will not be activated simultaneously. Figure 12 shows the temperature map for the instrument in the WHC. The
heat fluxes of the instrument are shown in Table 6.
Temperature gradients in the package of the thermopiles are a source of noise in the measurements, as has been
said in subsection II.b. Temperature gradient in the thermopiles, defined as the temperature difference between the
top and the bottom of the thermopile, in this case is lower than 7 mK.
A detailed temperature map of the calibration
plate is shown in Figure 13, and the maximum
gradients for both areas are shown in Table 7.
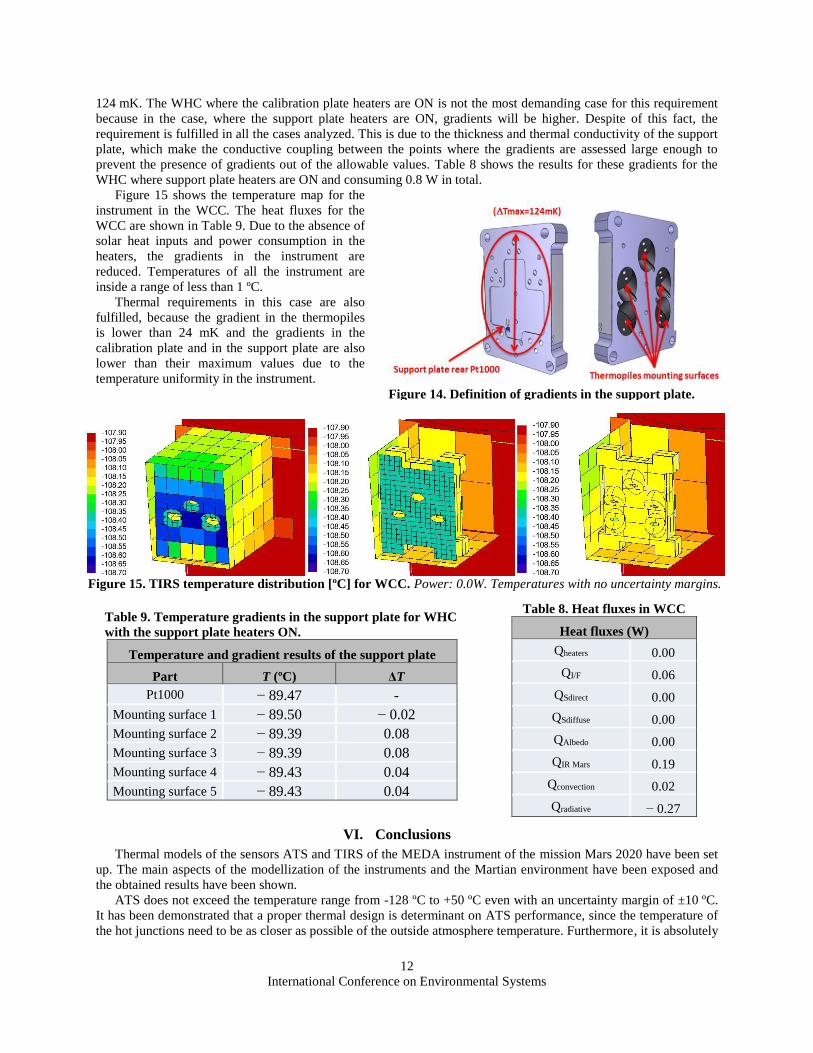
Another thermal requirement of the
instrument is a maximum allowable value for the
temperature gradients between the Pt1000 of the
support plate and the surfaces where thermopiles
are located. Figure 14 shows that the maximum
gradient between the Pt1000 and the mounting
surfaces of the thermopiles shall be less than
Figure 12. TIRS temperature distribution [ºC] for WHC. Power: 0.8 W. Temperatures with no uncertainty margins.
Table 7. Temperature gradients in the Calibration plate.
Temperature and gradient results of the Calibration plate
Part T (ºC) Max ΔT
Pt1000 34.66 -
A1 34.57 -0.08
A2 34.82 0.16
Table 6. Heat fluxes in WHC.
Heat fluxes (W)
Qheaters 0.80
QI/F -1.06
QSdirect 0.96
QSdiffuse 0.18
QAlbedo 0.13
QIR Mars 2.04
Qconvection -0.02
Qradiative -3.04
Figure 13. Temperature gradients in the calibration plate in the WHC.
International Conference on Environmental Systems
12
124 mK. The WHC where the calibration plate heaters are ON is not the most demanding case for this requirement
because in the case, where the support plate heaters are ON, gradients will be higher. Despite of this fact, the
requirement is fulfilled in all the cases analyzed. This is due to the thickness and thermal conductivity of the support
plate, which make the conductive coupling between the points where the gradients are assessed large enough to
prevent the presence of gradients out of the allowable values. Table 8 shows the results for these gradients for the
WHC where support plate heaters are ON and consuming 0.8 W in total.
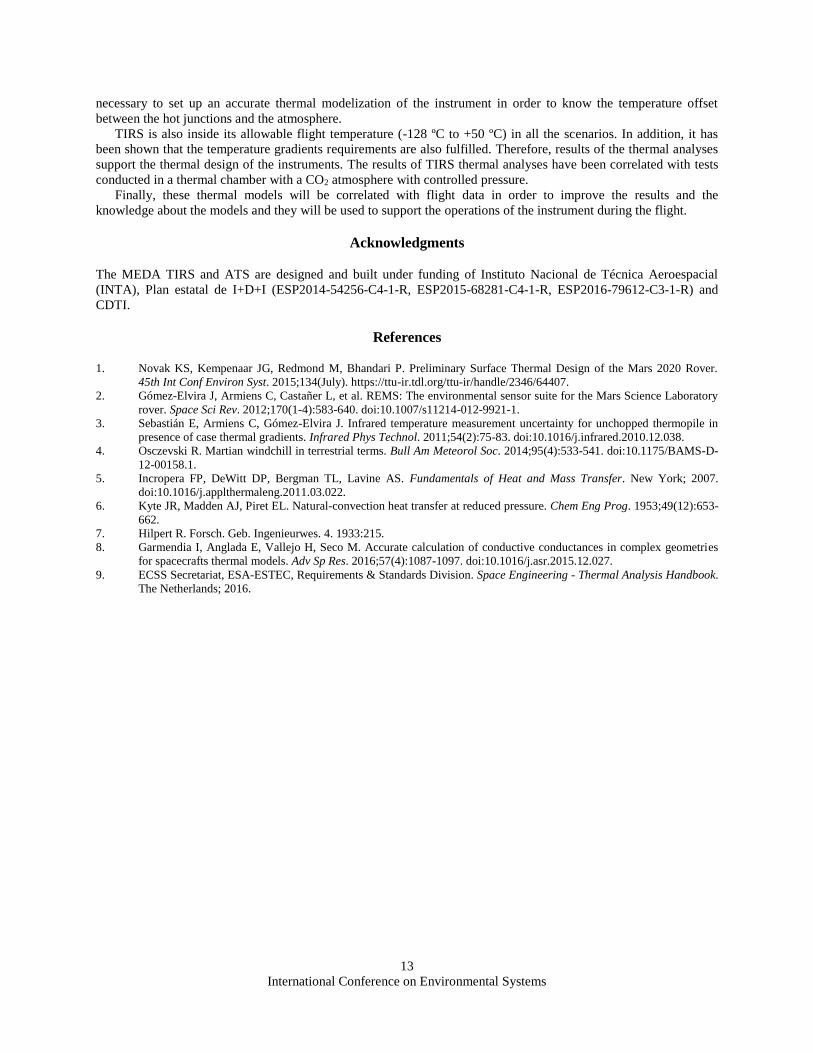
Figure 15 shows the temperature map for the
instrument in the WCC. The heat fluxes for the
WCC are shown in Table 9. Due to the absence of
solar heat inputs and power consumption in the
heaters, the gradients in the instrument are
reduced. Temperatures of all the instrument are
inside a range of less than 1 ºC.
Thermal requirements in this case are also
fulfilled, because the gradient in the thermopiles
is lower than 24 mK and the gradients in the
calibration plate and in the support plate are also
lower than their maximum values due to the
temperature uniformity in the instrument.
VI. Conclusions
Thermal models of the sensors ATS and TIRS of the MEDA instrument of the mission Mars 2020 have been set
up. The main aspects of the modellization of the instruments and the Martian environment have been exposed and
the obtained results have been shown.
ATS does not exceed the temperature range from -128 ºC to +50 ºC even with an uncertainty margin of ±10 ºC.
It has been demonstrated that a proper thermal design is determinant on ATS performance, since the temperature of
the hot junctions need to be as closer as possible of the outside atmosphere temperature. Furthermore, it is absolutely
Figure 15. TIRS temperature distribution [ºC] for WCC. Power: 0.0W. Temperatures with no uncertainty margins.
Table 8. Heat fluxes in WCC
Heat fluxes (W)
Qheaters 0.00
QI/F 0.06
QSdirect 0.00
QSdiffuse 0.00
QAlbedo 0.00
QIR Mars 0.19
Qconvection 0.02
Qradiative − 0.27
Figure 14. Definition of gradients in the support plate.
Table 9. Temperature gradients in the support plate for WHC
with the support plate heaters ON.
Temperature and gradient results of the support plate
Part T (ºC) ΔT
Pt1000 − 89.47 -
Mounting surface 1 − 89.50 − 0.02
Mounting surface 2 − 89.39 0.08
Mounting surface 3 − 89.39 0.08
Mounting surface 4 − 89.43 0.04
Mounting surface 5 − 89.43 0.04
International Conference on Environmental Systems
13
necessary to set up an accurate thermal modelization of the instrument in order to know the temperature offset
between the hot junctions and the atmosphere.
TIRS is also inside its allowable flight temperature (-128 ºC to +50 ºC) in all the scenarios. In addition, it has
been shown that the temperature gradients requirements are also fulfilled. Therefore, results of the thermal analyses
support the thermal design of the instruments. The results of TIRS thermal analyses have been correlated with tests
conducted in a thermal chamber with a CO2 atmosphere with controlled pressure.
Finally, these thermal models will be correlated with flight data in order to improve the results and the
knowledge about the models and they will be used to support the operations of the instrument during the flight.
Acknowledgments
The MEDA TIRS and ATS are designed and built under funding of Instituto Nacional de Técnica Aeroespacial
(INTA), Plan estatal de I+D+I (ESP2014-54256-C4-1-R, ESP2015-68281-C4-1-R, ESP2016-79612-C3-1-R) and
CDTI.
References
1. Novak KS, Kempenaar JG, Redmond M, Bhandari P. Preliminary Surface Thermal Design of the Mars 2020 Rover.
45th Int Conf Environ Syst. 2015;134(July). https://ttu-ir.tdl.org/ttu-ir/handle/2346/64407.
2. Gómez-Elvira J, Armiens C, Castañer L, et al. REMS: The environmental sensor suite for the Mars Science Laboratory
rover. Space Sci Rev. 2012;170(1-4):583-640. doi:10.1007/s11214-012-9921-1.
3. Sebastián E, Armiens C, Gómez-Elvira J. Infrared temperature measurement uncertainty for unchopped thermopile in
presence of case thermal gradients. Infrared Phys Technol. 2011;54(2):75-83. doi:10.1016/j.infrared.2010.12.038.
4. Osczevski R. Martian windchill in terrestrial terms. Bull Am Meteorol Soc. 2014;95(4):533-541. doi:10.1175/BAMS-D-
12-00158.1.
5. Incropera FP, DeWitt DP, Bergman TL, Lavine AS. Fundamentals of Heat and Mass Transfer. New York; 2007.
doi:10.1016/j.applthermaleng.2011.03.022.
6. Kyte JR, Madden AJ, Piret EL. Natural-convection heat transfer at reduced pressure. Chem Eng Prog. 1953;49(12):653-
662.
7. Hilpert R. Forsch. Geb. Ingenieurwes. 4. 1933:215.
8. Garmendia I, Anglada E, Vallejo H, Seco M. Accurate calculation of conductive conductances in complex geometries
for spacecrafts thermal models. Adv Sp Res. 2016;57(4):1087-1097. doi:10.1016/j.asr.2015.12.027.
9. ECSS Secretariat, ESA-ESTEC, Requirements & Standards Division. Space Engineering - Thermal Analysis Handbook.
The Netherlands; 2016.