Embed Size (px)
Citation preview
THERMAL DESIGN METHODOLOGY FOR ELECTRONIC SYSTEMS
Angie Minichiello, P.E. Space Dynamics Laboratory / Utah Sate University
1695 North Research Park Way North Logan, UT 84341
Phone: (435) 797-4712, Fax: (435) 797-4366 Email: [email protected]
Christian Belady, P.E.
Hewlett Packard Company High Performance Systems Laboratory (HPSL)
3000 Waterview Parkway Richardson, TX 75080
Phone: (972) 497-4049, Fax: (972) 497-4245 Email: [email protected]
ABSTRACT This paper presents the thermal design methodology used to design a multi-processor enterprise server, the RP8400. The proposed methodology combines well-known analytical and experimental thermal design tools, including heat transfer correlations, Flow Network Modeling (FNM) and Computational Fluid Dynamics (CFD) techniques, and experimental measurements. The key benefit of this methodology is its emphasis on the use of varied design tools, each applied at its optimal point in the product design cycle. Thus, analysis time is greatly reduced, with acceptable sacrifice to accuracy and detail, during the earliest stages of design when the design concept is fluid, new ideas abound, and speed is paramount. Detailed analyses, providing a greater degree of accuracy, are performed in the latter stages of the development cycle when designs are firm, changes are fewer, and optimization/validation is the goal. In this manner, thermal risk is systematically reduced throughout the product design cycle. This paper begins with an overview of the thermal design methodology. Direct application of the methodology to the design of an enterprise server, the RP8400, is discussed. Numerical modeling and empirical results are presented and compared, followed by a discussion of methods for improving thermal design in future products. KEY WORDS: FNM, CFD, Thermal Design, Electronics Cooling, System Analysis
NOMENCLATURE CEC core electronics complex chip cfm cubic feet per minute CPU central processing unit DIMM Dual In-Line Memory Module EMI electro-magnetic interference HS heatsink IO input output or IO chip GB gigabyte lfm linear feet per minute MEM CON memory controller chip P power (W) PCB printed circuit board
PDH processor dependent hardware Q volumetric flowrate (cfm) Spec specification limit VRM voltage regulation module X BAR Cross Bar chip Greek symbols ∆T temperature difference (oC) Θ thermal resistance (oC/W) Subscripts a room ambient bench bench measurement ch case to heatsink ha heatsink to room ambient j junction jc junction to case max maximum sys system
INTRODUCTION The ultimate goal of system thermal design is not the prediction of component temperatures, but rather the reduction of thermally associated risk to the product [1]. This risk, inherent to today’s power-packed electronic systems, is manifested by compromised designs that do not meet projected schedules due to unforeseen thermal and/or reliability issues. Thermal design, therefore, is the process by which engineers use temperature and airflow predictions to uncover potential risk areas and develop feasible solutions as early as possible in the product design cycle. Ultimately, the goal of this effort is to provide optimal designs that meet or exceed projected schedules and component requirements. Many tools exist to assist thermal design engineers during this process, including heat transfer correlations, Flow Network Modeling (FNM), Computational Fluid Dynamics (CFD), and experimental measurement techniques. The key to efficient and comprehensive thermal design is not, necessarily, the choice of the “best” tool for design, but rather the optimized integration of available tools.
This paper presents the thermal design methodology used to design the RP8400 enterprise server. Possessing a maximum power per area rating of over 800 W/ft2, the RP8400 required careful thermal analyses in order to meet its aggressive project schedule. Relying upon the methodology presented herein, the thermal designer was able to systematically reduce risk throughout the product design cycle, culminating in a design that met the project schedule while requiring no changes to component thermal solutions, air movers, or layout.
METHODOLOGY SUMMARY
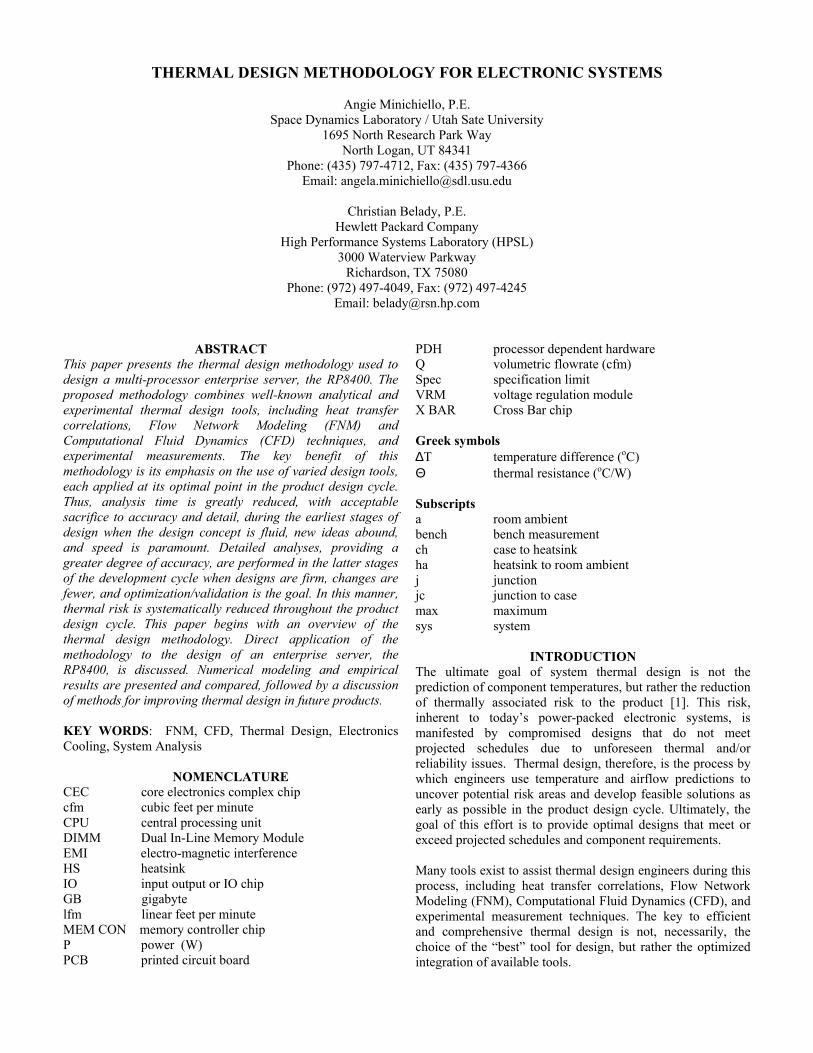
Biber & Belady [2] first introduced a thermal design methodology that later evolved into the “Enhanced Product Design Cycle” [3] as discussed in this paper. According to this method, the development cycle is comprised of three distinct phases: Concept Development, Detailed Design, and Hardware Test. During each phase, the most applicable and expedient thermal design tools are used, as proposed in Figure 1. Thus, the methodology promotes a “fluid” process in which the predictions of tools used in the first phase are compared with subsequent predictions as the design enters the next phase and new tools are adopted.
Fig. 1 Enhanced Product Development Cycle [3] Concept Development The Concept Development Phase is the initial stage in the product design cycle. At the start of this phase, the product concept is in its infancy. This phase is characterized by rapidly changing product layouts and requirements as representatives from all disciplines meet to discuss requirements and to develop new ideas. Here, the goal of the thermal designer is to thoroughly, yet rapidly, analyze scenarios and offer design suggestions for improvement in real time. This phase concludes in a single product layout that meets or exceeds the all requirements. At the conclusion of this phase, the thermal designer has: (1) completed a mechanical layout (board through product
level) able to support the power dissipation of the unit (2) completed air-mover selection (size, number, location,
and orientation) (3) sized and placed critical component heat sinks, insuring
that adequate volume is available (4) estimated the air temperature rises through all exhaust
paths of the product
(5) identified areas of thermal risk, proposing design requirements necessary to mitigate these risks
Concept Development Phase Thermal Tools. Based upon their ease of use, quick solve times, and limited required input data (usually geometry and fluid data only), the common tools used in this phase are generalized correlations for heat transfer and fluid flow, spreadsheets (such as heatsink design optimizers), and Flow Network Modeling (FNM) techniques. Details of FNM techniques can be found in [3], [4], and [5]. FNM techniques are easy to master, although an adequate knowledge of 2D flow paths within the system must be known or estimated upfront. FNM cannot resolve 3D flow paths- advanced techniques or additional modeling may be required if these exist. Empirical sub-system flow resistance data is not required, although flow-bench data of available sub-systems can be used if available. At a minimum, vendor air-mover data is required. For software based solvers, run times are extremely short- on the order of seconds. Detailed Design Once a single layout has been agreed upon, detailed design work begins in earnest. The thermal designer must now focus on identified areas of thermal risk within the product. Here, thermal analyses become more detailed (and time consuming), while results become more refined. Experimental measurement and construction of mockups of system critical areas may be required for input into models, or to gain information concerning areas of the product that are difficult to model. The ultimate goal of the thermal designer is to dig deeply into critical areas and offer design suggestions in order to facilitate an optimal product design that meets or exceeds the project schedule
Concept Design Hardware
time
CORRELATIONS/SPREADSHEETS
CFD
TESTING
FNM
Concept Design Hardware
time
CORRELATIONS/SPREADSHEETS
CFD
TESTING
FNM
Detailed Design Phase Thermal Tools. Tools commonly used in the electronics industry for detailed thermal design are Computational Fluid Dynamics (CFD) and Finite Element Analysis (FEA) solvers. Typically, these types of analyses require longer setup / solve times and more detailed input data. Three dimensional (3D) modeling or simplification of existing 3D Computer Aided Design (CAD) models may be required. User experience is required for the most accurate results. Furthermore, based upon system size and complexity, empirical sub-system flow resistance data may be required as described in [6] and [7]. This data can be gathered through flow- bench testing of fans, heat sinks and subsystems as they become available. CFD solvers marketed for the electronics industry, such as IcePak [8] and FLOTHERM [9], incorporate the ability to perform heat transfer calculations in addition to fluid flow solutions. FEA analyses may be required to solve for component, interconnect, or board temperatures once global airflow rates or heat transfer coefficients are calculated. Hardware Test Once product prototypes are available, the Hardware Test phase begins. The goal of the thermal designer here is to experimentally measure critical components and areas of risk within the product in order to verify the design. At this point,
there should be no surprises. Additionally, measurements are compared to estimates in order to “calibrate” or fine tune earlier models (calibrated models can be used in future studies). These comparisons are used to determine the accuracy of initial predictions and to help the designer develop “thermal intuition”. Hardware Test Phase Thermal Tools. While the most common tool for temperature measurement most certainly is the thermocouple, additional tools such as thermistors, RTDs, thermochromic liquid crystals, thermopiles, and infrared imaging techniques, are also available. Detailed information concerning their use is found in [10]. Air velocity measurement is also valuable during this phase. Classis hot wire anemometers provide the most precise measurements (they can measure speed and direction), but can be fragile, difficult to calibrate, and expensive. Newer “rugged” hot wire probes are available from Cambridge Accusense Inc. These probes, packaged in an easy –to-attach sensor, measure mean air speed (straight wire only- no directional information) and temperature. [11]
COMPUTER SYSTEM DESIGN: THE METHODOLOGY APPLIED
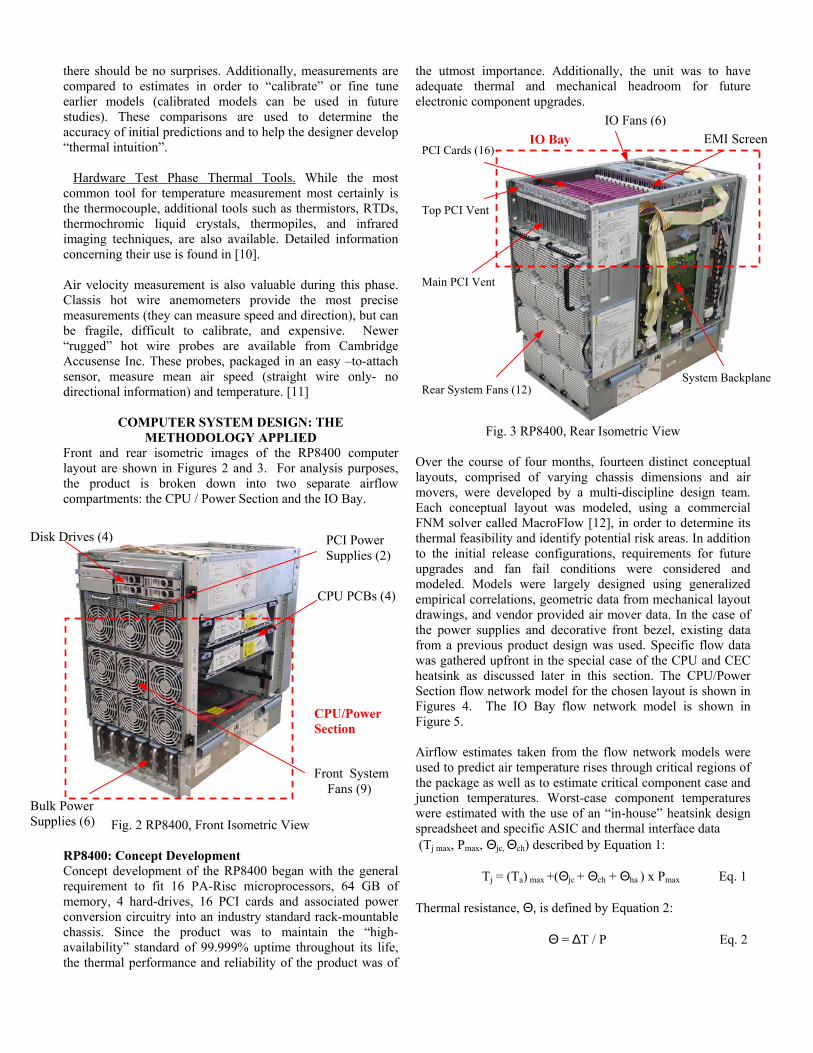
Front and rear isometric images of the RP8400 computer layout are shown in Figures 2 and 3. For analysis purposes, the product is broken down into two separate airflow compartments: the CPU / Power Section and the IO Bay.
Fig. 2 RP8400, Front Isometric View RP8400: Concept Development Concept development of the RP8400 began with the general requirement to fit 16 PA-Risc microprocessors, 64 GB of memory, 4 hard-drives, 16 PCI cards and associated power conversion circuitry into an industry standard rack-mountable chassis. Since the product was to maintain the “high-availability” standard of 99.999% uptime throughout its life, the thermal performance and reliability of the product was of
the utmost importance. Additionally, the unit was to have adequate thermal and mechanical headroom for future electronic component upgrades. )
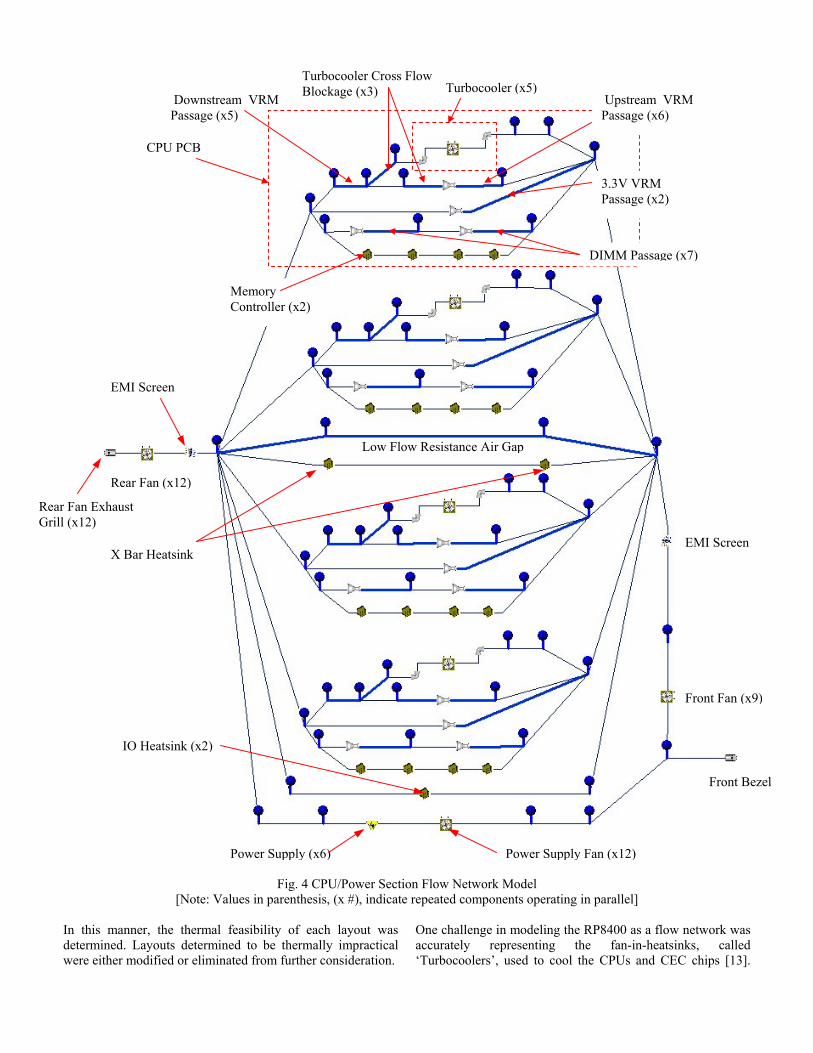
Fig. 3 RP8400, Rear Over the course of four months,layouts, comprised of varying movers, were developed by a mEach conceptual layout was mFNM solver called MacroFlow [thermal feasibility and identify poto the initial release configuratiupgrades and fan fail conditmodeled. Models were largely empirical correlations, geometricdrawings, and vendor provided athe power supplies and decoratifrom a previous product design was gathered upfront in the speciheatsink as discussed later in thSection flow network model for tFigures 4. The IO Bay flow Figure 5. Airflow estimates taken from thused to predict air temperature risthe package as well as to estimatejunction temperatures. Worst-cawere estimated with the use of aspreadsheet and specific ASIC an (Tj max, Pmax, Θjc, Θch) described b Tj = (Ta) max +(Θjc + Θ Thermal resistance, Θ, is defined Θ = ∆T
Front System Fans (9)
CPU PCBs (4)
)
PCI Cards (16)
Rear System Fans (12)
IO Bay
Top PCI Vent
Main PCI Vent
PCI Power Supplies (2)
IO Fans (6
Isometric View
fourteen distinct conceptual chassis dimensions and air ulti-discipline design team.
odeled, using a commercial 12], in order to determine its tential risk areas. In addition
System Backplane
Disk Drives (4
ons, requirements for future ions were considered and designed using generalizeddata from mechanical layout ir mover data. In the case of ve front bezel, existing data was used. Specific flow data al case of the CPU and CEC is section. The CPU/Power he chosen layout is shown in network model is shown in
CPU/PowerSection
e flow network mes through critica critical componese component ten “in-house” heatd thermal interfacy Equation 1:
ch + Θha ) x Pmax
by Equation 2:
/ P
EMI Screen
odels were l regions of nt case and mperatures sink design e data
Bulk Power Supplies (6)
Eq. 1
Eq. 2
Turbocooler Cross Flow Blockage (x3) )
In this mannedetermined. Lwere either mo
B
Rear Fan Exhaust Grill (x12)
EMI
Downstream VRM Passage (x5)
Upstream VRM Passage (x6)
CPU PC
)
Screen
3.3V VRM Passage (x2)
)
Memory Controller (x2)
Rear Fan (x12
[Note: V
r, the thermalayouts determidified or elimin
)
)
n
Power Supply (x6
Fig. 4 CPU/Power Section Flow Networkalues in parenthesis, (x #), indicate repeated compon
feasibility of each layout was ned to be thermally impractical ated from further consideration.
One challenge iaccurately re‘Turbocoolers’,
Power Supply Fan (x12)
Model ents operating in parallel]
n modeling the RP8400 as a flowpresenting the fan-in-heatsi used to cool the CPUs and CE
Front Fan (x9
netwnks, C ch
Front Bezel
EMI Scree
Turbocooler (x5
DIMM Passage (x7
Low Flow Resistance Air Gap
X Bar Heatsink
IO Heatsink (x2)
ork was called
ips [13].
TurboCooler Fan Curve
0
0.02
0.04
0.06
0.08
0.1
0.12
0.14
0.16
0.00 5.00 10.00 15.00 20.00
Airflow (CFM)
Stat
ic P
ress
ure
(in H
20)
t t
VRM exhaust (x2)
)
)
e
n
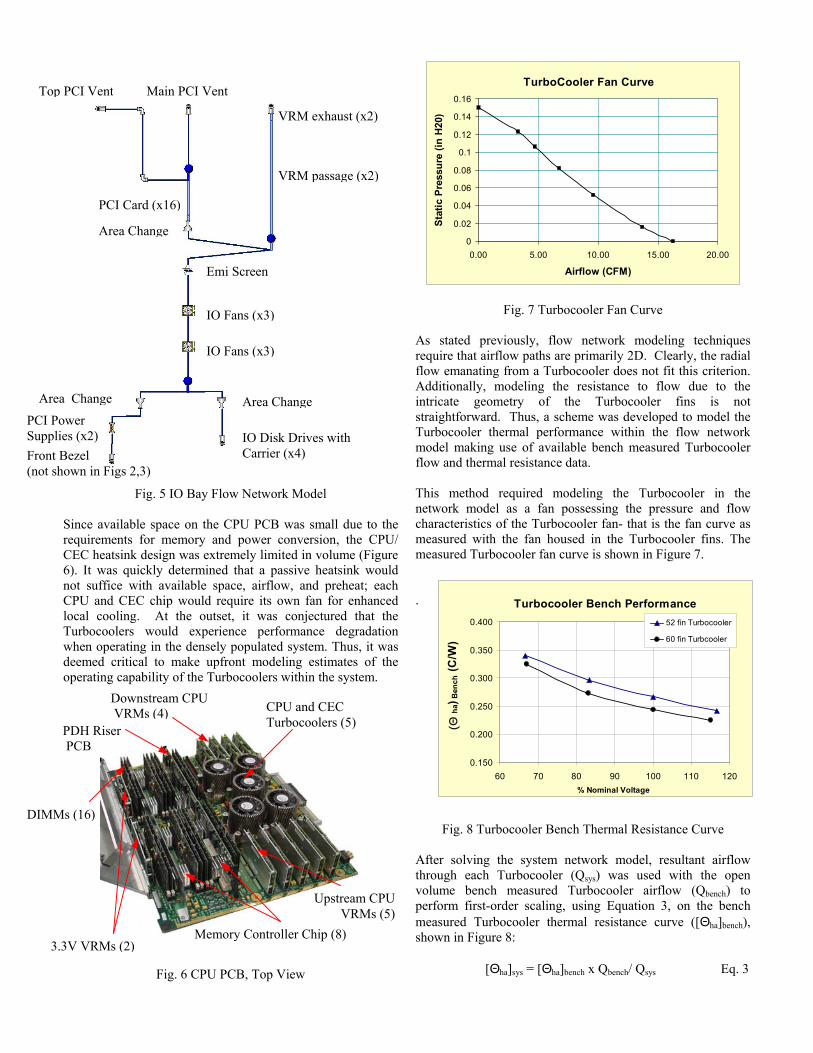
Fig. 5 IO Ba
Since available space onrequirements for memorCEC heatsink design was6). It was quickly determnot suffice with availabCPU and CEC chip woulocal cooling. At the Turbocoolers would exwhen operating in the dedeemed critical to makeoperating capability of th
Fig. 6 C
Fig. 7 Turbocooler Fan Curve
As stated previously, flow network modeling techniques require that airflow paths are primarily 2D. Clearly, the radial
PCI Power Supplies (x2) Front Bezel (not shown in Figs 2,3)
)
IO Fans (x3)
IO Fans (x3)
Emi Scree
y Flow Netw
the CPU PCy and power extremely limined that a
le space, airfld require itsoutset, it waperience pensely populat upfront moe Turbocooler
PU PCB, Top
IO DCarri
CT
VRM passage (x2
PCI Card (x16
ork Model
B was small due to the conversion, the CPU/ ited in volume (Figure
passive heatsink would low, and preheat; each own fan for enhanced s conjectured that the rformance degradation ed system. Thus, it was deling estimates of the s within the system.
flow emanating from a Turbocooler does not fit this criterion. Additionally, modeling the resistance to flow due to the intricate geometry of the Turbocooler fins is not straightforward. Thus, a scheme was developed to model the Turbocooler thermal performance within the flow network model making use of available bench measured Turbocooler flow and thermal resistance data.
e
isk Drives with er (x4)
This method required modeling the Turbocooler in the network model as a fan possessing the pressure and flow characteristics of the Turbocooler fan- that is the fan curve as measured with the fan housed in the Turbocooler fins. The measured Turbocooler fan curve is shown in Figure 7.
Turbocooler Bench Performance
0.150
0.200
0.250
0.300
0.350
0.400
60 70 80 90 100 110 120% Nominal Voltage
(Θ ha
) Ben
ch (C
/W)
52 fin Turbocooler
60 fin Turbcooler
.
PU and CEC urbocoolers (5)
Fig. 8 Turbocooler Bench Thermal Resistance Curve
After solving the system network model, resultant airflow through each Turbocooler (Qsys) was used with the open volume bench measured Turbocooler airflow (Qbench) to perform first-order scaling, using Equation 3, on the bench measured Turbocooler thermal resistance curve ([Θha]bench), shown in Figure 8: )
Upstream CPU VRMs (5)
Memory Controller Chip (8
3.3V VRMs (2)
Area Chang
Area ChangeArea Chang
Downstream CPU VRMs (4)
Main PCI Ven
Top PCI VenPDH Riser PCB
DIMMs (16
View [Θha]sys = [Θha]bench x Qbench/ Qsys Eq. 3
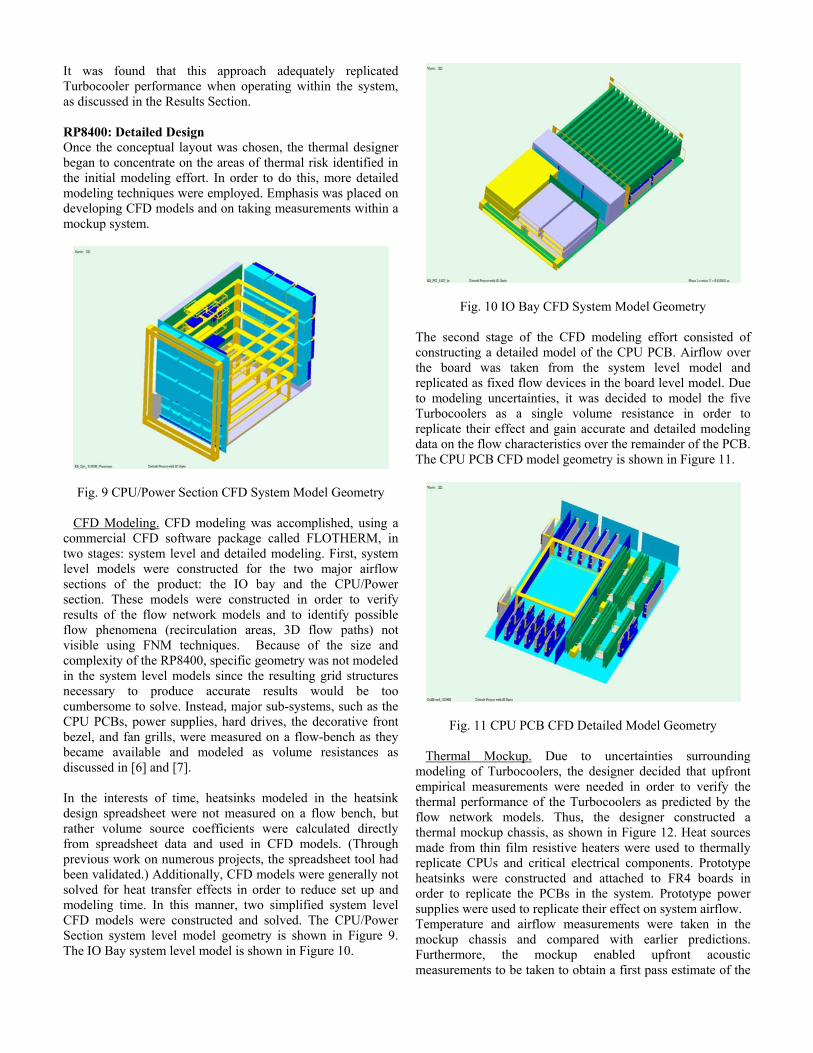
It was found that this approach adequately replicated Turbocooler performance when operating within the system, as discussed in the Results Section. RP8400: Detailed Design Once the conceptual layout was chosen, the thermal designer began to concentrate on the areas of thermal risk identified in the initial modeling effort. In order to do this, more detailed modeling techniques were employed. Emphasis was placed on developing CFD models and on taking measurements within a mockup system.
Fig. 9 CPU/Power Section CFD System Model Geometry CFD Modeling. CFD modeling was accomplished, using a commercial CFD software package called FLOTHERM, in two stages: system level and detailed modeling. First, system level models were constructed for the two major airflow sections of the product: the IO bay and the CPU/Power section. These models were constructed in order to verify results of the flow network models and to identify possible flow phenomena (recirculation areas, 3D flow paths) not visible using FNM techniques. Because of the size and complexity of the RP8400, specific geometry was not modeled in the system level models since the resulting grid structures necessary to produce accurate results would be too cumbersome to solve. Instead, major sub-systems, such as the CPU PCBs, power supplies, hard drives, the decorative front bezel, and fan grills, were measured on a flow-bench as they became available and modeled as volume resistances as discussed in [6] and [7]. In the interests of time, heatsinks modeled in the heatsink design spreadsheet were not measured on a flow bench, but rather volume source coefficients were calculated directly from spreadsheet data and used in CFD models. (Through previous work on numerous projects, the spreadsheet tool had been validated.) Additionally, CFD models were generally not solved for heat transfer effects in order to reduce set up and modeling time. In this manner, two simplified system level CFD models were constructed and solved. The CPU/Power Section system level model geometry is shown in Figure 9. The IO Bay system level model is shown in Figure 10.
Fig. 10 IO Bay CFD System Model Geometry The second stage of the CFD modeling effort consisted of constructing a detailed model of the CPU PCB. Airflow over the board was taken from the system level model and replicated as fixed flow devices in the board level model. Due to modeling uncertainties, it was decided to model the five Turbocoolers as a single volume resistance in order to replicate their effect and gain accurate and detailed modeling data on the flow characteristics over the remainder of the PCB. The CPU PCB CFD model geometry is shown in Figure 11.
Fig. 11 CPU PCB CFD Detailed Model Geometry Thermal Mockup. Due to uncertainties surrounding modeling of Turbocoolers, the designer decided that upfront empirical measurements were needed in order to verify the thermal performance of the Turbocoolers as predicted by the flow network models. Thus, the designer constructed a thermal mockup chassis, as shown in Figure 12. Heat sources made from thin film resistive heaters were used to thermally replicate CPUs and critical electrical components. Prototype heatsinks were constructed and attached to FR4 boards in order to replicate the PCBs in the system. Prototype power supplies were used to replicate their effect on system airflow. Temperature and airflow measurements were taken in the mockup chassis and compared with earlier predictions. Furthermore, the mockup enabled upfront acoustic measurements to be taken to obtain a first pass estimate of the
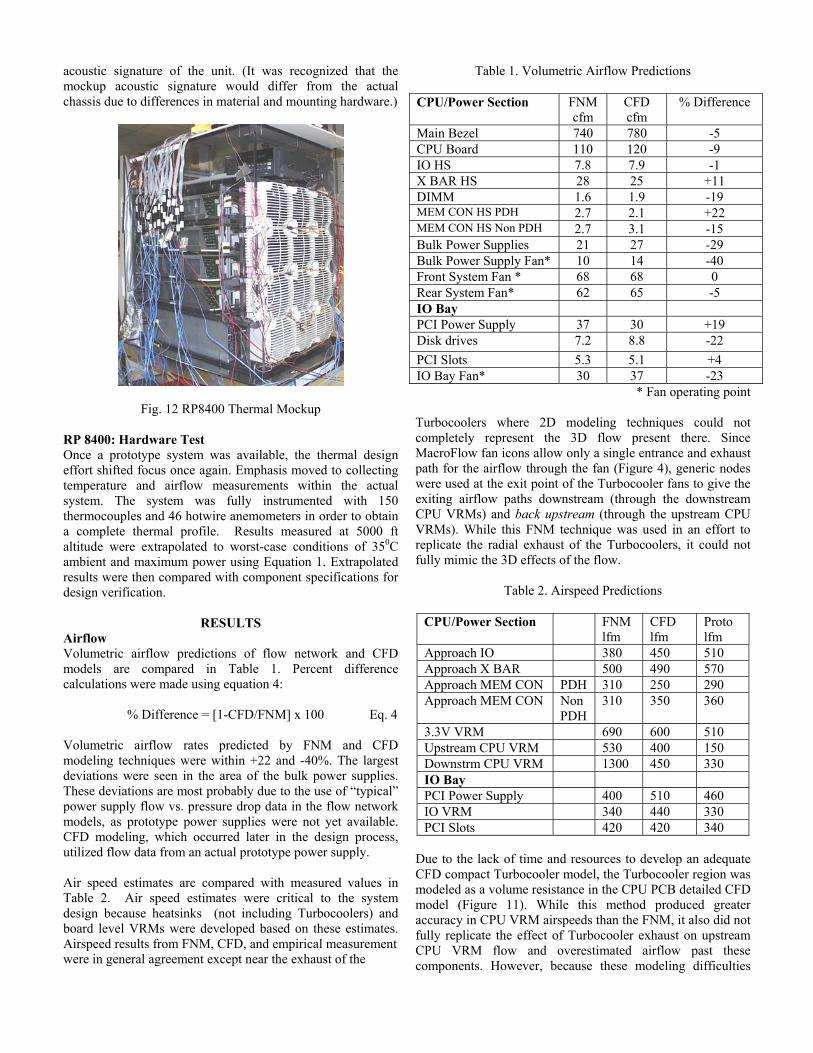
acoustic signature of the unit. (It was recognized that the mockup acoustic signature would differ from the actual chassis due to differences in material and mounting hardware.)
Fig. 12 RP8400 Thermal Mockup RP 8400: Hardware Test Once a prototype system was available, the thermal design effort shifted focus once again. Emphasis moved to collecting temperature and airflow measurements within the actual system. The system was fully instrumented with 150 thermocouples and 46 hotwire anemometers in order to obtain a complete thermal profile. Results measured at 5000 ft altitude were extrapolated to worst-case conditions of 350C ambient and maximum power using Equation 1. Extrapolated results were then compared with component specifications for design verification.
RESULTS Airflow Volumetric airflow predictions of flow network and CFD models are compared in Table 1. Percent difference calculations were made using equation 4: % Difference = [1-CFD/FNM] x 100 Eq. 4 Volumetric airflow rates predicted by FNM and CFD modeling techniques were within +22 and -40%. The largest deviations were seen in the area of the bulk power supplies. These deviations are most probably due to the use of “typical” power supply flow vs. pressure drop data in the flow network models, as prototype power supplies were not yet available. CFD modeling, which occurred later in the design process, utilized flow data from an actual prototype power supply. Air speed estimates are compared with measured values in Table 2. Air speed estimates were critical to the system design because heatsinks (not including Turbocoolers) and board level VRMs were developed based on these estimates. Airspeed results from FNM, CFD, and empirical measurement were in general agreement except near the exhaust of the
Table 1. Volumetric Airflow Predictions CPU/Power Section FNM
cfm CFD cfm
% Difference
Main Bezel 740 780 -5 CPU Board 110 120 -9 IO HS 7.8 7.9 -1 X BAR HS 28 25 +11 DIMM 1.6 1.9 -19 MEM CON HS PDH 2.7 2.1 +22 MEM CON HS Non PDH 2.7 3.1 -15 Bulk Power Supplies 21 27 -29 Bulk Power Supply Fan* 10 14 -40 Front System Fan * 68 68 0 Rear System Fan* 62 65 -5 IO Bay PCI Power Supply 37 30 +19 Disk drives 7.2 8.8 -22 PCI Slots 5.3 5.1 +4 IO Bay Fan* 30 37 -23
* Fan operating point
Turbocoolers where 2D modeling techniques could not completely represent the 3D flow present there. Since MacroFlow fan icons allow only a single entrance and exhaust path for the airflow through the fan (Figure 4), generic nodes were used at the exit point of the Turbocooler fans to give the exiting airflow paths downstream (through the downstream CPU VRMs) and back upstream (through the upstream CPU VRMs). While this FNM technique was used in an effort to replicate the radial exhaust of the Turbocoolers, it could not fully mimic the 3D effects of the flow.
Table 2. Airspeed Predictions
CPU/Power Section FNM lfm
CFD lfm
Proto lfm
Approach IO 380 450 510 Approach X BAR 500 490 570 Approach MEM CON PDH 310 250 290 Approach MEM CON Non
PDH 310 350 360
3.3V VRM 690 600 510 Upstream CPU VRM 530 400 150 Downstrm CPU VRM 1300 450 330 IO Bay PCI Power Supply 400 510 460 IO VRM 340 440 330 PCI Slots 420 420 340
Due to the lack of time and resources to develop an adequate CFD compact Turbocooler model, the Turbocooler region was modeled as a volume resistance in the CPU PCB detailed CFD model (Figure 11). While this method produced greater accuracy in CPU VRM airspeeds than the FNM, it also did not fully replicate the effect of Turbocooler exhaust on upstream CPU VRM flow and overestimated airflow past these components. However, because these modeling difficulties
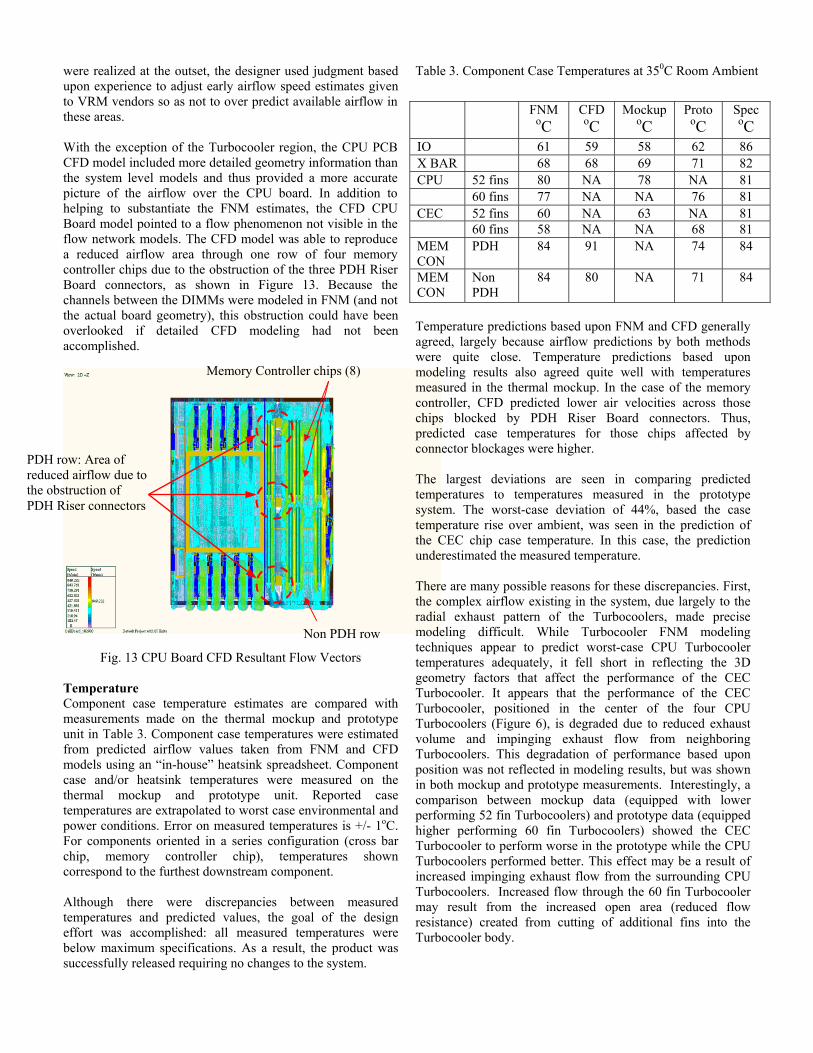
were realized at the outset, the designer used judgment based upon experience to adjust early airflow speed estimates given to VRM vendors so as not to over predict available airflow in these areas. With the exception of the Turbocooler region, the CPU PCB CFD model included more detailed geometry information than the system level models and thus provided a more accurate picture of the airflow over the CPU board. In addition to helping to substantiate the FNM estimates, the CFD CPU Board model pointed to a flow phenomenon not visible in the flow network models. The CFD model was able to reproduce a reduced airflow area through one row of four memory controller chips due to the obstruction of the three PDH Riser Board connectors, as shown in Figure 13. Because the channels between the DIMMs were modeled in FNM (and not the actual board geometry), this obstruction could have been overlooked if detailed CFD modeling had not been accomplished.
There are many possible reasons for these discrepancies. First, the complex airflow existing in the system, due largely to the radial exhaust pattern of the Turbocoolers, made precise modeling difficult. While Turbocooler FNM modeling
Fig. 13 CPU Board CFD Resultan
Temperature Component case temperature estimatesmeasurements made on the thermal munit in Table 3. Component case temperfrom predicted airflow values taken fmodels using an “in-house” heatsink sprcase and/or heatsink temperatures wethermal mockup and prototype utemperatures are extrapolated to worst capower conditions. Error on measured temFor components oriented in a series conchip, memory controller chip), tcorrespond to the furthest downstream co Although there were discrepancies temperatures and predicted values, theeffort was accomplished: all measurebelow maximum specifications. As a resuccessfully released requiring no change
Table 3. Component Case Temperatures at 350C Room Ambient
FNM oC
CFD oC
Mockup oC
Proto oC
Spec oC
IO 61 59 58 62 86 X BAR 68 68 69 71 82 CPU 52 fins 80 NA 78 NA 81 60 fins 77 NA NA 76 81 CEC 52 fins 60 NA 63 NA 81 60 fins 58 NA NA 68 81 MEM CON
PDH 84 91 NA 74 84
MEM CON
Non PDH
84 80 NA 71 84
Temperature predictions based upon FNM and CFD generally agreed, largely because airflow predictions by both methods were quite close. Temperature predictions based upon modeling results also agreed quite well with temperatures measured in the thermal mockup. In the case of the memory controller, CFD predicted lower air velocities across those chips blocked by PDH Riser Board connectors. Thus, predicted case temperatures for those chips affected by connector blockages were higher.
Memory Controller chips (8)
PDH row: Area of reduced airflow due to the obstruction of PDH Riser connectors
The largest deviations are seen in comparing predicted temperatures to temperatures measured in the prototype system. The worst-case deviation of 44%, based the case temperature rise over ambient, was seen in the prediction of the CEC chip case temperature. In this case, the prediction underestimated the measured temperature.
Non PDH row techniques appear to predict worst-case CPU Turbocooler temperatures adequately, it fell short in reflecting the 3D geometry factors that affect the performance of the CEC Turbocooler. It appears that the performance of the CEC Turbocooler, positioned in the center of the four CPU Turbocoolers (Figure 6), is degraded due to reduced exhaust volume and impinging exhaust flow from neighboring Turbocoolers. This degradation of performance based upon position was not reflected in modeling results, but was shown in both mockup and prototype measurements. Interestingly, a comparison between mockup data (equipped with lower performing 52 fin Turbocoolers) and prototype data (equipped higher performing 60 fin Turbocoolers) showed the CEC Turbocooler to perform worse in the prototype while the CPU Turbocoolers performed better. This effect may be a result of increased impinging exhaust flow from the surrounding CPU Turbocoolers. Increased flow through the 60 fin Turbocooler may result from the increased open area (reduced flow resistance) created from cutting of additional fins into the Turbocooler body.t Flow Vectors
are compared with ockup and prototype atures were estimated rom FNM and CFD eadsheet. Component re measured on the nit. Reported case se environmental and peratures is +/- 1oC. figuration (cross bar
emperatures shown mponent.
between measured goal of the design d temperatures were sult, the product was s to the system.
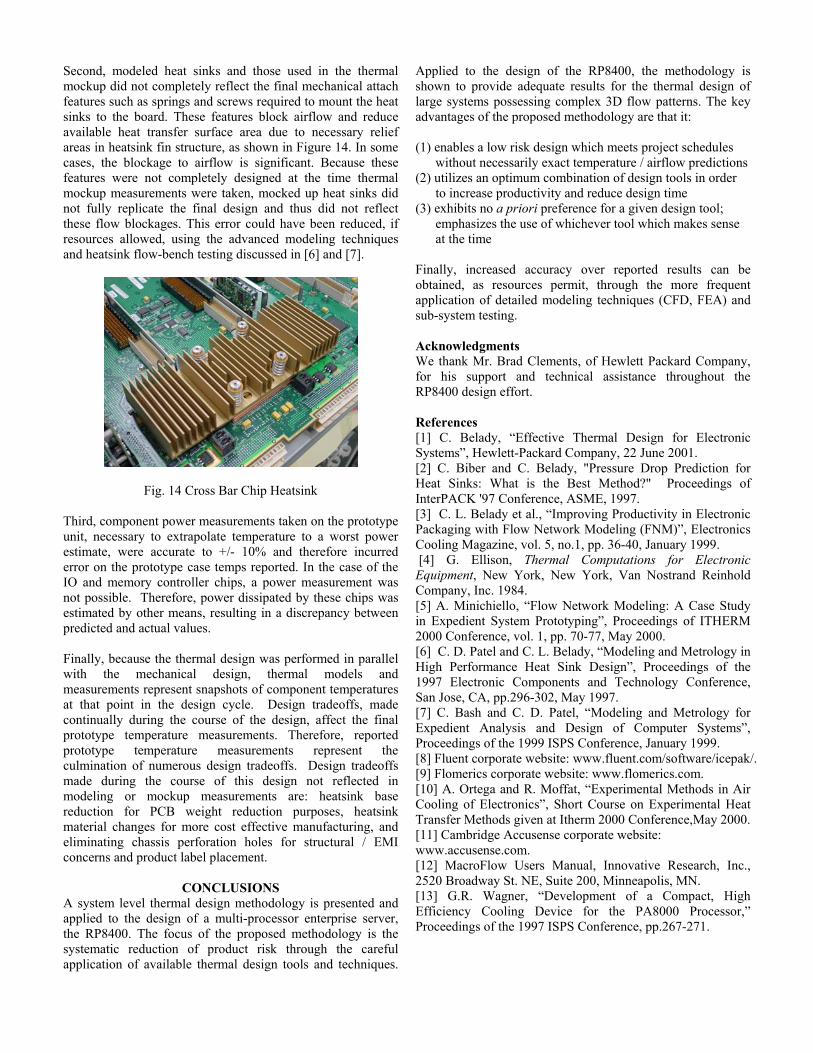
Second, modeled heat sinks and those used in the thermal mockup did not completely reflect the final mechanical attach features such as springs and screws required to mount the heat sinks to the board. These features block airflow and reduce available heat transfer surface area due to necessary relief areas in heatsink fin structure, as shown in Figure 14. In some cases, the blockage to airflow is significant. Because these features were not completely designed at the time thermal mockup measurements were taken, mocked up heat sinks did not fully replicate the final design and thus did not reflect these flow blockages. This error could have been reduced, if resources allowed, using the advanced modeling techniques and heatsink flow-bench testing discussed in [6] and [7].
Fig. 14 Cross Bar Chip Heatsink Third, component power measurements taken on the prototype unit, necessary to extrapolate temperature to a worst power estimate, were accurate to +/- 10% and therefore incurred error on the prototype case temps reported. In the case of the IO and memory controller chips, a power measurement was not possible. Therefore, power dissipated by these chips was estimated by other means, resulting in a discrepancy between predicted and actual values. Finally, because the thermal design was performed in parallel with the mechanical design, thermal models and measurements represent snapshots of component temperatures at that point in the design cycle. Design tradeoffs, made continually during the course of the design, affect the final prototype temperature measurements. Therefore, reported prototype temperature measurements represent the culmination of numerous design tradeoffs. Design tradeoffs made during the course of this design not reflected in modeling or mockup measurements are: heatsink base reduction for PCB weight reduction purposes, heatsink material changes for more cost effective manufacturing, and eliminating chassis perforation holes for structural / EMI concerns and product label placement.
CONCLUSIONS A system level thermal design methodology is presented and applied to the design of a multi-processor enterprise server, the RP8400. The focus of the proposed methodology is the systematic reduction of product risk through the careful application of available thermal design tools and techniques.
Applied to the design of the RP8400, the methodology is shown to provide adequate results for the thermal design of large systems possessing complex 3D flow patterns. The key advantages of the proposed methodology are that it: (1) enables a low risk design which meets project schedules without necessarily exact temperature / airflow predictions (2) utilizes an optimum combination of design tools in order to increase productivity and reduce design time (3) exhibits no a priori preference for a given design tool; emphasizes the use of whichever tool which makes sense at the time Finally, increased accuracy over reported results can be obtained, as resources permit, through the more frequent application of detailed modeling techniques (CFD, FEA) and sub-system testing. Acknowledgments We thank Mr. Brad Clements, of Hewlett Packard Company, for his support and technical assistance throughout the RP8400 design effort. References [1] C. Belady, “Effective Thermal Design for Electronic Systems”, Hewlett-Packard Company, 22 June 2001. [2] C. Biber and C. Belady, "Pressure Drop Prediction for Heat Sinks: What is the Best Method?" Proceedings of InterPACK '97 Conference, ASME, 1997. [3] C. L. Belady et al., “Improving Productivity in Electronic Packaging with Flow Network Modeling (FNM)”, Electronics Cooling Magazine, vol. 5, no.1, pp. 36-40, January 1999. [4] G. Ellison, Thermal Computations for Electronic Equipment, New York, New York, Van Nostrand Reinhold Company, Inc. 1984. [5] A. Minichiello, “Flow Network Modeling: A Case Study in Expedient System Prototyping”, Proceedings of ITHERM 2000 Conference, vol. 1, pp. 70-77, May 2000. [6] C. D. Patel and C. L. Belady, “Modeling and Metrology in High Performance Heat Sink Design”, Proceedings of the 1997 Electronic Components and Technology Conference, San Jose, CA, pp.296-302, May 1997. [7] C. Bash and C. D. Patel, “Modeling and Metrology for Expedient Analysis and Design of Computer Systems”, Proceedings of the 1999 ISPS Conference, January 1999. [8] Fluent corporate website: www.fluent.com/software/icepak/. [9] Flomerics corporate website: www.flomerics.com. [10] A. Ortega and R. Moffat, “Experimental Methods in Air Cooling of Electronics”, Short Course on Experimental Heat Transfer Methods given at Itherm 2000 Conference,May 2000. [11] Cambridge Accusense corporate website: www.accusense.com. [12] MacroFlow Users Manual, Innovative Research, Inc., 2520 Broadway St. NE, Suite 200, Minneapolis, MN. [13] G.R. Wagner, “Development of a Compact, High Efficiency Cooling Device for the PA8000 Processor,” Proceedings of the 1997 ISPS Conference, pp.267-271.