Embed Size (px)
Citation preview

47th International Conference on Environmental Systems ICES-2017-170 16-20 July 2017, Charleston, South Carolina
Thermal Design and Analysis of an ISS Science Payload –
SAGE III on ISS
Kaitlin A. K. Liles1, Ruth M. Amundsen2, and Warren T. Davis3
NASA Langley Research Center (LaRC), Hampton, VA, 23681
Laurie Y. Carrillo4
NASA Johnson Space Center (JSC), Houston, TX, 77058
The Stratospheric Aerosol and Gas Experiment III (SAGE III) instrument is the fifth in
a series of instruments developed for monitoring aerosols and gaseous constituents in the
stratosphere and troposphere. SAGE III will be launched in the SpaceX Dragon vehicle in
2017 and mounted to an external stowage platform on the International Space Station (ISS)
to begin its three-year mission. The SAGE III thermal team at NASA Langley Research
Center (LaRC) worked with ISS thermal engineers to ensure that SAGE III, as an ISS
payload, would meet requirements specific to ISS and the Dragon vehicle. This document
presents an overview of the SAGE III thermal design and analysis efforts, focusing on
aspects that are relevant for future ISS payload developers. This includes development of
detailed and reduced Thermal Desktop (TD) models integrated with the ISS and launch
vehicle models, definition of analysis cases necessary to verify thermal requirements
considering all mission phases from launch through installation and operation on-orbit, and
challenges associated with thermal hardware selection including heaters, multi-layer
insulation (MLI) blankets, and thermal tapes.
Nomenclature
BATC = Ball Aerospace and Technologies Corporation
BOL = Beginning of Life
CDR = Critical Design Review
CMP = Contamination Monitoring Package
DMP = Disturbance Monitoring Package
DOE = Design of Experiments
ELC = ExPRESS Logistics Carrier
EOL = End of Life
EOTP = Enhanced ORU Transfer Platform
EVA = Extravehicular Activity
ExPA = EXPRESS Payload Adapter
ExPRESS = Expedite the Processing of Experiments to Space Station
FOD = Foreign Object Damage
FRAM = Flight Releasable Attachment Mechanism
GMM = Geometric Math Model
GSE = Ground Support Equipment
GSFC = Goddard Space Flight Center
H2O = Water Vapor
HEU = Hexapod Electronics Unit
HMA = Hexapod Mechanical Assembly
HPS = Hexapod Pointing System
1Thermal Engineer, Structural and Thermal Systems Branch, Engineering Directorate, Mail Stop 431. 2 Thermal Engineer, Structural and Thermal Systems Branch, Engineering Directorate, Mail Stop 431. 3 Thermal Engineer, Structural and Thermal Systems Branch, Engineering Directorate, Mail Stop 431. 4 Thermal Engineer, Thermal Design Branch, Engineering Directorate, Mail Stop ES3.
https://ntrs.nasa.gov/search.jsp?R=20170007404 2018-07-26T09:45:19+00:00Z
International Conference on Environmental Systems
2
IA = Instrument Assembly
IAM = Interface Adapter Module
ICE = Instrument Control Electronics
In = inches
IP = Instrument Payload
IR = Infrared
ISS = International Space Station
JSC = Johnson Space Center
LaRC = Langley Research Center
MBS = Mobile Base System
MCR = Mission Concept Review
MLI = Multi-layer Insulation
MRAD = Mission Resource Allocation Document
MSS = Mobile Servicing System
MT = Mobile Translator
NESC = NASA Engineering Safety Center
NO2 = Nitrogen Dioxide
NVP = Nadir Viewing Platform
O2 = Oxygen
O3 = Ozone
ORU = Orbital Replacement Unit
PDR = Preliminary Design Review
PEL = Power Equipment List
PRT = Platinum Resistance Thermometers
PTCS = Passive Thermal Control Systems
ROBO = Robotics Operations
RTD = Resistance Temperature Detectors
SA = Sensor Assembly
SAGE = Stratospheric Aerosol and Gas Experiment
SARJ = Solar Array Rotary Joint
SINDA/FLUINT = Systems Improved Numerical Differencing Analyzer/Fluid Integrator
SIR = Systems Integration Review
SPDM = Special Purpose Dexterous Manipulator
SRR = System Requirements Review
SSRMS = Space Station Remote Manipulator System
TAS-I = Thales Alenia Space – Italy
TD = Thermal Desktop
TFAWS = Thermal and Fluids Analysis Workshop
TMM = Thermal Math Model
TRASYS = Thermal Radiation Analyzer System
TRRJ = Thermal Radiator Rotary Joints
TVAC = Thermal Vacuum
V = Volts
W = Watts
YPR = Yaw, Pitch, Roll

International Conference on Environmental Systems
3
Figure 4: SAGE III IP and NVP in
Dragon Trunk.
I. Introduction
he Stratospheric Aerosol and Gas Experiment (SAGE) III instrument is the fifth in a series of instruments
developed for monitoring aerosols and gaseous constituents in the stratosphere and troposphere. SAGE III was
launched in the SpaceX Dragon vehicle in February 2017 and mounted to an external stowage platform on the
International Space Station (ISS) to begin its three-year mission. SAGE III measures solar occultation, as shown in
Figure 1a and lunar occultation in a similar fashion. SAGE III also measures
the scattering of solar radiation in the Earth’s atmosphere (called limb
scattering) as shown in Figure 1b. These scientific measurements provide the
basis for the
analysis of five of
the nine critical
constituents
identified in the
U.S. National Plan
for Stratospheric
Monitoring. These
five atmospheric
components include
the profiles of
aerosols, ozone
(O3), nitrogen
dioxide (NO2), water vapor (H
2O), and air density using
oxygen (O2). The SAGE III project is a partnership between LaRC,
Thales Alenia Space – Italy (TAS-I), and Ball Aerospace
and Technologies Corporation (BATC). SAGE III consists
of two payloads – the Instrument Payload (IP) and the
Nadir Viewing Platform (NVP). The IP, shown in Figure 2
is broken down into several subsystems including the
Instrument Assembly (IA), Hexapod Pointing System
(HPS), Interface Adapter Module (IAM), Contamination
Monitoring Package (CMP), and Disturbance Monitoring
Package (DMP). The IA and HPS are existing hardware
from the heritage SAGE III on ISS mission while the IAM,
CMP, and DMP are being developed. The NVP is shown
in Figure 3, which attaches to both the IP and the ISS via
standard ISS Flight Releasable Attachment Mechanisms
(FRAMs).
Figure 4 shows the IP and NVP installed in the Dragon trunk. The
purpose of the NVP is to orient the IP so that it is nadir-facing; this is
required for the IA to collect science data. SAGE III will be mounted
on the Expedite the Processing of Experiments to Space Station
(ExPRESS) Logistics Carrier (ELC)-4 on the port-facing side of the
ELC-4 at site 3, as shown in Figure 5.
The IP thermal design includes various types of thermal hardware
including thin-film heaters for survival and operation, multi-layer
insulation (MLI) blankets, and thermal tapes. Thermal hardware was
selected in order to ensure that the payload would remain within an
acceptable temperature range for all phases of the mission. During the
design phase, it was necessary to consider ISS requirements and
constraints when specifying the details of the thermal hardware.
Many types of thermal analyses were required to ensure that the
SAGE III payload would remain within acceptable limits during all
phases of the mission. Configurations included those with the payload
mounted in the Dragon capsule, on the EOTP during transfer from
T
Figure 2: Instrument Payload (IP).
(a) Solar Occultation
(b) Limb Scattering
Figure 1: SAGE III
Measurement Techniques.
Passive FRAM
Interface Plate
Truss
Structure
Passive FRAM
Components
(PFRAM)
Power CableExPA
Interface Plate
ExPRESS
Payload Adapter
(ExPA)
Data Cable
Figure 3: Nadir Viewing Platform (NVP).

International Conference on Environmental Systems
4
Table 1: Voltage Ranges.
Mission
Phase Bus
Voltage (V)
Min Nominal Max
Dragon Main Contingency (120V) 113 120 126
EOTP Main Contingency (120V) 103.6 120 124.6
ELC
Operational (28V) 25 28 31
Operational (120V) 106.5 120 126.5
Main Contingency (120V) 106.5 120 126.5
Auxiliary Contingency (120V) 106.5 120 126.5
Dragon to ELC-4, and at the payload’s final
location on ELC-4. Analysis runs were
performed to determine the worst-case orbital
parameters for this payload and this location on
ISS, standard runs to evaluate the payload
thermal behavior during test and in all
operational phases, and mapping of thermal
results to a structural model to evaluate
thermally-induced stress and deflection.
A detailed thermal model of the SAGE III
payloads mounted to the ISS was developed at
NASA Langley Research Center (LaRC). This
model was used for the majority of the
analyses, and many methods were developed to
make the model more efficient and effective in
order to expedite this large amount of thermal
analysis1,2. A low-fidelity model was created and delivered to SpaceX and the ISS Passive Thermal Control Systems
(PTCS) team for integration into their Dragon and ISS models, respectively. SpaceX performed mission-specific
analysis for the time between launch and berthing to ISS and the PTCS team performed detailed analyses to make
temperature predictions for the transfer of the IP from the Dragon trunk to the ELC-4.
II. Thermal Design
The IP is thermally controlled via a combination of active and passive design elements. Thermal control is not
required for the NVP because it has no active electronics or other temperature-sensitive items.
The active thermal control of the IP is achieved using Kapton thin film heaters with 3M 966 adhesive which are
operated in a bang-bang (simple on/off) mode using mechanical thermostats. The IP heater power has a different
configuration depending on where the IP is mounted during the different phases of the mission. These phases
include the Dragon trunk as it travels to and berths with the ISS, the Enhanced Orbital Replacement Unit (ORU)
Transfer Platform (EOTP) as the payload is being moved from Dragon to its final location, and the IP’s final
location at ELC-4. Table 1 shows the power busses available during each mission phase, along with their voltage
ranges. In the Dragon trunk and on the EOTP, only the main contingency power bus is available to provide heater
power to the IP. While on the ELC-4 for nominal operations the operational (120V) bus, the main contingency bus,
and the auxiliary contingency
bus are available to provide
heater power to the IP. The
SAGE III survival heaters were
sized based on the limiting
power case which occurs while
SAGE III is mounted on the
EOTP. Heater resistances were
specified based on nominal
power values. Minimum
powers, corresponding to the
minimum voltages at each
SAGE III location (Dragon,
EOTP, and ELC-4), were used
in the thermal model to verify that the heater power is sufficient to maintain acceptable temperatures. Maximum
powers, corresponding to the maximum voltage for the SAGE III mission (which occurs on ELC-4), were used to
verify that the total heater power consumption remains within the limits defined by ISS. Maximum voltages were
also used to determine the heater watt density.
Each subsystem has one operational heater and two survival heaters (one main and one auxiliary), with the
exception of the Sensor Assembly (SA) for which the same heaters are used for operation and survival. The main
and auxiliary heaters for a given subsystem are of identical specification. Watt density is taken into account when
specifying heaters because higher watt densities represent higher risk for heater failures, primarily because in the
event that a portion of the heater becomes detached from the hardware on which it is installed, a local hotspot could
Figure 5: SAGE III Location on ISS.
International Conference on Environmental Systems
5
develop. Within the thermal community, the standard practice for maximum watt density varies considerably.
Based on a Goddard Space Flight Center (GSFC) procurement specification3, the SAGE III thermal team originally
set a goal to keep heater watt densities below 3.5 W/in2 (note that this is conservative since that guideline relates to a
heater suspended in air, while the SAGE III heaters are all mounted to metal surfaces); however, this was not
possible in the case of the CMP due to its small size and required heater power. Guidelines provided in Tayco
Engineering, Inc. specification documentation4 stated that “normal satellite usage is less than 3 W/in2; however,
depending on application methods, power density can go up to 25 W/in2” and “heaters with watt densities of 3-7
W/in2 should be secured using epoxy around the perimeter.” Based on this guidance, the watt densities for the CMP
heaters were limited to a maximum of 7 W/in2.
Standard practices for heater installation vary. The SAGE III heaters were installed using a procedure written at
LaRC which was developed based on a review of a GSFC procedure5 for installing Kapton heaters and on guidance
received from the heater manufacturer and others in the NASA and industry thermal community6. To minimize the
risk of creating bubbles in the heater surfaces during installation, the SAGE III heaters are all simple shapes
(rectangles and circles) and were mounted on flat surfaces, with the exception of the CMP survival heaters which
encountered a small amount of curved surface. Per GSFC recommendation, heat was applied to the heater surfaces
using a clean-room compatible heat gun to remove as much moisture and residual solvent as possible. After
thoroughly cleaning the surface to which the heater was to be applied, the heaters were installed by exposing the
film adhesive and carefully rolling the heater onto the surface, keeping the heater at an angle of approximately 30°
and slowly removing the protective backing paper. Uniform finger pressure was applied to ensure good contact.
Small beads of epoxy were applied around the perimeter of each heater as a way to prevent the edges of the heater
from peeling up. While this may not be necessary for heaters with very low watt densities (below 3 W/in2), there is
no drawback to using the method besides the necessity of ensuring that there is enough physical space for the epoxy
beads.
While some groups maintain that aluminum over-tape should be used on Kapton heaters as a heat-spreader or to
prevent the heater edges from curling up, the SAGE III team (along with the heater manufacturer Tayco) believes
this is not necessary when heaters are being mounted to a metal substrate that is sufficiently thick to provide
adequate heat sinking capability. In the case of SAGE III, all of the surfaces to which heaters were mounted were at
least 50 times thicker than the aluminum tape. Additionally, Tayco does not recommend the use of over-tape due to
concerns that it prevents gas and moisture from escaping the Kapton surface when placed in a vacuum environment.
This could lead to the formation of bubbles, and thus local hot spots and potential heater failure. There is successful
flight heritage for both configurations (with and without over-tape). SAGE III determined that it was prudent to
follow manufacturer recommendations unless there is a compelling reason not to do so. This decision and the
background research was thoroughly documented in a project report6 and interested readers may contact the author
for more information. Additionally, the report will be posted on the NASA Engineering Safety Center (NESC)
Passive Thermal community website (https://nen.nasa.gov/web/pt) after it is approved for public release. With the
exception of the Instrument Control Electronics (ICE) heaters, which were installed prior to the SAGE III team
discovering Tayco’s recommendation not to use over-tape, the SAGE III heaters were installed without the use of
aluminum over-tape. After discussing the various options, the SAGE III team decided that the risk of making
modifications to the ICE heaters outweighed the potential benefits. Removing the aluminum tape carries a high risk
of damaging the heater surface and creating a gap in the existing epoxy, which could lead to damage of the heaters
or the ICE chassis. Thermal predictions indicate that there is very little risk of the heater surfaces reaching
temperatures at which the
aluminum tape would de-bond;
additionally, if this were to occur in
flight the tape would be contained
within the ICE bracket and as such
would not pose any risk of Foreign
Object Damage (FOD) to SAGE III
or ISS.
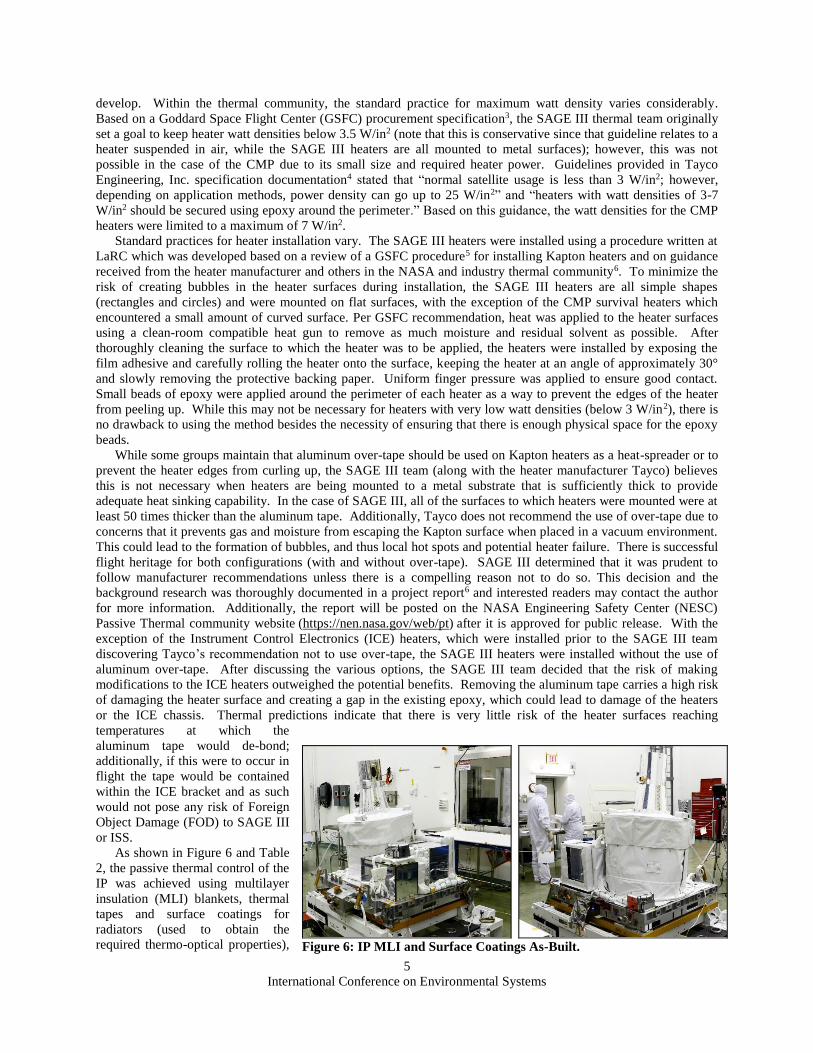
As shown in Figure 6 and Table
2, the passive thermal control of the
IP was achieved using multilayer
insulation (MLI) blankets, thermal
tapes and surface coatings for
radiators (used to obtain the
required thermo-optical properties),
Figure 6: IP MLI and Surface Coatings As-Built.

International Conference on Environmental Systems
6
Table 2: IP Passive Control Summary.
IP Subsystem Blankets Coatings
Interface Adapter
Module (IAM)
MLI with aluminized beta cloth
exterior on wake side
Triple-layer beta cloth connector boots
on connectors not covered by MLI
5 mil silver Teflon on all sides except wake
(ram side partially obscured by cables)
Small portions not covered by tape are
irridite or hard anodized aluminum
Contamination
Monitoring
Package (CMP)
Triple-layer beta cloth connector boots
Four-layer beta cloth finger guard
around CMP1 isolators
5 mil silver Teflon except over connectors
and on bottom
Small portions not covered by tape are hard
anodized aluminum
Disturbance
Monitoring
Package (DMP)
None Painted with Aeroglaze Z-307 except bottom
which is clear anodized
Sensor Assembly
(SA) None external
5 mil perforated silver Teflon on scan head
and azimuth thermal housing
Aluminized side of aluminized Kapton on
spectrometer thermal housing
Instrument
Controller
Electronics (ICE)
MLI with aluminized beta cloth
exterior covers ICE, bracket and
connectors on all sides except wake
and nadir
Four-layer beta cloth finger guard
around standoffs
10 mil silver Teflon on wake and nadir
facing surfaces (legacy material)
2 mil aluminized Kapton on bottom of
bracket
Black anodized aluminum on portions not
covered by tape
ExPA
3 MLI blankets with aluminized beta cloth
exterior cover all exposed portions of
ExPA except part of the starboard-facing
side and keep out zones
5 mil silver Teflon under HEU
2 mil aluminized Kapton under ICE and
within HMA enclosure
Clear anodized aluminum on remainder
Hexapod
Mechanical
Assembly (HMA)
2 MLI blankets with aluminized beta cloth
exterior Black anodized aluminum
Hexapod
Electronics Unit
(HEU)
MLI with aluminized beta cloth exterior on
port side (igloo extending from HMA
blanket)
5 mil silver Teflon on all sides except port
Small portions not covered by tape are
black anodized aluminum
Kapton tape is on the bottom of the HEU
thermal interface materials used to maximize conductive heat transfer, and thermal isolation. Three different MLI
layups were used on the IP. The ExPRESS Payload Adapter (ExPA), ICE, and IAM MLI blankets consist of 15
total layers with an additional aluminized beta cloth outer layer (aluminizing is on the inside). The inner (hardware-
facing) layer was intended to be Kapton-out for all of these blankets; however, due to an error in the fabrication
process the IAM blanket has the inner layer with the aluminized side out. Impacts of this difference are considered
to be negligible. The Hexapod blankets consist of 21 total layers with an additional aluminized beta cloth outer
layer. Aluminized beta cloth was used (in lieu of plain beta cloth) to ensure that a light-blocking layer was present to
prevent the MLI from getting too hot. The MLI blankets are vented in the wake, port, and starboard directions using
Spectra mesh filters. The design is such that no venting will occur toward the CMPs, SA, or silver Teflon surfaces to
minimize contamination. To prevent the possibility of astronauts’ fingers becoming trapped anywhere on the SAGE
III payload during an Extra-Vehicular Activity (EVA), plain beta cloth finger guards (4 layers) where installed
around the wire-rope isolators that attach the CMP1 to the IAM, and around the standoffs that attach the ICE to the
ExPA. Connector “boots” made with 3 layers of plain beta cloth were installed on all connector backshells that
were not already covered by an MLI blanket. MLI blankets, finger guards, and connector boots were installed
primarily with Velcro, although buttons were used in limited cases where Velcro was not practical. Drawstrings

International Conference on Environmental Systems
7
Table 3: IP Thermal Contact.
IP
Subsystem Description of Thermal Contact
IAM
In good thermal contact with the ExPA using NuSil CV-2946. There is a section with material
removed to reduce mass under the Flight Computer under which an aluminum filler plate is
mounted. The interface between the IAM and the filler plate also contains NuSil CV-2946.
CMP1 Thermally isolated from the IAM because it is mounted on wire-rope isolators for structural
reasons.
CMP2 In contact with the ExPA with no interface material.
DMP Interfaces to the ExPA with an interface mounting plate made of Aluminum 6061.
SA Attaches to the HMA and uses Ti-6Al-4V standoffs and washers for thermal isolation.
ICE Installed within a bracket which interfaces with the ExPA via twelve titanium standoffs and
washers for thermal isolation.
HMA
Uses 5mm zirconia thermal washers for thermal isolation of each bolt attached to the ExPA. For
each bolt, 2 washers are used to decouple the HMA from the ExPA. One washer is below the head
of the bolt and the other is between the HMA offset flange and the ExPA.
HEU Hard-mounted to the ExPA. Due to the shape of the chassis, only the feet of the HEU are in contact
with the ExPA.
were used to secure the connector boots around cable bundles. All cables not covered by MLI blankets were
wrapped in plain beta cloth (single layer with 50% overlap).
The IP uses silver Teflon tape to create its radiator surfaces and aluminized Kapton tape to minimize radiative
coupling between selected surfaces within the IP. All tapes used on the IP are attached via pre-applied acrylic 966
adhesive. As with the heaters, the SAGE III team developed a procedure at LaRC based on review of various
procedures including manufacturer-provided documentation7 and procedures from GSFC. As was the case with the
Kapton heaters, surfaces were thoroughly cleaned and the tape was carefully rolled onto the hardware surface. For
dimpled areas such as recessed bolt heads, the trapped air volume was eliminated by cutting a small slit or excising
an area of tape directly over the recessed area. Since materials do not adhere well to Teflon, it was necessary to
leave several 1” diameter cut-outs to allow for installation of test thermocouples prior to thermal vacuum (TVAC)
testing. Cutouts were circular to avoid sharp corners which may catch or peel up more easily. Following testing and
removal of the thermocouples, circular patches were installed at cut-out locations to recover silver Teflon coverage
on the hardware. It is important to note that silver Teflon must be handled very carefully as it can be damaged
(scratched) relatively easily; this can lead not only to deterioration of thermal properties, but can be a contamination
concern depending on the sensitivity of the payload. Because of an ISS requirement related to minimizing the view
factor of reflective surfaces to the ISS and other payloads, it was necessary to obtain concurrence from the ISS
Passive Thermal Control Systems (PTCS) group early in the design process for the extensive use of silver Teflon
that was planned for SAGE III. In addition, to verify that the heat flux from the radiators would be acceptable for
the ISS, the heat rate was found for each component with silver Teflon to all of the ISS in the worst hot case, at the
hottest time point. The power transfer to ISS was summed over all the silver Teflon surfaces on each component,
and summed over all ISS surfaces that each component transfers heat to; this total is not reduced by the heat input to
the component from any ISS surface. These values were provided, along with the total heat loss to space from each
component, to the ISS for concurrence during the requirements verification process.
Table 3 summarizes the thermal contact between each subsystem and its conductive interface. Some of the
conductive interfaces within the IP were designed for the purpose of thermal isolation while others were designed to
facilitate good thermal contact. The IAM interface design was particularly challenging because the electronics
dissipate a significant amount of heat which cannot all be dissipated through the radiative interface with space.
Furthermore, the available footprint for the IAM was limited due to the fact that all SAGE III subsystems had to fit
on the standard ExPA provided by ISS, and the chassis is only fastened to the ExPA on two sides (fasteners ~20”
apart) which does not provide continuous contact pressure along the full length of the chassis. Various options were
considered, including indium foil and gap pad 2200SF, but the interface material finally selected was NuSil CV-
2946. The design iterations and challenges encountered are described in a presentation made at the 2015 Thermal
and Fluids Analysis Workshop (TFAWS)8. Readers who wish for more information may contact the author.
A total of 98 sensors are used to monitor the temperature of the IP. Most of the temperature sensors are 10k
thermistors; however, there are also several Resistance Temperature Detectors (RTDs) and 1k Platinum Resistance
Thermometers (PRTs). Six channels of temperature measurements are available via the ISS ELC data stream when

International Conference on Environmental Systems
8
Figure 7: Detailed SAGE III Thermal
Model (IP and NVP).
Figure 8: SAGE III Integrated with
Dragon.
the IP is powered off. The placement of these sensors was critical, since they provide the only information to
initially assess payload health and readiness to begin activation following installation on ISS. No SAGE III
temperature data is available while in the Dragon trunk (although there are three sensors mounted to trunk structure,
the data is not payload-specific) or on the EOTP. For this reason, it is critical for ISS payloads to develop a thermal
model that can accurately predict thermal time-to-limit in the Dragon and robotic transfer scenarios (discussed
further in Section V).
III. Detailed Thermal Model Development
A detailed thermal model of the SAGE III payloads mounted
to the ISS was developed using Thermal Desktop (TD) and the
combined IP and NVP model is shown in Figure 7. This
integrated model was used for all SAGE III analyses performed at
LaRC, with the exception of initial subsystem model
development. This included all of the analysis required for on-
orbit operations on the ISS, launch and transit to ISS in Dragon
(additional analysis was performed by SpaceX and the PTCS team
using their models), and predictions related to ground testing. The
definition of SAGE III analysis cases is discussed in Section V.
The model
includes a
detailed
representation of
the SAGE III
payload and reduced representations of the ISS and Dragon.
The model is shown integrated with Dragon in Figure 8 and with
ISS in Figure 9. Additionally, it includes models of two TVAC
chambers in which SAGE III ground testing occurred and the
Ground Support Equipment (GSE) associated with each test. Figure
10 shows the IP configured with its GSE for the system-level TVAC
configuration (chamber is not shown for clarity).
The model utilizes flags to define which
submodels should be built for various scenarios.
Having all configurations housed within the
same model was extremely beneficial because it
prevented branches of the model held by
different analysts from falling out of sync and
reduced the likelihood of changes being
inadvertently left out when branches of a model
were re-integrated2.
The TD model of the ISS was provided to the
SAGE III thermal team by the ISS PTCS team at
The Boeing Company (Houston) and Johnson
Space Center (JSC). The PTCS team worked
closely with the SAGE III team to ensure that the
models were integrated properly; lines of communication remained open throughout the project for SAGE III
analysts to request guidance on the use of the ISS model for analyzing various scenarios and/or verifying thermal
requirements. This model, which is a simplified version of the full ISS model specifically intended for use by
hardware developers to determine the induced thermal environment imposed by the ISS9, was imported into the
SAGE III thermal model and translated to metric temperature units for consistency with the SAGE III modeling
approach1. The SAGE III model can be run in either set of temperature units, °C or °F, by setting the associated
register. The ISS model provided a much more accurate solution than would have been possible by making
assumptions for boundary conditions and blocking surfaces. The model has the flexibility to simulate key
operational aspects of the ISS (visiting vehicles, control of solar arrays and radiators, changes in ISS attitude, etc.)9.
Figure 9: SAGE III Integrated with ISS (v6r4).

International Conference on Environmental Systems
9
Figure 11: ExPA Model.
Table 4: Description of Submodels
Subsystems Manufacturer /
Model Developer
Number of
Nodes
HMA TAS-I / TAS-I 1058
HEU TAS-I / LaRC 1070
SA BATC / BATC 1489
ICE BATC / LaRC 2192
IAM LaRC / LaRC 2142
CMP1 LaRC / LaRC 425
CMP2 LaRC / LaRC 392
DMP Honeywell /
Honeywell
10
Total IP 8778
NVP LaRC / LaRC 1233
Total SAGE 10011
ExPA (x2) JSC / JSC 222
EOTP JSC / JSC 94
ISS JSC / JSC 3538
Dragon SpaceX / JSC 44
Total Integrated Model 13909
Figure 12: SA Thermal
Model.
Figure 13: ICE Thermal Model.
The initial version of the ISS model that was included in the
SAGE III model in 2011 was v6r1. Due to the complexities
involved with removing and re-importing the ISS model (primarily
a result of the units conversion and addition of symbols for tracker
control), the SAGE III team did not update the ISS model with
each revision; however, the SAGE III and JSC PTCS teams
worked together to determine when updates were appropriate and
the decision was made to update the ISS model once during the
SAGE III design and analysis process. The current version of the
SAGE III model includes v6r4 (January 2012) of the ISS model.
The most recent version of the ISS model released to payload
developers is v7r1; the SAGE III team is currently assessing the
usefulness of updating the ISS model for future on-orbit
predictions. The logic for the ISS model is contained within three
blocks: the main block to generate nodes and conductors, register
data, and setting boundary temperatures for hot and cold cases.
Only radiative heat exchange between SAGE III and ELC-4 is
modeled because the contact is very minimal and it is reasonable to
assume no conductive heat transfer; this also helps satisfy an ISS
requirement stating that payloads cannot not rely on the ISS for a
conductive heat sink.
The ExPA model was provided separately and
the v3 model is included in the SAGE III detailed
model. The ISS program requires use of the
standard ExPA model that was created by the ISS
PTCS team to aid in payload thermal analysis. The
SAGE III thermal model includes two ExPAs, one
for the IP
ExPA and one
for the NVP
ExPA. Thus,
this ExPA v3
model was
imported
twice, and
placed on the correct articulators and at the
correct location for each ExPA. The imported
ExPA model is as shown in Figure 11. Due to
the coarseness of the mesh, it was necessary to
use contactors to include the radiation from the
ICE, HEU, and HMA to the un-insulated parts
of the ExPA. The ExPA model utilizes
RadCAD surfaces which are not used to create
SINDA nodes. Instead, the nodes and
conductors (linear and radiative) are created in
logic blocks within the model. Logic blocks are also used to
create the arrays for temperature-dependent materials.
The SAGE III team also incorporated a reduced version of the
Dragon model into the system-level model, which was provided
by the ISS PTCS team. Along with the model itself, PTCS
provided a guidelines document that defined modeling
Figure 10: IP in System-Level TVAC
Configuration.
SAGE III

International Conference on Environmental Systems
10
Figure 14: DMP Thermal
Model.
Figure 16: CMP1 Thermal Model.
Figure 17: HEU Thermal Model.
Figure 18: HMA Thermal Model.
Figure 19: NVP Thermal
Model.
Figure 15: IAM Thermal Model.
assumptions and analysis cases. As was the case with incorporation of the ISS model, the PTCS team worked
closely with the SAGE III team to ensure that the Dragon model was properly incorporated and that the cases were
set up to properly complete the analysis. The initial version of the Dragon model provided to SAGE III was v1r1 and
an update was later made to v3r1. The Dragon model v3r1 includes several changes to the orbits that are required to
be run. These orbits were substantially different than the orbits in the earlier Dragon model. In order to facilitate
import of these orbits and other orbits in potential future releases of the Dragon model, symbols were used to change
the orientation of Dragon and SAGE III assemblies so the imported Dragon orbits could be used directly, without
alteration of orientation.
The initial baseline thermal model was developed in support of the SAGE III Mission Concept Review (MCR) in
August 2011 and the model was continuously updated as the SAGE III design matured. Model updates and current
results were presented at each major SAGE III project life-cycle review with the last documented update occurring
at the Systems Integration Review (SIR) in May 2015. The model was correlated at the subsystem level for the
majority of the subsystems
(SA, ICE, IAM, CMP, and
HEU) and again at the
system level following IP
TVAC testing10.
The SAGE III thermal
team at LaRC consisted of
multiple analysts, with a
total of six analysts
working on the model over the course of the project.
Three analysts from BATC and TAS-I worked on the
subsystem models that were provided to LaRC. The
model was stored on a shared drive along with an excel
spreadsheet which was used to track changes that were
made to the model (including version history) and results
summaries over time. The model was version-controlled
using a system of major (numerical) and minor
(alphabetical) version names. The final version of the model prior to beginning on-orbit operations was v59c. Many
efficiency-improving methods were implemented during the development of this model related to the use of
assemblies, logic, and symbols in TD1,2.
Because the SAGE III project was a partnership between several organizations, submodels developed by various
partners were delivered to the LaRC thermal team who created the integrated model. All models were provided in
TD; although earlier versions of some of the models of heritage
components were in other software, BATC and TAS-I provided
LaRC with TD models for incorporation into the system-level
thermal model. LaRC also developed detailed models for the
subsystems that were built at LaRC. Table 4 provides a list of the
subsystems, information about who built the hardware and the
model, and the number of nodes for each subsystem as well as the
integrated model. The SAGE III subsystem models are shown in
detail in Figure 12 through Figure 19. The CMP2 model is not
shown because it is very similar to the CMP1 model which is shown in
Figure 16.
Each electronics box includes a board-level internal model where
components with significant power dissipation and/or critical thermal
limits were included. The remaining
power dissipation (for components not
modeled) was distributed evenly across
the appropriate board. Measured surface
properties (emissivity and absorptivity)
were included where possible, and in other cases properties were obtained from
standard sources such as the Spacecraft Thermal Control Handbook11. Where power
International Conference on Environmental Systems
11
Table 5: Actual vs. Model Mass Comparison
Subsystem Actual
Mass (lb)
Mass in Thermal
Model (lb)
Percentage
Difference
IP 730.3 618.8 -15%
NVP 419.3 368.5 -12%
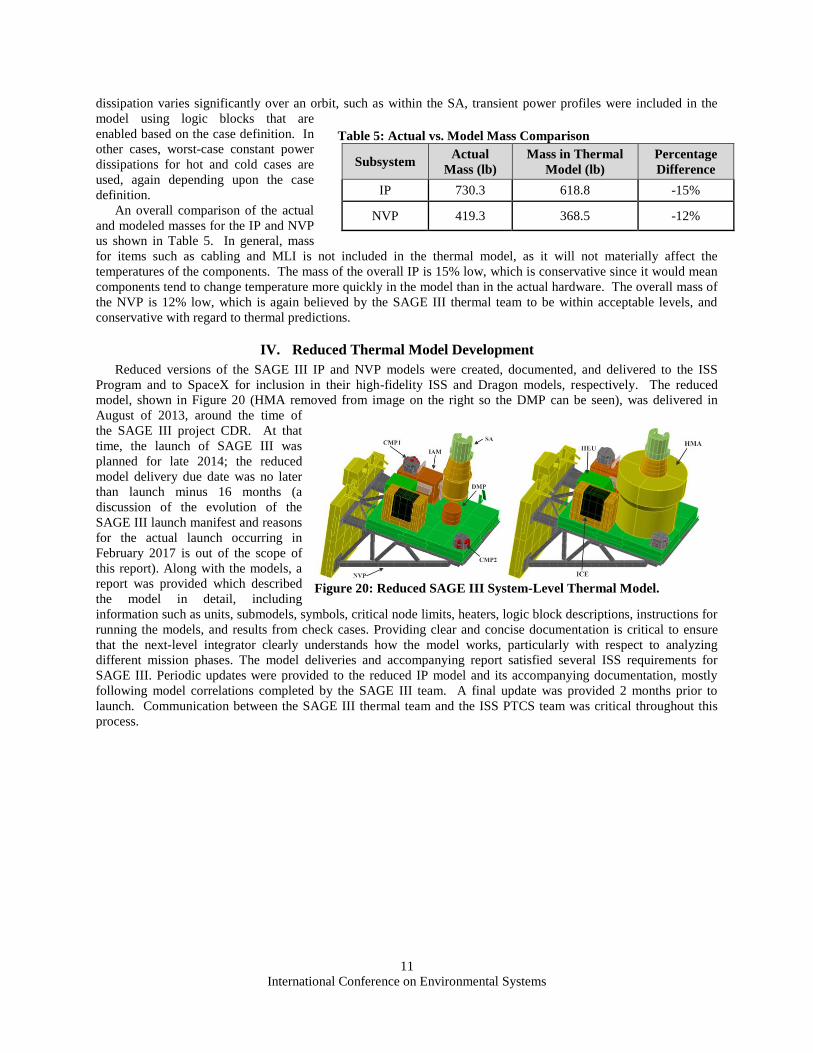
Figure 20: Reduced SAGE III System-Level Thermal Model.
dissipation varies significantly over an orbit, such as within the SA, transient power profiles were included in the
model using logic blocks that are
enabled based on the case definition. In
other cases, worst-case constant power
dissipations for hot and cold cases are
used, again depending upon the case
definition.
An overall comparison of the actual
and modeled masses for the IP and NVP
us shown in Table 5. In general, mass
for items such as cabling and MLI is not included in the thermal model, as it will not materially affect the
temperatures of the components. The mass of the overall IP is 15% low, which is conservative since it would mean
components tend to change temperature more quickly in the model than in the actual hardware. The overall mass of
the NVP is 12% low, which is again believed by the SAGE III thermal team to be within acceptable levels, and
conservative with regard to thermal predictions.
IV. Reduced Thermal Model Development
Reduced versions of the SAGE III IP and NVP models were created, documented, and delivered to the ISS
Program and to SpaceX for inclusion in their high-fidelity ISS and Dragon models, respectively. The reduced
model, shown in Figure 20 (HMA removed from image on the right so the DMP can be seen), was delivered in
August of 2013, around the time of
the SAGE III project CDR. At that
time, the launch of SAGE III was
planned for late 2014; the reduced
model delivery due date was no later
than launch minus 16 months (a
discussion of the evolution of the
SAGE III launch manifest and reasons
for the actual launch occurring in
February 2017 is out of the scope of
this report). Along with the models, a
report was provided which described
the model in detail, including
information such as units, submodels, symbols, critical node limits, heaters, logic block descriptions, instructions for
running the models, and results from check cases. Providing clear and concise documentation is critical to ensure
that the next-level integrator clearly understands how the model works, particularly with respect to analyzing
different mission phases. The model deliveries and accompanying report satisfied several ISS requirements for
SAGE III. Periodic updates were provided to the reduced IP model and its accompanying documentation, mostly
following model correlations completed by the SAGE III team. A final update was provided 2 months prior to
launch. Communication between the SAGE III thermal team and the ISS PTCS team was critical throughout this
process.
International Conference on Environmental Systems
12
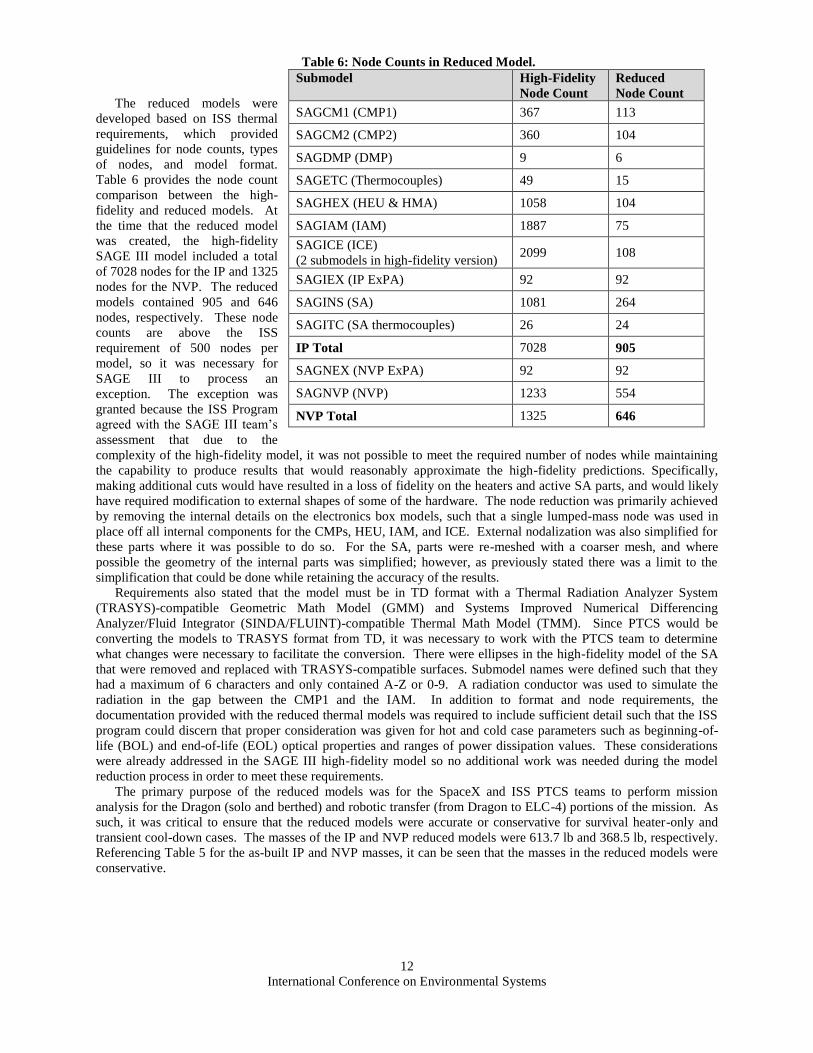
Table 6: Node Counts in Reduced Model.
Submodel High-Fidelity
Node Count
Reduced
Node Count
SAGCM1 (CMP1) 367 113
SAGCM2 (CMP2) 360 104
SAGDMP (DMP) 9 6
SAGETC (Thermocouples) 49 15
SAGHEX (HEU & HMA) 1058 104
SAGIAM (IAM) 1887 75
SAGICE (ICE)
(2 submodels in high-fidelity version) 2099 108
SAGIEX (IP ExPA) 92 92
SAGINS (SA) 1081 264
SAGITC (SA thermocouples) 26 24
IP Total 7028 905
SAGNEX (NVP ExPA) 92 92
SAGNVP (NVP) 1233 554
NVP Total 1325 646
The reduced models were
developed based on ISS thermal
requirements, which provided
guidelines for node counts, types
of nodes, and model format.
Table 6 provides the node count
comparison between the high-
fidelity and reduced models. At
the time that the reduced model
was created, the high-fidelity
SAGE III model included a total
of 7028 nodes for the IP and 1325
nodes for the NVP. The reduced
models contained 905 and 646
nodes, respectively. These node
counts are above the ISS
requirement of 500 nodes per
model, so it was necessary for
SAGE III to process an
exception. The exception was
granted because the ISS Program
agreed with the SAGE III team’s
assessment that due to the
complexity of the high-fidelity model, it was not possible to meet the required number of nodes while maintaining
the capability to produce results that would reasonably approximate the high-fidelity predictions. Specifically,
making additional cuts would have resulted in a loss of fidelity on the heaters and active SA parts, and would likely
have required modification to external shapes of some of the hardware. The node reduction was primarily achieved
by removing the internal details on the electronics box models, such that a single lumped-mass node was used in
place off all internal components for the CMPs, HEU, IAM, and ICE. External nodalization was also simplified for
these parts where it was possible to do so. For the SA, parts were re-meshed with a coarser mesh, and where
possible the geometry of the internal parts was simplified; however, as previously stated there was a limit to the
simplification that could be done while retaining the accuracy of the results.
Requirements also stated that the model must be in TD format with a Thermal Radiation Analyzer System
(TRASYS)-compatible Geometric Math Model (GMM) and Systems Improved Numerical Differencing
Analyzer/Fluid Integrator (SINDA/FLUINT)-compatible Thermal Math Model (TMM). Since PTCS would be
converting the models to TRASYS format from TD, it was necessary to work with the PTCS team to determine
what changes were necessary to facilitate the conversion. There were ellipses in the high-fidelity model of the SA
that were removed and replaced with TRASYS-compatible surfaces. Submodel names were defined such that they
had a maximum of 6 characters and only contained A-Z or 0-9. A radiation conductor was used to simulate the
radiation in the gap between the CMP1 and the IAM. In addition to format and node requirements, the
documentation provided with the reduced thermal models was required to include sufficient detail such that the ISS
program could discern that proper consideration was given for hot and cold case parameters such as beginning-of-
life (BOL) and end-of-life (EOL) optical properties and ranges of power dissipation values. These considerations
were already addressed in the SAGE III high-fidelity model so no additional work was needed during the model
reduction process in order to meet these requirements.
The primary purpose of the reduced models was for the SpaceX and ISS PTCS teams to perform mission
analysis for the Dragon (solo and berthed) and robotic transfer (from Dragon to ELC-4) portions of the mission. As
such, it was critical to ensure that the reduced models were accurate or conservative for survival heater-only and
transient cool-down cases. The masses of the IP and NVP reduced models were 613.7 lb and 368.5 lb, respectively.
Referencing Table 5 for the as-built IP and NVP masses, it can be seen that the masses in the reduced models were
conservative.

International Conference on Environmental Systems
13
Table 7: Comparison between High-Fidelity and Reduced Model, Dragon Cold Case.
Component
Heater Duty Cycle Temperature
Difference (Reduced –
High Fidelity), °F
High Fidelity
v41
Reduced
v41_r25
CMP1 0% 0% +2
CMP2 0% 0% +3
DMP 86% 87% +1
HEU 97% 97% +3
HMA
88% actuators,
0% upper
platform
88% actuators,
0% upper
platform
0
IAM 77% 71% 0
ICE 67% 61% +2
SA Elevation
Motor N/A N/A +9
SA Azimuth
Motor 40% (Zone 3) 14% (Zone 3) -14
SA
Spectrometer
Assy
73% (Zone 1) 93% (Zone 1) +1
Figure 22: Comparison of High-Fidelity (left) and Reduced (right)
Model Results – Dragon Cold Case.
Table 8: Comparison of High-Fidelity and
Reduced Model Results – Cold Unpowered
EOTP Case.
Component
Difference in Temperature
Decrease after 6-hour
Unpowered Transient
(Reduced – High Fidelity),
°F
CMP1 -1
CMP2 0
DMP 0
HEU -2
HMA -2
IAM -1
ICE +5
SA Elevation
Motor -2
SA Azimuth
Motor +9
SA Spectrometer
Assy -3
Comparisons of
temperature predictions
to the high-fidelity
model are provided in
Table 7 through Table 9
and Figure 21 through
Figure 23. For each
figure, temperature maps
are shown from the high-
fidelity and reduced
models for the same
anlaysis case.
Temperature scales are
not shown but they are
equal for any given
figure, so a direct
comparison can be made.
Results are shown as a
difference between the
reduced and high fidelity
models (in °F as required
by ISS). A positive
number indicates that the reduced model
over-predicts when compared to the
high-fidelity model. For the Dragon
case, the results are shown for the end of
a 72-hour transient run. For the EOTP
case, the results are shown as the
temperature change at the end of 6-
hours with no operational or survival
power. For the hot operational case,
results shown are the maximum
temperatures at quasi-steady-state.
Direct comparisons were made
where possible; however, there are some
approximations. The temperatures shown for the high fidelity
model results are generally chassis averages. For the SA, the
spectrometer assembly temperatures shown are the CCD
shield temperatures (the elevation motor and azimuth motor
nodes are the same as in the reduced model). The SA Zone 3
heaters are listed along with the azimuth motor because those
heaters are located in the azimuth assembly. Likewise, the
scan mirror heater duty cycle (op case only) is shown with the
elevation motor since that heater is in the scan head assembly.
In general, the results show good agreement, with
temperatures being mostly within 5°F and heater duty cycles
being mostly within 6%. The exceptions were considered to
be acceptable to the SAGE III thermal team. The SA
elevation motor temperature predictions are within 9°F. The
SA is the most complex of the SAGE III subsystems, and as
such it was difficult to achieve better matching in the reduced
version. The SA azimuth motor temperature predictions are
14°F colder in the reduced model than in the high-fidelity
model in the cold survival cases (Dragon ATT01 and EOTP)
and 6°F warmer than the high-fidelity model in the hot
operational case. Although these differences may be larger

International Conference on Environmental Systems
14
Figure 23: Comparison of High-Fidelity and Reduced Model Results –
Cold Unpowered EOTP Case.
Table 9: Comparison of High-Fidelity and Reduced Model Results –
Hot Operational Case.
Component Heater Duty Cycle Temperature
Difference (Reduced
– High Fidelity), °F High
Fidelity v41
Reduced
v41_r25
CMP1 0% 0% +21
CMP2 0% 0% +17
DMP 0% 0% +4
HEU 0% 0% -1
HMA 0% 0% +1
IAM 0% 0% +5
ICE 0% 0% +21
SA Elevation
Motor
100% (scan
mirror)
100% (scan
mirror) -2
SA Azimuth
Motor 0% (Zone 3) 0% (Zone 3) +6
SA
Spectrometer
Assy
0% (Zone 1) 19% (Zone 1) +5
than desired, they are not of great
concern since they are
conservative. The transient cool-
down in the EOTP unpowered
case shows very good agreement
for all nodes except for the
azimuth motor, for which there is
a 9°F difference in the change in
temperature during the 6-hour
run. Although the cool-down is
somewhat slower in the reduced
model, the absolute temperature
prediction after the 6-hour run
matches very well with the high-
fidelity model. The discrepancy is also not of major concern because the azimuth motor is not the limiting
component when it comes to the transient cool-down case (other components reach limits first). In the hot
operational case, some of the electronics box temperature predictions are considerably warmer in the reduced model
than in the high-fidelity model; however, it is important to remember that the temperatures shown for the high-
fidelity model are chassis temperatures, while the reduced model temperatures represent lumped mass nodes to
which the operational power is applied. The SA zone 1 heater duty cycles and the HMA upper platform heater duty
cycles are high in some cases; however, this is considered to be acceptable since it will lead to conservative power
consumption estimates for the SAGE III
payload. The SA zone 3 heater duty
cycles are lower in the reduced model
than in the high fidelity model; however,
this will have a negligible impact on the
total power consumption estimates for
the SAGE III payload because the zone 3
heaters are low-powered heaters in
comparison with the others (6W
nominal).
Although the reduced models were
specifically requested for the scenarios
previously mentioned, it is important for
ISS payloads to be aware that the models
could be used for other analysis cases in
the on-orbit configuration as needed.
Shortly before the SAGE III launch, it
became necessary for the ISS PTCS
team to evaluate the impacts to ELC-4
payloads of a previously unplanned
Extravehicular Activity (EVA) during
which survival power would not be
available. When the analysis results
were presented, they were not
consistent with SAGE III analysis for
the same case. Upon further
investigation, it was discovered that the
reason for the discrepancy was due to a
change that was made to the high-
fidelity IP model that was not also
made to the reduced IP model. This
change (the stow angle for the scan
head of the SA) did not apply to
Dragon or robotic transfer operations,
and as such it was not believed (by
Figure 24: Comparison of High-Fidelity (left) and Reduced Model
(right) Results – Hot Operational Case.

International Conference on Environmental Systems
15
SAGE III or ISS PTCS) to be a necessary adjustment to the reduced model. The lesson from this experience is that
it is important to keep the reduced model in mind, and to stay in good communication with ISS PTCS, throughout
the duration of mission preparation and ops. Working together, the SAGE III and PTCS teams came to agreement
with respect to predicted time-to-limit for the EVA scenario.
V. Analysis Case Definition
Many types of thermal analyses were required to ensure that the SAGE III payload would remain within
acceptable limits during all phases of the mission. Configurations included those with the payload mounted in the
Dragon capsule, on the EOTP during transfer from Dragon to ELC-4, and at the payload’s final location on ELC-4.
Analysis runs were performed to determine the worst-case orbital parameters for this payload and this location on
ISS, standard runs to evaluate the payload thermal behavior during test and in all operational phases, and mapping of
thermal results to a structural model to evaluate thermally-induced stress and deflection.
A summary of all of the flight analysis cases for SAGE III on ISS is provided in Table 10. Those cases shown in
highlighted rows are the only ones which were run routinely when model updates were made; others were performed
for specific requirements and did not need to be repeated throughout the design process. Approximately 90 analysis
cases were run routinely to predict SAGE III temperatures throughout the different phases of the flight mission.
Analysis cases performed in support of ground testing are not included in the table, though extensive pre-test and
post-test analysis was performed for subsystem and system-level TVAC testing. The table also does not include
analysis performed by PTCS for the transfer of SAGE III from Dragon to ELC-4 (to be discussed later in this
section). Also not shown are cases that were run specifically to map thermal results to structural models for
verification of thermal stress requirements. Finally, the table does not include cases that were run to simulate
specific operational scenarios during payload commissioning (initial 3 months after SAGE III is installed on ELC-4
and powered on), which were performed in the months leading up to launch. In these cases, the focus shifted from
attempting to make worst-case predictions to determining a more narrow range of expected temperatures during
initial power on and science event operations.
Table 10: SAGE III on ISS Analysis Cases.
SAGE III
Location
Description Environment Power Number
of Cases
Dragon
Trunk
Solo Cold
Survival Power 6
Unpowered 6
Hot Survival Power 15
Solo, Off-Nominal Flight
Scenarios Cold Survival Power 3
Berthed to ISS Cold
Survival Power 7
Unpowered 7
Hot Survival Power 7
Dragon Trunk Total 51
EOTP
(Transfer
from Dragon
to ELC-4)
DOE Runs for Worst-Case
Environment Definition
ISS Extreme Cold Unpowered 59
ISS Extreme Hot Unpowered 69
SAGE Mission Success Cold Unpowered 77
SAGE Mission Success Hot Unpowered 66
EOTP DOE Total 271
Worst-Case EOTP
ISS Extreme Cold Survival Power 2
Unpowered 2
ISS Extreme Hot Survival Power 1
SAGE Mission Success Cold Survival Power 2
Unpowered 1
SAGE Mission Success Hot Survival Power 1
Worst-Case EOTP Total 9
ROBO Analysis for Time-
To-Limit Nominal
Survival Power 6
Unpowered 7
ROBO Total (SAGE III only, not PTCS) 13

International Conference on Environmental Systems
16
SAGE III
Location
Description Environment Power Number
of Cases
EOTP Total 293
ELC-4
YVV ISS Extreme Cold Survival Power 18
ISS Extreme Hot Survival Power 18
ZVV ISS Extreme Cold Survival Power 14
ISS Extreme Hot Survival Power 14
Plume Impingement ISS Extreme Hot Survival Power 1
Operational Power 1
ELC-4 Off-Nominal Total 66
DOE Runs for Worst-Case
Environment Definition
ISS Extreme Hot Unpowered 76
SAGE Mission Success Hot Unpowered 92
ELC-4 DOE Total 168
ELC-4 Survival
ISS Extreme Cold Survival Power 1
Unpowered 1
ISS Extreme Hot Survival Power 2
SAGE Mission Success Cold Survival Power 2
Unpowered 1
SAGE Mission Success Hot Survival Power 1
SAGE Mission Success Nominal Survival Power 1
Unpowered 1
ELC-4 Survival Total 10
ELC-4 Operational
ISS Extreme Cold Operational Power 1
ISS Extreme Hot Operational Power 1
SAGE Mission Success Cold Operational Power 6
SAGE Mission Success Hot Operational Power 12
SAGE Mission Success Nominal Operational Power 3
ELC-4 Operational Total 23
ELC-4 Total 267
All of the analysis cases required for Dragon solo flight and Dragon berthed to ISS prior to removal of SAGE III
were defined by SpaceX. Spacecraft attitude, initial conditions, and durations were specified in the guidelines
documentation. There were 6 different spacecraft attitudes to assess, each with their own set of assumptions with
respect to hot or cold environments, beta angle, and availability of survival heater power. A total of 48 analysis
cases were required in the standard set of cases, with 3 off-nominal scenarios specific to the SpX-10 mission added
to the list as the launch date approached. A high-level summary is provided in Table 10 and further details cannot
be provided here since the information is considered proprietary by SpaceX. These cases, particularly those for the
Dragon solo portion of the mission, were designed to be conservative and provide information on worst-case time-
to-limit for Dragon payloads. They were not intended to represent expected temperatures and as such, the usual
amount of thermal margin was not applied to these; ±5°C was applied rather than ±15°C which was the typical
margin used in SAGE III analysis cases. SAGE III completed the analysis for each of these cases and provided the
results to ISS PTCS in a report at various intervals, the last of which was late in 2014, approximately one year
before the SAGE III payload was delivered to Kennedy Space Center in November of 2015 in preparation for a
launch in February 2016 (later postponed to February 2017).
In addition to the analyses completed by the SAGE III team, SpaceX used the reduced SAGE III models along
with their high-fidelity Dragon model to produce predictions to support their Mission Resource Allocation
Document (MRAD) cycles. The SAGE III thermal team reviewed these documents and had the opportunity to
provide feedback. In a couple of cases where discrepancies were found, the SAGE III team worked with the SpaceX
thermal engineers to find the root cause and make the necessary adjustments.
Analysis cases on the ISS included hot operational, cold operational, survival (heater power only), and transient
cases with no power which begins from the end of the survival case. The unpowered case was necessary in order to
satisfy an ISS requirement that payloads must survive at least 6 hours without survival heater power; however, the
SAGE III team typically ran these cases out to 24 hours in order to obtain predictions for when limits may begin to
be reached. While mounted on EOTP (after being removed from Dragon, before being installed at ELC-4), the
payloads are moved using the Mobile Servicing System (MSS) which includes the Space Station Remote

International Conference on Environmental Systems
17
Manipulator System (SSRMS), Special Purpose Dexterous Manipulator (SPDM), and the Mobile Base System
(MBS). SAGE III was not operational on the EOTP; therefore, only the survival and 6-hour no-power transient
cases were included for the EOTP location.
Assumptions that are common to all ISS analysis cases are as follows: beginning of life (BOL) optical properties
were used for cold cases and end of life (EOL) properties were used for hot cases, minimum voltage was used to
determine worst-case heater power (except in nominal cases) and nominal voltage was used to define heater duty
cycles used in the Power Equipment List (PEL). Per direction from ISS, radiator wings were parked at specific
angles and the solar arrays were articulating (sun-tracking). Several special cases were also analyzed, including
plume impingement from visiting vehicles, locked solar arrays, and alternate ISS attitudes.
In the analysis performed for configurations following the removal of SAGE III from the Dragon trunk, both
during transfer on the EOTP and during operations on ELC-4, environments were defined based on ISS
requirements. In those requirements, two sets of thermal environments were defined; one set of environments was
used to verify that ISS program requirements are met (i.e. that SAGE III does not damage ISS or its payloads, that
interface temperatures will remain within defined ranges) and one set of environments was used to assure SAGE III
mission success. These are referred to as ISS Extreme and SAGE Mission Success environments, respectively, and
are shown in Table 11. Albedo and Earth infrared (IR) heat flux values are provided for varying orbit times; these
have been implemented as such in the SAGE III system model. Two sets of hot and cold environments, labeled A
and B, were defined in the ISS requirements document. Case A is based on the worst-case Earth IR and case B is
based on the worst-case albedo. After running both sets of cases, it was determined that the SAGE III hardware is
more sensitive to changes in Earth IR and as such, the albedo and Earth IR values from the A cases were used in all
future SAGE III analysis and only those parameters are shown below.
Table 11: Thermal Environments on ISS.
Case Orbit Altitude (km) Solar (W/m2) Albedo* Earth IR* (W/m2)
ISS Extreme Cold 500 1321 0-0.27 153-206
ISS Extreme Hot 278 1423 0.25-0.3 286-349
SAGE Mission Success Hot 460 1321 0-0.27 177-217
SAGE Mission Success Cold 360 1423 0.20-0.27 273-307
SAGE Mission Success Nominal 410 1372 0.27 241
*Implemented as time-varying parameters
The full list of ISS attitudes is shown in Table 12. Since +/- XVV are generally considered symmetric, it was
not necessary to consider –XVV. Although on-orbit data is not generally covered by this report, it is worth noting
that when the ISS transitioned to –XVV with SAGE III installed, temperature fluctuations of approximately 10°C
were observed. An analysis was performed to determine whether or not the model would predict this fluctuation and
the results were very similar to what was observed on-orbit. For +XVV, two sets of yaw, pitch, and roll (YPR)
values are shown. The first is the more extreme range which corresponds to the range used for ISS requirements
verification, while the ranges in parentheses are the more realistic values provided in ISS requirements documents
and as such these were used in the SAGE Mission Success cases. For the XVV cases, analyses were conducted over
a beta angle range of -75° to +75° and over the attitude range shown in Table 12. To determine the worst-case beta
angle and attitude combinations for hot and cold cases, Design of Experiments (DOE) methods were used to conduct
sets of parametric runs for both the ELC-4 and EOTP locations12. A summary of the worst-case beta angle and
attitude combinations that were determined based on the results of the DOE analysis is provided in Table 13. It is
important to note that there were cases where a certain subsystem was found to have a different worst-case
combination of beta angle and attitude than the rest of the payload; these cases were added to the matrix of cases that
were routinely run to evaluate SAGE III payload temperatures, but are not shown in this report for the sake of
simplicity. Additionally, while four locations in the transfer path between Dragon and ELC-4 were analyzed as part
of the EOTP DOE study, locations are not shown here. YVV and ZVV attitudes were only considered for ISS
Extreme cases, not SAGE Mission Success cases. YVV is a temporary attitude (likely less than 24 hours) to be used
infrequently for certain EVA scenarios and is heavily constrained in current flight rules. For YVV, two reduced
case matrices were defined by the ISS PTCS team. For YVV cases with all ISS joints articulating normally, the
reduced matrix includes beta angles of 0, ±30, ±55, ±75. The positive beta angles were analyzed for the +YVV
configuration (YPR of 90°, 0°, 0°) and the negative beta angles were analyzed for the –YVV configuration (YPR of
270°, 0°, 0°). The beta angle of 0° was evaluated for ±YVV. A second matrix of YVV cases was required with the
Solar Array Rotary Joints (SARJs) locked: in +YVV, port and starboard SARJs are locked at 0 for beta angles of 0

International Conference on Environmental Systems
18
and -30, and locked at 270 and 90 respectively for beta angles of -30, -60 and -75. ZVV is a potential short-term
attitude only for vehicle docking/undocking. The reduced matrix of ZVV cases was ZVV orientation (ISS pitch
90°), beta angles 0, ±30, ±60, ±75°, with port and starboard Thermal Radiator Rotary Joints (TRRJs) locked at 90°,
port SARJs locked at 270° and starboard SARJs locked at 90°.
Table 12: Full ISS Attitude Matrix.
ISS Attitude Name Solar Beta
Range () Yaw Pitch Roll Time in Attitude
+XVV +Z Nadir -75≤ ≤ +75 -15to +15
(-9° to +3°)
-20to +15
(-12° to -2°)
-15to +15
(+0.5° to +1°) No Limit
-XVV +Z Nadir -75≤ ≤ +75 +165to +195 -20to +15 -15to +15 No Limit
+YVV +Z Nadir -75≤ ≤ +10 -110to -80 -20to +15 -15to +15 No Limit
-YVV +Z Nadir -10≤ ≤ +75 +75to +105 -20to +15 -15to +15 No Limit
+ZVV –X Nadir -75≤ ≤ +75 -15to +15 +75to +105 -15to +15 3 Hours
-ZVV –X Nadir -75≤ ≤ +75 +165to +195 +75to +105 -15to +15 3 Hours
Table 13: Worst-Case Orbital Parameters Determined by DOE Analysis.
EOTP ELC-4
Parameter
ISS
Extreme
Cold
ISS
Extreme
Hot
SAGE
Mission
Success
Cold
SAGE
Mission
Success
Hot
ISS
Extreme
Cold
ISS
Extreme
Hot
SAGE
Mission
Success
Cold
SAGE
Mission
Success
Hot
Beta Angle -75° +75° -3.3° +75° -75° 75° -58.9° 47.5°
Yaw -15° 15° -5.8° -8.3° -15° -15° -8.4° -8.4°
Pitch +15° -20° -12° -12° +15° +15° -2° -3.7°
Roll -15° 15° +0.5° +0.7° +15° +15° +0.6° +0.5°
The approach to defining the analysis cases to determine SAGE III temperature predictions for the transfer from
Dragon to ELC-4 on the EOTP evolved over time. For all of the analyses that were run prior to final model
correlation, the SAGE III team defined the cases by performing a set of parametric runs in order to determine the
worst-case hot and cold locations as well as beta angle/attitude combinations for the SAGE III payload while it is
mounted on the EOTP. Four EOTP locations were defined in the model, with assistance from ISS PTCS, to
represent specific times in the transfer timeline. These included just outside of the Dragon trunk, just prior to mating
the IP to the NVP at ELC-4, and two Mobile Translator (MT) worksite locations in between. The worst-case
locations and environments were defined using the DOE approach previously mentioned12. Once the worst-case
locations and environments were defined, survival and unpowered runs were completed at only the worst-cast hot
and cold locations, to determine the bounding predictions.
As launch approached, it became necessary to refine the analysis. Along with assistance from the robotic
operations (ROBO) and PTCS teams at JSC, a set of cases was defined which gave a more accurate representation
of discrete points along the transfer and installation timeline, and nominal environments were used in lieu of worst-
case environments so that realistic thermal clocks could be defined. The SAGE III payload transfer from Dragon to
ELC-4 occurs over a period of 5 days. Analyses were run at 6 locations at 3 beta angles (defined based on expected
launch window). Each case was initiated from the end of the previous case, so that time-to-limit and required warm-
up time could be determined for each scenario. These results were delivered to ISS PTCS in April 2016, with an
expected launch date of November 2016. The ISS PTCS team performed an independent analysis using the detailed
ISS model and reduced SAGE payload models. This analysis included 9 locations at 7 beta angles. The results of
this analysis were used to determine thermal clocks that would be used during transfer operations, since the work
completed by PTCS was more detailed than the work completed by SAGE III. The SAGE III thermal team worked
informally with PTCS to compare results and confirm that there was good agreement, as well as to come to
agreement on the margin approach and finalized thermal clocks. Note that the primary responsibility for this
analysis resides with the PTCS team. In many cases, project thermal analysts are no longer assigned to the project
by the time the details of the robotic transfer become clear. In this situation, it is critical for the project thermal
International Conference on Environmental Systems
19
analysts to communicate with the PTCS team prior to departing the project to convey any concerns they may have
(such as requests for additional margin or concerns about a particular component).
For the operational cases once SAGE III is mounted to the ELC-4, multiple cases were defined in order to
capture different operational scenarios for SAGE III; specifically, in order to bound the worst-case temperature
predictions, hot cases were defined with the maximum number and expected duration of each science event (solar,
lunar, and limb) and cold cases were defined with the minimum number and duration.
VI. Conclusion
This paper has presented details related to the design and analysis of the SAGE III on ISS payload, with the
intention of providing future ISS payloads with relevant information to support early thermal design and analysis
planning efforts. ISS requirements and constraints were taken into account throughout the design process. A
detailed thermal model was developed that provided capability to perform analyses for all ground and on-orbit
configurations within a single model. A reduced thermal model was created for inclusion in detailed Dragon and
ISS thermal models so that SpaceX and the JSC/Boeing PTCS team could perform independent analyses for mission
planning purposes. A large number of analyses cases were required to determine the worst-case environments for
each phase of the SAGE III on ISS mission, to ensure that the payload would remain within acceptable thermal
limits, to verify ISS requirements, to prepare for and correlate to ground testing, and to predict expected
temperatures during the early operations phase of the mission.
Acknowledgments
The authors would like to acknowledge Steven Tobin (NASA LaRC), Shawn McLeod (Analytical Mechanics
Associates), Kim Martin (Northrup Grumman), Sergio Mannu (Thales Alenia Space – Italy), Corrado Guglielmo
(Thales Alenia Space – Italy), and Salvatore Scola (NASA LaRC) for their contributions to the development of the
SAGE III thermal model and definition of SAGE III thermal hardware. The authors would also like to thank Caryn
Preston (The Boeing Company) and Miranda Singleton (The Boeing Company) for their support with incorporating
the SAGE III models with the ISS models and for working closely with the SAGE III team to complete a robust
analysis for the robotic transfer from Dragon to ELC-4.
References 1Liles, K.A., Amundsen, R.M., Davis, W.T., et al “Development and Implementation of Efficiency-Improving Analysis
Methods for the SAGE III on ISS Thermal Model,” Thermal and Fluids Analysis Workshop, Daytona Beach, FL, 2013. 2Liles, K.A., Amundsen, R.M., Davis, W.T., McLeod, S., “Thermal Modeling Method Improvements for SAGE III on ISS,”
Thermal and Fluids Analysis Workshop, Silver Spring, MD, 2015. 3King, T, “GSFC Procurement Specification for Thermofoil Heaters Rev E,” GSFC-S-311-P-079, 1996. 4Tayco Engineering, Inc., “Flexible Kapton Heater Specification,” www.taycoeng.com. 5Clatterbuck, C., “Adhesive Bonding Kapton Thermofoil Heaters to Substrate Surfaces Rev A”, S-313-022, 1993. 6Liles, K.A., “Summary of Guidance on Heater Watt Density and Plans for Mitigating Risk,” NASA Passive Thermal
Technical Discipline Team Website, SAGE III-THM-040 V3, 2016 (unpublished). 7Sheldahl, “Application and Handling of Thermal Control Materials,” www.sheldahl.com. 8Davis, W.T., Liles, K.A., and Martin, K., “SAGE III Lessons Learned on Thermal Interface Design,” Thermal and Fluids
Analysis Workshop, Silver Spring, MD, 2015. 9Carrillo, L., Farner, D., Preston, C., “NASA-TFAWS Short Course on ISS Payload Thermal Environments,” Thermal and
Fluids Analysis Workshop, Silver Spring, MD, 2015. 10Amundsen, R.M., Davis, W.T., Liles, K.A., “Correlation of the SAGE III on ISS Thermal Models in Thermal Desktop,”
International Conference on Environmental Systems, ICES-2017-171, Charleston, SC, 2017. 11Gilmore, D., Spacecraft Thermal Control Handbook Volume 1: Fundamental Technologies, 2nd ed., The Aerospace Press,
El Segundo, CA, 2002, Appendix A. 12Moeller, T.M., Wilhite, A.W., Liles, K.A., “Selection of Thermal Worst-Case Orbits via Modified Efficient Global
Optimization,” NASA/TM-2014-218182, 2014.