Embed Size (px)
Citation preview

THERMAL DENATURATION OF TOBACCO MOSAIC VIRUS
BY MAX A. LAUFFER AND W. C. PRICE
(From the Department of Animal and Plant Pathology of The Rockefeller Institute for Medical Research, Princeton)
(Received for publication, November 29, 1939)
In recent studies (6, 7), the thermal inactivation of unpurified tobacco mosaic virus was shown to follow the course of a first order reaction. However, dilution of the plant juice containing the virus was found to result in an increase in the reaction rate. Moreover, the thermal inactivation point of this unpurified virus was observed to be between 90” and 93”, in contrast with the ther- mal inactivation point of about 75” reported for the purified virus by Stanley and Loring (9). In view of these observations, it was thought desirable to study the kinetics of the heat dena- turation of purified virus under relatively well controlled con- ditions in order to learn whether or not there is any relationship between the inactivation and denaturation phenomena and to fmd, if possible, explanations of some of the observations just mentioned.
EXPERIMENTAL
Discussion of Experimental Method-Most of the experiments reported were carried out on an old sample of virus purified by ammonium sulfate precipitation (8). In two experiments, a fresh sample of virus purified by differential centrifugation (11) was used. Except when otherwise designated, a few ml. of a cold concentrated solution of virus dissolved in 0.1 M phosphate buffer were added to at least 3 times their volume of hot 0.1 M
phosphate buffer solution at the same pH value in a large test- tube immersed in a water bath held at the desired temperature, hO.2”. The virus solution in the bath was stirred constantly by mechanical means. The stirring and the adding of the virus to hot buffer were resorted to in order to reduce the time required
1
by guest on Decem
ber 5, 2018http://w
ww
.jbc.org/D
ownloaded from

2 Virus Denaturat,ion
by the virus to reach the temperature of the bath. Samples were withdrawn from the tube periodically by means of a pipette and were immedia.tcly cooled by immersing in ice water. In a few tests, the virus was heated without agitation in a number of small tightfly stoppered test-tubes immersed in the water bath or stored in oil baths in constant temperature ovens. Periodically one tube from each batch was cooled as described above. Under the condit)ions obt’aining in this study, the denatured virus pre- cipitates, even before cooling, in moderately large amorphous particles. This material was separated from the remaining sol- uble protein by spinning for a few minutes in a laboratory cen- trifugc. The concentration of the soluble material was then determined by the micro-Kjeldahl meth0d.l
In addition to the errors inherent in the micro-Kjeldahl method, several limitations are encountered in determinations of this sort. A brief period is required for the virus in hot buffer to attain the temperature of the bath. Vigorous stirring of both the reacting solution and the bath tends to decrease this lag. Its effect be- comes negligible if the first sample is withdrawn after the equilib- rium temperature has been reached and if the initial virus concen- tration is ignored in calculations of the rate of the reaction. A second source of error is a consequence of the relatively high tem- perature coefficient of the denaturation reaction. Minor fluc- tuations in temperature may result in appreciable error. At the higher temperatures, the reaction proceeds so rapidly that samples must bc taken at time intervals only slightly longer than the time required for the sampling process. Obviously, serious errors may result in this case. A third error should be expected in light of t,he finding of Bawden and Pirie (1) and of Stanley and Loring (9) that nucleic acid is split off from the virus upon heat denatura- tion.
Under the conditions of denaturation obtaining in this study it was found that essentially all of the carbohydrate, as measured by the orcinol method, remains soluble upon denaturation of about 90 per cent of the virus. From this observation it may be in- ferred that all or most of the nucleic acid of the denatured virus has remained in the supernatant liquid. The Kjeldahl method
1 The authors wish to acknowledge the assistance of Mr. Martin Hanig, who performed the analyses reported in this paper.
by guest on Decem
ber 5, 2018http://w
ww
.jbc.org/D
ownloaded from

M. A. Lauffer and IV. C. Price 3
should be expected, therefore, to give values for the protein con- centration of the supernatant liquid which are somewhat too high. The error should progress from 0 at the beginning of the denaturation to the order of 50 per cent when the reaction has reached 90 per cent completion. It is possible to correct t.he experimental data by using the following equation, C = (Cl-Go,)/ (1 - b), where C is the actual concentration of virus protein in the supernatant liquid, Cl is the measured protein concen- tration, Co is the initial concentration of the virus, and b is the fraction of the total nitrogen of the virus present in the nucleic acid. In the experiments here reported, Co has an approximate value of 6 mg. per ml. in most cases, and 3 mg. per ml. in the remaining cases. According to Loring (4), tobacco mosaic virus contains about 5.2 per cent nucleic acid which has a nitrogen content of about 15.1 per cent. The factor b then becomes (5.2 X 15.1)/(100 X 16.6) = 0.047. Although it can be shown mathematically t.hat, if the reactions are allowed to proceed only to about 80 per cent of completion, no serious error can result in t’he estimates of the reaction velocity constants due to the nucleic acid accumulation, the error does make it more difficult to decide upon the order of the reaction. Especially for this latter reason, the data reported in this paper are all corrected by means of the equation described above.
Presentation of Data-The results of eighteen denaturation ex- periments on purified tobacco mosaic virus carried out as described previously arc summarized in Table I. All experiments were done with old, chemically purified viruses, except Experiments 17 and 18, in which ultracentrifugally isolated material was used. In Experiments 8, 11, and 16, the virus was heated without agita- tion in stoppered tubes instead of in the open tube with stirring. The initial concentrations of virus in t’he reacting solutions were about 6 mg. per ml. in most experiments and about, 3 mg. per ml. in the others. The former are designated as init*ial dilutions of 1: 1 and the latter as 1: 2 in Table I. The pH values reported were measured at room temperature by means of a glass electrode on solutions prepared in the same manner from the same stock solutions as those being heated. The k values reported were calculated from the slopes of t’he straight lines best fitting the data when the natural logarithms of the corrected concentrations
by guest on Decem
ber 5, 2018http://w
ww
.jbc.org/D
ownloaded from

4 Virus Denaturation
TABLE I
Heat Denaturation of Tobacco Mosaic Virus under Various Conditions
Experi- ment
No.
’
1
_-
rem- pera- ture
1
“C.
67
2 60
3
4
5
6
71
73
73
74
-
nitial dill+ tion
I
-
1:l
1:l
1:l
1:
1:l
I:1
- -
I
t:
1
-
7.05
7.05
7.05
7.05
7.05
7.05
Time
min.
10
20 32 40 50 60 70 80 15 30 45 60 75 90
3 6 9
12 15 18 21 24
3 6 9
12 1
2 3 4 5 6 8 2 4 6 8
~oncentrstion of soluble
protein
Mea5
ma. ,er ml.
6.24 6.04 5.74 5.45 5.35 5.14 4.88 4.72 5.23 4.52 3.95 3.51 3.14 2.83 5.74 4.72 4.37 3.76 3.43 2.87 2.50 2.31 4.44 2.63 1.59 0.98 5.80 5.20 4.05 3.82 3.55 2.80 1.86 1;.66 2.97 1.86 0.94
-
-
7ng. ler ml.
6.24 6.04 5.73 5.42 5.32 5.10 4.82 4.66 5.19 4.45 3.74 3.39 3.00 2.68 5.74 4.66 4.29 3.65 3.30 2.72 2.33 2.13 4.37 2.46 1.37 0.73 5.78 5.16 3.96 3.72 3.43 2.64 1.66 1.60 Z.82 1.66 1.69
k (first order)
min.-’
0.00424 f 0.00015
0.00874 rk 0.00013
0.0472 rt 0.0016
0.198 f 0.003
0.171 f 0.001
0.311
by guest on Decem
ber 5, 2018http://w
ww
.jbc.org/D
ownloaded from

hf. A. Lauffer and W. C. Price 5
Experi- ment NO.
Tem- pera- ture
60
79
1:l
1:2
1:2
1:2
1:2
I:2
1:1
1:1
TABLE I-Continued
,H at POOrn ?mper ature
.-
7.05
7.05
7.05
7.05
6.10
6.10
Time
min.
1
2 3
460 1,440 1,880 2,860 5,750 8,600
5 20 35 50 65
3 6 9
12 15 18 21
0 7
14 21
2 3 4 5 6
10 20 30
6 9
12 15 18 21 -
Concentration of soluble
protein
ml. m ml
5.06 2.63 1.15 2.72 2.48 2.60 2.41 1.97 1.69 2.70 2.02 1.52 0.67 0.47 2.46 1.86 1.11 1.18 0.84 0.88 0.51 3.16 1.75 1.01 0.62 2.19 1.52 1.32 0.84 0.64 5.20 3.62 1.15 4.99 4.55 3.64 2.87 1.48 1.08
COP rected
,,“:1.
5.02 2.47 0.91 2.70 2.46 2.58 2.38 1.92 1.63 2.68 1.97 1.45 0.56 0.35 2.43 1.80 1.02 1.09 0.73 0.78 0.39 3.17 1.69 0.91 0.50 2.15 1.45 1.24 0.73 0.52 5.16 3.50 0.91 4.98 4.48 3.52 2.72 1.26 0.84
k (first order)
min.-l
0.855
:6.31 f 0.43) x 10-S
0.0354 + 0.0045
0.0894 * 0.0120
0.0880
0.352 f 0.020
0.087
0.121 f 0.018
by guest on Decem
ber 5, 2018http://w
ww
.jbc.org/D
ownloaded from

Virus Denaturation
TABLE I-Concluded
6
Experi- ment No.
16
16"
17t
1st
Tern- PWZL- ture
“C.
81
71
69
I nitial dilu- tion
1:l
1:l
1:1
1:l
pH at rOOm smper. ature
6.10
5.77
7.05
7.05
Time
min.
3 6 9
12 5,320
22,600 44,200 68,680 90,280
10 75
1 7
Concentration of soluble
protein
CC+ rected
m!l. pa ml.
ml. 1 ,er ml.
4.89 4.84 3.34 3.26 1.92 1.72 1.18 0.94 5.70 5.68 3.54 3.42 3.37 3.24 2.70 2.54 1.75 1.54 5.52 5.50 2.46 2.28 5.77 5.75 1.92 1.72
6 (first order)
min.-l
0.184
(1.33 f 0.22) x 10-b
0.0135
0.201
* Stoppered tubes, no stirring. t Ultracentrifugally isolated virus.
of undenatured virus were plotted against the time of the reaction. They are, therefore, first order reaction velocity constants ex- pressed in units of reciprocal minutes. The justification for calculating first order constants will be considered presently.
Order of Reaction-As was shown by Chick and Martin (2), the heat denaturation reactions of hemoglobin and egg albumin are of the first order. The results of Wu and Ling (lo), on the other hand, indicate that the surface denaturation reactions of methemoglobin and egg albumin are of the zero order. A reac- tion of this latter type progresses at a constant rate irrespective of the concentration of the reacting material, and it can be de- scribed by the simple differential equation, -dC/dt = Ice. C is the concentration of the undenatured material, t is the time, and k is the velocity constant. If the rate of the denaturation at any given instant is directly proportional to the concentration of the reactant at that instant, the reaction is of the first order and may be described by the equation, -dC/dt = klC. If two protein particles must come together and react before they can denature,
by guest on Decem
ber 5, 2018http://w
ww
.jbc.org/D
ownloaded from

ht. A. Lauffer and W. C. Price 7
the process is a second order reaction which can be described by the equation -dC/dt = lczC2. If three particles must come to- gether simultaneously before denaturation can occur, the reac- tion is of the third order and may be described by the equation, -dC/dt = kQ. When these four equations are integrated, they may be written as follows: zero order, C = C,, - k,$; first order, log, C = log, CO - ikIt; second order, l/C = l/Co + h$; third order, l/C2 = l/Co2 + 2kst. In these equations, CO is the initial concentration and t is the time interval from the beginning of the reaction. In each of the above equations, some
2.0 ,p .___
/ \d73"Expt. 5
0 IL0 40 60 Time in minutes
80
FIG. 1. Curves illustrating denaturation rates at several different tem- peratures of purified tobacco mosaic virus in 0.1 M phosphate buffer. (Initial concentrations about 6 mg. per ml., pH 7.05.)
function of the concentration is linearly related to the time, and the slope of the line in each case is a simple multiple of the velocity constant.
It may be seen in Fig. 1 that when log, C is plotted against t for the denaturation of the virus at several temperatures, the data fit straight lines fairly closely, indicating that heat denaturation of the virus may follow the course of a first order reaction. How- ever, inasmuch as there is considerable error in each experimental point, it is also possible to fit straight lines to the data when either C or l/C is plotted against t. The data allow no doubt
by guest on Decem
ber 5, 2018http://w
ww
.jbc.org/D
ownloaded from

8 Virus Denaturation
that l/C2 is not a linear function of t. Although simple inspec- tion reveals t,hat the fit is usually best when log, C is plotted against t, the data have been treated statistically in order that the conclusion concerning the order of the reaction may be as sound as the data permit. Iior all the experiments reported in Table I in which more than four experimental points have been recorded, the best fitting straight lines were determined by the method of least squares for the cases in which C, log, C, and l/C are con- sidered as functions of t. The standard error of estimate was then calculated for each line according to the following equation, standard error = (2 (Y - Y’)2)/((N - 2) B (2 - X)z), when Y
TABLE II
Comparison of Errors Involved in Fitting Denaturation Data to Zero, First, and Second Order Equations
Experiment No.
1 2 3 5 8 9
10 12 14 16
-
0 order 1st order 2nd order
26.26 10.65 14.52 13.01 12.68 11.12
5.55 8.60
13.66 4.39
29.06 21.29 29.75 12.50 14.63 7.94 7.45
12.24 6.89 6.02
-
26.35 42.23 16.19
6.34 14.60
4.40 4.57 6.15 4.25 4.63
7 value
is the calculated value of 6, log, C, or l/C as the case may be, Y’ is the observed value, N is the number of observations, X is the mean time, and X is the observed time. The slopes of the lines divided by their standard errors are summarized in Table II. The greater the magnitude of this statistic, designated here as 7 value, the better is the fit of the data to the straight line in ques- tion. It may be seen in Table II that in seven of the ten experi- ments thus analyzed the data favor first order over zero order equations and in nine of the ten cases first order over second order equations. Since there is no good reason to believe that the order of the reaction should be different at one temperature from that at another, the data taken as a whole make it appear probable
by guest on Decem
ber 5, 2018http://w
ww
.jbc.org/D
ownloaded from

M. A. Lauffer and W. C. Price 9
that the denaturation of the virus is a reaction of the first order. This probability is enhanced by the fact that there can be no doubt that the thermal inactivation of the virus is a reaction of the first order (7). However, an experiment subjected to more precise control was designed specifically to yield further information on this question.
The general plan of the experiment parallels that described previously, but it differs from that of the others in that a larger volume of protein was used and many more precautions were exercised than would have been practical for any considerable number of tests. The temperature was held at 69.8” YIC 0.045”, with fluctuations completing one cycle every 40 seconds. Evapo- ration from the reacting tube was prevented by placing a layer of melted paraffin over the surface of the hot material. 5 ml. samples were withdrawn every 14 minutes for the first 196 min- utes, and a final sample was taken after 250 minutes. A long stainless steel tube, which was allowed to remain in the reacting system, and a 5 ml. hypodermic syringe were used for the sampling. The reaction, in this case, was allowed to proceed to 97 per cent completion, greatly increasing the sensitivity of the test for the order of the reaction. This was made possible by completely eliminating the error due to nucleic acid accumulation in the super- natant liquid. Instead of analyzing the supernatant liquids directly after the denatured protein was removed, we denatured aliquots of them to completion by heating for 4 hour at loo”, and the flocculated protein, separated by centrifugation and fil- tration, was measured by the micro-Kjeldahl method. This procedure allows one to detect the amount of soluble protein capable of becoming insoluble upon heating, which is, of course, exactly what is wanted. The results of this experiment are shown in Table III. In Fig. 2, log, of the concentration of coagulable soluble protein is plotted against time. It is evident that the reaction may be described by the first order equation. According to the method of analysis of the data used in the less sensitive experiments, 7 values for zero, first, and second order equations of 12.7, 68.6, and 7.6, respectively, were obtained. This result is overwhelmingly in favor of the reaction being of the first order.
Degree of Reproducibility--The degree of reproducibility of the
by guest on Decem
ber 5, 2018http://w
ww
.jbc.org/D
ownloaded from

10 Virus Denaturation
TABLE III
Heat Denaturation of Tobacco Mosaic Virus (6 Mg. per Ml.) in 0.1 M
Phosphate Buffer at pH 7 and 69.8’
Time
min.
0
14
28
42
56
70 84
98
Concentration of soluble, coagulable
protein
mg. per ml.
5.91 5.96 4.20 4.37 3.34 3.29 2.84 2.89 2.42 2.42 2.05 1.65 1.70 1.38 1.38
Time
min.
112
126
140
154
168
182
196
250
I -
Concentration of soluble, eoagulable
protein
mg. per ml.
1.13 1.16 0.84 0.91 0.76 0.81 0.69 0.66 0.51 0.55 0.43 0.45 0.40 0.38 0.14 0.13
-21 I I I I I I I I I 0 50 100 150 200 2
Time in minutes
FIG. 2. Data of Table III plotted according to a first order equation
by guest on Decem
ber 5, 2018http://w
ww
.jbc.org/D
ownloaded from

M. A. Lauffer and W. C. Price 11
rate of denaturation of a given virus preparation may be estimated by comparing the velocity constants 2.0 X 10-l and 1.7 X 10-l calculated for Experiments 4 and 5 (Table I) on chemically iso- lated material at 73” and pH 7.05. The extent to which the denaturation rates are independent of the methods of virus prep- aration may be judged by comparison of the k value of Experi- ment 17 (13.5 X 1OP at 69O) with that of Experiment 2 (8.7 X 1O-3 at 69”) and by comparing the k value of Experiment 18 (2.0 X 10-l at 73”) with those of Experiments 4 and 5 (2.0 and 1.7 X lo-‘, respectively, at 73”). Experiments 17 and 18 were conducted with recently ultracentrifugally isolated material, and Experiments 2, 4, and 5 with old, chemically purified virus. Evidently the rate of heat denaturation is not influenced by the differences between chemically and ultracentrifugally purified virus, which are reflected by the higher degree of aggregation and the lower specific infectivity of the former (5). The effect of stirring the reacting material may be seen by comparing the k value 8.9 X 1O-2 of Experiment 10, carried out in the usual way, with the value 8.8 X 10e2 of Experiment 11 in which the virus was denatured without being stirred in several small stoppered test-tubes. A true picture of the reproducibility of this dena- turation may be gained by examining the points, corresponding to the experiments mentioned above, lying near the lower curve of Fig. 3. The dimensions of the points on this curve are fair es- timates of the error inherent in each determination. From all of these comparisons it may be concluded that the rate of de- naturation of the virus is a reproducible property of the material.
Temperature Coeficient-Arrhenius proposed the equation cl log, k/dT = E/RT2, where T is the absolute temperature, E is a constant usually identified as the energy of activation, and R is the gas constant. This equation may be integrated and expressed in the form, log, k = constant - (E/RT). By plotting log, lc against l/T one should obtain a straight line of slope -E/R. It may be seen in Fig. 3 that when the logarithms of the k values obtained at pH 7.05 are plotted against l/T the points group fairly nicely about two straight lines with essentially equal slopes. The upper line is drawn to fit the data for systems whose initial concentrations were about 3 mg. per ml. and the lower curve is drawn to fit data for systems whose initial concentrations were
by guest on Decem
ber 5, 2018http://w
ww
.jbc.org/D
ownloaded from

12 Virus Denaturation
about 6 mg. per ml. The slope of these curves, -E/R, is equal to about -7.65 X 10⁴, and from this it may be estimated that E, the energy of activation, is about 153,000 calories per mole. This value is of the order of magnitude frequently encountered in protein denaturations.
Effect of Dilution-By comparing the k value reported in Table I obtained from Experiment 9 with those obtained from Experi- ments 2 and 17, those of Experiments 10 and 11 with that of Ex- periment 3, and that of Experiment 12 with those of Experiments
2.86 2.90 2.94 2.98 3 l/T x 103
2
FIG. 3. Curves obtained when the velocity constants of the denatura- tion of tobacco mosaic virus at pH 7.05 are plotted as functions of absolute temperature according to the Arrhenius equation: upper curve for systems with initial virus concentration of about 3 mg. per ml.; lower curve for systems with initial virus concentration of about 6 mg. per ml. The numbers near the points on the curves represent experiment numbers cor- responding to those recorded in Table I.
4, 5, and 18, it may be seen that virus solutions in which the initial concentration was about 6 mg. per ml. denature approximately half as fast as those in which the initial virus concentration was about 3 mg. per ml. By examination of Fig. 3 it may be seen that the straight line fitted by the method of least squares to the data for the dilute solutions is displaced from the one fitted to the data for the concentrated solutions by approximately log, 2. This in- crease in reaction rate upon dilution parallels the similar finding for the case of unpurified virus (7). As may be seen in Fig. 2 of the paper referred to, a 1:20 dilution with water of the plant
by guest on Decem
ber 5, 2018http://w
ww
.jbc.org/D
ownloaded from

M. A. Lauffer and W. C. Price
juice containing virus resulted in approximately a 20-fold increase in the rate of inactivation. Since there is a possibility that slight changes in pH accompanied the dilution in this latter case, it is impossible to say just how much of the observed increase in ve- locity is actually the effect of lowering the virus concentration. This uncertainty, however, does not obt.ain in the case of the purified virus. A possible explanation of the inverse relationship between initial virus concentration and reaction rate is that some grouping within the virus is acting as a negative catalyst or an inhibitor for the denaturation.2
E$ect of Changing the pH-An examination of Experiments 13, 14, and 15 (Table I) reveals that at pH 6.10 denaturation takes place at a rate comparable to that at pH 7.05 only when the temperature is 7” or 8’ higher. A comparison of Experiment 16 carried out at pH 5.77 at 71” with Experiment 3 carried out at pH 7.05 at 71” shows that there is a 3500-fold increase in the rate of denaturation at the higher pH over that at the lower one. It would appear that the reaction rate varies inversely with some- thing like the third power of the hydrogen ion concentratioq3 being greater in more alkaline and less in more acid solutions. In this respect, the virus differs from those proteins which show a minimum rate of denaturation at the neutral point. As was pointed out previously, the thermal inactivation point of purified virus is about 75”, whereas that of the unpurified material in plant juice is between 90” and 93”. The acidity of expressed plant juice is generally about pH 5.5 and the studies on purified virus were carried out at acidities near pH 7 (1, 9). In view of the findings of the present study, these facts alone could account
* This effect of dilution may also be considered in terms of the concepts of absolute reaction velocities (see La Mer (3)). It may be calculated that the entropy of activation in initially dilute virus solutions is greater than in initially more concentrated solutions. Taking into account such fac- tors as ionization would not change the magnitude of the difference in entropies of activation. However, the physical significance of this differ- ence and its relationship to initial virus concentration may be, at best, but vaguely understood.
3 This result would indicate that a dissociation of protons is one of the stages of the activation process, in keeping with the considerations of Steinhardt (see La Mer (3)). However, the experiments here reported were not designed to yield critical information on this issue, and no quan- titative interpretation is warranted.
by guest on Decem
ber 5, 2018http://w
ww
.jbc.org/D
ownloaded from
14 Virus Denaturation
for at least a great part of the difference in stability between purified virus and virus in plant juice.
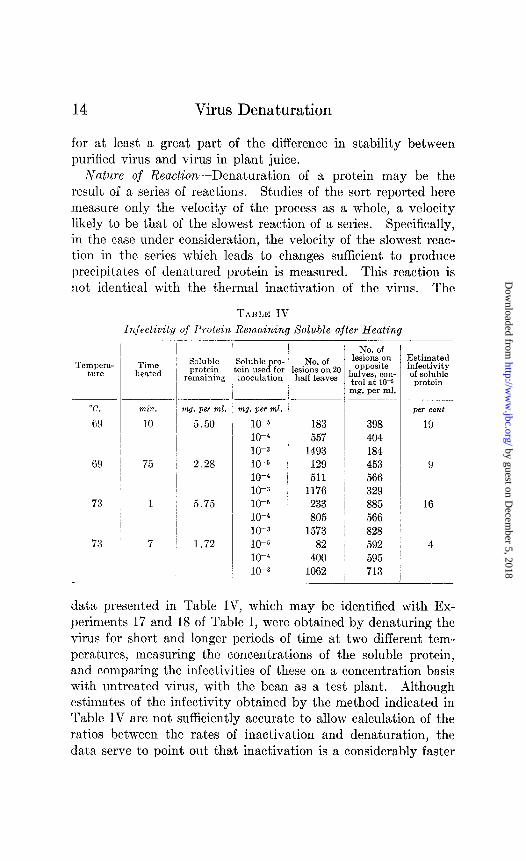
Nature of Reaction-Denaturation of a protein may be the result of a series of reactions. Studies of the sort reported here measure only the velocity of the process as a whole, a velocity likely to be that of the slowest reaction of a series. Specifically, in the case under consideration, the velocity of the slowest reac- tion in the series which leads to changes sufficient to produce precipitates of denatured protein is measured. This reaction is not identical with the thermal inactivation of the virus. The
TABLE IV
Infectivity of Protein Remaining Soluble after Heating
“C.
69
69
73
73
Time heated
min.
10
75
1
7
Soluble protein
remaining
ql. per ml.
5.50
2.28
5.75
1.72
‘1Lg. per ml.
10-S 10-d 10-3 10-5 10-d 10-S 10-b 10-4 10-a 10-S 10-k 10-z
. 1 No. of
lesions on 2( half leaves
183 398 557 404
1493 184 129 453 511 566
1176 329 233 885 805 566
1573 828 82 592
400 595 1062 713
’ 1
I
No. of lesions on opposite
1alves, con- trol at 10’ ng. per ml. II-
Estimated infectivity of soluble protein
per cent
19
9
16
4
data presented in Table IV, which may be identified with Ex- periments 17 and 18 of Table I, were obtained by denaturing the virus for short and longer periods of time at two different tem- peratures, measuring the concentrations of the soluble protein, and comparing the infectivities of these on a concentration basis with untreated virus, with the bean as a test plant. Although estimates of the infectivity obtained by the method indicated in Table IV are not sufficiently accurate to allow calculation of the ratios between the rates of inactivation and denaturation, the data serve to point out that inactivation is a considerably faster
by guest on Decem
ber 5, 2018http://w
ww
.jbc.org/D
ownloaded from
M. A. Lauffer and W. C. Price 15
process than denaturation measured by precipitation. In all likelihood, inactivation of the virus is one of the earlier reactions in a series which finally leads to denaturation. It apparently is not the reaction of limiting velocity. The energy of activation calculated for the denaturation is of the same order of magnitude as that calculated for the thermal inactivation at the higher tem- peratures (7), indicating that the inactivation is probably due to a reaction similar Do that which controls the denaturation rate.
SUMMARY
The thermal denaturation of tobacco mosaic virus was found to be a readily reproducible phenomenon and was shown to be a reaction of the first order. The energy of activation of the reac- tion in 0.1 M phosphate buffer at pH 7 was calculated to be about 153,000 calories per mole. The rate of the reaction at a given temperature was found to be strongly influenced by changes in hydrogen ion concentration, the reaction progressing more rapidly in more alkaline and less rapidly in more acidic solutions. The reaction rate was found to vary inversely with the initial concen- tration of virus, being approximately twice as great in systems with an initial concentration of 3 mg. per ml. as in solutions with an init,ial concentration of 6 mg. per ml. Thermal inactivation of virus was found to proceed more rapidly than thermal denatura- Con measured by precipitation.
BIBLIOGRAPHY
1. Bawden, F. C., and Pirie, N. W., Proc. Roy. Sot. London, Series B, 123, 274 (1937).
2. Chick, H., and Martin, C. G., J. Physiol., 43, 1 (1911). 3. La Mer, V. K., Science, 86, 614 (1937). 4. Loring, H. S., J. Biol. Chem., 130, 251 (1939). 5. Loring, H. S., Lauffer, M. A., and Stanley, W. M., N&we, 142, 841
(1938). 6. Price, W. C., Phytopathology, 23, 749 (1933); 29, 20 (1939). 7. Price, W. C., Arch. ges. Virusforsch., in press (1940). 8. Stanley, W. M., J. Biol. Chem., 116, 673 (1936). 9. Stanley, W. M., and Loring, H. S., in Cold Spring Harbor symposia
on quantitative biology, Cold Spring Harbor, 6, 341 (1938). 10. Wu, H., and Ling, S. M., Chinese J. Physiol., 1, 407 (1927). 11. Wyckoff, R. W. G., Biscoe, J., and Stanley, W. M., J. BioZ. Chem.,
117, 57 (1937).
by guest on Decem
ber 5, 2018http://w
ww
.jbc.org/D
ownloaded from
Max A. Lauffer and W. C. PriceTOBACCO MOSAIC VIRUS
THERMAL DENATURATION OF
1940, 133:1-15.J. Biol. Chem.
http://www.jbc.org/content/133/1/1.citation
Access the most updated version of this article at
Alerts:
When a correction for this article is posted•
When this article is cited•
alerts to choose from all of JBC's e-mailClick here
#ref-list-1
http://www.jbc.org/content/133/1/1.citation.full.htmlaccessed free atThis article cites 0 references, 0 of which can be
by guest on Decem
ber 5, 2018http://w
ww
.jbc.org/D
ownloaded from