Embed Size (px)
Citation preview

THERMAL CYCLING OF THIN-FILM CADMIUM SULFIDE SOLAR CELLS
. . I 1 .
by Adolph E. Spukowski undJohn G. Ewushinku i!. . , , \ , \,
Lewis Reseurch Center Cleveland, Ohio
_I.
N A T I O N A L AERONAUTICS AND SPACE A D M I N I S T R A T I O N WASHINGTON, D. C. OCTOBER 1966
https://ntrs.nasa.gov/search.jsp?R=19660028384 2018-08-30T13:35:49+00:00Z

TECH LIBRARY KAFB,NM
0330223 NASA '1" U-3330
THERMAL CYCLING O F THIN-FILM CADMIUM SULFIDE SOLAR CELLS
By Adolph E. Spakowski and John G. Ewashinka
Lewis R e s e a r c h Center Cleveland, Ohio
N A T I O N A L AERONAUTICS AND SPACE ADMINISTRATION
For sale by the Clearinghouse for Federal Scientific and Technical Information Springfield, Virginia 22151 - Price $1.00

THERMAL CYCLING OF THIN-FILM CADMIUM SULFIDE SOLAR CELLS
by Adolph E. Spakowski and John G. Ewashinka
Lewis Research Center
SUMMARY
A space environmental chamber is described in which twenty -f our 3- by 3-inch thin-film cadmium sulfide solar cells can be thermally cycled in a vacuum of torr by using a xenon light source. The entire process, including the collection of cell output data, has been automated. Thermal cycling tests have been performed on thin-film cadmium sulfide solar cells to test them under conditions similar to those found in actual space applications. Cells were thermally cycled from above room temperature to -100' C. Metal substrate cells that depended solely on the pressure of the encapsulating plastic to hold the grid in contact with the barrier surface failed within several hundred cycles. The failures were due to short circuits that developed between the grid and substrate. Cells of this type that performed the best were made of the thinnest materials. Two types of cadmium sulfide cells successfully withstood the rigors of thermal cycling. One type had the current collecting grid electroplated directly onto the barrier surface. The other type substituted a plastic substrate for the metal substrate commonly used. Both types of cells showed no loss of power after many thermal cycles, and one cell with a plastic
1substrate completed 16 000 cycles, a life equivalent to more than 25 years in a near-Earth orbit.
INTRODUCTION
In the past several years cadmium sulfide (CdS) thin-film solar cells have been greatly improved both mechanically and electrically. Three- by three-inch cells have been made that produce a power output of over 1/3 watt at about 0.4 volt in terrestrial sunlight (refs. 1and 2). With the lighter construction now being used these cell characteristics are equivalent to short circuit current densities of 20 milliamperes per square centimeter and power densities (excluding packaging and deployment structures) approaching 100 watts per pound. With these improvements the use of thin-film cells may be considered for space power applications. However, most of the performance tests of

the solar cells have been obtained under idealized laboratory conditions and do not reflect actual performance in the space environment. Of all the environmental tests, one of the most meaningful is the thermal cycling test. Such tests have been conducted by NASA (ref. 3) and by a contractor. These tests have uncovered weaknesses in the cell design and have given direction to the design and construction of improved cells.
In this report a space environmental chamber is described in which twenty-four 3by 3-inch thin-film solar cells can be thermally cycled in a vacuum of torr by using a xenon light source. The entire process, including the collection of data, has been automated. A number of solar cells representing various types of construction were thermally cycled, and their designs are evaluated.
THERMAL CYCLING FACILITY
Space Environmental Tank
The space tank is 30 inches in diameter and 321feet long, and its longitudinal axis is horizontal (fig. 1). The ends of the space tank are hemispherical, and one end is removable. This end is mounted on a carriage which allows it to be rolled clear of the main tank. The tank was fabricated of 5/16-inch, type 304, stainless steel. Observation ports and feed-throughs were provided for light, power, and vacuum facilities. A 12-inch ground quartz plate (ultraviolet grade) window 1 inch thick in the fixed end of the tank permitted use of an external light source. The window provided a clear 10-inch-diameter aperture.
The vacuum system of the space tank had the capacity to achieve an ultimate vacuum of 1X10m8torr in 4 hours or less. The operating vacuum of the system for tests was 4~10-?torr . Pumping rates at the tank were at least 750 liters per second at torr and 200 liters per second at torr. Two 10-inch oil diffusion pumps with liquid-nitrogen baffles and suitable forepumps were used. To minimize vibrations in the tank, the forepumps were isolated from the system. Two instruments were installed in the space tank to measure pressures: (1)A naked ionization gage of the Bayard-Alpert type, and (2) a Pirani gage between the forepump and the diffusion pumps.
Inside the tank, and supported therefrom, was a double-walled stainless-steel shroud for liquid nitrogen. The inside diameter of the cylindrical section was 28 inches. End sections were also double-walled and hemispherical to match the contour of the tank. The main shroud was flange-supported from the main tank so that it could be removed easily. There were openings in both main and end shrouds for access to feed-through ports, windows, and pump connections. All these liquid-nitrogen-cooled surfaces were blackened to give as high an emissivity as possible. The surface coating was able to withstand
2

Figure 1. -Thermal cycling vacuum tank and light source.
baking at 250' C. A secondary liquid-nitrogen shroud was instalIed in the tank at the test plane because the main shroud could not provide a dark temperature of -100' C in the necessary time. This shroud was mounted on the movable end of the space tank as shown in figures 1 and 2. The secondary shroud had an inside diameter of 23g1 inches and was 16 inches long. The stainless steel surfaces were also blackened for high emissivity. This shroud contained the solar-cell mounting bracket near the closed end of the cylinder.
The solar-cell mounting bracket shown in figure 2 had a diameter of 22 inches and was constructed from l/2-inch 304 stainless-steel rod. The frame for holding the solar cells was divided into four separate quadrants. A terminal strip for electrical connections was mounted on the periphery of the quadrant. Each quadrant was strung with Teflon-covered piano wi re s (very similar to harp wires) on 1-inch centers. The insulated
3

Figure 2. - Secondary liquid-nitrogen baffle with cell mounting frame in position.
mounting wires permitted the solar cells to be electrically isolated from ground. This was necessary since some cells were constructed with the metal substrate exposed. Solar cells were mounted on the quadrants with either tape or small clamps. Teflon-covered leads from the cells were soldered to the terminal junction boards on each quadrant. Each cell had two power leads and two leads for temperature sensors. The quadrants with mounted solar cells were then attached to the bracket in the secondary liquid-nitrogen shroud. Electrical connections were brought outside the tank by Teflon-covered leads and multipoint connectors in the tank walls.
Primary Light Source
The primary light source chosen for the space tank was a 5000-watt xenon compact-arc lamp. Since this lamp was rich in ultraviolet and had a conversion efficiency of 82 percent (at 140 A and 32 V), 140milliwatts per square centimeter af energy could be obtained at the test plane. One drawback to the use of the lamp for long-term tests, however, was the extremely short rated life (200 hr). Subsequent modifications in the commercial power supply included the removal of a ground-loop circuit and the addition of an over-voltage protection for the lamp. These improvements in the circuitry increased lamp life to over 1000 hours. The starter, monitoring, and power controls of the lamp
4

were mounted in the lamp control panel (fig. 3). The power supplied to the lamp was nominally set at 4750 watts and manually controlled at this power setting to maintain the intensity level.
The optics of the solar simulator consisted of an ellipsoidal quartz collector (18-in. diam), two Vycor lenticular lenses (11- and 16-in. diam), andtwo quartz con
1densing lenses (52- and 6-in. diam). The collector had a front -surface coating with a transmission range of 0.25 to 2.4 microns. The projection lens, housed in a water-cooled mounting, projected a divergent beam into the tank to cover the test area of appraximately a 20-inch diameter. In the solar tank a bank of six 150-watt tungsten lights was located on the stationary end to provide additional energy in the near-infrared region of the spectrum (see fig. 1, p. 3). Thermal cycling was accomplished by interrupting the main light beam with a water -cooled shutter mounted inside the solar simulator housing. The secondary tungsten light was cycled in parallel with the shutter.
Calibration af the light at the test plane was made with the tank open by using a circular eight -junction bismuth-silver normal-incidence thermopile with lamp black coat ing. The thermopile was calibrated at a radiation intensity of 140 milliwatts per square centimeter.
DATA ACQUISITION SYSTEM Figure 3. - Data acquisition system.
Shawn in figure 3 is the data acquisition system, which contained the recorder,
5

I I I I Cell
All cell I signal \ Cell load' _-___ -
II I
signals - 1 stepper voltage- switch divider I
I I
I I network
LL II
AH cell I Recorder I Ithermo- Thermocouple Thermocouple Icouples-I reference I
- i junction, -signal step- I I
[ 150°F p r switch
(b) Cell loading.
Figure 4. - Schematic diagrams for data acquisition system.
master tandem timer, subtimers, lamp control panel, programer stepper switches, and additional vacuum gages associated with the space tank. The s t r ip chart recorder was a 48-point 10-millivolt recorder which printed one data point per second. The master tandem timer could be set for thermal cycling periods up to 1hour of light and 1hour of darkness by controlling a pneumatic shutter which in turn interrupted the light beam into the space tank. The subtimers operated in conjunction with the main timer to signal the start of data collection 10 minutes after the shutter was opened. The acquisition system (fig. 4(a)) contained a voltage divider network to drop incoming voltages to accommodate the 10-millivolt span of the recorder. The parameters measured for each solar cell were cell temperature, open circuit voltage, and voltage drop across loads of 2.0, 1.0, 0.5, and 0.2 ohm (fig. 4(b)). The programer system also contained two gold-plated 28-volt direct-current stepping switches. The first stepper handled the temperature of all the cells through a 150' F reference junction, and the second stepper handled all the cell voltages. Both switches were synchronized to record data for each cell in the proper sequence.
A typical data cycle was started when the master tandem timer energized the shutter control to start the irradiation d the solar cells. At the same time, the light-cycle sub-timer was started and the dark-cycle subtimer was reset to zero. After 10 minutes
6

(controlled by the light -cycle subtimer) the programer began the collection of solar -cell data. The temperature and voltages of cell 1were recorded. Then the stepper was switched to cell 2 and the same sequence of data collection was repeated. This process continued until the data from all the solar cells were recorded; then the steppers were reset to their starting positions. At the end of 15 minutes the shutter was closed by a signal from the master timer and the dark portion of the cycle began. Simultaneously, the light-cycle subtimer was reset to zero and the dark-cycle subtimer was started. Ten minutes later the cell temperatures were recorded.
The solar-cell data were accumulated for some period of time before they were reduced and plotted. For evaluation of solar -cell construction, it was sufficient to plot the open circuit voltage and the voltage drop across the 1-ohm load as a function of the num ber of thermal cycles.
THIN-FILM SOLAR-CELL CONSTRUCTION
Tables I and III give the mechanical and photovoltaic properties of the various types of CdS solar cells studied. All the cells used for the thermal cycling tests were approximately 3 by 3 inches. A sectional view of the type I solar cell is shown in figure 5. The cell was made from a 1- or 2-mil-thick molybdenum sheet on which a 1-mil layer of CdS was evaporated. The copper sulfide barrier was formed by dipping the CdS in a hot copper chloride solution. Then the gold current-collecting grid was applied to the barrier and the cell completed by lamination in the appropriate plastic. In this cell the plastic served the dual purpose of being an integral part of the mechanical structure of the cell and protecting the cell from moisture damage. Variations of this construction included cells with either thinner metal substrates or thinner plastic encapulants. However, all of these cells depended solely on the pressure of the encapulating plastic to hold the grids in contact with the barriers. Type 11cells were identical to type I cells except that copper grids were substituted for the gold grids. Type III cells were identical to the first two classes of cells, but the gold or copper grids were cemented to the barrier surface with silver-filled epoxy cements. In some cells the copper grids were silver plated to improve the epoxy bond.
The cells of type IV had the same basic construction as type I cells except for the gold current collecting grids, which were electroplated directly on the barrier surface. These grids adhered very well to the barrier and, therefore, did not depend on the encapsulating plastic for support.
The type V plastic cell used 2-mil-thick Kapton as the substrate. A flash-coat of silver was applied to the Kapton, followed by an electroplated zinc layer on which the CdS was then evaporated. A preformed gold grid was used and the cell encapsulated in plastic.
7

---
---
--- --
-- --- ---
---
TABLE I. - SUMMARY OF THERMAL CYCLING DATA
- ~~ ~~
m Cell Substrate Grid Encapsulating Are:, Short- Open- vlaximum Efficiency, Cycles to initial Length of test of material circuit circuit power, percent fluctuations or cycles
cell Uaterial current, voltage, 50-percent loss contacting
ISC' voc, mW of maximum power
I I d mV (a)
I 1 Molybdenum Gold Pressure Kapton 360 450 78 1.9 650 1860 Similar cells Molybdenum Gold Pressure 1.4 to 4.3 10 to 1650 2900 -
II 2 Copper Pressure Mylar 50 814 515 206 4.12 50 900 Similar cells Molybdenum Pressure ~ Mylar -_- 4.0 to 4.5 b20 to 1320 '2450
or copper
III 3 Molybdenum Gold Similar cell Molybdenum Gold
Cement Cement
Mylar Mylar
49 _-
705 3.86 3.67
160 50
2900 3600
d4 Molybdenum Copperd
Cement Mylar 51 638 4.02 40 1320 5 Molybdenum Copper Cement Mylar 50 724 4.10 220 9 0 0
Similar cells Molybdenum Coppere Cement Mylar _ _ 3.1 to 4.9 10 to 700 '3180
Iv 6 Molybdenum Gold Electroplating Mylar 107 2.18 Similar cells Molybdenum Gold Electroplating mpton 2.4 to 2.9 b700 to 3400 3400
~~ ~
V 7 Kapton Gold Pressure Mylar 40 415 56 1.40 '16 000 Similar cells Kapton Gold Pressure Mylar _ _ --_ _ _ _ 1.2 to 5.6 3 600
8 Kapton Gold Pressure Mylar 49 720 218 4.45 1760-aJ3a8ed on tungsten equivalent to 100 mW/cm2 sunlight at 25' C. boutput steady when cell was removed from test. 'Thermal cycling test still in progress at time of writing. dSilver-plated copper grid. e7 of 10 cells had silver-plated copper grids.

K\--Molybdenum substrate
. . L - N e g a t i v e lead
CD-8343
1Plastic encapsulant
Figure 5. - Schematic drawing of thin-film cadmium sulfide solar cell. (Figure not drawn to Scale.)
PROCEDURE
The solar cells to be thermally cycled were mounted on the appropriate test quadrant and wired into the data collecting system. To measure the temperature d a cell, either a bead thermistor was mounted on the front corner of the cell with epoxy cement, or a (28 gage) Chromel-Alumel thermocouple was attached to the backside with masking tape. Theoretical calculations indicated a temperature gradient of several degrees from the front to the back surface of a metal substrate solar cell.
After the cells had been mounted, the tank was pumped down to a pressure of torr and the liquid-nitrogen flow was started to the shrouds. The cooling brought the vacuum dawn to lo” torr. The cycle-timing clock was then set to the desired cycle length and the test started. A typical thermal cycle is shown in figure 6, where the temperature d cell 4 is plotted as a function of time. The shutter was opened at zero time, and the equilibrium temperature was approached rapidly. Data recording normally started after 10 minutes since the temperature of the cell was then within several degrees d its equilibrium value. Data recording for all cells required approximately 3 minutes.
9

cE a5 +lo--I
-100
-120
- Data
,-Light on taken Lighi off
I// I I I
Time, min
Figure 6. -Temperature cycle of cell 4 during thermal cycle..-.
The shutter was then closed and the cell cooled at a slower rate, so that the temperature reached -100' C in 15 minutes. It was usual to record only the temperature of the cells after 10 minutes of cooling in the dark portion of the thermal cycle. The cycling continued unattended.
RESULTS AND DISCUSSION
The thermal cycling tests were initiated in 1963 to test the ability of thin-film solar cells to withstand the space environment that would be encountered during a typical near-Earth orbit application. These conditions were approximated by cycling the cells in a
tor r vacuum and by using a xenon solar simulator. It became apparent at once that the cells were not stable and that either the photovoltaic junction or the mechanical integrity of the cells was being affected. The early tests in another thermal cycling facility indicated that the instability was mechanical in nature (ref. 3). A cell was considered to have failed when its output dropped suddenly or when its output dropped below 50 percent of the original value.
Type I and I1 Metal-Substrate Pressure-Grid Cells
The first molybdenum substrate cells used an electroformed gold grid (70lines/in. ) that was held in contact with the barrier layer of the cell only by the pressure of the en
10

I I I I I +Open circuit voltaqe ---E--Voltaqe dr
I-ohm I
500
450,
400
350
m >E
d 2502P
200
1%
100
50
0
\9
200
Q
-n
b
7l-Q
400
bIIIIIII1
.qI
800 loo0 1200 Thermal cycles
I I
1400 1600 1800
Figure 7. -Output of cadmium sulfide solar cell 1 during thermal cycling.
capsulating plastic (ref. 4). Thermal cycling data for cell 1 are presented in figure 7. In this figure the open circuit voltage and the voltage across a 1-ohm load were plotted against the total number of thermal cycles. The behavior of cell 1was typical of all cells with a gold grid that was held in contact with the barrier only by the encapsulating plastic. Both Mylar and Kapton plastics were used. All cells with this type of construction failed in the manner shown. Cell 1failed after 650 thermal cycles, although some cells lasted up to several thousand cycles. The causes of the failures were short circuits that developed as a result of the movement of the grid across the barrier during the thermal cycle. In the lamination process the metallic grid was enclosed on three sides by the plastic. Because of the mismatch in thermal expansion coefficients between the plastic-grid and the CdS-molybdenum, movement occurred at the interface as the temperature fluctuated and eventually a short circuit occurred. Two possible mechanisms could have led to
11
these short circuits: (1)The movement of the grid could have worn through the thin barr ie r layer at a weak point and thus formed a shorting path, or (2) in the more typical case, pinholes could have been formed in the CdS layer during the evaporation and filled with conducting material in the barrier dip process. In either case, when the grid contacted one of the conducting paths through the barrier, a short circuit occurred. The short circuits could be removed in most cases by the application of short voltage pulses to the cell (ref. 3), by relamination, or by simply annealing the cells. The first technique definitely removed the short circuits which had caused the cell failure, but it did not affect any of the potential short circuits that existed elsewhere in the cell. The latter two techniques did not permanently restore the output of the cells since these methods only moved the grid away from the localized shorting point.
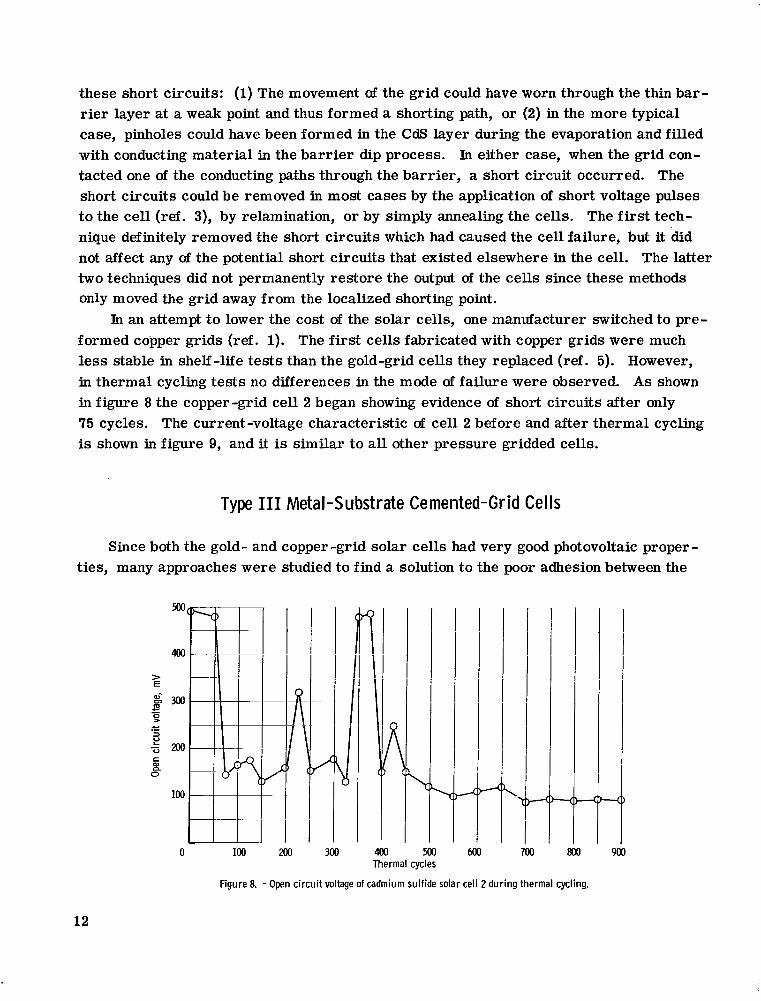
In an attempt to lower the cost of the solar cells, one manufacturer switched to preformed copper grids (ref. 1). The first cells fabricated with copper grids were much less stable in shelf-life tests than the gold-grid cells they replaced (ref. 5). However, in thermal cycling tests no differences in the mode d failure were observed. As shown in figure 8 the copper-grid cell 2 began showing evidence of short circuits after only 75 cycles. The current-voltage characteristic of cell 2 before and after thermal cycling is shown in figure 9, and it is similar to all other pressure gridded cells.
Type I11 Metal-Substrate Cemented-Grid Cells
Since both the gold- and copper-grid solar cells had very good photovoltaic properties, many approaches were studied to find a solution to the poor adhesion between the
~
I1
! 3i t '. -1
I ~
0 100 200 400 500 700 800 900 Thermal cycles
Figure 8. -Open circuit voltage of cadmium sulfide solar cell 2 during thermal cycling.
12
L
200 300 500 Voltage, mV
Figure 9. -Effect of thermal cycling on current-voltage curve of cadmium sulfide solar cell 2.
Before cycling
a ' E
-E- 400 alL
3 V
m After
'cycling
200
\
1~
1 2 500 Voltage, mV
Figure 10. - Effect of thermal cycling on current-voltage output of cadmium sulfide solar cells with cemented grids.
13
I.

grid and the cell. The most direct method, of course, was to cement the grids onto the barr ier with conducting epmy cements. Under ambient conditions, these cells displayed good conversion efficiencies, as shown by the original plot of current against voltage in figure 10, but in the thermal cycling tes ts they failed, as shown in figure 11. The lower curves in figure 10 were obtained immediately after the cycling tests were completed. The cells with the cemented grids failed simply because the epoxy did not remain bonded to the grids.
Type I V Metal-Substrate Electroplated-Grid Cells
Another approach studied to obtain sufficient adhesion between the grid and the cell was to electroplate the gold grid directly on the barrier. The grids made in this
450
I I I
400 Solar cell 0 3 0 4 0 5
350
300 I >E
$ 250 -c
200
150
100 ipecimen -D emoved a.0
3' 3-!
0 200 400 600 800 1200 1400 1600 1800 m Thermal cycles
Figure 11. -Open circuit voltage of cadmium sulfide solar cells 3, 4, and 5 during thermal cycling. ,
14

Q
0 m 800 1200 1600 m Thermal cycles
Figure 12. -Open circuit voltage of cadmium sulfide solar cell 6 during thermal cycling.
way adhered tenaciously to the barrier, but the plating solution severely reduced the power output of the cells. Figure 12 shows the results from thermal cycling an electroplated gold-grid cell. It must be emphasized, however, that these cells must have welded leads so that they will not depend on the standard pressure leads, which can also cause shorting-type failures. The power loss suffered during the plating process had been traced to porous photoresist masks. A s a result of improvements made in the photoresist technique, recent cells have been made without any loss of power during the electroplat ing process .
Type V Plastic Substrate Cells
The front-wall plastic substrate cells have also successfully withstood thermal cycling. These cells were made with current collecting grids that were held in place only by the pressure of the encapsulating plastic. The fact that the grids showed no signs of moving around on the barrier surface must have been due to the smaller stresses developed at the grid-barrier interface during the temperature excursions. Only the thin CdS layer was thermally mismatched with other parts of the cell, and therefore this thin layer must have deformed sdficiently to keep the cell intact. Figure 13 presents the data for cell 7, which had been thermally cycled over 16 000 times from 61' to -85' C. Cell 7 was one of the first plastic cells to be thermally cycled and was therefore of low efficiency; however, all plastic cells behaved similarly, including the 4.45 -percent -efficient cell 8 (also plotted in fig. 13).
Thermal Cycling Ratings
A review of thermal cycling data on almost 100 separate solar cells has shed new light on thin-film cell design. It is proposed that failures during thermal cycling are the result of stresses being relieved at the grid-barrier interface. These stresses are due to the thermal mismatch of the many cell materials. As shown in table 11molybdenum
15

~-
III i -I
6 -I"I*4~ 1. L
6200 0 800 1600 2400 3200 m
-
4800 f
7000 7800
TABLE II. - THERMAL EXPANSION
COEFFICIENTS FOR SOLAR-
CELL MATERIALS -
Material Thermal expansion coefficient, in. /(in. )(OC)
_ _ ~ -
Molybdenum 4.gx10-6
Cadmium sulfide 4.2
Gold 14.2
Copper 16.6 Mylar 27 Kapton 20
16
Thermal,
Figure U. -Outputs of cadmium sulfide
and CdS have almost identical thermal expansion coefficients. The same is true for the metal grids and encapsulating plastics. However, the mismatch between these two groups is quite large, and therefore stresses will develop during thermal excursions. The total stress between the groups of materials will be directly proportional to their thicknesses. Also the steepest stress gradient will be located at the grid-barrier interface. Thus, it is concluded that all thin-film CdS solar cells that must depend on the pressure of the encapsulating plastic to hold the current-collecting grid in contact with the barrier fail because of movement between the two.

1 1 1 1 1 1 Solar Voltage cell
7 8 1 Open c i r cu i ti.-=-. 7 Drop across
d
a-
IT JI
-8600 9400 10 200 11OOO 11 800 12600 13 400 14 200 15 OOO 15 800 16 600
cycles
solar cells 7 and 8 dur ing thermal cycling, -
In figure 14 the results of thermal cycling tests a r e presented for all the cell types studied. The curves represent the percentage of cells of a particular type that failed at each thermal cycling level. The thermal cycling levels were chosen from the pattern of results of all cycling tests. To discuss the data more easily, a relative numerical rating was calculated for each type of cell; these values are shown in table Ill. The ratings are equal to the integrated areas under each curve in figure 14, multiplied by a constant to give a value of 100 for the type III cell. The type Ia cell had a 2-mil metal substrate, a 1-mil plastic encapsulant, and a gold pressure grid; its rating was 150. The total stress in this type cell can be reduced either by using thinner encapsulating plastic (thereby increasing the rating to 195) or by using a thinner metal substrate (increasing the rating to 180 for chemically milled molybdenum, 0.5 to 1.0mil thick). And as would be expected, decreasing the thickness of the plastic had the greater effect.
Very few copper-grid cells (type 11)that depend on pressure to hold the grids in place had been tested, but the results for those tested were poor. The small number of cells tested did not permit a curve to be drawn in figure 14. Compared to gold, copper has low ductility. This leads to a steeper stress gradient at the grid-barrier interface since
17

Type of solar cel I (see table 111,
P. 1 0 I a 0 I b 0 I C 0 I11- A I V h V
0 1- 1 .-L 1 - J 0 to 100 100 to 500 500 to lo00 loo0 to 2OOo 2000 to 3000 >m
Thermal cycles before fa i lure
Figure 14. - Summary of thermal cycling tests.
TABLE III. - THERMAL CYCLING RATINGS O F SOLAR CELLS
I’ype of Substrate rhickness of Grid Rating cell
Thickness, mils
Ia 2 Ib 2 I C 0 .5 to 1.0
IIa 2
IIb 1 111 2
rv 0.5 to 2.0
V 2
plasticMaterial encapsulant!
mils
Molybdenum 1 Gold 150 Molybdenum . 5 Gold 195 Molybdenum 1 Gold 180 Molybdenum 2 Copper 0 Copper 2 Copper 100 Molybdenum 2 Cemented gold 100
and copper Molybdenum 1 Electropolated 530
gold Plastic 2 Gold 610 ~
18

less stress would be absorbed by deforming copper. In type I I I solar cells, the use of silver epoxy cements t o hold the grids more firmly
in place had been singly disappointing. The main cause for the low rating (100) was the decrease in the power output of the cells due to the failure of the epoxy bond after only a few thermal cycles.
Two types of CdS solar cells were produced that were very stable during long-term thermal cycling, and this stability was reflected in the high ratings achieved: 530 for type IV electroplated-gold cells, and 610 for type V plastic-substrate cells. The cells with the gold grids electroplated directly on the barr ier had achieved this stability by virtue of the good bond between the gold and the barrier. A contributing factor was the ductility of gold, which could absorb some stress by deformation rather than transmitting it t o the grid-barrier interface. The plastic substrate solar cell was a very stable cell despite its dependence on pressure to hold the grid in position. This stability probably resulted from the small total s t ress developed during temperature fluctuations since only the thin CdS layer was thermally mismatched with other parts of the cell. It was entirely possible for the CdS layer to deform internally and thereby absorb the stress.
CONCLUSIONS
A space ehvironmental chamber was built in which twenty-four 3 - by 3 -inch solar cells could be thermally cycled in a vacuum of tor r by using a xenon light source. Cell temperatures from above room temperature to -100' C were achieved over a wide range of cycle durations. The entire process, including the collection of cell performance data, was automated.
The thermal cycling tests have uncovered weaknesses in cell construction. This has led to better cell design and to improved methods of fabrication. The early solar-cell designs with metal substrates that utilized preformed current -collecting grids held in contact with the barr ier by the pressure of the encapsulating plastic have been shown to be unreliable for space applications where thermal fluctuations will be experienced.
Large area thin-film cadmium sulfide solar cells made either with a metal substrate and an electroplated gold grid or with a plastic substrate have very long thermal cycling life. One plastic substrate cell has completed over 16 000 cycles from 60°to -85' C
1with no loss in power output. This time is equivalent to over 2%years in a near -Earth orbit.
Lewis Research Center, National Aeronautics and Space Administration,
Cleveland, Ohio, March 28, 1966.
19

REFERENCES
1. Shirland, F. A. ; and Hietanen, J. R. : The Thin Film CdS Solar Cell. Vol. 2 of the Proceedings of the Fifth Photovoltaic Specialists Conference, NASA Goddard Space Flight Center, Greenbelt, Maryland, Oct. 19, 1965. Rep. No. PIC-SOL-209/6, Power Information Center, Pennsylvania Univ., Philadelphia, Jan. 1966, paper C-3.
2. Shirland, F. A. ; and Augustine, F. : Thin Film Plastic Substrate CdS Solar Cells. Vol. 2 of the Proceedings of the Fifth Photovoltaic Specialists Conference, NASA Goddard Space Flight Center, Greenbelt, Maryland, Oct. 19, 1965. Rep. No. PIC-SOL-209/6, Power Information Center, Pennsylvania Univ. , Philadelphia, Jan. 1966, paper C-4.
3. Ewashinka, John G. ; and Stephenson, George K., Jr. : Thermal Cycling and Heat Damage Tests of Thin-Film Cadmium Sulfide Solar Cells. NASA TN D-3038, 1965.
4. Griffin, T. A. ; Krus, D. J.; and Schaefer, J. C. : Research and Development in CdS Photovoltaic Film Cells. Final Rept., Harshaw Chemical Co. (NASA CR-54481), Aug. 1965.
5. Spakowski, A. E.; Schalla, R. L.; and Potter, A. E. : Some Problems of the Thin Film Cadmium Sulfide Solar Cell. Proceedings of the IEEE, 1966 (in press).
20 NASA-Langley, 1966 E-3367
I

rrThe aeronautical and space activities o f the United States shall be conducted 50 as to contribute . . . to the expansion of hr~manh o w l edge of phenomena in the atmosphere and space. T h e Administration shall provide fo r the widest practicable and appropriaie dissemination of information concer~zingits activities and the results thereof .”
-NATlONAL AERONAUTICSAND SPACE ACTOF 1958
NASA SCIENTIFIC AND TECHNICAL PUBLICATIONS
TECHNICAL REPORTS: Scientific and technical information considered important, complete, and a lasting contribution to existing knowledge.
TECHNICAL NOTES: Information less broad in scope but nevertheless of importance as a contribution to existing knowledge.
TECHNICAL MEMORANDUMS: Information receiving limited distribution because of preliminary data, security classification, o r other reasons.
CONTRACTOR REPORTS: Technical information generated in connection with a NASA contract or grant and released under NASA auspices.
TECHNICAL TRANSLATIONS: Information published in a foreign language considered to merit NASA distribution in English.
TECHNICAL REPRINTS: Information derived from NASA activities and initially published in the form of journal articles.
SPECIAL PUBLICATIONS: Information derived from or of value to NASA activities but not necessarily reporting the results .of individual NASA-programmed scientific efforts. Publications include conference proceedings, monographs, data compilations, handbooks, sourcebooks, and special bibliographies.
Details on the availability of these publications may be obtained from:
SCIENTIFIC AND TECHNICAL INFORMATION DIVISION
NAT10NA L A E R 0NA UTICS A ND S PACE A D M I N ISTRATI 0N
Warhingk, D.C. PO546


![Engineering Quantum Dot (Cadmium Sulfide) on …downloads.hindawi.com/journals/jnm/2020/4707123.pdf2019/12/20 · from it [11]. Doxorubicin is used as anticancer medicine and has](https://img.pdfslide.us/doc/110x75/5fde898609462c0dec4e8b9f/engineering-quantum-dot-cadmium-sulfide-on-20191220-from-it-11-doxorubicin.jpg)