Embed Size (px)
Citation preview
Thermal control and rate of deposition system of chemical vapor deposition at
atmospheric pressure production of thin tin-oxide films by an APCVD process
Maarten Jan Smit CTI Renato Archer – Divisão de Mostradores de Informação
University of Twente – Faculty of Engineering Technology – Applied Mechanics August 7, 2012
Thermal control and rate of deposition system of APCVD | MJ Smit 2 | P a g e
Thermal control and rate of deposition system of
chemical vapor deposition at atmospheric pressure
Maarten Jan Smit – s0142638
15/05/2012 – 07/08/2012
Center for Information Technology Renato Archer - Divisão de Mostradores de Informação
Supervisor: Thebano Emilio de Almeida Santos
Campinas – São Paulo – Brazil
University of Twente, Faculty of Engineering Technology, Applied Mechanics
Supervisor: Dr. Ir. M.B. de Rooij
(Laboratory for Surface Technology and Tribology)

Thermal control and rate of deposition system of APCVD | MJ Smit 3 | P a g e
Preface When it was time for me to decide where I would want to do my internship, the decision was
easily made to go abroad. After a really good experience in India in 2009, I wanted to discover
another part of the world I hadn’t been to yet: Brazil. Not knowing too much about Brazil I
started reading about the country and when I arrived, this country exceeded my expectations
on practically every area. I have had a most amazing experience staying here in Brazil.
The decision to go to CTI was an easy one for me since many people I know have done their
internship here and the University of Twente has some good connections with the institute.
Since my first day at work at CTI people have showed interest in me and made me feel
welcome. The people I worked with have created an amazing working atmosphere which really
made me enjoy working at CTI and enjoy my project.
The level of responsibility that I was given in doing my internship was extraordinary and quite
differs from the level of responsibility we usually have when working in the Netherlands. I was
free to use the resources at hand at CTI and got a lot of help from the people within the
institute. Having this much responsibility and control over your own project is something of
great value for me and after finishing the project, I truly learned a lot from this.
A great aspect of working at CTI is the freedom and flexibility you get in doing your internship.
As long as you follow your planning and carry out your work as expected, you have the
flexibility to enjoy Brazil and sometimes take a day off for special occasions or sightseeing.
They really value it when you know their country a little. Something I really appreciated and
enjoyed.
The project I worked on was an interesting project with many aspects. I have carried out
practical work, research and learned a new programming language to write a control program
for the designed reactor. This diversity in work is something interesting and has been a great
learning experience for me personally; since I have not really experienced an assignment in its
totality like this before.
Though I have worked alone several times before, it keeps on being a valuable aspect as it was
too during my internship here. Being responsible for the end results yourself and not together,
asks for different qualities from me than usually; which I really learned from.
I could not end this preface without sincerely thanking everyone who made my internship this
wonderful and amazing; an experience I won’t forget. I would like to thank everyone for their
involvement, interests and hospitality; without you I wouldn’t have enjoyed this internship this
much. In special I would like to thank Thebano Santos for accepting my request to do an
internship at CTI and guiding me throughout my research. Many thanks also to Luis Roberto
Ribeiro without whose help I couldn’t have carried out the project and Tania Lima for her
support and help in arranging a lot of things here. For the rest I would like to thank all my
colleagues at DMI who made my stay and work here really pleasant and truly fun.
Maarten Smit
August 2012
Thermal control and rate of deposition system of APCVD | MJ Smit 4 | P a g e
Summary This report covers the design and manufacturing of a new CVD reactor for chemical vapor
deposition (CVD) of tin-oxide to glass as well as several related issues such as written process
control software, chemical process information and test run results. The CVD process is one
step in the production of liquid crystal displays and many other applications. Currently CTI has
a working discontinuous atmospheric pressure (APCVD) reactor that needs replacement to
allow a process with more degrees of freedom as to conduct a more elaborate research.
The CVD process as carried out at CTI is a process that is chemically not fully understood yet,
but results of deposition of tin-oxide are measured. The principles behind the general process
as well as the specific process carried out at CTI are treated up to certain detail in this report as
well as several important influences on the process.
The design of the new APCVD reactor concerns in fact not the entire reactor, but rather all the
involved electrical equipment that is stored in a so called ‘control box’. This control box houses
all the mass flow control, electrical and temperature control equipment as well as equipment
for the rotational motor of the heater that is necessary for the CVD process. The control box’s
design is optimized using 3D CAD software and both an electrical circuit as a gas flow circuit is
drawn of the equipment inside.
To control the process digitally via a PC, it was necessary to communicate with the mass flow
controllers (MFCs) and hence software has been written to do so. for the equipment came
without any control software. The written program, named Deposition Control, is fully
explained so anyone acquainted with the used software to write the program can understand
and later on adapt the program if necessary.
Finally after finishing the assembly of the equipment and all the connections inside the
reactor, several test runs have been carried out to assure proper functioning of the total
reactor. During these tests, several improvements have been made to the equipment as well
as to the Deposition Control program. This report is concluded with several recommendations
for better control of the CVD process in future use.
Thermal control and rate of deposition system of APCVD | MJ Smit 5 | P a g e
Contents
Preface .................................................................................................................................................. 3
Summary ............................................................................................................................................... 4
1. Problem definition ........................................................................................................................ 7
1.1 Introduction ......................................................................................................................... 7
1.2 Current equipment ............................................................................................................... 7
1.3 Problem definition ............................................................................................................... 8
1.4 Problem approach ................................................................................................................ 9
2. The CVD process ......................................................................................................................... 10
2.1 General process .................................................................................................................. 10
2.1.1 Influence of substrate temperature .......................................................................... 11
2.1.2 Influence of gas mixture homogeneity ...................................................................... 12
2.1.3 Influence of deposition time ...................................................................................... 12
2.1.4 Other influences on the CVD process ........................................................................ 12
2.2 Chemical process of SnO2 deposition at CTI ...................................................................... 13
2.2.1 New reactor purpose ................................................................................................. 13
2.3 Process phases ................................................................................................................... 14
2.3.1 Pressurized gas to the bubblers ................................................................................. 14
2.3.2 Bubblers to the reaction chamber ............................................................................. 14
2.4 Reaction chamber .............................................................................................................. 15
2.5 Heater, insulation, support and exhaust ............................................................................ 16
3. Design and manufacture of the CVD control box ....................................................................... 17
3.1 Problem definition ............................................................................................................. 17
3.1.2 Hydrochloric acid backflow and leakage ................................................................... 17
3.2 Design of the control box ................................................................................................... 18
3.2.1 Hydrochloric acid backflow and leakage ................................................................... 18
3.2.2 SolidWorks 3D model ................................................................................................. 18
3.2.3 Electrical layout .......................................................................................................... 19
3.2.4 Gas flow circuit .......................................................................................................... 19
3.3 Final result .......................................................................................................................... 20
4. Deposition Control software ...................................................................................................... 22
4.1 MKS-416 Console ............................................................................................................... 22
4.2 Programming software: LabVIEW ...................................................................................... 22
4.3 Deposition Control software .............................................................................................. 22
4.3.1 The user interface ...................................................................................................... 24

Thermal control and rate of deposition system of APCVD | MJ Smit 6 | P a g e
4.3.2 Setting the initial values of the MKS-416 ................................................................... 24
4.3.3 Data acquisition and indication from mass flow meters ........................................... 25
4.3.4 Controlling the mass flows and time in each phase .................................................. 26
4.3.5 Phase indication and general timing .......................................................................... 26
4.3.6 Write data to file ........................................................................................................ 27
4.3.7 More information on the program ............................................................................ 27
4.3.8 How to use the program for a CVD process ............................................................... 28
4.4 Deposition Control process data file .................................................................................. 28
5. APCVD Reactor test runs ............................................................................................................ 29
5.1 Deposition process parameters ......................................................................................... 29
5.2 MFCs zero value and calibration ........................................................................................ 29
5.2.1 MFCs zero value ......................................................................................................... 29
5.2.2 Calibration of the MFCs ............................................................................................. 30
5.3 Temperature control .......................................................................................................... 30
5.3.1 Heating time .............................................................................................................. 30
5.3.2 Temperature drop ..................................................................................................... 30
5.3.3 PID temperature control ............................................................................................ 30
5.4 Substrate thermoshock ...................................................................................................... 30
5.5 Results ................................................................................................................................ 31
5.5.1 General....................................................................................................................... 31
5.5.2 deposition layer distribution ............................................................................ 31
5.5.3 Vapor mixture ............................................................................................................ 31
5.6 System improvements ....................................................................................................... 31
5.6.1 Substrate thermoshock .............................................................................................. 31
5.6.2 Thermocontrol PID parameters ................................................................................. 32
5.7 APCVD process characteristics ........................................................................................... 32
6. Recommendations and further research ................................................................................... 33
Appendices.......................................................................................................................................... 34
Appendix 1: CVD Process user guide.............................................................................................. 35
Appendix 2: Deposition Control user guide ................................................................................... 37
Appendix 3: Control box connections ............................................................................................ 39
Appendix 4: Troubleshooting ......................................................................................................... 40
References .......................................................................................................................................... 41

Thermal control and rate of deposition system of APCVD | MJ Smit 7 | P a g e
1. Problem definition
1.1 Introduction One of the key activities of the Brazilian research institute Center for Information Technology
Renato Archer (CTI) is the research and small-volume production of Liquid Crystal Displays
(LCD), Organic Light Emitting Diodes (OLED), Field Emission Displays (FED), and touch screens
etcetera. Use of these applications are found in practically any digital device nowadays and
hence further research is continuously ongoing.
Part of the production process of all of the above mentioned applications involve the
deposition of a thin conducting layer of tin-dioxide ( ) to a glass by a process called
chemical vapor deposition, or shortly CVD. This process can generally be carried out in various
ways in either a continuous or discontinuous process; depending on the equipment available
and the production quantity needed. At CTI this process is carried out by means of a
discontinuous reactor in which the substrate (the glass) is first heated to a temperature of
around 300 to 400⁰C and subsequently deposited with .
The deposition of is usually realized by the reaction of dioxide ( ) or water ( ) with
tin-tetrachloride ( ). However, at CTI the deposition of is realized using flows only
containing and methanol ( ); where and are both carried by
precisely controlled nitrogen ( ) gas flows. This process is chemically highly interesting since
it should not be possible to form solely with these components; as will be discussed in
Chapter 2.2. Somehow CTI succeeds in depositing the way as described above, which
yields further research for better understanding.
Two important characteristics of the deposited transparent conductive film (TCO), is that it
must have a high transmissivity and a low resistivity. The resistivity of the TCO is proportional
to the film thickness as where the transmissivity is inversely proportional to the film thickness;
hence an optimum point has to be found between these two resulting in the most favorable
layer thickness. More on the thickness of the film and characteristics of the CVD process
related to this is found in Chapter 2.1.
The reactor used at CTI is a discontinuous one and hence only one substrate can be treated at
a time, which is sufficient for the research done at CTI. The general principles behind the CVD
process as well as the process used by CTI will be discussed in more detail in Chapter 2.
1.2 Current equipment The current CVD reactor in use at CTI is depicted in Figure 1. The substrate is placed in the
reaction chamber (within the furnace) above the heater. The substrate’s support is slowly
rotating to achieve an even temperature distribution on the substrate inside the reacting
chamber. The temperature is of great influence on the deposition process, as explained in
Chapter 2.1.1, and hence an even temperature distribution is crucial across the substrate in
order to guarantee an evenly thick layer across the substrate. The temperature of the
substrate is measured using a thermocouple and controlled by a temperature actuation device
which is connected to the heater and can be manually set to a certain set point temperature.

Thermal control and rate of deposition system of APCVD | MJ Smit 8 | P a g e
The two gas flows that carry the reaction components (precursors) of the CVD process are
controlled by two mass flow controllers (MKS, type 1179B) which can be digitally analyzed and
controlled via a PC using specially developed software and a NI MKS-416 controller. All the
equipment for controlling the rotational speed, heating actuation and measurement, mass
flow controllers and pressure regulation is stored in a ‘control box’ for convenient reasons.
Since the current deposition process of from and is not fully understood
yet, numerous experiments have been carried out using the current equipment in order to
figure out the working principles behind the process. However, important parameters involved
could not be changed; such as additional gas flows for example. Therefore it is desired to have
another reactor in which these parameters can be taken into account and a new series of
experiments can be carried out to try to understand and determine the chemical process that
is taking place.
1.3 Problem definition Sufficient equipment is present at CTI to build another CVD reactor capable of depositing
using a slightly different process than with the current reactor, which is desired. Also in the
new setting not the substrate, but the heater will rotate; which is expected to lead to a better
temperature distribution (see Chapter 2.1.1). Furthermore the chemical process of depositing
the layer is different for an oxygen stream is also added. Together with some other small
differences, this led to the following problem:
Design and build a CVD reactor that meets the following demands:
Able of processing 200 x 200 mm substrates
Able of controlling the temperature inside the reaction chamber
Able of controlling the rotational speed of the heater (explained below)
Able to measure and control the oxygen and nitrogen pressures
The power of the entire system – i.e. all the separate equipment – should be
controlled by one single switch
Able to digitally control and measure two nitrogen and one oxygen stream
Able to carry out the chemical process in four different phases (digitally controlled)
Figure 1: (clockwise) Furnace and bubblers; reaction chamber; bubblers; control box
Thermal control and rate of deposition system of APCVD | MJ Smit 9 | P a g e
The last two points need some further explanation. The requirement to digitally control the
deposition process yields that a program has to be written to read and control the mass flow
data of the nitrogen and oxygen streams, since the equipment does not come with digital
control software. The list of requirements that the program has to comply with is given in
Chapter 4.3.
1.4 Problem approach The heater of the process as well as the reaction chamber was already designed and built
earlier; the rest of the equipment was only available in separate parts.
The following equipment is used in the process of designing and building the CVD reactor:
Two 1000 sccm* nitrogen ( ) mass flow controllers (MKS type 1159B)
One 10 sccm oxygen ( ) mass flow controller (MKS type 1159B)
Vacuum gauge measurement and control system (MKS type 146C)
Thermo couple and measurement device (Coel, type HW1440)
Heater actuation equipment (connected to the thermo couple measurement device)
Rotational motor control equipment
Two pressure regulators
Two pressure gauges (max 15 bar)
One pressure meter (max 2 bar)
All of this equipment has to be correctly connected to one another and conveniently be stored
in a ‘control box’.
The project roughly consists of two parts: designing and building the CVD reactor – i.e.
designing and building the control box – and writing the software used to control the mass
flows and hence the deposition process. However, first of all the principles behind a CVD
process in general as well as the specific process at CTI will be treated.
Finally, when the reactor is assembled and operative, several test runs will be done to assure
that the equipment and software functions properly.
*sccm stands for ‘standard cubic centimeter per minute’

Thermal control and rate of deposition system of APCVD | MJ Smit 10 | P a g e
2. The CVD process
2.1 General process Chemical vapor deposition (CVD) is the process of chemically reacting a volatile compound of a
material to be deposited, with other gases, to produce a nonvolatile solid that deposits
atomistically on a suitably placed substrate. The process is often used in the semiconductor
industry to produce thin films. In a CVD process the substrate is exposed to one or more
volatile precursors, which react and/or decompose on the substrate surface to produce the
desired deposit layer. Precursor gases, which are often diluted in carrier gases, are delivered
into the reaction chamber at approximately ambient temperatures. As they pass over or come
into contact with a heated substrate, they react and/or decompose. Figure 2 shows the basic
principles of a CVD process.
Figure 2: General principles of CVD process [1]
1. Mass transport of the gaseous reactants from the reactor inlet to the deposition zone.
2. Chemical reactions in the gas phase leading to new reactive species and byproducts.
3. Mass transport of the initial reactants and reaction products to the substrate surface.
4. Adsorption of these species to the substrate surface.
5. Surface diffusion of adsorbed species over the surface to the growth centre.
6. Surface reactions at the growth centre.
7. Desorption of by-products.
8. Diffusive mass transport of the by-products away from the surface.
9. Mass transport of the by-products to the outlet of the reactor.
The deposition process that takes place in the reaction chamber (or deposition chamber) is a
precise process that requires the right proportions of reacting gases in order to guarantee the
deposition results and hence a lot of equipment is needed to control the gas flows. The
equipment used in the considered process will be discussed in Chapter 3.
The essential functions of CVD equipment are to create an appropriate vapor or gas mixture,
and to make it flow over the substrate at an appropriate temperature. In most applications for
coating large areas, CVD processes are carried out at normal atmospheric pressure. In some
Thermal control and rate of deposition system of APCVD | MJ Smit 11 | P a g e
specialized applications, particularly in the semiconductor industry, CVD is carried out at lower
pressures. If the reactants are gases, then an appropriate gas mixture can be formed using
standard mass flow controllers. If the reactant is a liquid or a solid, it must first be vaporized.
Often the vaporization is done in a bubbler, by passing a carrier gas through the precursor. [1]
A CVD process can be carried out in a numerous amount of different ways; e.g. at different
temperatures, different pressures and using different chemical reactions; all dependent on the
desired end product and equipment at hand. The CVD reactor used at CTI works at
atmospheric pressure and the process is therefore referred to as Atmospheric Pressure
Chemical Vapor Deposition (APCVD).
2.1.1 Influence of substrate temperature
The substrate temperature (and reaction chamber temperature) is a critical factor the most
important parameter to consider in the minimization of the electrical resistivity of tin oxide
films deposited by CVD [7]. The temperature can vary from relatively low temperature of a
several hundred degrees to up to 1500⁰C, all dependent on what the desired end result (e.g.
layer thickness or atomic structure) is and what reactions are to take place. The process
carried out at CTI is carried out at temperatures between 300 and 400 ⁰C.
Not only the temperature but also the temperature distribution across the substrate is very
important in a CVD process [5][6]. When a constant layer thickness is desired on the substrate,
the temperature should be homogeneously distributed across the substrate’s surface too,
since the deposition and rate of deposition is temperature dependent. However, besides the
sheer temperature and its distribution, the layer thickness and structure is also dependent on
the gas mixture as will be discussed in Chapter 2.1.2.
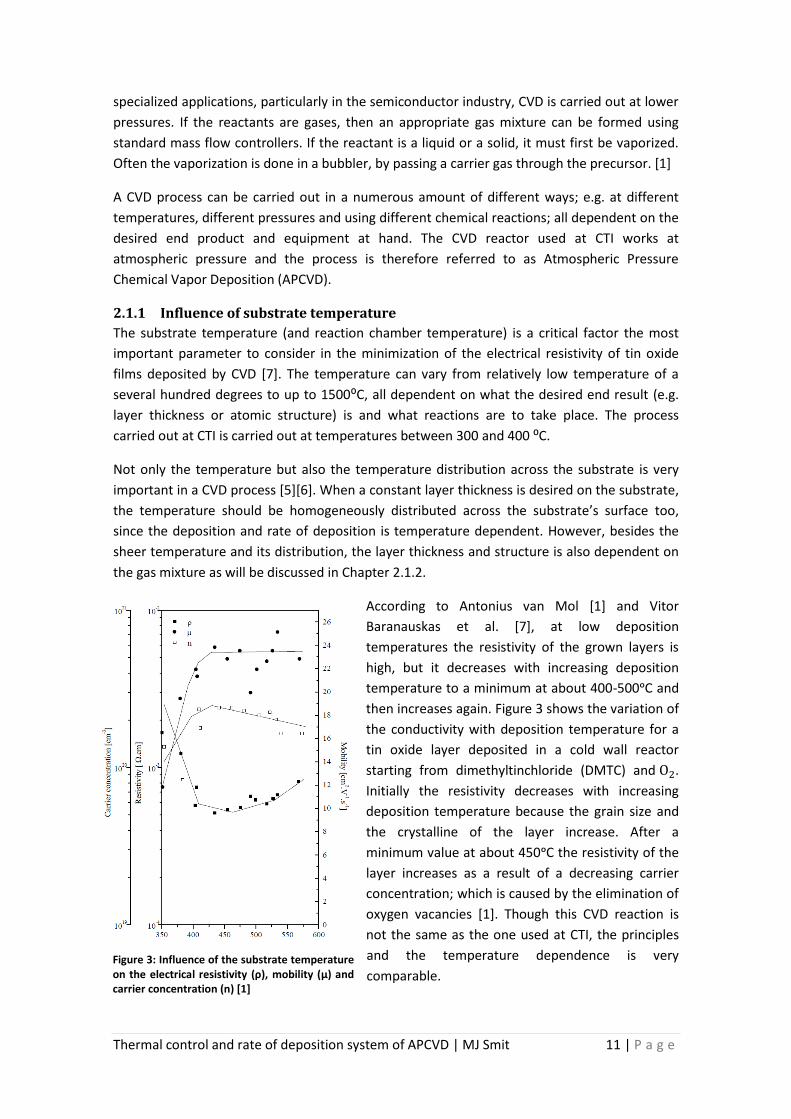
According to Antonius van Mol [1] and Vitor
Baranauskas et al. [7], at low deposition
temperatures the resistivity of the grown layers is
high, but it decreases with increasing deposition
temperature to a minimum at about 400-500ᵒC and
then increases again. Figure 3 shows the variation of
the conductivity with deposition temperature for a
tin oxide layer deposited in a cold wall reactor
starting from dimethyltinchloride (DMTC) and .
Initially the resistivity decreases with increasing
deposition temperature because the grain size and
the crystalline of the layer increase. After a
minimum value at about 450ᵒC the resistivity of the
layer increases as a result of a decreasing carrier
concentration; which is caused by the elimination of
oxygen vacancies [1]. Though this CVD reaction is
not the same as the one used at CTI, the principles
and the temperature dependence is very
comparable. Figure 3: Influence of the substrate temperature on the electrical resistivity (ρ), mobility (μ) and carrier concentration (n) [1]

Thermal control and rate of deposition system of APCVD | MJ Smit 12 | P a g e
In the current reactor present at CTI the substrate’s support, and hence the substrate, is
rotating in order to obtain an evenly distributed temperature profile as possible across the
substrate’s surface and inside the reaction chamber. In contrary to the current reactor, the
new reactor will have the substrate fixed, but the heater rotating.
2.1.2 Influence of gas mixture homogeneity
The gas mixture homogeneity and distribution of the gas mixture across the reaction chamber
is very important when it comes to the distribution of the deposited layer and hence its layer
thickness and electrical resistance. For example, when the substrate is placed as shown in the
left side of Figure 4 and the gas flow is from left to right, the reactants will have a relative
higher density in the flow on the left side of the substrate than on the right side, where the
flow is already partly depleted of reactants, and hence the layer thickness will vary in the same
way; i.e. it will be thicker on the right side than on the left side. To overcome this effect in this
particular case, the substrate should be tilted slightly to compensate for this effect so an
evenly distributed layer thickness is obtained; as shown in the right side of Figure 4.
Figure 4: Effect of gas mixture and substrate placement on deposit layer thickness.
This example illustrates the importance of the gas mixture distribution on the end product and
it is in fact a much more complicated fluid dynamical problem than shown in this relatively
simple example. Though this topic will not be elaborated on in this report, it is presented here
to bear in mind the importance of it and the influence it can have which is necessary for a
better understanding of the entire process. Chapter 2.4 shows the reaction chamber as well as
some gas mixture characteristics of the new reactor.
2.1.3 Influence of deposition time
When all other deposition parameters are kept constant, an increasing deposition time results
in a higher thickness of the layer. In general, the electrical resistivity of the film decreases with
increasing thickness to a more or less constant value. A longer deposition time results in larger
grains in the crystalline structure of the film. The dependency of the electrical resistivity on the
deposition time is not a single mechanism however and in some cases an increase of resistivity
has been reported at thicker boundary layers [1]. When preparing and designing a CVD
process, great care should be given to this to predict the expected end result of the film.
2.1.4 Other influences on the CVD process
There are many other factors that influence the CVD process and the characteristics of the
layer as is elaborately discussed in ‘Chemical Vapour Deposition of Tin Oxide Thin Films’
[1] and ‘The Materials Science of Thin Films’ [2]. Several other important factors influencing the
CVD process are for example the flow rate of precursors, the type of substrate used and
additional chemicals etc. For further reading see also reference [5] and [6].
Thermal control and rate of deposition system of APCVD | MJ Smit 13 | P a g e
2.2 Chemical process of SnO2 deposition at CTI As explained in the introduction (Chapter 1), the chemical process behind the current process
is not fully understood yet and several chemical reactions are possible to occur that could
realize the deposition of the layer on the substrate. There are many different ways of
depositing , but usually this reaction takes place either by hydrogenation or oxygenation
of by the following reactions respectively:
(1)
(2)
Both reactions require additional heat input (ΔT) to take place, which is realized by the
temperature of the substrate. There are many other possibilities of forming , but these
will not be treated here for they are irrelevant for the case considered.
At CTI the deposition is realized using and . When combining flows of
and the following possible reaction can take place where is formed (in two
steps):
(3)
And using the formed , can be broken down as follows:
(4)
Both reactions again require additional heat input in order to take place. The odd thing
however about reaction (3) is that in order to break down the methanol ( ), the
presence of a strong acid is needed to realize this. This strong acid is not present in the reactor
and hence the formation of from and remains quite a mystery which is
not fully understood yet.
However, there are some theories about the formation of that may hold validity. The
main theory is that since CTI is working with an APCVD reactor (non vacuum), there is normal
air inside the reaction chamber which contains small amounts of depending on its
humidity; which might result in reaction (2) taking place and hence the formation of . It
has been proven after several experiments that the humidity is of influence on the reaction
taking place and at some levels of humidity the formation of does not occur at all. Also
the might react with the oxygen present inside the reaction chamber.
2.2.1 New reactor purpose
To investigate the principles behind the process taking place it is desired to let the process take
place with an additional flow of oxygen, for example, to see how this affects the outcome of
the deposition process. Since the current reactor does not allow an additional third flow into
the reaction chamber, this yielded the design of a new reactor which does. The new reactor
will be used to further investigate the process taking place and to carry out experiments
allowing an additional gas flow inside the reaction chamber.

Thermal control and rate of deposition system of APCVD | MJ Smit 14 | P a g e
2.3 Process phases The total cycle of the CVD process covers everything from the pressurized oxygen and nitrogen
flows, to the reaction in the deposition chamber to the final exhaust of the gases. In this part
the process steps will be discussed step by step. A schematic overview of the CVD process is
shown in Figure 5.
Figure 5: Schematic overview of the CVD process of the new reactor
2.3.1 Pressurized gas to the bubblers
The nitrogen and oxygen are maintained at a constant pressure of around 2 bars, which can
manually be controlled by the pressure regulators on the control box. The gases are directly
connected to the mass flow controllers where their flow rate is accurately controlled using the
written Deposition Control software. From the mass flow controllers the two nitrogen flows go
to the bubblers where they function as carrier gases for the and , which together
with the are the reaction components in the CVD process. The oxygen flow from the MFC is
connected to the methanol stream before entering the reaction chamber; see Figure 5.
2.3.2 Bubblers to the reaction chamber
The process steps from the bubblers to the reaction chamber are the actual CVD process steps,
or phases, where the reactions take place and hence the formation of the deposit layer. The
formation of the layer is done in several different phases where the right proportions of
precursors are realized up to the purge of the reaction components at the end of the process.
The process steps are as follows:
Phase 1: the first phase consists of a stream of mainly methanol and occasionally
oxygen to fill up the entire reaction chamber. The flow is still closed and
hence no reaction is taking place.
Phase 2: In the second phase a small flow of is added to the already ongoing
flows of methanol. If not present yet, oxygen is occasionally also added. In this
phase the first thin layer is formed.

Thermal control and rate of deposition system of APCVD | MJ Smit 15 | P a g e
Phase 3: The third phase is the phase where the final deposit layer is formed. This
phase is the grow phase where a strong flow of is present as well as the
flows of oxygen or methanol (or both).
Phase 4: The fourth phase is the final one and is the purge phase. In this phase only a
strong flow of methanol is present to purge all the reactants out of the
reaction chamber. There is no flow of present in this phase and hence
the growth of the deposit layer is stopped.
In the phases as described above, phase 2 and 3 can actually be combined if desired forming a
3-phase deposition process. After numerous runs with the old (current) reactor it was found
that the total deposition process takes up 5 to 10 minutes to really start; hence phase 2 was
introduced to assure the start of the process where phase 3 is the real deposit layer growth
phase.
2.4 Reaction chamber The reaction chamber is the most important facet of the CVD equipment since this is where
the reactions take place. The reaction chamber is depicted in Figure 6.
Figure 6: Reaction chamber of the new reactor
Since the two inflowing (reacting) precursor streams flow into the reaction chamber right
above the substrate, a gas flow interference plateau is placed to prevent the flows from
directly flowing towards the substrate and creating forced flow reactions. Since the plateau
redirects the precursor flows, the flows become more or less random and cause natural and
random reactions and layer growth on the substrate.
Also the gas flow interference plateau catches any solid substances resulting from reactions in
the top of the reaction chamber so to protect the substrate right underneath it.

Thermal control and rate of deposition system of APCVD | MJ Smit 16 | P a g e
2.5 Heater, insulation, support and exhaust The heater, insulation and exhaust holes are depicted in Figure 7. The heater consists of a
resistance heating wire that is embedded in a low conducting ceramic plate to direct the heat
towards the substrate’s support. The substrate’s support is a solid stainless steel plate with
good heat conducting properties.
The thermocouple is put inside the center of this steel plate to measure its temperature. It is
assumed that the substrate will approximately have the same temperature as the steel plate.
This assumption is valid since the plate can store a sufficient amount of heat and has good
heat conducting properties; hence the small (thin) substrate will approximately have the same
temperature.
Insulation is placed both around the heater as well as around the substrate’s support to keep
the heat inside the deposition chamber. The insulation around the heater is to prevent
unnecessary energy losses and ensuring an optimum heat transfer toward the substrates
support instead of in other directions.
As can be seen in Figure 6, the glass dome (with the precursor inlets) is placed on top of the
structure depicted in the right side of Figure 7. From the outside to the inside of the reaction
chamber small hole are present all around the glass dome, which function as the exhaust holes
(see Figure 7).
Figure 7: (left) heater and insulation; (right) Substrate support and insulation

Thermal control and rate of deposition system of APCVD | MJ Smit 17 | P a g e
3. Design and manufacture of the CVD control box
3.1 Problem definition Controlling the mass flows, temperature, pressure and the rotational speed of the heater
yields a lot of electrical and other types of equipment. It is convenient to have this equipment
stored all together in a so called control box for practical reasons. The control box is meant to
contain the following equipment:
Two 1000 sccm nitrogen ( ) mass flow controllers (MKS type 1159B)
One 10 sccm oxygen ( ) mass flow controller (MKS type 1159B)
Vacuum gauge measurement and control system (MKS type 146C)
Thermo couple and measurement device (Coel, type HW1440)
Heater actuation equipment (connected to the thermo couple measurement device)
Rotation motor control equipment
Two pressure regulators
Two pressure gauges (max 15 bars)
One pressure meter (max 2 bars)
(See Figure 5 and Figure 10 for visualization of the use of the equipment)
Besides containing the above listed equipment, the control box also has to comply with the
following requirements:
The control box should have one main power switch which powers all the equipment
at once as well as a separate switch for the rotational motor of the heater.
Since a certain space is reserved for the total CVD equipment at CTI, the maximum
dimensions of the box should not exceed 500 x 500 x 400 mm (length x width x
height).
The control box should have the following electrical outputs:
o Output for thermocouple
o Output for earth wire of the heating equipment
o Power output for the rotational motor
o Power output for the heater
o Output for RS-232 communication cable
There should be a constant overpressure inside the control box; this will be explained
in Chapter 3.1.2.
3.1.2 Hydrochloric acid backflow and leakage
Before and after every deposition process, or series of processes, the equipment used is
thoroughly cleaned. It is possible that during the cleaning there is still water remaining inside
the tubes that carry the gasses from the bubblers to the reaction chamber. In some cases it
has been experienced that the , in the absence of additional heat, get hydrogenated and
forms tin(IV)chloride-pentahydrate ( crystals (solid) which block the tube. While
the nitrogen is still running, a certain pressure is build up at the bubblers side due to the
blockage and in time small amounts of hydrochloric acid gas ( ) are formed. When the
stream of nitrogen is turned off, the created overpressure on the bubblers side can cause the
, a very volatile and corrosive gas, to flow back towards the mass flow meters. Since the

Thermal control and rate of deposition system of APCVD | MJ Smit 18 | P a g e
mass flow controllers are not designed to cope with , leakage may occur and cause
corrosion to the equipment inside the control box. Therefore it is necessary to have a constant
slight overpressure inside the box to purge in case it leaks from the mass flow controllers.
Though it is not very likely to occur, these necessary precautions need to be taken just in case.
3.2 Design of the control box In the design phase of the control box care is given to obtain an as practical layout of the
equipment as possible, taking into account the most practical positions of all the outputs and
controls for practical matters. Also enough space must be available inside for maintenance
purposes and special care is given to the backflow problem.
3.2.1 Hydrochloric acid backflow and leakage
To cope with the problem as described in Chapter 3.1.2 several measures can be taken to
realize the overpressure inside the control box. To realize this overpressure, a constant stream
of nitrogen will be used which can be controlled with a pressure meter on the front panel of
the control box. However, instead of creating an overpressure inside the entire control box, it
is chosen to isolate the three mass flow controllers from the rest of the equipment with a
small airtight box so that only an overpressure inside this smaller space has to be realized;
which is much more efficient and safe. The airtight box is placed around the mass flow
controllers and the gas can be purged out via ventilation holes in the sides of the control box.
From the pressure meter on the front panel which controls the purge flow of nitrogen a tube is
connected to the inside of the airtight box.
3.2.2 SolidWorks 3D model
The main dimensions are determined by the controls on the front panel (pressure gauges,
MKS-416 controller, switches etc). To determine the final dimension most of the equipment
has been modeled in SolidWorks 2011, a 3D CAD program, to visualize the design and ensure
all the equipment will fit in properly. The design is shown below in Figure 8. The final
dimensions of the design are 450 x 410 x 305 mm (L x W x H).
Figure 8: Design of the control box and placement of equipment

Thermal control and rate of deposition system of APCVD | MJ Smit 19 | P a g e
3.2.3 Electrical layout
All the equipment used for the CVD process runs on 110V, except for the MKS-416 console and
the heater which both run on 220V. Therefore the system is powered by two plugs, one for
each voltage. To realize the requirement that the system must have one main switch to turn
on/off all the equipment, a relay switch is used. This particular switch is convenient since it
works with a maximum amperage level and if that limit is exceeded the switch is turned off
automatically; much like the effect of using a fuse.
Most of the equipment consists of multiple printed circuit boards (PCBs) which are
interconnected and hence the full electrical circuit of the equipment inside the control box is
quite complex. For this reason a simplified electrical circuit is drawn which clusters the PCBs of
the thermocouple and the rotational motor. The scheme is shown in Figure 9.
Figure 9: Electrical circuit of the components inside the control box
3.2.4 Gas flow circuit
The CVD process makes use of several streams of nitrogen and oxygen which are connected to
pressure gauges, meters, regulators and the mass flow controllers. Much like the electrical
circuit, a gas flow circuit has been made to show the gas flows and all the connections to the
equipment from the pressurized oxygen and nitrogen tanks to the exhaust of the reaction
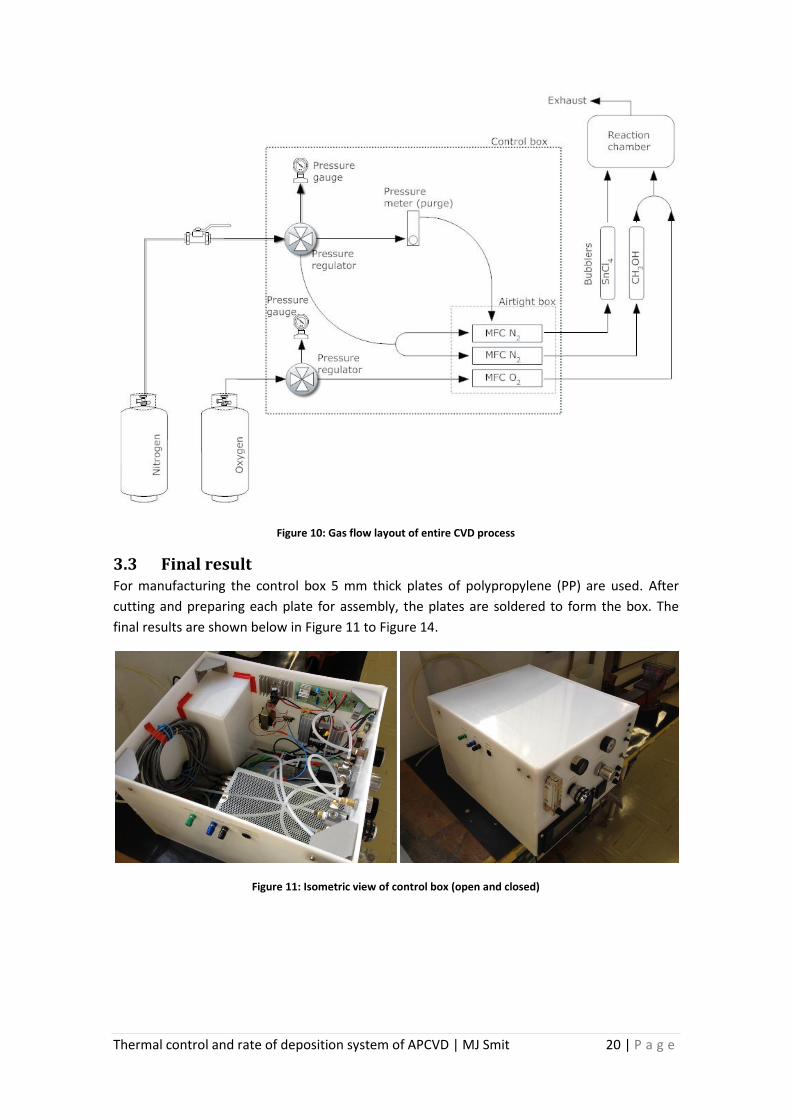
chamber. The gas flow chart is shown in Figure 10.
Notice that the bigger dashed box indicates what equipment is placed inside the control box
and the smaller dashed box (inside the control box) indicates the airtight space where the
mass flow controllers are places. The stream from the ‘pressure meter (purge)’ is the gas
flow that is used to create the overpressure inside the airtight box.
Thermal control and rate of deposition system of APCVD | MJ Smit 20 | P a g e
Figure 10: Gas flow layout of entire CVD process
3.3 Final result For manufacturing the control box 5 mm thick plates of polypropylene (PP) are used. After
cutting and preparing each plate for assembly, the plates are soldered to form the box. The
final results are shown below in Figure 11 to Figure 14.
Figure 11: Isometric view of control box (open and closed)

Thermal control and rate of deposition system of APCVD | MJ Smit 21 | P a g e
Figure 12: Front panel of control box
Figure 13: (clockwise) Top view; Airtight box; Electrical outlets (ground, motor and thermocouple); Main power switch and motor control
Figure 14: (left to right) Furnace and bubbler chamber; idem with computer; idem with control box
Thermal control and rate of deposition system of APCVD | MJ Smit 22 | P a g e
4. Deposition Control software In order to digitally control the CVD process, software has been written to continuously
acquire and control the mass flow data of the three mass flow controllers using a PC and the
MKS-416 device. The written program is named Deposition Control and is designed using the
software LabVIEW 8.5; see Chapter 4.2. In case the program might be adapted in the future,
the general functioning principles of it will be discussed in this chapter; so anyone acquainted
to LabVIEW can get a basic understanding of it. First off all the MKS-416 console and
programming software will be discussed briefly; hereafter the written software will be treated.
4.1 MKS-416 Console The MKS-416 console, shown in Figure 12, is used to control and acquire data from the mass
flow controllers as well as to set all the important parameters before operation. This console is
designed to be controlled manually and the data can be read from the console’s screen
directly. However, the console can also be connected to a PC for digital data analyzing and
mass flow control. The connection between the console and a PC is realized using a RS-232
communication cable; detailed information about the connection of the device to a PC can be
found in the MKS-416 manual.
4.2 Programming software: LabVIEW In order to establish communication from the PC with the MSK-416 device, a program is
written using the software LabVIEW (version 8.5). LabVIEW (short for Laboratory Virtual
Instrumentation Engineering Workbench) is a system design platform and development
environment for a visual programming language from National Instruments. The software
allows the engineer to design a user interface (UI) for data communication as well as to design
the data flow-sheet that realizes all the communication and the sequential order in which all
the steps and commands are executed. The UI is easily understandable and user friendly,
whereas the data flow-sheet – the actual programming behind it all – is rather complicated;
hence the data flow sheet will be discussed and explained. The final results of the data flow-
sheet and the UI can be found in Figure 15 and Figure 16 respectively.
4.3 Deposition Control software The program that has been written for the CVD process at CTI, called Deposition Control, had
to comply with the following requirements:
Variable number of mass flow phases (maximum 4)
Able to control the mass flows for the three separate flows in each phase
Able to control the timing in each separate phase
Able to read elapsed and remaining process time
Read and show the mass flow data of all three flows continuously
Write the process data to a file every time the process is started
The final result of the program, the data flow-sheet, is shown in Figure 15. Chapter 4.3.2 and
further will discuss every part of the data flow-sheet in order to provide information about the
working principles behind it for a better understanding of the software.

Thermal control and rate of deposition system of APCVD | MJ Smit 23 | P a g e
Figure 15: Data flow-sheet of Deposition Control program
Thermal control and rate of deposition system of APCVD | MJ Smit 24 | P a g e
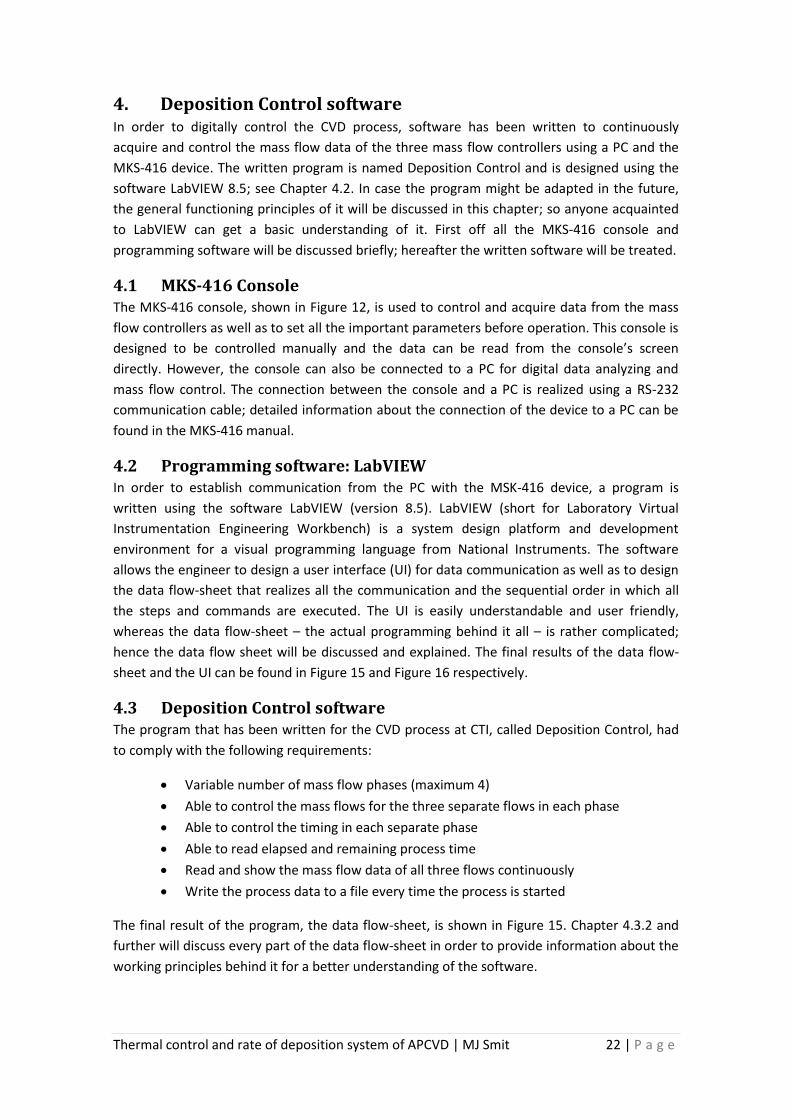
4.3.1 The user interface
The UI of the Deposition Control program is the actual program as it appears to the user and is
shown below in Figure 16.
Figure 16: User interface (UI) of the Deposition Control program
The UI is rather simple and needs little explanation. The UI is where the process parameters
can be set; i.e. the values of the different flows in each phase and the timing of each phase. On
the upper part of the UI the values of the three different streams can be read. The total
elapsed and remaining time of the entire process as well as of each phase are shown on the
center of the UI. The lower part of the UI is used for specifying a name and path for the
program to save the data of the process in after completion.
As can be seen the UI also has a few indicators which show in which phase the process is. In
this case the light will change color from dark-green to light-green. Another indicator is the
‘process ready’ indicator which turns to light green when the process has finished.
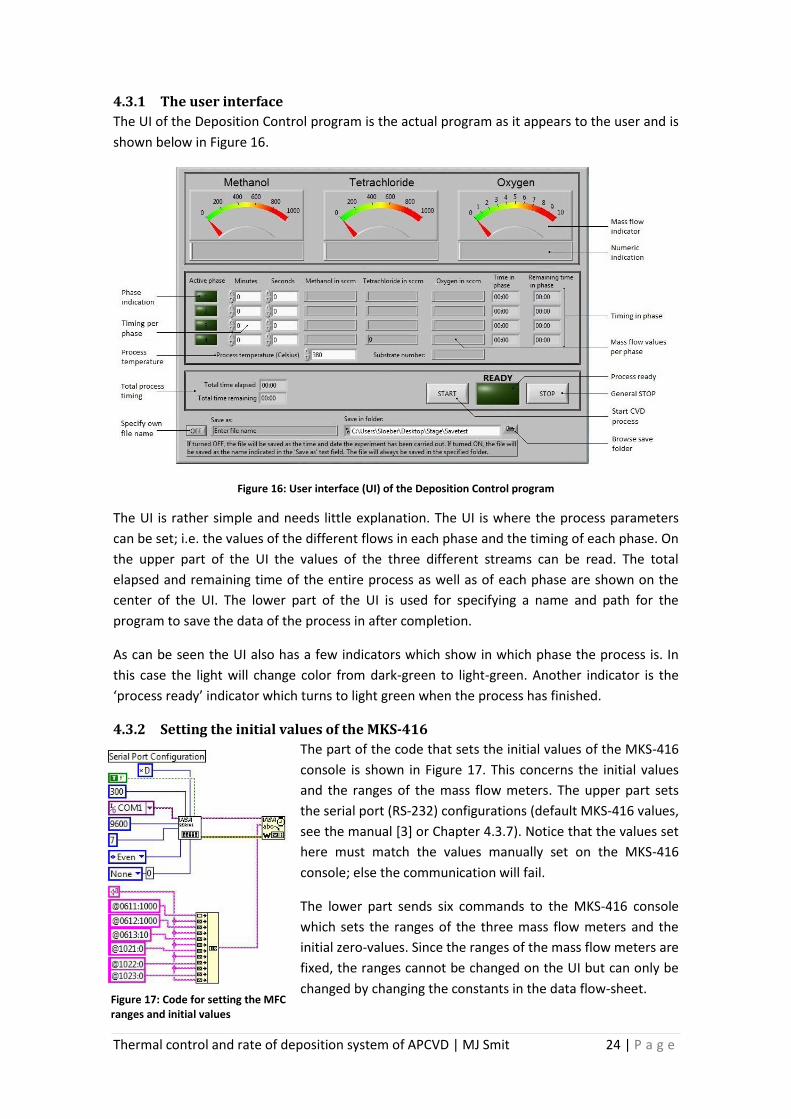
4.3.2 Setting the initial values of the MKS-416
The part of the code that sets the initial values of the MKS-416
console is shown in Figure 17. This concerns the initial values
and the ranges of the mass flow meters. The upper part sets
the serial port (RS-232) configurations (default MKS-416 values,
see the manual [3] or Chapter 4.3.7). Notice that the values set
here must match the values manually set on the MKS-416
console; else the communication will fail.
The lower part sends six commands to the MKS-416 console
which sets the ranges of the three mass flow meters and the
initial zero-values. Since the ranges of the mass flow meters are
fixed, the ranges cannot be changed on the UI but can only be
changed by changing the constants in the data flow-sheet. Figure 17: Code for setting the MFC ranges and initial values

Thermal control and rate of deposition system of APCVD | MJ Smit 25 | P a g e
4.3.3 Data acquisition and indication from mass flow meters
The part of the code that realizes the constant data acquisition from the mass flow controllers
and shows the mass flow values on the UI is shown below in Figure 18.
Figure 18: Code for continuous data acquisition and value indication from mass flow controllers
The total code is surrounded by a while loop which runs during the entire process. The left part
of the while loop shows a small structure which is responsible for the data send to the MKS-
416 console to request the value of the mass flow controllers. This is a so called case structure
which changes its code inside with every iteration of the entire loop in order request the status
of every mass flow controller in sequence, after which the total loop restarts; hence the status
of every mass flow controller is sequentially checked, continuously.
The right side of Figure 18 reads the response from the MKS-416 console containing the values
of the mass flow controllers. Since the response is a long string of characters, the string it cut
down and manipulated so it only contains the numeric value of the mass flow controllers in
the end and the result is linked to the correct mass flow meter and indicator on the UI.
Also the general STOP button is found in this piece of code, at the top of the main loop. If
pressed this button makes sure the entire process is stopped at once. An important facet here
is the case structure that makes sure that the MFCs are set to zero before the entire process is
stopped. If this is not done, the MFCs will continue the process with the last received mass
flow data (in the phase the process is stopped); hence the process will not stop, but only the
program. Using this structure the program as well as the process is stopped.

Thermal control and rate of deposition system of APCVD | MJ Smit 26 | P a g e
4.3.4 Controlling the mass flows and time in each phase
In every phase of the process commands are sent to the MKS-416 console and the program
keeps track of the time. This is done by the code structures as shown below in Figure 19.
The left structure is a timed sequence which is a structure which only executes once at a given
timing. This structure is used to send the mass flow details for each phase at a certain time as
specified by the user in the UI. Inside the structure the codes are assembled which set the
desired values of the mass flows and are then send to the MKS-416 device. The codes use the
specified values for each mass flow meter as specified by the user in the UI.
Each sequence structure activates a while loop at the same time the commands are send to
the MKS-416 console; thus at the beginning of each phase. This while loop is shown in the right
side of the figure and upon activation of this loop a timer starts running until the next phase
starts. The timer shows the total elapsed and remaining time in each phase, which is both
shown on the UI, and is automatically stopped at the end of each phase.
4.3.5 Phase indication and general timing
The phase indication on the UI and the
‘process ready’ indicator, see Figure 16, is
controlled by the code as shown in .
This while loop contains an ‘elapsed time’
block, which keeps track of the total timing
and time remaining of the entire process. This
block is used to compare the total timing with
the times set per phase and these results are
used to determine the active phase, using
several comparison operators.
Figure 19: Code that is responsible for controlling the mass flows and timing in each phase
Figure 20: Code for the phase indication on the UI and the general timing of the process

Thermal control and rate of deposition system of APCVD | MJ Smit 27 | P a g e
4.3.6 Write data to file
All the by the user specified values – i.e. the mass flows and phase times – are stored in one
text file using the code as shown in Figure 21.
The middle part of Figure 21 (the light-
yellow rectangular box) is used to combine
all the incoming strings into one piece of
text which is subsequently written to a text
file.
Just below the incoming signals the part of
the code is found that saves the process
temperature.
The lower part of the code, below the ‘Date
and time’ string, specifies the path to the
folder in which the results are saved and the
name of the file. This part of the code
included a case structure which determines
the name of file. If the option ‘Save as:’ on
the UI is turned OFF, the file will be saved as
the date and time the process has been
carried out. If the option is turned ON the
file will be saved as the name specified in
the field below ‘Save as:’ on the UI. When
no name is specified however and this
option is turned ON, the file will be saved as
the date and time the process has been
carried out. This is to prevent data
overwriting when the file is saved without a
name multiple times.
The file path – i.e. the path containing the folder in which the file will be saved – can be
selected by clicking on the ‘browse folder’ button next to the shown file path. For an example
of the saved text file, see Figure 22.
4.3.7 More information on the program
After the process has been finished a null sequence follows, which looks like the structure used
for sending the mass flow commands; see left structure in Figure 19. The null sequence sets all
three flows to zero after the deposition process is finished.
The serial port communication settings of the Deposition Control program are set to the
default settings of the MKS-416 device. In this way, when the device crashes and goes back to
its initial settings, the communication with the PC will not be affected. The port settings are as
follows: baud rate: 9600, data bits: 7 and parity: even.
Figure 21: Code for writing the process data to a text file
Thermal control and rate of deposition system of APCVD | MJ Smit 28 | P a g e
More contextual help on the different operation blocks used in the code for the deposition
control software can be found by using LabVIEW’s ‘context help’ which gives detailed
information on the function blocks used when scrolling over the code.
The Deposition Control program code does not contain any subVI’s and hence the program’s
code is all stored in just this one file as depicted in Figure 15.
4.3.8 How to use the program for a CVD process
The user guide of how to use the Deposition Control program for a CVD process can be found
in Appendix 2: Deposition Control user guide.
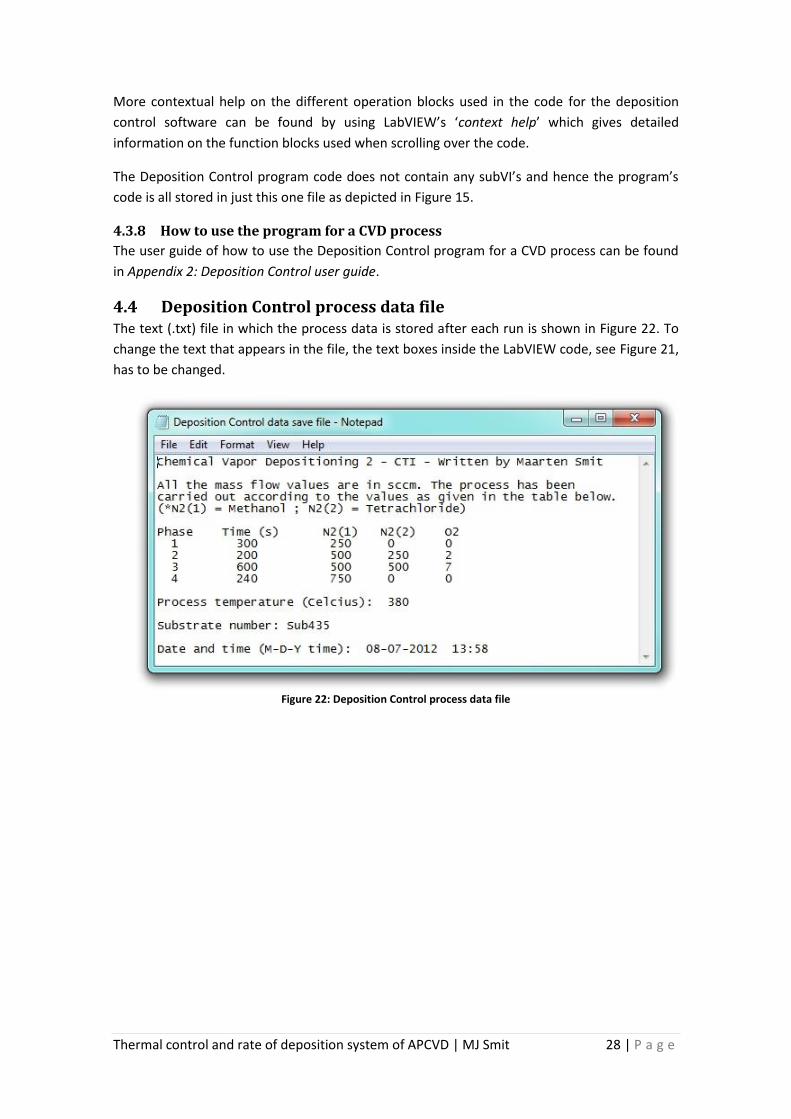
4.4 Deposition Control process data file The text (.txt) file in which the process data is stored after each run is shown in Figure 22. To
change the text that appears in the file, the text boxes inside the LabVIEW code, see Figure 21,
has to be changed.
Figure 22: Deposition Control process data file

Thermal control and rate of deposition system of APCVD | MJ Smit 29 | P a g e
5. APCVD Reactor test runs After assembly of the control box, connection to the rest of the equipment and installation of
the Deposition Control software, several test runs have been carried out. These test runs
provide some important information on the process and equipment used. Several important
aspects will be discussed here.
5.1 Deposition process parameters The parameters of the deposition process that has been carried out for testing purposes are
shown in Table 1.
Table 1: Deposition test run process parameters
Phase Time (min) Methanol (sccm) Tetrachloride (sccm) Oxygen (sccm)
1 5:00 500 0 0
2 3:00 250 750 0
3 1:00 500 0 0
4 - - - -
Process temperature: 380ᵒC
As can be seen this trial run is a 3-phase deposition process and no oxygen is used; this is done
to mimic the deposition process with the old reactor from which the results are known and can
hence be compared.
5.2 MFCs zero value and calibration
5.2.1 MFCs zero value
The MFCs show a (small) inaccuracy when their value is set to zero. In operation mode the
MFCs report their values as set in the Deposition Control program with a slight inaccuracy of
around ±0.5 sccm. However when the MFCs are set to zero all three of them show different
inaccuracies:
Methanol zero value: +20 to +70 sccm (temperature dependent)
Tetrachloride zero value: 0±1.0 sccm
Oxide zero value: -1±0.02 sccm
In the current reactor settings, the zero values of the mass flow meters are good. The fact that
the methanol stream is always positive, even when set to zero, is no problem since the
methanol is actually used in every phase with a flow value higher than the zero value. Also the
methanol is used to purge the reactants from the reaction chamber; hence a small constant
stream of methanol is not harmful.
The tetrachloride stream is completely shut down when set to zero, which is very important
since the flow of tetrachloride determines the reaction rate. The oxygen stream of -1±0.02
sccm, when set to zero, is harmless. However, when checked the stream turned out to be
slightly positive instead of negative.
Thermal control and rate of deposition system of APCVD | MJ Smit 30 | P a g e
5.2.2 Calibration of the MFCs
Since the zero values of the oxygen and methanol stream are not exactly zero, this yields that
their mass flows when set to a certain other value, e.g. during the process, might not be
accurate too. It is therefore highly recommended that the sensors are calibrated for better
control of the deposition process.
5.3 Temperature control
5.3.1 Heating time
The total heating time of the substrate’s support takes about 90 minutes to reach a
temperature of 380ᵒC from a start temperature of 20ᵒC. The heating time is quite high and it is
observed that the heating goes much faster when the door of the furnace is left open instead
of closed. For comparison, the heating time of the old reactor is about 60 min. The long
heating time is of course related to the power of the heating element but it is also a result of
the temperature control as will be discussed in Chapter 5.3.3.
5.3.2 Temperature drop
During the process the temperature dropped from 380 to 350ᵒC on average, which is about
10% of the process temperature. The temperature should increase again as soon as it drops
below 380ᵒC and the heat dissipation inside the furnace (reactor) is small enough for the
heater to be able to counteract the temperature drop. In other words, there is no reason for
the temperature to drop as much as it does if the system was correctly controlled.
5.3.3 PID temperature control
The temperature is controlled by the COEL HW1440 temperature controller which uses a PID
controller to determine the corrective action if the temperature deviates from the set-point.
The PID controller’s parameters are calibrated according to a certain temperature inertia of
the system, which is different for every system and dependent on the equipment used; hence
this determines how appropriate a controller is for the system considered.
Since the HW1440 temperature controller has been used for another system before, the PID is
most likely not calibrated to suit the current system. Even though eventually the controller will
correct any deviations from the set-point temperature, the corrective actions will be much
faster and accurate when the PID parameters are calibrated to suit the current system.
5.4 Substrate thermoshock After the substrate’s support is heated to about 380ᵒC, the substrate is placed inside the
reaction chamber directly on the stainless steel support. As was quite expected however, after
a few seconds the glass substrate just breaks due to a thermoshock. The temperature
difference between the substrate’s support and the substrate itself is too big and the sudden
increase of temperature results in a rapid thermal expansion the material cannot cope with.
Thermal control and rate of deposition system of APCVD | MJ Smit 31 | P a g e
5.5 Results
5.5.1 General
The test runs showed that the reactor and all the equipment works as planned. The following
can be concluded:
The system is airtight (there is no, or very little, gas leakage)
The temperature control works properly (aside from the PID settings)
The rotational motor control works properly
Mass flow control works properly
The Deposition Control program works properly
Power ON/OFF works properly
The APCVD process can be carried out using this reactor
Aside from the fact that everything works properly and deposition processes can be carried
out using this reactor, there are a few issues that need to be improved as will be discussed
below and in Chapter 6.
5.5.2 deposition layer distribution
Since the deposited film is semi-conducting, its thickness can be determined measuring
the conductivity of the material. After several measurements it is concluded that the thickness
lies within the right range, as was expected with the used process parameters, but it is not
uniform across the surface. This non-uniform layer thickness implies a non-uniform
temperature distribution across the substrate, an inhomogeneous vapor mixture inside the
reaction chamber, forces flow layer growth chamber or all of the above.
5.5.3 Vapor mixture
It is observed that at the top of the reaction chamber where the two streams (methanol and
) enter, a white crystalline powder is formed which might imply the reaction of
with water [9]. The crystals are caught by the gas flow interference plateau, see Figure 6, and
do hence not contaminate the substrate. However, the formation of the crystals is not desired.
It is also observed that the flow is not homogeneously distributed across the reaction
chamber; this can actually be seen with the naked eye.
5.6 System improvements After the first few test runs with the new reactor, several changes have been made to the
process and/or equipment for improved functioning.
5.6.1 Substrate thermoshock
The effect of the thermoshock has been counteracted by using a small carbon support for the
substrate as to decrease the rate of heat transfer when placed in the reaction chamber. With
the lower rate of heat transfer it will take a little while longer to get the substrate to the
required process temperature, but the substrate will not suffer from a thermoshock anymore
which is essential. The estimated time it takes for the substrate to reach the process
temperature is about 5 minutes.
Thermal control and rate of deposition system of APCVD | MJ Smit 32 | P a g e
5.6.2 Thermocontrol PID parameters
Since the temperature control of the system was not optimal during the first settings, the PID
controls of the HW1440 have been tuned to suit the system and so to improve the
temperature control of the CVD process. After calibration the P, I and D values of the PID
controller are respectively 0.2, 127 and 19. Using these values the temperature characteristics
of the process are as follows:
Heating time (from 20ᵒC to 360ᵒC): 50 min
Temperature drop during process: 0 ᵒC
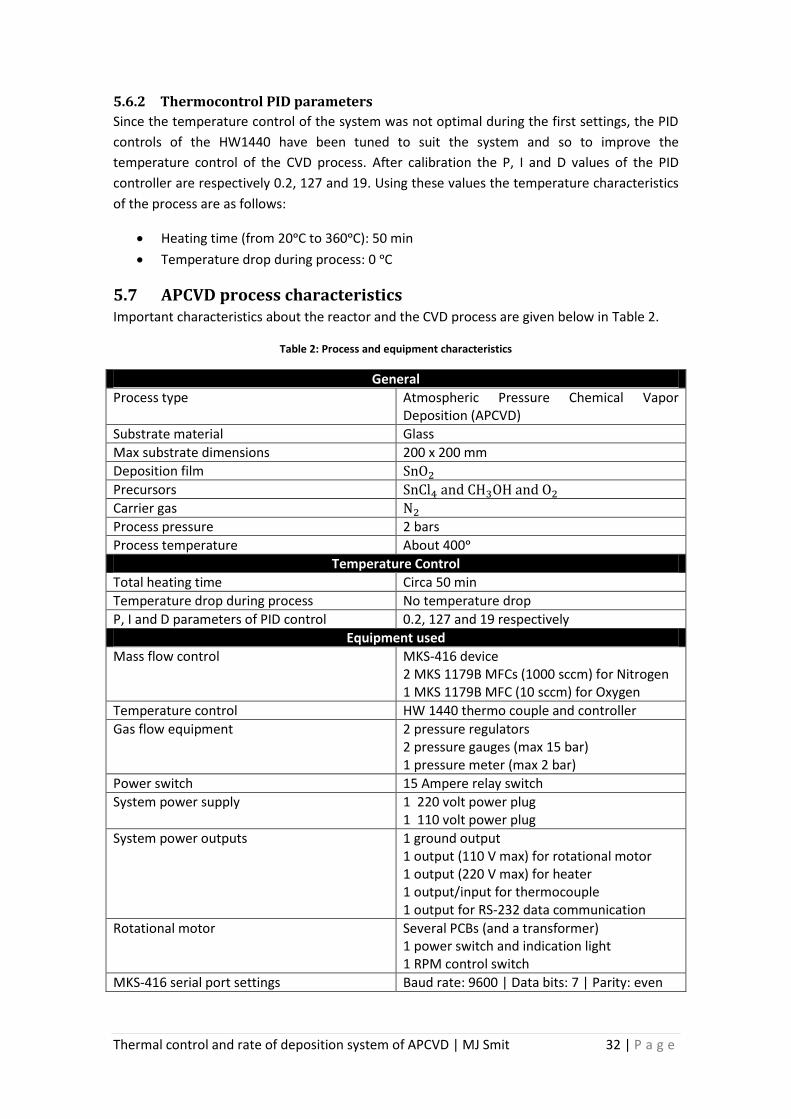
5.7 APCVD process characteristics Important characteristics about the reactor and the CVD process are given below in Table 2.
Table 2: Process and equipment characteristics
General
Process type Atmospheric Pressure Chemical Vapor Deposition (APCVD)
Substrate material Glass
Max substrate dimensions 200 x 200 mm
Deposition film
Precursors
Carrier gas Process pressure 2 bars
Process temperature About 400ᵒ
Temperature Control
Total heating time Circa 50 min
Temperature drop during process No temperature drop
P, I and D parameters of PID control 0.2, 127 and 19 respectively
Equipment used
Mass flow control MKS-416 device 2 MKS 1179B MFCs (1000 sccm) for Nitrogen 1 MKS 1179B MFC (10 sccm) for Oxygen
Temperature control HW 1440 thermo couple and controller
Gas flow equipment 2 pressure regulators 2 pressure gauges (max 15 bar) 1 pressure meter (max 2 bar)
Power switch 15 Ampere relay switch
System power supply 1 220 volt power plug 1 110 volt power plug
System power outputs 1 ground output 1 output (110 V max) for rotational motor 1 output (220 V max) for heater 1 output/input for thermocouple 1 output for RS-232 data communication
Rotational motor Several PCBs (and a transformer) 1 power switch and indication light 1 RPM control switch
MKS-416 serial port settings Baud rate: 9600 | Data bits: 7 | Parity: even

Thermal control and rate of deposition system of APCVD | MJ Smit 33 | P a g e
6. Recommendations and further research After carrying out the project as described in this report, several recommendations will be
made based upon encountered problems or difficulties as to improve the performance of the
CVD process and research for future use.
Temperature distribution
The temperature distribution across the substrate is not optimal in the current situation –
though better than in the old reactor. It is recommended that the temperature distribution is
measured and the substrate’s support is slightly altered so to make the temperature
distribution more even; i.e. changes in the stainless steel support such as thickness variation
determines the rate of heat flow and hence the temperature distribution across the substrate.
Homogeneity of the gas mixture
The gas mixture inside the reaction chamber is not yet optimal, as has been noticed during the
test runs. Research should be done to determine how to optimize the gas mixture
homogeneity. This can either be done using computational fluid dynamics numerical models
(recommended) or by trying to change the flow in practice. A possible solution, for example, is
using a showerhead like unit in the top of the reaction chamber to disperse the gas flows and
improve their mixture and homogeneity.
Reactor tools and equipment
Currently the placement or removal of the substrate inside/from the reaction chamber is hard
since the correct tools are not present. Also, when opening the reaction chamber, there is no
support to leave the glass dome (top of the reaction chamber). The correct tools and support
for the glass dome should be realized to prevent unnecessary accidents from happening.
Chemical process and influences
Research should be carried out to determine what factors influence the CVD process so a
better control on the rate of deposition and hence the process can be obtained. Currently the
chemical process occurring is not fully understood yet, but it is known that several factors
influence the rate of deposition. Experiments should be carried out to determine the factors
the process depends on.
Calibration of MFCs
The MFCs should be calibrated to assure their proper functioning. In the current situation the
MFCs are functioning with certain inaccuracies, affecting the CVD process; see Chapter 5.2.
Calibration of the MFCs would yield a better control of the process.
Mechanical friction and control of rotational motor
The mechanical friction in the rotational motor and heater equipment sometimes blocks the
rotational movement and thus affecting the CVD process. Whether the rotational control or
the mechanical friction is the main cause, or both, it is recommended tot sort this out and
solve this.

Thermal control and rate of deposition system of APCVD | MJ Smit 34 | P a g e
Appendices
Thermal control and rate of deposition system of APCVD | MJ Smit 35 | P a g e
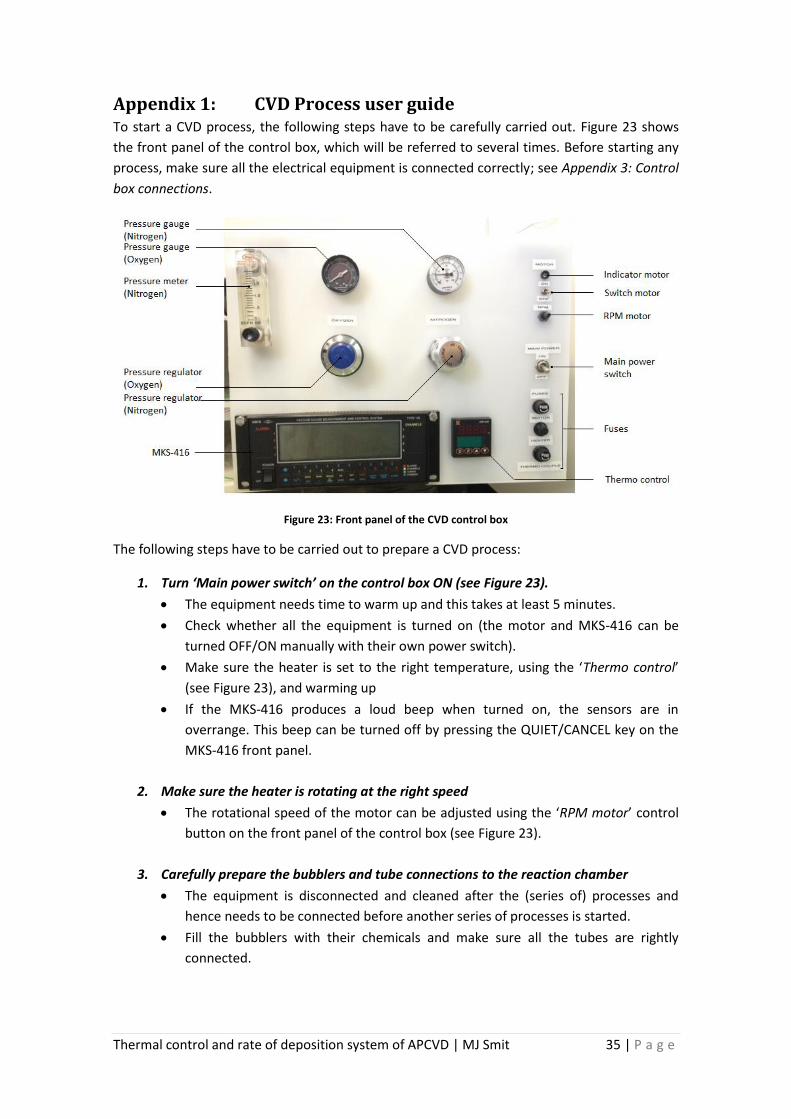
Appendix 1: CVD Process user guide To start a CVD process, the following steps have to be carefully carried out. Figure 23 shows
the front panel of the control box, which will be referred to several times. Before starting any
process, make sure all the electrical equipment is connected correctly; see Appendix 3: Control
box connections.
Figure 23: Front panel of the CVD control box
The following steps have to be carried out to prepare a CVD process:
1. Turn ‘Main power switch’ on the control box ON (see Figure 23).
The equipment needs time to warm up and this takes at least 5 minutes.
Check whether all the equipment is turned on (the motor and MKS-416 can be
turned OFF/ON manually with their own power switch).
Make sure the heater is set to the right temperature, using the ‘Thermo control’
(see Figure 23), and warming up
If the MKS-416 produces a loud beep when turned on, the sensors are in
overrange. This beep can be turned off by pressing the QUIET/CANCEL key on the
MKS-416 front panel.
2. Make sure the heater is rotating at the right speed
The rotational speed of the motor can be adjusted using the ‘RPM motor’ control
button on the front panel of the control box (see Figure 23).
3. Carefully prepare the bubblers and tube connections to the reaction chamber
The equipment is disconnected and cleaned after the (series of) processes and
hence needs to be connected before another series of processes is started.
Fill the bubblers with their chemicals and make sure all the tubes are rightly
connected.

Thermal control and rate of deposition system of APCVD | MJ Smit 36 | P a g e
4. Turn the Oxygen and Nitrogen flows on
Turn on the oxygen and nitrogen flows and check their pressures on the pressure
gauges (see Figure 23)
If necessary adjust the pressures using the pressure regulators (see Figure 23)
5. Check the nitrogen purge flow to the airtight box
Make sure a small purge stream is flowing to the airtight box, the stream can be
controlled using the ‘Pressure meter (nitrogen)’ (see Figure 23).
6. Make sure the temperature is stabilized at the specified value
7. Make sure the MFCs are stabilized before starting the CVD process!
If the MFCs are not warmed up enough yet, their value has not stabilized. If not
stabilized, wait a few more minutes before starting the process. ( is stabilized
around -1 sccm; around 0 sccm and methanol around 20 to 50 sccm)
8. Carefully place the substrate inside the reaction chamber
Make sure the substrate’s surface is clean and placed on the carbonate support to
prevent it from breaking due to a thermoshock. If the surface is not clean, this will
affect the final result of the deposited film.
9. Start the process by going through the ‘Deposition Control user guide’

Thermal control and rate of deposition system of APCVD | MJ Smit 37 | P a g e
Appendix 2: Deposition Control user guide Here the steps of how to use the Deposition Control program to control the mass flows of the
CVD process will be discussed so anyone is able to use the program. The UI is depicted in
Figure 24; which will be referred to multiple times in this guide. Before using the program,
make sure all the equipment of the CVD process is ready to use and the MFCs and the heater
are warmed up (see CVD Process user guide).
Figure 24: User Interface (UI) of Deposition Control program
The following steps have to be carried out to start a CVD process
1. Turn on the computer and log in
2. Double click (open) the shortcut to the Deposition Control program
LabVIEW 8.5 is opened and the UI as shown in Figure 24 pops up.
3. Press the RUN button in LabVIEW or press CNTR+R.
The program starts measuring the MFC mass flows. If the mass flow values are not
shown in the indicators (see Figure 24, the program is not running!)
4. Fill in the values for the process time in every phase
The time can be entered manually or set by using the up and down buttons next to
the time fields. The left field is for the minutes, the right field for the seconds.
5. Fill in the mass flow values of the different streams in every phase
The mass flows are manually set for every phase, in sccm. Fill in 0 if you don’t use a
stream or if the stream needs to be zero.
6. Fill in the process temperature and substrate number
Thermal control and rate of deposition system of APCVD | MJ Smit 38 | P a g e
7. Indicate if you want to save the process data in a file with a specified file name
The process data is ALWAYS saved. If the button ‘Specify own file name’ (see
Figure 24) is turned OFF, the file is saved as the time and date the experiment is
carried out.
If you want to save the process data in a file with an own specified name, click the
‘Specify own file name’ so it says ON and turns green. Now enter you file name in
the box under ‘Save as:’.
8. Specify the folder in which you want to save the file
The box underneath ‘Save in folder:’ (see Figure 24) shows the path to the folder in
which the file will be saved. By clicking the ‘browse folder’ button next to the
shown path, a destination folder can be selected in a popup menu.
9. To start the process click the START button
To start the CVD process, press the START button on the UI. The UI will show that
the process is running as long as the ‘Process Ready’ indicator (see Figure 24) is still
dark green. Also the time indicators are running.
10. Process ready
The CVD process is ready when the ‘Process Ready’ indicator (see Figure 24) turns
from dark green to light green and the text ‘READY’ is clearly visible.
11. Stop process
If the process is ready ALWAYS click the ‘General STOP’ button (see Figure 24),
even if you want to carry out another CVD process.
12. Start new process
To start a new process, repeat steps 3 to 11 if the Deposition Control program is
still opened.
IMPORTANT NOTES:
1. After a process is finished and the substrate removed from the reaction chamber,
allow the substrate to cool down by waiting a few minutes. After the substrate is
removed and another substrate is placed, the process can be started again.
2. Always check whether the temperature is stabilized or not, do not start the process if
the temperature is not yet stabilized at the specified value.
3. If the process is to be stopped during operation, press the stop button. The mass
flows are automatically set to zero and the process is stopped.
4. If 3 or less phases are desired, just fill in the data for the first few phases. The values
of the phases left out can be set to zero or be left empty.
5. The file path – the path containing the folder in which the file will be saved – can
only be changed in the LabVIEW code, not on the UI.
Thermal control and rate of deposition system of APCVD | MJ Smit 39 | P a g e
Appendix 3: Control box connections The control box has several connections to other devices which will be discussed here. In order
to start a CVD process, the following connections have to be checked and be right.
1. RS-232 between computer and MKS-416 device
To realize data communication and process control via the PC, the RS-232 cable
has to be connected.
2. Power plugs of the control box
The control box uses two power plugs (one of 110V and one of 220V).
3. Heater power
The power of the heater is controlled by the control box. The heater is connected
to the power socket at the back of the control box.
4. Motor power
The power of the rotational motor is controlled by the control box. The motor is
connected to the power socket at the left side of the control box (black and red
output).
5. Electrical ground of the external equipment
The external equipment (heater and motor) is connected to the electrical ground
using the ground output at the left side of the control box (green output).
6. Thermocouple
The thermocouple is connected to the box at the left side of the control box (black
input).
7. Oxygen and nitrogen input
The oxygen and nitrogen inputs are connected to the control box at the back of
the control box.
8. Gas flow outputs
The two nitrogen streams and the oxygen stream connections are found at the
back of the box.

Thermal control and rate of deposition system of APCVD | MJ Smit 40 | P a g e
Appendix 4: Troubleshooting Several possible errors or problems that can be encountered while using the equipment and
Deposition Control program will be treated here and are as follows; see Table 3.
Table 3: Troubleshooting equipment errors
Error Possible cause Corrective action
Deposition Control software does not read the mass flows
Mass flow meters are not correctly connected to MKS 416 device (see MKS 416 error E0)
Check the connections and make sure the plugs are connected correctly
RS 232 cable is not connected correctly
Check the connection of the RS 232 cable to the PC and the MKS 416
Wrong communication port selected in Deposition Control software
Try to change the communication port and try to run the program again
Communication port settings of the MKS 416 and DC program do not match
Check the port setting of the MKS 416 (see page 221 of MKS 416 manual) and the settings of the DC program (see Chapter 4.3.2)
MKS 416 error E0 (shown on front panel of MKS 416 and/or on Deposition Control program)
Disconnected sensor (MFC controller)
Check the connections and make sure the plugs are connected correctly.
MKS 416 error E12 (shown on front panel of MKS 416 and/or on Deposition Control program)*
System recovery failure. Turn the MKS 416 ON and OFF and run the Deposition program again. If this does not work, check the MKS communication port settings and make sure these values match the DC program values.
Thermocontrol OPEN message on HW1440 display
One or both of the thermocouple wires is not connected
Check the connection of the thermocouple to the control box
Heater does not start (temperature does not increase)
Temperature set point is not set correctly
Check the temperature set point and set again
Heater plug is not connected to the control box
Check the connection (back of the control box)
Rotational motor does not work
Motor plugs are not connection correctly
Check the connection of the power plugs (left side of control box)
Too much mechanical friction in the equipment
Manually try to overcome the friction and the movement will start.
Equipment does not work Fuses are blown Check the fuses (front panel of control box)
Power switch does not work Power plugs are not connected
Check the connection of the 2 power plugs.
*For more error/status messages of the MKS 416, see page 307 and further of the manual [3].
Thermal control and rate of deposition system of APCVD | MJ Smit 41 | P a g e
References
1. MOL, A.M.B. van (2003). Chemical Vapour Deposition of Tin Oxide Thin Films. Technical
University Eindhoven, The Netherlands.
2. OHRING, M. (1992). The Materials Science of Thin Films. Academic Press, 2nd edition.
3. MKS Type 146C Cluster Gauge Vacuum Gauge Measurement and Control System. MKS
Instruments, Inc. (2000) (MKS 416 Manual)
4. Controlador e indicador de temperature microprocessado modelo HW1440. Coel
(1999). (Instruction manual for thermocontrol)
5. DHERE, R.G. et al. (1998). Characterization of SnO2 Films Prepared Using Tin
Tetrachloride and Tetra Methyl Tin Precursors. National Renewable Energy Laboratory,
USA.
6. JEONG, J., CHOI, S.P. and HONG, K.J. (2006). Structural and Optical Properties of SnO2
Thin Films Deposited by Using CVD Techniques. Journal of the Korean Physical Society
(Vol. 48, No. 5, May 2006, pp. 960-963).
7. BARANAUSKAS, V. and SANTOS, T.E.A. et al. (2002). Analysis of nanocrystalline
coatings of tin oxides on glass by atomic force microscopy. CTI, Brazil. (Elsevier, Sensors
and Actuators, B 85, pp. 90-94)
8. TimeDomain CVD, Inc. (-). Funcamentals of CVD. Available:
http://www.timedomaincvd.com/CVD_Fundamentals/introduction/generic_CVD_reac
tor.html. Last accessed 30th July 2012.
9. LIDE, D.R. (1997). Handbook of Chemistry and Physics 77th ed. National Institute of
Standards and Technology, USA.