Embed Size (px)
Citation preview
THERMAL CONDUCTIVITY OF PEACH, RASPBERRY, CHERRYAND PLUM JUICES AS A FUNCTION OF TEMPERATURE
AND CONCENTRATION
MIKAIL A. MAGERRAMOV1, AZIZ I. ABDULAGATOV2,ILMUTDIN M. ABDULAGATOV4 and NAZIM D. AZIZOV3
1Azerbaijan State Economic University, Az 1001 Baku,Istiglaliayt Str. 31, Azerbaijan
2Institute of Physics of the Dagestan Scientific Center of theRussian Academy of Sciences,
367003 Makhachkala, Shamilya Str. 39-A,Dagestan, Russia
3Azerbaijan State Oil Academy,Baku, 370601, Azerbaijan
Accepted for Publication March 9, 2006
ABSTRACT
The thermal conductivity (k) of four fruit juices (peach, raspberry, cherryand plum) was measured using a coaxial-cylinder (steady-state) technique.Measurements were made in the temperature range from 20 to 120C and arange of concentration between 9.8 and 60.0°Brix. The total uncertainties ofthe k and temperature measurements were less than 2% and 0.03C, respec-tively. The reliability and accuracy of the experimental methodology for fruitjuices was confirmed with measurements on pure water. The experimental andcalculated values of k of pure water showed excellent agreement within theirexperimental uncertainty. The effect of temperature and concentration on thek of peach, raspberry, cherry and plum juices was evaluated. The predictivecapability of various polynomial models was established.
INTRODUCTION
Accurate thermal conductivity (k) data for fruit juices and their variationwith operating conditions (over wide temperature and concentration regions)
4 Corresponding author: I.M. Abdulagatov, Physical and Chemical Properties Division, NationalInstitute of Standards and Technology, 325 Broadway, Boulder, CO 80305, U.S.A. TEL: (303)497–4027; FAX: (303) 497–5224; EMAIL: [email protected]
Journal of Food Process Engineering 29 (2006) 304–326. All Rights Reserved.© 2006, The Author(s)Journal compilation © 2006, Blackwell Publishing
304

are needed for a variety of research and engineering applications (developingfood processes and processing equipment, the control of products, filters andmixers, quality evaluation and an understanding of the structure of food andraw agricultural materials) in many branches of the food industry. Modeling,optimization and automation of food processes is difficult because of thecomplexity of the raw materials and product involved, which affect thermo-physical properties such as density, viscosity, Cp and k.
The k of fruit juices exhibits substantial changes with concentration andtemperature during processing (storage, transport, marketing and consump-tion, chilled, change temperature, tank farm change concentration and evapo-rator change concentration; see Moressi and Spinosi [1980] and Crandall et al.[1982]). For this reason, the k and other thermophysical properties (density,heat capacity [Cp], viscosity and thermal diffusivity [a]) should be studied asa function of temperature and concentration. Little is known about the effect oftemperature and concentration on the k of liquid foods. Thus, there is greatpractical interest in the study of the effect of temperature and concentration onk of fruit juices at equipment-operating conditions. Other thermophysicalproperties such as a and Cp can be estimated from k measurements. Unfortu-nately, the k of food products cannot be accurately predicted theoretically,because of their complicated physical and chemical structures. Therefore, theaccurate measurement of k of juices is needed. The available theoreticalmodels for liquids cannot describe complex real systems as they meet inpractice. Better prediction models can be developed based on reliable experi-mental information on k.
The k of liquid foods was reviewed by Qashou et al. (1972), Cuevas andCheryan (1978) and Choi and Okos (1983a, 1986a). A survey of the literaturereveals the scarcity of reliable experimental k data for liquid foods. Previously,the k data of fruit and vegetable juices have been reported by several authors(Riedel 1949; Khelemshi and Zhadan 1963; Woodams 1965; Voitko et al.1967; Dickerson 1968; Reidy 1968; Choi and Okos 1983b; Ziegler and Rizvi1985; Constenla et al. 1989; Lau et al. 1992; Gratão et al. 2005). Differenttechniques (for steady-state: guarded parallel-plate, concentric-cylinder andconcentric-sphere; for transient: heating and cooling curve, probe and fitch)have been used to measure the k of various juices. Reviews of the methods fork measurements of foods include Mohsenin (1980), Choi and Okos (1983a)and Jowitt et al. (1983). However, most existing k measurements for fruitjuices are at room temperature and very limited concentration range.
A literature survey revealed that there are no experimental k data availablefor peach, cherry, plum and raspberry juices, except for a few data pointsreported by Riedel (1949) for cherry and raspberry juices at temperatures of 20and 80C and at 89% mass concentration. Measurements were made by usingthe concentric-cylinder method. Sweat and Haugh (1974) used a probe method
305THERMAL CONDUCTIVITY OF FRUIT JUICES
to measure the k of cherry tomato at room temperature. Constenla et al. (1989)reported the k data for apple juice as a function of concentration and tempera-ture in the range from 20 to 90C and at concentrations between 12 and70°Brix. Choi and Okos (1983b) reported the k data for tomato juice over awide temperature range of 30 to 150C and at concentrations between 40.0 and95.2% of the mass. More recently, Gratão et al. (2005) reported the k ofpassion juice. These measurements were made using the concentric-cylindertechnique in the concentration range from 0.506 to 0.902 mass fractions ofwater content and at temperatures from 0.4 to 68.8C. The results were corre-lated using a simple linear polynomial function.
The k is one of the more difficult properties to measure because ofconvection (Wakeham et al. 1991). This article presents the first study of themeasurement of k for selected juices over a wide range of temperatures andconcentrations. The main objective was to provide a new and accurate experi-mental k data for four fruit juices at temperatures between 20 and 120C and atconcentrations up to 60°Brix using a coaxial-cylinder (steady-state) technique,previously shown to produce accurate measurements on other liquids (waterand aqueous solutions) at high temperatures and high pressures (Abdulagatovet al. 2004a,b; Abdulagatov and Azizov 2005). Another objective was todevelop prediction models for the k of fruit juices as a function of temperatureand concentration.
MATERIALS AND METHODS
The four experimental samples of cherry, peach, plum and raspberryjuices were obtained from fresh full-ripe fruits from a processing plant inBaku, Azerbaijan. The natural juices were obtained by squeezing the fruitswith a laboratory screw press, eliminating the suspended solids by filtering andclarifying. Concentrated juices with various soluble solids contents wereobtained from the original concentrate using a rotary glass vacuum evaporator(SPT-200, Zeamil-Horyzont, Krakow, Poland) at temperature below 60C. Theevaporation chamber was rotated at a constant rotational speed in a water bathat 40C. The soluble solids content was measured in °Brix using a universallaboratory refractometer (RLU-1, Ekaterinburg, Russia) at room temperature(20C). In order to adjust the concentration of the juice, the concentrated juicewas diluted with distilled water. The samples were stored in a glass vessel at2–4C until use (8 h) for the k measurements.
The physical and chemical characteristics of juices were measured in thechemical laboratory of the State Research Institute of Horticultural andSubtropical Crops, Baku, Azerbaijan. The microelements, potassium, calcium,magnesium and phosphates were determined using an atomic absorption
306 MIKAIL A. MAGERRAMOV ET AL.
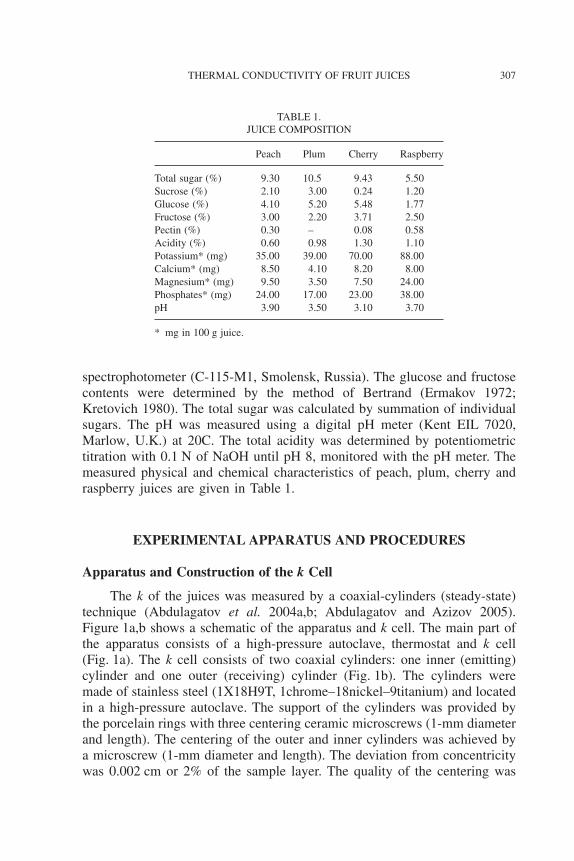
spectrophotometer (C-115-M1, Smolensk, Russia). The glucose and fructosecontents were determined by the method of Bertrand (Ermakov 1972;Kretovich 1980). The total sugar was calculated by summation of individualsugars. The pH was measured using a digital pH meter (Kent EIL 7020,Marlow, U.K.) at 20C. The total acidity was determined by potentiometrictitration with 0.1 N of NaOH until pH 8, monitored with the pH meter. Themeasured physical and chemical characteristics of peach, plum, cherry andraspberry juices are given in Table 1.
EXPERIMENTAL APPARATUS AND PROCEDURES
Apparatus and Construction of the k Cell
The k of the juices was measured by a coaxial-cylinders (steady-state)technique (Abdulagatov et al. 2004a,b; Abdulagatov and Azizov 2005).Figure 1a,b shows a schematic of the apparatus and k cell. The main part ofthe apparatus consists of a high-pressure autoclave, thermostat and k cell(Fig. 1a). The k cell consists of two coaxial cylinders: one inner (emitting)cylinder and one outer (receiving) cylinder (Fig. 1b). The cylinders weremade of stainless steel (1X18H9T, 1chrome–18nickel–9titanium) and locatedin a high-pressure autoclave. The support of the cylinders was provided bythe porcelain rings with three centering ceramic microscrews (1-mm diameterand length). The centering of the outer and inner cylinders was achieved bya microscrew (1-mm diameter and length). The deviation from concentricitywas 0.002 cm or 2% of the sample layer. The quality of the centering was
TABLE 1.JUICE COMPOSITION
Peach Plum Cherry Raspberry
Total sugar (%) 9.30 10.5 9.43 5.50Sucrose (%) 2.10 3.00 0.24 1.20Glucose (%) 4.10 5.20 5.48 1.77Fructose (%) 3.00 2.20 3.71 2.50Pectin (%) 0.30 – 0.08 0.58Acidity (%) 0.60 0.98 1.30 1.10Potassium* (mg) 35.00 39.00 70.00 88.00Calcium* (mg) 8.50 4.10 8.20 8.00Magnesium* (mg) 9.50 3.50 7.50 24.00Phosphates* (mg) 24.00 17.00 23.00 38.00pH 3.90 3.50 3.10 3.70
* mg in 100 g juice.
307THERMAL CONDUCTIVITY OF FRUIT JUICES
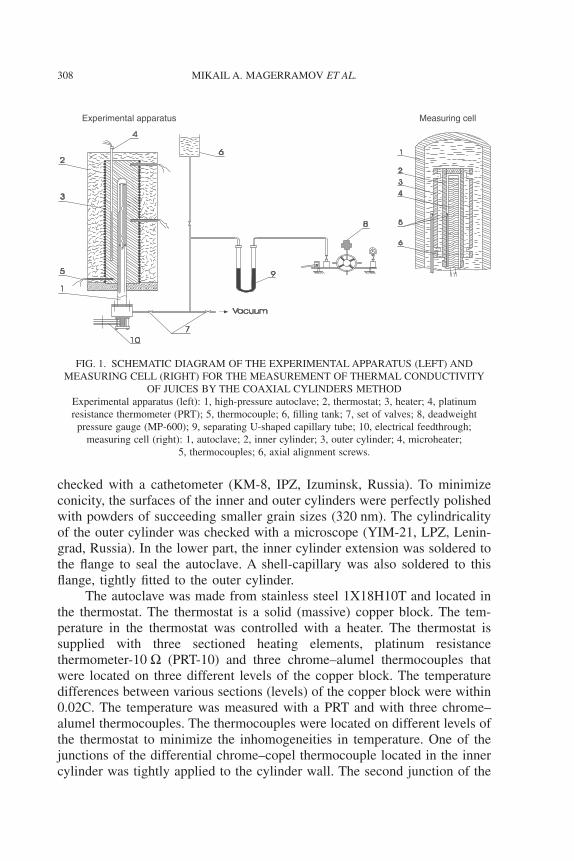
checked with a cathetometer (KM-8, IPZ, Izuminsk, Russia). To minimizeconicity, the surfaces of the inner and outer cylinders were perfectly polishedwith powders of succeeding smaller grain sizes (320 nm). The cylindricalityof the outer cylinder was checked with a microscope (YIM-21, LPZ, Lenin-grad, Russia). In the lower part, the inner cylinder extension was soldered tothe flange to seal the autoclave. A shell-capillary was also soldered to thisflange, tightly fitted to the outer cylinder.
The autoclave was made from stainless steel 1X18H10T and located inthe thermostat. The thermostat is a solid (massive) copper block. The tem-perature in the thermostat was controlled with a heater. The thermostat issupplied with three sectioned heating elements, platinum resistancethermometer-10 W (PRT-10) and three chrome–alumel thermocouples thatwere located on three different levels of the copper block. The temperaturedifferences between various sections (levels) of the copper block were within0.02C. The temperature was measured with a PRT and with three chrome–alumel thermocouples. The thermocouples were located on different levels ofthe thermostat to minimize the inhomogeneities in temperature. One of thejunctions of the differential chrome–copel thermocouple located in the innercylinder was tightly applied to the cylinder wall. The second junction of the
Measuring cellExperimental apparatus
FIG. 1. SCHEMATIC DIAGRAM OF THE EXPERIMENTAL APPARATUS (LEFT) ANDMEASURING CELL (RIGHT) FOR THE MEASUREMENT OF THERMAL CONDUCTIVITY
OF JUICES BY THE COAXIAL CYLINDERS METHODExperimental apparatus (left): 1, high-pressure autoclave; 2, thermostat; 3, heater; 4, platinumresistance thermometer (PRT); 5, thermocouple; 6, filling tank; 7, set of valves; 8, deadweight
pressure gauge (MP-600); 9, separating U-shaped capillary tube; 10, electrical feedthrough;measuring cell (right): 1, autoclave; 2, inner cylinder; 3, outer cylinder; 4, microheater;
5, thermocouples; 6, axial alignment screws.
308 MIKAIL A. MAGERRAMOV ET AL.

thermocouple was located in the shell-capillary. The thermocouples weretwice calibrated with a standard resistance thermometer (manufactured inleningrad, and calibrated at the Russian Institute of Physical and TechnicalMeasurements, Moscow, Russia). The difference between calibrations was0.01C. The temperature-sensitive element of the thermocouple was locatedon the same level as the measuring cell. The reading of the single thermo-couples differed by ±0.01C. Measurements started when differences of read-ings among all the thermocouples were minimal (0.02C).
Geometrical Characteristics of the k Cell
The important dimensions of the k cell are: (1) outside diameter (o.d.)of the inner cylinder, d2 = (10.98 ± 0.01) ¥ 10-3 m; (2) inside diameter(i.d.) of the outer cylinder, d2 = (12.92 ± 0.02) 10-3 m; (3) the length of themeasuring section of the inner cylinder (emitter), l = (150.0 ± 0.1) ¥ 10-3 m;and (4) the gap between cylinders (thickness of the liquid gap),d = (0.97 ± 0.03) ¥ 10-3 m. The choice of this gap was a compromise betweendecreasing convection and accommodation effect. The acceptable value for thethickness of the liquid layer d is between 0.5 and 1.0 mm. If d � 1 mm, anatural convection of heat transfer will develop. The optimal ratio of l/d2
should be 10 to 15 (Kondrat’ev 1957). It is very difficult to keep the homo-geneity of the temperature distribution along the length of the inner cylinderwhen this ratio is greater than 15. If l/d2 � 10 the influence of the end effect issignificant.
The fruit juices under investigation were confined in the vertical gap ofthe cell. The k cell was filled with sample using the set of valves (Fig. 1a).Before filling, the cell was heated and evacuated. To fill the measuring cell(gap between cylinders) with test juice sample, slots of 2-mm width and25-mm length were made on the outer cylinder (3 mm from the end). Allconnecting tubes, including the filling unit and high-pressure U-shaped vessel,were made of stainless steel.
In the cell, heat was generated in the microheater (Fig. 1b), which con-sists of an isolated high-temperature lacquer-covered constantan wire of0.1-mm diameter. The microheater was mounted inside the inner cylinder(emitter), which was closely wound around the surface of a 2-mm diameterceramic tube and isolated with high-temperature lacquer. The tube was tightlyfitted inside a heater pocket of 6-mm diameter on the inner cylinder. All heaterswere made with 0.1-mm diameter constantan wire and isolated with high-temperature lacquer.
The electrical schema of the measurements consists of circuits of PRT,calorimetric heater, differential and single thermocouples. All electrical mea-surements were performed with compensation method using direct currentsemiautomatic potentiometers (P323/2).
309THERMAL CONDUCTIVITY OF FRUIT JUICES
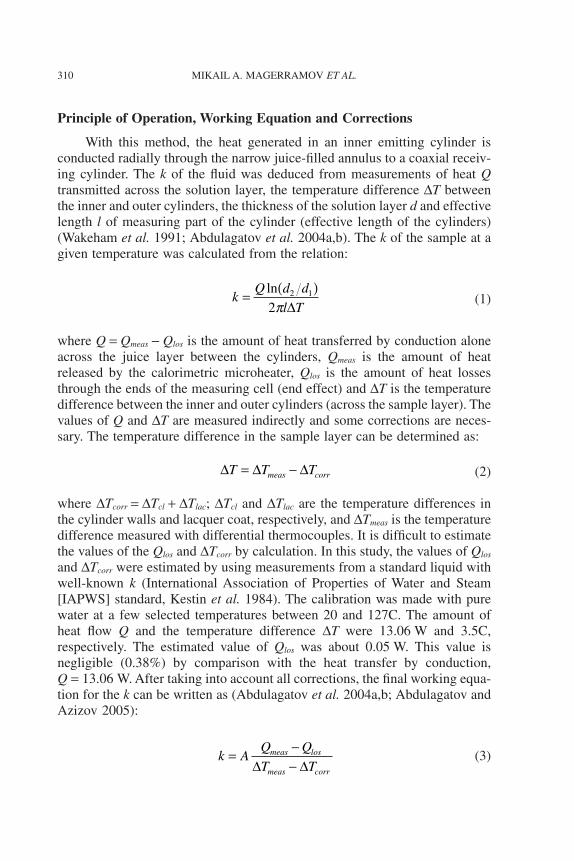
Principle of Operation, Working Equation and Corrections
With this method, the heat generated in an inner emitting cylinder isconducted radially through the narrow juice-filled annulus to a coaxial receiv-ing cylinder. The k of the fluid was deduced from measurements of heat Qtransmitted across the solution layer, the temperature difference DT betweenthe inner and outer cylinders, the thickness of the solution layer d and effectivelength l of measuring part of the cylinder (effective length of the cylinders)(Wakeham et al. 1991; Abdulagatov et al. 2004a,b). The k of the sample at agiven temperature was calculated from the relation:
kQ d d
l T= ( )ln 2 1
2p Δ (1)
where Q = Qmeas - Qlos is the amount of heat transferred by conduction aloneacross the juice layer between the cylinders, Qmeas is the amount of heatreleased by the calorimetric microheater, Qlos is the amount of heat lossesthrough the ends of the measuring cell (end effect) and DT is the temperaturedifference between the inner and outer cylinders (across the sample layer). Thevalues of Q and DT are measured indirectly and some corrections are neces-sary. The temperature difference in the sample layer can be determined as:
Δ Δ ΔT T Tmeas corr= − (2)
where DTcorr = DTcl + DTlac; DTcl and DTlac are the temperature differences inthe cylinder walls and lacquer coat, respectively, and DTmeas is the temperaturedifference measured with differential thermocouples. It is difficult to estimatethe values of the Qlos and DTcorr by calculation. In this study, the values of Qlos
and DTcorr were estimated by using measurements from a standard liquid withwell-known k (International Association of Properties of Water and Steam[IAPWS] standard, Kestin et al. 1984). The calibration was made with purewater at a few selected temperatures between 20 and 127C. The amount ofheat flow Q and the temperature difference DT were 13.06 W and 3.5C,respectively. The estimated value of Qlos was about 0.05 W. This value isnegligible (0.38%) by comparison with the heat transfer by conduction,Q = 13.06 W. After taking into account all corrections, the final working equa-tion for the k can be written as (Abdulagatov et al. 2004a,b; Abdulagatov andAzizov 2005):
k AQ Q
T Tmeas los
meas corr
= −−Δ Δ
(3)
310 MIKAIL A. MAGERRAMOV ET AL.
where Ad
dl= ⎛
⎝⎜⎞⎠⎟
ln 2
1
2p is the geometric constant, which can be determined
with the geometrical characteristics of the experimental cell. The values of Acan also be determined by means of a calibration technique using k data for thereference fluid (pure water, IAPWS standard, Kestin et al. 1984). The valuesof the cell constant determined both with geometrical characteristics of theexperimental cell and by calibration techniques (pure water at temperature20C) are 0.1727 m-1 and 0.1752 m-1, respectively. In this study, we used thevalue of A as a function of temperature derived using the calibration procedurewith pure water. The geometrical constant A changed by 12% over the tem-perature range from 20 to 477C. Because of the large emitter size and the smallfluid volume surrounding the emitter, no accommodation effect was to beexpected.
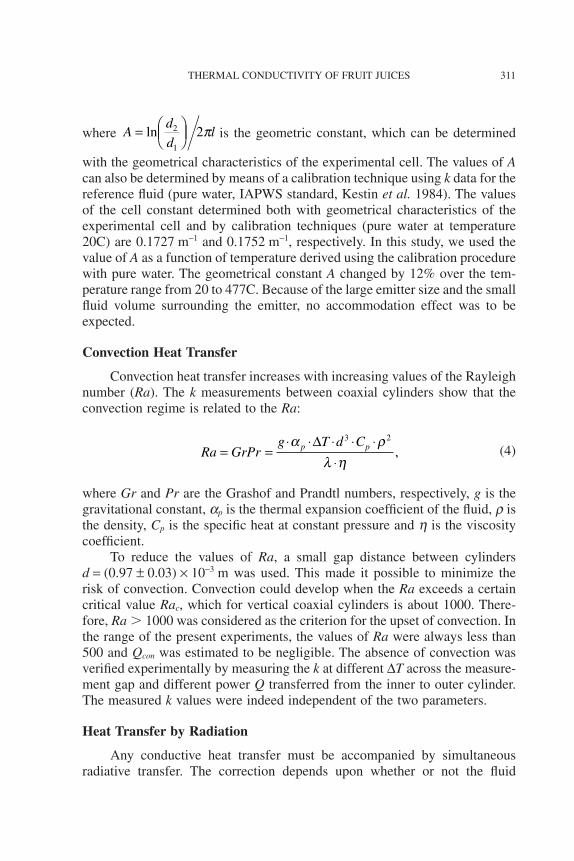
Convection Heat Transfer
Convection heat transfer increases with increasing values of the Rayleighnumber (Ra). The k measurements between coaxial cylinders show that theconvection regime is related to the Ra:
Ra Grg T d Cp p= =
⋅ ⋅ ⋅ ⋅ ⋅⋅
Pra r
l hΔ 3 2
, (4)
where Gr and Pr are the Grashof and Prandtl numbers, respectively, g is thegravitational constant, ap is the thermal expansion coefficient of the fluid, r isthe density, Cp is the specific heat at constant pressure and h is the viscositycoefficient.
To reduce the values of Ra, a small gap distance between cylindersd = (0.97 ± 0.03) ¥ 10-3 m was used. This made it possible to minimize therisk of convection. Convection could develop when the Ra exceeds a certaincritical value Rac, which for vertical coaxial cylinders is about 1000. There-fore, Ra � 1000 was considered as the criterion for the upset of convection. Inthe range of the present experiments, the values of Ra were always less than500 and Qcon was estimated to be negligible. The absence of convection wasverified experimentally by measuring the k at different DT across the measure-ment gap and different power Q transferred from the inner to outer cylinder.The measured k values were indeed independent of the two parameters.
Heat Transfer by Radiation
Any conductive heat transfer must be accompanied by simultaneousradiative transfer. The correction depends upon whether or not the fluid
311THERMAL CONDUCTIVITY OF FRUIT JUICES
absorbs radiation. If the juice is entirely transparent, then the conductive andradiative heat fluxes are additive and independent and usually negligible.When the juice absorbs and reemits radiation (partially transparent), theproblem is more complicated because the radiative and conductive fluxes arecoupled. In this case, effect heat transferred by radiation can be derived fromthe solution of the integro-differential equation describing coupled radiationand conduction. This problem is amenable to exact study only numerically.The approximate solution indicates that the magnitude of radiative contribu-tion to the heat flux depends on the characteristic of the juice for radiativeabsorption. This characteristic optical property of juice is seldom known sothat it is not possible to apply a correction for radiation routinely. There aresome situations under which some contribution from radiative transport isnegligible. The inner and outer cylinders were perfectly polished with powdersof succeeding smaller grain sizes (320 nm), their emissivity was small(e = 0.32) and heat flux arising from radiation Qrad was negligible in compari-son with the heat transfer by conduction in the temperature range of ourexperiment. To minimize the heat transfer by radiation, the solid material(stainless-steel 1X18H9T) of low emissivity (e = 0.32) was used for thecylinders and thin layers of fluid were also used (0.97 mm). In this way,heat transport by radiation can be strongly minimized.
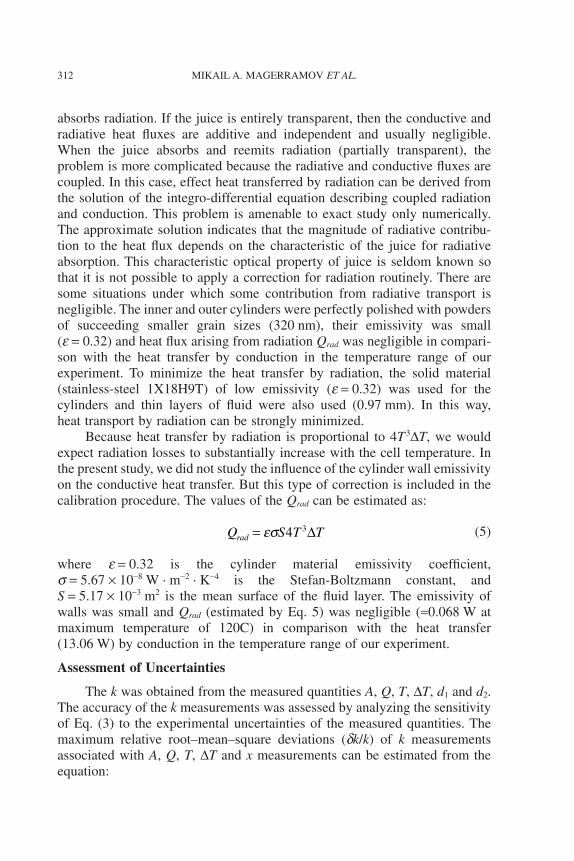
Because heat transfer by radiation is proportional to 4T3DT, we wouldexpect radiation losses to substantially increase with the cell temperature. Inthe present study, we did not study the influence of the cylinder wall emissivityon the conductive heat transfer. But this type of correction is included in thecalibration procedure. The values of the Qrad can be estimated as:
Q S T Trad = es 4 3Δ (5)
where e = 0.32 is the cylinder material emissivity coefficient,s = 5.67 ¥ 10-8 W · m-2 · K-4 is the Stefan-Boltzmann constant, andS = 5.17 ¥ 10-3 m2 is the mean surface of the fluid layer. The emissivity ofwalls was small and Qrad (estimated by Eq. 5) was negligible (ª0.068 W atmaximum temperature of 120C) in comparison with the heat transfer(13.06 W) by conduction in the temperature range of our experiment.
Assessment of Uncertainties
The k was obtained from the measured quantities A, Q, T, DT, d1 and d2.The accuracy of the k measurements was assessed by analyzing the sensitivityof Eq. (3) to the experimental uncertainties of the measured quantities. Themaximum relative root–mean–square deviations (dk/k) of k measurementsassociated with A, Q, T, DT and x measurements can be estimated from theequation:
312 MIKAIL A. MAGERRAMOV ET AL.

dk
k k
k
AS
k
QS
k
TS
k
TS
k
xSA Q T T x= ∂
∂⎛⎝
⎞⎠ + ∂
∂⎛⎝
⎞⎠ + ∂
∂⎛⎝
⎞⎠ + ∂
∂⎛⎝
⎞⎠ + ∂
∂⎛⎝
⎞⎠
1 2 2 2 2 2
Δ Δ (6)
where SA = 0.0009 m-1, SQ = 2.6 · 10-3 W, SD = 0.005C, ST = 0.030C andSx = 0.005°Brix are the root–mean–square deviations of A, Q, DT, T and xmeasurements, respectively (Abdulagatov et al. 2004a,b). The value of root–mean–square deviation of heat losses through the ends of the measuring cell isabout SQlos = 0.001 W. As the uncertainties of the measured values d1, d2 and lare 0.15, 0.09 and 0.07%, respectively, the corresponding uncertainty of A is0.50%. Values for the partial derivatives (�k/�T)x and (�k/�x)T were calculatedusing the correlating equation for k reported in the next section.
The uncertainty in heat flow Q measurement is about 0.1%. To make surethat the cell was in equilibrium, the measurements were initiated 10 h after thetime when the thermostat temperature reached the prescribed temperature.About 5–6 measurements were taken at one state and the average values of kcalculated. Reproducibility of the measurements was about 0.5%. From theuncertainty of the measured quantities and the corrections mentioned above,the total maximum relative uncertainty dk/k in measuring the k was 2%. All theother uncertainties were assumed negligible.
Performance Tests
To check and confirm the reliability and accuracy of the measurementmethod and correct operation of the apparatus, the k data were taken for purewater in the temperature range from 20 to 120C (Table 2). The agreementbetween test measurements for pure water and the IAPWS standard (Kestinet al. 1984) calculations is excellent. This k apparatus was successfullyemployed in our previous studies of k of pure liquids, water and aqueoussolutions (Abdulagatov et al. 2004a,b; Abdulagatov and Azizov 2005).
TABLE 2.TEST MEASUREMENTS OF THERMAL CONDUCTIVITY (W · m-1 · K-1) OF PURE WATER
T (C) 20 40 60 80 100 120
k (this work) 0.601 0.630 0.654 0.670 0.679 0.689IAPWS* standard 0.599 0.631 0.654 0.670 0.679 0.683Deviation (%) 0.334 0.159 0.000 0.000 0.000 0.879
* Internationally accepted International Association of Properties of Water and Steam (IAPWS)standard data for the thermal conductivity of pure water (Kestin et al. 1984).
313THERMAL CONDUCTIVITY OF FRUIT JUICES
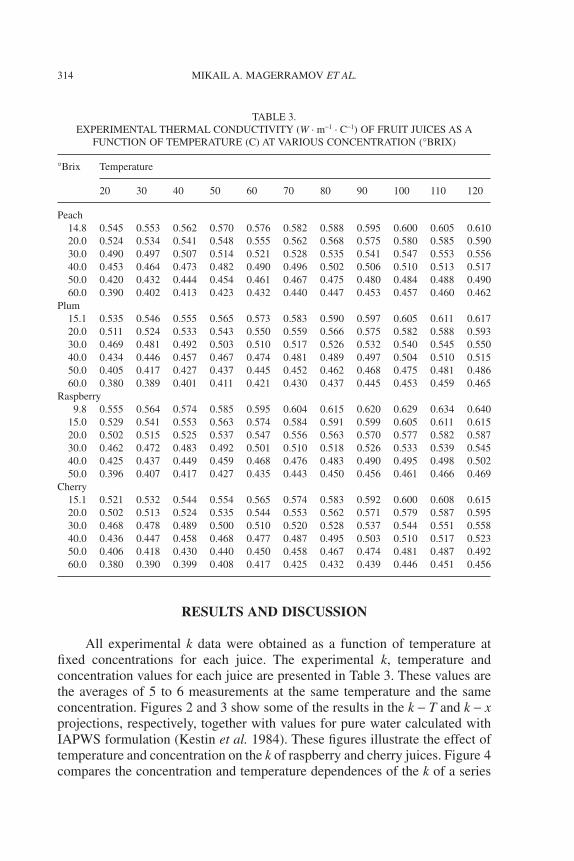
RESULTS AND DISCUSSION
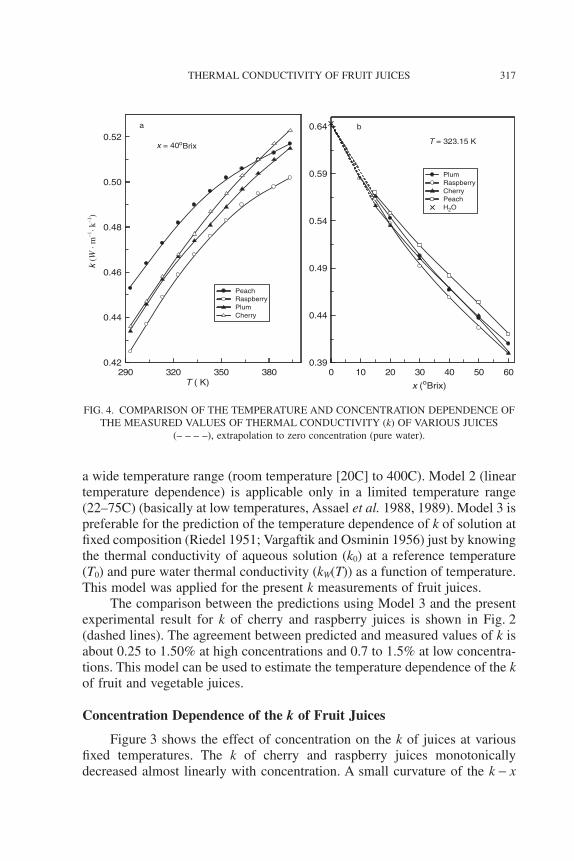
All experimental k data were obtained as a function of temperature atfixed concentrations for each juice. The experimental k, temperature andconcentration values for each juice are presented in Table 3. These values arethe averages of 5 to 6 measurements at the same temperature and the sameconcentration. Figures 2 and 3 show some of the results in the k - T and k - xprojections, respectively, together with values for pure water calculated withIAPWS formulation (Kestin et al. 1984). These figures illustrate the effect oftemperature and concentration on the k of raspberry and cherry juices. Figure 4compares the concentration and temperature dependences of the k of a series
TABLE 3.EXPERIMENTAL THERMAL CONDUCTIVITY (W · m-1 · C-1) OF FRUIT JUICES AS A
FUNCTION OF TEMPERATURE (C) AT VARIOUS CONCENTRATION (°BRIX)
°Brix Temperature
20 30 40 50 60 70 80 90 100 110 120
Peach14.8 0.545 0.553 0.562 0.570 0.576 0.582 0.588 0.595 0.600 0.605 0.61020.0 0.524 0.534 0.541 0.548 0.555 0.562 0.568 0.575 0.580 0.585 0.59030.0 0.490 0.497 0.507 0.514 0.521 0.528 0.535 0.541 0.547 0.553 0.55640.0 0.453 0.464 0.473 0.482 0.490 0.496 0.502 0.506 0.510 0.513 0.51750.0 0.420 0.432 0.444 0.454 0.461 0.467 0.475 0.480 0.484 0.488 0.49060.0 0.390 0.402 0.413 0.423 0.432 0.440 0.447 0.453 0.457 0.460 0.462
Plum15.1 0.535 0.546 0.555 0.565 0.573 0.583 0.590 0.597 0.605 0.611 0.61720.0 0.511 0.524 0.533 0.543 0.550 0.559 0.566 0.575 0.582 0.588 0.59330.0 0.469 0.481 0.492 0.503 0.510 0.517 0.526 0.532 0.540 0.545 0.55040.0 0.434 0.446 0.457 0.467 0.474 0.481 0.489 0.497 0.504 0.510 0.51550.0 0.405 0.417 0.427 0.437 0.445 0.452 0.462 0.468 0.475 0.481 0.48660.0 0.380 0.389 0.401 0.411 0.421 0.430 0.437 0.445 0.453 0.459 0.465
Raspberry9.8 0.555 0.564 0.574 0.585 0.595 0.604 0.615 0.620 0.629 0.634 0.640
15.0 0.529 0.541 0.553 0.563 0.574 0.584 0.591 0.599 0.605 0.611 0.61520.0 0.502 0.515 0.525 0.537 0.547 0.556 0.563 0.570 0.577 0.582 0.58730.0 0.462 0.472 0.483 0.492 0.501 0.510 0.518 0.526 0.533 0.539 0.54540.0 0.425 0.437 0.449 0.459 0.468 0.476 0.483 0.490 0.495 0.498 0.50250.0 0.396 0.407 0.417 0.427 0.435 0.443 0.450 0.456 0.461 0.466 0.469
Cherry15.1 0.521 0.532 0.544 0.554 0.565 0.574 0.583 0.592 0.600 0.608 0.61520.0 0.502 0.513 0.524 0.535 0.544 0.553 0.562 0.571 0.579 0.587 0.59530.0 0.468 0.478 0.489 0.500 0.510 0.520 0.528 0.537 0.544 0.551 0.55840.0 0.436 0.447 0.458 0.468 0.477 0.487 0.495 0.503 0.510 0.517 0.52350.0 0.406 0.418 0.430 0.440 0.450 0.458 0.467 0.474 0.481 0.487 0.49260.0 0.380 0.390 0.399 0.408 0.417 0.425 0.432 0.439 0.446 0.451 0.456
314 MIKAIL A. MAGERRAMOV ET AL.

of juices at the selected temperature of 50C and concentration of 40°Brix. Thepeach juice has the highest measured values of k among all the juices at thesame thermodynamic (T, x) conditions, while raspberry juice exhibits thelowest value. This can be explained by the different chemical compositions ofthe juices (e.g., contents of the microelements, sugar, or glucose, fructose andsucrose).
Temperature Dependence of the k of Fruit Juices
The k of juices increases considerably with increasing temperature. Forinstance, at temperatures between 20 and 120C, the k of cherry and raspberryjuices is significantly (up to 19–20%) affected by temperature at high concen-trations (60°Brix) and up to 15–18% at low concentrations (15°Brix) (Fig. 2and Table 3). For pure water at the same temperature range, the k changes upto 14%. The rate of temperature changes (dk/dT) at low temperatures is higherthan that at high temperatures. Figure 2 also demonstrates how the behavior ofthe temperature dependence of the k of juices depends on concentration. Atlow concentrations (below 40°Brix), the curvature of the k - T curves is higherthan that at high concentrations (above 40°Brix). The k of pure water and
T ( K)
0.35
0.40
0.45
0.50
0.55
0.60
0.65
0.70
Cherry juice
H2O
50o Brix
15.1 oBrix
60 oBrix
40 oBrix
30oBrix
270 300 330 360270 300 330 360T (K)
0.36
0.41
0.46
0.51
0.56
0.61
0.66Raspberry juice
H2O
9.8 oBrix
20 oBrix
30oBrix
50oBrix
40 o Brix
60o Brix
k (W
· m
–1· k
–1)
FIG. 2. MEASURED VALUES OF THERMAL CONDUCTIVITY (k) OF CHERRY ANDRASPBERRY JUICES AS A FUNCTION OF TEMPERATURE (T) ALONG SELECTED
FIXED CONCENTRATIONS(– · – · – · –), pure water (IAPWS, Kestin et al. 1984); (– – – –), Model 3; (––––), Model 1.
IAPWS, International Association of Properties of Water and Steam.
315THERMAL CONDUCTIVITY OF FRUIT JUICES

aqueous solutions increases with temperature and it passes through amaximum between 100 and 200C and it decreases at higher temperatures(Abdulagatov and Magomedov 1999a,b, 2000, 2001, 2004; Abdulagatov et al.2004a,b; Abdulagatov and Azizov 2005). In this study (up to 120C), we did notfind any maximum of the k of juices, although a slight decrease in dk/dT at hightemperatures is observed (Fig. 2).
A number of correlation equations have been developed in the literatureto calculate and predict the k of liquid foods as a function of temperature(Fernández-Martin and Montes 1972; Cuevas and Cheryan 1978; Choi andOkos 1983a; Constenla et al. 1989; Telis-Romero et al. 1998; Gratão et al.2005). Because of the lack of a theoretical background on the temperature andconcentration dependency of k for liquids and liquid mixtures, empirical andsemiempirical correlation equations and prediction techniques are commonlyused (Millat et al. 1996). Several widely used models for the temperaturedependence of the k are shown in Table 4. Here, we examined the applicabilityof these models for the k of our tested fruit juices. The Model 1 (quadraticpolynomial in temperature [T ], Table 4) was used by many authors (Venartand Prasad 1980; Horvath 1985; Abdulagatov and Magomedov 1999a,b, 2000,2001, 2004) to represent experimental k data of liquids and liquids mixtures in
0 10 20 30 40 50 60 70
x (oBrix)
0.36
0.41
0.46
0.51
k (W
· m
–1· k
–1)
0.56
0.61
0.66
Cherry juice
20C120C50CH2O (IAPWS)Model 1
0 10 20 30 40 50 60
x (oBrix)
0.36
0.41
0.46
0.51
0.56
0.61
0.66Raspberry juice
FIG. 3. MEASURED VALUES OF THERMAL CONDUCTIVITY (k) OF CHERRY ANDRASPBERRY JUICES AS A FUNCTION OF CONCENTRATION (x) ALONG
SELECTED ISOTHERMS(– – – –), extrapolation to zero concentration (pure water).
316 MIKAIL A. MAGERRAMOV ET AL.
a wide temperature range (room temperature [20C] to 400C). Model 2 (lineartemperature dependence) is applicable only in a limited temperature range(22–75C) (basically at low temperatures, Assael et al. 1988, 1989). Model 3 ispreferable for the prediction of the temperature dependence of k of solution atfixed composition (Riedel 1951; Vargaftik and Osminin 1956) just by knowingthe thermal conductivity of aqueous solution (k0) at a reference temperature(T0) and pure water thermal conductivity (kW(T)) as a function of temperature.This model was applied for the present k measurements of fruit juices.
The comparison between the predictions using Model 3 and the presentexperimental result for k of cherry and raspberry juices is shown in Fig. 2(dashed lines). The agreement between predicted and measured values of k isabout 0.25 to 1.50% at high concentrations and 0.7 to 1.5% at low concentra-tions. This model can be used to estimate the temperature dependence of the kof fruit and vegetable juices.
Concentration Dependence of the k of Fruit Juices
Figure 3 shows the effect of concentration on the k of juices at variousfixed temperatures. The k of cherry and raspberry juices monotonicallydecreased almost linearly with concentration. A small curvature of the k - x
290 320 350 380T ( K)
0.42
0.44
0.46
0.48
0.50
0.52
PeachRaspberryPlumCherry
x = 40 oBrix
a
0 10 20 30 40 50 60
x (oBrix)
0.39
0.44
0.49
0.54
0.59
0.64
PlumRaspberryCherryPeachH2O
T = 323.15 K
b
k (W
· m
–1· k
–1)
FIG. 4. COMPARISON OF THE TEMPERATURE AND CONCENTRATION DEPENDENCE OFTHE MEASURED VALUES OF THERMAL CONDUCTIVITY (k) OF VARIOUS JUICES
(– – – –), extrapolation to zero concentration (pure water).
317THERMAL CONDUCTIVITY OF FRUIT JUICES
curves at high concentrations was noted. The k considerably decreases (up to38–48%) with concentration at low temperatures (20C) and up to 35–43% athigh temperatures (120C). The most often used models for the concentrationdependence of k0 are given in Table 4.
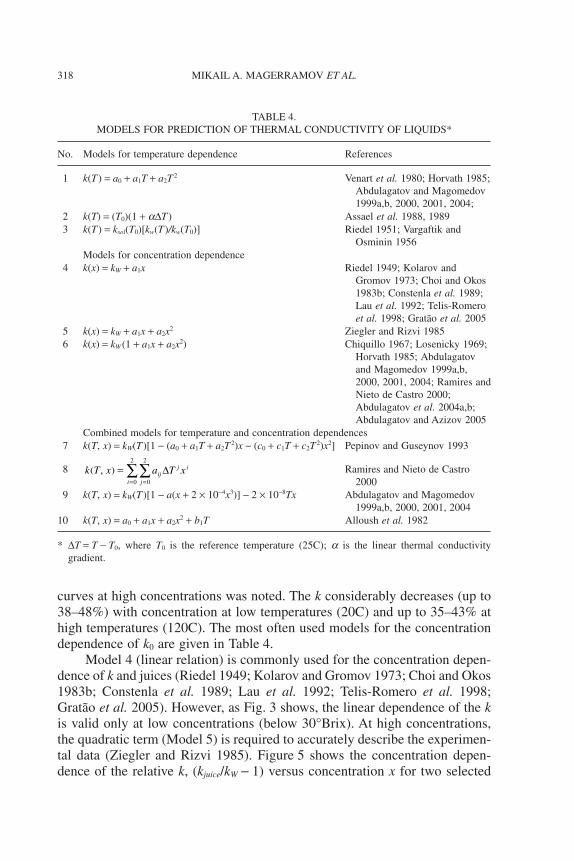
Model 4 (linear relation) is commonly used for the concentration depen-dence of k and juices (Riedel 1949; Kolarov and Gromov 1973; Choi and Okos1983b; Constenla et al. 1989; Lau et al. 1992; Telis-Romero et al. 1998;Gratão et al. 2005). However, as Fig. 3 shows, the linear dependence of the kis valid only at low concentrations (below 30°Brix). At high concentrations,the quadratic term (Model 5) is required to accurately describe the experimen-tal data (Ziegler and Rizvi 1985). Figure 5 shows the concentration depen-dence of the relative k, (kjuice/kW - 1) versus concentration x for two selected
TABLE 4.MODELS FOR PREDICTION OF THERMAL CONDUCTIVITY OF LIQUIDS*
No. Models for temperature dependence References
1 k(T) = a0 + a1T + a2T 2 Venart et al. 1980; Horvath 1985;Abdulagatov and Magomedov1999a,b, 2000, 2001, 2004;
2 k(T) = (T0)(1 + aDT) Assael et al. 1988, 19893 k(T) = ksol(T0)[kw(T)/kw(T0)] Riedel 1951; Vargaftik and
Osminin 1956Models for concentration dependence
4 k(x) = kW + a1x Riedel 1949; Kolarov andGromov 1973; Choi and Okos1983b; Constenla et al. 1989;Lau et al. 1992; Telis-Romeroet al. 1998; Gratão et al. 2005
5 k(x) = kW + a1x + a2x2 Ziegler and Rizvi 19856 k(x) = kW(1 + a1x + a2x2) Chiquillo 1967; Losenicky 1969;
Horvath 1985; Abdulagatovand Magomedov 1999a,b,2000, 2001, 2004; Ramires andNieto de Castro 2000;Abdulagatov et al. 2004a,b;Abdulagatov and Azizov 2005
Combined models for temperature and concentration dependences7 k(T, x) = kW(T)[1 - (a0 + a1T + a2T 2)x - (c0 + c1T + c2T 2)x2] Pepinov and Guseynov 1993
8 k T x a T xijj i
ji
,( ) ===∑∑ Δ
0
2
0
2
Ramires and Nieto de Castro2000
9 k(T, x) = kW(T)[1 - a(x + 2 ¥ 10-4x3)] - 2 ¥ 10-8Tx Abdulagatov and Magomedov1999a,b, 2000, 2001, 2004
10 k(T, x) = a0 + a1x + a2x2 + b1T Alloush et al. 1982
* DT = T - T0, where T0 is the reference temperature (25C); a is the linear thermal conductivitygradient.
318 MIKAIL A. MAGERRAMOV ET AL.
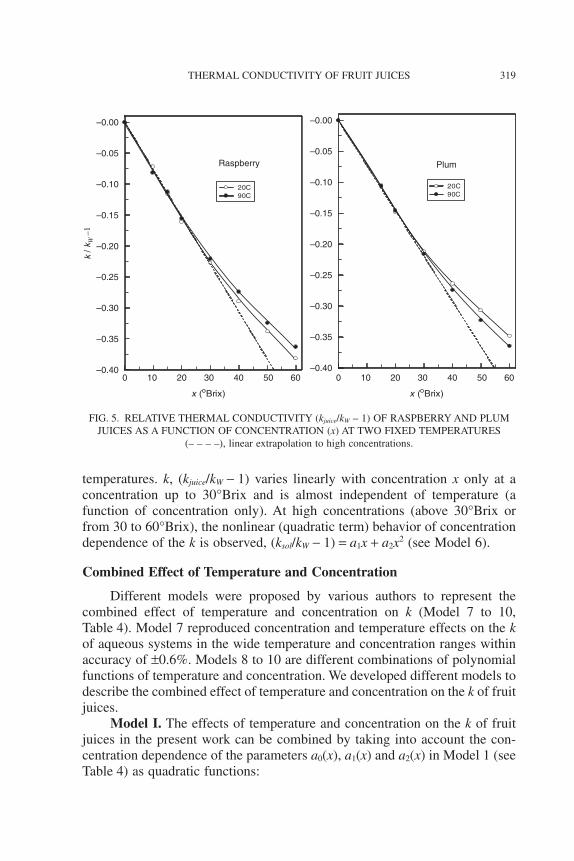
temperatures. k, (kjuice/kW - 1) varies linearly with concentration x only at aconcentration up to 30°Brix and is almost independent of temperature (afunction of concentration only). At high concentrations (above 30°Brix orfrom 30 to 60°Brix), the nonlinear (quadratic term) behavior of concentrationdependence of the k is observed, (ksol/kW - 1) = a1x + a2x2 (see Model 6).
Combined Effect of Temperature and Concentration
Different models were proposed by various authors to represent thecombined effect of temperature and concentration on k (Model 7 to 10,Table 4). Model 7 reproduced concentration and temperature effects on the kof aqueous systems in the wide temperature and concentration ranges withinaccuracy of ±0.6%. Models 8 to 10 are different combinations of polynomialfunctions of temperature and concentration. We developed different models todescribe the combined effect of temperature and concentration on the k of fruitjuices.
Model I. The effects of temperature and concentration on the k of fruitjuices in the present work can be combined by taking into account the con-centration dependence of the parameters a0(x), a1(x) and a2(x) in Model 1 (seeTable 4) as quadratic functions:
x (oBrix)
–0.40
–0.35
–0.30
–0.25
–0.20
–0.15
–0.10
–0.05
–0.00
Raspberry
20 C90 C
0 10 20 30 40 50 600 10 20 30 40 50 60
x (oBrix)
–0.40
–0.35
–0.30
–0.25
–0.20
–0.15
–0.10
–0.05
–0.00
Plum
20 C90 C
k / k
W –
1
FIG. 5. RELATIVE THERMAL CONDUCTIVITY (kjuice/kW – 1) OF RASPBERRY AND PLUMJUICES AS A FUNCTION OF CONCENTRATION (x) AT TWO FIXED TEMPERATURES
(– – – –), linear extrapolation to high concentrations.
319THERMAL CONDUCTIVITY OF FRUIT JUICES
a x c c x c x0 1 2 32( ) = + + (7)
a x c c x c x1 4 5 62( ) = + + (8)
a x c c x c x2 7 8 92( ) = + + (9)
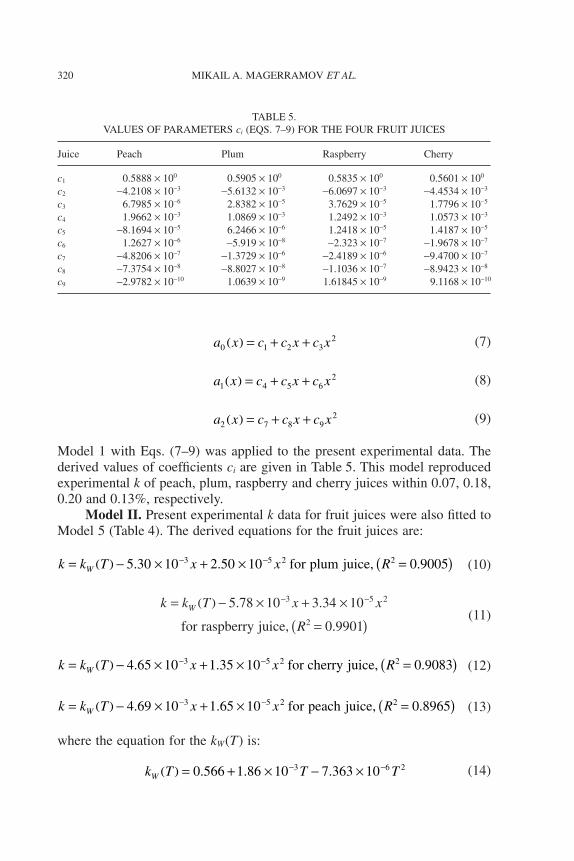
Model 1 with Eqs. (7–9) was applied to the present experimental data. Thederived values of coefficients ci are given in Table 5. This model reproducedexperimental k of peach, plum, raspberry and cherry juices within 0.07, 0.18,0.20 and 0.13%, respectively.
Model II. Present experimental k data for fruit juices were also fitted toModel 5 (Table 4). The derived equations for the fruit juices are:
k k T x x RW= ( ) − × + × =( )− −5 30 10 2 50 10 0 90053 5 2 2. . .for plum juice, (10)
k k T x x
R
W= ( ) − × + ×
=( )
− −5 78 10 3 34 10
0 9901
3 5 2
2
. .
.for raspberry juice,(11)
k k T x x RW= ( ) − × + × =( )− −4 65 10 1 35 10 0 90833 5 2 2. . .for cherry juice, (12)
k k T x x RW= ( ) − × + × =( )− −4 69 10 1 65 10 0 89653 5 2 2. . .for peach juice, (13)
where the equation for the kW(T) is:
k T T TW ( ) = + × − ×− −0 566 1 86 10 7 363 103 6 2. . . (14)
TABLE 5.VALUES OF PARAMETERS ci (EQS. 7–9) FOR THE FOUR FRUIT JUICES
Juice Peach Plum Raspberry Cherry
c1 0.5888 ¥ 100 0.5905 ¥ 100 0.5835 ¥ 100 0.5601 ¥ 100
c2 -4.2108 ¥ 10-3 -5.6132 ¥ 10-3 -6.0697 ¥ 10-3 -4.4534 ¥ 10-3
c3 6.7985 ¥ 10-6 2.8382 ¥ 10-5 3.7629 ¥ 10-5 1.7796 ¥ 10-5
c4 1.9662 ¥ 10-3 1.0869 ¥ 10-3 1.2492 ¥ 10-3 1.0573 ¥ 10-3
c5 -8.1694 ¥ 10-5 6.2466 ¥ 10-6 1.2418 ¥ 10-5 1.4187 ¥ 10-5
c6 1.2627 ¥ 10-6 -5.919 ¥ 10-8 -2.323 ¥ 10-7 -1.9678 ¥ 10-7
c7 -4.8206 ¥ 10-7 -1.3729 ¥ 10-6 -2.4189 ¥ 10-6 -9.4700 ¥ 10-7
c8 -7.3754 ¥ 10-8 -8.8027 ¥ 10-8 -1.1036 ¥ 10-7 -8.9423 ¥ 10-8
c9 -2.9782 ¥ 10-10 1.0639 ¥ 10-9 1.61845 ¥ 10-9 9.1168 ¥ 10-10
320 MIKAIL A. MAGERRAMOV ET AL.
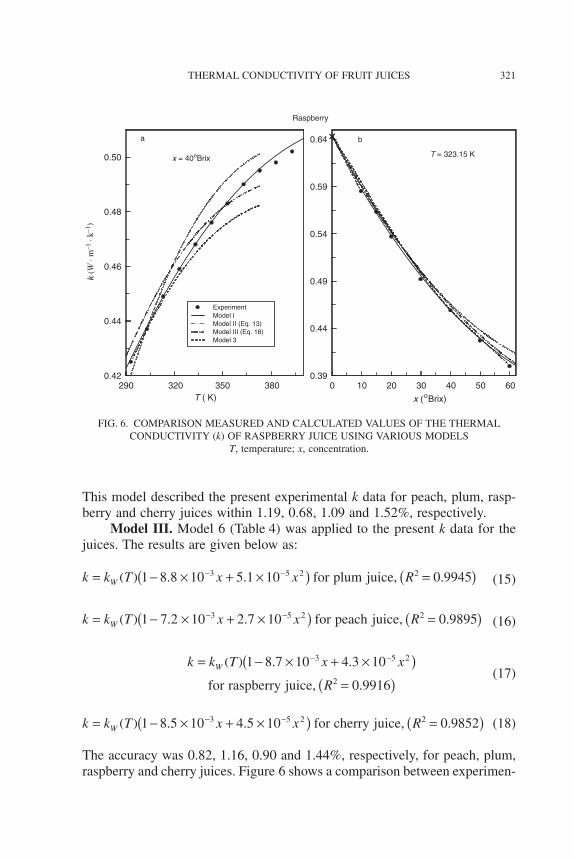
This model described the present experimental k data for peach, plum, rasp-berry and cherry juices within 1.19, 0.68, 1.09 and 1.52%, respectively.
Model III. Model 6 (Table 4) was applied to the present k data for thejuices. The results are given below as:
k k T x x RW= ( ) − × + ×( ) =( )− −1 8 8 10 5 1 10 0 99453 5 2 2. . .for plum juice, (15)
k k T x x RW= ( ) − × + ×( ) =( )− −1 7 2 10 2 7 10 0 98953 5 2 2. . .for peach juice, (16)
k k T x x
R
W= ( ) − × + ×( )=( )
− −1 8 7 10 4 3 10
0 9916
3 5 2
2
. .
.for raspberry juice,(17)
k k T x x RW= ( ) − × + ×( ) =( )− −1 8 5 10 4 5 10 0 98523 5 2 2. . .for cherry juice, (18)
The accuracy was 0.82, 1.16, 0.90 and 1.44%, respectively, for peach, plum,raspberry and cherry juices. Figure 6 shows a comparison between experimen-
290 320 350 380T ( K)
0.42
0.44
0.46
0.48
0.50
k (W
· m
–1 ·
k–1)
x = 40 oBrix
a
Experiment Model IModel II (Eq. 13)Model III (Eq. 18)Model 3
0 10 20 30 40 50 60
x (oBrix)
0.39
0.44
0.49
0.54
0.59
0.64
T = 323.15 K
b
Raspberry
FIG. 6. COMPARISON MEASURED AND CALCULATED VALUES OF THE THERMALCONDUCTIVITY (k) OF RASPBERRY JUICE USING VARIOUS MODELS
T, temperature; x, concentration.
321THERMAL CONDUCTIVITY OF FRUIT JUICES
tal and calculated values using Models I to III. The multiparametric Model Ibest represents the current experimental k data, but the extrapolation andprediction capabilities of Models II and III are better. Moreover, accordingto Models II and III, the difference, k(T, x) - kW(T), and reduced k, k(T,x)/kW(T) - 1, are almost independent of temperature (function of concentrationonly, see Fig. 5). This means that the temperature dependence of the k of juiceis basically governed by the temperature dependence of kW(T). Therefore,Models II and III allow the prediction of the values of the k of juices at anytemperature just by knowing the concentration dependence of k(T0, x) at afixed (or reference) temperature T0.
CONCLUSIONS
The thermal conductivities of four fruit juices (cherry, raspberry, plumand peach) were measured using a coaxial-cylinder (steady-state) technique.The range of temperature and concentration was 20 to 120C and 9.8 to°Brix,respectively. The combined effect of temperature and concentration on the k offruit juices was studied. New correlation and prediction models for the k ofjuices were developed. The applicability and predictive capability of themodels used previously for aqueous solutions to describe the effect of tem-perature and concentration on the k of juices was studied. It was found that theprediction Model 3, k(T) = ksol(T0)[kW(T)/kW(T0)], can be adopted satisfactorilyfor fruit juices. Therefore, minimal experimental information is needed topredict the k of juices as a function of temperature and concentration. The k ofjuices can be calculated just by knowing the single k, (ksol(T0)) of juice at areference temperature T0 = 20C and pure water data (kW(T)), which facilitatesto the prediction of the k of fruit juices. Models I to III are recommended toaccurately represent experimental k data for fruit juices in the temperature andconcentration ranges used in this study.
ACKNOWLEDGMENT
Authors A.M. Abdulagatov and I.M.A. Abdulagatov wish to thank thePhysical and Chemical Properties Division at the National Institute of Stan-dards and Technology (NIST) for the opportunity to work as Guest Research-ers at NIST during the course of this research.
REFERENCES
ABDULAGATOV, I.M. and AZIZOV, N.D. 2005. Thermal conductivity andviscosity of the aqueous K2SO4 solutions at temperatures from 298 to573 K and at pressures up to 30 MPa. Int. J. Thermophys. 26, 593–635.
322 MIKAIL A. MAGERRAMOV ET AL.
ABDULAGATOV, I.M. and MAGOMEDOV, U.B. 1999a. Thermal conduc-tivity measurements of aqueous SrCl2 and Sr(NO3)2 solutions in thetemperature range between 293 and 473 K at pressures up to 100 MPa.Int. J. Thermophys. 20, 187–196.
ABDULAGATOV, I.M. and MAGOMEDOV, U.B. 1999b. Measurements ofthe thermal conductivity of aqueous CoCl2 solutions at pressures up to100 MPa by parallel-plate apparatus. J. Chem. Eng. Jap. 32, 465–471.
ABDULAGATOV, I.M. and MAGOMEDOV, U.B. 2000. Thermal conduc-tivity of aqueous BaI2 solutions in the temperature range 293–473 and thepressure range 0.1–100 MPa. Fluid Phase Equilib. 171, 243–252.
ABDULAGATOV, I.M. and MAGOMEDOV, U.B. 2001. Thermal conduc-tivity of aqueous KI and KBr solutions at high temperatures and highpressures. J. Sol. Chem. 30, 223–235.
ABDULAGATOV, I.M. and MAGOMEDOV, U.B. 2004. Thermal conduc-tivity of pure water and aqueous srbr2 solutions at high temperatures andhigh pressures. High Temp. 35/36, 149–168.
ABDULAGATOV, I.M., AKHMEDOVA-AZIZOVA, L.A. and AZIZOV,N.D. 2004a. Thermal conductivity of aqueous Sr(NO3)2 and LiNO3 solu-tions at high temperatures and high pressures. J. Chem. Eng. Data 49,688–704.
ABDULAGATOV, I.M., AKHMEDOVA-AZIZOVA, L.A. and AZIZOV,N.D. 2004b. Thermal conductivity of binary aqueous NaBr and KBr andternary H2O+NaBr+KBr solutions at temperatures from 294 to 577 K andpressures up to 40 MPa. J. Chem. Eng. Data 49, 1727–1737.
ALLOUSH, A., GOSNEY, W.B. and WAKEHAM, W.A. 1982. A transienthot-wire instrument for thermal conductivity measurements in electri-cally conducting liquids at elevated temperatures. Int. J. Thermophys. 3,225–235.
ASSAEL, M.J., CHARITIDOU, E., GEORGIADIS, G.P. and WAKEHAM,W.A. 1988. Absolute measurement of the thermal conductivity of elec-trically conducting liquids. Ber. Bunsenges. Phys. Chem. 92, 627–631.
ASSAEL, M.J., CHARITIDOU, E., STASSIS, J.C.H. and WAKEHAM,W.A. 1989. Absolute measurement of the thermal conductivity ofsome aqueous chloride solutions. Ber. Bunsenges. Phys. Chem. 93, 887–892.
CHIQUILLO, A. 1967. Measurements of the Relative Thermal Conductivity ofAqueous Salt Solutions with a Transient Hot-wire Method. JurisDruck + Verlag, Zurich.
CHOI, I. and OKOS, M.R. 1986b. Effect of temperature and composition onthermal properties of foods. In Food Engineering and Process Applica-tions (M. Maguer and P. Jelen, eds.), pp. 93–101, Elsevier AppliedScience Publishers, London.
323THERMAL CONDUCTIVITY OF FRUIT JUICES
CHOI, I. and OKOS, M.R. 1983a. The Thermal Properties of Liquid Foods-Review. Presented at the Winter Meeting ASAE, Chicago, IL. Paper No.83–6516.
CHOI, I. and OKOS, M.R. 1983b. The thermal properties of tomato juiceconcentrates. Trans. ASAE 26(1), 305–311.
CHOI, I. and OKOS, M.R. 1986a. Thermal properties of liquid foods-Review.In Physical and Chemical Properties of Food (M.R. Okos, ed.) pp.35–77, ASAE, New York.
CONSTENLA, D.T., LOZANO, J.E. and CRAPISTE, G.H. 1989. Thermo-physical properties of clarified apple juice as a function of concentrationand temperature. J. Food Sci. 54, 663–668.
CRANDAL, P.G., CHEN, C.S. and CARTER, R.D. 1982. Models for predict-ing viscosity of orange juice concentrate. Food Technol. 36, 245–252.
CUEVAS, R. and CHERYAN, M. 1978. Thermal conductivity of liquid foods-Review. J. Food Proc. Eng. 2, 283–306.
DICKERSON, R.W. 1968. Thermal Properties of Foods: The Freezing Pres-ervation of Foods, Vol 2, 4th Ed. The AVI Publishing Co., Westport, CT.
ERMAKOV, A.I. 1972. The Methods of Biochemical Study. Vysshaya Shkola,Moscow.
FERNÁNDEZ-MARTIN, F. and MONTES, F. 1972. Influence of tempera-ture and composition on some physical properties of milk and milkconcentrates. III: Thermal conductivity. Milchwissenschaft 27, 772–776.
GRATÃO, A.C.A., JÚNIOR, V.S., POLIZELLI, M.A. and TELIS-ROMERO,J. 2005. Thermal properties of passion fruit juice as affected by tempera-ture and water content. J. Food Process. Eng. 27, 413–431.
HORVATH, A.L. 1985. Handbook of Aqueous Electrolyte Solutions: PhysicalProperties, Estimation Methods and Correlation Methods. EllisHorwood, West Sussex, England.
JOWITT, R., ESCHER, F., HALLSTROM, B., MEFFERT, H.F.T., SPIESS,M.E.L. and VOS, G. (eds.) 1983. Thermal properties of foods: Part III. InPhysical Properties of Foods, Applied Sciences Publishers, London.
KESTIN, J., SENGERS, J.V., KAMGAR-PARSI, B. and LEVELTSENGERS, J.M.H. 1984. Thermophysical properties of fluid H2O. J.Phys. Chem. Ref. Data 13, 175–189.
KHELEMSHI, M.Z. and ZHADAN, V.Z. 1963. The effect of dry solidsconcentration in beet juice on its thermophysical properties. Russ. J.Sugar Indust. 37, 23–27.
KOLAROV, K.M. and GROMOV, M.A. 1973. A universal equation for thecomputing of thermal conductivity of fruit and vegetable juices andsyrups. Khromitelna Promishlennost. 22, 33–39.
KONDRAT’EV, G.M. 1957. Thermal Measurements. Mashizdat, Moscow.
324 MIKAIL A. MAGERRAMOV ET AL.

KRETOVICH, V.L. 1980. Biochemistry of Plants. Vysshaya Shkola,Moscow.
LAU, A.K., MARCH, A.C., LO, K.V. and CUMMING, D.B. 1992. Physicalproperties of celery juice. Can. Agric. Eng. 34, 105–110.
LOSENICKY, Z. 1969. Thermal conductivity of aqueous solutions of alkalihydroxides. J. Phys. Chem. 73, 451–452.
MILLAT, J., DYMOND, J.H. and NIETO DE CASTRO, C.A. (eds.) 1996.Transport Properties of Fluids: Their Correlation, Prediction and Esti-mation, IUPAC. Cambridge University Press, New York.
MOHSENIN, N.N. 1980. Thermal Properties of Foods and AgriculturalMaterials. Gordon and Breach Science Publishers, New York.
MORESSI, M. and SPINOSI, M. 1980. Engineering factors in the productionof concentrated fruit juices. 1: Fluid physical properties of orange juices.J. Food. Technol. 15, 265–276.
PEPINOV, R.I. and GUSEYNOV, G.M. 1993. Thermal conductivity ofaqueous solutions of lithium chloride at high temperatures. Russ. J. Phys.Chem. 67, 1101–1103.
QASHOU, M.S., VACHON, R.I. and TOULOUKIAN, Y.W. 1972. Thermalconductivity of foods. ASHRAE Trans. 78(Part I), 165–183.
RAMIRES, M.L.V. and NIETO DE CASTRO, C.A. 2000. Thermal conduc-tivity of aqueous potassium chloride solutions. Int. J. Thermophys. 21,671–679.
REIDY, G.A. 1968. Methods for determining thermal conductivity andthermal diffusivity of foods. II. Values for thermal properties of foodsgathered from the literature. M.S. Thesis, Michigan State University,East Lansing, MI.
RIEDEL, L. 1949. Thermal conductivity measurement on sugar solutions,fruit juices and milk. Chem. Ing.-Technik 17/18, 340–341.
RIEDEL, L. 1951. The heat conductivity of aqueous solutions of strongelectrolytes. Chem. Ing.-Technik 3, 59–64.
SWEAT, V.E. and HAUGH, C.G. 1974. A thermal conductivity probe forsmall food samples. T. ASAE 17, 56–58.
TELIS-ROMERO, J., TELIS, V.R.N., GABAS, A.L. and YAMASHITA, F.1998. Thermophysical properties of Brazilian orange juice as affected bytemperature and water content. J. Food Eng. 38, 27–40.
VARGAFTIK, N.B. and OSMININ, Y.P. 1956. Thermal conductivity ofaqueous salt, acid, and alkali solutions. Teploenergetika 7, 15–16.
VENART, J.E.S. and PRASAD, R.C. 1980. Thermal conductivity of waterand oleum. J. Chem. Eng. Data 25, 196–198.
VOITKO, A.M., KOVALEVA, R.I. and TSAPLIN, V.A. 1967. The study ofphysical characteristics of concentrated grape juice. Proc. of the MoldovaNIIPP 7, 61–74.
325THERMAL CONDUCTIVITY OF FRUIT JUICES

WAKEHAM, W.A., NAGASHIMA, A. and SENGERS, J.V. (eds.) 1991.Measurements of the Transport Properties of Fluids, Vol III, BlackwellScientific Publications, Oxford.
WOODAMS, E.E. 1965. Thermal conductivity of fluid foods. Ms.D. Thesis,pp. 61–62, Cornell University, Fthaca, NY.
ZIEGLER, G.R. and RIZVI, S.S.H. 1985. Thermal conductivity of liquidfoods by the thermal comparator method. J. Food Sci. 50, 1458–1462.
326 MIKAIL A. MAGERRAMOV ET AL.