Embed Size (px)
Citation preview

Journal of Research of the National Bureau of Standards Vol. 58, No.5, May 1957 Research Paper 2760
Thermal Conductivity of Nitrogen from 50 0 to 500°C and 1 to 100 Atmospheres* R. 1. Nuttall ! and D. C. Ginnings
A new apparatus has been constructed for meas urements of the therm al conductiv ity of gases up to 500°C and 100-atmosphere p ress ure. The paral lel-plate m ethod was used with a spacing of about 0.5 millimeter betwee n the hotplate and coldplate. A capacitance method was used to measure the effect ive s pacing and area of t he plates under the conditions of the expe rim e nt. No solid material was used bet,,'ec n the plates. The e ffect of radiation was minimized by use of polished s ilver parts a nd I\"aS accounted for by experiments with the conductivity cell evac uatcd. ~1easureme llts on nit roge n were made at J, 50, and 100 atmosphe res, and from 50° to 500°C. It is beli e l'ed that. the accuracy of the r esul ts is about 0.5 percent, except at the highest gas de nsities.
1. Introduction
Accurate data on the thermal conductivity of gases are needed for two reasons. First, they arc needed to check present theories of heat conduction in gases. Experimental measurements at very high temperatures and pressures arc extremel~T diffi cult, so that theoretical means of predicting thermal co ndu ctivities in this range arc needed. Second, accurate data are needed on at least one gas so t1tat engin eering data on other gases can be obtai ned with relatively simple apparatus by a comparison method. The present apparatus was co nstructed primarily to furnish very accurate data for use as standards by others making thermal-co ndu ctivity measurements on gases. Nitrogen was chosen as the first gas to be measured for several reasons. ~lore measurements have been made on nitrogen than 0 11 any other pure gas. It is readily available in a state of high purit~- and is entirely sui table as a standard reference gas for use in calibrating apparatus for relative measuremen ts.
2. Method
~Ieasuremen ts of thermal condu ctivi ty of gases in a steady state have been made by two general methods, radial heat flow and linear heat flow. ~Iost measurements have been made with radial heat flow, either from a hot wire or between coaxial cylinders. In principle, these measurements are S llS
ceptible to co nvection errors . Elimination of these errors aL the high pressures r equires extremely small dimensions, which may be difficult to determine. The lin ear heat flow method is free from co nvection if the heat flow is downward . For th is reason, the parallel -plate method was chosell for these measurements up to 100 atm. The spacing between the plates was made small to minimize the errol' caused by rad ial heat transfer. In addit ion , the small spacing reduces the possibility of convection in case the plates are not quite horizontal.
*rphis work was supported in part by the National Advisory Committee for A l1fonau tics.
I Pn'Sf'llt address },ryon nc Nationa l Laboratory, Lemon t, ]11 .
271
T he correct ion for heat transfer by radiation between t he hotplate and the coldplate was evaluated by an exper iment with the condu ct ivi t~· cell evacuated. Of course, this assumes t ha t no appreciable part of t he radiation is absorbed b.\- tll e gas in th e conduetiv i ty experimen t. III all Lhe experiments, it was neC'essary to know t he efrective spaC'i ng between t he plates. Frequently, solid spaC'ers (of known dimel1sions) are used between t he hotplate and coldplate. Ko su ch spacers were used in this apparatus because i t was bel ieved that the heat transfer t hrough t he contaC't area of t he spacers and plates might be d ifferent with gas present than with the C'ell evacuated. The radiation correction experi· mrll t would thus be partially inval idated. Th e effeC'Live spacing was m easured by a capaci tance method under the actual cond it ions of the experi · ment. T his method has several advantages over the usual method with measurecl spacers. F irst, the above-mentioned uncertainty in t he effect of contact is eliminated. Second, t he capacitanC'e method au tornatically accot! nts for an~- change in dimensions. Th ird , because the direct capacitance between the hotplate and. coldplate is measured, nonlinear hrat flow at the C' irC'umferrnce of the hotplate is accounted. for.
The thermal C'ol1ductiv ity, k (w C'm- 1 deg C-l) , for ll eat flow between parallel plates is given by the equation
(1)
where Q is the rate of heat (walts) flowing only b~C'onduction from the hotplate throug'h the gas to lilr colclplate, t:..t is t he temperature . d ifference (de~ C) between t he ho t pla.te and C'oldplate, t:..X is the effect ive d istance (cm) betweell the two plates, 9,nd A is the d l'ective area (cm 2) of t he ho tpla te. The fa.ctor t:..X/A may be considered as the constant of t he "C'ollducLiv ity cell" determined b.\- lhe capfLcitanC'e method, so that
0.0885516Q Ct:..t ' k (2)

wh ere C is the direc t capaci tance (micl'omicrofarads) between the hotplate and t be cold plate, assuming the material between the plates to have a dielec tri c cOllstant of unity corresponding to a vacuum. "Vith the gas between the plates, a small correction must be made for its di electric constant. The conduction equation (2) would apply, of course, to an~~ two surfaces, as well as to parallel plates, provided only that the temperature and electric fielcls arr geometrically similar.
3. Experimental Procedure
3.1. Apparatus
The general assembl~~ of the tllermal-condu<:tivit.," cell , the pressure vessel, and the surrounding furnace is shown in figure 1. The hotplate (H ), coldplatr (J), guard (F), and auxiliary guard (E) are showll schematicall.Y . The pressure vessel (G) is made of s tainless steel and is sealed wit h a Monel gasket (D). This vessel is surrounded by a furnace (K) and furna,ce "neel,," (C), which are made of aluminum and are equipped wit h electric heaters ill numerous porcelain tubes in the aluminum. The furnace temperature was au tomaticall~~ controlled b~T means of a plati num res istallce th ermometer n.nd bridge circuit. The furnace neck was controlled r elative to the fmnace b.,- means of a thermocouple. The pressure vessel extends upward out of the furnace r egion so tha t t he electric leads can be brought out of t he pressure vessel in a cold r egion . The cooling coil (B) dissipates the heat from the furnace, so that t he top is cool. The eleetric leads (all No. 32 gold wire) ar e brought up from the a uxiliary guard through t hree 1nconel tubes, which serve as electrostatic shi elds, as described la ter. There are 29 of th ese leads, which are brought out of the pressure vessel through a pressure seal , A. These leads go out radially between two " Kel-F" (polychlorotrifluoroc thylene) disks, which are pressed toget her for the seal.
A number of difficulties were encountered before obtaining a successful seal at A. At first, the material T eflon (polytetl'afluOl'o ethylene) was used, but it was found to flow excessively at th e high pressures necessary for th e seal. The method finallv used for this seal was to mold Kel-F around the gold wires at about 200 0 C.
The v ital parts of the thermal-conductivit~- eell a l'e shown in figure 2. The hotplate (':'1 ), coldplate (0 ), guard (E) , and auxiliar:v guard (B ) are all made of silver to minimize temperat ure gradients and h eat transfer by radiation. The hot plate is made of three parts, silver-sold ered together. The hotplate heater (L) is located between the lower parts and consists of about 55 ohms (at 25 0 0 ) of (0.05-mm diameter ) platinum wire insulated with mica. Gold leads from this h eater are brought out through the tempering region located at H between the upper two silve], pieces of the hotplate and then to the therma.l tie-down, F. The purpose of this thermal tic-down
~ Aluminum
~ Stainle ss Steel
BlSilver
K
o I
2 I
1W0flf.- --- C
~§~~;;J_F
H~~~~~H
4 INCHES I
F I G(;RE 1. Therma l-conductivity apparatus .
A, Pressure seal for electric loads; B , cooli ng coil ; OJ furnace neck; D, wIonel g~s kct; E, auxiliary guard ; F, guard; G, pressure vessel; H , hotplate; J , cold p late; ] ..... , fu rnacc.
A
o --t<:~~+--....
E---+;>~'
G
o 0.5 1.0 INCHE S I
FIGURE 2. Thermal-wnductivity cell.
A, C, V', H , P, '"!"' hermal tic·downs for electric leads; B, a l1 xiliar~.r guard; D. Q. platinum resistance therm ometers; E , guard; OJ silver screw; J . quartz supports for hotplate; K, aluminum insert; L, hotplate heater; ::V[ , hotplate; X, quartz spacers; 0, coldplate. .
272

is to bring the leads as dose as poss ible to the temperatUl'e of the silver. This type of t ie-down IS used extensively throughout th e apparat us and consists of a gold te rminal insulated bet wee n thin mica disks a nd held down t o the silv er by a nut threaded OJI a madline screw. The gold terminal is spaced aroulld the scr ew so that it is ins ulated from it.
The hotplate is supported by th e guard ring at three points , using quartz supports (J ), so that th e bottom plane of the hotplate is ill the same plall e as th e bottom of the guard ring. Because th e coefficient of thermal expensioll of quart z is lower than t bat of silver, an aluminum inser t (Ie) h aving a high er coefficient tha n quartz was used with the quartz for compensa tion. The quart z is held tightl:l" against the hotplat e by the silver screw (0) pressing against the aluminum inser t . The guard (E ) surrounds the hotplate, except where it is exposed to t h e coldplate. III the vital region n ear the coldplate, the guard is spaced about 0.5 mm from the h o tplate. The assembl.'T of th e guard and hotpla te is held about 0. 5 mm from the cold plate b.," three quartz spacers (N) between th e guard a nd coldplate . In this region, th e silver was highly polished to r educe heat transfer by radiation. H eaters (L1 ot shown) a re installed in both th e guard aud coldplate.
The temperat ures of th e guard a nd coldplate are measured b:v using the platinum resistall ce thermomete rs (D ) and (Q ), respectivel.I", in conjullctiolJ with a Mueller bridge . These strain-free th ermometers are not scaled. All leads (gold ) from these two thermometers arc t h ermall v t icd dow n at C and P , respectivel:I' , so that th e tempe rat ures of the plat inum res istance th ermometers a rc not affected by h ea"t co ndu ct ion along th e leads. The temperature differellce between th e guard a nd hotplate is determined by means of a mult iple-junction thermopile, using fo ur 1\0. 36 Chromc1 P-Alumel t h ermocouples in series. This thermopile has one se t of clectricall:I' ins ulated j ulletions at F on t.he hotplate and t he other set at C on th e guard.
Experiments indicated tlte clesirabiIi t:v of providing a nother thermal tic-down zo ne for all electric leads before they go out from C to th e cold region. For this purpose, the s ilver auxiliary guard (B ) was used II"itlt a heater built in to provide the bulk of the heat flow up along the electric leads. All three silver pieces, (B ), (E), and (0 ), are held toget her b,'~ long machine screws fas te ned in the bottom of the surrounding press ure vessel. These four pieces are all elect ricall,- insulated from one a nother.
The eA:ective operation of the thermal-co nductivity a pparatus depended upon th e proper temperature co nt rol of th e various components . For this purpose, five a utomat ic thermoregulators were used to cont rol th e temperatures of the coldplate, guard, a uxiliar.\T guard, fUl'nace, and t he furnace neck. These th ermoreg ulato rs were act uated by thermocouples or r es istance th ermometers (not the meas" uring resistance th ermometers), a nd they consisted esse ntially of "chopper-amplifiers" operat ing sat urable reactors in th e heater circuits. The guard was mainta ined at th e same temperature as that of the
hotplate b:," m ea ll S of the differential tllCrmopile previously m ent ioned. This t emperat ure co utrol was th e most important; it maintained cO llstanc:' " of temperat ure to abo ut 0.001 deg C. The auxilialY guard was maintained at th e same temprrat ul'e as the guard b:," a single differ ential th ermocouple. As a result of the effectiveness of the thermoregulation in the thermal-conductivity apparatus, all the observations 011 the thermal condu ctivit~" of nitrogen were made b:v one person. Both the electri c power in the hotplate heater and the the rmocouple r eadings were observed with a precision potentiometer.
A capacitan ce bridge was used to measure to e capacitance between the ho tplate a nd the coldplate. This bridge permitted the accurate m easuremen t of small direct capacitances, even t hough relativelv large capaci tances exist between the "ground" and the plates. To eliminate, as far as possible, enol'S of m easuremell t in capacitance, a calib rated capacitor having about the capacitance of the thermal-conductivi t.v cell (abo ut 10 f.i./.d) was used as a r efer ence a nd the measurements mad e bv a substitution m ethod. III t his measurement, the same internal eapacita llce to gro un d was kept in the bridge circuit , so that the capacitance measuremen t approach ed very closely to the ideal comparat ive measuremen t , givillg a n accuracy comparable with the accurac.,- of tlte calibrated capaeitor. Much care was ta ken to avoid significant capacita ll ce betwee n the leads from the ho tplate and eoldpla.te. The.,~ were effectively shi elded from ea.ch other b~' bringing leads out through sep~rate grounded Incollel tu bes a nd by proper locatIOn of th e leads t hat pass through the pressure seal.
For th e measurement of the pressure of t he ga.s in the co n~u ct i v i t.v.ceJl , cal.i.brated Bourdon l;iages ,\"ere used . 1: he r eq LUremell t for accurac.'T Oil tJlCse gages was not great beca use t he var iat ion of thcrmal co nductivity wit lt pressure was much small er tha n t hc change with temperature.
3.2. Purity of Nitrogen
The lli troge ll used was extra-dry high-purity, obtain ed from the Linde Air Products Co., who stated that impuri t ies did not exceed 100 ppm. Cryoscopic measurements made by O. F . Furukawa at the N a.tional Bureau of Standards with an adiabatic calorimeter showed liquid-soluble solid-insolubJe impurities to be about 10 ppm. The conductivity cell was filled with this nitrogen , which had been passed through a sili ca-gel dryer a nd a filter made of glass wool.
3 .3 . Procedure
The general procedure was to set the furnace co ntrols to the desired temperature, fill the conductivity cell with gas at the desired pressure, and put in a chosen electric power in the hotplate. "With the eoldplate automatically r egulated to a constant temperature and the guard temperature automatically (,O lltrolled to the temperature of the hotplate, the hot-
273

plate temperature b ecam e constan t. After the capacitance between the two plates was m easured , a lternate m easuremen ts of electric power (H') a nd tempera ture differ ence (L'1t) between the plates were m ade until the constancy of their valu es indicated that a steady state had b een r each ed . Th e power in t he hotplate' was then changed so that simil ar m ea,suremen ts were made a t three or more powers. The (Tas pressure was then changed and m easurem ents ~rere repeated for each of the pressures 0.7, 50, and 100 a tm, All of these m easurem ents were made at .'iOo , 100°, 200°, 300°, 400 °, and 500°.
According to eq (2), the three quan t it ies needed to d etermine the thermal-conductivity coefficient, k , are the rate of hea t flow , Q, the tempera ture difference L'1t and the direct rapacitan ce, 0, between the hotplat~ and coldpla te. E ach of th ese quan tit ies is di scussed in de tail below .
In order to ob tain Q from H', the m easured elec tr ic power in the ho tpla te , i t is neeessary to account fo r all h rat flow from the hotpla te other than b.\- conduct ion through the gas. The possible pat hs of this heat flow are (1) to the surrounding guard by conduction and convection through gas, conduction through lead wires and radia t ion, (2) to the coldplate by con -vection, a~d (3) to the coldplate by radia tion . .
Preliminar y experiments were m ade to de term1l1 e t he heat-transfer coefficien t b etween the guard and hotpla te . R esul ts of th ese experimcnts showed that an un cer tainty in conductiv ity of l ess tha n 0.1 percen t would be caused by a tempera ture difference between the guard and the ho tplate of 0.001 ° C . .It was found possible to control the temperature chfference au tom atically to abou t this value.
The conductiv ity cell was designe~ to elimin ~ te any convection curren ts. If convectlOll does eXIst, it ,,,ill cause an apparen t cha nge in the valu e of k with change in power input. At the lower gas densities, no such change was observed , and convection effects seem ed absen t. However , at the higher gas densit ies, k appear ed to vary wi th power . The apparen t k values were corrected by extrapola ting to zero power inpu t . This apparen t change in k with power is believed to be due to a "chimn ey"type con vect ion r esul ting from gas f1owin~ in to the space b etween the guard and colclpla te and ou t of the holes (no t shown in fig , 2) prov ided for electri c leads in the top of the guard . It is expec ted that blocking of these sp aces would have elim inated this effect.
The heat transfer by radia t ion was accoun ted for bY m easurem en ts with the cell cvac uated . This power (H 'r) transferred between two p arallel plates can b e expressed as
Wr=eAO"(T~- T 1), (4)
where e is an effective emissiv ity of the smfaces, A is an effective area, 0" is the Stefa n-Boltzm ann constan t, and Tl and T2 are the ab solute temperatures. If the temperature differ ence, L'1t , is small com pa red to t he average temperature, T = 0.5 (T2 + T j ), then the t r ansfer equation can be simplified to
(5)
The constan t B was evaluated in preliminary experim en ts ove r the en tire temperature range wi th the conductiv ity cell evacuated . The gas pressure in the cell in these experimen ts was estimated to be less than 10 - 5 mm of mercury . During the progress of the experimen ts with gas, the constan t B was check ed p eriodically at tempera tures of 350° C and belm\- to test for possible changes in emissivity wi th time. Higher temperatures wer e no t r echeck ed for reasons to b e discussed la ter wi th temperature m easurem en t.
The direct capacitance (0) between the ho t pla t eand coldplate was m easured by flo substitution m ethod using a calibrated sta ndard and a Sylvania typ e 125 capacitance bridge. The precision of the bridge reading was better than t he certified accuracy of th e s tandard capacitor.
The capa citance, 0, in eq (2) is tha t m easured in vacuum. For m easurements wi t h gas in the cell, correction must be made for t he dielectric constan t . E, of the gas. E was determined by using th e Clausius-Mosott i equa tion
E- l E+ 2=Dp, (6)
wh ere D is a constant independ ent of t emp erature for nonpolar gases, and p is t he gas density . Th e valu e used for D was 1953 X 10- 7 [1] 2 when p is ill Amagat units [2]. Although the correction for th e dielectric constan t of t he ni trogen may amount t,o 1 or 2 p ercen t at t he hig hes t densities, i t is believed t hat t he uncer tain ties in k du e to this correc tion ar e less than 0.01 percen t.
T empera ture m easuremen ts were m ade with th e r esistan ce t hermometers in t he coldpla te and t he guard , together wi th the four-junction thermopile between th e gua rd and the hotpla te. These r esistance thermometers were ca libra ted by the N BS T empera tUl'e M easuremen ts Section before assembly of the cell . I t was found, however , t hat when the system was k ep t under high vacuum at temperatures above 400° C, the t hermometer char acteristirs changed slig htly . This was probably du e to contamina tion of t he platinum by other metals in t he sys tem . Such a change took place during the determination of radiation corrections a t 500° C. Rath er t han disman tle t he apparatus to reca1ibrate t he t hermometers, it was thoug h t t hat suffi :;ien t aecura c.\· could be r etained if the two th ermometers wer e compared ill place. In this way, the temperature differ ence would be known more accurately t han the absolute temperature. This procedure is valid only because the evaluatiolI of t he temperature d~fference, L'1 t, is t he important factor, wller eas the cll ange in thermal conductiv ity with temperature is sm all. I t is estima ted t hat after t his procedure, t he accuracy of th e m easurem en t of L'1 t was 0.002 c1 eg C a nd of average temperature Twas 0.01 cle:b C.
Z Figu res in brackets ind icate the Ii tetatl1J'c refc l' f'llces 3t the end of t h is paper.
274

4. Results
T he results of the measurements arc given in table 1. The first column gives tbe temperature of th e experiment, which is the mean of the hotplate and coldplate temperatmes. The second column gives the power (TV) put into the hotplate (as measmed electrically) with nitrogen in the conductiv ity cell. Values of power Wr , given in the third column, arc based on experiments with the conductivity cell evacua ted and are calcula ted from eq (5). These valu es are subtracted from the cOlTesponding valu es of liT' to give Q, as used in eq (2). Over 40 experiment s were made to determine the value of B in this equaLion. A value of B = 4.90 X IO- 12 w/deg4 in this equation was found to fit the results best. The values of B calculated from the individual vacuum experiments deviated on the average about 4 percellt from the above value, and seemed to be independent of tempemLure. Because the maximum values of TVr arc onl~r 3 percent of Lhe cOl'l'esponding values of lV, an enor of 4 percent in B would cause a maximum elTor of only about 0.1 percent ill conduc tiviLy lc.
The values of tempel'aLme difference l1t given in column 4 arc based Oll measurements wiLh the two
" resistance Lhermometers and Lite Lhennopile, which was used only as a "llull" indicator. Column 5 gives the values of capacitance C (as used in eq (2» between the hotplate and coldplate as determined at the same time and under the same conditions of the condu ctivity experiment. Th ese values have been conecLed for the dielectric constant of the nitrogen.
Th e values of "apparen t" thermal conductivity, lc* , given in column 6, were calculated from eq (2). These values, when corrected to even temperatures, seem to be fr ee from errOl' due to convection in that they are usuall~T independent of power, except at some of the highest pressures, as mentioned earlier. Because this effect is b elieved to be due to a chimnevt~Tpe convection, it should diminish at lower power inputs. Therefore, the values of lc* were extrapolated to zero power to give "true" conductivities, k. In the worst case, at 100-atm pressure and 50° C, the extrapolation is over a large range of values of lc *. However, it is believed that this extrapolation should introduce only a relatively small error. The results from the three experiments at different powers were fitted by the method of least squares to a linear equation in power. Tbe maximum deviaLion of the observed values of k* in this linear equation was only 0.28 percent, so that it is believed that the lineal' extrapolation was adequate.
At low pressures the effect of temperature discont inuity near the walls may become significant. This has been taken into account for the 0.7-atm data by use of the equation
(7)
41 883:>- 57--4 275
'fA BI, I" J . E.rpel'£lI!entall'eslills on nitrogen
T l' IllIJ(' r· atu re,
t
---
51. 03 52. 75 57.85
100.1:l 101. 87 106.68
200.09 201. 50 205.02 204.86
:l00.48 302. 17 :l04.25 :l06. (\4 306. 56
JOl. 02 402. (;,\ -106.4:l
50 1.(>0 502.0:1 506.46
50.59 .,1. 02 02.4(1 ,S5. in 09. fiH
100.3 1 101. 94 lOS. 1.\
200.2(i 201. 6 1 206.33
30 1. 54 :105. (;S 302.85
400.81 402.30 405.86
001. 57 502.98
1_507.42
50. 12 50. S:l 51. 82
99.86 101. 10 104.06
199. 70 201.08 204.51
299. (12 :100.79 302.7'i 305.30
400.79 402. fi8 405.56
501. 21 502.66 506.68
'''itil ni t rogrn ,
lI'
w
0.05107 .1039 . 2630
. 058%
. 1202
.2927
. 07569 · l3S7 .2981 .2971
.09072
. 1818
. 2972 · ·1:l08 .:HW
.106-1
.2177 · 4702
.13 11
. 2:Jr,9
.5248
O.Il~4 1 0 .0.\9:l8 . 11 :l8 .25 11
.04'157
. 0(1805 · 1:l·I.> . 27'18
. 09 102 · I.\()9 · :l9(I(i
. 1589
. 4077
. 2365
· 1000 .2105 · 1099
· 13:l1 . 2575 .6426
o 03336 . 06738 . 1210
.0597
. 1195
. 3421
.07(\64 · 1502 . 347:l
. IH7:l2
. 11 50
. 236fi
.401i8
· 1059 .2468 . 4(;50
· 1342 . 2612 .6218
I W ith
ytiC lIUl11 , IV,
rL'c mpcrai ure
clifl'crcn cc, At
Pn'~SllJ'(\, 0.7 aLm
--- -
w
0. 00027 .OOO5fl .0015
.00042
.0000
.0022
.00088 · DOW .0035 .0035
.0148
. 0030
. 0049
.0072
.00uG
.002(1
.0fl5:l
.0 1t0
.0010
.oon
.0 ](\4
I. 647 :l.3:l2 8. :J06
1. 664 3. 371 8. 117
1. 696 3.101 r,.614 6.615
1. 704 3.404 5.5:l4 7.991 G.891
1. 706 :l.4R4 7.539
1. 770 3.205 7.04!1
Pl'('~~un'. 50 at lll
o 0002 1 .OOOZO · ()()05 .00 11
. 00030
. 00045
. 0009
.00 lS
.00 10 1 · (){) 17 .0014
. 0025
.00 G4
.0037
.0025
.0048
.0 108
.0039
.0076
.0 191
I. 200 1. 718 3. l79 (i. 519
1. 172 I. 7Rl 3.4:l4 0.711\
1. 937 3.322 S. l(i5
2.8:l5 7. ].,8 4. 194
I. Olli :l.197 7.067
1. 720 3.316 8. 195
Pressure, 100 atm
0. 000 14 . 00025 .0005
.0004
.0007
.0018
.0008:l
.0010
.00:l5
. 00082 · DOl O .0038 .00n5
.0024
.0055
. 0104
. 0039
. 0075
.0180
0. 8:l5 1. 57G 2.615
L 423 2. fi75 6.539
1. 003 3.02J 6.556
0. 889 2.048 4.079 6.811
1. .\70 3.641 6.778
1. 698 3.290 7.727
Capacitance ,
C
9.781) 9.7S!! 9.797
9.975 10. 049 10.017
10.450 10.4 55 10. '163 10.435
10. 80 10.82 10. ~.\ 10. R3 10. 8,\
II. 17 II . 1 ~ 11 .20
ll. 71 11.71 11 . 77
9.llil H.7fi:l 9. ii2 9.78X
O. 9~7 9. 9~0 9.90(;
10.02 1
1O. 4.\ii 10. <l5G 10. ,18 1
10.84 10. 87 10 . . ~4
Il.l fi I l. 16 II. I H
11.7'2 11 .74 11 .77
9.809 9.81:l 9.821
10. 007 10. 014 1O.031i
10.41 10. -I:l 10. -I(i
1O.8:l 1O. 8:l 10. R-I 10. 84
11. 17 11. 19 I I. 20
II. 69 II. 70 11. 75
API H.I.rl' 1ll conctuC'lh'ih+
I:" ,
/0- 1 iF / f lit
deg
2.790 2.80·1 2. 841i
3.1 22 :l.120 3. 16.5
3. liST 3.74·1 3. ,tin 3. , 0,
4.29:l 4.2!l9 4. :1 12 4 . :l:lli 4.326
4. ~22 4. Q29 4.84l
.'.408 5. 410 :'.430
0.0911 3.120 3. 22~ :l. 1;0
:l. :l18 :1.3fiX J.44 fi a. 59:!
:l.9:37 3.9.Sli 4.051>
4 .. ;05 4.5{)7 4.53.\
5. 080 .\. 104 5. 14 5
.5.67'1
.5.68.\
.1, 721
J.5Yl :l.84:l .1. 158
:l.6R9 3.921\ 4.490
4.023 4. 177 4.440
4. 271) 4.511) 4.662 4.802
5.231 5. 244 5.303
5.8 1fi 5.831i 5.890

Tlte,,"temperatur~-jump di~tance ", g, is related to the accommodatIOn coeffiClent ", a, by the relation [16]:
2- a, ~ 0.5 k g=----a:-,27rRT) Cr+ l )CyP' (8)
in which R is the gas constant, T the absolute temp erature , k the thermal conductivity, Oy the constant-volume specific heat, 'Y the specific-heat ratio , and P the pressure of the gas . Values of a for nitrogen on silver vary from about 0.8 at room temperat Ut'e to 0.4 at 800° C [6] . The valu e of 0.5 was chosen as the most probable for the temperatLlre range of these experiments.
Values of observed conductivit), k, corrected to eyen temperatures, are lis ted in column 2 of table 2. In order to facilitate interpolation of the results between the obser ved points , empirical equations were derived to give conductivity as a function of temperature at each of the three pressures. These equations are as follows:
k= 1.0591) ( Cv+~ R) (pressure, 0.7 atm) , (9)
104lc = 2.714 + 0.005897t (pressure, 50 atm) , (JO)
J 0·llc = 3 .161 + 2.9317 X 10- 3t+ 9.0761 X 1O- 6t2 -
(pressure, 100 atm) (ll )
In these equations, lc is in watts cm- I deg- I, t is in d.eg 0, 1) is viscosity (poise), Cy is heat capacity (J g-I deg- I ), at constant volume, and R is the gas constant (8.317/28 .016 j g- I deg- I). The values of yiscosity and heat capacity used in eq (9) were ob-
TAIlLE 2. Thermal condllclivily oj n-itrogen -
Condu ctivity, k Observed 'remper- mj nus
ature I Calculated
calculated Observed
_.
Pressure, 0.7 atm
I ]O-j wlc", I lO- j 11"/C'"
o C dey dey % 50 2.794 2.818 - 0.9
]00 3.129 3.13 1 -.1 200 3.750 3.727 +.6
I
300 4.308 4.308 .0 400 4.836 4.857 -.4 500 5.430 5. 381 +.9
Pressure, 50 atm
50 3. 003 3.009 -0.2 100 3.303 3. 304 .0 200 3.905 3.893 +.3 300 4.477 4.483 -.1 400 5.075 5.073 .0 500 5.660 5.662 .0
P ressure, 100 atm
50 3.340 3.329 + 0.3 100 3.513 3.536 -.6 200 4.060 4. 040 +.5 300 4.612 4.619 -.1 400 5.218 5.221 .0 500 5.794 5.792 . 0
276
• •
taincd from NBS Circular 564 (Nov. 1955), which tabulates heat-transport properties for a number of gase~. The constants of these equations were obtalI~ed by the m ethod of least squares. 'i-alues of lc given 111 column 3 of table 2 are calculated from these equations. Column 4 gives the deyiation s of the observed results from these calculated values . Thel results are also given in figure 3, where the ClI'C es represent observed values and the solid lin es the values from the above equation s.
The empirical eq (10) and (11) fit the obserYCd values at 50- and 100-atm pressure r espectivelY a.h:l0st 3;s well as would be expected 'from t he pr'c~ C1SlOn of the data. The averaO'e deviation of eq (10) (which is linear in t) from th~ observed cOllCluct i',"ities is only 0.1 percen t, with f1 maximum deYiatlOn of 0.3 ,Percent. The deviations from eq (11) are also qUite small except below 200°C where ther~ was .increased difficulty, both. experi~entally and 111 fi~tll:g the observed POll1ts WIth an equation. The devlatlOI1S of eq (9) from the observed values seem to be larger than can be attributed to experimental enol's. Equation (9) is the same semiempirical equation proposed by Eucken [3], except for the constant factor. A factor of 1.059 was found t? fit the present data, as compared to a factor of 1. o['JgI n ally proposed by Eucken. 1101'e recell t modlficatlOns of Eucken's equation by other investigators generally h ave predicted a value slio'hth~ greater .than 1. An alte rnative equation fo~ 0.7 atn:, wInch ftts well up to 400°C, and which may he eaSler for use in llumerical interpolatioll in < tllis region, is
lc = 2.495 X 10- 4 + 6.366 X l 0- 7t - 1.065 X 1O- 10t". (12)
65 ,----,----,-----,---------~--~
U')
o x 60
T 0>
'" '0 55 T E u
~ 50 '0 ~
245 >f-
> t; 40 ~ o z 8 35 ..J <t ~
~ 30 I f-
P=IOO aIm 104 k=3.161 + 2 .9317 X 1O- 3 t
+9.0761 X 10-St2
-8.8318 X 10- 9 t 3 --
P=50alm 10 4 k=2 .714+0.005897 t
P=0.7olm
- - k= 1.059T)(Cv+~R )
25~--~------------------------~ o 100 200 300 400 500 600
TEMPERATURE (t) , °C
FIG VR E 3. Thermal conductivity of nitrogen.
•
where le is-in w cm- I deg-\ a nd t is in deg C. AI-though all of these equatio ns are suitable for inter polation at their respective pressures, they may not be valid for extrapolat ion beyond the experimental range. Equation (9) is probabl:l- the most s uitable for extrapolation to higher temperatures.
5. Discussion of Results
5.1. Accuracy
In order to estimate the accuraCI" of the final res ults, i t is necessar.l" to consider the eHect of each of the terms in the conductivi t:l" equation
le= 0.0885516Q. O!:::,. t
The constanL 0.0885516 is a co nv ersion facLor to allow for the system. of units. IL has negligible uncertainty in its use here. Some possible sources of elTor ill the meas ured capacit a nce, 0, are the
- ---- ----------------
capacitance belween electric leads and the relatively large capaciLa nce to ground (the guard is grounded) of the hotplate and coldplates. The electric leads were cm·cfu ll.\- shield ed to avoid significant error from this source. The cHect of t he ground capaeitan ce is largel.\" eliminated by the design of the bridge used in its measurernent . Use of a substitution method that compares the conductivit.\"-cell ca pacitance with that of a standard capacitor minimizes a number of possible errors. B.\- usin g this method, it is believed that this comparison is aeeurate t o better than 0.1 pereent. The absolu te value of the standard capacitor is certified b~- t he NBS (with a high probability) to only 0.3 percent.
In the experiments with nit rogen, the effect of the dielectrie constant of the gas must be consid ered. It is estimated that un certainty in the valu e of the dielectric constant of nitrogen is less than 0.01 percent, giving the same un ccrtaint:\" in o and le . The total uncertainty in th e capac it anC't' measurement is believed to be abo ut 0.3 perce nt. . This is the largest un cerLa int:I' in most of the measureme nt s, and it is based on 1 chance in ] 0 that the elTOr will he larger than O.:~ percent.
· . 0 ~ N as ( EQ UAT IO N III
- 5 0
0 - 10 PR ESSURE· 100 olm
;'
V> Z 0
~ " @ 0 ~
00
V> V
"' • z + ~ NBS (EO UAT IO N 10j
'" -3 PRE SSU RE · 50 o lm
0 ~
G
@ . • ' ' ''--- NBS @ G • • (EOU ATION 9) Xa> as x«> • • x • e
~ ·0 e - 5 e e
e e
PRESSURE · 10 1m
- 10 100 200 300 4 00 500 600 700 BOO 900 1000
TEMPERATURE , °c
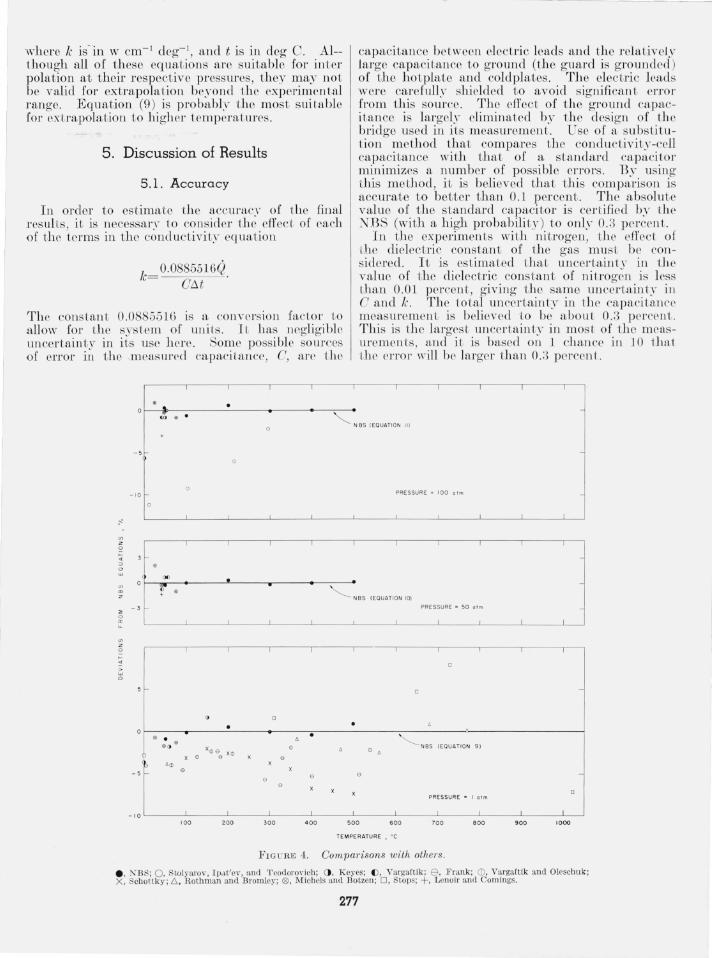
FIG L' m } 4. Comparisons with others.
e, ~B~ ; 0, SloJ)·arov, 1p"t'e\' , and 'L'eodoJ'ov icb ; (), K eyes; {), Vargaft ik; 8 . Frank ; <D, Vargaftik and Oleschuk; X, Schottky ; b. , Rothman and Bromley; 0 , Michels and Bolzen ; 0 , Stops; +. Lenou· and Comlllgs.
277

The factor Q in eq (2 ) is evaluated from the t wo powers Wand VfTT ' The electrical measurement of W is believed to have negligible error. The uncertainty in the value of TiVT determined from vacuum experiments is estimated to be less than 0.1 percent, except at the highest temperatures, where it may be as large as 0.1 to 0.2 percent. It is possible that the vacuum experiments do not accoun t completely for all heat flow (other than Q) from the hotplate eluring the gas experiments. This ma\~ be du e to imperfect matching of the guard tempei'ature to the hotplate temperature. It is estimated that the elTor from this source is less t han 0.1 percent.
The measurement of t::.t , which has been discussed earlier, has an estimated uncertainty of 0.002 deg C. This introduces uncertainties in the values of k of from 0.02 to 0.2 percent , depending on the m agnitude of. t::.t. The uncertainty in th e temperature scale, estlmated to be about 0.01 deg 0, is believed to in troduce negligible error in k.
In estimating the over-all accuracy of the r esults the authors believe that with most of the l"esults' there is only 1 cha nce inl0 that the true concluctiv i t\~ values will deviate more than 0.5 percent from 01'e observed values given in table 2. In the case of a few values at the highest pressures, it is believed that this tolerance might be in creased by as much flS 1 percent.
5 .2. Comparison With Others
. A comparison of the results of this investigation " -I tit the observed conductivity values from some other recent researches is given in figure 4. ~ 0
attemp t was made to inelude in the fi gure all the aVailable data at low temperatures and low pressures, al though all known high-pressure data are given. The data are plotted as deviations from eq (9), (10), and (11), which represent the NBS data for the three pressure rangrs . At lo \\~ pressures (approximately 1
a tm), Frank [4] and Schottky [5] made measurements up to 500 0 C, Ro thman and Bromley [6] up to 800 0
C, Stops [7] up to 1,020 0 C, ~1ichels and Botzen [8] up to 750 C, and Vargaftik and Oleschuk [9] up to 541 0 C. K eyes and Sandell [10] have also made mea~urements up to 400 0 C at various pressures. Th~n' results ar~ not shown h ere because they believe thell' conductlvity vaJues to be too low over most of th e temperature range. Later observed yalues of Keyos [11] up to 150 0 C are shown. Further measurcm ents by K eyes [12] have becn made up to about 3500 C, but no observed values of conduct ivity have been published . At higher pressures, ~Ii chel s and Botzen [8] made m easurem ents up to 2,500 atm and 75 0 C, Stolyarov, Ipat 'ev, and T eodoroyich [13] up to 300 atm and 300 0 C, Vargaftik [4] up to 90 atm and 62 0 C, and Lenoir and Comings [15] up to 200 atm at 41 0 C. As in the low-pressure l11E'aSllremcnts the results of Keyes and Sandell ar c not s hmnl : although later rcsults of K eyes are gin ll up to 100 atm and 50 0 C.
6. References
[1] Handbook der Phys ik 12, 517 (1927) . [2J XBS Circular 564 (November 1955). [3J Physik Z. 2, 1101 (1911). [4] Z. E lektrochem. 55, 636 (195 1) . [5] Z. E lektlochem. 56, 889 (1952) . [6J Ind . Eng. Chem. 47, 899 (1955). [7J ~ ature 164, 966 (1949) . 18] Physica 18, 605 (952) . [91 IzvesL VTI 15, #6, 7 (1946) .
[10] Trans . ASME 72,767 (1950). [tlJ Trans. ASME 73, 597 (1951) . [12J Trans. ASME 74, 1303 (1952). [13] J. PhYR. Chcm. (U. S. S. R.) 24, 166 (1950) . [14] T ech. Phys. U. S. S. R. 4, 341 (1937). [15J Chern. Eng. Progr. 47, 228 (1 951). [16] E. H . Kennard, K inetic theor.v of gases ( :'I IcGra,,--Hill
Book Co ., I nc., New York, N. Y., 1938) .
VY-~SI-IIXG'rON, December 27 , 1956.
278


![Thermal conductivity reduction in graphene with …...rounding the thermal transport properties. As regards the heat transport of tuning graphene, investigations of isotope [18], nitrogen](https://img.pdfslide.us/doc/110x75/5fda9edff35a643bca2fc359/thermal-conductivity-reduction-in-graphene-with-rounding-the-thermal-transport.jpg)