Embed Size (px)
Citation preview

PNNL-13911
Thermal Conductivity and Shear Strength of K Basin Sludge A. P. Poloski P. R. Bredt A. Schmidt R. G. Swoboda J. W. Chenault S. R. Gano June 2002 Prepared for the U.S. Department of Energy under Contract DE-AC06-76RL01830

DISCLAIMER
This report was prepared as an account of work sponsored by an agency of the United States Government. Neither the United States Government nor any agency thereof, nor Battelle Memorial Institute, nor any of their employees, makes any warranty, express or implied, or assumes any legal liability or responsibility for the accuracy, completeness, or usefulness of any information, apparatus, product, or process disclosed, or represents that its use would not infringe privately owned rights. Reference herein to any specific commercial product, process, or service by trade name, trademark, manufacturer, or otherwise does not necessarily constitute or imply its endorsement, recommendation, or favoring by the United States Government or any agency thereof, or Battelle Memorial Institute. The views and opinions of authors expressed herein do not necessarily state or reflect those of the United States Government or any agency thereof.
PACIFIC NORTHWEST NATIONAL LABORATORY operated by BATTELLE
for the UNITED STATES DEPARTMENT OF ENERGY
under Contract DE-AC06-76RL01830
Printed in the United States of America
Available to DOE and DOE contractors from the Office of Scientific and Technical Information,
P.O. Box 62, Oak Ridge, TN 37831-0062; ph: (865) 576-8401 fax: (865) 576-5728
email: [email protected]
Available to the public from the National Technical Information Service, U.S. Department of Commerce, 5285 Port Royal Rd., Springfield, VA 22161
ph: (800) 553-6847 fax: (703) 605-6900
email: [email protected] online ordering: http://www.ntis.gov/ordering.htm
This document was printed on recycled paper. (8/00)
PNNL-13911
Thermal Conductivity and Shear Strength of K Basin Sludge A. P. Poloski P. R. Bredt A. Schmidt R. G. Swoboda J. W. Chenault S. R. Gano June 2002 Prepared for the U.S. Department of Energy under Contract DE-AC06-76RL01830

Summary To provide input for the design and modeling of sludge storage systems, Pacific Northwest National Laboratory, under contract to the Fluor Hanford Spent Nuclear Fuel (SNF) Project, performed thermal conductivity and shear strength measurements on representative sludge samples from the Hanford K East (KE) Basin: floor sludge, canister sludge, and a composite of floor and canister sludge plus spent fuel fragments. This work was performed in the High Level Radiochemistry Facility (hot cells) located in the Radiochemical Processing Laboratory in the Hanford 300 Area. K Basin sludge contains metallic uranium and uranium oxides that will corrode, hydrate, and, consequently, generate heat and hydrogen gas during storage. Heat is generated within the sludge by radiolytic decay and the reaction of uranium metal with water. For maintaining thermal stability, the sludge must be retrieved, staged, transported, and stored in systems designed to provide a rate of heat removal that prevents the temperature from increasing beyond acceptable limits. To support dispositioning the sludge to T Plant, modeling and experimental testing and analyses are being performed to predict the behavior of the material when placed into the storage containers. Two physical properties of the sludge that are critical to the modeling and testing/analyses efforts are thermal conductivity and sludge shear strength (yield stress). The thermal conductivity for a material is defined as the ratio of steady-state heat flow by conduction across a surface (heat transfer per unit area per unit time) to the temperature gradient at the surface. The thermal conductivity of the K Basin sludge must be known in order to accurately predict the rate of heat removal and the temperature of the sludge within a storage container. For saturated settled solid particles, such as the K Basin sludge, the shear strength (or yield stress) is the maximum stress force that can be applied to a material before it deforms. The shear strength of the sludge is important for predicting the mobilization behavior during retrieval. Additionally, the shear strength will affect how uranium metal fragments are distributed while the storage container is being filled. If sludge deposited in a container exhibits little or no cohesion or strength, incoming uranium metal fuel particles will pass through and accumulate on the bottom of the vessel. Shear strength is also the dominating physical property of the sludge in determining whether it can support a vessel spanning gas bubble. Furthermore, shear strength data are needed to predict the quantity of gas that can be retained in the sludge matrix when uniform gas generation occurs (i.e., uniform distribution of metallic uranium particles). Further explanation on the rationale for thermal conductivity and shear strength measurements on K Basin sludge samples is provided in the Data Quality Objectives for Analysis of Hanford K Basins Sludge to Support Transport to and Storage in T Plant (Makenas 2000) and the Sampling and Analysis Plan for Sludge from 105-K Basins to Support Transport to and Storage in T Plant (Baker et al. 2000). Thermal Conductivity Measurements Twelve samples of KE Basin sludge, collected from the North Loadout Pit, the Weasel Pit, the basin floor (several locations), and the canisters, were used for the thermal conductivity measurements. One sample, SNF + Sludge Composite (SNF Comp), was a mixture of fuel fragments and KE Basin floor and canister sludge. The settled density and weight fraction solids of the sludge samples were determined in parallel with the thermal conductivity measurements to allow better data interpretation and modeling.
iii

The instrument used for the measurements was a Hukseflux TPSYS02 system with a needle probe, using a non-steady-state method in accordance with ASTM D 5334-92. Before the actual sludge samples were measured, the equipment and method were tested extensively at room temperatures using standards and simulants. This initial testing demonstrated the reproducibility and accuracy of the Hukseflux system for the type of samples analyzed (saturated sludges). For the thermal conductivity measurements of the sludge, each sample was measured at least three times, and the average value and the standard deviation reported (see Table S.1). The measurements were performed at ambient hot cell temperature, which ranged from 29°C to 41°C. The percent standard deviations from multiple measurements ranged from 1.5% to about 6%, confirming good reproducibility. For most of the samples, essentially the same thermal conductivity value was measured. Excluding the sludge samples from the North Loadout Pit (1.03 W/mK), the Weasel Pit (0.86 W/mK), KC-5 P250 (0.80 W/mK – large-particle floor sludge, away from canisters), and KC-2/3 M250 (0.81 W/mK – small-particle canister sludge), the average thermal conductivity of the remaining eight sludge samples was 0.70 (standard deviation of 0.014) W/mK. In general, no direct trends were evident on the relationship between thermal conductivity and chemical composition, particle size, settled density, or mass fraction water. The relationship is more likely a complex combination of these properties along with oxidation states and crystalline structures. However, the volume fraction water (void fraction) for the all of the K Basin sludge samples was similar; 0.77 on average, with a standard deviation of 12%. The thermal conductivities of the sludge samples were only a little higher than that of water (~0.60 W/mK). [As another comparison, the range of thermal conductivities of the sludges fell into the lower region of that expected for saturated sands and soils.] The high water content and the abundance of hydrated species in the sludges likely contributed to the relatively low values. The similar and relatively high volume fraction water in the K Basin sludge samples appears to be a dominating factor affecting the thermal conductivity. For nominal design modeling and calculations, a thermal conductivity on the low end of the measured range is desired. Therefore, a thermal conductivity of 0.70 W/mK is judged to provide both a reasonable and a defensible value for all KE Basin sludge types. Shear Strength Measurements Shear strength measurements were performed on six K Basin sludge samples [collected from the North Loadout Pit, the Weasel Pit, the basin floor (several locations), and the canisters]. SNF Comp was also measured. The shear strengths were determined using a shear vane and a Haake M5 measuring head. The vane is rotated at a constant angular velocity, typically 0.3 rpm or 0.6 rpm, and the force required to maintain this angular velocity was measured as a function of time. Material that exhibits a shear strength shows a maximum torque value in a relatively small degree of rotation. Shear strengths were calculated from the measured maximum torque values. Prior to and during the testing with K Basin sludge samples, the performance of the Haake M5 measuring head and the entire system, located in a hot cell, was checked with standards and known slurries. The system performance was validated, and the shear strength results obtained with the system in the hot cell, using known slurries, compared favorably with those obtained from several other instruments.
iv

v
Table S.1. Summary of Thermal Conductivity, Settled Solids Density, Wt% Water, and Void Fraction Results
Sludge Sample Sample Description
Thermal Conductivity, W/mK (standard
deviation) Settled Sludge Density, g/cm3
Wt% Water
Void Fraction (Volume
Fraction Water) KE Basin Floor Sludge Samples
FE-3 (whole)
North Loadout Pit sludge 1.03 (±0.05) 1.35 54 0.76
FE-5 (whole)
Weasel Pit sludge 0.86 (±0.04) 1.47 44 0.65
KC-4 (whole)
Floor sludge from between canisters 0.72 (±0.04) 1.26 64 0.81
KC-4 M250 Floor sludge from between canisters (minus 250-µm fraction)
0.69 (±0.04) 1.53 68 0.82
KC-4 P250 Floor sludge from between canisters (plus 250-µm fraction) – Reconstituted(a)
0.70 (±0.03) 1.49 54 0.81
KC-5 (whole)
Floor sludge from main basin 0.72 (±0.03) 1.28 66 0.84
KC-5 M250 Floor sludge from main basin (minus 250-µm fraction)
0.69 (±0.01) 1.29 73 0.94
KC-5 P250 Floor sludge from main basin (plus 250-µm fraction) – Reconstituted(a)
0.80 (±0.02) 1.43 48 0.69
KE Basin Canister Sludge Samples KC-2/3 (whole)
Canister sludge composite 0.70 (±0.04) 1.30 54 0.70
KC-2/3 M250
Canister sludge (minus 250-µm fraction) 0.81 (±0.06) 2.15 44 0.88
96-13 Canister sludge collected in 1996 – Reconstituted(a)
0.68 (±0.04) 2.67 26 0.64
KE Basin Floor + Canister Sludge + Fuel Fragments SNF + Sludge Composite
By volume, ~64% floor sludge, ~26% canister sludge, ~7% fuel corrosion product (e.g., U4O9), and ~3% uranium fuel fragments
0.70 (±0.03) 2.32 31 0.72
(a) Reconstituted – sludge sample dried out and was reconstituted to a settled sludge state through the addition of K Basin water and aggressive mixing.

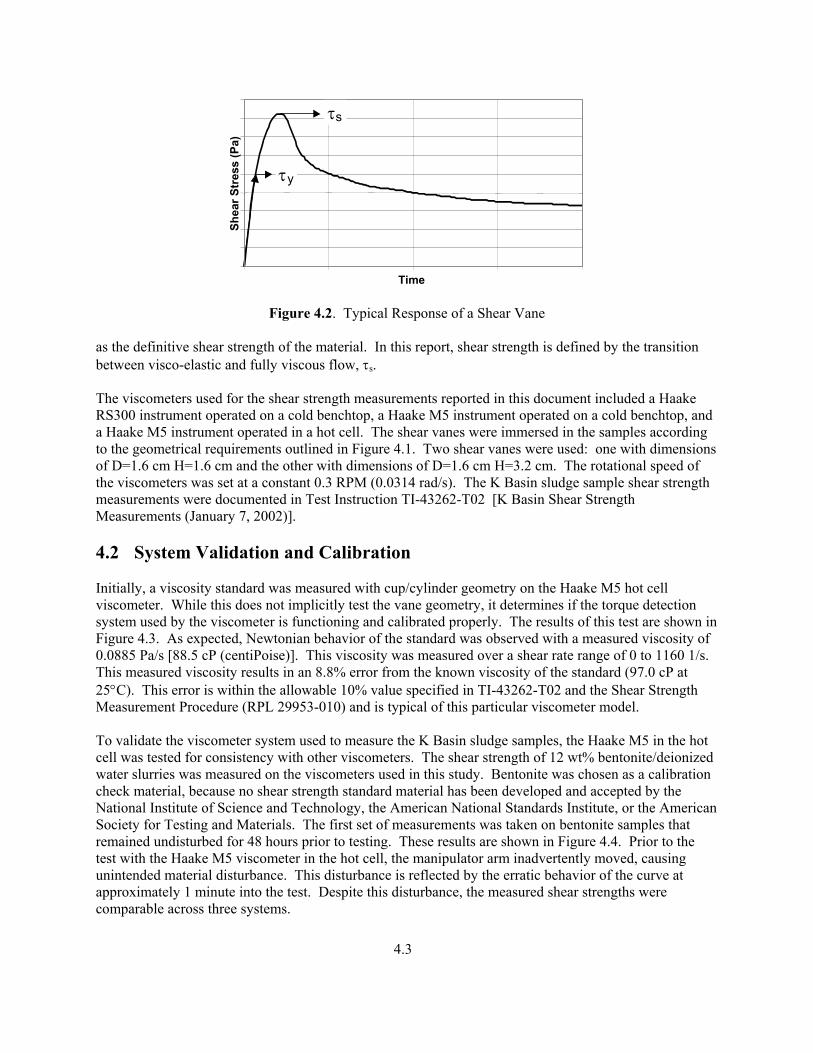
Table S.2 presents the results of the shear strength measurements for the sludge samples at several settling times. Measurements were performed on “as-received sludge”; sludge that was disturbed and allowed 48 hours to re-settle/reconsolidate; and sludge that was disturbed and allowed 5 days to reconsolidate. The “as-received sludge” had not been disturbed for more than 20 days; however, several days before the measurements were made, the samples were moved through several cell areas, using relatively large manipulators, to the cell containing the yield strength test apparatus. While the samples were being moved, the sludge may have been partially disturbed. Shear strength increased significantly with settling time for the Weasel Pit (FE-5), canister (KC-2/3), and the SNF Comp sludges. For the North Loadout Pit (FE-3) and floor sludges (KC-4 and KC-5), the shear strength was either constant or varied randomly with settling time. The shear strength values in Table S.2 (240 to 8200 Pa) are generally higher than most values obtained during previous characterization efforts (most samples were 100 to 500 Pa). Two factors likely contributed to the higher values: sample history (handling and aging) and the presence of large-diameter particles (i.e., particles greater than 250 µm). The sludge samples analyzed were collected in 1999. During the time the samples were stored, metallic uranium and other compounds likely experienced some oxidation and hydration, resulting in physical changes to the sludge. The samples have also been subjected to considerable handling during characterization and process testing (e.g., recovery from sample canister, settling tests, multiple transfers). Samples KC-4, KC-5, and a portion of the material in KC-2/3 were used in ambient-temperature gas generation tests. The SNF Comp sample was held at elevated temperatures for a period of weeks. While handling and aging likely affected the shear strength of the sludge samples, the actual K Basin sludge will also be subjected to handling during retrieval (i.e., it will be pumped through several hundred feet of hose at velocities around 10 ft/sec), and will be stored in T Plant for a number of years. It should be noted that the sludge samples tested (though previously handled and stored) represent the best sludge sample material remaining at the hot cells from characterization activities over the past 4 years. Obtaining new representative samples from the K Basins was not an option because of the significant resources and time required. All samples analyzed for shear strength in this study (Table S.2) were “whole” samples, containing the entire sample particle size distribution, including some fraction of particles greater than 250 µm. During previous characterization efforts, all shear strength measurements were made on individual segregated layers (formed during settling tests) or size-fractionated subsamples of whole samples. Measurements performed in 1999 on size-fractionated subsamples of KC-4 and KC-5, containing only particles greater than 250 µm, gave shear strength values of 2700 Pa and 2800 Pa, respectively. In comparison, the size-fractionated subsamples of KC-4 and KC-5 that contained only particles less than 250 µm exhibited shear strengths of 300 Pa and 270 Pa, respectively. In general, to produce reliable results from the shear vane test system, the test material should be saturated, fine grained, and homogeneous. However, neither the method nor the vendor literature specify a maximum particle size for a valid shear strength measurement. The test container and vane were set up to maintain the recommended clearance between the vane and container wall (i.e., space between the vane and the wall was significantly greater than ¼ in., the maximum potential particle size possible in the sludge sample material). Also, the results from KC-4 “whole” (15 wt%, dry basis, particles greater than 250 µm) in Table S.2 (330 Pa to 480 Pa) are comparable to the value of 300 Pa obtained previously for the KC-4 minus 250-µm fraction in 1999. Consequently, the reliability of the data in Table S.2 cannot be significantly discounted based on the presence of larger-diameter particles.
vi

vii
Table S.2. K Basin Sludge Shear Strength vs. Settling Time
Sludge Sample Sample Description
Days of Settling(a)
Average Shear
Strength, Pa Standard
Deviation, Pa
Number of Valid
Measurements KE Basin Pit and Floor Sludge Samples
2 760 340 35 920 10(b) 2
FE-3 (whole)
North Loadout Pit. Prepared from 2 core samples collected in Jun. 1999. About 80 wt% (dry) is made up of particles between 250 µm and 1410 µm. U content: ~1.7 wt% (dry)
+20 240 61 5
2 1100 -- 15 1800 640 4
FE-5 (whole)
Weasel Pit. Prepared from 2 core samples collected in Jan. and Apr. 1999. About 70 wt% (dry) is made up of particles less than 250 µm. U content: ~5 wt% (dry). +20 4000 750 5
2 480 -- 15 330 80(b) 2
KC-4 (whole)
Floor, between slotted canisters. Prepared from 3 sample locations; collected in Mar. 1999. About 85 wt% (dry) is made up of particles less than 250 µm. U content: ~17 wt% (dry).
+20 400 160 4
2 1100 -- 15 1600 100(b) 2
KC-5 (whole)
Floor, away from canisters. Prepared from 3 sample locations; collected in Mar. 1999. Only about 36 wt% (dry) is made up of particles less than 250 µm. U content: ~6 wt% (dry). After being stored in the hot cell, sample was found moist in Oct. 2001 but not saturated.
+20 1000 150 3
KE Canister Sludge Samples 2 5700 1700 35 4600 560 3
KC-2/3 (whole)
Canister Sludge Composite. Prepared from 10 sample locations; collected in Mar. and Apr. 1999. About 72 wt% (dry) is made up of particles less than 250 µm. U content: ~60 wt% (dry). A portion of the sludge used was found moist in Oct. 2001 but not saturated.
+20 8200 4000 3
KE Basin Floor + Canister Sludge + Fuel Fragments 2 740 -- 15 No valid measurements obtained
SNF + Sludge Composite
By volume, ~64% floor sludge, ~26% canister sludge, ~7% fuel corrosion product (e.g., U4O9), and ~3% uranium fuel fragments. About 20% to 30% of the material added to composite was dry sludge and fuel fragments.
+20 1900 -- 1
(a) Measurements obtained at settling time identified as “+20 days” (also designated “as-received sludge”) were performed just after moving settled sludge samples through several hot cells. The settled sludge may have been disturbed during the sample transport.
(b) For measurements with only two observations, the value given is the range between the average and the measurements.

While most of the shear strength data obtained in previous characterization activities was significantly lower than those measured in this study, a technical justification for discounting either set of data was not found. The technical reasons for the differences were substantiated based on functionality checks on the equipment and independent verification of the calculations. Calculations and analyses requiring K Basin shear strength data should include both previously determined values and the values given in this report. The results of combining the data sets is a wide range of yield strength values for the sludge: 1 to 8200 Pa. Consequently, the analyst performing the calculations will have to consider either the total range or the source and handling of a specific sludge stream, making a case for using a subset of the observed values based on technical merits or design considerations. References American Society for Testing and Materials (ASTM). D 5334-92, Standard Test Method for Determinination of Thermal Conductivity of Soil and Soft Rock by Thermal Needle Probe Procedure. West Conshohocken, PA. Baker, R. B., T. L. Welsh, and B. J. Makenas. 2000. Sampling and Analysis Plan for Sludge from the 105-K Basins to Support Transport and Storage in T Plant. HNF-6479, Rev. 0, Fluor Hanford, Inc., Richland, WA. Makenas, B. J. 2000. Data Quality Objectives for Analysis of Hanford K Basins Sludge to Support Transport to and Storage in T Plant. HNF-5345, Rev. 0, Fluor Hanford, Richland, WA.
viii

Contents Summary ............................................................................................................................................ iii 1.0 Introduction ............................................................................................................................... 1.1 2.0 K Basin Sludge Materials Tested .............................................................................................. 2.1 3.0 Thermal Conductivity Measurements........................................................................................ 3.1 3.1 Measurement Equipment and Theory ............................................................................... 3.1 3.2 System Validation and Calibration ................................................................................... 3.4 3.3 Description of Simulants ................................................................................................... 3.4 3.4 Results from Thermal Conductivity Measurements of Standards and Simulants ............. 3.5 3.5 Results from Thermal Conductivity Measurements of K Basin Sludge Samples............. 3.7 4.0 Shear Strength Measurements ................................................................................................... 4.1 4.1 Measurement Equipment and Theory ............................................................................... 4.1 4.2 System Validation and Calibration ................................................................................... 4.3 4.3 Results ............................................................................................................................... 4.5 5.0 References ................................................................................................................................ 5.1 Appendix A - Thermal Conductivity Data......................................................................................... A.1 Appendix B - Shear Strength Measurement Plots ............................................................................. B.1
ix

Figures 3.1 System Diagram of Hukseflux TPSYS02.................................................................................. 3.2 3.2 TP02 Plot (Water + Agar) for Determining Thermal Conductivity .......................................... 3.2 3.3 TP02 Plot (Canister Sludge Sample KC-2/3 M250) for Determining Thermal Conductivity... 3.3 3.4 Data Analysis for Determining Thermal Conductivity of Sample FE-3, North Loadout Pit .... 3.3 4.1 Geometrical Requirements of a Shear Vane.............................................................................. 4.2 4.2 Typical Response of a Shear Vane ............................................................................................ 4.3 4.3 Viscometer Calibration Check with 97.0 cP Viscosity Standard .............................................. 4.4 4.4 Shear Strength of 12 Wt% Bentonite Suspension Aged 48 Hours ............................................ 4.4 4.5 Shear Strength of Recently Disturbed 12 Wt% Bentonite Suspension ..................................... 4.5 4.6 Shear Stress Response of As-Received K Basin Sludge Sample FE-3 ..................................... 4.7
x
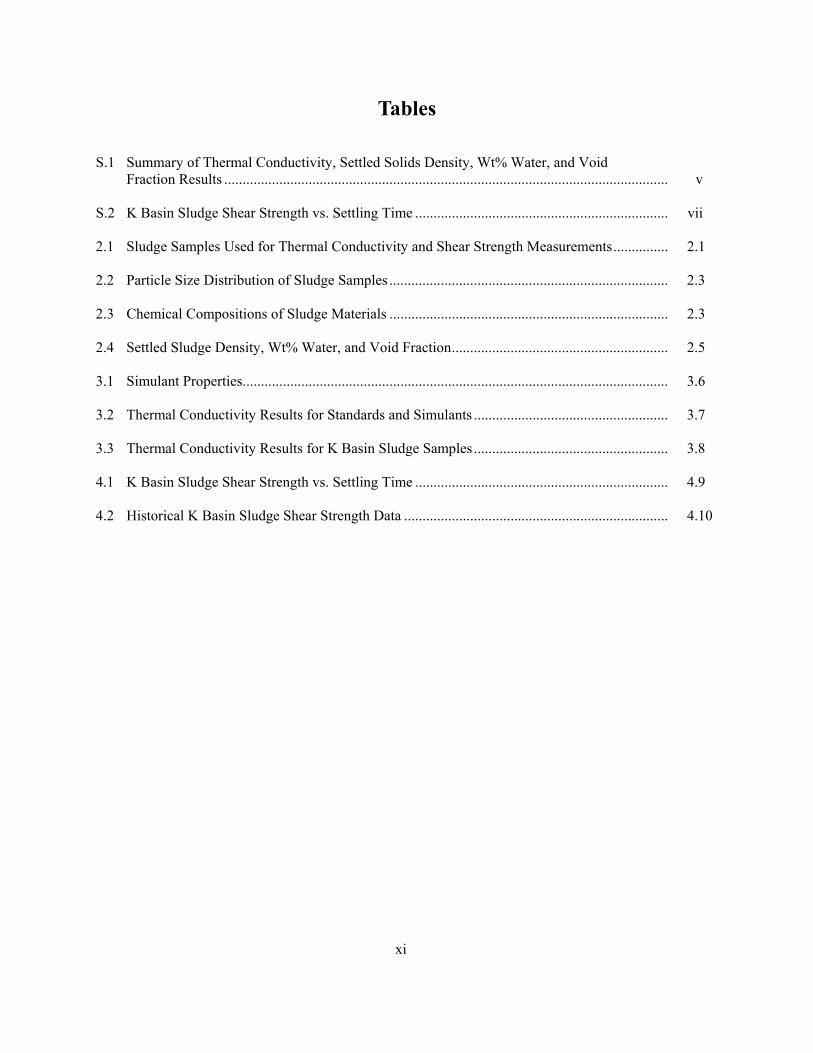
Tables S.1 Summary of Thermal Conductivity, Settled Solids Density, Wt% Water, and Void Fraction Results ......................................................................................................................... v S.2 K Basin Sludge Shear Strength vs. Settling Time ..................................................................... vii 2.1 Sludge Samples Used for Thermal Conductivity and Shear Strength Measurements............... 2.1 2.2 Particle Size Distribution of Sludge Samples ............................................................................ 2.3 2.3 Chemical Compositions of Sludge Materials ............................................................................ 2.3 2.4 Settled Sludge Density, Wt% Water, and Void Fraction........................................................... 2.5 3.1 Simulant Properties.................................................................................................................... 3.6 3.2 Thermal Conductivity Results for Standards and Simulants ..................................................... 3.7 3.3 Thermal Conductivity Results for K Basin Sludge Samples..................................................... 3.8 4.1 K Basin Sludge Shear Strength vs. Settling Time ..................................................................... 4.9 4.2 Historical K Basin Sludge Shear Strength Data ........................................................................ 4.10
xi

1.0 Introduction The Hanford K Basin sludge will be managed as two general waste streams: K East (KE) floor, pit, and canister sludge containing relatively low concentrations of fuel particles; and K West (KW) sludge, some of which will contain relatively high concentrations of fuel particles and graphoil. The KE sludge, which comprises the majority of the total K Basin sludge inventory, will be loaded into large-diameter containers (approximately 5 ft in diameter and 10 ft high) and stored in process cells at T Plant in the Hanford 200 Area. The KW sludge will be loaded into small-diameter containers (~1 ft diameter) and stored underwater in the T Plant fuel pool. The presence of metallic uranium fuel particles in the K Basin sludge(a) creates the primary technical challenge to the design of the storage systems. The metallic uranium and uranium oxides within the sludge will corrode, hydrate, and, consequently, generate heat and hydrogen gas during storage. To support dispositioning the sludge to T Plant, models have been developed and experimental testing and analyses are being performed to predict the behavior of sludge when placed into the storage containers. These efforts have shown that optimal conditions for safe storage of sludge occur when the metallic uranium fuel particles are uniformly distributed in the storage container. Two physical properties of the sludge that are critical to the modeling and testing/analyses efforts are thermal conductivity and sludge shear strength (yield stress). Heat is generated within the sludge by two general mechanisms: radiolytic decay and chemical reactions. The reaction of uranium metal and water (dominant heat-generating reaction) releases hydrogen gas and energy, and the rate of this reaction increases exponentially with temperature. To maintain thermal stability, the sludge must be retrieved, staged, transported, and stored in systems designed to provide a rate of heat removal that prevents the temperature in the sludge from rising above established limits (currently defined as below the sludge boiling point). The thermal conductivity of the sludge must be known so that the rate of heat removal and the temperature of the sludge are accurately estimated for storage system design. Hydrogen gas bubbles generated during the corrosion of metallic uranium and uranium oxides will escape the sludge matrix, accumulate in pockets, or be retained in the sludge as discrete bubbles. Terrones and Gauglitz (2002) evaluated the potential formation of vessel spanning bubbles in K Basin sludge stored in large-diameter containers. Gauglitz and Terrones (2002) examined gas retention within containerized K Basin sludge under the conditions of uniform gas generation. Shear strength, defined as the maximum stress force that can be applied before the sludge deforms, is the key physical sludge property that affects the fate of generated gas bubbles. The purpose of this report is to provide the results of thermal conductivity and shear strength measure-ments performed on K Basin sludge samples collected from the KE Basin floor, pits, and canisters. These physical property data will be used in modeling and assessments to design and validate sludge storage systems. Further explanation on the rationale for thermal conductivity and shear strength measurements on K Basin sludge samples is provided in the Data Quality Objectives for Analysis of Hanford K Basins Sludge to Support Transport to and Storage in T Plant (Makenas 2000) and the Sampling and Analysis
(a) A detailed description of the inventory and compositions of all K Basin sludge materials is given in Pearce
(2001).
1.1

Plan for Sludge from 105-K Basins to Support Transport to and Storage in T Plant (Baker et al. 2000). The work was conducted in the Hanford 300 Area High Level Radiochemistry Facility (hot cells) by Pacific Northwest National Laboratory (PNNL) under contract to the Fluor Hanford Spent Nuclear Fuel (SNF) Project. Section 2.0 of this report describes the K Basin sludge samples used for the testing. The sample history, chemical composition, particle size distribution, and settled density and fraction water data are included. Thermal conductivity measurements are given in Section 3.0, which includes measurements on a number of simulants and 12 KE Basin sludge samples. Section 4.0 provides the shear strength measurement results from 6 KE Basin sludge samples. The shear strength results are also compared with shear strength measurements performed on K Basin sludges during previous characterization efforts. Appendix A contains detailed thermal conductivity tables, and Appendix B contains the plots from the shear strength measurements. In accordance with Baker et al. (2000), a full data package will be provided to the Fluor Hanford SNF Sludge Handling Project for the data discussed in this report. This data package will include the completed test instructions, raw data entries, photographs of the sludge samples tested, and supporting quality assurance information.
1.2

2.0 K Basin Sludge Materials Tested The KE Basin sludge samples used for the measurements discussed in this report are identified in Table 2.1. Also listed is the individual sample history, including age, heating, and dehydration/ reconstitution—factors that likely impact thermal conductivity and shear strength. Except for Sample 96-13 (discussed below), the sludge samples were taken from the KE Basin floor, pits or fuel canisters in two sampling campaigns, consolidated sampling and single pull sampling, in FY 1999. The consolidated sampling campaign employed a technique for collecting large quantities of sludge from several locations to form “consolidated samples.” In the single pull campaign, isolated cores of sludge were suctioned into bottles. Detailed descriptions of the sampling equipment and the sampling campaigns are provided by Pitner (1999).
Table 2.1. Sludge Samples Used for Thermal Conductivity and Shear Strength Measurements
Measurements Sample History Sludge Sample Sample Description
Thermal Conductivity
Shear Strength
Year Collected Heated
Dried Out
KE Basin Floor Sludge Samples FE-3, whole
North Loadout Pit Yes Yes 1999 No No
FE-5, whole
Weasel Pit Yes Yes 1999 No No
KC-4, whole
Floor sludge by canisters
Yes Yes 1999 No No
KC-4 M250
KC-4, minus 250-µm fraction
Yes No 1999 No No
KC-4 P250
KC-4, plus 250-µm fraction
Yes No 1999 No Yes
KC-5, whole
Floor sludge, away from canisters
Yes Yes 1999 No No
KC-5 M250
KC-5, minus 250-µm fraction
Yes No 1999 No No
KC-5 P250
KC-5, plus 250-µm fraction
Yes No 1999 No Yes
KE Basin Canister Sludge Samples KC-2/3, whole
Canister sludge composite
Yes Yes 1999 No No
KC-2/3 M250
KC-2/3, minus 250-µm fraction
Yes No 1999 No No
96-13 Canister sludge collected in 1996
Yes No 1996 No Yes
KE Basin Floor + Canister Sludge + Fuel Fragments SNF + Sludge Composite
Floor, Canister, Fuel Fragments
Yes Yes 1999 Yes Small portions
2.1
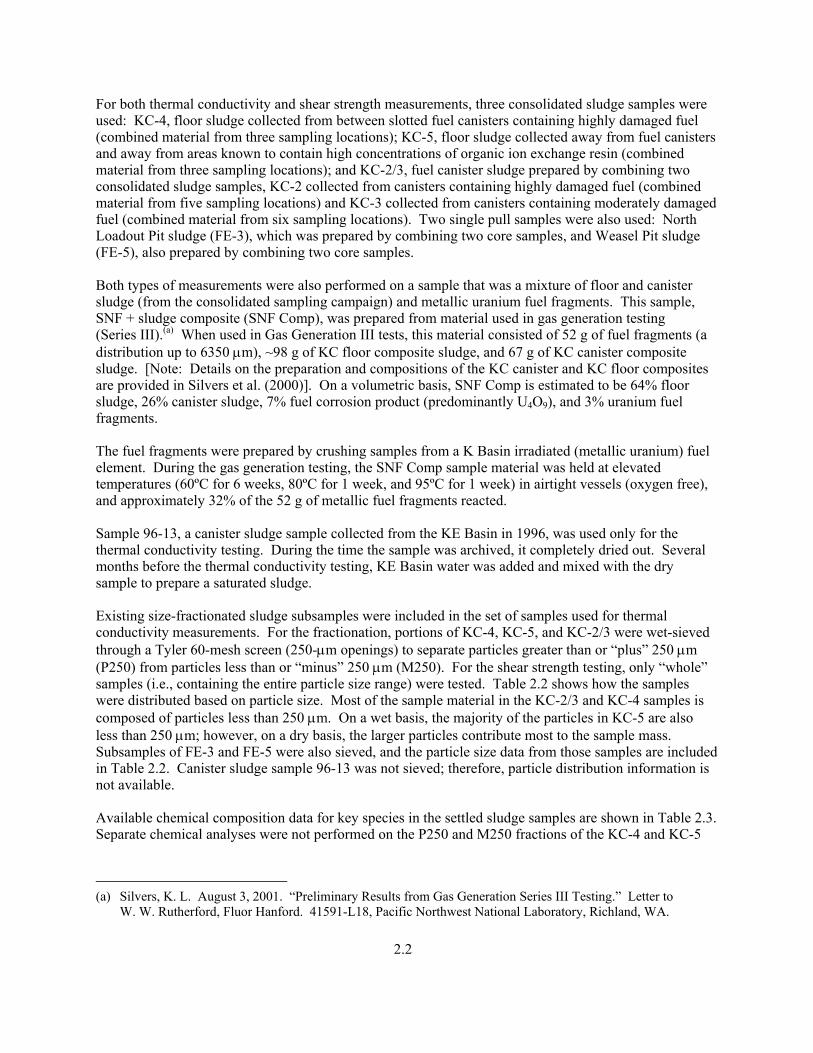
For both thermal conductivity and shear strength measurements, three consolidated sludge samples were used: KC-4, floor sludge collected from between slotted fuel canisters containing highly damaged fuel (combined material from three sampling locations); KC-5, floor sludge collected away from fuel canisters and away from areas known to contain high concentrations of organic ion exchange resin (combined material from three sampling locations); and KC-2/3, fuel canister sludge prepared by combining two consolidated sludge samples, KC-2 collected from canisters containing highly damaged fuel (combined material from five sampling locations) and KC-3 collected from canisters containing moderately damaged fuel (combined material from six sampling locations). Two single pull samples were also used: North Loadout Pit sludge (FE-3), which was prepared by combining two core samples, and Weasel Pit sludge (FE-5), also prepared by combining two core samples. Both types of measurements were also performed on a sample that was a mixture of floor and canister sludge (from the consolidated sampling campaign) and metallic uranium fuel fragments. This sample, SNF + sludge composite (SNF Comp), was prepared from material used in gas generation testing (Series III).(a) When used in Gas Generation III tests, this material consisted of 52 g of fuel fragments (a distribution up to 6350 µm), ~98 g of KC floor composite sludge, and 67 g of KC canister composite sludge. [Note: Details on the preparation and compositions of the KC canister and KC floor composites are provided in Silvers et al. (2000)]. On a volumetric basis, SNF Comp is estimated to be 64% floor sludge, 26% canister sludge, 7% fuel corrosion product (predominantly U4O9), and 3% uranium fuel fragments. The fuel fragments were prepared by crushing samples from a K Basin irradiated (metallic uranium) fuel element. During the gas generation testing, the SNF Comp sample material was held at elevated temperatures (60ºC for 6 weeks, 80ºC for 1 week, and 95ºC for 1 week) in airtight vessels (oxygen free), and approximately 32% of the 52 g of metallic fuel fragments reacted. Sample 96-13, a canister sludge sample collected from the KE Basin in 1996, was used only for the thermal conductivity testing. During the time the sample was archived, it completely dried out. Several months before the thermal conductivity testing, KE Basin water was added and mixed with the dry sample to prepare a saturated sludge. Existing size-fractionated sludge subsamples were included in the set of samples used for thermal conductivity measurements. For the fractionation, portions of KC-4, KC-5, and KC-2/3 were wet-sieved through a Tyler 60-mesh screen (250-µm openings) to separate particles greater than or “plus” 250 µm (P250) from particles less than or “minus” 250 µm (M250). For the shear strength testing, only “whole” samples (i.e., containing the entire particle size range) were tested. Table 2.2 shows how the samples were distributed based on particle size. Most of the sample material in the KC-2/3 and KC-4 samples is composed of particles less than 250 µm. On a wet basis, the majority of the particles in KC-5 are also less than 250 µm; however, on a dry basis, the larger particles contribute most to the sample mass. Subsamples of FE-3 and FE-5 were also sieved, and the particle size data from those samples are included in Table 2.2. Canister sludge sample 96-13 was not sieved; therefore, particle distribution information is not available. Available chemical composition data for key species in the settled sludge samples are shown in Table 2.3. Separate chemical analyses were not performed on the P250 and M250 fractions of the KC-4 and KC-5
(a) Silvers, K. L. August 3, 2001. “Preliminary Results from Gas Generation Series III Testing.” Letter to
W. W. Rutherford, Fluor Hanford. 41591-L18, Pacific Northwest National Laboratory, Richland, WA.
2.2

Table 2.2. Particle Size Distribution of Sludge Samples
Particle Distribution; Wet Basis, wt%
Particle Distribution; Dry Basis, wt%
Sludge Sample P250, 250 to
6350 µm M250,
<250 µm P250, 250 to
6350 µm M250,
<250 µm KC-4(a) 10 90 16 84 KC-5(a) 36 64 64 36 KC-2/3(a) 22 78 28 72 FE-3(b) 91 9 80 19 FE-5(b) 28 72 30 70 (a) Data from Bredt et al. (1999). (b) Data from Bredt et al. (2000).
Table 2.3. Chemical Compositions of Sludge Materials (Wet Basis)
Analyte,
wt% FE-3(a) FE-5(a) KC-4(b) KC-5(c) KC-2/3 M250(c) 96-13(d)
Al 0.473 1.75 2.20 5.43 1.17 1.09 Ca 0.392 0.79 0.333 0.171 0.058 0.0525 Fe 1.61 20.1 7.80 5.71 0.869 0.211 Mg 0.0364 0.096 0.106 0.063 0.018 0.143 Na NM NM 0.116 0.133 0.131 0.0324 Si 0.0734 0.217 1.58 1.94 0.176 NM U, ICP 0.724 4.18 5.74 2.30 42.1 56.2 U, phos. 0.820 3.49 5.37 2.26 41.5 55.7
Analyte, µCi/g
60Co 0.162 0.574 0.349 0.390 0.266 <0.68
137Cs 8.96 112 539 468 244 48.8
154Eu 0.204 0.646 0.835 0.394 5.37 6.87
241Am 2.26 6.85 9.42 4.65 58.5 54.2
238Pu 0.439 1.35 1.58 0.706 10.6 <53
239,240Pu 2.85 8.58 12.6 4.65 74.8 82.9
NM – not measured or no valid data. (a) Data from R. B. Baker and T. L. Welsh, May 10, 2001, Letter Report, “Summary
of Initial Laboratory Data From Consolidated and Single Pull Core Sludge Sampling Campaigns.” 01-SNF/RBB-004, Letter to K. L. Pearce, Fluor Hanford, Richland, WA.
(b) Data from Elmore et al. (2000); values displayed are the average of KC-4 and KC-4 dup.
(c) Data from Elmore et al. (2000). (d) Data from Makenas et al. (1997).
2.3

samples. The canister sludge samples KC-2/3 M250 and 96-13 contain about an order of magnitude more uranium than the floor and pit samples. The Weasel Pit sample (FE-5) contains significantly more iron than the other samples. The KC-5 floor sludge sample contains more aluminum than the other samples. Considering that the North Loadout Pit (also known as the Sand Filter Backwash Pit) sludge (FE-3) is apparently mostly sand, the silicon concentrations reported in Table 2.3 most likely are significantly less than the true values. Settled density and water fraction data are important parameters that affect the thermal conductivity and shear strength of sludge. While historical characterization data for these parameters were available for most of the sludges, because of the age of the sludge samples, settled density and wt% water were determined in parallel with the thermal conductivity measurements. Table 2.4 presents the settled density, wt% water, and void fraction (calculated from density and wt% water) measurements. The values for these parameters determined during previous characterization efforts are also provided. The settled densities of the pit and floor sludge samples fall into a relatively narrow range, 1.26 to 1.49 g/cm3. The wt% water varied significantly for the 12 sludge samples, with an average value of 52% and a percent standard deviation of 28%. In contrast, the void fractions were remarkably similar for all of the sludge samples. The average void fraction was 0.77, with a relative standard deviation of 12%.
2.4

Table 2.4. Settled Sludge Density, Wt% Water, and Void Fraction
Settled Sludge Density, g/cm3 Wt% Water
Sludge Sample
Measured During TC(a)
Testing Reported
Previously
Measured During TC
Testing Reported
Previously
Void Fraction Based on
TC Samples
KE Basin Floor Sludge Samples FE-3 (North Loadout Pit)
1.35 1.23(1) to 1.56(2) 54 52(1) to 80(3) 0.76
FE-5 (Weasel Pit)
(b) 1.43(1) to 1.5(2) 44 34(1) to 54(3) 0.65(c)
KC-4 (Whole) 1.26 1.24(4) 64 68(5) 0.81 KC-4 M250 1.53 1.2(6) 68 68(5) 0.82(d) KC-4 P250 1.49 1.25(6) 54 Not Measured 0.81 KC-5 (Whole) 1.28 1.19(4) 66 65(5) 0.84 KC-5 M250 1.29 1.19(6) 73 65(5) 0.94 KC-5 P250 1.43 1.48(6) 48 57(4) 0.69
KE Basin Canister Sludge Samples KC-2/3 Whole 1.30 2.1(4) 54 ~47(5) 0.70 KC-2/3 M250 (b) 2.1 to 2.2(4) 44 4(5) 0.88(c) 96-13 2.67 2.46(7) 26 24(7) 0.64
KE Basin Floor + Canister Sludge + Fuel Fragments SNF + Sludge Composite
2.32 (e) 31 (e) 0.72
(a) TC = thermal conductivity measurement testing. (b) Due to experimental difficulties, a valid measurement was not obtained. (c) Average of historical data was used to calculate void fraction. (d) Based on settled density and % water data obtained from thermal conductivity subsample,
calculated void fraction is greater than 1. Using historical settled density (1.2 g/cm3), a void fraction of 0.82 is obtained for KC-4 M250.
(e) Sample is unique, and no previous measurements of density or % water exist. References for Previously Reported Data: (1) R. B. Baker and T. L. Welsh, May 10, 2001. Letter Report, “Summary of Initial Laboratory
Data From Consolidated and Single Pull Core Sludge Sampling Campaigns.” 01-SNF/RBB-004, Letter to K. L. Pearce, Fluor Hanford.
(2) Bryan et al. (2001). (3) Bredt et al. (2000). (4) Bredt et al. (1999). (5) Elmore et al. (2000). (6) Delegard et al. (2000). (7) Makenas et al. (1997).
2.5

3.0 Thermal Conductivity Measurements Thermal conductivity measurements were performed on standards, simulants, and K Basin sludge samples. The tests with standards and simulants were conducted to validate the measurement system with wet sands and to collect data for use in interpreting the measurements performed on the actual sludge samples. The sludge samples were analyzed in two batches: samples FE-5, KC-4 M250, KC-5 P250, and KC-2/3 M250 were measured in June/July 2001 [Test Instruction TI-41591-T02, K Basin Sludge Thermal Conductivity Measurements (June 13, 2001)]; the remaining samples were measured in November/ December 2001 [Test Instruction TI-43262-T01, K Basin Sludge Thermal Conductivity Measurements (November 20, 2001)]. The tabular data for each thermal conductivity run are provided in Appendix A. 3.1 Measurement Equipment and Theory The thermal conductivity measurements were performed using a Hukseflux TPSYS02 system with a TP08 non-steady-state probe (Figure 3.1). This system was selected (after a review of a number of thermal conductivity systems) based on its suitability/simplicity for use with radioactive samples, its reasonable cost, and the technical support provided by Hukseflux. The system operates by the non-steady-state method in ASTM D 5334-92 (Standard Test Method for Determination of Thermal Conductivity of Soil and Soft Rock by Thermal Needle Probe Procedure). The TP08 probe (1 mm diameter x 70 mm length) contains a heater wire running the length of the needle and a temperature sensor located approximately halfway down the length. When the heater wire in the probe is energized, there is a short transient period after which the temperature rise (∆T) is dependent on the heater power (Q) and the thermal conductivity of the sample (λ) in accordance with Equation (3.1):
)B)t(ln(4QT +
πλ=∆ (3.1)
where ∆T is the temperature rise (K) Q is the probe power (W/m) λ is the sample thermal conductivity (W/mK) t is the time since heating began (s) B is a constant.
Based on this equation, a plot of Q
T4 ∆π versus ( )tln should yield a straight line with the slope being the
reciprocal of the thermal conductivity. For each measurement, a sample was placed in a container of appropriate geometry (roughly 50 times the probe diameter). Care was taken not to allow the air bubbles to become entrapped within the sample matrix. Next, the probe needle was completely submerged in the sample, but not allowed to touch the bottom of the container. The sample and the probe were then allowed to reach thermal equilibrium with the surrounding environment. After stable temperature readings were observed, a fixed power was applied to the heater wire, and the temperature was recorded as a function of time for about 50 seconds.
3.1

TP08TP08
Figure 3.1. System Diagram of Hukseflux TPSYS02. The main components are the thermal properties sensor (probe), sample container, the measurement and control unit (MCU), and the PC208W software. Multiple measurements were taken for each sample by removing and then reinserting the probe in a different location. Time was allotted between measurements for the sample and the probe to re-establish thermal equilibrium. The TPSYS02 system is equipped with a Campbell CR10X data logger that records several parameters, including power, temperature, and run time. These raw data are imported into Excel and plotted. A typical plot is displayed in Figure 3.2 for a water standard. The first portion of the slope shown in Figure 3.2 is not linear. Only the linear portion of the plot was used in the calculation of the thermal conductivity. Figure 3.3 is an example plot from Sample KC-2/3 M250 (canister sludge), which shows a slight departure from the more ideal behavior exhibited by the water standard. The data from all samples were plotted in this manner to evaluate the quality of each run and to facilitate the selection of the linear portion of the plot for the thermal conductivity calculation. Figure 3.4 is an example of the data analysis for Sample FE-3.
6
7
8
9
10
11
12
13
14
15
16
0 0.5 1 1.5 2 2.5 3 3.5 4
ln (time)
Slope=1.75 λ=0.57 W/mK
4π∆ T
/Q
6
7
8
9
10
11
12
13
14
15
16
0 0.5 1 1.5 2 2.5 3 3.5 4
ln (time)
Slope=1.75 λ=
(mK\
W)
6
7
8
9
10
11
12
13
14
15
16
0 0.5 1 1.5 2 2.5 3 3.5 4
ln (time)
Slope=1.75 λ=
4π∆ T
/Q
6
7
8
9
10
11
12
13
14
15
16
0 0.5 1 1.5 2 2.5 3 3.5 4
ln (time)
Slope=1.75 λ=
(
6
7
8
9
10
11
12
13
14
15
16
0 0.5 1 1.5 2 2.5 3 3.5 4
ln (time)
Slope=1.75 λ=0.57
4π∆ T
/Q
6
7
8
9
10
11
12
13
14
15
16
0 0.5 1 1.5 2 2.5 3 3.5 4
ln (time)
Slope=1.75 λ=
(mK\
W)
6
7
8
9
10
11
12
13
14
15
16
0 0.5 1 1.5 2 2.5 3 3.5 4
ln (time)
Slope=1.75 λ=
4π∆ T
/Q
6
7
8
9
10
11
12
13
14
15
16
0 0.5 1 1.5 2 2.5 3 3.5 4
ln (time)
Slope=1.75 λ=
(
6
7
8
9
10
11
12
13
14
15
16
0 0.5 1 1.5 2 2.5 3 3.5 4
ln (time)
Slope=1.75 λ=0.57 W/mK
4π∆ T
/Q
6
7
8
9
10
11
12
13
14
15
16
0 0.5 1 1.5 2 2.5 3 3.5 4
ln (time)
Slope=1.75 λ=
(mK\
W)
6
7
8
9
10
11
12
13
14
15
16
0 0.5 1 1.5 2 2.5 3 3.5 4
ln (time)
Slope=1.75 λ=
4π∆ T
/Q
6
7
8
9
10
11
12
13
14
15
16
0 0.5 1 1.5 2 2.5 3 3.5 4
ln (time)
Slope=1.75 λ=
(
6
7
8
9
10
11
12
13
14
15
16
0 0.5 1 1.5 2 2.5 3 3.5 4
ln (time)
Slope=1.75 λ=0.57
4π∆ T
/Q
6
7
8
9
10
11
12
13
14
15
16
0 0.5 1 1.5 2 2.5 3 3.5 4
ln (time)
Slope=1.75 λ=
(mK\
W)
6
7
8
9
10
11
12
13
14
15
16
0 0.5 1 1.5 2 2.5 3 3.5 4
ln (time)
Slope=1.75 λ=
4π∆ T
/Q
6
7
8
9
10
11
12
13
14
15
16
0 0.5 1 1.5 2 2.5 3 3.5 4
ln (time)
Slope=1.75 λ=
(
Figure 3.2. TP02 Plot (Water + Agar) for Determining Thermal Conductivity
3.2

4
5
6
7
8
9
10
11
12
13
14
15
16
0 0.5 1 1.5 2 2.5 3 3.5 4ln (time)
Slope=1.23 λ=0.81 W/mK
4
5
6
7
8
9
10
11
12
13
14
15
16
0 0.5 1 1.5 2 2.5 3 3.5 4ln (time)
Slope=1.23
4
5
6
7
8
9
10
11
12
13
14
15
16
0 0.5 1 1.5 2 2.5 3 3.5 4ln (time)
Slope=1.23
4
5
6
7
8
9
11
12
13
14
15
16
0 0.5 1 1.5 2 2.5 3 3.5 4ln (time)
Slope=1.23
(mK
/W)
4 π∆
T/Q
4
5
6
7
8
9
10
11
12
13
14
15
16
0 0.5 1 1.5 2 2.5 3 3.5 4ln (time)
Slope=1.23 λ=0.81 W/mK
4
5
6
7
8
9
10
11
12
13
14
15
16
0 0.5 1 1.5 2 2.5 3 3.5 4ln (time)
Slope=1.23
4
5
6
7
8
9
10
11
12
13
14
15
16
0 0.5 1 1.5 2 2.5 3 3.5 4ln (time)
Slope=1.23
4
5
6
7
8
9
11
12
13
14
15
16
0 0.5 1 1.5 2 2.5 3 3.5 4ln (time)
Slope=1.23
(mK
/W)
4 π∆
T/Q
Figure 3.3. TP02 Plot (Canister Sludge Sample KC-2/3 M250) for Determining Thermal Conductivity
Measurement #1:y = 0.9502x + 10.731
R2 = 0.9979
Measurement #2:y = 1.0067x + 10.844
R2 = 0.9994
Measurement #3:y = 0.9917x + 10.711
R2 = 0.9991
Measurement #4:y = 0.9731x + 10.946
R2 = 0.9991
1010.5
1111.5
1212.5
1313.5
1414.5
15
1.5 2 2.5 3 3.5 4
Measurement #1Measurement #2Measurement #3Measurement #4Linear (Measurement #1)Linear (Measurement #2)Linear (Measurement #3)Linear (Measurement #4)
Measurement #1:y = 0.9502x + 10.731
R2 = 0.9979
Measurement #2:y = 1.0067x + 10.844
R2 = 0.9994
Measurement #3:y = 0.9917x + 10.711
R2 = 0.9991
Measurement #4:y = 0.9731x + 10.946
R2 = 0.9991
1010.5
1111.5
1212.5
1313.5
1414.5
15
1.5 2 2.5 3 3.5 4
In (time)
Measurement #1Measurement #2Measurement #3Measurement #4Linear (Measurement #1)Linear (Measurement #2)Linear (Measurement #3)Linear (Measurement #4)
4π∆T
/Q(m
K/W
)
Measurement #1:y = 0.9502x + 10.731
R2 = 0.9979
Measurement #2:y = 1.0067x + 10.844
R2 = 0.9994
Measurement #3:y = 0.9917x + 10.711
R2 = 0.9991
Measurement #4:y = 0.9731x + 10.946
R2 = 0.9991
1010.5
1111.5
1212.5
1313.5
1414.5
15
1.5 2 2.5 3 3.5 4
Measurement #1Measurement #2Measurement #3Measurement #4Linear (Measurement #1)Linear (Measurement #2)Linear (Measurement #3)Linear (Measurement #4)
Measurement #1:y = 0.9502x + 10.731
R2 = 0.9979
Measurement #2:y = 1.0067x + 10.844
R2 = 0.9994
Measurement #3:y = 0.9917x + 10.711
R2 = 0.9991
Measurement #4:y = 0.9731x + 10.946
R2 = 0.9991
1010.5
1111.5
1212.5
1313.5
1414.5
15
1.5 2 2.5 3 3.5 4
In (time)
Measurement #1Measurement #2Measurement #3Measurement #4Linear (Measurement #1)Linear (Measurement #2)Linear (Measurement #3)Linear (Measurement #4)
4π∆T
/Q(m
K/W
)
Figure 3.4. Data Analysis for Determining Thermal Conductivity of Sample FE-3, North Loadout Pit
3.3

Samples were either measured in a glass jar or in a vendor-supplied sample holder. The vendor-supplied sample holder was a 125-mL stainless steel cylinder (~50 mm diam. x 65 mm) constructed with ~1-in.-thick walls to provide a thermally stable vessel for conducting measurements. The sample holder was used for most of the simulants during cold testing and for one K Basin sludge sample. However, it was determined that when air drafts were minimized, measurements could be conducted directly in glass sample jars without the need for multiple transfers between the sample jars and the sample holder. 3.2 System Validation and Calibration Calibration checks were performed using water and mercury, both of which have well-characterized thermal conductivities. As recommended by the vendor, 0.4 wt% agar was added to the water standard to reduce convection. [Note: the vendor used the water-agar mixture to verify the system accuracy.] The accepted thermal conductivity of water is 0.598, 0.615, and 0.631 W/mK at 20, 30, and 40°C, respectively (Lide 1999). The thermal conductivity of mercury at 21°C is estimated to be 8.17 W/mK (Lide 1999). The water standard was measured at 0.57 W/mK (±0.01) on April 2, 2001, prior to simulant measurements. A second water calibration check was performed on June 7, 2001, before the first batch of K Basin sludge samples was measured. This second water check measured 0.58 W/mK (±0.03). Both water checks were within 5% of the accepted literature values, and the probe showed no detectable drift over the 2-month time period. A mercury standard was measured at 8.3 W/mK (±1.3) (at 21°C) on June 20, 2001, before measurements were conducted on the first batch of sludge samples. The measured value for mercury was within the 3% instrument specification for accuracy; however, the standard deviation of multiple measurements was ~15% of the average value. Convection currents in the mercury may have contributed to the measurement variability. Also, the specified instrument range for thermal conductivity is 0.1 to 6 W/mK, so this high uncertainty was judged acceptable. Because of the concerns associated with disposal of the resulting mixed waste, mercury checks were not repeated after the equipment was installed in the hot cells. Calibration checks were also performed in conjunction with the second batch of K Basin sludge samples, and the water standard was measured at 0.56 ± 0.05 W/mK. A final calibration check with water/agar was performed in January 2002, and the thermal conductivity measured was 0.59 ± 0.1 W/mK. As an additional quality control measure, much of the thermal conductivity data and analyses for the simulants and first batch of K Basin sludge samples were sent to the system vendor, Hukseflux, for review. The Hukseflux review agreed with the PNNL data analysis. 3.3 Description of Simulants Before the K Basin sludge samples were measured, thermal conductivity measurements were performed on a number of simulants to collect relevant data and gain experience in the operation of the system and in the data interpretation. Also, while thermal conductivity data were desired for sludge consisting primarily of metallic fuel fragments (to represent KW Basin knock-out pot sludge), a sufficient volume of appropriate test material was not available. Consequently, simulant testing was performed using metallic fragments of tungsten carbide/cobalt binder material (W/Co) to gain insight into how KW sludge will behave.
3.4

Simulants evaluated in this testing were: 1. Water (with agar addition to minimize convection). Theoretically, the thermal conductivity of water
should be ~0.598, 0.615, and 0.631 W/mK at 20, 30, and 40°C, respectively (Lide 1999). In addition to its use in shaking down the system, water serves as a known thermal conductivity standard.
2. Fine Sand: A cleaned sand with ~99 wt% less than 500 µm. A typical thermal conductivity value for
dry sand is 0.35 W/mK. Saturated sands and soils range from 0.6 to 4 W/mK. 3. Hanford Blown Sand: Sand/blown material collected from a concrete pad in North Richland,
Washington, adjacent to the Hanford Site. 4. K Basin Simulant: 8 wt% tungsten metal powder (1 and 10 µm), 17 wt% flyash (1 to 120 µm), and
75 wt% Hanford sand collected near the K Basins (50 to 300 µm). This simulant has been used to qualify K Basin sludge sampling equipment (Hecht 1999).
5. Tungsten Carbide with Cobalt Binder (W/Co) Fragments (Kennametal K96 and K3833): 500- to
6350-µm metal fragments (~88% W, 8% to 10% Co; 1% carbide; trace Ta, Ti, and Nb). Particle density ~14.5 g/cm3. Particle thermal conductivity (25°C) = ~96 W/mK (ASM International 1987). [Note: thermal conductivity of pure tungsten at 25°C is 180 W/mK, and pure uranium metal is 27.5 W/mK.] The W/Co fragments were mixed with K Basin sludge at various ratios to gain insight into how the thermal conductivity of the KW sludge may change as a function of metal content.
6. Mercury: A pure element, with a well-characterized thermal conductivity, used for a higher-end
thermal conductivity system calibration check. The values for dry density, wet density, and water fraction (volume and mass) for the simulants are presented in Table 3.1. The volume ratios given in the first column for W/Co and K Basin simulant represent the volumes of the individual constituents before mixing. After mixing, a portion of the K Basin simulant occupied void space between the larger W/Co particles. Table 3.1 shows that the volume fraction of water did not change significantly as a function of the ratio of W/Co:K Basin simulant. However, the mass fraction of water decreased significantly as the volume fraction (and mass fraction) of W/Co increased. 3.4 Results from Thermal Conductivity Measurements of Standards and
Simulants The testing with standards and simulants demonstrated the reproducibility and accuracy of the Hukseflux TPSYS02 for the type of samples analyzed in this testing. Consistent and accurate thermal conductivity values were obtained for the water/0.4% agar standard from the initial testing with the thermal conductivity test system in April 2001 to beyond completion of the analysis of the K Basin sludge samples in January 2002. The slight temperature differences when checking the standard may have contributed to the small variations in the measured values (i.e., 0.56 to 0.59 W/mK – Table 3.2). The standard deviations of multiple measurements of the thermal conductivities for the dry mixtures of simulants, including the W/Co mixtures, ranged from about 5% to 8% of the average measured values. For the saturated sands and K Basin simulant, the standard deviations of multiple measurements were 7% to 9% of the average values.
3.5
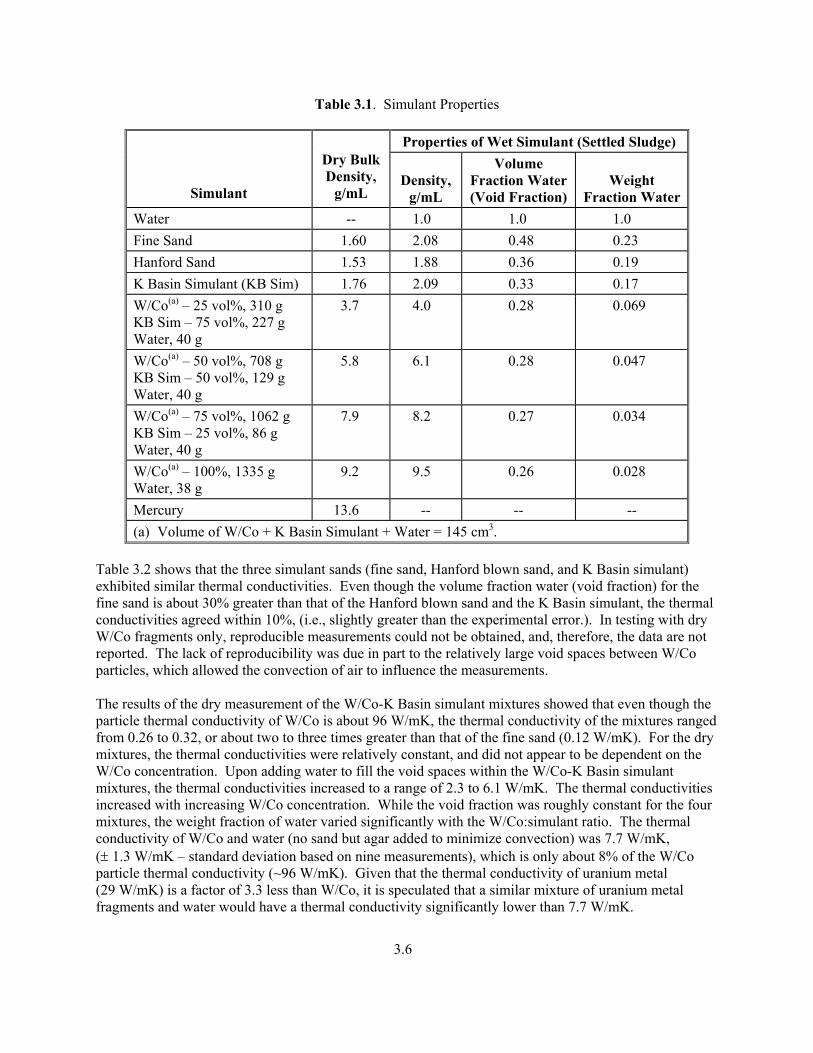
Table 3.1. Simulant Properties
Properties of Wet Simulant (Settled Sludge)
Simulant
Dry Bulk Density,
g/mL Density,
g/mL
Volume Fraction Water (Void Fraction)
Weight Fraction Water
Water -- 1.0 1.0 1.0 Fine Sand 1.60 2.08 0.48 0.23 Hanford Sand 1.53 1.88 0.36 0.19 K Basin Simulant (KB Sim) 1.76 2.09 0.33 0.17 W/Co(a) – 25 vol%, 310 g KB Sim – 75 vol%, 227 g Water, 40 g
3.7 4.0 0.28 0.069
W/Co(a) – 50 vol%, 708 g KB Sim – 50 vol%, 129 g Water, 40 g
5.8 6.1 0.28 0.047
W/Co(a) – 75 vol%, 1062 g KB Sim – 25 vol%, 86 g Water, 40 g
7.9 8.2 0.27 0.034
W/Co(a) – 100%, 1335 g Water, 38 g
9.2 9.5 0.26 0.028
Mercury 13.6 -- -- -- (a) Volume of W/Co + K Basin Simulant + Water = 145 cm3.
Table 3.2 shows that the three simulant sands (fine sand, Hanford blown sand, and K Basin simulant) exhibited similar thermal conductivities. Even though the volume fraction water (void fraction) for the fine sand is about 30% greater than that of the Hanford blown sand and the K Basin simulant, the thermal conductivities agreed within 10%, (i.e., slightly greater than the experimental error.). In testing with dry W/Co fragments only, reproducible measurements could not be obtained, and, therefore, the data are not reported. The lack of reproducibility was due in part to the relatively large void spaces between W/Co particles, which allowed the convection of air to influence the measurements. The results of the dry measurement of the W/Co-K Basin simulant mixtures showed that even though the particle thermal conductivity of W/Co is about 96 W/mK, the thermal conductivity of the mixtures ranged from 0.26 to 0.32, or about two to three times greater than that of the fine sand (0.12 W/mK). For the dry mixtures, the thermal conductivities were relatively constant, and did not appear to be dependent on the W/Co concentration. Upon adding water to fill the void spaces within the W/Co-K Basin simulant mixtures, the thermal conductivities increased to a range of 2.3 to 6.1 W/mK. The thermal conductivities increased with increasing W/Co concentration. While the void fraction was roughly constant for the four mixtures, the weight fraction of water varied significantly with the W/Co:simulant ratio. The thermal conductivity of W/Co and water (no sand but agar added to minimize convection) was 7.7 W/mK, (± 1.3 W/mK – standard deviation based on nine measurements), which is only about 8% of the W/Co particle thermal conductivity (~96 W/mK). Given that the thermal conductivity of uranium metal (29 W/mK) is a factor of 3.3 less than W/Co, it is speculated that a similar mixture of uranium metal fragments and water would have a thermal conductivity significantly lower than 7.7 W/mK.
3.6

Table 3.2. Thermal Conductivity Results for Standards and Simulants
Material Description
Thermal Conductivity, W/mK (standard
deviation) Water with 0.4 wt% Agar Calibration Check 0.57 (±0.01) 4/2/01
0.58 (±0.03) 6/7/01 0.56 (±0.05) 11/21/01 0.59 (±0.01) 1/2/02
Mercury Calibration Check 8.3 (±1.3) Fine Sand Dry 0.12 (±0.01) Saturated 1.2 (±0.1) Hanford Sand Dry 0.14 (±0.01) Saturated 1.3 (±0.1) K Basin Simulant
Dry 0.20 (±0.01)
Saturated 1.1 (±0.1) W/Co – 25 vol% K Basin Simulant - 75 vol%
Dry 0.32 (±0.03)
Saturated 2.3 (±0.5) W/Co – 50 vol% K Basin Simulant - 50 vol%
Dry 0.26 (±0.02)
Saturated 3.8 (±0.5)
W/Co – 75 vol% K Basin Simulant - 25 vol%
Saturated 6.1 (±0.4)
W/Co – 85 vol% Fine Sand –15 vol%
Dry 0.26 (±0.02)
W/Co – 100 vol% Saturated 7.7 (±1.3) 3.5 Results from Thermal Conductivity Measurements of K Basin Sludge
Samples Table 3.3 presents the results of the thermal conductivity measurements performed on the K Basin sludge samples. Each sample was measured at least three times (Appendix A), and the average value and the standard deviation are reported. The measurements were performed at ambient hot cell temperatures, which ranged from 29°C to 41°C (Appendix A). The percent standard deviations from multiple measurements ranged from 1.5% to about 6%, demonstrating good reproducibility. Some of this variability was likely the result of the inhomogeneous nature of the sludge and the fact that the probe was moved to a new location for each measurement. For most of the samples, essentially the same thermal conductivity value was measured. Excluding the sludge samples from North Loadout Pit (1.03 W/mK), the Weasel Pit (0.86 W/mK), KC-5 P250 (0.80 W/mK – large-particle floor sludge, away from canisters), and KC-2/3 M250 (0.81 W/mK – small-particle canister sludge), the average thermal conductivity of the remaining eight sludge samples was 0.70 (standard deviation of 0.014) W/mK. In general, no direct
3.7

Table 3.3. Thermal Conductivity Results for K Basin Sludge Samples
Material Description
Thermal Conductivity, W/mK (standard
deviation) KE Basin Floor and Pit Sludge Samples
FE-3 (whole) North Loadout Pit sludge 1.03 (±0.05) FE-5 (whole) Weasel Pit sludge 0.86 (±0.04) KC-4 (whole) Floor sludge from between canisters 0.72 (±0.04) KC-4 M250 Floor sludge from between canisters (minus 250-µm
fraction) 0.69 (±0.04)
KC-4 P250 Floor sludge from between canisters (plus 250-µm fraction) – Reconstituted(a)
0.70 (±0.03)
KC-5 (whole) Floor sludge from main basin 0.72 (±0.03) KC-5 M250 Floor sludge from main basin (minus 250-µm fraction) 0.69 (±0.01) KC-5 P250 Floor sludge from main basin (plus 250-µm fraction) –
Reconstituted(a) 0.80 (±0.02)
KE Basin Canister Sludge Samples KC-2/3 (whole)
Canister sludge composite 0.70 (±0.04)
KC-2/3 M250 Canister sludge (minus 250-µm fraction) 0.81 (±0.06) 96-13 Canister sludge collected in 1996 – Reconstituted(a) 0.68 (±0.04)
KE Basin Floor + Canister Sludge + Fuel Fragments SNF + Sludge Composite
By volume, ~64% floor sludge, ~26% canister sludge, ~7% fuel corrosion product (e.g., U4O9), and ~3% uranium fuel fragments
0.70 (±0.03)
(a) Reconstituted – sludge sample dried out and was reconstituted to a settled sludge state through the addition of K Basin water and aggressive mixing.
trends were evident on the relationship between thermal conductivity and chemical composition, particle size, settled density, or mass fraction water. The relationship is more likely a complex combination of these properties along with oxidation states and crystalline structures. However, the volume fraction water (void fraction) for all of the K Basin sludge samples was similar; 0.77 on average, with a standard deviation of 12% (see Table 2.4). This relative percent standard deviation for the void fraction is about the same as the estimated accuracy of the void fraction measurements (±10%). The K Basin simulants and sands (Table 3.2), which exhibited higher thermal conductivities, had an average void fraction of 0.4. The sludge from the North Loadout Pit (also known as the Sand Filter Backwash Pit) exhibited the highest thermal conductivity of the K Basin sludge samples (1.03 W/mK). This value is lower but close to that of the saturated K Basin simulant (1.1 W/mK) and sands (1.2 and 1.3 W/mK). While the North
3.8

Loadout Pit sludge is believed to be mostly sand, its void fraction was measured to be about 0.76 (compared with about 0.4 for the K Basin simulant and sand). The higher water content of the North Loadout Pit sludge is likely the predominant factor for its lower thermal conductivity compared with the simulants. The Weasel Pit (FE-5), KC-5 P250 (floor), and KC-2/3 M250 canister sludges exhibited similar thermal conductivities (0.86, 0.80, and 0.81 W/mK, respectively) that were about 20% greater than those measured for the other sludges (not including the North Loadout Pit). The composition of these sludges varied drastically (e.g., 40 wt% uranium for KC-2/3 M250 vs. ~4 wt% for FE-5 and ~2 wt% for KC-5 P250), as did the particle size distribution. However, these three samples had nearly identical water contents (44 to 48 wt% water). While these water content values are lower than most of the other sludge samples, Samples 96-13 (canister sludge) and SNF Comp, with thermal conductivities of 0.68 and 0.70 W/mK, respectively, were found to contain 26 and 31 wt% water, respectively. The thermal conductivities of the sludge samples were only a little higher than that of water (~0.60 W/mK). [As another comparison, the range of thermal conductivities of the sludges fell into the lower region of that expected for saturated sands and soils.] The high water content and the abundance of hydrated species in the sludges likely contributed to the relatively low values. The similar and relatively high volume fraction water in the K Basin sludge samples appears to be a dominating factor affecting the thermal conductivity. The thermal conductivity of K Basin sludge will vary to some extent as a function of temperature. This secondary dependence was not addressed in the current measurements of thermal conductivity of the sludges. As noted previously, the thermal conductivity measurements on the actual sludge samples were performed only at ambient hot cell temperatures, which ranged from 29ºC to 41ºC. Accepted literature show that across this temperature range, the thermal conductivity of water increases by about 3%. Across the temperature range of interest for K Basin sludge storage, 20ºC to 100ºC, the thermal conductivity of water increases by about 14% (Lide 1999). The thermal conductivity of uranium metal increases about 6% as temperatures increase from 25ºC to 100ºC (Weast and Astle 1982). However, in the temperature range of 50ºC to 100ºC, the thermal conductivity of various uranium oxides decreases by about 7% to 15% (Belle 1961). Similarly, the thermal conductivity of solid quartzite and granite over the range of 0 to 100ºC decreases by about 22% and 14%, respectively (Weast and Astle 1982). Given that the thermal conductivity of water apparently dominates the overall thermal conductivity of the sludge, the use of the values measured between 29ºC and 41ºC is judged to provide reasonable (i.e., potentially slightly conservative) values over the entire temperature range of interest for sludge storage. The thermal conductivity data measured here provide a significant step in understanding where to establish the thermal calculations, since there were no prior measurements of this parameter for these types of sludges (either specifically or in the literature), and the potential uncertainties in detailed modeling of thermal conductivity were significant [e.g., effects of water fractions vary widely; ratios of oxides of various elements (U, Al, etc.) cannot be accurately measured; non-crystalline states of compounds were unknown; effects of shape and surface constitution of particles are basically unknown, etc.]. For nominal design modeling and calculations, a thermal conductivity on the low end of the measured range is desired. Therefore, a thermal conductivity of 0.70 W/mK is judged to provide both a reasonable and a defensible value for all KE Basin sludge types.
3.9
4.0 Shear Strength Measurements The shear strength of six K Basin sludge samples was measured to provide an updated/current set of data on the sludge materials. The need for these shear strength data was identified and described by Makenas (2000) and Baker et al. (2000). Shear strength measurements were also performed on a bentonite slurry to validate the measurement system and for a relative comparison with the sludge samples. The shear strength of a material is defined as the maximum stress force applied to a material before it deforms. Materials that possess a shear strength exhibit solid-like behavior at low stresses and fluid-like behavior at high stresses. During the solid-like behavior, the material behaves elastically, where it will strain to a point at a given stress. When the stress is removed, the material will return to its initial state. The shear strength is regarded as the transition between the elastic behavior and viscous flow. Materials that exhibit shear strength are typically solid/liquid multiphase systems. In these systems, the solid particles are usually attracted to each other through electrostatic forces. This creates a network of attracted particles (i.e., a flocculated structure) that can impede viscous flow at low stresses. Viscous flow is achieved when the applied stress is high enough to break apart the structure. Examples of materials that display shear strength include cements, soils, paints, pastes, and various food products (Liddell and Boger 1996), as well as K Basin sludge. Many techniques have been devised to measure shear strength. The most common technique involves extrapolating data from a conventional rheogram (i.e., shear stress/shear rate) to zero shear rate. The extrapolation can be made through the use of rheological models such as the Bingham, Herschel-Bulkley, or the Casson models. This technique requires accurate experimental data at low shear rates. Due to slip flow, inertial effects, etc., this is often difficult with conventional viscometers. Consequently, direct measurements of shear strength have been developed, which are discussed in greater detail in Section 4.1. 4.1 Measurement Equipment and Theory Shear strength can be directly measured by slowly rotating a vane immersed in the sample material and measuring the resulting torque as a function of time. The torque can be converted to a shear stress by making some assumptions (Liddell and Boger 1996): 1) The material is assumed to be sheared only along the cylinder defined by the dimensions of the vane. This assumption has been shown to be largely correct. The actual diameter of the sheared surface may be up to 5% larger than the vane dimensions (Bowles 1977; Keentok 1982; Keentok et al. 1985). 2) It is assumed that the stress is distributed uniformly over the cylindrical sheared surface. Although the stress actually peaks sharply at the vane peaks (Keentok et al. 1985), it has been shown that the error due to this assumption is minimal (Alderman et al. 1991; Avamidis et al. 1991; James et al. 1987; Nguyen and Boger 1985a; Nguyen and Boger 1985b; Nguyen and Boger 1983). Therefore, a good approximation of the measured stress can be calculated from Equation (4.1), where K is the vane constant defined in Equation (4.2).
4.1

K/T=τ (4.1)
+
π=
31
DH
2DK
3 (4.2)
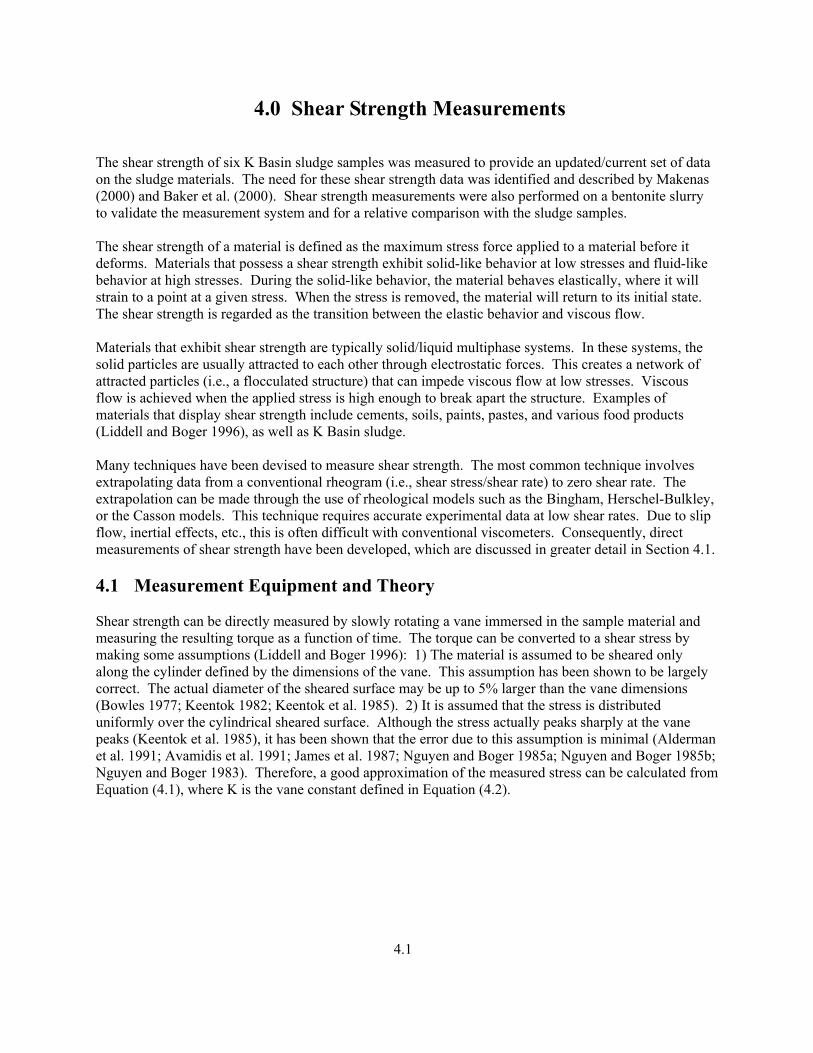
where τ is the calculated shear stress (Pa) T is the measured torque (Nm) K is the shear vane constant (m3) D is the shear vane diameter (m) H is the shear vane height (m). For valid measurements, the shear vane must be immersed in the test material such that wall and end effects are negligible. Figure 4.1 shows an accepted material testing geometry to minimize wall and end effects (Nguyen and Boger 1985b). In addition, for the K Basin sludge samples, the geometry was set up to maintain a clearance significantly greater than ¼ in. between the vane and container walls/bottom (e.g., maximum possible particle size in sludge sample material because of collection methods used to maintain particle size ranges within the definition of sludge in the SNF Project). A typical stress/time profile is shown in Figure 4.2. The profile shows an initial linear region, followed by a non-linear region, a stress maximum, and a stress decay region. The shape of the stress time profile can be explained from a consideration of the network bonds within the material. The initial linear region represents the elastic deformation of the network bonds. The non-linear region represents visco-elastic flow (also called creep flow), where the network bonds are stretched beyond their elastic limit and some of the bonds begin to break. At the maximum stress, the majority of the bonds are broken and the material begins to flow as a fully viscous fluid. The network typically collapses, and stress decay is observed. From this response, two shear strengths can be defined: one corresponding to the transition between elastics and visco-elastic flow, τy, and the other corresponding to the transition between visco-elastic and fully viscous flow, τs. Most researchers regard the transition between visco-elastic and fully viscous flow
D
DT
Z1
Z2
H
N (rpm)
H/D < 3.5DT/D >2.0
Z1/D >1.0
Z2/D > 0.5
Figure 4.1. Geometrical Requirements of a Shear Vane
4.2
Time
Shea
r Str
ess
(Pa)
τs
τy
Time
Shea
r Str
ess
(Pa)
τs
τy
Figure 4.2. Typical Response of a Shear Vane
as the definitive shear strength of the material. In this report, shear strength is defined by the transition between visco-elastic and fully viscous flow, τs. The viscometers used for the shear strength measurements reported in this document included a Haake RS300 instrument operated on a cold benchtop, a Haake M5 instrument operated on a cold benchtop, and a Haake M5 instrument operated in a hot cell. The shear vanes were immersed in the samples according to the geometrical requirements outlined in Figure 4.1. Two shear vanes were used: one with dimensions of D=1.6 cm H=1.6 cm and the other with dimensions of D=1.6 cm H=3.2 cm. The rotational speed of the viscometers was set at a constant 0.3 RPM (0.0314 rad/s). The K Basin sludge sample shear strength measurements were documented in Test Instruction TI-43262-T02 [K Basin Shear Strength Measurements (January 7, 2002)]. 4.2 System Validation and Calibration Initially, a viscosity standard was measured with cup/cylinder geometry on the Haake M5 hot cell viscometer. While this does not implicitly test the vane geometry, it determines if the torque detection system used by the viscometer is functioning and calibrated properly. The results of this test are shown in Figure 4.3. As expected, Newtonian behavior of the standard was observed with a measured viscosity of 0.0885 Pa/s [88.5 cP (centiPoise)]. This viscosity was measured over a shear rate range of 0 to 1160 1/s. This measured viscosity results in an 8.8% error from the known viscosity of the standard (97.0 cP at 25°C). This error is within the allowable 10% value specified in TI-43262-T02 and the Shear Strength Measurement Procedure (RPL 29953-010) and is typical of this particular viscometer model. To validate the viscometer system used to measure the K Basin sludge samples, the Haake M5 in the hot cell was tested for consistency with other viscometers. The shear strength of 12 wt% bentonite/deionized water slurries was measured on the viscometers used in this study. Bentonite was chosen as a calibration check material, because no shear strength standard material has been developed and accepted by the National Institute of Science and Technology, the American National Standards Institute, or the American Society for Testing and Materials. The first set of measurements was taken on bentonite samples that remained undisturbed for 48 hours prior to testing. These results are shown in Figure 4.4. Prior to the test with the Haake M5 viscometer in the hot cell, the manipulator arm inadvertently moved, causing unintended material disturbance. This disturbance is reflected by the erratic behavior of the curve at approximately 1 minute into the test. Despite this disturbance, the measured shear strengths were comparable across three systems.
4.3

y = 0.0885x R2 = 0.9997
0
20
40
60
80
100
120
0 200 400 600 800 1000 1200
Shear Rate (1/s)
Shre
ar S
tres
s (P
a)
y = 0.0885x R2 = 0.9997
0
20
40
60
80
100
120
0 200 400 600 800 1000 1200
Shear Rate (1/s)
Shre
ar S
tres
s (P
a)
Figure 4.3. Viscometer Calibration Check with 97.0 cP Viscosity Standard
050
100150200250300350400450
0 0.5 1 1.5
Time (min)
2
RS300 Run #1Cold M5 Run #1Hotcell M5 Run #1 (Manip. Moved)
050
100150200250300350400450
0 0.5 1 1.5
Time (min)
2
RS300 Run #1Cold M5 Run #1Hotcell M5 Run #1 (Manip. Moved)
Shea
r Str
e ss
(Pa )
050
100150200250300350400450
0 0.5 1 1.5
Time (min)
2
RS300 Run #1Cold M5 Run #1Hotcell M5 Run #1 (Manip. Moved)
050
100150200250300350400450
0 0.5 1 1.5
Time (min)
2
RS300 Run #1Cold M5 Run #1Hotcell M5 Run #1 (Manip. Moved)
Shea
r Str
e ss
(Pa )
Figure 4.4. Shear Strength of 12 Wt% Bentonite Suspension Aged 48 Hours A second set of shear strength measurements was taken on the 12 wt% bentonite slurries. Rather than remaining undisturbed for 48 hours prior to testing, this material had been disturbed prior to measurement. For this set of measurements, the Haake RS300 and the Haake M5 in the hot cell were used. The first Haake M5 viscometer run was set up in a configuration with a Haake RV100 controller/ data plotter. The Haake RV100 controller/data plotter system was used in previous K Basin shear strength measurements. Currently, the Haake M5 system is controlled with a laptop computer rather than the RV100 device. The RV100 configuration was used to validate the current configuration in relation to previous results. As seen in Figure 4.5, the measured shear strengths between these systems were in acceptable agreement.
4.4

0
50
100
150
200
250
0 0.5 1 1.5
Time (min)
Shea
r Stre
ss (P
a)
2
RS300 Run #1Hotcell M5 Run #1 with RV100Hotcell M5 Run #2Hotcell M5 Run #3
Figure 4.5. Shear Strength of Recently Disturbed 12 Wt% Bentonite Suspension
Several important factors must be considered when comparing the shear strength measurements performed on the 12 wt% bentonite slurries using different systems and locations. First, the ambient temperature in the hot cell is about 10°C higher than the temperature in the cold laboratory. Also, it is likely that small differences existed in the water content and the intensity of mixing used to prepare the 12 wt% bentonite slurries, as the test slurries were prepared in separate containers. Finally, the aging time (consolidation time) for the bentonite slurries tested in the hot cell and cold laboratory varied by several hours. These factors could lead to differences (20% to 40%) in the absolute shear strength among the 12 wt% bentonite slurries tested. The sensitivity of the slurry to water content, mixing history, temperature, and aging provides insight into the lack of a recognized standard for shear strength measurements. 4.3 Results With the functionality of the Haake M5 viscometer in the hot cell established, shear strength measurements were taken on K Basin sludge samples. The shear vanes were immersed in the samples according to the geometrical requirements outlined in Figure 4.1. The K Basin sludge samples that were analyzed for shear strength included: 1. FE-3 (KE Basin North Loadout Pit) 2. FE-5 (KE Basin Weasel Pit) 3. KC-4 (KE floor, between canisters) 4. KC-5 (KE floor, main basin) 5. KC-2/3 (whole consolidated canister sludge)
4.5

6. SNF + Sludge Composite (SNF Comp) (floor, canister, and fuel) - Prepared under TI-43262-T01 (11-20-2001)
Shear strength measurements were also performed on canister sludge sample KC-2/3 M250; however, no valid measurements were obtained. Initially, the K Basin samples were transferred to the hot cell where the Haake M5 is located. The samples were slightly disturbed during the transfer, and the suspended solids were allowed to settle until a clear supernatant was present. Before the transfer, the samples had been undisturbed for 20 to 30 days. The clear supernatant from the samples was removed such that the samples were still saturated. Shear strength measurements were then taken on the samples. This set of measurements was referred as the “+20 days settling time,” or the “as-received” measurements. The samples were then mixed thoroughly with a spoonula and allowed to sit undisturbed for approximately 5 days, then measured. This set of measurements was referred as the “5 days settling time” measurements. The samples were mixed thoroughly a second time and allowed to sit undisturbed for approximately 48 hours, then measured. This set of measurements was referred as the “2 day settling time” measurements. Several measurements were taken on each sample. The first measurement was at the center of the sample container, and subsequent runs were taken in the undisturbed locations between the center and the container wall. Only the first measurement at the center container location conformed to the geometrical requirements outlined in Figure 4.1. The other measurements were taken at relatively undisturbed locations for the purpose of validating the initial measurement and may not have conformed to Figure 4.1. As an example of the type of data acquired during the shear strength measurement testing, the shear stress/time profile results obtained from the North Loadout Pit, Sample FE-3, “as-received sample,” are shown in Figure 4.6. The measurement from the first of six runs was discarded. Subsequent runs in undisturbed locations show repeatable data with a shear strength in the range of 160-320 Pa. Similar plots for the other samples are given in Appendix B. These plots provide insight into the data interpretation. Ideally, several measurements would result in smooth shear stress/time profiles and have a repeatable maximum. The shear stress should also decay to a consistent value. Generally, shear strength measurements exhibit a high degree of repeatability for materials that are homogeneous, have small particle sizes, and have remained undisturbed for the same period of time. If the testing material has large particles relative to the vane diameter or is heterogeneous, an erratic (nonconforming) response can occur as a result of large particles slipping in the sample material and building up on the vane face or riding on the vane edge. As the large particles build up on the vane face or edge, the torque response would increase. As the large particles fall off the vane edge, the torque response would decrease. If these large particles are high density, such as the SNF material found in the K Basin sludge, and suspended in low viscosity fluid, such as water present in the K Basin sludge, the large-particle slipping would be more significant, resulting in erratic responses. Table 4.1 presents the results of the shear strength measurements for the sludge samples at the three settling times. Shear strength increased significantly with settling time for the Weasel Pit (FE-5), canister (KC-2/3) and SNF Comp sludges. For the North Loadout Pit (FE-3) and floor sludges (KC-4 and KC-5), the shear strength was either constant or varied randomly with settling time.
4.6
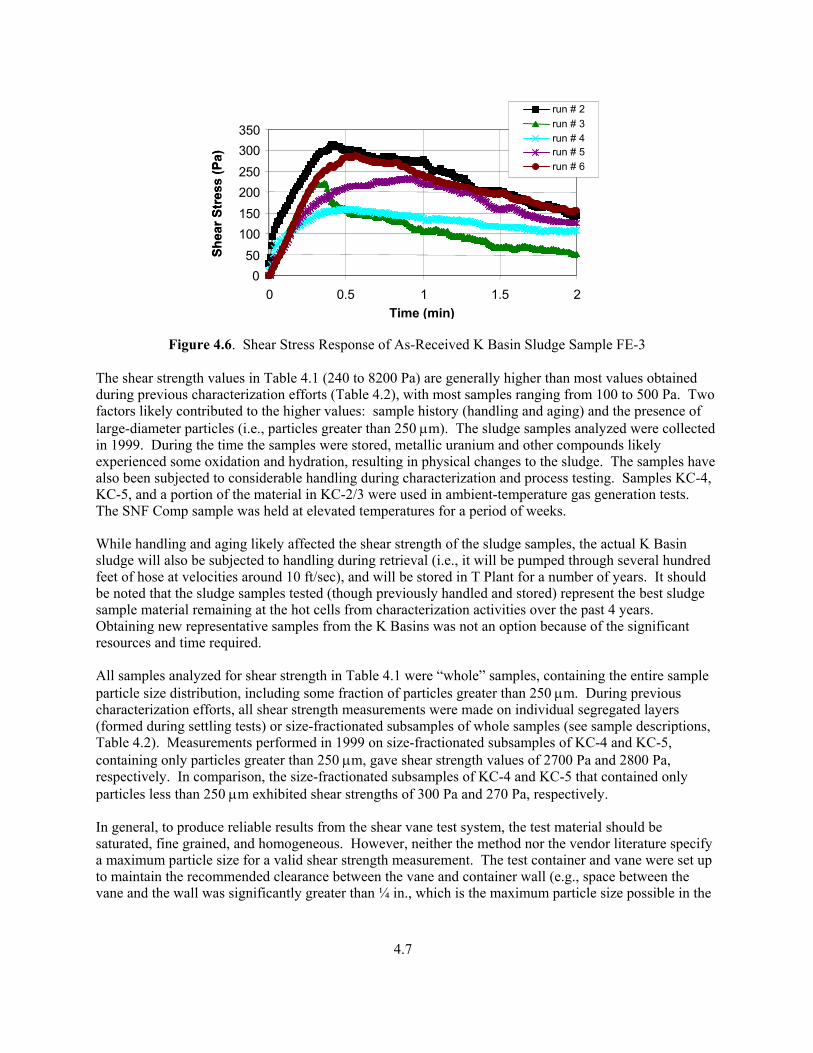
050
100150200250300350
0 0.5 1 1.5 2Time (min)
Shea
r Str
ess
(Pa)
run # 2run # 3run # 4run # 5run # 6
050
100150200250300350
0 0.5 1 1.5 2Time (min)
Shea
r Str
ess
(Pa)
run # 2run # 3run # 4run # 5run # 6
Figure 4.6. Shear Stress Response of As-Received K Basin Sludge Sample FE-3 The shear strength values in Table 4.1 (240 to 8200 Pa) are generally higher than most values obtained during previous characterization efforts (Table 4.2), with most samples ranging from 100 to 500 Pa. Two factors likely contributed to the higher values: sample history (handling and aging) and the presence of large-diameter particles (i.e., particles greater than 250 µm). The sludge samples analyzed were collected in 1999. During the time the samples were stored, metallic uranium and other compounds likely experienced some oxidation and hydration, resulting in physical changes to the sludge. The samples have also been subjected to considerable handling during characterization and process testing. Samples KC-4, KC-5, and a portion of the material in KC-2/3 were used in ambient-temperature gas generation tests. The SNF Comp sample was held at elevated temperatures for a period of weeks. While handling and aging likely affected the shear strength of the sludge samples, the actual K Basin sludge will also be subjected to handling during retrieval (i.e., it will be pumped through several hundred feet of hose at velocities around 10 ft/sec), and will be stored in T Plant for a number of years. It should be noted that the sludge samples tested (though previously handled and stored) represent the best sludge sample material remaining at the hot cells from characterization activities over the past 4 years. Obtaining new representative samples from the K Basins was not an option because of the significant resources and time required. All samples analyzed for shear strength in Table 4.1 were “whole” samples, containing the entire sample particle size distribution, including some fraction of particles greater than 250 µm. During previous characterization efforts, all shear strength measurements were made on individual segregated layers (formed during settling tests) or size-fractionated subsamples of whole samples (see sample descriptions, Table 4.2). Measurements performed in 1999 on size-fractionated subsamples of KC-4 and KC-5, containing only particles greater than 250 µm, gave shear strength values of 2700 Pa and 2800 Pa, respectively. In comparison, the size-fractionated subsamples of KC-4 and KC-5 that contained only particles less than 250 µm exhibited shear strengths of 300 Pa and 270 Pa, respectively. In general, to produce reliable results from the shear vane test system, the test material should be saturated, fine grained, and homogeneous. However, neither the method nor the vendor literature specify a maximum particle size for a valid shear strength measurement. The test container and vane were set up to maintain the recommended clearance between the vane and container wall (e.g., space between the vane and the wall was significantly greater than ¼ in., which is the maximum particle size possible in the
4.7

sludge sample material. Also, the results from KC-4 “whole” (15 wt% dry basis particles greater than 250 µm) in Table 4.1 (330 Pa to 480 Pa) are comparable to the value of 300 Pa obtained previously for the KC-4 minus 250-µm fraction in 1999. Consequently, the reliability of the data in Table 4.1 cannot be significantly discounted based on the presence of larger-diameter particles. While most of the shear strength data obtained in previous characterization activities were significantly lower than those measured in this study, a technical justification for discounting either set of data was not found. The differences were substantiated based on functionality checks on the equipment and independent verification of the calculations. Calculations and analyses requiring K Basin shear strength data should include both previously determined values and the values given in this report. The results of combining the data sets is a wide range of yield strength values for the sludge – 1 to 8200 Pa. Consequently, the analyst performing the calculations will have to consider either the total range or the source and handling of a specific sludge stream, making a case for using a subset of the observed values based on technical merits or design considerations.
4.8

4.9
Table 4.1. K Basin Sludge Shear Strength vs. Settling Time
Sludge Sample Sample Description
Settled Density,(a)
g/cm3 current data (previous data)
Days of Settling(b)
Average Shear
Strength, Pa Standard
Deviation, Pa Number of
Measurements KE Basin Pit and Floor Sludge Samples
2 760 340 35 920 10(c) 2
FE-3 (whole)
North Loadout Pit. Prepared from 2 core samples collected in Jun. 1999. About 80 wt% (dry) is made up of particles between 250 µm and 1410 µm. U content: ~1.7 wt% (dry)
1.35 (1.23 – 1.56) +20 240 61 5
2 1100 -- 15 1800 640 4
FE-5 (whole)
Weasel Pit. Prepared from 2 core samples collected in Jan. and Apr. 1999. About 70 wt% (dry) is made up of particles less than 250 µm. U content: ~5 wt% (dry).
No new data (1.43 – 1.5)
+20 4000 750 52 480 -- 15 330 80(c) 2
KC-4 (whole)
Floor, between slotted canisters. Prepared from 3 sample locations; collected in Mar. 1999. About 85 wt% (dry) is made up of particles less than 250 µm. U content: ~17 wt% (dry).
1.26 (1.24)
+20 400 160 4
2 1100 -- 15 1600 100(c) 2
KC-5 (whole)
Floor, away from canisters. Prepared from 3 sample locations; collected in Mar. 1999. Only about 36 wt% (dry) is made up of particles less than 250 µm. U content: ~6 wt% (dry). After being stored in the hot cell, sample was found moist in Oct. 2001 but not saturated.
1.28 (1.19)
+20 1000 150 3
KE Canister Sludge Samples 2 5700 1700 35 4600 560 3
KC-2/3 (whole)
Canister Sludge Composite. Prepared from 10 sample locations; collected in Mar. and Apr. 1999. About 72 wt% (dry) is made up of particles less than 250 µm. U content: ~60 wt% (dry). A portion of the sludge used was found moist in Oct. 2001 but not saturated.
1.3 (2.1)
+20 8200 4000 3
KE Basin Floor + Canister Sludge + Fuel Fragments 2 740 -- 15 No valid measurements obtained
SNF + Sludge (SNF Comp)
By volume, ~64% floor sludge, ~26% canister sludge, ~7% fuel corrosion product (e.g., U4O9), and ~3% uranium fuel fragments. About 20% to 30% of the material added to composite was dry sludge and fuel fragments.
2.38 (not previously measured)
+20 1900 -- 1
(a) Measurements of the settled sludge density were performed about 1 month before shear strength measurements were made. Measurements identified as previously reported were generally made within several months of when sludge samples were collected from the KE Basin. A large difference between the current measurements and the previously reported measurements may indicate the samples had undergone significant changes during sample storage.
(b) Measurements obtained at settling time identified as “+20 days” were performed just after moving settled sludge samples through several hot cells. The settled sludge may have been disturbed during the sample transport.
(c) For measurements with only two observations, the value given is the range between the average and the measurements.
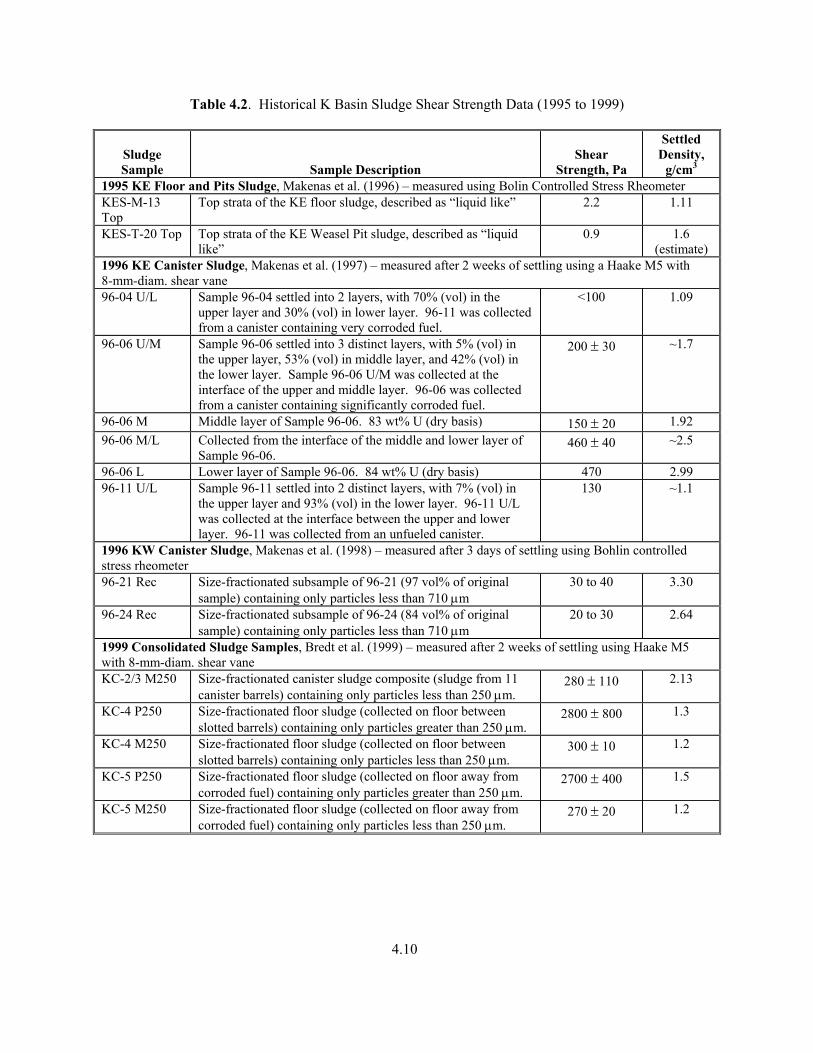
Table 4.2. Historical K Basin Sludge Shear Strength Data (1995 to 1999)
Sludge Sample Sample Description
Shear Strength, Pa
Settled Density,
g/cm3 1995 KE Floor and Pits Sludge, Makenas et al. (1996) – measured using Bolin Controlled Stress Rheometer KES-M-13 Top
Top strata of the KE floor sludge, described as “liquid like” 2.2 1.11
KES-T-20 Top Top strata of the KE Weasel Pit sludge, described as “liquid like”
0.9 1.6 (estimate)
1996 KE Canister Sludge, Makenas et al. (1997) – measured after 2 weeks of settling using a Haake M5 with 8-mm-diam. shear vane 96-04 U/L Sample 96-04 settled into 2 layers, with 70% (vol) in the
upper layer and 30% (vol) in lower layer. 96-11 was collected from a canister containing very corroded fuel.
<100 1.09
96-06 U/M Sample 96-06 settled into 3 distinct layers, with 5% (vol) in the upper layer, 53% (vol) in middle layer, and 42% (vol) in the lower layer. Sample 96-06 U/M was collected at the interface of the upper and middle layer. 96-06 was collected from a canister containing significantly corroded fuel.
200 ± 30 ~1.7
96-06 M Middle layer of Sample 96-06. 83 wt% U (dry basis) 150 ± 20 1.92 96-06 M/L Collected from the interface of the middle and lower layer of
Sample 96-06. 460 ± 40 ~2.5
96-06 L Lower layer of Sample 96-06. 84 wt% U (dry basis) 470 2.99 96-11 U/L Sample 96-11 settled into 2 distinct layers, with 7% (vol) in
the upper layer and 93% (vol) in the lower layer. 96-11 U/L was collected at the interface between the upper and lower layer. 96-11 was collected from an unfueled canister.
130 ~1.1
1996 KW Canister Sludge, Makenas et al. (1998) – measured after 3 days of settling using Bohlin controlled stress rheometer 96-21 Rec Size-fractionated subsample of 96-21 (97 vol% of original
sample) containing only particles less than 710 µm 30 to 40 3.30
96-24 Rec Size-fractionated subsample of 96-24 (84 vol% of original sample) containing only particles less than 710 µm
20 to 30 2.64
1999 Consolidated Sludge Samples, Bredt et al. (1999) – measured after 2 weeks of settling using Haake M5 with 8-mm-diam. shear vane KC-2/3 M250 Size-fractionated canister sludge composite (sludge from 11
canister barrels) containing only particles less than 250 µm. 280 ± 110 2.13
KC-4 P250 Size-fractionated floor sludge (collected on floor between slotted barrels) containing only particles greater than 250 µm.
2800 ± 800 1.3
KC-4 M250 Size-fractionated floor sludge (collected on floor between slotted barrels) containing only particles less than 250 µm.
300 ± 10 1.2
KC-5 P250 Size-fractionated floor sludge (collected on floor away from corroded fuel) containing only particles greater than 250 µm.
2700 ± 400 1.5
KC-5 M250 Size-fractionated floor sludge (collected on floor away from corroded fuel) containing only particles less than 250 µm.
270 ± 20 1.2
4.10
5.0 References Alderman, N. J., G. H. Meeten, and J. D. Sherwood. 1991. J. Non-Newtonian Fluid Mech. 39:291-310. ASM International. 1987. Metals Handbook, 9th edition, vol. 13, Corrosion. ASM International Handbook Committee, Metals Park, OH. American Society for Testing and Materials (ASTM). D 5334-92, Standard Test Method for Determinination of Thermal Conductivity of Soil and Soft Rock by Thermal Needle Probe Procedure. West Conshohocken, PA. Avarmidis, K. S., and R. M. Turain. 1991. J. Colloid Interface Sci. 143:54-68. Baker, R. B., T. L. Welsh, and B. J. Makenas. 2000. Sampling and Analysis Plan for Sludge from the 105-K Basins to Support Transport and Storage in T Plant. HNF-6479, Rev. 0, Fluor Hanford, Inc., Richland, WA. Barnes, H. A., and J. O. Carnali. 1991. J. Colloid Interface Sci. 143:54-68. Belle, J. 1961. Uranium Dioxide: Properties and Nuclear Applications, Naval Reactors. Division of Reactor Development, U.S. Atomic Energy Commission. U.S. Government Printing Office, Washington, D.C. Bowles, J. E. 1977. Foundation, Analysis and Design, 2nd edition, p. 99. McGraw-Hill, NY. Bredt, P. R., C. H. Delegard, A. J. Schmidt, and K. L. Silvers. 1999. Testing and Analysis of Consolidated Sludge Samples from the 105 K East Basin Floor and Canisters. PNNL-13341, Pacific Northwest National Laboratory, Richland, WA. Bredt, P. R., C. H. Delegard, A. J. Schmidt, K. L. Silvers, B. M. Thornton, and S. R. Gano. 2000. Particle Size (Sieving) and Enthalpy (Acid Calorimetry) Analysis of Single-Pull K East Basin Floor and Pit Sludges. PNNL-13373, Pacific Northwest National Laboratory, Richland, WA. Bryan, S. A., C. H. Delegard, A. J. Schmidt, R. L. Sell, K. L. Silvers, S. R. Gano, and B. M. Thornton. 2001. Gas Generation from K East Basin Sludges – Series II Testing. PNNL-13446, Pacific Northwest National Laboratory, Richland, WA. Delegard, C. H., S. A. Bryan, A. J. Schmidt, P. R. Bredt, C. M. King, R. L. Sell, L. L. Burger, and K. L. Silvers. 2000. Gas Generation from K East Basin Sludges – Series I Testing. PNNL-13320, Pacific Northwest National Laboratory, Richland, WA. Elmore, M. R., A. J. Schmidt, K. L. Silvers, B. M. Thornton, and S. R. Gano. 2000. Chemical and Radiochemical Analysis of Consolidated Sludge Samples from the K East Basin. PNNL-13360, Pacific Northwest National Laboratory, Richland, WA. Hecht, S. L. 1999. System Design Description for the Consolidated Sludge Sampling System to K Basins Floor and Fuel Canisters. WHC-SP-1182, Westinghouse Hanford Company, Richland, WA.
5.1

5.2
James, A. E., D. A. Williams, and P. R. Williams. 1987. Rheol. Acta. 26:437-446. Keentok, M. 1982. Rheol. Acta. 21:325-332. Keentok, M., J. F. Milthorpe, and E. O’Donovan. 1985. J. Non-Newtonian Fluid Mech. 17:23-35. Liddell, P. V., and D. V. Boger. 1996. “Yield Stress Measurements with the Vane.” J. Non-Newtonian Fluid Mech. 63:235-261. Lide, D. R. 1993. Handbook of Chemistry and Physics, 74th edition. CRC Press, Ann Arbor, MI. Lide, D. R. 1999. Handbook of Chemistry and Physics, 80th edition. CRC Press, Boca Raton, FL. Makenas, B. J., T. L. Welsh, R. B. Baker, D. R. Hansen, and G. R. Golcar. 1996. Analysis of Sludge from Hanford K East Basin Floor and Weasel Pit. WHC-SP-1182, Westinghouse Hanford Company, Richland, WA. Makenas, B. J., T. L. Welsh, R. B. Baker, E. W. Hoppe, A. J. Schmidt, J. Abrefah, J. M. Tingey, P. R. Bredt, and G. R. Golcar. 1997. Analysis of Sludge from Hanford K East Basin Canisters. HNF-SP-1201, DE&S Hanford, Inc., Richland, WA. Makenas, B. J. 2000. Data Quality Objectives for Analysis of Hanford K Basins Sludge to Support Transport to and Storage in T Plant. HNF-5345, Rev. 0, Fluor Hanford, Richland, WA. Nguyen, Q. D., and D. V. Boger. 1983. Rheol. Acta. 27:321-349. Nguyen, Q. D., and D. V. Boger. 1985a. Rheol. Acta. 24:247-437. Nguyen, Q. D., and D. V. Boger. 1985b. Rheol. Acta. 29:335-347. Pitner, A. L. 1999. K East Basin Sludge/Sampling 1999 Campaigns. HNF-4746, Rev. 0, Numatec Hanford Corporation, Richland, WA. Silvers, K. L., J. J. Wagner, and R. T. Steele. 2000. TCLP Preparation and Analysis of K East Basin Composite Sludge Samples. PNNL-13280, Pacific Northwest National Laboratory, Richland, WA. Weast, R. C., and M. J. Astle. 1982. Handbook of Chemistry and Physics, 63rd edition. CRC Press, Boca Raton, FL.

Appendix A
Thermal Conductivity Data
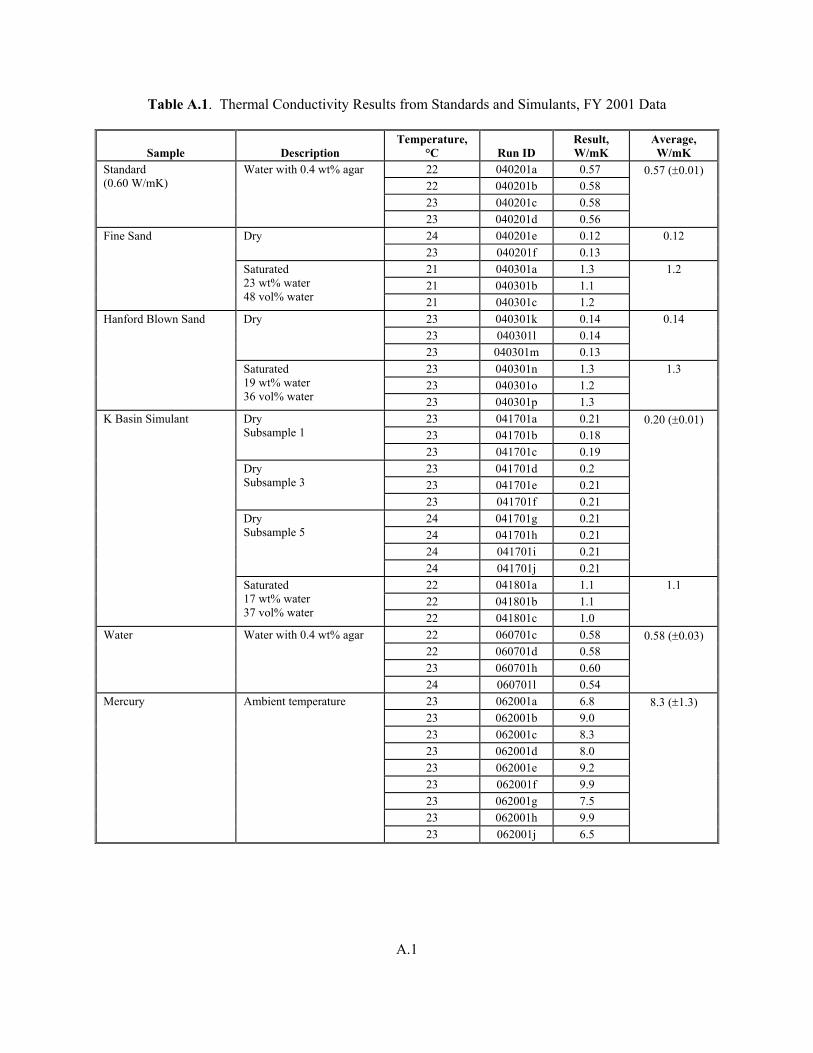
Table A.1. Thermal Conductivity Results from Standards and Simulants, FY 2001 Data
Sample Description Temperature,
°C Run ID Result, W/mK
Average, W/mK
22 040201a 0.57 22 040201b 0.58 23 040201c 0.58
Standard (0.60 W/mK)
Water with 0.4 wt% agar
23 040201d 0.56
0.57 (±0.01)
24 040201e 0.12 Dry 23 040201f 0.13
0.12
21 040301a 1.3 21 040301b 1.1
Fine Sand
Saturated 23 wt% water 48 vol% water 21 040301c 1.2
1.2
23 040301k 0.14 23 040301l 0.14
Dry
23 040301m 0.13
0.14
23 040301n 1.3 23 040301o 1.2
Hanford Blown Sand
Saturated 19 wt% water 36 vol% water 23 040301p 1.3
1.3
23 041701a 0.21 23 041701b 0.18
Dry Subsample 1
23 041701c 0.19 23 041701d 0.2 23 041701e 0.21
Dry Subsample 3
23 041701f 0.21 24 041701g 0.21 24 041701h 0.21 24 041701i 0.21
Dry Subsample 5
24 041701j 0.21
0.20 (±0.01)
22 041801a 1.1 22 041801b 1.1
K Basin Simulant
Saturated 17 wt% water 37 vol% water 22 041801c 1.0
1.1
22 060701c 0.58 22 060701d 0.58 23 060701h 0.60
Water Water with 0.4 wt% agar
24 060701l 0.54
0.58 (±0.03)
23 062001a 6.8 23 062001b 9.0 23 062001c 8.3 23 062001d 8.0 23 062001e 9.2 23 062001f 9.9 23 062001g 7.5 23 062001h 9.9
Mercury Ambient temperature
23 062001j 6.5
8.3 (±1.3)
A.1

Table A.2. Thermal Conductivity Results from KE Basin Sludge Samples, FY 2001 Data
Sample Description Temperature,
°C Run ID Result, W/mK
Average, W/mK
40 070901a 0.93 40 070901b 0.84 40 070901c 0.85
Sample in glass jar
41 070901d 0.85 41 070901e 0.88 41 070901f 0.88 41 070901g 0.89
Sample stirred and re-measured
41 070901h 0.89 41 070901i 0.80 41 070901j 0.78 41 070901k 0.83
FE-5
Sample stirred and re-measured
41 070901l 0.84
0.86 (±0.04)
Sample in glass jar 40 062901e 0.75 Repeat of run 062901 E 40 062901f 0.71 Repeat of run 062901 E 40 062901g 0.70 Repeat of run 062901 E 40 062901h 0.73
39 062901i 0.63 39 062901j 0.67 39 062901l 0.67
KC-4 M250
Moved probe to new location
39 062901m 0.67
0.69 (±0.04)
41 062801a 0.71 41 062801b 0.69
Sample in glass jar
41 062801c 0.69 37 062801d 0.68 37 062801e 0.67
Sample transferred to vendor sample holder
37 062801f 0.70 37 062901a 0.69 37 062901b 0.71 37 062901c 0.70
KC-5 M250
Sample stirred and re-measured
37 062901d 0.69
0.69 (±0.01)
39 070201a 0.98 39 070201b 0.81 39 070201c 0.81 39 070201d 0.80
Sample in glass jar
39 070201e 0.78 40 070201f 0.74 39 070201g 0.77 39 070201h 0.86
Sample stirred and re-measured
40 070201i 0.84 36 070201j 0.79 37 070201k 0.75
KC-2/3 M250
Sample stirred and re-measured
37 070201l 0.76
0.81 (±0.04)
A.2

Table A.3. Thermal Conductivity Results from Standards and Simulants, FY 2002 Data
Sample Description Temperature,
°C Run ID Result, W/mK
Average, W/mK
Water Standard + 0.5 wt% agar
32 112101c 0.56 0.56 (±0.05)
22 123101a 0.36 22 123101b 0.31
Dry
23 123101c 0.3
0.32 (±0.03)
23 123101d 2.7 23 123101e 2.6 23 123101f 1.6 23 123101g 1.9
W/Co(a) – 25 vol%, 310 g KB Sim – 75 vol%, 227 g
Saturated water, 40 g
22 123101h 2.5
2.3 (±0.5)
23 123101i 0.27 23 123101j 0.27
Dry
25 123101k 0.24
0.26 (±0.02)
23 010202e 3.8 23 010202f 3.6 23 010202g 3.4 23 010202h 3.2 22 010202i 4.5
W/Co(a) – 50 vol%, 708 g KB Sim – 50 vol%, 129 g
Saturated water, 40 g
23 010202j 4.1
3.8 (±0.5)
23 010202k 5.7 22 010202l 6.4 23 010202m 6.5 23 010202n 5.8 23 010202o 5.8
W/Co(a) – 75 vol%, 1062 g KB Sim – 25 vol%, 86 g
Saturated water, 41 g
23 010202p 6.5
6.1 (±0.4)
24 010202r 6.4 22 010202s 8.6 23 010202t 5.6 21 010202u 9.0 22 010202v 6.8 22 010202w 9.5 22 010202x 7.4 22 010202y 7.9
W/Co(a) – 100%, 1335 g Water, 38 g + 0.4% agar
22 010202z 8.3
7.7 (±1.3)
22 010202a 0.60 22 010202b 0.60 22 010202c 0.58 23 010202d 0.57
Water Standard, 0.4% agar
23 010202q 0.60
0.59 (±0.01)
(a) Volume of W/Co + K Basin Simulant + Water = 145 cm3.
A.3
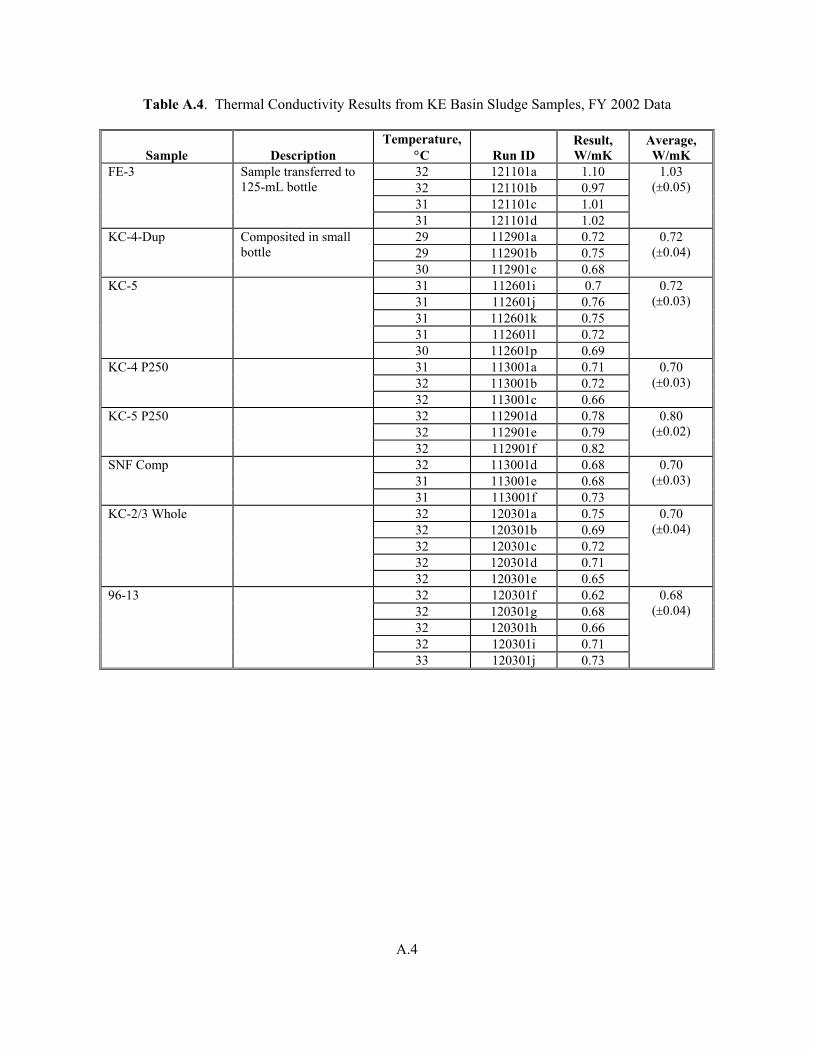
A.4
Table A.4. Thermal Conductivity Results from KE Basin Sludge Samples, FY 2002 Data
Sample Description Temperature,
°C Run ID Result, W/mK
Average, W/mK
32 121101a 1.10 32 121101b 0.97 31 121101c 1.01
FE-3 Sample transferred to 125-mL bottle
31 121101d 1.02
1.03 (±0.05)
29 112901a 0.72 29 112901b 0.75
KC-4-Dup Composited in small bottle
30 112901c 0.68
0.72 (±0.04)
31 112601i 0.7 31 112601j 0.76 31 112601k 0.75 31 112601l 0.72
KC-5
30 112601p 0.69
0.72 (±0.03)
31 113001a 0.71 32 113001b 0.72
KC-4 P250
32 113001c 0.66
0.70 (±0.03)
32 112901d 0.78 32 112901e 0.79
KC-5 P250
32 112901f 0.82
0.80 (±0.02)
32 113001d 0.68 31 113001e 0.68
SNF Comp
31 113001f 0.73
0.70 (±0.03)
32 120301a 0.75 32 120301b 0.69 32 120301c 0.72 32 120301d 0.71
KC-2/3 Whole
32 120301e 0.65
0.70 (±0.04)
32 120301f 0.62 32 120301g 0.68 32 120301h 0.66 32 120301i 0.71
96-13
33 120301j 0.73
0.68 (±0.04)

Appendix B
Shear Strength Measurement Plots

Appendix B
Shear Strength Measurement Plots B.1 Results from Shear Strength Measurements of As-Received (+20 Days
of Consolidation) K Basin Sludge Samples The shear stress/time profiles for the as-received K Basin samples are shown in Figures B.1 through B.6. Several measurements were taken on the same sample; the first run was taken at a location at the center of the sample container, and subsequent runs were taken in the undisturbed locations between the center and the container wall. Only the first measurement at the center container location conforms to the geometrical requirements outlined in Figure 4.1 in the text. The other measurements were taken at relatively undisturbed locations for the purpose of validating the initial measurement and may not conform to Figure 4.1. When no data are given for a particular run, those data were discarded due to their nonconforming behavior. Figure B.1 shows the shear stress response of Sample FE-3. The initial run was discarded. Subsequent runs in undisturbed locations show repeatable data with a shear strength in the range of 160-320 Pa.
050
100150200250300350
0 0.5 1 1.5Time (min)
Shea
r Str
ess
(Pa)
2
run # 2run # 3run # 4run # 5run # 6
050
100150200250300350
0 0.5 1 1.5Time (min)
Shea
r Str
ess
(Pa)
2
run # 2run # 3run # 4run # 5run # 6
Figure B.1. Shear Stress Response of As-Received K Basin Sludge Sample FE-3
B.1

Figure B.2 shows the shear stress response of Sample FE-5. The initial run was repeatable on subsequent runs. The measured shear strength was in the range of 3000-5000 Pa.
0
1000
2000
3000
4000
5000
6000
0 0.5 1 1.5 2
Time (min)
Shea
r Stre
ss (P
a)run # 1
run # 2
run # 4
run # 5
run # 6
Figure B.2. Shear Stress Response of As-Received K Basin Sludge Sample FE-5 Figure B.3 shows the shear stress response of Sample KC-4. The initial run was discarded. Subsequent runs in undisturbed locations show repeatable data with a shear strength in the range of 280-600 Pa.
0100200300400500600700
0 0.5 1 1.5
Time (min)
Shea
r Str
ess
(Pa)
2
run #2run #3run #5run #6
0100200300400500600700
0 0.5 1 1.5
Time (min)
Shea
r Str
ess
(Pa)
2
run #2run #3run #5run #6
Figure B.3. Shear Stress Response of As-Received K Basin Sludge Sample KC-4
B.2

Figure B.4 shows the shear stress response of Sample KC-5. The initial run was discarded. Subsequent runs in undisturbed locations show repeatable data with a shear strength in the range of 800-1100 Pa.
0
200
400
600
800
1000
1200
0 0.5 1 1.5 2
Time (min)
Shea
r Stre
ss (P
a)run #2
run #3
run #4
Figure B.4. Shear Stress Response of As-Received K Basin Sludge Sample KC-5
Figure B.5 shows the shear stress response of Sample KC-2/3 Whole. The initial run was repeatable on subsequent runs. The measured shear strength was in the range of 4,000-12,000 Pa. The sample container for KC-2/3 M250 was too large for as-received measurements. The sample material was transferred to a smaller container for further measurements.
02000400060008000
100001200014000
0 0.5 1 1.5 2
Time (min)
Shea
r Stre
ss (P
a) run #1
run #2
run #3
Figure B.5. Shear Stress Response of As-Received K Basin Sludge Sample KC-2/3 Whole
B.3

Figure B.6 shows the shear stress response of Sample SNF Comp. The sample container only allowed for one undisturbed measurement. The measured shear strength was approximately 1800 Pa.
0200400600800
100012001400160018002000
0 0.5 1 1.5Time (min)
Shea
r Stre
ss (P
a)
2
run # 1
Figure B.6. Shear Stress Response of As-Received K Basin Sludge Sample SNF Comp
Table B.1 shows a summary of the measured shear strength values. Erratic data were rejected; the remaining data were averaged and given with a standard deviation value.
Table B.1. Summary of As-Received Shear Strength Data
As-Received Shear Strength in Each Run (Pa)
Sample 1 2 3 4 5 6 Avg. SD
FE-3 (a) 3.2E+02 2.2E+02 1.6E+02 2.3E+02 2.9E+02 2.4E+02 6.1E+01
FE-5 4.6E+03 3.3E+03 (a) 3.9E+03 4.9E+03 3.2E+03 4.0E+03 7.5E+02
KC-4 (a) 3.0E+02 4.5E+02 (a) 6.0E+02 2.6E+02 4.0E+02 1.6E+02
KC-5 (a) 8.2E+02 1.1E+03 1.1E+03 1.0E+03 1.5E+02
SNF Comp 1.9E+03 Not enough sample for more runs 1.9E+03 KC-2/3 Whole 8.6E+03 4.0E+03 1.2E+04 (a) (a) 8.2E+03 4.0E+03 KC-2/3 M250 Container too large for shear vane
(a) Results obtained were judge invalid due to nonconforming behavior.
B.4

B.2 Results from Shear Strength Measurements of K Basin Sludge Samples 48 Hours After Mixing
The shear stress/time profiles for the sludge samples 48 hours after mixing are shown in Figures B.7 through B.12. Figure B.7 shows the shear stress response of Sample FE-3. The initial run was repeatable on subsequent runs. The measured shear strength was in the range of 450-1100 Pa.
0
200
400
600
800
1000
1200
0 0.2 0.4 0.6 0.8 1 1.2 1.4 1.6 1.8 2
run #1
run #2
run #3
Shea
r Str
ess
(Pa)
Time (min)
0
200
400
600
800
1000
1200
0 0.2 0.4 0.6 0.8 1 1.2 1.4 1.6 1.8 2
run #1
run #2
run #3
Shea
r Str
ess
(Pa)
Time (min)
Figure B.7. Shear Stress Response of K Basin Sludge Sample FE-3 48 Hours After Mixing
B.5

Figure B.8 shows the shear stress response of Sample FE-5. The initial run was the only acceptable data. The shear strength from this measurement was approximately 1100 Pa.
0
200
400
600
800
1000
1200
0 0.2 0.4 0.6 0.8 1 1.2 1.4 1.6 1.8 2
Time (min)
run #1
Shea
r Str
ess
(Pa)
0
200
400
600
800
1000
1200
0 0.2 0.4 0.6 0.8 1 1.2 1.4 1.6 1.8 2
Time (min)
run #1
Shea
r Str
ess
(Pa)
Figure B.8. Shear Stress Response of K Basin Sludge Sample FE-5 48 Hours After Mixing Figure B.9 shows the shear stress response of Sample KC-4. The initial run was discarded. A subsequent run in an undisturbed location shows repeatable data with a shear strength in the range of 175-475 Pa.
0
50
100
150200
250
300350
400
450
500
0 0.5 1 1.5 2
Time (min)
Shea
r Str
ess
(Pa)
run #1run #2
0
50
100
150200
250
300350
400
450
500
0 0.5 1 1.5 2
Time (min)
Shea
r Str
ess
(Pa)
run #1run #2
Figure B.9. Shear Stress Response of K Basin Sludge Sample KC-4 48 Hours After Mixing
B.6

Figure B.10 shows the shear stress response of Sample KC-5. The initial run was the only acceptable data. The shear strength from this measurement was approximately 1100 Pa.
0
200
400
600
800
1000
1200
0 0.5 1 1.5 2
Time (min)
Shea
r Stre
ss (P
a)
run #1
Figure B.10. Shear Stress Response of K Basin Sludge Sample KC-5 48 Hours After Mixing
Figure B.11 shows the shear stress response of Sample KC-2/3 Whole. The initial run is repeatable on subsequent runs. The measured shear strength was in the range of 4500-7500 Pa.
0
1000
2000
3000
4000
5000
6000
7000
8000
0 0.5 1 1.5 2
Time (min)
Shea
r Stre
ss (P
a)
run #1
run #2
run #3
Figure B.11. Shear Stress Response of K Basin Sludge Sample KC-2/3 48 Hours After Mixing
Although it was put into the smaller container, the KC-2/3 M250 sample produced a series of unreliable results, and the entire set of data was discarded.
B.7

Figure B.12 shows the shear stress response of Sample SNF Comp. The sample container only allowed for one undisturbed measurement. The measured shear strength was approximately 750 Pa.
0
100
200
300
400
500
600
700
800
0 0.5 1 1.5 2
Time (min)
Shes
s St
reng
th (P
a)
run #1
Figure B.12. Shear Stress Response of K Basin Sludge Sample SNF Comp 48 Hours After Mixing
Table B.2 shows a summary of the measured shear strength values. Erratic data were rejected; the remaining data were averaged and given with a standard deviation value.
Table B.2. Summary of Shear Strength Data 48 Hours After Mixing
48-hr Shear Strength in Each Run (Pa) Sample 1 2 3 4 5 6 Avg. SD
FE-3 4.5E+02 7.3E+02 1.1E+03 7.6E+02 3.4E+02FE-5 1.1E+03 (a) 1.1E+03 KC-4 (a) 4.8E+02 4.8E+02 KC-5 1.1E+03 (a) 1.1E+03 SNF Comp 7.4E+02 7.4E+02 KC-2/3 Whole 7.6E+03 4.8E+03 4.5E+03 5.7E+03 1.7E+03KC-2/3 M250 (a) (a) (a) (a) (a) Results obtained were judge invalid due to nonconforming behavior.
B.8

B.3 Results from Shear Strength Measurements of K Basin Sludge Samples 5 Days After Mixing
The shear stress/time profiles are shown in Figures B.13 through B.17 for the sludge samples 5 days after mixing. Figure B.13 shows the shear stress response of Sample FE-3 5 days after mixing. The initial run was repeatable on a subsequent run. The measured shear strength was approximately 900 Pa.
0
100
200
300
400
500
600
700
800
900
1000
0 0.2 0.4 0.6 0.8 1 1.2 1.4 1.6 1.8 2
run #1run #2
Shea
r Str
ess
(Pa)
Time (min)
0
100
200
300
400
500
600
700
800
900
1000
0 0.2 0.4 0.6 0.8 1 1.2 1.4 1.6 1.8 2
run #1run #2
Shea
r Str
ess
(Pa)
Time (min)
Figure B.13. Shear Stress Response of K Basin Sludge Sample FE-3 5 Days After Mixing
Figure B.14 shows the shear stress response of Sample FE-5 5 days after mixing. The initial run is repeatable on subsequent runs. The measured shear strength was in the range of 700-2100 Pa.
B.9

0
500
1000
1500
2000
2500
3000
0 0.5 1 1.5 2
Time (min)
Shea
r Stre
ss (P
a)
run #1
run #2
run #3
run #4
Figure B.14. Shear Stress Response of K Basin Sludge Sample FE-5 5 Days After Mixing Figure B.15 shows the shear stress response of Sample KC-4. The initial run was repeatable on a subsequent run. The measured shear strength was approximately 250-400 Pa.
0
50
100
150
200
250
300
350
400
450
0 0.5 1 1.5 2
Time (min)
Shea
r Str
ess
(Pa)
run #1
run #3
Figure B.15. Shear Stress Response of K Basin Sludge Sample KC-4 5 Days After Mixing
B.10

Figure B.16 shows the shear stress response of Sample KC-5. The initial run was repeatable on a subsequent run. The measured shear strength was approximately 1500 Pa.
0
200
400
600
800
1000
1200
1400
1600
1800
0 0.5 1 1.5 2
Time (min)
run #1
run #2
Shea
r Str
ess
(Pa)
0
200
400
600
800
1000
1200
1400
1600
1800
0 0.5 1 1.5 2
Time (min)
run #1
run #2
Shea
r Str
ess
(Pa)
Figure B.16. Shear Stress Response of K Basin Sludge Sample KC-5 5 Days After Mixing
Figure B.17 shows the shear stress response of Sample KC-2/3 Whole. The initial run is repeatable on subsequent runs. The measured shear strength was in the range of 4200-5200 Pa.
0
1000
2000
3000
4000
5000
6000
0 0.5 1 1.5 2
Time (min)
Shea
r Str
ess
(Pa)
run #1
run #2
run #3
Figure B.17. Shear Stress Response of K Basin Sludge Sample KC-2/3 Whole 5 Days After Mixing
Although in the smaller sample container, the KC-2/3 M250 sample produced a series of unreliable results. This entire set of data was discarded. Also, the SNF Comp sample produced a series of unreliable results. This entire set of data was also discarded.
B.11

B.12
Table B.3 shows a summary of the measured shear strength values. Erratic data were rejected; the remaining data were averaged and given with a standard deviation value.
Table B.3. Summary of Shear Strength Data 5 Days After Mixing
5-Day Shear Strength in Each Run (Pa) Sample 1 2 3 4 5 6 Avg. SD
FE-3 9.1E+02 9.3E+02 9.2E+02 FE-5 9.0E+02 1.7E+03 2.1E+03 2.4E+03 (a) 1.8E+03 6.4E+02 KC-4 2.5E+02 (a) 4.0E+02 3.3E+02 KC-5 1.5E+03 1.6E+03 1.6E+03 SNF Comp (a) (a) KC-2/3 Whole
4.6E+03 4.1E+03 5.2E+03 4.6E+03 5.6E+02
KC-2/3 M250
(a)
(a) Results obtained were judge invalid due to nonconforming behavior.