Embed Size (px)
Citation preview
Thermal Birefringence in Freely Quenched MultilayeredSlabs of Amorphous Polymers: Experimentand Simulation
Nam Hyung Kim, Avraam I. IsayevDepartment of Polymer Engineering, The University of Akron, Akron, Ohio 44325-0301
The simulation of the gapwise distribution of thethermally-induced residual birefringence and stressesin freely-quenched PS-PC-PS and PC-PS-PC multi-lay-ered slabs in water was carried out to calculate thegapwise distribution of the transient and residual bire-fringence. The modeling was based on the linearviscoelastic and photoviscoelastic constitutive equa-tions combined with the first-order rate equation forvolume relaxation. The master curves for the Young’srelaxation modulus and strain-optical coefficient func-tions obtained earlier for PS and PC were used in thesimulations. The obtained numerical results providedthe evolution of the thermally-induced stress and bire-fringence with time during and after quenching. Thepredicted gapwise residual birefringence distribution inthese slabs was found to be in a fair agreement withthe measured results. In addition, the gapwise distribu-tion of the thermally-induced residual birefringence inthe multi-layered PS-PMMA-PS, PMMA-PS-PMMA,PMMA-PC-PMMA, and PC-PMMA-PC slabs quenchedfrom different initial temperatures was measured.Explanations were provided for the observed gapwisedistribution of the thermal residual birefringence ineach layer of these slabs including the effect ofthe initial temperature. POLYM. ENG. SCI., 54:2097–2111,2014. VC 2013 Society of Plastics Engineers
INTRODUCTION
During polymer processing, the polymer undergoes
simultaneous mechanical and thermal influences in the
fluid, rubbery, and glassy states. These effects introduce
orientation, residual stresses, and shrinkage in the prod-
ucts which in turn affect the physical, optical and
mechanical properties, dimensional stability, and appear-
ance of the finished products. The frozen orientation man-
ifests itself in the frozen-in birefringence phenomenon.
The residual stresses and birefringence in polymer proc-
essing operations can be attributed to two main sources.
One is the flow-induced residual stresses including the
shear and normal stresses during the nonisothermal flow.
The other is the thermally induced stresses induced during
the cooling process and inhomogeneous densitification
even in the absence of flow [1–7]. The thermal stresses
occur in parts that experience inhomogeneous temperature
variations. In the case of elastic materials subjected to
free quenching, a temperature gradient induces the tran-
sient thermal stresses that vanish when the sample reaches
a homogeneous temperature. This occurs only if there is
no plastic deformation and the material properties
throughout the sample are homogeneous at the initial and
final states [6, 8]. Thermal stresses arise due to the com-
bination of an inhomogeneous temperature distribution
and a strong dependence of the mechanical properties of
the material on temperature. In the case of polymeric
materials, the combined effect of the non-equilibrium
density variation and the viscoelastic behavior of the
polymer taking place during cooling through the glass
transition temperature (Tg) results in the thermal stresses
and birefringence. Due to low thermal conductivity of
polymers, the cooling process generates a large tempera-
ture gradient along the sample thickness such that each
position reaches the final temperature at different times.
As a consequence, each point experiences different ther-
mal history. During cooling, due to the temperature gradi-
ent, the polymer contracts at different proportion causing
the thermal stresses. These stresses partially relax in
regions where the temperature is elevated. However,
when the polymer cools down from above to belowTg, its
Young’s modulus increases by several orders of magni-
tude [9]. Therefore, part of the thermal stresses and bire-
fringence generated during solidification will not relax
resulting in the residual stress and birefringence distribu-
tion in the final product [6]. However, the thermal bire-
fringence is not a linear function of the thermal stress,
since the stress-optical or strain-optical coefficient shows
a photoviscoelastic behavior and becomes a function of
both the time and temperature in the glass-to-rubber tran-
sition zone. Therefore, the memory effect in the optical
behavior of the polymer becomes significant and a photo-
viscoelastic relation should be utilized in correlating the
Correspondence to: Avraam I. Isayev e-mail: [email protected]
Contract grant sponsor: NSF Division of Engineering; contract grant
number: DMI-0322920.
DOI 10.1002/pen.23748
Published online in Wiley Online Library (wileyonlinelibrary.com).
VC 2013 Society of Plastics Engineers
POLYMER ENGINEERING AND SCIENCE—2014
thermal birefringence with thermal stresses [10–14]. How-
ever, very little work is available in the existing literature
concerning this aspect.
Osaki and coworkers [15–18] performed the dynamic
and stress relaxation measurements for polystyrene (PS)
and polycarbonate (PC) over the temperature range of 90
to 115�C for PS and 142 to 156�C for PC. In the analysis
of the data, they utilized a so-called modified stress-
optical rule earlier developed by Read [19]. For PS, the
master curves of the Young’s relaxation modulus at the
reference temperature of 100�C, as well as the strain-
optical coefficient at the reference temperature of 115�Cwere obtained. Shyu and Isayev [12, 20] carried out the
stress relaxation measurement over the temperature range
of 22 to 123�C for PS and 22 to 153�C for PC to obtain
the master curve of the time-dependent relaxation modu-
lus and strain-optical coefficient functions along with
their respective shift factors from which the stress-optical
coefficient functions for both PS and PC were calculated.
Over the years the factors governing the development
of the thermal residual stresses and birefringence during
the polymer processing have received much attention
from many researchers [5, 10, 21–32]. In particular,
Isayev and Crouthamel [5] and Isayev [21] gave reviews
on the relevant theoretical works about the thermal
stresses and birefringence in quenched amorphous poly-
mers. The theories that have been attempted can be clas-
sified into two categories. One is based on the instant-
freezing assumption [5, 21–23, 27, 28, 30, 33–35], which
states that above and below Tgthe polymer can respec-
tively be treated as an idealized fluid and an idealized
elastic material [33]. The other is based on the visco-
elastic constitutive equation relating the stresses to the
strains with an inclusion of the free volume relaxation
affected by rapid cooling [5, 10, 21, 24, 32, 36–44].
Therefore, the thermal histories and viscoelastic effects
should be taken into account when the thermal stresses
and birefringence of the final products are calculated. In
the polymer processing because of the high temperature
gradient through the part thickness and the rapid tempera-
ture change, the nonequilibrium free volume should be
included in the Williams-Landel-Ferry (WLF) equation
based on the free-volume approach [45]. In addition, the
time-dependent volume relaxation [46, 47] should be
taken into account. Bartenev [34, 35] was evidently the
first to propose the “instant freezing” theory for descrip-
tion of the thermal stresses in inorganic glasses. It treats
the glass above Tg, as an ideal fluid bearing no stresses
due to low viscosity. On the other hand, below Tg, glass
is solidified and treated as an elastic material with no
flow and stress relaxation as a result of high viscosity.
Since the instant freezing assumption is too crude to
describe the time-temperature behavior of polymeric
materials in the transition zone, significant deviation of
the predictions from the experimental results was
observed. Santhanam [48] predicted the thermal stresses
in injection molded parts by introducing the linear visco-
elastic model. However, the predicted residual stresses
were much higher than experimental results. Bushko and
Stokes [22, 23] briefly reviewed the development in mod-
eling of the thermal stresses, studied the residual stresses
and dimensional changes caused by solidification using a
thermoviscoelastic model and thought this model could
be used to assess the packing pressure effect in injection
molded strip. But these studies did not take into account
the density relaxation phenomena of polymeric materials.
Schwarzl and Staverman [49] classified “thermorheo-
logically simple” materials as materials in which all
molecular changes are affected by temperature in the
same way and specified the condition for the material
relaxation function to satisfy the time-temperature equiva-
lence principle. Consequently, only amorphous thermo-
plastics are expected to exhibit such a thermorheological
simplicity since in the semicrystalline polymers both the
change of the crystalline and amorphous structure will
certainly depend on the temperature in a way different
from that of the viscosity in the amorphous polymers.
The most appealing equation to many researchers was
derived by Morland and Lee [36] who extended the linear
viscoelasticity theory to account for the time- and
temperature-dependent variations of properties by intro-
ducing the concept of the pseudotime or material time
which is in general a function of both time and space var-
iables. The model was applied to a cylinder of the incom-
pressible linear thermorheologically simple material
subjected to a steady-state temperature field. However,
the thermal stresses due to nonhomogeneous thermal
expansion were neglected in this model because of the
assumption of incompressibility. Based on the free vol-
ume theory, Shyu and Isayev [4, 10, 12, 50, 51] devel-
oped a physical model to predict the thermally-induced
birefringence. They also performed experimental meas-
urements of the birefringence in freely quenched samples.
Ghoneim and Hieber [52] attempted to predict the thermal
residual stresses including density relaxation phenomena,
indicating that the density relaxation has a significant
effect on the evolution of the residual stresses. However,
in their work, no attempt was made to compare numerical
results with experimental data. Guo and Isayev [24, 32]
compared the thermoelastic model and thermoviscoelastic
model to calculate the residual thermal stresses in freely
quenched slabs of semicrystalline polymers, based on the
modifications of the Indenbom theory [33] and Morland
and Lee viscoelastic constitutive equation [36] with crys-
tallization phenomena taken into account.
Recently, Min and Yoon [53] performed frequency
sweep tests to obtain the stress optical behavior in a wide
range of frequency and temperature including rubbery,
glassy, and glass transition regions for PS, PC, cyclic ole-
fin copolymer (COC). In particular, they found that for
COCs of different compositions exhibiting different val-
ues of Tg the stress-optical coefficients in rubbery and
glassy states was almost unaffected by the difference in
composition.
2098 POLYMER ENGINEERING AND SCIENCE—2014 DOI 10.1002/pen
The objective of this study was to elucidate the ther-
mally induced birefringence in freely quenched multilay-
ered slabs made of various layer combinations. To the best
of our knowledge, this study is the first attempt in available
literature where simulations and measurements of the gap-
wise distribution of the thermally-induced birefringence Dnin freely quenched multilayer slabs is considered. The pres-
ent modeling is based on the linear viscoelasticity and lin-
ear photoviscoelasticity accounting for the time and
temperature dependence of mechanical and optical proper-
ties with the volume relaxation based on the first-order rate
equation [25]. The numerical formulation is based on the
quasi-static analysis with the hypothesis of infinitesimal
deformations of linear viscoelastic multilayered slabs expe-
riencing one-dimensional heat conduction along their thick-
ness direction only. To verify the modeling, free quenching
experiments were performed on thin multilayered slabs at
different initial temperatures using various combinations of
polymer layers and their birefringence distributions along
the thickness direction were measured. This comparison is
useful for applications of the model to predict the residual
birefringence in co-injection molded and co-extruded parts.
MATERIALS AND EXPERIMENTAL PROCEDURES
Multilayered slabs were prepared from a variety of
material combinations under quenching conditions, as
listed in Table 1. Single component slabs of PS (Styron
615-APR, Dow Chemical Co.), PC (PC123, General Elec-
trical Co.), and polymethyl methacrylate (PMMA) (Per-
spex CP-51, INEOS Acrylics) with dimensions of 12 3
10 3 0.15 cm3 were first manufactured by compression
molding at 185�C for PS, 190�C for PMMA and 225�Cfor PC, followed by slow cooling for approximately 10 h
inside the compression molding machine to obtain the
stress-free slabs. The prepared slabs were stacked in the
rectangular mold to make multi-layered slabs with dimen-
sions of 12 3 10 3 0.45 cm3. The mold with the stacked
slabs was placed into vacuum oven for 45 min at a tem-
perature of 225�C for the PC being the outer layer and
210�C for the PS or PMMA being the outer layer fol-
lowed by slow cooling. These multilayered slabs were
then cut into dimensions of 5 3 5 3 0.45 cm3 for carry-
ing out free quenching experiments. Before quenching,
the birefringence measurements for one multilayered slab
were carried out showing negligible birefringence (of the
order of 1027). Initial temperatures of 150, 160, 170, and
180�C were employed for material combinations of PS-
PC-PS, PC-PS-PC, PMMA-PC-PMMA, and PC-PMMA-
PC, and 110, 130, 150, and 170�C for material combina-
tions of PS-PMMA-PS and PMMA-PS-PMMA. A
quenching temperature of 25�C was used for all material
combinations. For quenching, the slab was placed in a
beaker filled with silicone oil at the required initial tem-
perature. After reaching equilibrium the multilayered slab
was quickly taken out of the beaker and immediately
quenched in water at 25�C.
Based on the magnitude of the thermally induced bire-
fringence in the multilayer slabs, a strip of a thickness of
0.2 cm for PS-PC-PS and PC-PS-PC slabs and a strip of
a thickness of 0.2 cm or 0.4 cm for PMMA-PC-PMMA,
PC-PMMA-PC, PS-PMMA-PS, and PMMA-PS-PMMA
slabs were cut from the quenched slabs by a low speed
diamond saw (ISOMET/BUECHLER). The birefringence
distribution along the slab thickness direction was then
measured by a polarizing microscope (Leitz Laborlux 12
POL/LEITZ WETZLAR) with a compensator (4th or 30th
order, 1592K/LEITZ WETZLAR) within 2 to 3 days after
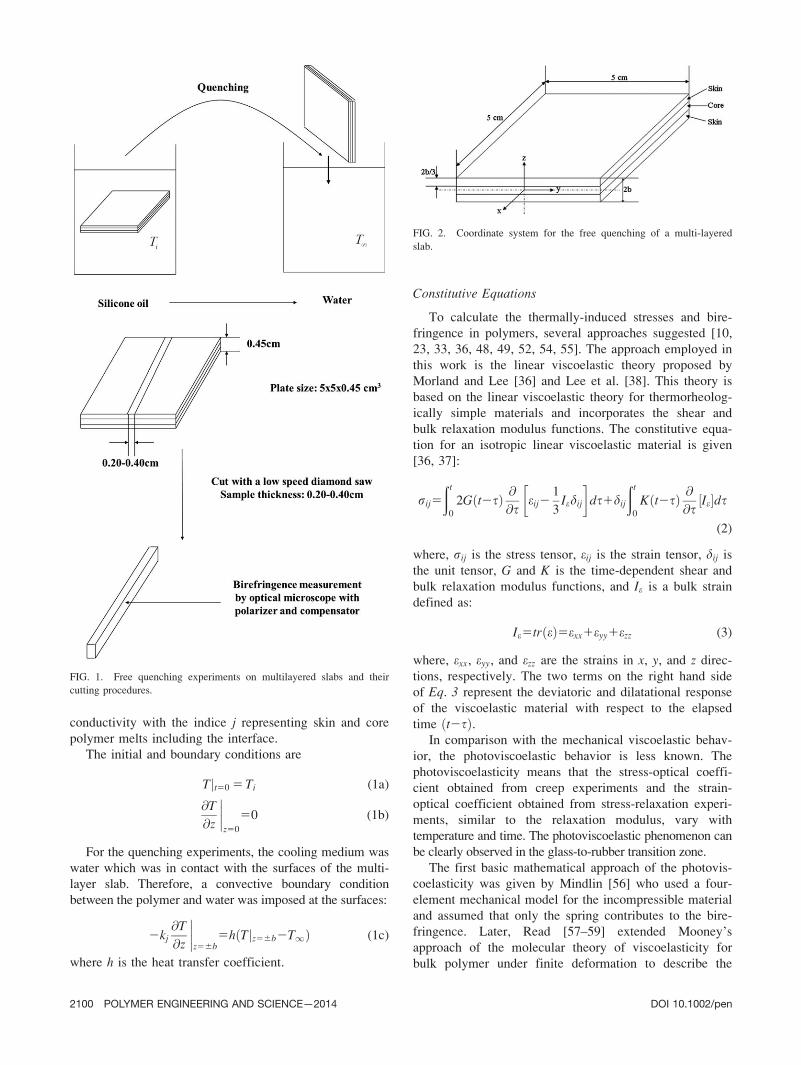
quenching. Figure 1 shows the schematic diagram of the
experimental procedure.
THEORETICAL
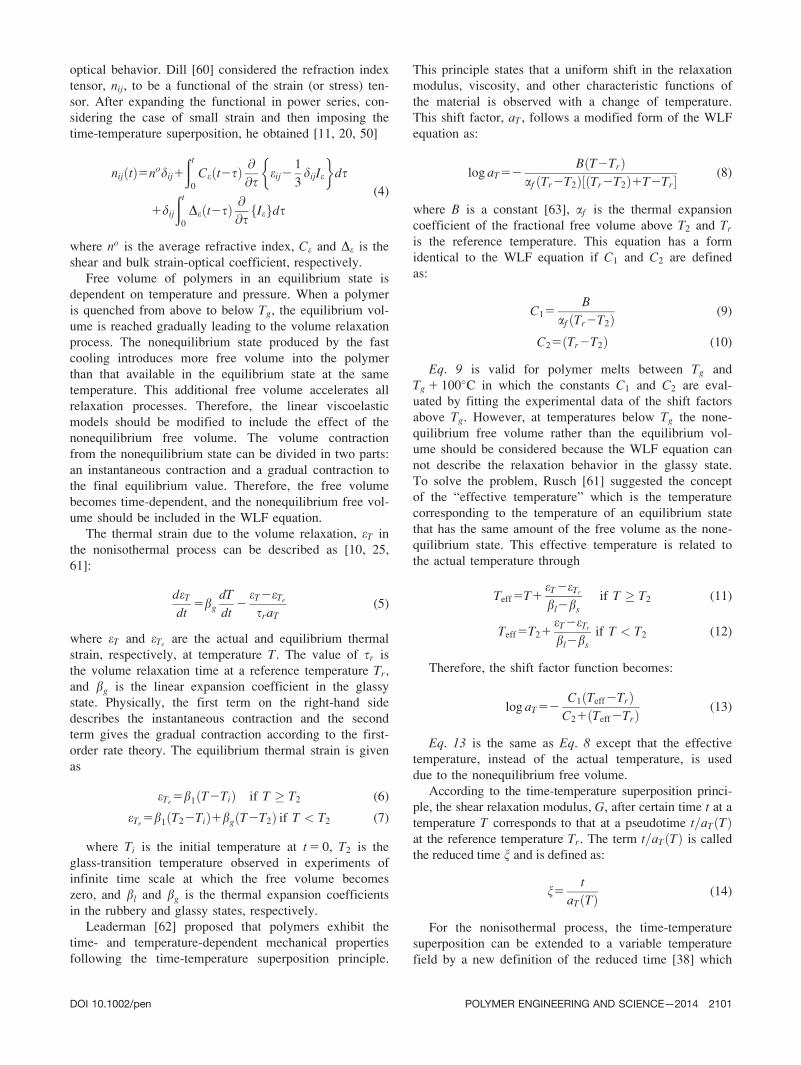
An idealized problem of the free quenching of a multi-
layered slab with the geometry and coordinate system
shown in Fig. 2 was considered. The slab was assumed to
be infinite in x-y plane with its thickness being 2b. Ini-
tially, the slab is at a uniform initial temperature of Ti
above Tg. Then, it is subjected to symmetric cooling from
both surfaces at a coolant temperature of T1 below Tg.
Therefore, heat transfer occurs only in z direction. The
thermal stresses and birefringence are generated due to
the interactions between nonhomogeneous thermal con-
traction and changes in the polymer viscoelastic and opti-
cal properties during cooling.
Temperature Distribution
The temperature distribution of the multilayered slab
was calculated by solving the one-dimensional heat trans-
fer equation:
@T
@t5aj
@2T
@z2
� �(1)
where aj5kj
qjCp;jis the thermal diffusivity with q, Cp, and
k being the density, heat capacity, and the thermal
TABLE 1. Multilayered slabs and quenching conditions.
Material combination Initial temperature Quenchingy temperature
PS-PC-PS Silicone oil Water
PC-PS-PC 150 �C (90 min) 25 �C160�C(15min) 25 �C
170 �C (8 min) 25 �C180�C (5 min) 25 �C
PS-PMMA-PS Silicone oil Water
PMMA-PS-PMMA 110�C (60 min) 25 �C130 �C (30 min) 25 �C150 �C (15 min)
170 �C (5 min)
25 �C
PMMA-PC -PMMA Silicone oil 25 �C Water
PC-PMMA-PC 150 �C (90 min) 25 �C160 �C (15 min) 25 �C170 �C (8 min) 25 �C180�C (5 min) 25 �C
DOI 10.1002/pen POLYMER ENGINEERING AND SCIENCE—2014 2099
conductivity with the indice j representing skin and core
polymer melts including the interface.
The initial and boundary conditions are
Tjt50 5 Ti (1a)
@T
@z
����z50
50 (1b)
For the quenching experiments, the cooling medium was
water which was in contact with the surfaces of the multi-
layer slab. Therefore, a convective boundary condition
between the polymer and water was imposed at the surfaces:
2kj@T
@z
����z56b
5h Tjz56b2T1ð Þ (1c)
where h is the heat transfer coefficient.
Constitutive Equations
To calculate the thermally-induced stresses and bire-
fringence in polymers, several approaches suggested [10,
23, 33, 36, 48, 49, 52, 54, 55]. The approach employed in
this work is the linear viscoelastic theory proposed by
Morland and Lee [36] and Lee et al. [38]. This theory is
based on the linear viscoelastic theory for thermorheolog-
ically simple materials and incorporates the shear and
bulk relaxation modulus functions. The constitutive equa-
tion for an isotropic linear viscoelastic material is given
[36, 37]:
rij5
ðt
0
2G t2sð Þ @@s
eij21
3Iedij
� �ds1dij
ðt
0
K t2sð Þ @@s
Ie½ �ds
(2)
where, rij is the stress tensor, eij is the strain tensor, dij is
the unit tensor, G and K is the time-dependent shear and
bulk relaxation modulus functions, and Ie is a bulk strain
defined as:
Ie5tr eð Þ5exx1eyy1ezz (3)
where, exx, eyy, and ezz are the strains in x, y, and z direc-
tions, respectively. The two terms on the right hand side
of Eq. 3 represent the deviatoric and dilatational response
of the viscoelastic material with respect to the elapsed
time t2sð Þ.In comparison with the mechanical viscoelastic behav-
ior, the photoviscoelastic behavior is less known. The
photoviscoelasticity means that the stress-optical coeffi-
cient obtained from creep experiments and the strain-
optical coefficient obtained from stress-relaxation experi-
ments, similar to the relaxation modulus, vary with
temperature and time. The photoviscoelastic phenomenon can
be clearly observed in the glass-to-rubber transition zone.
The first basic mathematical approach of the photovis-
coelasticity was given by Mindlin [56] who used a four-
element mechanical model for the incompressible material
and assumed that only the spring contributes to the bire-
fringence. Later, Read [57–59] extended Mooney’s
approach of the molecular theory of viscoelasticity for
bulk polymer under finite deformation to describe the
FIG. 2. Coordinate system for the free quenching of a multi-layered
slab.
FIG. 1. Free quenching experiments on multilayered slabs and their
cutting procedures.
2100 POLYMER ENGINEERING AND SCIENCE—2014 DOI 10.1002/pen
optical behavior. Dill [60] considered the refraction index
tensor, nij, to be a functional of the strain (or stress) ten-
sor. After expanding the functional in power series, con-
sidering the case of small strain and then imposing the
time-temperature superposition, he obtained [11, 20, 50]
nij tð Þ5nodij1
ðt
0
Ce t2sð Þ @@s
eij21
3dijIe
� �ds
1dij
ðt
0
De t2sð Þ @@s
Ief gds
(4)
where no is the average refractive index, Ce and De is the
shear and bulk strain-optical coefficient, respectively.
Free volume of polymers in an equilibrium state is
dependent on temperature and pressure. When a polymer
is quenched from above to below Tg, the equilibrium vol-
ume is reached gradually leading to the volume relaxation
process. The nonequilibrium state produced by the fast
cooling introduces more free volume into the polymer
than that available in the equilibrium state at the same
temperature. This additional free volume accelerates all
relaxation processes. Therefore, the linear viscoelastic
models should be modified to include the effect of the
nonequilibrium free volume. The volume contraction
from the nonequilibrium state can be divided in two parts:
an instantaneous contraction and a gradual contraction to
the final equilibrium value. Therefore, the free volume
becomes time-dependent, and the nonequilibrium free vol-
ume should be included in the WLF equation.
The thermal strain due to the volume relaxation, eT in
the nonisothermal process can be described as [10, 25,
61]:
deT
dt5bg
dT
dt2
eT2eTe
sraT(5)
where eT and eTeare the actual and equilibrium thermal
strain, respectively, at temperature T. The value of sr is
the volume relaxation time at a reference temperature Tr,
and bg is the linear expansion coefficient in the glassy
state. Physically, the first term on the right-hand side
describes the instantaneous contraction and the second
term gives the gradual contraction according to the first-
order rate theory. The equilibrium thermal strain is given
as
eTe5b1 T2Tið Þ if T � T2 (6)
eTe5b1 T22Tið Þ1bg T2T2ð Þ if T < T2 (7)
where Ti is the initial temperature at t 5 0, T2 is the
glass-transition temperature observed in experiments of
infinite time scale at which the free volume becomes
zero, and bl and bg is the thermal expansion coefficients
in the rubbery and glassy states, respectively.
Leaderman [62] proposed that polymers exhibit the
time- and temperature-dependent mechanical properties
following the time-temperature superposition principle.
This principle states that a uniform shift in the relaxation
modulus, viscosity, and other characteristic functions of
the material is observed with a change of temperature.
This shift factor, aT , follows a modified form of the WLF
equation as:
log aT52B T2Trð Þ
af Tr2T2ð Þ Tr2T2ð Þ1T2Tr½ � (8)
where B is a constant [63], af is the thermal expansion
coefficient of the fractional free volume above T2 and Tr
is the reference temperature. This equation has a form
identical to the WLF equation if C1 and C2 are defined
as:
C15B
af Tr2T2ð Þ (9)
C25 Tr2T2ð Þ (10)
Eq. 9 is valid for polymer melts between Tg and
Tg 1 100�C in which the constants C1 and C2 are eval-
uated by fitting the experimental data of the shift factors
above Tg. However, at temperatures below Tg the none-
quilibrium free volume rather than the equilibrium vol-
ume should be considered because the WLF equation can
not describe the relaxation behavior in the glassy state.
To solve the problem, Rusch [61] suggested the concept
of the “effective temperature” which is the temperature
corresponding to the temperature of an equilibrium state
that has the same amount of the free volume as the none-
quilibrium state. This effective temperature is related to
the actual temperature through
Teff5T1eT2eTr
bl2bs
if T � T2 (11)
Teff5T21eT2eTr
bl2bs
if T < T2 (12)
Therefore, the shift factor function becomes:
log aT52C1 Teff2Trð Þ
C21 Teff2Trð Þ (13)
Eq. 13 is the same as Eq. 8 except that the effective
temperature, instead of the actual temperature, is used
due to the nonequilibrium free volume.
According to the time-temperature superposition princi-
ple, the shear relaxation modulus, G, after certain time t at a
temperature T corresponds to that at a pseudotime t=aT Tð Þat the reference temperature Tr. The term t=aT Tð Þ is called
the reduced time n and is defined as:
n5t
aT Tð Þ (14)
For the nonisothermal process, the time-temperature
superposition can be extended to a variable temperature
field by a new definition of the reduced time [38] which
DOI 10.1002/pen POLYMER ENGINEERING AND SCIENCE—2014 2101
means that the thermal history and the time dependence
of G are accounted by a single variable n defined as:
n5
ðt
0
dt0
aT Tðt0Þ½ � (15)
By introducing the reduced time into Eqs. 2 and 4, the
following equations to calculate the thermally-induced
stresses and the refractive index tensor in terms of the
reduced time were, respectively, obtained [38].
rij nm tð Þð Þ5ðnm
0
2G nm2n0m @
@n0meij n0m
21
3Ie n0m
dij
� �dn0m
1dij
ðnm
0
K nm2n0m @
@n0mIe n0m
23eT n0m
dij
� �dn0m
(16)
nij nc tð Þð Þ5nodij1
ðnc
0
Ce nc2n0c @
@n0c
eij n0c
21
3dijIe n0c
� �dn0c
1dij
ðnc
0
De nc2n0c @
@n0cIe n0c
23eT n0c
dij
�dn0c
(17)
where nm is the reduced time for the modulus and nc is
the reduced time for the strain-optical coefficient. It
should be noted that Ie23eT means the strains resulting
from a temperature change and it does not contribute to
the pressure and birefringence. Eqs. 16 and 17 use the
different reduced time for the shear relaxation modulus
and strain-optical coefficient because their shift factors
may be different.
NUMERICAL IMPLEMENTATION
Temperature History
Equation 1 with initial and boundary conditions were
numerically solved to determine the temperature history
using the Crank-Nicolson scheme [64] by means of a
finite difference method, as shown in Appendix A. After
obtaining the thermal history for the multilayered slab,
the first order rate equation, Eq. 5, together with Eq. 11through Eq. 13 for the skin and core layers was solved by
the fourth order Runge-Kutta method [64] to obtain the
thermal strain eT , the effective temperature Teff , and the
shift factor aT for the skin and core layers. It should be
noted that values of eT , Teff , and aT for the skin and core
layers were averaged to obtain the value at the interface.
Then the value of n was determined from Eq. 15.
Stress and Strain Analysis
For an infinite multilayered slab subjected to symmet-
ric cooling, only volume contraction occurs upon cooling.
Therefore, it was assumed that no shear stress and strain
components are imposed such that
rij5eij50 i 6¼ jð Þ (18)
Moreover, no surface traction is acting on the interface
and free surfaces of the slab in x-y plane.
rzz5 0 2b � z � b (19)
Therefore, the problem is reduced to a planar
stress problem. Since the lateral dimensions are much
larger than the thickness (the edge effect is neglected),
the two non-zero normal stress and strain components are
equal to each other, and the strain components are inde-
pendent on z. Consequently, it can be written that
rxx5rxx z; tð Þ5ryy5ryy z; tð Þ (20)
exx5exx tð Þ5eyy5eyy tð Þ (21)
Because the multuilayered slab is free of constraints
(no external forces), the resulting force is zero through
the thickness.
ðb
2b
rxx z; tð Þdz50 (22)
It is seen that with this idealized problem of free
quenching, the calculation of the thermal stresses and
birefringence is greatly simplified.
Thermal Stresses and Birefringence
Numerical simulation schemes were formulated to cal-
culate the residual thermal stresses and birefringence in
the freely quenched multilayered slab.
Expanding Eq. 16 yields the following equation:
rxx sxy sxz
syx ryy syz
szx szy rzz
����������
����������5
ðnm
0
2G nm2n0m @
@n0m
exx exy exz
eyx eyy eyz
ezx ezy ezz
����������
����������2
1
3
Ie 0 0
0 Ie 0
0 0 Ie
����������
����������
266664
377775dn0m
1
ðnm
0
K nm2n0m @
@n0m
Ie 0 0
0 Ie 0
0 0 Ie
����������
����������2
3eT 0 0
0 3eT 0
0 0 3eT
����������
����������
266664
377775dn0m
(23)
2102 POLYMER ENGINEERING AND SCIENCE—2014 DOI 10.1002/pen
Substituting the volume bulk strain Ie given by Eq. 3into Eq. 23, the strain components resulting from only
temperature change become:
exx21
3Ie5
1
32exx2eyy2ezz
(24)
eyy21
3Ie5
1
32eyy2exx2ezz
(25)
ezz21
3Ie5
1
32ezz2exx2eyy
(26)
Ie23eT5exx1eyy1ezz23eT (27)
where the thermal strain eT is given by Eq. 5.
Substituting Eq. 24 to Eq. 27 into Eq. 24 and rearrang-
ing them using the stress analysis, Eq. 19 and Eq. 20, the
stress components were obtained as:
rxx5ryy5
ðnm
0
2G nm2n0m @
@n0m
1
3exx n0m
21
3ezz n0m � �
dn0m
(28)
rzz505
ðnm
0
2G nm2n0m @
@n0m
2
3ezz n0m
22
3exx n0m � �
dn0m
1
ðnm
0
K nm2n0m @
@n0m2exx n0m
1ezz n0m
23eT
� �dn0m
(29)
Numerical solutions for the stress and strain tensor
components are given in Appendix B.
After obtaining the strain history, exx tð Þ and ezz z; tð Þ, in
the multi-layered slab, the birefringence was calculated as
follows:
Dnth5nxx2nzz5
ðnc
0
Ce nc2n0ð Þ @@n0
exx n0ð Þ2ezz n0ð Þ½ �dn0 (30)
Similar to the stress calculation, using the piecewise
linear approximation, Eq. 30 was discretized to obtain the
explicit formulation for the birefringence calculation as
follows:
Dnth5nxx2nzz5Xj
k52
ekxx2ek21
xx 2ei;kzz 1ei;k21
zz
ni;kc 2ni;k21
c
3
ðni;kc
ni;k21c
Ce ni;kc 2n0
dn0
(31)
SIMULATED RESULTS AND COMPARISON WITHEXPERIMENTS
The physical properties of PS and PC used in the
numerical simulation are listed in Table 2. The Young’s
relaxation modulus, E, strain-optical coefficient, Ce,
stress-optical coefficient, Cr functions with the corre-
sponding shift factors, aT , are required in the linear visco-
elastic and photoviscoelastic constitutive equations. These
functions were obtained by performing tensile stress and
birefringence relaxation experiments and reported in ear-
lier studies [20, 50]. The residual birefringence distribu-
tion in freely quenched multilayered slabs was measured
within two to three days after quenching. The obtained
data were compared with the simulated results based on
the viscoelasticity and photoviscoelasticity with inclusion
of the volume relaxation till time of 2 3 105 s after
quenching. Since the volume relaxation was considered,
aging that occurred during two days following quenching
was included in the simulated results.
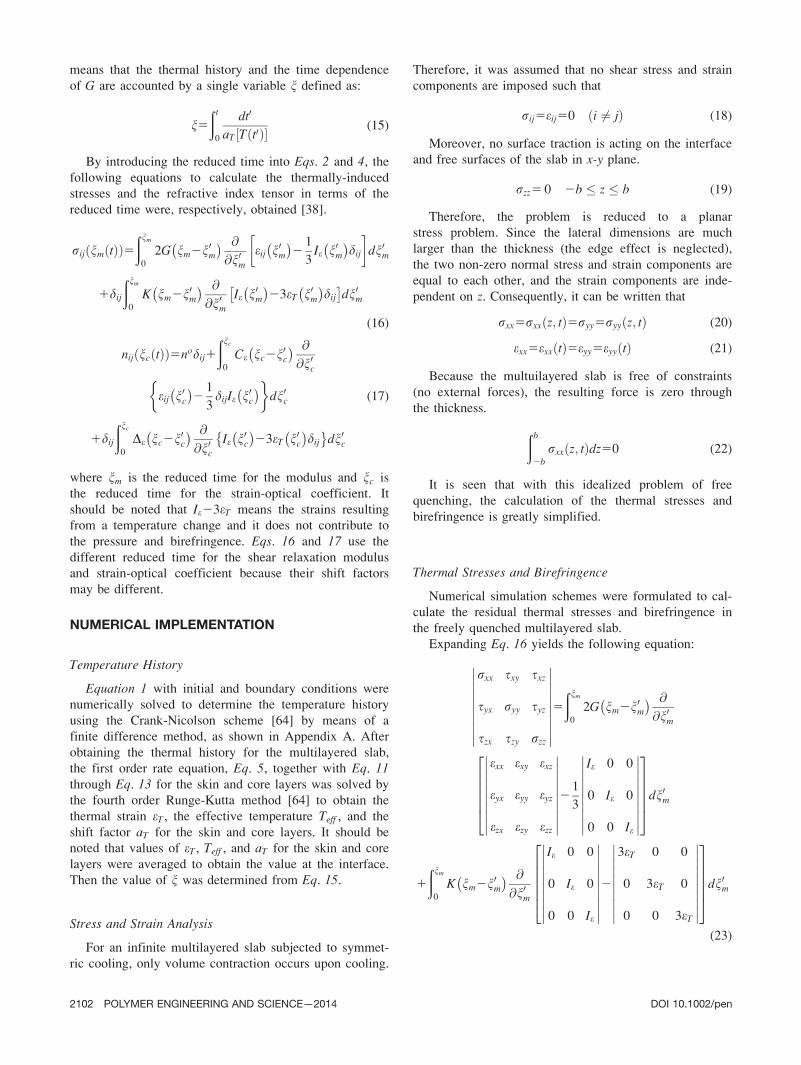
PS-PC-PS Slabs
Experiments have shown that no birefringence appears
when light is passed perpendicular to the x-y plane of the
multilayered slab, indicating that the birefringence in the
other two planes is equal. Thus, the birefringence in x-zor y-z planes was measured.
The measured and simulated thermally-induced resid-
ual birefringence distributions along the thickness direc-
tion of PS-PC-PS plates quenched in water at a
quenching temperature of 25�C from different initial tem-
peratures are shown in Fig. 3. The value of Cr for PC
used as the core layer is positive being, respectively 100
and 5600 Brewsters for the glass and melt state as deter-
mined from the tensile relaxation experiment [20, 50].
TABLE 2. Physical properties of PS and PC used in the simulation.
Properties PS Ref. PC Ref.
bl,(1/�K) 0.00066 [65] 0.00067 [65]
Bg,(1/�K) 0.00021 [65] 0.0002 [65]
a (m2/s) 6.13 1028 [65] 7.31 3 1028 [65]
h (J/s.m2,K) 490 [50] 490 [50]
sr (s) 0.04 [50] 0.3 [50]
Poisson ratio 0.33 [66] 0.41 [66]
WLF equation: C1 10.6 [50] 8.82 [50]
c2 (K) 57.0 [50] 40.2 [50]
Tr (K) 370.0 [50] 420.5 [50]
FIG. 3. Predicted and measured thermal birefringence distributions
along the thickness direction in PS-PC-PS multilayered slabs quenched
in 25�C water from different initial temperatures.
DOI 10.1002/pen POLYMER ENGINEERING AND SCIENCE—2014 2103
Therefore, the calculated and measured thermal birefrin-
gence in the PC core layer in quenched PS-PC-PS slabs
is always positive throughout the core thickness. It is
seen that the measured and simulated thermally-induced
birefringence of the PC core layer increases with an
increase of the initial temperature. In the PS skin layers,
at initial temperatures of 150 and 160�C the thermal bire-
fringence is negative throughout their thickness. It is due
to the fact that when the thermal stresses in the PS skin
layers of the quenched PS-PC-PS slabs are compressive
in the surface region and tensile away from the surface
(as shown in Fig. 4 for the thermal stress distribution),
the stress-optical coefficient, Cr, of PS changes sign dur-
ing cooling being negative in the melt state and positive
in the glassy [20, 50]. The compressive stress near the
surface and the positive stress-optical coefficient Cr of
PS layers in quenched PS-PC-PS slabs produces negative
birefringence in the case of initial temperatures of 150
and 160�C. Moreover, the compressive stress near the
surface and the negative stress-optical coefficient Cr of
PS after short quenching time produces negative birefrin-
gence for the case of initial temperatures of above 160�C.
On the other hand, for the core region of the PS skin
layers, the tensile thermal stresses and the negative stress-
optical coefficient Cr of PS after long quenching time
produces the negative birefringence at all the initial tem-
peratures, as shown in Fig. 3. Therefore, the sign for the
stress-optical coefficient Cr of PS results in the sign
reversal in the birefringence in the PS skin layers com-
pared with the PC core layer showing the positive bire-
fringence due to positive values of Cr of PC in the melt
and glassy states.
As the initial temperature increases from 160�C to
170�C and 180�C, the thermal birefringence becomes pos-
itive at the surface and negative in the extensive region
till the interface with position of zero birefringence being
near the surface of the PS layers. The difference between
birefringence distribution for the PC and PS layers can be
attributed in large part to the corresponding stress-optical
coefficient Cr of these polymers. It is known that the
value of Cr for PS is time- and temperature-dependent
and, negative and positive above and below Tg, respec-
tively. Its value for the melt is 25200 Brewsters [20, 50]
and 10 Brewsters at room temperature [20, 50, 67]. Such
a reversal in sign of the stress optical coefficient of PS
was caused by the orientation of the phenyl groups and
their polarizabilities [67–69].
It should be noted that the simulated results were
based on the volume relaxation times sr 5 0:04 s at 97�Cfor PS and sr 5 0:3s at 147.5�C for PC. These values
were found to fit all the measured thermal birefringence
in quenched single component PS and PC slabs [12, 25,
50]. However, it should be noted that no single volume
relaxation time can give the overall satisfactory predic-
tions of the residual birefringence in freely quenched PS
and PC slabs since the volume relaxation is governed by
a spectrum of relaxation times. The heat transfer coeffi-
cient, h, that best fit the experimental results was 490 J/s
m2 K for quenching of single component PS and PC slabs
in water [12, 25, 50]. This value of h was also used for
simulation of quenching of the multilayered slabs in this
study.
It should be noted that, similar to birefringence distri-
bution in the single polymer slabs subjected to the sym-
metric cooling, in the present case of the multilayered
slabs the thermal birefringence profile is not balanced,
that isÐ b2b Dndz 6¼ 0. The birefringence imbalance is due
to the fact that the stress-optical coefficient is not a con-
stant, but a function of both the time and temperature.
The simulated results of the thermal birefringence are in
qualitative agreement with the experimental data.
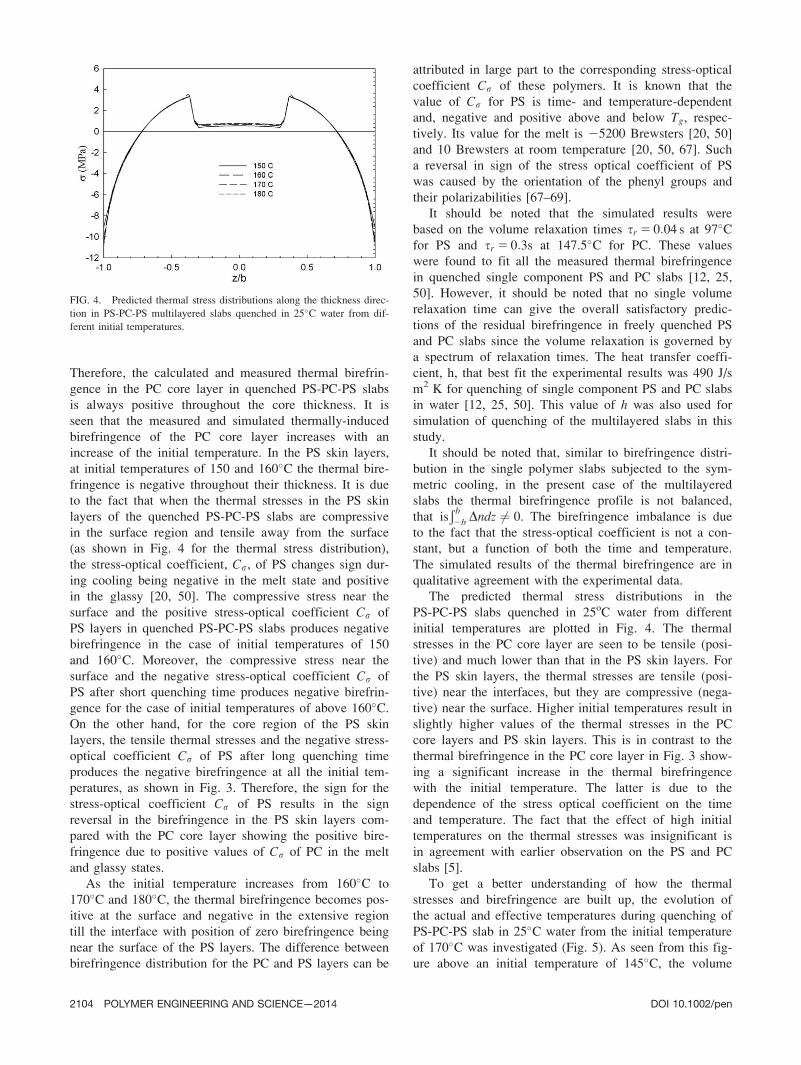
The predicted thermal stress distributions in the
PS-PC-PS slabs quenched in 25oC water from different
initial temperatures are plotted in Fig. 4. The thermal
stresses in the PC core layer are seen to be tensile (posi-
tive) and much lower than that in the PS skin layers. For
the PS skin layers, the thermal stresses are tensile (posi-
tive) near the interfaces, but they are compressive (nega-
tive) near the surface. Higher initial temperatures result in
slightly higher values of the thermal stresses in the PC
core layers and PS skin layers. This is in contrast to the
thermal birefringence in the PC core layer in Fig. 3 show-
ing a significant increase in the thermal birefringence
with the initial temperature. The latter is due to the
dependence of the stress optical coefficient on the time
and temperature. The fact that the effect of high initial
temperatures on the thermal stresses was insignificant is
in agreement with earlier observation on the PS and PC
slabs [5].
To get a better understanding of how the thermal
stresses and birefringence are built up, the evolution of
the actual and effective temperatures during quenching of
PS-PC-PS slab in 25�C water from the initial temperature
of 170�C was investigated (Fig. 5). As seen from this fig-
ure above an initial temperature of 145�C, the volume
FIG. 4. Predicted thermal stress distributions along the thickness direc-
tion in PS-PC-PS multilayered slabs quenched in 25�C water from dif-
ferent initial temperatures.
2104 POLYMER ENGINEERING AND SCIENCE—2014 DOI 10.1002/pen
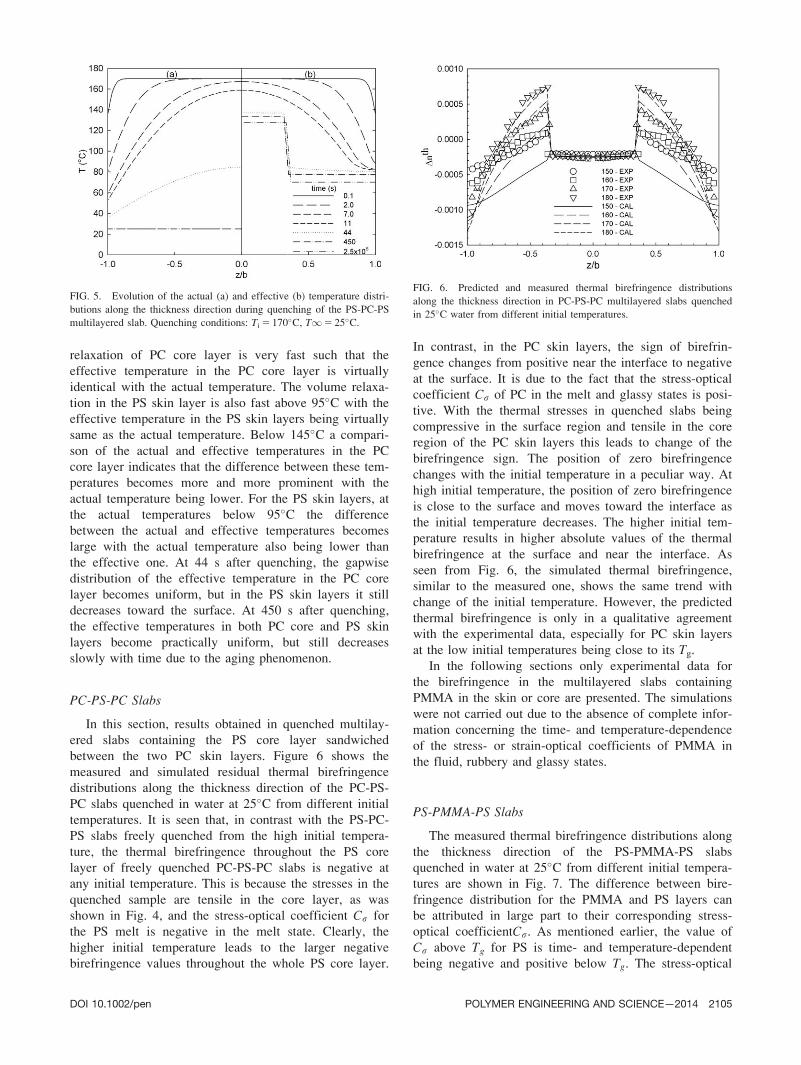
relaxation of PC core layer is very fast such that the
effective temperature in the PC core layer is virtually
identical with the actual temperature. The volume relaxa-
tion in the PS skin layer is also fast above 95�C with the
effective temperature in the PS skin layers being virtually
same as the actual temperature. Below 145�C a compari-
son of the actual and effective temperatures in the PC
core layer indicates that the difference between these tem-
peratures becomes more and more prominent with the
actual temperature being lower. For the PS skin layers, at
the actual temperatures below 95�C the difference
between the actual and effective temperatures becomes
large with the actual temperature also being lower than
the effective one. At 44 s after quenching, the gapwise
distribution of the effective temperature in the PC core
layer becomes uniform, but in the PS skin layers it still
decreases toward the surface. At 450 s after quenching,
the effective temperatures in both PC core and PS skin
layers become practically uniform, but still decreases
slowly with time due to the aging phenomenon.
PC-PS-PC Slabs
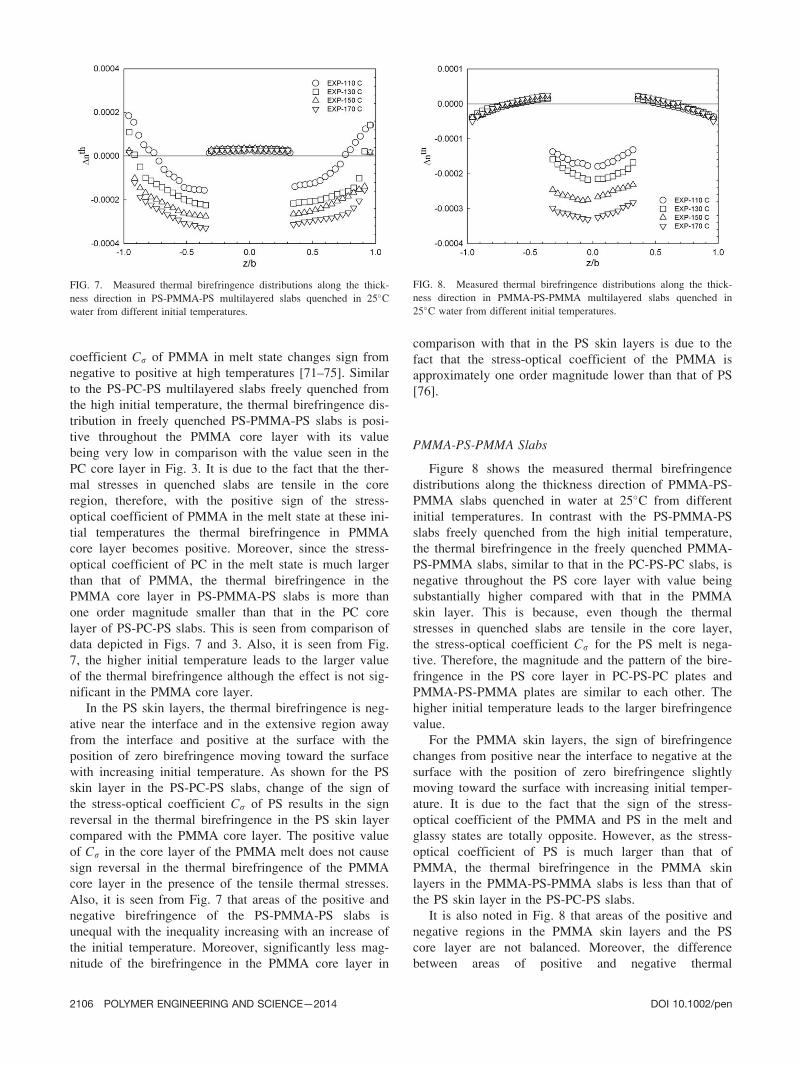
In this section, results obtained in quenched multilay-
ered slabs containing the PS core layer sandwiched
between the two PC skin layers. Figure 6 shows the
measured and simulated residual thermal birefringence
distributions along the thickness direction of the PC-PS-
PC slabs quenched in water at 25�C from different initial
temperatures. It is seen that, in contrast with the PS-PC-
PS slabs freely quenched from the high initial tempera-
ture, the thermal birefringence throughout the PS core
layer of freely quenched PC-PS-PC slabs is negative at
any initial temperature. This is because the stresses in the
quenched sample are tensile in the core layer, as was
shown in Fig. 4, and the stress-optical coefficient Cr for
the PS melt is negative in the melt state. Clearly, the
higher initial temperature leads to the larger negative
birefringence values throughout the whole PS core layer.
In contrast, in the PC skin layers, the sign of birefrin-
gence changes from positive near the interface to negative
at the surface. It is due to the fact that the stress-optical
coefficient Cr of PC in the melt and glassy states is posi-
tive. With the thermal stresses in quenched slabs being
compressive in the surface region and tensile in the core
region of the PC skin layers this leads to change of the
birefringence sign. The position of zero birefringence
changes with the initial temperature in a peculiar way. At
high initial temperature, the position of zero birefringence
is close to the surface and moves toward the interface as
the initial temperature decreases. The higher initial tem-
perature results in higher absolute values of the thermal
birefringence at the surface and near the interface. As
seen from Fig. 6, the simulated thermal birefringence,
similar to the measured one, shows the same trend with
change of the initial temperature. However, the predicted
thermal birefringence is only in a qualitative agreement
with the experimental data, especially for PC skin layers
at the low initial temperatures being close to its Tg.
In the following sections only experimental data for
the birefringence in the multilayered slabs containing
PMMA in the skin or core are presented. The simulations
were not carried out due to the absence of complete infor-
mation concerning the time- and temperature-dependence
of the stress- or strain-optical coefficients of PMMA in
the fluid, rubbery and glassy states.
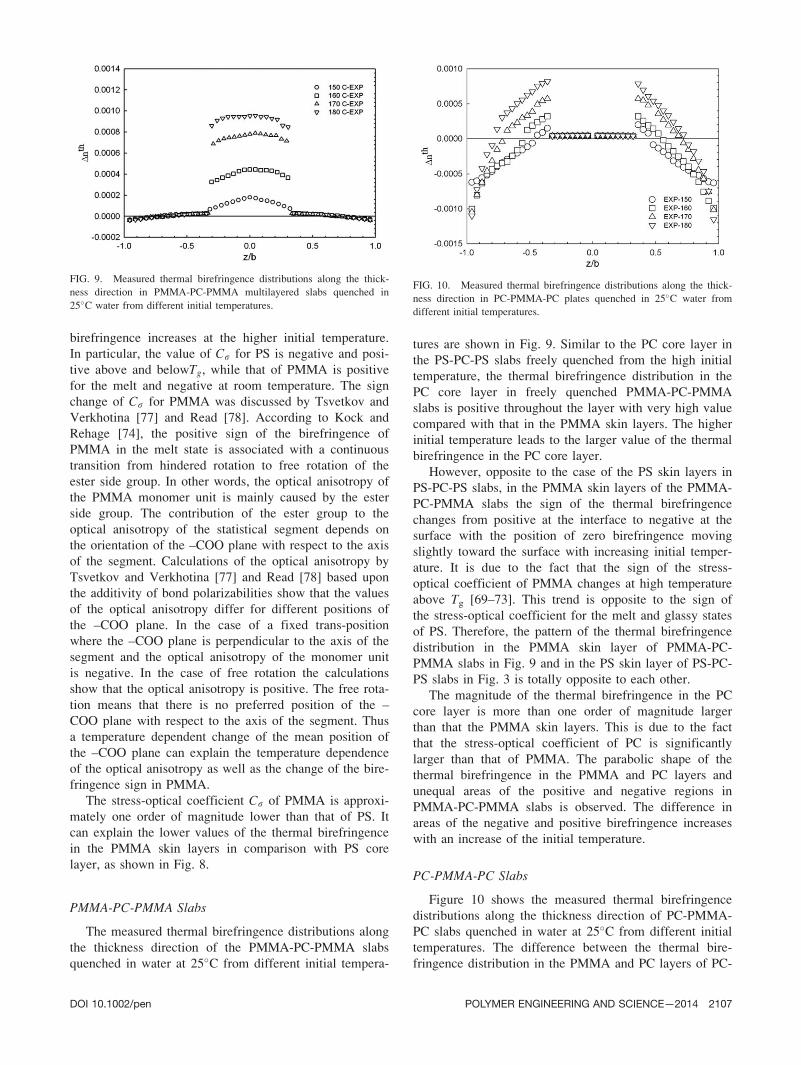
PS-PMMA-PS Slabs
The measured thermal birefringence distributions along
the thickness direction of the PS-PMMA-PS slabs
quenched in water at 25�C from different initial tempera-
tures are shown in Fig. 7. The difference between bire-
fringence distribution for the PMMA and PS layers can
be attributed in large part to their corresponding stress-
optical coefficientCr. As mentioned earlier, the value of
Cr above Tg for PS is time- and temperature-dependent
being negative and positive below Tg. The stress-optical
FIG. 5. Evolution of the actual (a) and effective (b) temperature distri-
butions along the thickness direction during quenching of the PS-PC-PS
multilayered slab. Quenching conditions: Ti 5 170�C, T15 25�C.
FIG. 6. Predicted and measured thermal birefringence distributions
along the thickness direction in PC-PS-PC multilayered slabs quenched
in 25�C water from different initial temperatures.
DOI 10.1002/pen POLYMER ENGINEERING AND SCIENCE—2014 2105
coefficient Cr of PMMA in melt state changes sign from
negative to positive at high temperatures [71–75]. Similar
to the PS-PC-PS multilayered slabs freely quenched from
the high initial temperature, the thermal birefringence dis-
tribution in freely quenched PS-PMMA-PS slabs is posi-
tive throughout the PMMA core layer with its value
being very low in comparison with the value seen in the
PC core layer in Fig. 3. It is due to the fact that the ther-
mal stresses in quenched slabs are tensile in the core
region, therefore, with the positive sign of the stress-
optical coefficient of PMMA in the melt state at these ini-
tial temperatures the thermal birefringence in PMMA
core layer becomes positive. Moreover, since the stress-
optical coefficient of PC in the melt state is much larger
than that of PMMA, the thermal birefringence in the
PMMA core layer in PS-PMMA-PS slabs is more than
one order magnitude smaller than that in the PC core
layer of PS-PC-PS slabs. This is seen from comparison of
data depicted in Figs. 7 and 3. Also, it is seen from Fig.
7, the higher initial temperature leads to the larger value
of the thermal birefringence although the effect is not sig-
nificant in the PMMA core layer.
In the PS skin layers, the thermal birefringence is neg-
ative near the interface and in the extensive region away
from the interface and positive at the surface with the
position of zero birefringence moving toward the surface
with increasing initial temperature. As shown for the PS
skin layer in the PS-PC-PS slabs, change of the sign of
the stress-optical coefficient Cr of PS results in the sign
reversal in the thermal birefringence in the PS skin layer
compared with the PMMA core layer. The positive value
of Cr in the core layer of the PMMA melt does not cause
sign reversal in the thermal birefringence of the PMMA
core layer in the presence of the tensile thermal stresses.
Also, it is seen from Fig. 7 that areas of the positive and
negative birefringence of the PS-PMMA-PS slabs is
unequal with the inequality increasing with an increase of
the initial temperature. Moreover, significantly less mag-
nitude of the birefringence in the PMMA core layer in
comparison with that in the PS skin layers is due to the
fact that the stress-optical coefficient of the PMMA is
approximately one order magnitude lower than that of PS
[76].
PMMA-PS-PMMA Slabs
Figure 8 shows the measured thermal birefringence
distributions along the thickness direction of PMMA-PS-
PMMA slabs quenched in water at 25�C from different
initial temperatures. In contrast with the PS-PMMA-PS
slabs freely quenched from the high initial temperature,
the thermal birefringence in the freely quenched PMMA-
PS-PMMA slabs, similar to that in the PC-PS-PC slabs, is
negative throughout the PS core layer with value being
substantially higher compared with that in the PMMA
skin layer. This is because, even though the thermal
stresses in quenched slabs are tensile in the core layer,
the stress-optical coefficient Cr for the PS melt is nega-
tive. Therefore, the magnitude and the pattern of the bire-
fringence in the PS core layer in PC-PS-PC plates and
PMMA-PS-PMMA plates are similar to each other. The
higher initial temperature leads to the larger birefringence
value.
For the PMMA skin layers, the sign of birefringence
changes from positive near the interface to negative at the
surface with the position of zero birefringence slightly
moving toward the surface with increasing initial temper-
ature. It is due to the fact that the sign of the stress-
optical coefficient of the PMMA and PS in the melt and
glassy states are totally opposite. However, as the stress-
optical coefficient of PS is much larger than that of
PMMA, the thermal birefringence in the PMMA skin
layers in the PMMA-PS-PMMA slabs is less than that of
the PS skin layer in the PS-PC-PS slabs.
It is also noted in Fig. 8 that areas of the positive and
negative regions in the PMMA skin layers and the PS
core layer are not balanced. Moreover, the difference
between areas of positive and negative thermal
FIG. 7. Measured thermal birefringence distributions along the thick-
ness direction in PS-PMMA-PS multilayered slabs quenched in 25�Cwater from different initial temperatures.
FIG. 8. Measured thermal birefringence distributions along the thick-
ness direction in PMMA-PS-PMMA multilayered slabs quenched in
25�C water from different initial temperatures.
2106 POLYMER ENGINEERING AND SCIENCE—2014 DOI 10.1002/pen
birefringence increases at the higher initial temperature.
In particular, the value of Cr for PS is negative and posi-
tive above and belowTg, while that of PMMA is positive
for the melt and negative at room temperature. The sign
change of Cr for PMMA was discussed by Tsvetkov and
Verkhotina [77] and Read [78]. According to Kock and
Rehage [74], the positive sign of the birefringence of
PMMA in the melt state is associated with a continuous
transition from hindered rotation to free rotation of the
ester side group. In other words, the optical anisotropy of
the PMMA monomer unit is mainly caused by the ester
side group. The contribution of the ester group to the
optical anisotropy of the statistical segment depends on
the orientation of the –COO plane with respect to the axis
of the segment. Calculations of the optical anisotropy by
Tsvetkov and Verkhotina [77] and Read [78] based upon
the additivity of bond polarizabilities show that the values
of the optical anisotropy differ for different positions of
the –COO plane. In the case of a fixed trans-position
where the –COO plane is perpendicular to the axis of the
segment and the optical anisotropy of the monomer unit
is negative. In the case of free rotation the calculations
show that the optical anisotropy is positive. The free rota-
tion means that there is no preferred position of the –
COO plane with respect to the axis of the segment. Thus
a temperature dependent change of the mean position of
the –COO plane can explain the temperature dependence
of the optical anisotropy as well as the change of the bire-
fringence sign in PMMA.
The stress-optical coefficient Cr of PMMA is approxi-
mately one order of magnitude lower than that of PS. It
can explain the lower values of the thermal birefringence
in the PMMA skin layers in comparison with PS core
layer, as shown in Fig. 8.
PMMA-PC-PMMA Slabs
The measured thermal birefringence distributions along
the thickness direction of the PMMA-PC-PMMA slabs
quenched in water at 25�C from different initial tempera-
tures are shown in Fig. 9. Similar to the PC core layer in
the PS-PC-PS slabs freely quenched from the high initial
temperature, the thermal birefringence distribution in the
PC core layer in freely quenched PMMA-PC-PMMA
slabs is positive throughout the layer with very high value
compared with that in the PMMA skin layers. The higher
initial temperature leads to the larger value of the thermal
birefringence in the PC core layer.
However, opposite to the case of the PS skin layers in
PS-PC-PS slabs, in the PMMA skin layers of the PMMA-
PC-PMMA slabs the sign of the thermal birefringence
changes from positive at the interface to negative at the
surface with the position of zero birefringence moving
slightly toward the surface with increasing initial temper-
ature. It is due to the fact that the sign of the stress-
optical coefficient of PMMA changes at high temperature
above Tg [69–73]. This trend is opposite to the sign of
the stress-optical coefficient for the melt and glassy states
of PS. Therefore, the pattern of the thermal birefringence
distribution in the PMMA skin layer of PMMA-PC-
PMMA slabs in Fig. 9 and in the PS skin layer of PS-PC-
PS slabs in Fig. 3 is totally opposite to each other.
The magnitude of the thermal birefringence in the PC
core layer is more than one order of magnitude larger
than that the PMMA skin layers. This is due to the fact
that the stress-optical coefficient of PC is significantly
larger than that of PMMA. The parabolic shape of the
thermal birefringence in the PMMA and PC layers and
unequal areas of the positive and negative regions in
PMMA-PC-PMMA slabs is observed. The difference in
areas of the negative and positive birefringence increases
with an increase of the initial temperature.
PC-PMMA-PC Slabs
Figure 10 shows the measured thermal birefringence
distributions along the thickness direction of PC-PMMA-
PC slabs quenched in water at 25�C from different initial
temperatures. The difference between the thermal bire-
fringence distribution in the PMMA and PC layers of PC-
FIG. 9. Measured thermal birefringence distributions along the thick-
ness direction in PMMA-PC-PMMA multilayered slabs quenched in
25�C water from different initial temperatures.
FIG. 10. Measured thermal birefringence distributions along the thick-
ness direction in PC-PMMA-PC plates quenched in 25�C water from
different initial temperatures.
DOI 10.1002/pen POLYMER ENGINEERING AND SCIENCE—2014 2107
PMMA-PC slabs can be attributed in large part to the dif-
ference in behavior of the stress-optical coefficient Cr of
these polymers as discussed earlier. The thermal birefrin-
gence in the PMMA core layer in PC-PMMA-PC slabs is
positive with its value being very low compared to that in
PC skin layers. It is due to the fact that the tensile ther-
mal stresses in the PMMA core layer of quenched slabs
with the positive sign of the stress-optical coefficient of
the PMMA melt would lead to the positive thermal bire-
fringence due to the positive sign of the stress-optical
coefficient of PMMA. However, as the stress-optical
coefficient of PMMA is much smaller than that of PC,
the thermal birefringence in the PMMA core layer in PC-
PMMA-PC slabs is more than one order of magnitude
smaller than that in the PC skin layers. Again the higher
initial temperature leads to larger value of the thermal
birefringence but the effect is not significant.
The sign of the thermal birefringence in the PC skin
layers changes from positive near the interface to negative
at the surface with the position of zero birefringence mov-
ing toward the surface with increasing initial temperature.
It is due to the fact that the stress-optical coefficient Cr of
PC in the melt and glassy states is positive with the thermal
stresses in quenched slabs being compressive in the surface
region and tensile in the core region in the PC skin layers.
The higher initial temperature results in the higher thermal
birefringence in the surface and near the interface.
CONCLUSIONS
Free quenching experiments from the different initial
temperatures into the water of 25�C were carried out on
PS-PC-PS, PC-PS-PC, PMMA-PC-PMMA, PC-PMMA-
PC, PS-PMMA-PS, and PMMA-PS-PMMA multilayered
slabs and the thermal birefringence distributions along the
thickness direction were measured.
In the PC core layer of the quenched PS-PC-PS and
PMMA-PC-PMMA slabs, the thermal birefringence is
positive with its value increasing with the initial tempera-
ture. In the PS skin layers, the thermal birefringence is
negative throughout the PS layers at an initial temperature
of 150�C, but at higher initial temperatures the positive
thermal birefringence at the surface and negative at the
interface and in the extensive skin layers was observed.
In the PS core layer of the quenched PC-PS-PC and
PMMA-PS-PMMA slabs, the thermal birefringence is
negative with its value increasing with the initial tempera-
ture. In the PC skin layers of the PC-PS-PC slabs and in
the PMMA skin layers of the PMMA-PS-PMMA slabs,
the thermal birefringence is negative near the surface and
positive near the interface. The position of zero thermal
birefringence is shifted toward the surface with an
increase of the initial temperature.
In the PMMA core layer of the quenched PS-PMMA-
PS and PC-PMMA-PC slabs, the thermal birefringence is
positive with its values increasing with the initial temper-
ature. In the PS skin layers of the PS-PMMA-PS slabs,
the thermal birefringence is positive at the surface and
negative near the interface. In the PC skin layers of the
PC-PMMA-PC slabs the thermal birefringence is negative
at the surface and positive near the interface. With an
increase of the initial temperature the position of zero
birefringence moves close to the surface.
Methodology was presented to calculate the thermal
birefringence in the multilayered PS-PC-PS and PC-PS-
PC slabs based on the mechanical and optical relaxation
functions of PS and PC measured earlier. The simulated
and measured birefringence distributions in the thickness
direction of the multilayered PS-PC-PS and PC-PS-PC
slabs freely quenched from different initial temperatures
into water at 25�C were found to be in a fair agreement.
However, for the multilayered slabs containing PMMA
the simulations were not carried out since complete infor-
mation on the time and temperature dependence of the
strain- or stress-optical coefficient of PMMA in the
glassy, rubbery and melt states is currently not available.
APPENDIX A: NUMERICAL SOLUTION FOR THETEMPERATURE HISTORY DURING QUENCHING
Discretizing the derivatives in Eq. 1 using forward differ-
ence for the first order derivative and the central differ-
ence for the second order derivative yields:
@T
@t5
1
DtTn11
i 2Tni
(A1)
aj@2T
@z25
1
2
aj
Dz2fðTn11
i21 22Tn11i 1Tn11
i11 Þ
1ðTni2122Tn
i 1Tni11Þg
(A2)
where subscript i and n stands for the finite difference
node along the thickness direction and time step,
respectively.
Substituting Eqs. A1 and A2 into Eq. 1 and grouping
terms yields the following equations for the interior nodes
along the thickness direction.
2~rj
2Tn11
i21 1 11~rj
Tn11
i 2~rj
2Tn11
i11 5~rj
2Tn
i21
1 12~rj
Tn
i 1~rj
2Tn
i11
(A3)
where
~rj5ajDt
Dz2(A4)
This equation is valid for i 5 2 to i max 21 with i 51
and i max corresponding to the boundaries.
For the skin layer,
~rj5~rs5asDt
Dz2(A5)
Where
2108 POLYMER ENGINEERING AND SCIENCE—2014 DOI 10.1002/pen
as5ks
qsCp;s(A6)
For the interface between the skin and core layers,
~rj5~r int 5aint Dt
Dz2(A7)
Where
aint 5ac1as
2(A8)
For the core layer,
~rj5~rc5acDt
Dz2(A9)
Where
ac5kc
qcCp;c(A10)
To derive the first row of the band matrix, the boundary
condition at the center is given by the symmetry condi-
tion providing the absence of gradient at the center of the
slab. Discretization of the derivative in Eq. 1b using the
central differences of the first order yields:
@T
@z
����z50
51
2
1
2DzTn11
i11 2Tn11i21
1 Tn
i112Tni21
�50 (A11)
Tni215Tn
i111 Tn11i11 2Tn11
i21
(A12)
Substituting Eq. A11 into Eq. A3, at i50 corresponding to
the centerline, z50, the following equation is obtained for
the first row of the band matrix:
11~rcð ÞTn110 2~rcTn11
1 5 12~rcð ÞTn01~rcTn
1 (A13)
For the last row of the band matrix, the convective
boundary condition at the surface of the slab is given in
Eq. 1c. For the discretization, the equation is rewritten as:
kj@T
@z5hT12hTi at z56b for t > 0 (A14)
Discretization of the derivative and Ti in Eq. A13 yields
kj@T
@z5kj
1
4DzTn11
i11 2Tn11i21
1 Tn
i112Tni21
�� �(A15)
2hTi52h
2Tn11
i 1Tni
(A16)
After substituting Eqs. A15 and A16 into Eq. A14 and
rearranging it for Tn11i11 the following equation is obtained:
Tn11i11 5Tn11
i21 2 Tni112Tn
i21
1CT12
C
2Tn11
i 2Tni
(A17)
Where
C54Dzh
ks(A18)
Substituting Eq. A17 into Eq. A3 yields the following
equation for the last row of the band matrix for the con-
vective boundary condition:
2~rsTn11i max 211 11~rs1
~rsC
4
� �Tn11
imax 5~rsTnimax 21
1 12~rs2~rsC
4
� �Tn
imax 1~rsC
2T1
(A19)
Equations A3, A13, and A19 are a set of algebraic equa-
tions that can be arrayed in a band matrix of the form
Ai Bi Ci½ � Ti
� �5 RHSi½ �, where Ti
� �is the solution of
the temperature at the present time. The discretized equa-
tions were solved by means of a tridiagonal solver using
the equilibrium method [64].
APPENDIX B: NUMERICAL SOLUTION FOR THESTRAIN AND STRESS HISTORIES
Using the piecewise linear approximation [64], the inte-
grals in Eqs. 28 and 29 were expanded as:
ðn
0
A n2n0ð Þ @B n0ð Þ@n0
dn05Xj
k51
B nk
2B nk21
nk2nk21
ðnk
nk21
A nj2n0
dn0(B1)
in which B nj
at n5nj(j denotes the current time step) is
unknown and B nk
at k < j (k denotes a previous time
step) was solved in the previous time step. Then the strain
ezz z; tð Þ is obtained by Eq. 29 and the strain exx tð Þ is
derived by substituting Eq. 28 into Eq. 22. After calcula-
tions of exx tð Þ and ezz z; tð Þ for the skin and core regions,
the exx tð Þ and ezz z; tð Þ at the interface is obtained by aver-
aging the value of exx tð Þ and ezz z; tð Þ for a node of the
skin and a node of the core near the interface of skin and
core regions. Then the stress history rxx z; tð Þ can be
solved by Eq. 28 using exx tð Þ and ezz z; tð Þ calculated ear-
lier. The final discretized formulation becomes:
Gi;k5
ðni;k
ni;k21
G ni;k2n0
dn0" #�
ni;k2ni;k21
(B2)
Ai;j52Gi;j ei;j21zz 2ei;j21
xx
1Xj21
k52
Gi;k ei;kzz 2ei;k21
zz 2ei;kxx 1ei;k21
xx
� �(B3)
Bi;j52 2Kl24Gi;j=3
= Kl14Gi;j=3
(B4)
ki;j523ei;j
T Kl if T > Tg
23ei;jT Kg2 Kg2Kl
ei
xx12eizz23ei
T
� �jT5Tg
if T > Tg
8<:
(B5)
DOI 10.1002/pen POLYMER ENGINEERING AND SCIENCE—2014 2109
Ci;j5 4Ai;j=32ki;j
= Kl14Gi;j=3
(B6)
ei;jzz52
ðb
2b
2 Ai;j2Gi;jCi;j
dz
� �� ðb
2b
2 Gi;j 11Bi;j � �
dz
� �(B7)
ei;jxx52Bi;jei;j
zz1Ci;j (B8)
ri;jxx52Gi;j 11Bi;j
ei;j
zz12 Ai;j2Gi;jCi;j
(B9)
where the superscript i denotes discretization in z direc-
tion and k or j denotes discretization in time. Values of
eixx12ei
zz23eiT
� �jT5Tg
were evaluated at the discretized
position i when the temperature at that position becomes
equal to Tg
REFERENCES
1. W.F. Zoetelief, G.W.M. Peters, and H.E.H. Meijer. Int.Polym. Process., 12, 216 (1997).
2. A.I. Isayev and C.A. Hieber, Rheol. Acta, 19, 168 (1980).
3. A.I. Isayev, Polym. Eng. Sci., 23, 271 (1983).
4. A.I. Isayev, G.D. Shyu, and C.T. Li, J. Polym. Sci. Part B:Polym. Phys., 44, 622 (2006).
5. A.I. Isayev and D.L. Crouthamel, Polym. Plast. Technol.Eng., 22, 177 (1984).
6. A.I. Isayev, Thermal Stress in Concise Encyclopedia ofPolymer Science and Engineering, J.I. Kroschowitz, Ed.,
John Willey & Sons, New York, p. 1187 (1989).
7. K.K. Kabanemi and M.J. Crochet, Int. Polym. Process., 7,
60 (1992).
8. S. Timoshenko, Theory of Elasticity, Chapter 3, McGraw-
Hill, New York (1934).
9. J. Bicerano, “Glass transition” in Encyclopedia of PolymerScience and Engineering, 4th ed., H.F. Mark, Ed., John Wil-
ley & Sons, New York, v. 2, 655 (2001).
10. G. D. Shyu and A. I. Isayev, Ann. Tech. Conf. Soc. Plast.Eng., 39, 1673 (1993).
11. M.L. Williams and R.J. Arenz, J. Exp. Mech., 4, 249
(1964).
12. G.D. Shyu and A.I. Isayev, Ann. Tech. Conf. Soc. Plast.Eng., 38, 549 (1992).
13. R. Wimberger-Friedl and J.G. De Bruin, Rheol. Acta, 30,
419 (1991).
14. V. Brcic, Photoviscoelasticity in Theory and Practice,
Springer-Verlag, New York (1972).
15. K. Osaki and T. Inoue, Nihon Reoroji Gakkaishi, 19, 130
(1991).
16. T. Inoue, H. Okamoto, and K. Osaki, Macromolecules, 24,
5670 (1991).
17. T. Inoue, H. Hayashihara, H. Okamoto, and K. Osaki, J.Polym. Sci. Part B: Polym. Phys., 30, 409 (1992).
18. H. Okamoto, E.J. Hwang, T. Inoue, and K. Osaki, NihonReoroji Gakkaishi, 21, 86 (1993).
19. B.E. Read, Polym. Eng. Sci., 23, 835 (1983).
20. G.D. Shyu, A.I. Isayev, and C.T. Li, J. Polym. Sci. Part B:Polym. Phys., 39, 2252 (2001).
21. A.I. Isayev, Ed. Injection and Compression Molding Funda-mentals, Marcel Dekker, New York (1987).
22. W.C. Bushko and V.K. Stokes, Polym. Eng. Sci., 35, 365
(1995).
23. W.C. Bushko and V.K. Stokes, Polym. Eng. Sci., 35, 351
(1995).
24. X. Guo and A.I. Isayev, Ann. Tech. Conf. Soc. Plast. Eng.,45, 1813 (1999).
25. G.D. Shyu, A.I. Isayev and C. T. Li, J. Polym. Sci. Part B:Polym. Phys., 41, 1850 (2003).
26. G. Titomanlio, V. Drucato, and M. R. Kamal, Int. Polym.Process., 1, 55 (1987).
27. R. Wimberger-Friedl and J.G. De Bruin, Rheol. Acta, 30,
419 (1991).
28. R. Wimberger-Friedl and J.G. de Bruin, J. Polym. Sci. PartB: Polym. Phys., 31, 1041 (1993).
29. F. Boitout, J.F. Agassant, and M. Vincent, Int. Polym. Pro-cess., 10, 237 (1995).
30. W.C. Bushko and V.K. Stokes, Polym. Eng. Sci., 36, 322
(1996).
31. H. Ghoneim and C. A. Hieber, J. Thermal Stress, 19, 795
(1996).
32. X. Guo and A.I. Isayev, J. Appl. Polym. Sci., 75, 1404
(2000).
33. V.L. Indenbom, Zh. Sakharnoi Promyshlennosti, 24, 925
(1954).
34. G.M. Bartenev, Doklady Akademii Nauk SSSR, 60, 257
(1948).
35. G.M. Bartenev, Zh. Tekh. Fiz., 19, 1423 (1949).
36. L.W. Morland and E.H. Lee, Trans. Soc. Rheol., 4, 233
(1960).
37. R. Muki and E. Sternberg, J. Appl. Mech., 28, 193 (1961).
38. E.H. Lee, T.G. Rogers, and T.C. Woo, J. Am. Ceram. Soc.,48, 480 (1965).
39. E.H. Lee and T.G. Rogers, J. Appl. Mech., 32, 874 (1965).
40. O.S. Narayanaswamy and R. Gardon, J. Am. Ceram. Soc.,52, 554 (1969).
41. O.S. Narayanaswamy, J. Am. Ceram. Soc., 54, 491 (1971).
42. O.S. Narayanaswamy, J. Am. Ceram. Soc., 61, 146 (1978).
43. S.M. Ohlberg and T.C. Woo, Rheol. Acta, 12, 345 (1973).
44. S.M. Ohlberg and T.C. Woo, J Non-Cryst. Solids, 14, 280
(1974).
45. M.L. Williams, R.F. Landel and J.D. Ferry, J. Am. Chem.Soc., 77, 3701 (1955).
46. A.J. Kovacs, Fortschr. Hochpolymer Forsch., 3, 394 (1964).
47. G. Goldbach and G. Rehage, J. Polym. Sci. Polym. Symp.16, 2289 (1967).
48. N. Santhanam, Analysis of Residual Stresses and Post Mold-ing Deformation in Injection Molded Components, PhD
Thesis, Cornell University, Ithaca, NY (1992).
49. F. Schwarzl and A.J. Staverman, J. Appl. Phys., 23, 838
(1952).
50. G.D. Shyu, Birefringence and Residual Stresses in MoldedArticles of Amorphous Polymers, PhD thesis, University of
Akron, Akron (1993).
51. G.D. Shyu and A.I. Isayev, Ann. Tech. Conf. Soc. Plast.Eng., 41, 2911 (1995).
2110 POLYMER ENGINEERING AND SCIENCE—2014 DOI 10.1002/pen
52. H. Ghoneim and C.A. Heiber, Polym. Eng. Sci., 37, 219
(1997).
53. I. Min and K. Yoon, Korea-Australia Rheol. J., 24(1), 73
(2012).
54. F.P.T. Baaijens, Rheol. Acta, 30, 284 (1991).
55. A.A.M. Flaman, Polym. Eng. Sci., 33, 193 (1993).
56. R.D. Mindlin, J. Appl. Phys., 20, 206 (1949).
57. B.E. Read, Polymer, 3, 143 (1962).
58. B.E. Read, J. Polym. Sci., 5, 87 (1964).
59. B.E. Read, Polymer, 5, 1 (1964).
60. E.H. Dill, J. Polym. Sci., 5, 67 (1964).
61. K.C. Rusch, J. Macromol. Sci., Phys., 2, 179 (1968).
62. H. Leaderman, Elastic and Creep properties of Filamentous
Materials and Other High Polymers, The Textile Founda-
tion, Washington D. C. (1943).
63. G.B. Jackson and R.L. Ballman, SPE J., 16, 1147 (1960).
64. J.D. Hoffmann, Numerical Methods for Engineers and Sci-entists, McGraw-Hill, New York (1992).
65. Encyclopedia of Polymer Science and Technology, Inter-
science, New York (1989).
66. D.W. van Krevelen, Properties of Polymers, Elsevier,
Amsterdam (1976).
67. T.F. Rudd and E.F. Gurnee, J. Appl. Phys., 28, 1096 (1957).
68. J.F. Rudd and E.F. Gurnee, J. Polym. Sci., A1, 2857 (1963).
69. H.A. Stuart and H. Volkmann, Z. Phys., 80, 107 (1933).
70. M. Pick and R. Lovell, Strain-Birefringence Measurementsas Means for Investigating Viscoelastic Properties, Polymer,
20, 1448 (1979).
71. R.S. Stein, in Die Physik Der Hochpolymeren, H.A. Stuart,
Ed., Springer-Verlag, Berlin, p. 110 (1956).
72. H. Peukert, Kunststoffe, 41, 154 (1951).
73. W. Retting, Colloid Polym. Sci., 257, 689 (1979).
74. H.J. Kock and G. Rehage, Colloid Polym. Sci., 263, 708
(1985).
75. R. Wimberger-Friedl, Rheol. Acta, 30, 329 (1991).
76. J. Dugas, I. Pierrejean, J. Farenc, and J.P. Peichot, Appl.Optics, 33, 545 (1994).
77. V.N. Tsvetkov and L.N. Verkhotina, Soviet Phys. Tech.Phys., 3, 87 (1958).
78. B.E. Read, J. Polym. Sci. Polym. Symp., 16, 1887 (1967).
DOI 10.1002/pen POLYMER ENGINEERING AND SCIENCE—2014 2111