Embed Size (px)
DESCRIPTION
Artigo sobre formação de grafita chunky no nodular.
Citation preview
1. Introduction
Thermal analysis (TA) has been used since long for char-acterizing melt preparation of cast irons, most often forchecking composition before pouring but more and more asa means for providing information on the main phase trans-formations occurring upon cooling from the liquid state.Owing to the relationship between cooling curves charac-teristics and microstructure features, thermal analysis hasthus been developed for obtaining information regardinggraphite morphology1–6) as well as nucleation potential ofgraphite during solidification and inoculation efficiency.7–10)
It has been further extended for latent heat evaluation4,11–13)
and for improving process variables,7–8,14–18) e.g. with theaim at predicting final mechanical properties and hardnessvalues19,20) or for minimizing casting defects such as shrink-age tendency.6,21,22)
Thermal analysis, in particular carried out with standardthermal cups, has been successful in relating characteristicsof the solidification step as observed on cooling curves with microstructure changes caused by modification of thecomposition and of the nucleation potential of the melt.Less successful results have been achieved for predictinggraphite shape when the microstructure of post-inoculatedspheroidal, compacted and lamellar cast irons samples hasbeen compared to the characteristics of the coolingcurves.3–5,8,15)
This limitation of TA is quite unfortunate when dealingwith large melts prepared for thick-wall ductile iron cast-
ings. In these cases where cooling rate becomes extremelylow and where cooling curves are characterised by lengthyeutectic plateaus,23–26) the solidification microstructure maybe affected by magnesium and inoculation fading, markedintercellular segregation, as well as graphite degeneracy.Among the various forms of degenerate graphite observed,chunky graphite (hereafter denoted CHG) turns out to bethe most critical defect due to its negative influence on me-chanical properties.25,27) Graphite degeneracy in large sec-tion castings has been extensively studied since the 60’s andits formation or avoidance has been often related to thepresence of low-level elements.28–35) Limited amounts ofrare earths, lead and antimony added to the melt help avoid-ing CHG.31–33,36,37) Also, the use of chills has been found ef-ficient to suppress CHG formation,23,24,38,39) but this is lim-ited to thicknesses up to a few centimetres.
As done for the thermal analysis performed on standardcups, description of the cooling curves recorded during so-lidification of heavy sections, either or not with chills, hasbeen given since long.23,24,26,34,40) Some work was also donerecently aimed at relating thermal analysis made on stan-dard cups to characteristics of degenerated graphite mi-crostructure in large castings,41) that seems unsuccessful inview of the spreading of the reported data. Because of thelack of success of TA to help understanding CHG forma-tion, various authors made laboratory studies where solidi-fication of limited quantities of metal was controlled so asto reproduce the cooling schedule of large castings withquenching at critical times during the eutectic reaction.42–45)
220© 2009 ISIJ
ISIJ International, Vol. 49 (2009), No. 2, pp. 220–228
Thermal Analysis of the Formation of Chunky Graphite duringSolidification of Heavy-section Spheroidal Graphite Iron Parts
Jon SERTUCHA,1) Ramón SUÁREZ,1) Iker ASENJO,1) Peio LARRAÑAGA,1) Jacques LACAZE,2)
Iñaki FERRER3) and Susana ARMENDARIZ3)
1) Engineering and Foundry Department, AZTERLAN, Aliendalde auzunea 6, E-48200 Durango (Bizkaia), Spain.2) Université de Toulouse, CIRIMAT, UMR 5085, 31077 Toulouse cedex 4, France.3) TS Fundiciones, S.A. Pol. Sansinenea Erreka, E-20749 Arroa-Zestoa (Gipuzkoa), Spain.
(Received on September 12, 2008; accepted on November 6, 2008 )
Analysis of cooling curves recorded at the centre of large blocks cast with near-eutectic spheroidalgraphite cast irons prone to give chunky graphite has been checked against microstructure observations. Ithas been observed that solidification proceeds totally at temperatures lower than the stable eutectic tem-perature and the following solidification sequence could be proposed: 1) nucleation of primary graphite inthe liquid; 2) initial eutectic reaction processing by growth of austenite-like dendrites encapsulating the pri-mary nodules; 3) bulk eutectic reaction related to nucleation and then growth of CHG cells and of secondarynodules, these latter giving spheroidal graphite eutectic cells. It was found that the maximum recalescenceduring the eutectic reaction first increases with the volume of the block affected by chunky graphite, andthen decreases when most of the material is affected. Interestingly enough, a relationship between the vol-ume of the blocks affected by CHG and the recalescence measured on TA cups has been observed.
KEY WORDS: heavy-section castings; spheroidal cast iron; graphite degeneracy; chunky graphite; thermalanalysis.
All these studies conclusively showed that solidificationproceeds first by the formation of nodular graphite andaustenite dendrites, the former being encapsulated withinthe latter. This is only in a second stage that cells of CHGappear that nucleate at the austenite/liquid interface.Thanks to these laboratory experiments, it appeared ofsome interest to challenge again the analysis of coolingcurves obtained during solidification of thick-wall castings.In the present work, the cooling curves recorded duringcastings of large blocks and standard TA cups are first de-scribed and compared. The possibility of correlating cool-ing curve characteristics with microstructure informationand CHG formation is then discussed. Lines for further in-vestigations are finally drawn from these results.
2. Experimental Details
The experimental study was performed on large cubicblocks cast in sand. All details about the casting methodol-ogy have been given in a previous work, including indica-tions on the metallic charges used and the treatments per-formed for pre-inoculation and spheroidization.46) In thiswork, emphasis was put on the effect of post-inoculation inthe mould on the extent of the area affected by CHG forma-tion. All the cast blocks were in fact equipped with a K-type thermocouple positioned at the geometrical centre forrecording the cooling curves during solidification. Whilethe previous work dealt with cubic blocks 180 and 300 mmin size, it appeared necessary in the present report to selectonly the larger blocks for clarity. These blocks have a ther-mal modulus (ratio of their volume to their outer area avail-able for heat-exchange) of 5 cm. In most experiments, cou-ples of blocks of similar modulus were cast at the sametime using post-inoculated and non post-inoculated melts.For differentiating the various blocks that were cast, theywill be denoted M5-Y-Z where:
• M5 relates to the thermal modulus of the cubes;• Y is the experiment number (1, 2, 3, …);• Z is either I or N to indicate post-inoculated (I) or non
post-inoculated (N) block.In order to determine the chemical composition of the
melt, a metal sample was taken just before pouring the ironinto the moulds that was afterwards analysed by combus-tion techniques using a Leco CS 244 equipment for deter-mining C and S contents, inductively coupled plasma andmass spectrometry (ICP-MS Agilent 7500ce) for Sb, Pband Ce, gravimetric procedures for Si and optical emission
spectrometry (OBLF QS750) for P, Cu, Cr, Ni, Mn and Mg.The chemical compositions are listed in Table 1, where isgiven also the expected accuracy for each element. Becauseall alloying elements other than silicon are at very lowlevel, the carbon equivalent of the alloys may be simplywritten as Ceq�WC�0.28�WSi, where Wi designates theweight percent content of element “i” in the alloy.47) Also,the corresponding stable eutectic temperature Teut may beevaluated as Teut�1154.0�4.244�WSi (°C).47) Values ofboth Ceq and Teut have been added in Table 1. With eutecticcomposition assumed at Ceq�4.34 wt%, it is seen that thecarbon equivalent Ceq varies from a slightly hypoeutectic to a slightly hypereutectic composition (4.25 to 4.38 wt%)while the stable eutectic temperature ranges from 1162.7 to1164.0°C. Note that the Ceq values should normally differfor inoculated and non-inoculated castings from the samemelt. For usual inoculation as the one carried out in thiswork, the related increase in silicon content amounts toabout 0.14 wt% Si, that corresponds to an 0.04 wt% in-crease in the carbon equivalent value.
After cooling, all blocks were cut along vertical axes andthe sections examined for determining the amount of CHGaccording to the methodology described previously46) inwhich it was characterized by the two quantities VV and AA.The fraction of the volume of the block affected by CHG,denoted VV, was evaluated by means of macrographic ob-servation. The surface fraction of CHG cells, AA, at the cen-tre of the blocks was measured on five different optical mi-crographs. On the same metallographic sections, the nodulecount at the centre of the blocks, Nblock, was evaluated onfive different optical micrographs obtained at an enlarge-ment of �100 in areas where the graphite was correctlyformed. For this evaluation, only particles with an arealarger than 20 mm2 were considered, this corresponding tonodules with diameter larger than 5 mm. Please note that thedata given previously46) have been slightly corrected in thepresent work.
At the time of pouring, two standard TA cups (inoculatedand non inoculated) were simultaneously filled and theircooling curves recorded using the Thermolan® system.22)
The additionnal inoculation was performed by adding in thecup a convenient amount of the same inoculant than the oneused for post-inoculation of the blocks. This addition wasmade by powdering a mass of inoculant such as to reach thesame inoculation level than for blocks. The cooling curveswere subsequently analysed for determining the characteris-tic solidification temperatures. Also, on one occasion, one
ISIJ International, Vol. 49 (2009), No. 2
221 © 2009 ISIJ
Table 1. Chemical composition of the alloys (wt%). Numbers between brackets in the first row give the accuracy for each element.
of the blocks was quenched at about one third of the ex-pected solidification time. In that case, the mould-blocksystem was moved into a holder containing water when thetemperature record reached the minimum during the eutec-tic reaction. After the mould was plunged into the watertank, part of the sand was removed so as to increase thechilling effect.
3. Results
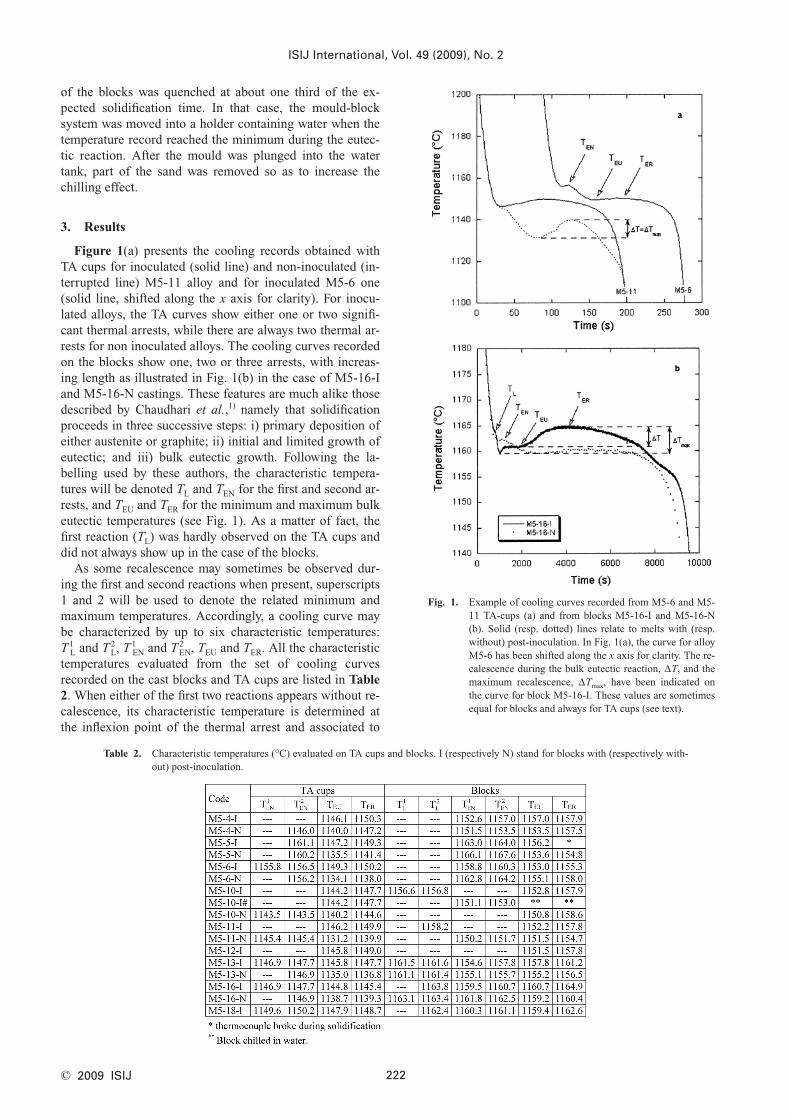
Figure 1(a) presents the cooling records obtained withTA cups for inoculated (solid line) and non-inoculated (in-terrupted line) M5-11 alloy and for inoculated M5-6 one(solid line, shifted along the x axis for clarity). For inocu-lated alloys, the TA curves show either one or two signifi-cant thermal arrests, while there are always two thermal ar-rests for non inoculated alloys. The cooling curves recordedon the blocks show one, two or three arrests, with increas-ing length as illustrated in Fig. 1(b) in the case of M5-16-Iand M5-16-N castings. These features are much alike thosedescribed by Chaudhari et al.,1) namely that solidificationproceeds in three successive steps: i) primary deposition ofeither austenite or graphite; ii) initial and limited growth ofeutectic; and iii) bulk eutectic growth. Following the la-belling used by these authors, the characteristic tempera-tures will be denoted TL and TEN for the first and second ar-rests, and TEU and TER for the minimum and maximum bulkeutectic temperatures (see Fig. 1). As a matter of fact, thefirst reaction (TL) was hardly observed on the TA cups anddid not always show up in the case of the blocks.
As some recalescence may sometimes be observed dur-ing the first and second reactions when present, superscripts1 and 2 will be used to denote the related minimum andmaximum temperatures. Accordingly, a cooling curve maybe characterized by up to six characteristic temperatures:T 1
L and T 2L, T 1
EN and T 2EN, TEU and TER. All the characteristic
temperatures evaluated from the set of cooling curvesrecorded on the cast blocks and TA cups are listed in Table2. When either of the first two reactions appears without re-calescence, its characteristic temperature is determined atthe inflexion point of the thermal arrest and associated to
ISIJ International, Vol. 49 (2009), No. 2
222© 2009 ISIJ
Table 2. Characteristic temperatures (°C) evaluated on TA cups and blocks. I (respectively N) stand for blocks with (respectively with-out) post-inoculation.
Fig. 1. Example of cooling curves recorded from M5-6 and M5-11 TA-cups (a) and from blocks M5-16-I and M5-16-N(b). Solid (resp. dotted) lines relate to melts with (resp.without) post-inoculation. In Fig. 1(a), the curve for alloyM5-6 has been shifted along the x axis for clarity. The re-calescence during the bulk eutectic reaction, DT, and themaximum recalescence, DTmax, have been indicated onthe curve for block M5-16-I. These values are sometimesequal for blocks and always for TA cups (see text).
T 2L or T 2
EN, while no value is given to T 1L or T 1
EN. When thefirst reaction was not observed, no TL value is reported. Fur-ther, the second and third reactions sometimes overlappedas for the inoculated block in Fig. 1(b), in which case theT 2
EN and TEU values are set equal and estimated at the inflex-ion point between the two thermal arrests. On some occa-sions these two thermal arrests merged in one single peakand only the TEU and TER temperatures are then given. Inone case, block M5-5-I, the thermocouple broke during so-lidification so that the maximum eutectic temperature couldnot be estimated.
For further analysis of the cooling records, recalescencevalues for the eutectic reaction were estimated from thecharacteristic temperatures listed in Table 2. In the case ofTA cup records, the recalescence DT is uniquely defined asDT�(TER�TEU). For records from the blocks, the maximumrecalescence DTmax�(TER�Tmin), where Tmin is the mini-mum temperature reached during solidification that may beeither T 1
EN or TEU, may differ from the recalescence associ-ated to the bulk eutectic reaction, DTEU�(TER�TEU). This isdue to the fact that the initial eutectic reaction may proceedat temperature either lower or higher than TEU. This is thecase of the curves in Fig. 1(b) and is again illustrated inFig. 6.
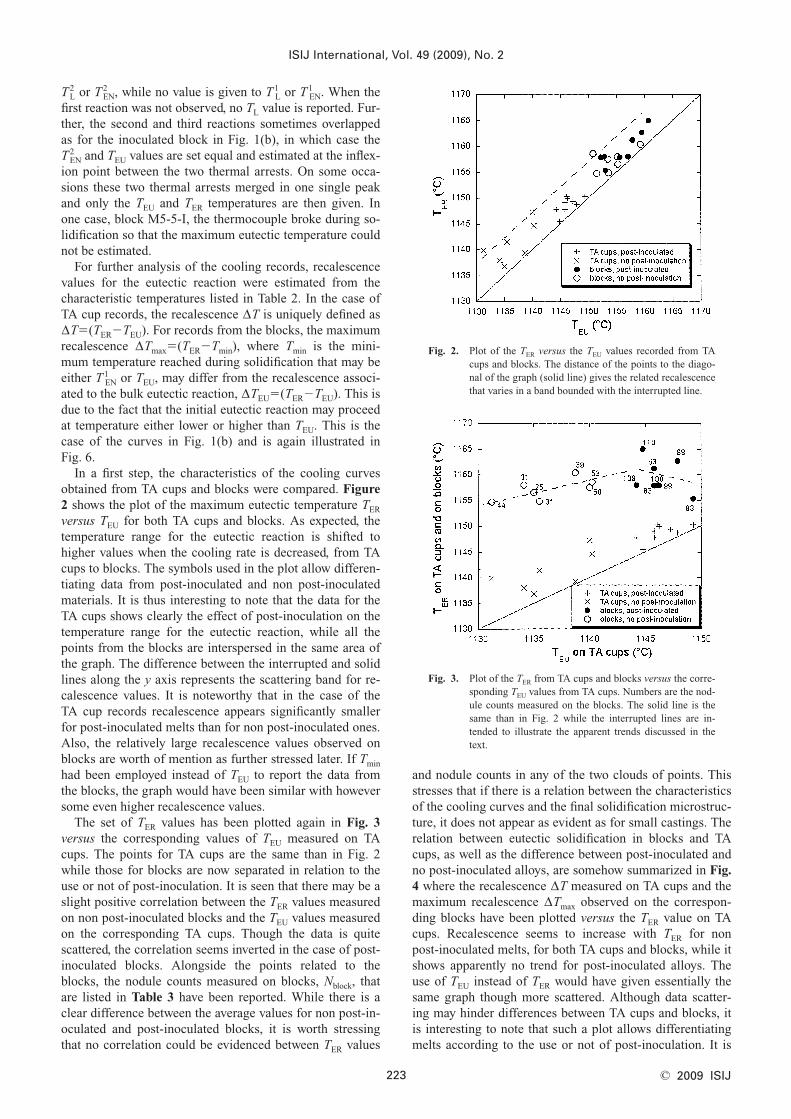
In a first step, the characteristics of the cooling curvesobtained from TA cups and blocks were compared. Figure2 shows the plot of the maximum eutectic temperature TER
versus TEU for both TA cups and blocks. As expected, thetemperature range for the eutectic reaction is shifted tohigher values when the cooling rate is decreased, from TAcups to blocks. The symbols used in the plot allow differen-tiating data from post-inoculated and non post-inoculatedmaterials. It is thus interesting to note that the data for theTA cups shows clearly the effect of post-inoculation on thetemperature range for the eutectic reaction, while all thepoints from the blocks are interspersed in the same area ofthe graph. The difference between the interrupted and solidlines along the y axis represents the scattering band for re-calescence values. It is noteworthy that in the case of theTA cup records recalescence appears significantly smallerfor post-inoculated melts than for non post-inoculated ones.Also, the relatively large recalescence values observed onblocks are worth of mention as further stressed later. If Tmin
had been employed instead of TEU to report the data fromthe blocks, the graph would have been similar with howeversome even higher recalescence values.
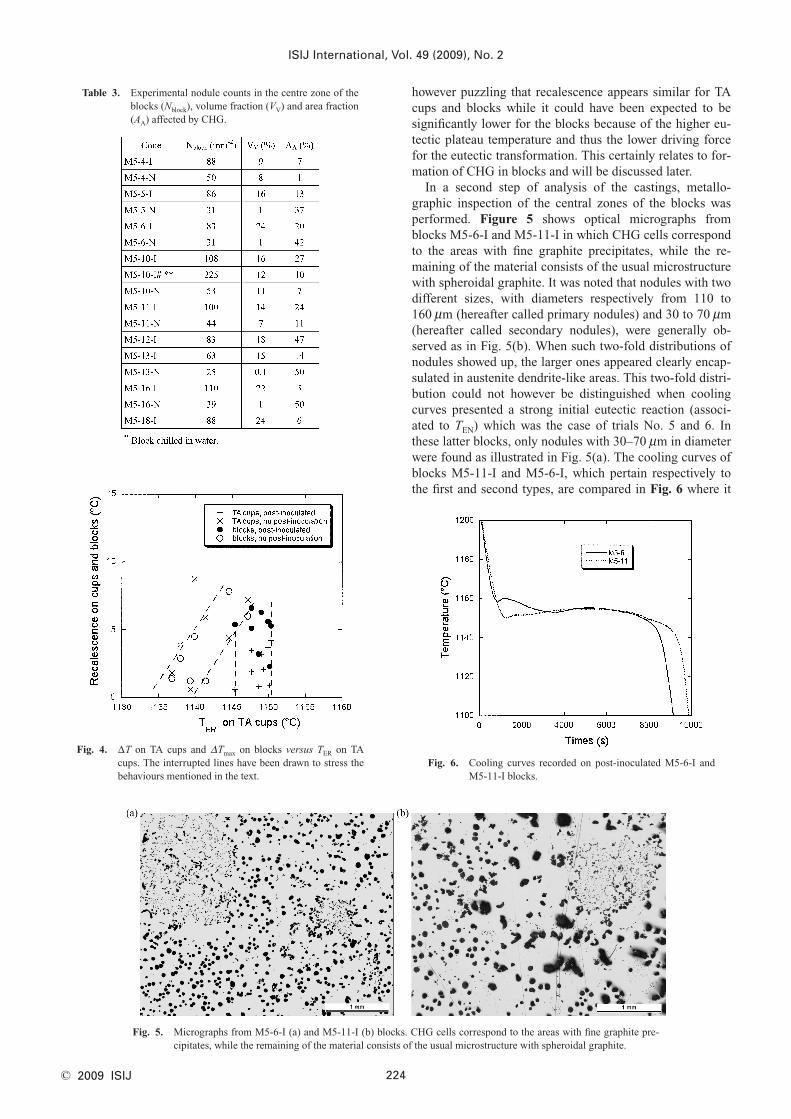
The set of TER values has been plotted again in Fig. 3versus the corresponding values of TEU measured on TAcups. The points for TA cups are the same than in Fig. 2while those for blocks are now separated in relation to theuse or not of post-inoculation. It is seen that there may be aslight positive correlation between the TER values measuredon non post-inoculated blocks and the TEU values measuredon the corresponding TA cups. Though the data is quitescattered, the correlation seems inverted in the case of post-inoculated blocks. Alongside the points related to theblocks, the nodule counts measured on blocks, Nblock, thatare listed in Table 3 have been reported. While there is aclear difference between the average values for non post-in-oculated and post-inoculated blocks, it is worth stressingthat no correlation could be evidenced between TER values
and nodule counts in any of the two clouds of points. Thisstresses that if there is a relation between the characteristicsof the cooling curves and the final solidification microstruc-ture, it does not appear as evident as for small castings. Therelation between eutectic solidification in blocks and TAcups, as well as the difference between post-inoculated andno post-inoculated alloys, are somehow summarized in Fig.4 where the recalescence DT measured on TA cups and themaximum recalescence DTmax observed on the correspon-ding blocks have been plotted versus the TER value on TAcups. Recalescence seems to increase with TER for nonpost-inoculated melts, for both TA cups and blocks, while itshows apparently no trend for post-inoculated alloys. Theuse of TEU instead of TER would have given essentially thesame graph though more scattered. Although data scatter-ing may hinder differences between TA cups and blocks, itis interesting to note that such a plot allows differentiatingmelts according to the use or not of post-inoculation. It is
ISIJ International, Vol. 49 (2009), No. 2
223 © 2009 ISIJ
Fig. 2. Plot of the TER versus the TEU values recorded from TAcups and blocks. The distance of the points to the diago-nal of the graph (solid line) gives the related recalescencethat varies in a band bounded with the interrupted line.
Fig. 3. Plot of the TER from TA cups and blocks versus the corre-sponding TEU values from TA cups. Numbers are the nod-ule counts measured on the blocks. The solid line is thesame than in Fig. 2 while the interrupted lines are in-tended to illustrate the apparent trends discussed in thetext.
however puzzling that recalescence appears similar for TAcups and blocks while it could have been expected to besignificantly lower for the blocks because of the higher eu-tectic plateau temperature and thus the lower driving forcefor the eutectic transformation. This certainly relates to for-mation of CHG in blocks and will be discussed later.
In a second step of analysis of the castings, metallo-graphic inspection of the central zones of the blocks wasperformed. Figure 5 shows optical micrographs fromblocks M5-6-I and M5-11-I in which CHG cells correspondto the areas with fine graphite precipitates, while the re-maining of the material consists of the usual microstructurewith spheroidal graphite. It was noted that nodules with twodifferent sizes, with diameters respectively from 110 to160 mm (hereafter called primary nodules) and 30 to 70 mm(hereafter called secondary nodules), were generally ob-served as in Fig. 5(b). When such two-fold distributions ofnodules showed up, the larger ones appeared clearly encap-sulated in austenite dendrite-like areas. This two-fold distri-bution could not however be distinguished when coolingcurves presented a strong initial eutectic reaction (associ-ated to TEN) which was the case of trials No. 5 and 6. Inthese latter blocks, only nodules with 30–70 mm in diameterwere found as illustrated in Fig. 5(a). The cooling curves ofblocks M5-11-I and M5-6-I, which pertain respectively tothe first and second types, are compared in Fig. 6 where it
ISIJ International, Vol. 49 (2009), No. 2
224© 2009 ISIJ
Table 3. Experimental nodule counts in the centre zone of theblocks (Nblock), volume fraction (VV) and area fraction(AA) affected by CHG.
Fig. 6. Cooling curves recorded on post-inoculated M5-6-I andM5-11-I blocks.
Fig. 4. DT on TA cups and DTmax on blocks versus TER on TAcups. The interrupted lines have been drawn to stress thebehaviours mentioned in the text.
Fig. 5. Micrographs from M5-6-I (a) and M5-11-I (b) blocks. CHG cells correspond to the areas with fine graphite pre-cipitates, while the remaining of the material consists of the usual microstructure with spheroidal graphite.
is seen that the TEN arrest proceeds at higher temperatureand seems longer for the M5-6-I block than for the M5-10-Ione.
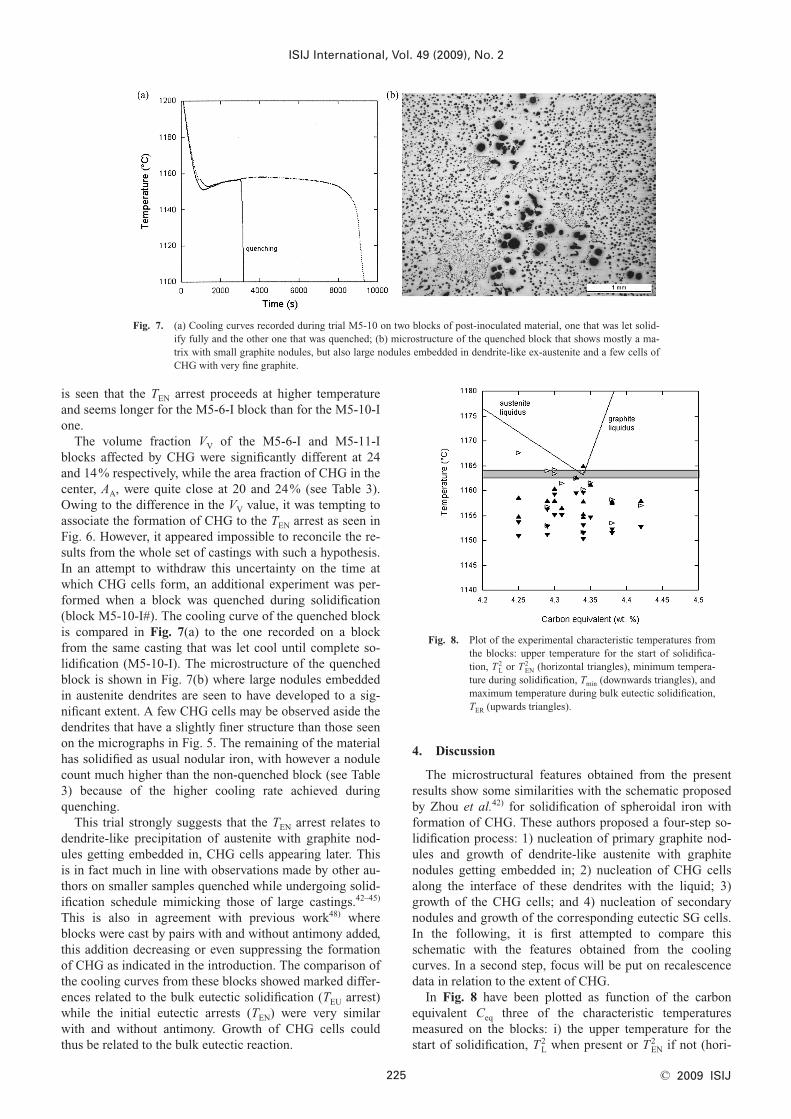
The volume fraction VV of the M5-6-I and M5-11-Iblocks affected by CHG were significantly different at 24and 14% respectively, while the area fraction of CHG in thecenter, AA, were quite close at 20 and 24% (see Table 3).Owing to the difference in the VV value, it was tempting toassociate the formation of CHG to the TEN arrest as seen inFig. 6. However, it appeared impossible to reconcile the re-sults from the whole set of castings with such a hypothesis.In an attempt to withdraw this uncertainty on the time atwhich CHG cells form, an additional experiment was per-formed when a block was quenched during solidification(block M5-10-I#). The cooling curve of the quenched blockis compared in Fig. 7(a) to the one recorded on a blockfrom the same casting that was let cool until complete so-lidification (M5-10-I). The microstructure of the quenchedblock is shown in Fig. 7(b) where large nodules embeddedin austenite dendrites are seen to have developed to a sig-nificant extent. A few CHG cells may be observed aside thedendrites that have a slightly finer structure than those seenon the micrographs in Fig. 5. The remaining of the materialhas solidified as usual nodular iron, with however a nodulecount much higher than the non-quenched block (see Table3) because of the higher cooling rate achieved duringquenching.
This trial strongly suggests that the TEN arrest relates todendrite-like precipitation of austenite with graphite nod-ules getting embedded in, CHG cells appearing later. Thisis in fact much in line with observations made by other au-thors on smaller samples quenched while undergoing solid-ification schedule mimicking those of large castings.42–45)
This is also in agreement with previous work48) whereblocks were cast by pairs with and without antimony added,this addition decreasing or even suppressing the formationof CHG as indicated in the introduction. The comparison ofthe cooling curves from these blocks showed marked differ-ences related to the bulk eutectic solidification (TEU arrest)while the initial eutectic arrests (TEN) were very similarwith and without antimony. Growth of CHG cells couldthus be related to the bulk eutectic reaction.
4. Discussion
The microstructural features obtained from the presentresults show some similarities with the schematic proposedby Zhou et al.42) for solidification of spheroidal iron withformation of CHG. These authors proposed a four-step so-lidification process: 1) nucleation of primary graphite nod-ules and growth of dendrite-like austenite with graphitenodules getting embedded in; 2) nucleation of CHG cellsalong the interface of these dendrites with the liquid; 3)growth of the CHG cells; and 4) nucleation of secondarynodules and growth of the corresponding eutectic SG cells.In the following, it is first attempted to compare thisschematic with the features obtained from the coolingcurves. In a second step, focus will be put on recalescencedata in relation to the extent of CHG.
In Fig. 8 have been plotted as function of the carbonequivalent Ceq three of the characteristic temperaturesmeasured on the blocks: i) the upper temperature for thestart of solidification, T 2
L when present or T 2EN if not (hori-
ISIJ International, Vol. 49 (2009), No. 2
225 © 2009 ISIJ
Fig. 7. (a) Cooling curves recorded during trial M5-10 on two blocks of post-inoculated material, one that was let solid-ify fully and the other one that was quenched; (b) microstructure of the quenched block that shows mostly a ma-trix with small graphite nodules, but also large nodules embedded in dendrite-like ex-austenite and a few cells ofCHG with very fine graphite.
Fig. 8. Plot of the experimental characteristic temperatures fromthe blocks: upper temperature for the start of solidifica-tion, T 2
L or T 2EN (horizontal triangles), minimum tempera-
ture during solidification, Tmin (downwards triangles), andmaximum temperature during bulk eutectic solidification,TER (upwards triangles).
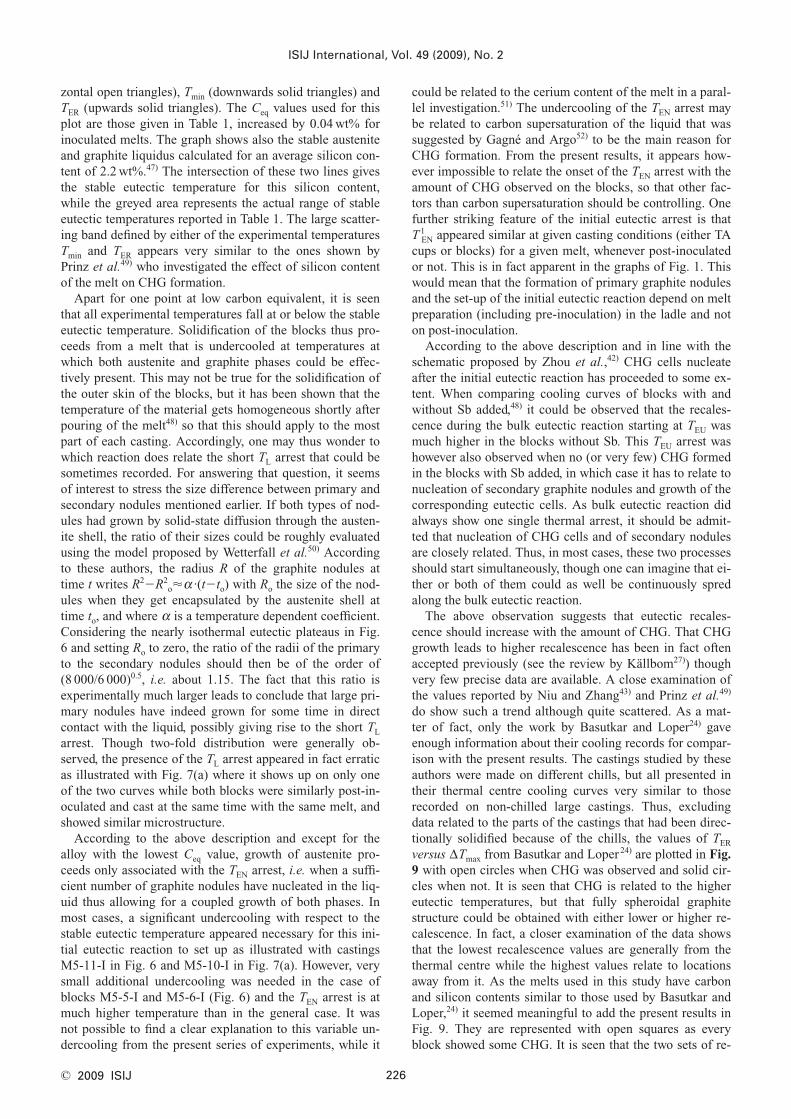
zontal open triangles), Tmin (downwards solid triangles) andTER (upwards solid triangles). The Ceq values used for thisplot are those given in Table 1, increased by 0.04 wt% forinoculated melts. The graph shows also the stable austeniteand graphite liquidus calculated for an average silicon con-tent of 2.2 wt%.47) The intersection of these two lines givesthe stable eutectic temperature for this silicon content,while the greyed area represents the actual range of stableeutectic temperatures reported in Table 1. The large scatter-ing band defined by either of the experimental temperaturesTmin and TER appears very similar to the ones shown byPrinz et al.49) who investigated the effect of silicon contentof the melt on CHG formation.
Apart for one point at low carbon equivalent, it is seenthat all experimental temperatures fall at or below the stableeutectic temperature. Solidification of the blocks thus pro-ceeds from a melt that is undercooled at temperatures atwhich both austenite and graphite phases could be effec-tively present. This may not be true for the solidification ofthe outer skin of the blocks, but it has been shown that thetemperature of the material gets homogeneous shortly afterpouring of the melt48) so that this should apply to the mostpart of each casting. Accordingly, one may thus wonder towhich reaction does relate the short TL arrest that could besometimes recorded. For answering that question, it seemsof interest to stress the size difference between primary andsecondary nodules mentioned earlier. If both types of nod-ules had grown by solid-state diffusion through the austen-ite shell, the ratio of their sizes could be roughly evaluatedusing the model proposed by Wetterfall et al.50) Accordingto these authors, the radius R of the graphite nodules attime t writes R2�R2
o�a ·(t�to) with Ro the size of the nod-ules when they get encapsulated by the austenite shell attime to, and where a is a temperature dependent coefficient.Considering the nearly isothermal eutectic plateaus in Fig.6 and setting Ro to zero, the ratio of the radii of the primaryto the secondary nodules should then be of the order of(8 000/6 000)0.5, i.e. about 1.15. The fact that this ratio isexperimentally much larger leads to conclude that large pri-mary nodules have indeed grown for some time in directcontact with the liquid, possibly giving rise to the short TL
arrest. Though two-fold distribution were generally ob-served, the presence of the TL arrest appeared in fact erraticas illustrated with Fig. 7(a) where it shows up on only oneof the two curves while both blocks were similarly post-in-oculated and cast at the same time with the same melt, andshowed similar microstructure.
According to the above description and except for thealloy with the lowest Ceq value, growth of austenite pro-ceeds only associated with the TEN arrest, i.e. when a suffi-cient number of graphite nodules have nucleated in the liq-uid thus allowing for a coupled growth of both phases. Inmost cases, a significant undercooling with respect to thestable eutectic temperature appeared necessary for this ini-tial eutectic reaction to set up as illustrated with castingsM5-11-I in Fig. 6 and M5-10-I in Fig. 7(a). However, verysmall additional undercooling was needed in the case ofblocks M5-5-I and M5-6-I (Fig. 6) and the TEN arrest is atmuch higher temperature than in the general case. It wasnot possible to find a clear explanation to this variable un-dercooling from the present series of experiments, while it
could be related to the cerium content of the melt in a paral-lel investigation.51) The undercooling of the TEN arrest maybe related to carbon supersaturation of the liquid that wassuggested by Gagné and Argo52) to be the main reason forCHG formation. From the present results, it appears how-ever impossible to relate the onset of the TEN arrest with theamount of CHG observed on the blocks, so that other fac-tors than carbon supersaturation should be controlling. Onefurther striking feature of the initial eutectic arrest is thatT 1
EN appeared similar at given casting conditions (either TAcups or blocks) for a given melt, whenever post-inoculatedor not. This is in fact apparent in the graphs of Fig. 1. Thiswould mean that the formation of primary graphite nodulesand the set-up of the initial eutectic reaction depend on meltpreparation (including pre-inoculation) in the ladle and noton post-inoculation.
According to the above description and in line with theschematic proposed by Zhou et al.,42) CHG cells nucleateafter the initial eutectic reaction has proceeded to some ex-tent. When comparing cooling curves of blocks with andwithout Sb added,48) it could be observed that the recales-cence during the bulk eutectic reaction starting at TEU wasmuch higher in the blocks without Sb. This TEU arrest washowever also observed when no (or very few) CHG formedin the blocks with Sb added, in which case it has to relate tonucleation of secondary graphite nodules and growth of thecorresponding eutectic cells. As bulk eutectic reaction didalways show one single thermal arrest, it should be admit-ted that nucleation of CHG cells and of secondary nodulesare closely related. Thus, in most cases, these two processesshould start simultaneously, though one can imagine that ei-ther or both of them could as well be continuously spredalong the bulk eutectic reaction.
The above observation suggests that eutectic recales-cence should increase with the amount of CHG. That CHGgrowth leads to higher recalescence has been in fact oftenaccepted previously (see the review by Källbom27)) thoughvery few precise data are available. A close examination ofthe values reported by Niu and Zhang43) and Prinz et al.49)
do show such a trend although quite scattered. As a mat-ter of fact, only the work by Basutkar and Loper24) gaveenough information about their cooling records for compar-ison with the present results. The castings studied by theseauthors were made on different chills, but all presented intheir thermal centre cooling curves very similar to thoserecorded on non-chilled large castings. Thus, excludingdata related to the parts of the castings that had been direc-tionally solidified because of the chills, the values of TER
versus DTmax from Basutkar and Loper24) are plotted in Fig.9 with open circles when CHG was observed and solid cir-cles when not. It is seen that CHG is related to the highereutectic temperatures, but that fully spheroidal graphitestructure could be obtained with either lower or higher re-calescence. In fact, a closer examination of the data showsthat the lowest recalescence values are generally from thethermal centre while the highest values relate to locationsaway from it. As the melts used in this study have carbonand silicon contents similar to those used by Basutkar andLoper,24) it seemed meaningful to add the present results inFig. 9. They are represented with open squares as everyblock showed some CHG. It is seen that the two sets of re-
ISIJ International, Vol. 49 (2009), No. 2
226© 2009 ISIJ
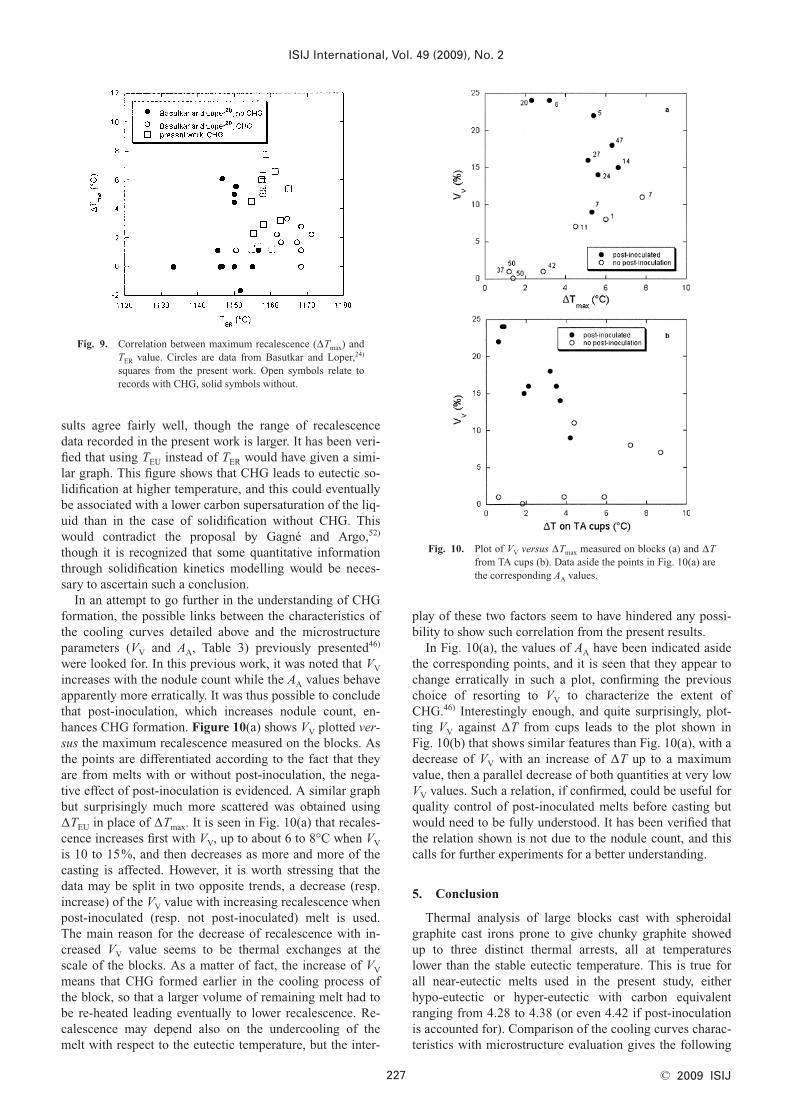
sults agree fairly well, though the range of recalescencedata recorded in the present work is larger. It has been veri-fied that using TEU instead of TER would have given a simi-lar graph. This figure shows that CHG leads to eutectic so-lidification at higher temperature, and this could eventuallybe associated with a lower carbon supersaturation of the liq-uid than in the case of solidification without CHG. Thiswould contradict the proposal by Gagné and Argo,52)
though it is recognized that some quantitative informationthrough solidification kinetics modelling would be neces-sary to ascertain such a conclusion.
In an attempt to go further in the understanding of CHGformation, the possible links between the characteristics ofthe cooling curves detailed above and the microstructureparameters (VV and AA, Table 3) previously presented46)
were looked for. In this previous work, it was noted that VV
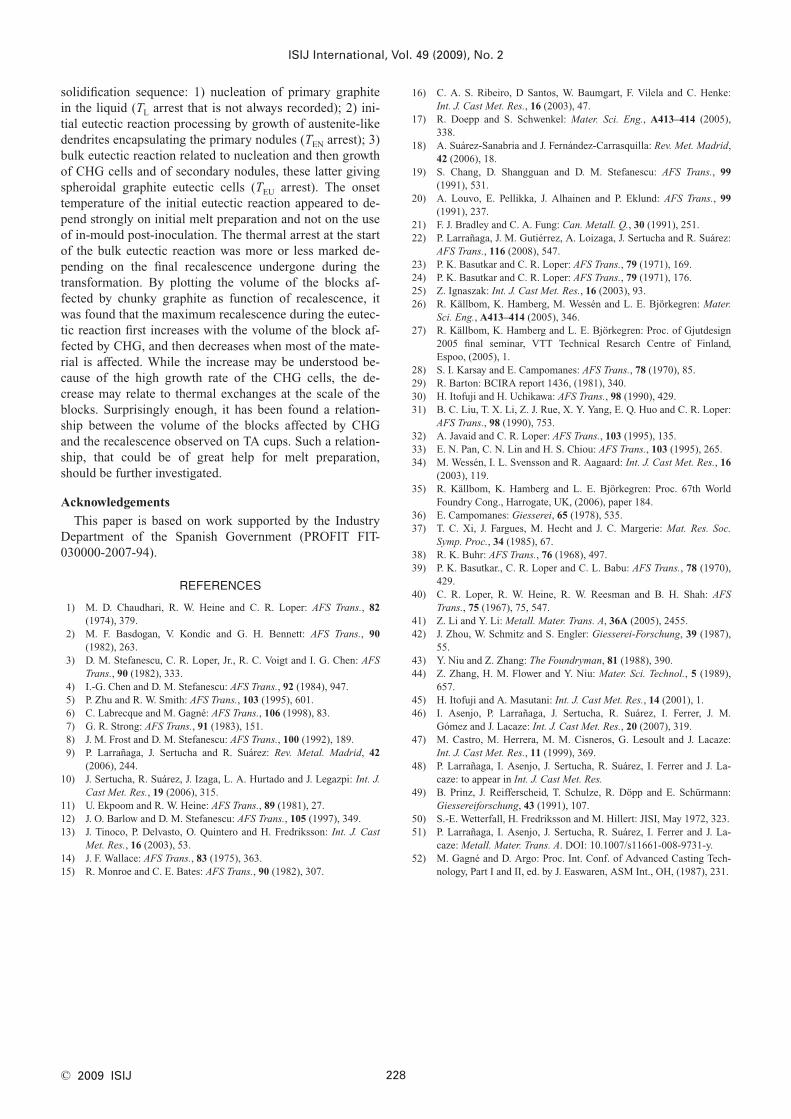
increases with the nodule count while the AA values behaveapparently more erratically. It was thus possible to concludethat post-inoculation, which increases nodule count, en-hances CHG formation. Figure 10(a) shows VV plotted ver-sus the maximum recalescence measured on the blocks. Asthe points are differentiated according to the fact that theyare from melts with or without post-inoculation, the nega-tive effect of post-inoculation is evidenced. A similar graphbut surprisingly much more scattered was obtained usingDTEU in place of DTmax. It is seen in Fig. 10(a) that recales-cence increases first with VV, up to about 6 to 8°C when VV
is 10 to 15%, and then decreases as more and more of thecasting is affected. However, it is worth stressing that thedata may be split in two opposite trends, a decrease (resp.increase) of the VV value with increasing recalescence whenpost-inoculated (resp. not post-inoculated) melt is used.The main reason for the decrease of recalescence with in-creased VV value seems to be thermal exchanges at thescale of the blocks. As a matter of fact, the increase of VV
means that CHG formed earlier in the cooling process ofthe block, so that a larger volume of remaining melt had tobe re-heated leading eventually to lower recalescence. Re-calescence may depend also on the undercooling of themelt with respect to the eutectic temperature, but the inter-
play of these two factors seem to have hindered any possi-bility to show such correlation from the present results.
In Fig. 10(a), the values of AA have been indicated asidethe corresponding points, and it is seen that they appear tochange erratically in such a plot, confirming the previouschoice of resorting to VV to characterize the extent ofCHG.46) Interestingly enough, and quite surprisingly, plot-ting VV against DT from cups leads to the plot shown inFig. 10(b) that shows similar features than Fig. 10(a), with adecrease of VV with an increase of DT up to a maximumvalue, then a parallel decrease of both quantities at very lowVV values. Such a relation, if confirmed, could be useful forquality control of post-inoculated melts before casting butwould need to be fully understood. It has been verified thatthe relation shown is not due to the nodule count, and thiscalls for further experiments for a better understanding.
5. Conclusion
Thermal analysis of large blocks cast with spheroidalgraphite cast irons prone to give chunky graphite showedup to three distinct thermal arrests, all at temperatureslower than the stable eutectic temperature. This is true forall near-eutectic melts used in the present study, eitherhypo-eutectic or hyper-eutectic with carbon equivalentranging from 4.28 to 4.38 (or even 4.42 if post-inoculationis accounted for). Comparison of the cooling curves charac-teristics with microstructure evaluation gives the following
ISIJ International, Vol. 49 (2009), No. 2
227 © 2009 ISIJ
Fig. 9. Correlation between maximum recalescence (DTmax) andTER value. Circles are data from Basutkar and Loper,24)
squares from the present work. Open symbols relate torecords with CHG, solid symbols without.
Fig. 10. Plot of VV versus DTmax measured on blocks (a) and DTfrom TA cups (b). Data aside the points in Fig. 10(a) arethe corresponding AA values.
solidification sequence: 1) nucleation of primary graphitein the liquid (TL arrest that is not always recorded); 2) ini-tial eutectic reaction processing by growth of austenite-likedendrites encapsulating the primary nodules (TEN arrest); 3)bulk eutectic reaction related to nucleation and then growthof CHG cells and of secondary nodules, these latter givingspheroidal graphite eutectic cells (TEU arrest). The onsettemperature of the initial eutectic reaction appeared to de-pend strongly on initial melt preparation and not on the useof in-mould post-inoculation. The thermal arrest at the startof the bulk eutectic reaction was more or less marked de-pending on the final recalescence undergone during thetransformation. By plotting the volume of the blocks af-fected by chunky graphite as function of recalescence, itwas found that the maximum recalescence during the eutec-tic reaction first increases with the volume of the block af-fected by CHG, and then decreases when most of the mate-rial is affected. While the increase may be understood be-cause of the high growth rate of the CHG cells, the de-crease may relate to thermal exchanges at the scale of theblocks. Surprisingly enough, it has been found a relation-ship between the volume of the blocks affected by CHGand the recalescence observed on TA cups. Such a relation-ship, that could be of great help for melt preparation,should be further investigated.
Acknowledgements
This paper is based on work supported by the IndustryDepartment of the Spanish Government (PROFIT FIT-030000-2007-94).
REFERENCES
1) M. D. Chaudhari, R. W. Heine and C. R. Loper: AFS Trans., 82(1974), 379.
2) M. F. Basdogan, V. Kondic and G. H. Bennett: AFS Trans., 90(1982), 263.
3) D. M. Stefanescu, C. R. Loper, Jr., R. C. Voigt and I. G. Chen: AFSTrans., 90 (1982), 333.
4) I.-G. Chen and D. M. Stefanescu: AFS Trans., 92 (1984), 947.5) P. Zhu and R. W. Smith: AFS Trans., 103 (1995), 601.6) C. Labrecque and M. Gagné: AFS Trans., 106 (1998), 83.7) G. R. Strong: AFS Trans., 91 (1983), 151.8) J. M. Frost and D. M. Stefanescu: AFS Trans., 100 (1992), 189.9) P. Larrañaga, J. Sertucha and R. Suárez: Rev. Metal. Madrid, 42
(2006), 244.10) J. Sertucha, R. Suárez, J. Izaga, L. A. Hurtado and J. Legazpi: Int. J.
Cast Met. Res., 19 (2006), 315.11) U. Ekpoom and R. W. Heine: AFS Trans., 89 (1981), 27.12) J. O. Barlow and D. M. Stefanescu: AFS Trans., 105 (1997), 349.13) J. Tinoco, P. Delvasto, O. Quintero and H. Fredriksson: Int. J. Cast
Met. Res., 16 (2003), 53.14) J. F. Wallace: AFS Trans., 83 (1975), 363.15) R. Monroe and C. E. Bates: AFS Trans., 90 (1982), 307.
16) C. A. S. Ribeiro, D Santos, W. Baumgart, F. Vilela and C. Henke:Int. J. Cast Met. Res., 16 (2003), 47.
17) R. Doepp and S. Schwenkel: Mater. Sci. Eng., A413–414 (2005),338.
18) A. Suárez-Sanabria and J. Fernández-Carrasquilla: Rev. Met. Madrid,42 (2006), 18.
19) S. Chang, D. Shangguan and D. M. Stefanescu: AFS Trans., 99(1991), 531.
20) A. Louvo, E. Pellikka, J. Alhainen and P. Eklund: AFS Trans., 99(1991), 237.
21) F. J. Bradley and C. A. Fung: Can. Metall. Q., 30 (1991), 251.22) P. Larrañaga, J. M. Gutiérrez, A. Loizaga, J. Sertucha and R. Suárez:
AFS Trans., 116 (2008), 547.23) P. K. Basutkar and C. R. Loper: AFS Trans., 79 (1971), 169.24) P. K. Basutkar and C. R. Loper: AFS Trans., 79 (1971), 176.25) Z. Ignaszak: Int. J. Cast Met. Res., 16 (2003), 93.26) R. Källbom, K. Hamberg, M. Wessén and L. E. Björkegren: Mater.
Sci. Eng., A413–414 (2005), 346.27) R. Källbom, K. Hamberg and L. E. Björkegren: Proc. of Gjutdesign
2005 final seminar, VTT Technical Resarch Centre of Finland,Espoo, (2005), 1.
28) S. I. Karsay and E. Campomanes: AFS Trans., 78 (1970), 85.29) R. Barton: BCIRA report 1436, (1981), 340.30) H. Itofuji and H. Uchikawa: AFS Trans., 98 (1990), 429.31) B. C. Liu, T. X. Li, Z. J. Rue, X. Y. Yang, E. Q. Huo and C. R. Loper:
AFS Trans., 98 (1990), 753.32) A. Javaid and C. R. Loper: AFS Trans., 103 (1995), 135.33) E. N. Pan, C. N. Lin and H. S. Chiou: AFS Trans., 103 (1995), 265.34) M. Wessén, I. L. Svensson and R. Aagaard: Int. J. Cast Met. Res., 16
(2003), 119.35) R. Källbom, K. Hamberg and L. E. Björkegren: Proc. 67th World
Foundry Cong., Harrogate, UK, (2006), paper 184.36) E. Campomanes: Giesserei, 65 (1978), 535.37) T. C. Xi, J. Fargues, M. Hecht and J. C. Margerie: Mat. Res. Soc.
Symp. Proc., 34 (1985), 67.38) R. K. Buhr: AFS Trans., 76 (1968), 497.39) P. K. Basutkar., C. R. Loper and C. L. Babu: AFS Trans., 78 (1970),
429.40) C. R. Loper, R. W. Heine, R. W. Reesman and B. H. Shah: AFS
Trans., 75 (1967), 75, 547.41) Z. Li and Y. Li: Metall. Mater. Trans. A, 36A (2005), 2455.42) J. Zhou, W. Schmitz and S. Engler: Giesserei-Forschung, 39 (1987),
55.43) Y. Niu and Z. Zhang: The Foundryman, 81 (1988), 390.44) Z. Zhang, H. M. Flower and Y. Niu: Mater. Sci. Technol., 5 (1989),
657.45) H. Itofuji and A. Masutani: Int. J. Cast Met. Res., 14 (2001), 1.46) I. Asenjo, P. Larrañaga, J. Sertucha, R. Suárez, I. Ferrer, J. M.
Gómez and J. Lacaze: Int. J. Cast Met. Res., 20 (2007), 319.47) M. Castro, M. Herrera, M. M. Cisneros, G. Lesoult and J. Lacaze:
Int. J. Cast Met. Res., 11 (1999), 369.48) P. Larrañaga, I. Asenjo, J. Sertucha, R. Suárez, I. Ferrer and J. La-
caze: to appear in Int. J. Cast Met. Res.49) B. Prinz, J. Reifferscheid, T. Schulze, R. Döpp and E. Schürmann:
Giessereiforschung, 43 (1991), 107.50) S.-E. Wetterfall, H. Fredriksson and M. Hillert: JISI, May 1972, 323.51) P. Larrañaga, I. Asenjo, J. Sertucha, R. Suárez, I. Ferrer and J. La-
caze: Metall. Mater. Trans. A. DOI: 10.1007/s11661-008-9731-y. 52) M. Gagné and D. Argo: Proc. Int. Conf. of Advanced Casting Tech-
nology, Part I and II, ed. by J. Easwaren, ASM Int., OH, (1987), 231.
ISIJ International, Vol. 49 (2009), No. 2
228© 2009 ISIJ