Embed Size (px)
Citation preview
THERMAL ANALYSIS OF SOME SCCL COALS
A THESIS SUBMITTED IN PARTIAL FULFILLMENT OF THE REQUIREMENTS FOR THE
DEGREE OF
BACHELOR OF TECHNOLOGY
IN
MINING ENGINEERING
BY
M.BHARATH KUMAR
10605025
DEPARTMENT OF MINING ENGINEERING
NATIONAL INSTITUTE OF TECHNOLOGY
ROURKELA - 769008
2010

THERMAL ANALYSIS OF SOME SCCL COALS
A THESIS SUBMITTED IN PARTIAL FULFILLMENT OF THE REQUIREMENTS FOR THE
DEGREE OF
BACHELOR OF TECHNOLOGY
IN
MINING ENGINEERING
BY
M.BHARATH KUMAR
10605025
Under the guidance of
PROF. D.S. NIMAJE
DEPARTMENT OF MINING ENGINEERING
NATIONAL INSTITUTE OF TECHNOLOGY
ROURKELA - 769008
2010

National Institute of Technology
Rourkela
CERTIFICATE
This is to certify that the thesis entitled “THERMAL ANALYSIS OF SOME
SCCL COAL” submitted by Sri M.Bharath Kumar in partial fulfillment of the
requirements for the award of Bachelor of Technology degree in Mining
Engineering at National Institute of Technology, Rourkela is an authentic work
carried out by him under my supervision and guidance.
To the best of my knowledge, the matter embodied in the thesis has not been
submitted to any other University/Institute for the award of any Degree or
Diploma.
Prof. D.S. Nimaje
Dept. of Mining Engineering
National Institute of Technology
Rourkela – 769008
(i)

ACKNOWLEDGEMENT
I wish to express my profound gratitude and indebtedness to Prof. D.S. Nimaje,
Department of Mining Engineering, NIT, Rourkela for introducing the present
topic and for their inspiring guidance, constructive criticism and valuable
suggestion throughout the project work.
I am also thankful to Mr. B. K. Bhoi, Mr B. N. Naik, and Mr. B. Pradhan and
other staffs in Department of Mining Engineering for their assistance and help in
carrying out different experiments in the laboratories.
Last but not least, my sincere thanks to all our friends who have patiently extended
all sorts of help for accomplishing this undertaking.
M.BHARATH KUMAR
10605025
Dept. of Mining Engineering
National Institute of Technology
Rourkela – 769008
(ii)

CONTENTS
Page No.
CERTIFICATE i
ACKNOWLDEGEMENT ii
ABSTRACT vi
LIST OF TABLES vii
LIST OF FIGURES viii
LIST OF PHOTOGRAPHS ix
CHAPTER – 01
INTRODUCTION
1.1 Background
1
1.2 Objective and scope of work 1
CHAPTER – 02
LITERATURE REVIEW
2.1 Coal mine fires
3
2.2 History of coal mine fires 4
2.3 Spontaneous heating 6

2.4 Mechanism of spontaneous heating 7
2.5 Theories of spontaneous heating 8
2.6 Factors affecting spontaneous heating 10
2.7 National and International status 12
CHAPTER – 03
EXPERIMENTAL TECHNIQUES
3.1 Sample collection and preparation
21
3.2 Intrinsic properties of coal
23
3.3 Susceptibility indices of coal 27
3.3.1 Flammability temperature 27
3.3.2 Wet oxidation potential 28
3.3.3 Crossing point temperature 29
3.3.4 Olpinski index 30
3.3.5 Critical air blast 30
3.3.6 Differential thermal analysis 31
3.3.7 Differential scanning calorimetry 33

CHAPTER – 04
RESULTS
34
CHAPTER – 05
ANALYSIS
38
CHAPTER – 06
DISCUSSION AND CONCLUSIONS
49
REFERENCES
50
APPENDIX 1
54
APPENDIX 2
58
ABSTRACT
The auto oxidation of coal ultimately leads to spontaneous combustion which is the major root
cause for the disastrous of coal mine. It has been a major problem in the leading producing coal
countries like Australia, India and China. Therefore the assessment for this combustion is very
much necessary. It depends upon different characteristics and properties of coal. Once if the
combustion of coal has been occurred, it is very difficult to control which also disturbs the
environment of the surroundings of the mine. The spontaneous heating susceptibility of different
coals varies over a wide range and it is important to assess their degree of proneness for taking
preventive measures against the occurrence of fires to avoid loss of lives and property,
sterilization of coal reserves and environmental pollution and raise concerns about safety and
economic aspects of mining etc
The B.Tech.dissertation deals with the thermal analysis of various parameters of coal with the
spontaneous heating tendency of coal. Nine insitu coal samples for the project were collected
from Singareni Collieries Company Ltd. (SCCL), both from opencast as well as underground
workings. The project deals with determination of spontaneous heating susceptibility of coal
samples by experimental techniques. The intrinsic properties as well as susceptibility indices of
the coal samples were determined by following experimental techniques:
Proximate analysis
Calorific value
Flammability temperature
Wet oxidation potential
Differential thermal analysis (DTA-TG)
It was interpreted from the analysis that DTA – TG is the best method to assess the spontaneous
heating tendency of coal in comparison to Flammability temperature and Wet oxidation
potential. It was also observed that the Transition temperature obtained from the DTA – TG plot
cannot be taken as a sole parameter to assess the spontaneous heating of coal, rather Stage IIB

and Stage II slopes give a better idea. It was also found that Flammability temperature method
does not provide an accurate measure of spontaneous heating tendency of coal.
It was found that Wet oxidation potential gave a fair enough approximation for spontaneous
heating tendency for high moisture coals. However it can be taken as a parameter for
spontaneous heating susceptibility as it requires less time for conduction than DTA –TG.
(vi)

LIST OF TABLES
Table No.
Title Page No.
2.1
2.2
2.3
3.1
Set elements of mining conditions
Experimental parameters used by different researchers in DTA
studies on spontaneous heating of coal
Experimental parameters used by different researchers in TG studies
on spontaneous heating of coal
Grading of non coking coal
12
19
20
27
4.1 List of coal samples 35
4.2 Results of Proximate analysis 35
4.3 Results of Calorific value 36
4.4 Results of Wet oxidation potential 36
4.5 Results of Flammability temperature
36
4.6 Results of DTA – TG 37
(vii)

LIST OF FIGURES
Fig No. Title Page No.
2.1
2.2
Mechanism of spontaneous heating
Stages of coal oxidation
7
8
3.1 Channel Sampling 22
3.2 CPT curve 29
3.3 Different stages of DTA 32
3.4 Determination of onset temperature of DSC 33
5.1 Moisture Vs Calorific value
38
5.2 Moisture Vs Wet oxidation potential
38
5.3 Moisture Vs Flammability temperature
39
5.4 Moisture Vs Transition temperature
39
5.5 Moisture Vs II slope of DTA
39
5.6 Ash Vs Calorific value
40
5.7 Ash Vs Wet oxidation potential
40
5.8 Ash Vs Flammability temperature
40
5.9 Ash Vs Transition temperature
41
5.10 Ash Vs II slope of DTA
41
5.11 Ash Vs IIA slope of DTA
41
5.12 Ash Vs IIB slope of DTA
42
5.13 VM Vs Calorific value
42
5.14 VM Vs Wet oxidation potential 42
5.15 VM Vs Flammability temperature
43
5.16 VM Vs Transition temperature
43
5.17 VM Vs II slope of DTA
43
5.18 Fixed carbon Vs Calorific value
44
5.19 Fixed carbon vs Wet oxidation potential
44
5.20 Fixed carbon Vs Flammability temperature
44
5.21 Fixed carbon Vs Transition temperature
45
5.22 Fixed carbon Vs II slope of DTA
45
5.23 Calorific value Vs Wet oxidation potential
45
5.24 Calorific value Vs Flammability temperature
46
5.25 Calorific value Vs Transition temperature
46
5.26 Calorific value Vs II slope of DTA
46
5.27 Wet oxidation potential Vs Transition temperature
47
5.28 Wet oxidation potential Vs II slope of DTA
47
5.29 Wet oxidation potential Vs IIA slope of DTA
47
5.30 Flammability temperature Vs Transition temperature
48
5.31 Flammability temperature Vs II slope of DTA
48
A1 DTA-TG curve of sample 1
55
A2 DTA-TG curve of sample 2
55
A3 DTA-TG curve of sample 3
55
A4 DTA-TG curve of sample 4
55
A5 DTA-TG curve of sample 5
56
A6 DTA-TG curve of sample 6 56

A7 DTA-TG curve of sample 7
56
A8 DTA-TG curve of sample 8
56
A9 DTA-TG curve of sample 9
57
A10 Wet oxidation potential curves
59
(viii)

LIST OF PHOTOGRAPHS
Plate No. Title Page No.
2.1 Coal reserves of India 5
2.2 Area map of SCCL
6
3.1 Bomb calorimeter 25
3.2 Flammability temperature apparatus 28
3.3
3.4
Wet oxidation potential apparatus
DTA-TG apparatus
28
31
(ix)

CHAPTER – 1
INTRODUCTION
1.1 Background
Coal is the source of about 27% of the world‘s primary energy consumption and it accounts for
about 34% of electricity generated in the world, so much attention has been focused in recent
years on coal as an alternative source of energy (Nimaje et.al., 2010). Coal is the dominant
energy source in India and meets 55% of country‘s primary commercial energy supply. Mine
fires in Indian coalfields is generally caused by spontaneous combustion of coal despite various
preventive technologies being adopted. The spontaneous heating of coal varies over a wide range
and it is important to assess their degree of proneness for taking preventive measures against the
occurrence of fires to avoid loss of lives and property, sterilization of coal reserves and
environmental pollution and raise concerns about safety and economic aspects of mining
(Tripathy, 2001).
In order to find out the susceptibility of coal to spontaneous heating different methods have been
adopted by various researchers of the world. A number of experiments have been done for
assessing the spontaneous heating susceptibility of coal viz., Crossing point temperature method
(Didari et.al., 2000), Wet oxidation potential method (Tarafadar et.al., 1989), Differential
thermal analysis (Nimaje et.al., 2010), Flammability temperature (Nimaje et.al., 2010). A
number of approaches have been developed over the years to assess the proneness of coal to
spontaneous heating. This propensity to self heating of coal also decide the incubation period of
coal seam, which decide the size of the panel to be formed, which is a most important safety
measure in mine planning. It is therefore imperative that the planners of a mine determine in
advance the spontaneous heating susceptibility of the seam/seams to be mined so that either the
coal has been extracted before the incubation period, or advance precautionary measures are
planned to tackle this menace.
The methods used to assess the tendencies of coals to spontaneous heating in the present study
are Proximate analysis, Calorific value, Flammability temperature, Wet oxidation potential,
Differential thermal analysis (DTA - TG).
1.2 Objectives of the project
The objectives of the project is to carry out thermal analysis of all the parameters of coal in order
to find out the mostly affected collected coal sample susceptible to spontaneous heating. The
project was divided into the following steps to achieve the abovesaid objective –

Literature review – collection of all the past works done by various
academicians/researchers/scientists both national and international.
Sample collection and preparation – Nine samples were collected from SCCL, for the
purpose of analysis and the samples were collected and prepared as per the Indian
Standards.
Experimentation – the experimentation part divided into two stages:
o Determination of intrinsic properties of coal – proximate analysis, calorific value
o Determination of susceptibility indices of coal – wet oxidation potential,
differential thermal analysis, flammability temperature.
Analysis – Different graphs have been plotted between the intrinsic properties and
susceptibility indices and the interpretation has been carried out on the basis of graphs.
CHAPTER – 2
LITERATURE REVIEW
2.1 Coal mine fires
Mine fires are associated mostly with coal mines, though fires in pyrite mines and occasional
timber fires in certain metal mines are not unknown. Mine fires are common occurrences in coal
mines but are rare in metal mines. Mine fires can be caused either by spontaneous heating,
explosion of gases, electrical failures and blasting. In coal mines the major cause of mine fire is
spontaneous heating of coal. An analysis of the causes of coal mine fires reveal that they may
start either from open fires over the external mining agencies or originate due to very nature of
coal (Pal et.al., 1998). The propensity of coal liberating heat when come in contact with oxygen
of air and its poor thermal conductivity favoring heat accumulation, may give rise to latter kind
of heating. The former type of fire from external agencies is known as Exogenous Fires and the
latter type i.e. due to self-heating characteristics of coal is called Endogenous Fires or
Spontaneous Combustion.
Endogenous fires:
1. Pyrite fires: The iron ore of pyrite having chemical formula of FeS2 is a polysulphide of iron.
Pure pyrite contains 46.37% Fe and 53.33% S. as with coal pyrite also reacts with oxygen of air
at room temperature liberating heat which under favorable conditions of heat accumulation gives
rise to spontaneous fires. Susceptibility to spontaneous heating of pyrites is much less than that
of coal but it increases if carbonaceous materials are present in pyrites. There are instances when
pyrites with 5 - 6 % C and 10 – 12 % S have caught fire due to spontaneous heating (Amjhore
Field, India).
2. Endogenous heating timber: Decayed timber may under extremely favorable conditions give
rise to spontaneous heating believed to be mainly from bacterial origin.
Exogenous fires:
Electricity is one of the important causes of mine fires. It may originate from short circuiting,
over heating of machines, electric bulbs, candles, flames from fires or explosion while blasting
and ignition of inflammable materials like timber, oil or wastes. At times crushing of sulphide
ores or fires from surface may also be the origin.

2.2 History of coal mine fires
Self heating of coal leading to spontaneous combustion is the most significant cause of fires in coal
mines across the world (Ramlu et.al., 1985). Self heating of coal can occur in underground mines,
opencast mines, coal stockpiles, transportation and during the disposal of wastes from coal using
industries in heap wastes (Bowes, 1984 and Carras et.al., 1994).
World scenario
Up to 10 coal fires per year in the Ruhr area of Germany are caused by spontaneous heating
(Pilarczyk et.al., 1995). In china underground coal fires are widespread within a region stretching
5000 Km east – west and 750 Km north – south. It is assumed that fires in northern China
consume an estimated amount of 100 – 200 MT of underground coal which is about 2 – 3 % of
world CO2 production (Huang et.al., 2001).surveys in the West Riding of Yorkshire (England)
showed that 45 of the county‘s 153 collieries were on fire in 1931 (Sheail, 2005). A more recent
example is the spontaneous combustion of spoil heaps at Middleburg colliery in Witbank
coalfield in South Africa (Bell et.al., 2001).
China
In China, the world‘s largest coal producer with an annual output around 2.5 billion tons, coal
fires are a serious problem. It has been estimated that some 10-20 million tons of coal uselessly
burn annually, and that the same amount again is made inaccessible to mining. They are
concentrated in the provinces of Xinjiang, Inner Mongolia and Ningxia. Beside losses from
burned and inaccessible coal, these fires contribute to air pollution and considerably increased
levels green house gas emissions and have thereby become a problem which has gained
international attention[32]
.
Germany
In Planitz, now a part of the city of Zwickau, a coal seam that had been burning since 1476 could
only be quenched in 1860. In Dudweiler (Saarland) a coal seam fire ignited around 1668 and is
still burning today. Also well-known is the so-called Stinksteinwand (stinking stone wall) in
Schwalbenthal on the eastern slope of the Hoher Meibner, where several seams caught fire
centuries ago after lignite coal mining ceased; combustion gas continues to reach the surface
today[32]
.
Indonesia
Coal and peat fires in Indonesia are often ignited by forest fires near outcrop deposits at the
surface. No accurate count of coal seam fires has been completed in Indonesia. Only a minuscule
fraction of the country has been surveyed for coal fires. The best data available come from a

study based on systematic, on-the-ground observation. In 1998, a total of 125 coal fires were
located and mapped within a 2-kilometer strip either side of a 100-kilometer stretch of road north
of Balikpapan to Samarinda in East Kalimantan, using hand-held Global Positioning System
(GPS) equipment. Extrapolating this data to areas on Kalimantan and Sumatera underlain by
known coal deposits, it was estimated that more than 250,000 coal seam fires may have been
burning in Indonesia in 1998[32]
.
United States
Many coalfields in the USA are subject to spontaneous ignition. The Federal Office of Surface
Mining (OSM) maintains a database (AMLIS), which in 1999 listed 150 fire zones. In
Pennsylvania, 45 fire zones are known, the most famous being the fire in the Centralia mine in
the hard coal region of Columbia County. In Colorado coal fires have arisen as a consequence of
fluctuations in the groundwater level, which can increase the temperature of the coal up to 30 °C,
enough to cause it to spontaneously ignite. The Powder River Basin in Wyoming and Montana
contains some 800 billion tons of brown coal, and already the Lewis and Clark Expedition (1804
to 1806) reported fires there[32]
.
India
Plate 2.1 Coal reserves of India

History of coal mines fires can be traced back to the year 1865, when the first fire was reported
in Raniganj Coalfields. Over 140 years fires have been reported till the year1967 from both
Jharia and Raniganj coal fields and superior quality non-cocking coal in Raniganj coal fields.
Fires occur whenever and wherever combustible material is present in mine working. They
endanger not only the valuable lives of men in mine but also cause considerable economic losses
to the organization affected by them. These fires not only continue to spread to adjoin areas,
adding to the losses but also prevent economic exploitation of the seam in the vicinity. Again the
open fire in these fields causes environmental pollution by emission of huge quantities of steam,
smoke and noxious gases posing a serious health hazards. In Indian coal mines 75% (Singh et.al.,
2004) of the coal fires occur due to spontaneous combustion. The main aspect of starting the fire
in India is that the coal seams are thicker and there is a tendency of spontaneous heating during
the depillaring operation. The problem of extraction of thick seam and coal standing in pillars is
a serious one particularly in cases where they are with high moisture, high volatile and low ash
content which are more liable to spontaneous combustion. It is not practicable to extract all the
coal by caving method or even by complete packing under Indian mining condition. Pillars
standing for long time are liable to deteriorate in straight and spilling may occur.
Plate 2.2 Area map of coal fields of SCCL
2.3 Spontaneous heating
The phenomenon in which the coal catches fire automatically on coming in contact with oxygen
in the atmosphere without any external source of fire which leads to mine fires is known as
spontaneous heating of coal. It is primarily thought that the main cause of spontaneous heating is
the self oxidation of coal. Although the actual mechanism of coal oxidation is yet unknown,
there are many theories put forward for explanation of the coal oxidation and combustion.
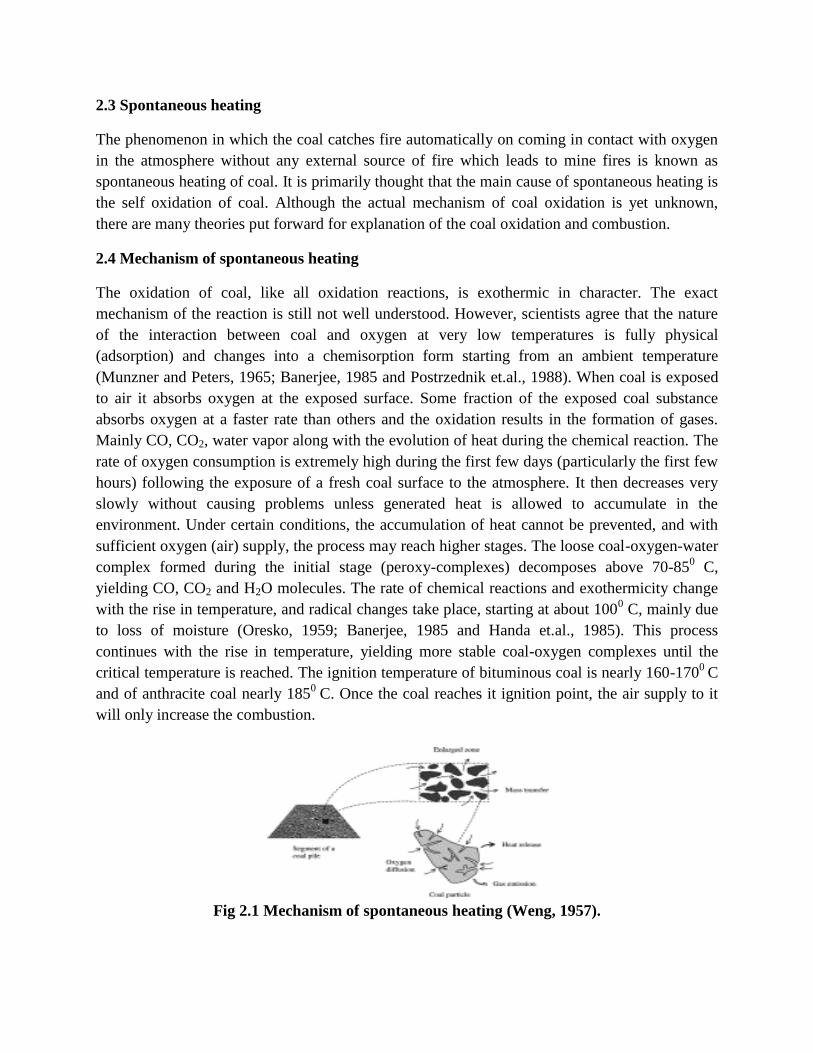
2.4 Mechanism of spontaneous heating
The oxidation of coal, like all oxidation reactions, is exothermic in character. The exact
mechanism of the reaction is still not well understood. However, scientists agree that the nature
of the interaction between coal and oxygen at very low temperatures is fully physical
(adsorption) and changes into a chemisorption form starting from an ambient temperature
(Munzner and Peters, 1965; Banerjee, 1985 and Postrzednik et.al., 1988). When coal is exposed
to air it absorbs oxygen at the exposed surface. Some fraction of the exposed coal substance
absorbs oxygen at a faster rate than others and the oxidation results in the formation of gases.
Mainly CO, CO2, water vapor along with the evolution of heat during the chemical reaction. The
rate of oxygen consumption is extremely high during the first few days (particularly the first few
hours) following the exposure of a fresh coal surface to the atmosphere. It then decreases very
slowly without causing problems unless generated heat is allowed to accumulate in the
environment. Under certain conditions, the accumulation of heat cannot be prevented, and with
sufficient oxygen (air) supply, the process may reach higher stages. The loose coal-oxygen-water
complex formed during the initial stage (peroxy-complexes) decomposes above 70-850 C,
yielding CO, CO2 and H2O molecules. The rate of chemical reactions and exothermicity change
with the rise in temperature, and radical changes take place, starting at about 1000 C, mainly due
to loss of moisture (Oresko, 1959; Banerjee, 1985 and Handa et.al., 1985). This process
continues with the rise in temperature, yielding more stable coal-oxygen complexes until the
critical temperature is reached. The ignition temperature of bituminous coal is nearly 160-1700
C
and of anthracite coal nearly 1850
C. Once the coal reaches it ignition point, the air supply to it
will only increase the combustion.
Fig 2.1 Mechanism of spontaneous heating (Weng, 1957).
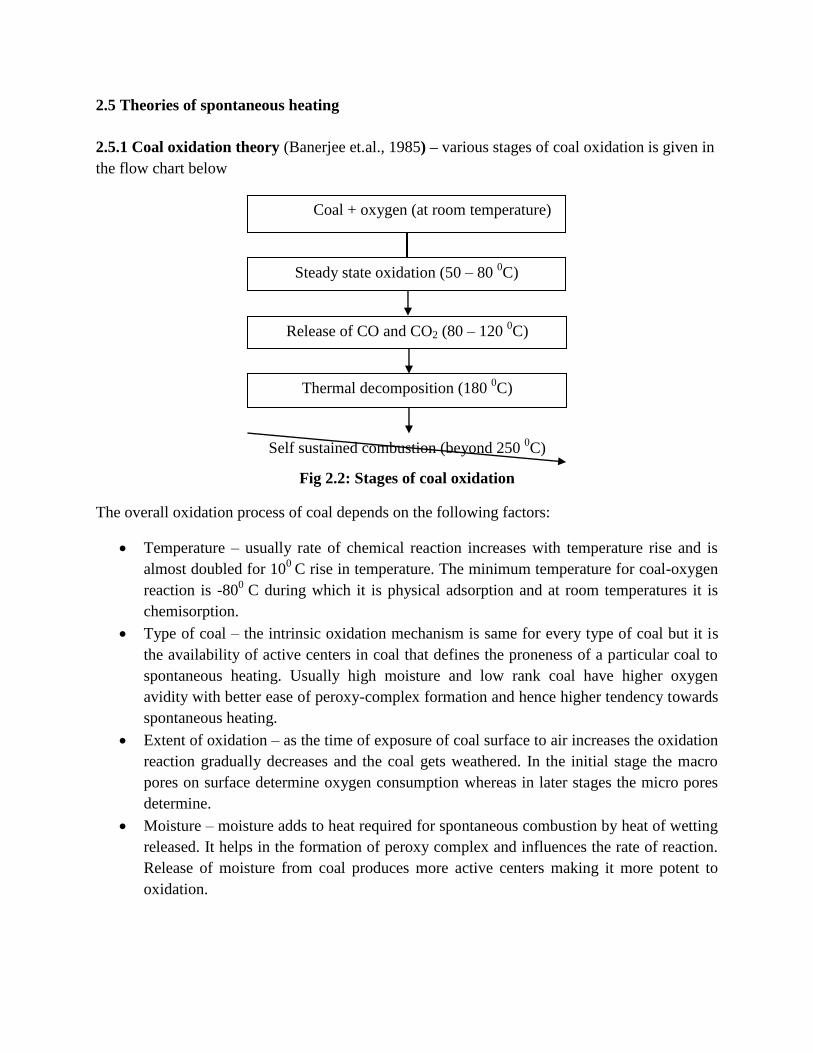
2.5 Theories of spontaneous heating
2.5.1 Coal oxidation theory (Banerjee et.al., 1985) – various stages of coal oxidation is given in
the flow chart below
Fig 2.2: Stages of coal oxidation
The overall oxidation process of coal depends on the following factors:
Temperature – usually rate of chemical reaction increases with temperature rise and is
almost doubled for 100
C rise in temperature. The minimum temperature for coal-oxygen
reaction is -800
C during which it is physical adsorption and at room temperatures it is
chemisorption.
Type of coal – the intrinsic oxidation mechanism is same for every type of coal but it is
the availability of active centers in coal that defines the proneness of a particular coal to
spontaneous heating. Usually high moisture and low rank coal have higher oxygen
avidity with better ease of peroxy-complex formation and hence higher tendency towards
spontaneous heating.
Extent of oxidation – as the time of exposure of coal surface to air increases the oxidation
reaction gradually decreases and the coal gets weathered. In the initial stage the macro
pores on surface determine oxygen consumption whereas in later stages the micro pores
determine.
Moisture – moisture adds to heat required for spontaneous combustion by heat of wetting
released. It helps in the formation of peroxy complex and influences the rate of reaction.
Release of moisture from coal produces more active centers making it more potent to
oxidation.
Coal + oxygen (at room temperature)
Steady state oxidation (50 – 80 0C)
Release of CO and CO2 (80 – 120 0C)
Thermal decomposition (180 0C)
Self sustained combustion (beyond 250 0C)

2.5.2 Pyrite theory (Banerjee et.al., 1985) –
The pyrites present as impurities in coal acts as a major source of heat. The oxidation of pyrites
is given by the following reaction:
2 FeS2 + 7 O2 + 6 H2O 2 H2SO4 + 2 FeSO4 + 7 H2O
The above reaction is exothermic and it produces heat which is capable enough of triggering
spontaneous combustion. Moreover the products of the above reaction have greater amount of
volume and hence break open the surface they are embedded in. But it has been found that
pyrites can be the cause of spontaneous heating only when they are present in considerable
proportions.
2.5.3 Bacterial theory (Jain, 2009) –
Spontaneous heating observed in haystacks and in wood are known to be mainly due to bacterial
action. Different evidences showed that bacteria were capable of living on coal and in some
cases such bacteria caused a slight rise in temperature of the coal. Graham observed that
sterilized coal oxidized at the same rate as the unsterilized coal and concluded that mechanism of
oxidation did not include bacterial activity. Fuchs however concluded that bacteria could cause
only a slight heating which may not play any significant role.
2.5.4 Phenol theory (Jain, 2009) –
Experiments have shown that phenolic hydroxyls and poly phenols oxidize faster than many
other groups. This theory is interesting because it offers a method of determining liability of coal
to spontaneous heating.
2.5.5 Electro chemical theory (Jain, 2009) –
It explains auto-oxidation of coals as oxidation-reduction processes in micro galvanic cells
formed by the coal components.
2.5.6 Humidity theory (Jain, 2009) –
Quantity of heat liberated by atmospheric oxidation of coal is much less than the quantity of heat
required removing water from the coal. Thus it can be concluded that if the evaporation of water
can be induced at the seat of heating, then the temperature of heating would decrease. Mukherjee
and Lahiri (1957) proposed the following mechanism of the reaction between water and coal at
100°C. (Brackets indicate chemisorptions):
H2O - (H) (OH) - (H2) (0) -- (H2) +02
C + 0 --- (CO) --- CO

(CO) + (0) --- (CO2) --- CO2
When it is recalled that water is an oxidation product of low temperature oxidation of coal, the
above scheme well explains other possible sources of CO and CO2 in low temperature reaction
between coal and oxygen.
2.6 Factors affecting spontaneous heating
The main reason for the difficulties in understanding the mechanism of spontaneous combustion
is the presence of many internal and external factors affecting the initiation and development of
the phenomenon. These factors have been reviewed by various researchers (Kr¨oger and Beier,
1962; Guney, 1968; Chamberlain and Hall, 1973; Feng et al., 1973; Beier, 1973; Kim, 1977;
Banerjee, 1982; Didari, 1988; Goodarzi and Gentzis, 1991; Didari and ¨Okten, 1994).
The main factors which have significant effects on the process are summarized below:
2.6.1 Intrinsic factors – These factors are mainly related to nature of coal
Pyrites – As pyrite content increases the tendency of spontaneous heating
increases.
Inherent moisture – Changes in moisture content such as drying or wetting of coal
have significant effects.
Particle size and surface area – As particle size decreases the exposed surface area
increases and the susceptibility increases.
Rank and Petrographic constituents – Lower rank coals are more susceptible.
Chemical constituents – Ash generally decreases liability for spontaneous heating
but certain parts of ash such as lime, soda; iron compounds have accelerating
effect whereas alumina and silica have retarding effects.
Mineral matter – Some chemicals promote an others inhibit spontaneous heating.
2.6.2 Extrinsic factors – These factors are mainly related to atmospheric, mining and
geological conditions

Temperature – Higher surrounding temperature leads to increase in oxidation
process and ultimately in spontaneous heating of coal.
Extraneous moisture – Evaporation of surface moisture leads to release of heat of
wetting which adds to the temperature rise and increases susceptibility. Presence
of atmospheric moisture increases rate of oxidation of coal.
Oxygen concentration – Higher the oxygen concentration in the atmosphere more
rapid is the oxidation process as oxygen is readily available.
Coal seam and surrounding strata – Presence of faults that lead to the passage of
air and oxygen to the heating are generally increase the rate of heating.
Method of working, ventilation and air flow rate – Mining methods such as bord
and pillar mining that leave some pillars attracts more spontaneous heating than
longwall methods. Air flow rate controls heating to a large extent. If the ideal
flow rate is maintained then it helps in dissipation of heat but if too much of air is
flowing then it stagnates the heat and increases the heating.
Timbering, roadways, bacteria and barometric pressure – Presence of timbers in
the mines leads to the danger of catching of fire which gives the heat required for
spontaneous heating of coal. Bacterial decomposition of coal and other wood
products also releases some amount of heat which increases susceptibility.
The following table gives a summary of all the factors that affect spontaneous heating tendency
of coal.
Table 2.1 Set elements of mining conditions (Banerjee, 1982)
Sl.
No.
Mining parameter /
conditions
Set elements Probability of
spontaneous fire risk
High Low
1. Category of coal (Chemical
nature)
a) Highly susceptible
b) Poorly susceptible
High
-
-
Low
2. Friability of coal a) Highly friable
b) Poor friability
High
-
-
Low
3. Method of working a) Bord and Pillar
b) Longwall
High
-
-
Low
4. State of stowing a) Extraction with caving
b) With complete stowing
High
-
-
Low
5. Seam thickness a) High (>5m)
b) Low (<4m)
High
-
-
Low

6. State of extraction a) Partial extraction
b) Complete extraction
High
-
-
Low
7. Nature of extraction a) Extraction with more than
one slice
b) In one slice
High
-
-
Low
8. Geological disturbances a) Present
b) Absent
High
-
-
Low
9. Rock bumps a) Present
b) Absent
High
-
-
Low
10. Dykes a) Present
b) Absent
High
-
-
Low
11. Overburden a) Greater than 300m
b) Less than 300m
High
-
-
Low
12. Parting a) Shale structure
b) Rocky and consolidated
High
-
-
Low
13. State of consolidation of
barrier
a) Fractured and crushed
b) Well consolidated
High
-
-
Low
14. Scope of accumulation of
fines
a) Fine accumulation
sustained
b) Fines avoided
High
-
-
Low
15. Method of ventilation a) Advancing type
b) Retreating type
High
-
-
Low
16. Quantity of ventilation a) Intensity of pressure
difference high
b) Low pressure difference
High
-
-
Low
17. Humidity a) Wet mines
b) Dry
High
-
-
Low
18. Source of hot spots a) Present
b) Absent
High
-
-
Low
19. Gas emission rate a) Low
b) High
High
-
-
Low
20. Size of panel of the face a) Large
b) Small
High
-
-
Low
21. Rate of face advance a) Slow
b) Fast
High
-
-
Low
22. Chances for blockage of
face advance
a) Present
b) Absent
High
-
-
Low
2.7 National and International status
National status:
Bhattacharya (1971) carried out laboratory experiments to measure the rates of heat release
from different coals by a calorimeter during sorption of water vapour in isothermal conditions. It
was observed that the rate of heat generation in a particular coal increases with the equilibrium

humidity deficiency of the coal, i.e. with the difference of equilibrium humidity of air and coal.
For a given coal, the rate of heat generation due to oxidation has been found to be negligible in
comparison with that due to sorption of water vapour. A small ‗peak‘ at the beginning of the rate
curves has been observed during the tests with dry coals, with the exception of anthracite;
explanations for this phenomenon have been attempted. The results also show that under a given
test condition the characteristic rate of heat release is dependent on the type of coal, its particle
size and its weathering.
Mishra et.al. (1980) presented a critical analysis of various genetic and physical factors
associated with certain Early and Late Permian and Oligocene coal seams and early Eocene
lignite seams of India revealed that the high secondary porosity and small particle size,
irrespective of petrographic and rank properties in sub-humid climate, favour spontaneous
combustion. Large particle size, high rates of gas emission and highly wet or dry seams, in
combination with each other tend to inhibit spontaneous heating in sub-humid, per-humid and
semi-arid conditions. The susceptibility to auto-ignition of a coal or lignite seam is not uniform
throughout its lateral extent and a high inherent porosity at any given rank stage and a high
content of susceptible or oxidizable constituents are not sufficient to cause auto-ignition.
Ghosh (1985) made an attempt to evolve a method to identify coal's proneness to spontaneous
combustion. It has been shown that if pyrite is present in a coal in finely divided form, the
proneness of coals towards spontaneous combustion increases; and the temperature of a coal bed
increases if water is added to it, which tends to indicate that water spraying or even flooding
cannot be considered as an effective measure to control spontaneous combustion. Moreover, it
was also suggested that if a coal body is chilled (to − 193 °C) the micropores and microcracks in
the coal are possibly contracted. Atmospheric oxygen is less likely to enter the coal through
micropores and microcracks; and hence chances of spontaneous combustion due to auto-
oxidation are diminished.
Tarafdar et.al. (1987) reported results of wet oxidation of coal using alkaline permanganate
solution involving measurements of differential temperature at different temperatures, at a
constant heating rate, and potential changes between a saturated calomel electrode and a carbon
electrode immersed in the coal oxidant mixture within a definite reaction time at a constant
temperature. The measurements were made on seven coal samples coalfield of known crossing
point temperatures (CPT). Four samples, considered to be highly susceptible to spontaneous
heating, had CPT in the range 132-1370C, and three, considered poorly susceptible to
spontaneous heating, had CPT values in the range 162-1680C, showing two distinct zones of
correlation between CPT values and the corresponding differential peak temperatures, and
between CPT and the observed potential changes. It was suggested that differential temperature
and potential difference measurements during wet oxidation of coal may be used as alternative
techniques for the assessment of tendency to spontaneous heating.

Chandra et.al. (1990) conducted a preliminary survey of the frequency of occurrence of fire due
to spontaneous combustion in the different seams of the Raniganj Coalfield and showed the
possibility of a relationship between coalification and spontaneous combustion of coals. Besides
rank, as evidenced from reflectance studies, the amount of vitrinite and exinite contents of the
coal seams also influenced the spontaneous combustibility of the coal seams. The found that
pyrite of the Raniganj Coalfield had no influence on the combustibility of the coal seams. It was
concluded that the proneness to spontaneous combustion of the coals is related to coalification.
As the coalification increases, the intensity of spontaneous combustibility decreases gradually
from highly susceptible to moderately susceptible to least susceptible to the spontaneous
combustion stage.
Bhatt et.al. (1995) developed a reaction-diffusion approach to consider the effects of moisture
evaporation and condensation on the rate of oxidation of coal. For a single isothermal particle,
pseudo-steady-state balances on moisture and oxygen permit calculation of the effect of different
levels of coal-bound moisture on the rate of oxidation. It was shown that partial wetting of coal
or condensation of moisture exerts two competing influences on the overall rate of oxidation. On
the one hand, a portion of the coal fills up with liquid moisture; in this region, the rate of
oxidation becomes negligible, since the oxygen has to dissolve in the moisture before it can gain
access to an active site on the coal surface and the solubility of oxygen in water is low. On the
other hand, condensation also leads to the release of the latent heat of vaporization. This heat
effect raises the temperature of the particle and increases the rate of oxidation in the dry region
of the coal. The relative magnitude of the rates of these competing influences determines
whether the potential for spontaneous combustion is abated or enhanced..
Sahu, et al. (2004) presented the method of finding out the spontaneous heating susceptibility of
coal samples by using differential scanning calorimetry (DSC). 30 coal samples collected from 7
different Indian coalfields have been studied by this method and the onset temperature for all the
samples were determined. In addition, the crossing point temperatures (CPT) of all the samples
were determined and a comparative study between onset temperature and CPT was presented.
Panigrahi et.al. (2004) carried out extensive field studies to investigate the pillar fire problems
in one coal mine in India. A Thermal IR gun and a Thermo vision camera have been employed
for thermal scanning to assess the state of heating in selected pillars. Special sampling setups
have been designed to collect gas samples from the holes drilled into the selected pillars and the
multi gas detector is used to analyse the composition of samples in situ. In order to predict the
spontaneous heating in coal pillars, different gas ratios have been calculated and it has been
observed that some of the established gas ratios, viz. Graham's ratio, Young's ratio etc. have
resulted in negative values in samples containing high amounts of methane. The modified gas
ratios have been proposed which will be useful for predicting the pillar fires. These ratios may
also be used for assessing the condition of fires in sealed-off areas.
Singh, et al. (2004) observed that exploitation of coal seams from underground mines has
become a major challenge to Indian coal mining industries. The problem of spontaneous heating
in blasting gallery (BG) panels during extraction is a major threat to safety and productivity in
SCCL mines. Most of the BG panels have been sealed due to the occurrences of spontaneous
heating during extraction of the panel. After sealing of the panel, it is much difficult to re-open
the panel.
Sahu, et al. (2005) described the determination of spontaneous heating susceptibility of coal
samples by three different experimental methods viz., crossing point temperature (CPT),
differential thermal analysis (DTA) and differential scanning calorimetry (DSC) since all coals
are not susceptible to spontaneous heating to the same extent, it was essential to assess their
degree of proneness in order to plan advance precautionary measures.. The acceptability of a
method for determining spontaneous heating characteristics of coal mainly depends upon how
closely it predicts the spontaneous heating behaviour in the field conditions. Considering this, it
may be concluded that the onset temperature obtained from differential scanning calorimetry
may be a better method than crossing point temperature.
Singh, et al. (2007) observed in opencast mines, coal immediately oxidises and catches fire due
to the intrinsic characteristics of coal, such as low rank, high moisture, high volatile matter,
presence of sulfur in the form of pyrites, low crossing point temperature (CPT) and ignition point
temperature (IPT) value and less incubation period. In opencast mines, when the coal benches
are left idle for a longer time, heat accumulation takes place in favourable conditions and
sometimes leads to fire. The purpose of this paper is to present the different successful case
studies regarding the safety management of open pit coal mines from occurrences of spontaneous
heating.
Ahmed, et al. (2008) calculated Liability index using CPT for studying the propensity of coal
towards spontaneous heating. CPT that has been in lab requires extra precaution for repeatable
results. To overcome the difficulties, attempts were made to study the relationship between
peripheral oxygen groups or the functional oxygen groups in coals and their correlation with
proneness to auto-oxidation using liability index (LI).Also the correlation between liability index
and crossing point temperature have been presented in this paper.
Sahay et.al. (2008) proposed realistic characterisation of coal towards spontaneous heating for
taking corrective measures. They developed a methodology based on thermo-decompositional
study of coal sample for determination of minimum temperature at which coal bed temperature
starts self propellant known as critical temperature and a new liability index based on it. They
presented a brief description of different liability index particularly based on thermal study, a
critical analysis of dependency of critical temperature on moisture content, ash content, volatile
matter, carbon content, surface area and porosity, new liability index based on

thermodecompositional study of coal sample and correlation with liability index model based on
coal proximate analysis results of coal sample including surface area and porosity.
Mohalik, et al. (2009) presented the review of application of three thermal techniques viz;
differential thermal analysis (DTA), thermogravimetry (TG) and differential scanning
calorimetry (DSC); for studying the susceptibility of coal to spontaneous heating and fire. It also
critically analyses the experimental standards adopted by different researchers, while applying
these techniques in studying thermal behaviour of coal samples. The paper also presents the
future direction of research in this subject area.
Nimaje et.al. (2010) made thermal studies on spontaneous heating of coal. Of all the
experimental techniques developed thermal studies play an important and dominant role in
assessing the spontaneous heating susceptibility of coal. They made an overview of thermal
studies carried out by different researchers across the globe for determination of spontaneous
heating of coal and revealed that lot of emphasis on experimental techniques is necessary for
evolving appropriate strategies and effective plans in advance to prevent occurrence and spread
of fire.
International status:
Peter, et al. (1978) observed the oxidation of the weathered materials has an apparent activation
energy lying between 63.9 and 69.0 kJ/mol which is independent of their moisture content.
However, the rate of oxidation of char increases with increasing moisture content and decreases
with increasing carbonization temperature of the parent coal, and with the extent of the char's
weathering.
Singh, et al. (1984) outlined the current techniques of assessment of spontaneous combustion
risk indices for classifying coal seams liable to self-heating. Factors affecting liability of coal to
spontaneous combustion depend upon intrinsic factors as well as external factors promoting the
self-heating. An adiabatic oxidation test was described which can be used to assess the liability
of coal according to intrinsic reactivity. Systems of risk classifications are based on the synthesis
of ratings assigned to intrinsic as well as extrinsic factors. Precautionary measures to control
spontaneous combustion hazard in underground longwall mining, stockpiling and seaborne
transport of coal are described together with the techniques of fire-fighting using liquid nitrogen.
Gouws et.al. (1988) gave three characteristics on a differential thermal analysis thermogram
(i.e., the crossing-point temperature, stage II exothermicity gradient and the transition
temperature to high-level exothermicity) are generally believed to be indicative of the self-
heating propensity of coal. A new index was developed and applied to 58 coals, enabling known
dangerous and safe coals to be identified.
Olayinka, et al. (1990) showed the CPT of Nigerian coals were found to decrease with increase
in coal rank. The liability index, which gives a better evaluation of susceptibility of coal to
spontaneous heating, was also found to decrease with increase in rank and with decrease in
oxygen content and moisture holding capacity of the coal. Of the four coals studied, the high
volatile bituminous coal had the lowest susceptibility to spontaneous combustion while the
subbituminous was the most susceptible.
Gouws, et al. (1990) designed an adiabatic calorimeter to enable the spontaneous combustion
propensity of coal to be established. Various indicators of self-heating potential, such as total
temperature rise, initial rate of heating, minimum self-heating temperature, and kinetic constants
were investigated. Results obtained from the adiabatic tests were compared with the results of
crossing-point temperature determinations and differential thermal analysis (DTA) tests for the
same coals, with a view to formulating a mathematically consistent spontaneous combustion
liability index. This paper describes the major components of the adiabatic calorimeter.
Anthony, et al. (1995) said that self-heating of coal mainly involves exothermic reactions of
oxygen at reactive radical sites within the coal and the enhancing or moderating effect that water
had on these reactions. The thermal response of samples of low-rank coals, dried by heating
under nitrogen flow at 105°C and exposed to dry oxygen, is similar to or slightly less than that
observed when they are flow-dried at 30°C and tightly bound moisture remains. The most likely
reason is that moisture affects the nature of the radical sites where oxidation occurs. By
hindering the formation of stabilized radicals, it encourages faster oxidation which may lead to
enhanced thermal response, although some of the extra heat may be taken up by the residual
moisture. When loosely bound moisture is allowed to remain in the coal, the thermal response on
exposure to dry oxygen decreases very quickly, due mainly to hindered access to reactive sites
and dissipation of heat generated by any oxidation that does occur. The effect of desorption is
comparatively minor and the course of the oxidation reaction responsible for generating heat
does not appear to be changed by the presence of small quantities of loosely bound moisture.
Jose, et al. (1995) used differential thermal analysis (DTA) as a method to study the self-heating
behaviour of fresh and oxidized coals. Oxidation was performed in air at 200°C for periods of up
to 72 h. As the rank of the coal increases, both the self-heating and the end of combustion
temperatures also increase. The total heat loss (area under the DTA curve) increases with the
rank of the coal. An increase in the self-heating temperature, a decrease in the temperature of the
end of combustion and a decrease in total heat flow were observed as a consequence of coal
oxidation. A relationship between the total heat loss and the calorific value as determined using
the ASTM standard method is pointed out.
Vancea, et al. (1995) work investigates the effect of the moisture content of coal on its
spontaneous ignition in oxygen (40°C–140°C). It has been found that the highest heating rate is
achieved at a medium moisture content of 7 wt% for an initial inherent moisture content of the
coal before drying (in dry nitrogen at 65°C) of 20 wt%. This is particularly noticeable at
temperatures below 80°C and tends to support previous studies showing that a maximum
oxidation rate occurs at such moisture content in the same temperature range.
Ren, et al. (1998) used adiabatic calorimeter for the propensity of 18 pulverised coals (Australia,
UK, US, Indonesia, South Africa, South America) to spontaneous combustion. All the coal
samples were tested at an initial temperature of 40°C and three samples at 60°C. Their
propensities to spontaneous combustion were ranked according to their initial rate of heating
(IRH) and total temperature rise (TTR) values. The results demonstrated that air humidity is an
important factor is determined whether a heating will progress rapidly or not. The particle size
distribution of the coal affects the IRH and TTR values, with relatively smaller particles tending
to be more reactive. Aged and pre-oxidised coals have higher IRH and lower TTR values, and
the coal becomes less reactive. The magnitude of the temperature raises (TTR) increases with
increasing initial temperature.
Rosema et.al. (2000) developed a numerical simulation model ―COALTEMP‖ to study the
oxidation and possible spontaneous combustion of coal that is exposed to the atmosphere and the
daily cycle of solar irradiation. First the differential equations that describe heat flow, oxygen
flow and oxidation in the coal matrix, and the equations describing the exchange of heat,
radiation and oxygen with the atmosphere, are presented.
Kuçuka, et al. (2001) evaluated the spontaneous combustion characteristics of Askale lignite
from Turkey. The effect of the gas flow rate, the moisture of the piles of coal, the humidity of the
air and particle size on the spontaneous combustion characteristics of coal samples were
examined using Crossing Point Methods adapted to their laboratories conditions. The liability of
spontaneous combustion of this lignite was found to increase with decreasing particle size,
increasing moisture content of the coal and decreasing humidity of the air.
Yucel et.al. (2001) conducted an experimental study aimed at evaluating the spontaneous
combustion characteristics of two Turkish lignites moistured and air-dried at varying times. The
content of three predominant oxygen functional groups (carboxyl, hydroxyl, and carbonyl) of
untreated, moisten and air-dried coal samples were also determined with wet chemical methods.
The content of oxygen functional groups in moisten coal samples do not differ significantly that
of untreated coal samples, for realized in vacuum dessicator to moisture of coal samples. The
liability of spontaneous combustion of the two coals were found to reduce when moisture content
increased with increase in contacted time to water vapour.
Nelson et.al. (2007) used a wide variety of techniques to gain insight into the processes that
govern the self-heating of coal. These include oxidation mechanisms, ranking the propensity of
different coals to self-heat, and the detection and suppression of self-heating. Moist coal in coal

mines and stockpiles have very different combustion characteristics than those predicted on the
basis of dry testing. Consequently, methods for ranking the propensity of coal to spontaneously
combust in actual mining conditions need to be developed.
Daiyong et.al. (2007) assumed that spontaneous combustion of coal seams is a complicated
process that is a function of the interplay of internal and external conditions. Based on geologic
field investigations and comprehensive analyses, four models of spontaneous combustion for
coal were established: A genesis-type model, a coal-fires propagation model, a model for the
progressive stages and products of a coal fire and a cross-sectional model of zones.
Table 2.2: Experimental parameters used by different researchers in DTA studies on
spontaneous heating of coal (Mohalik et al, 2009)
Sl
No
Name of
Author Year
Parameters
Particle
size/
mesh
Heating
rate 0C/
min
Atm.
Sample
Amt.
(mg)
Flow rate
mL/ min
No. of
sample
studied
Ref.
material
Temp.
range
/oC
01 Whitehead
and Breger 1950 - 10,20
Air/
Vacum - - - -
Amb.
to 550
02 Glass 1955 -100 10,20 - - - 7 -
Amb.
to
1000
03 Berkowitz 1957 -65 6 N2 100 2.5 6 Dry
quartz
Amb.
to 500
04 Banerjee and
Chakraborty 1967
-72, -
200, -10
+60
1,3,5,10
,15
Atm.
Air 600 - 6
Calcined
alumina
Amb.
to 400
05 Banerjee
et al. 1972 -72 5
Atm.
Air 600 - 6
Calcined
alumina
Amb.
to 400
06 Haykiri-
Acma et al. 1993 - 15 N2 - - - -
Amb.
to 1000
07 Podder et al. 1995 -100 10 Ar 10 100 5 - 30 -
900
08 Iordanidis
et al. 2001 -16 10 N2 - 150 7 Alumina
Amb.
to 1000
09 Kok 2002 -60 10 Air 10 167 4 Alumina 20 -
900
10 Panigrahi,
Sahu 2004 -72 30
Atm.
Air 600 - 31
Alpha
Alumina
Amb.
to 400
11 Elbeyli and
Piskin 2006 -65 10 Air/ N2 10 100 1 -
Amb.
to
1000
12 Haykiri-
Acma et al. 2006 -65 20 Atm. 20 - 7 Alumina
Amb.
to
1000
13 Sis 2007 -8+10
to -400 10 Air 10 50 1
Alpha
Alumina
Amb.
to 900
14 Ozbas 2008 - 10 N2 10 50 15 Alpha
Alumina
Amb.
to 900

Table 2.3: Experimental parameters used by different researchers in TG studies on
spontaneous heating of coal (Mohalik et al, 2009)
Sl
No
Name of
Author Year Parameters
Particl
e size/
Mesh
Heating
rate/ oC
/min
Atm.
Sample
amount
/ mg
Flow
rate mL/
min
No. of
sample
Ref.
material
Temp
range /oC
01 Ciuryla and
Welmar 1979 - 20 Helium - 1000 4 -
Amb. to
1000
02 Cumming 1980 - 15 Air 20 75 22 - Amb. to
900
03 Smith and
Neavel 1981 - 15 Air 300 - 66 -
Amb. to
1000
04 Pranda
et al. 1999 -72 5 - 10 - 1 - 200-700
05 Podder and
Majumder 2001 -100 10 N2 10 100 5 - 30-900
06 Alonso
et al. 2001 -400 25 Air 13 50 10 -
Amb. to
1000
07 Kok and
Keskin 2001 -60 10 N2 Air 10 50 10 - 20-800
08 Kok 2002 -60 10 Air 10 167 4 - 20-900
09 Avid 2002 - 10,20,30
,40,50 N2CO2 500 -
Amb. to
1000
10 Ozbas et al. 2002 -60 10 Air 10 50 4 - 20-900
11 Ozbas et al. 2003 -60 5,10,15,
20 Air 10 50 4 - 20-900
12 Kizgut et al. 2003 -200 10 N2 10 15 7 - Amb. to
700
13 Sonibare
et al. 2005 -100 10 Air N2 10,15 50 5 - 25-1000
14 Umar et al. 2005 -200 10 Air 500 25 2 - Amb. to
800
15 Gunes et al. 2005 20 N2 250 12 - 140-900
16 Kok 2005 -60 10 Air 10 50 17 - 20-600
17
Wachowski
and
Hofman
2006 -170 3 Helium 10 - 4 - 20-1000
18 Mianowski
et al. 2006 30 Air 500 - 4 -
Amb. to
900
19 Haykiri-
Acma et al. 2006 -65 20 Air 20 - 7 -
Amb. to
1000
20 Sis 2007
-8+10
to -
400
10 Air 10 50 1 Alumina Amb. to
900
21 Sensogut
et al. 2008 -150 10 N2 100 10
Alpha
Alumina
Amb. to
1600
22 Ozbas 2008 - 10 N2 10 50 15 Alpha
Alumina
Amb. to
900
CHAPTER – 3
EXPERIMENTAL TECHNIQUES
To study the effects of various parameters of coal that affect the spontaneous heating tendency of
coal, the following experiments are needed to be carried out:
Proximate analysis
Ultimate analysis
Petrographic analysis
Calorific value
Differential thermal analysis
Differential scanning calorimetry
Crossing point temperature
Wet oxidation potential
Flammability temperature
Critical air blast
Olpinski index
3.1 SAMPLE COLLECTION AND PREPARATION
It is the process by which the physical and chemical properties of the mineral or ore can be
ascertained with the desired accuracy. It is the process of collecting the small portion of a whole
such that consistence of that portion represents that of a whole.
Different types of sampling are:
Channel sampling
Chip sampling
Grab sampling
Bulk sampling
Drill hole sampling
Chip sampling is done in hard ores where it is difficult to cut the channels. It can be taken in
case of uniform ores and where the rock structures are independent of the values. The sample is
collected by breaking of small equal sized chips from a face at points usually equally spaced both
vertically and horizontally.

Grab sampling is applied to the broken ore in the stope or at the face, ore transported. Usually
grab sampling of the ore broken in the stope is unreliable as accurate estimation of the volume of
broken ore is impossible. Grab sampling of tubs or ships is however more representations since
samples are collected from units of regular volume.
Bulk sampling is done where conventional sampling methods do not give a representative scale;
large scale sampling or bulk sampling resorted to. Bulk samples eliminate the effect of irregular
distribution of value or minor.
For our Project work, channel sampling method has been carried out which is common among
various techniques discussed above.
3.1.1 Channel sampling (IS 436 Part I/Section I - 1964)
The section of seam to be sampled shall be exposed from the roof to the floor. The seam sample
shall, be taken in a channel representing the entire cross-section of the seam having the
dimensions of 30 x 10 cm, that is, 30 cm in width and 10 cm in depth. For this purpose, two
parallel lines, 30 cm apart end at right angles to the bedding planes of the seam shall be marked
by a chalked string on the smooth, freshly exposed surface of the seam. Obvious dirt bands
exceeding 10 cm in thickness shall be excluded. The channel between the marked chalk lines in
the seam shall be cut to a depth of 10 cm and the coal sample collected on a clean strong cloth or
tarpaulin placed immediately at the bottom so that the chances of pieces flying off during
excavation of coal are minimized.
Fig 3.1 Channel Sampling
3.1.2 Sample preparation (IS: 436 (Part 1/Section 1)-1964 and IS: 436 (Part II)-1965)
The samples received from the field via channel sampling are crushed in the laboratory as per the
experimental requirements. The crushed sample is then sieved to required sizes and stored in air

tight ploythene packets. The packets are stored in air tight containers for further use in
experimentation.
3.2 METHODS FOR DETERMINING INTRINSIC PROPORTIES OF COAL
3.2.1 Proximate analysis (IS 1350 Part I -1984)
The objective of coal ultimate analysis is to determine the amount of fixed carbon (FC), volatile
matters (VM), moisture, and ash within the coal sample. The variables are measured in weight
percent (wt. %) and are calculated on different basis.
Ar (ash-received) basis – puts all variables into consideration and uses the total weight as
the basis of measurement.
Ad (air-dried) basis – neglects the presence of moistures other than inherent moisture.
db (dry-basis) basis – leaves out all moistures, including surface moisture, inherent
moisture, and other moistures.
daf (dry, ash free) basis – neglects all moisture and ash constituent in coal.
dmmf (dry, mineral-matter-free) basis – leaves out the presence of moisture and mineral
matters in coal.
3.2.1.1 Moisture
Procedure:
Take 1 g of – 212 micron (BSS) coal sample in a glass crucible.
Put it in a furnace at 1100
C for 90 minutes.
Remove the sample after 90 minutes and weigh the glass crucible again.
Calculate the moisture content by the formula
Total moisture content of the original sample, A =. (X – Y)/X * 100
Where,
X – Initial mass of the coal sample before heating
Y – Final mass of coal sample after heating
3.2.1.2 Ash
Procedure:
Take 1g of -212 micron (BSS) coal sample in a silica crucible.

Heat the sample in a muffle furnace at 4500
C for 30 minutes and then further heat
it for 1 hour with temperature rising from 450 to 8500
C.
Remove the silica crucible and then allow it to cool in a dessicator for 15 minutes
and weigh the crucible again.
Calculate ash content by the formula
Ash percentage, A = (100 * (M3 – M4)) / (M2 – M1)
Where,
M1 – Mass of crucible (g)
M2 – Mass of crucible and sample
M3 – Mass of crucible and ash
M4 – Mass of the crucible after brushing out the ash and reweighing it
3.2.1.3 Volatile matter
Procedure:
Take 1 g of -212 micron coal sample in a crucible and put the lid.
Put the crucible in a furnace maintained at 9250 C for 7 minutes exactly.
Take out the crucible and weigh it again.
Calculate the volatile matter content by using the relation
Volatile matter percentage, V = (100 * (M2 – M3) / (M2 – M1)) – M0
Where,
M0 – Percentage of moisture in the sample on air dried basis
M1 – Mass of empty crucible and lid
M2 – Mass of crucible plus lid and sample before heating
M3 – Mass of crucible plus lid and sample after heating
3.2.1.4 Fixed carbon
It is determined by subtracting the sum of all the above parameters and is given as
Fixed Carbon, FC = 100 – (M + V + A)
Where,
M – Moisture content
V – Volatile matter content
A – Ash content

3.2.2 Ultimate analysis (IS 1351 - 1959)
The objective of coal ultimate analysis is to determine the constituent of coal, but rather in a
form of its basic chemical elements. The ultimate analysis determines the amount of carbon (C),
hydrogen (H), oxygen (O), sulfur (S), and other elements within the coal sample.
3.2.3 Petrographic analysis (IS 9127 Part II - 1992)
Coal is a rock composed of number of distinct organic entities called macerals and lesser known
amounts of inorganic substance called as minerals. Each maceral has a distinct set of property
and it influences the behavior of coal. Coal surface can be analyzed at macroscopic level and
microscopic level. At macroscopic level coal appears as banded or non banded rock. The bands
are divided into four major lithotypes – Vitrain, Clarain, Durain, Fusain. At microscopic level
coal has three basic groups of macerals and mineral matter. The macerals are of three types –
Vitrinite, Liptinite, Inertinite and Visible mineral matter.
3.2.4 Calorific value (IS 1350 – 1959)
Plate 3.1 Bomb calorimeter
The calorific value or heat of combustion or heating value of a sample of fuel is defined as the
amount of heat evolved when a unit weight ( or volume in the case of a sample of gaseous fuels )
of the fuel is completely burnt and the products of combustion cooled to a standard temperature
of 298oK.

Procedure:
About 1 g of coal sample is taken in a pellet press and a pellet is formed of nearly 1 g
weight.
The pellet is put in the lid provided and the nickel wire is put on.
A thread is suspended from the nickel wire that is in direct contact with the coal pellet.
The bomb is now closed by putting on the lid firmly from the top.
Oxygen is supplied into it till the pressure is 30 bar inside the bomb.
1 kg of water is put into the vessel provided and the bomb is put in the stand so that the
top of the bomb is in layer of water level.
The overall lid is closed and the stirrer is switched on along with the digital thermometer.
The stirrer is allowed to run till the temperature attains a near constant value.
The cord is put into the furnace and the bomb is fired after the attainment of constant
value.
The temperature rises initially at high rate and later settles down at a constant value.
The initial and final temperature is noted.
The water equivalent of the instrument is noted.
The calorific value of coal is calculated by using the relation
Calorific value = ((Tf – Ti) * Water equivalent) / Weight of the pellet
Where,
Tf – Final temperature
Ti – Initial temperature
Useful heat value = 8900 - 138(A+M)

The following grade system is followed in India for grading of non coking coals.
Table 3.1 Grading of non coking coal (IS 1350 - 1959)
Grade
Useful Heat Value
(UHV)(Kcal/Kg)
UHV= 8900-138(A+M)
Corresponding
Ash% + Moisture
% at (60% RH &
40O
C)
Gross Calorific Value GCV
(Kcal/ Kg) (at 5% moisture
level)
A Exceeding 6200 Not exceeding 19.5 Exceeding 6454
B Exceeding 5600 but not
exceeding 6200 19.6 to 23.8
Exceeding 6049 but not
exceeding 6454
C Exceeding 4940 but not
exceeding 5600 23.9 to 28.6
Exceeding 5597 but not
exceeding. 6049
D Exceeding 4200 but not
exceeding 4940 28.7 to 34.0
Exceeding 5089 but not
Exceeding 5597
E Exceeding 3360 but not
exceeding 4200 34.1 to 40.0
Exceeding 4324 but not
exceeding 5089
F Exceeding 2400 but not
exceeding 3360 40.1 to 47.0
Exceeding 3865 but not
exceeding. 4324
G Exceeding 1300 but not
exceeding 2400 47.1 to 55.0
Exceeding 3113 but not
exceeding 3865
3.3 METHODS FOR DETERMINING SPONTANEOUS HEATING SUSCPETIBILITY
OF COAL
3.3.1 Flammability temperature method (Nimaje et al., 2010)
The set up for the determination of the flammability temperature of coal consists of vertical
tubular furnace of internal diameter 50mm, length 300mm, open at both ends, a dust dispersing
unit, a solenoid valve a reservoir for air, a mercury manometer, a drying tower and an aspirator
bulb. Coal dust sample is kept in the helical dust disperser. Air from the reservoir is made to pass
through the disperser and on emergency from the divergent mount, forms a uniform dust-air
mixture inside the furnace. The minimum temperature at which this mixture catches fire, which
is indicated by the appearance of flame coming out of the bottom of the tubular furnace is the
flammability temperature of the coal dust.
Procedure:
Place 200 mg sample of coal having mesh size -200 mesh (BSS) in a helical tube.
Maintain mercury column difference of 8 cm by aspirator bulb and turn off the tap.

At desired temperature of furnace, switch on the solenoid valve, which allows the air
to pass through it very fast and find out the status of coal sample (spark, smoke or
flame).
If flame appears then find out the exact temperature in lower temperature range by
trial and error method, if not then go for higher temperature range.
Plate 3.2 Flammability temperature apparatus
3.3.2 Wet oxidation potential (Singh et.al., 1985, Tarafdar and Guha, 1989, and Panigrahi et.al.,
1996)
Plate 3.3 Wet oxidation potential apparatus
It is based on the chemical reaction of coal sample with solution of KMnO4 and KOH. The
solution of alkaline potassium permanganate and potassium hydroxide with coal sample forms an

electrochemical cell which on stirring produces EMF against a standard potential of 0.56V. The
plot of the EMF‘s versus time gives an idea of the susceptibility of the coal sample towards
spontaneous heating.
Procedure:
About 0.5g of -212 micron (BSS) of coal sample is taken in a solution of 100 ml of 1N
KMnO4 and 0.1N of KOH solution.
The electrodes, both the carbon and saturated calomel electrode, are inserted into the
solution.
The solution is then stirred continuously by using a magnetic stirrer and the EMF
readings are noted down.
The readings are taken at 1 minute time interval up to 30 minutes or till a constant value
of EMF is attained.
3.3.3 Crossing point temperature (Didari et.al., 2000)
This is one of the oldest methods for determining susceptibility of coal sample. In this the sample
is subjected to uniform constant heating of about 10
C/min and a graph is plotted between
temperature of sample and time. The experimental setup consists of an automated oven that is
capable of maintaining a constant temperature rise by a programmer. The sample is placed in a
tube of 2 cm diameter and length 20 cm. This tube is placed in a glycerine bath and a small tube
of 6 mm diameter is wound around the bigger tube to heat the incoming air. About 20 g of coal
sample is taken and put over a mesh and glass wool. A thermometer is placed in the bath as well
as the tube to measure the respective temperatures.
Fig 3.2 CPT curve (Didari et al 2000)

From the graph it can be inferred that initially due to release of moisture from coal sample the
temperature decreases but after that the graph is found to be parallel to the constant rate of
temperature line for some time. After that the temperature suddenly shoots up and crosses the
oven temperature line and rises steeply beyond that. The point on the graph at which the sample
temperature cuts the oven temperature is called as Crossing Point Temperature. Lower the
crossing point temperature higher is the susceptibility of the coal sample to catch fire.
3.3.4 Olpinski index (Banerjee et.al., 1985) –
In this method a small pellet of coal is allowed to undergo aerial oxidation at a temperature of
2350 C. The exothermicity of coal pellet gives the measure of spontaneous heating susceptibility
Sza of the concerned coal. This method makes correction for ash content of coal (A) and
expresses spontaneous heating tendency as
Szb = Sza – (100 / (100 – A))
Where
Szb – Spontaneous heating index free of ash
Sza – Olpinski index
3.3.5 Critical Air Blast (Sahu et.al., 2005) –
Different coals vary in their reactivity to oxygen/ air. Highly reactive coals oxidize faster and this
oxidation once started may even be sustained at low temperatures. The reaction of coal with
oxygen is termed as oxy-reactivity and this is determined by the critical air blast (CAB) test. The
critical air blast is a measure of the reactivity of coal to air. It is the minimum rate of air supply,
which maintains combustion of closely graded coal in an ignition bed 'of specified dimensions.
The more reactive the coal towards air, lower is its CAB value, and the coal is more susceptible
to spontaneous heating.
Critical Air Blast (CAB) = ((1549*f*V*(P + a – b)) / ((273.15 + Tw)*d))
Where,
P – Atmospheric pressure (mm Hg);
V – Air blast rate at which resuscitation occurs (k l/min of dry air);
d – Diameter of combustion chamber (mm);

f – Gas meter correction factor (1.0);
a – Manometer pressure (mm Hg);
h – Aqueous vapour pressure at T C (mm Hg); and
3.3.6 Differential thermal analysis (Nimaje et al., 2010)
Plate 3.4 DTA – TG apparatus
It is often used to determine the physical property of a substance as a function of temperature.
This method analyses the effect of temperature on the properties of the sample and compares it
with an inert reference material. In DTA the temperature difference between sample and inert
reference is measured when both are subjected to identical heat treatments and then plotted
against time or temperature. The DTA apparatus consists of a sample and reference holder, a
furnace, a temperature programmer to maintain constant temperature rate and an output to
monitor the test. The sample holder has two thermocouples each for reference and sample. The
sample is contained in a small crucible. The thermocouple should not be in direct contact with
sample. By the temperature programmer the temperature is made to rise at a constant rate and the
temperature difference of the sample and reference is plotted against time. The plot consists of
three parts – stage I, II, III.

Fig 3.3 Different stages of DTA (Nimaje et al., 2010)
During stage I mostly endothermic reactions take place and the temperature falls due to release
of moisture.
Stage II consists of two parts – II A and II B. From the beginning of II A, the heating tendency
starts accompanied by a small amount of endothermic reactions. The point where II A begins is
called as the inflexion point as the thermogram suddenly rises. In II B exothermic reactions start
to dominate.
The beginning of stage III is called as Transition temperature. This temperature is very important
as it is directly related to spontaneous heating tendency of coal. The lower the transition
temperature the higher is the susceptibility of coal and vice versa. From stage III onwards
complete exothermic reactions occur and the temperature continues to rise steeply.
From the thermogram plot four important points are required – slope of II A, II B, overall slope
of II and the transition temperature. Lower the slope values lower is the susceptibility. The
transition temperature is found out by drawing tangents at the inflexion point and any point on
stage III. Their intersection gives the transition temperature.
Procedure:
About 10 mg of -212 micron (BSS) coal sample is taken in the crucible.
The reference material taken is alpha alumina.
The DTA machine is switched on and the software is set according to required conditions
viz., heating rate is maintained at 50
C/minute and the final temperature is taken as 4500C.

The plots obtained are then analyzed for the slopes of various stages and transition
temperature.
3.3.7 Differential scanning calorimetry (Nimaje et al., 2010, 2010)
It is similar to DTA with the main difference being that in DSC the reference is maintained at a
known temperature and while the sample temperature is brought to that temperature the change
in energy is recorded. It is more accurate than the DTA. Differential scanning calorimetry (DSC)
is used to measure heat flow into or out of a sample as it is exposed to a controlled thermal
profile. DSC is a technique in which the ordinate value of an output curve at any given
temperature is directly proportional to the differential heat flow between a sample and reference
material and in which the area under the measured curve is directly proportional to the total
differential calorific input.
Fig 3.4 Determination of onset temperature of DSC (Nimaje et al., 2010)
It can be observed from the above thermogram that initially the endothermic reaction dominates
followed by the exothermic reactions. The temperature of initiation of the exothermic reaction
can be considered as an indicator of spontaneous heating susceptibility of coal samples, which is
known as the onset temperature. The lower is this temperature, higher is the spontaneous heating
susceptibility. To determine the onset temperature or characteristics temperature (T0) of
exothermic reaction, first a tangent is drawn at the inflexion point of the pre-transition. Then a
second tangent is drawn at the greatest slope of the first exothermic reaction. The intersection of
the two tangents gives the characteristics or onset temperature.

CHAPTER – 4
RESULTS
ABSTRACT OF EXPERIMENTAL TECHNIQUES
1. Proximate analysis
A. Determination of moisture
Amount of coal : 1 g coal
Size of coal : - 212 micron (72 mesh)
Heating time : 1.5 hours at 1100
C
B. Determination of volatile matter
Amount of coal : 1 g of coal
Size of coal : - 212 micron (72 mesh)
Heating time : at 9000
C for 7 minutes
C. Determination of ash
Amount of coal : 1 g of coal sample
Size of coal : - 212 micron (72 mesh)
Heating time : 30 minutes at 450oC and 60 minutes at 850
oC
2. Wet oxidation potential study
Amount of coal : 0.5 g of coal sample
Size of coal : - 212 micron (72 mesh)
System : Coal + KMnO4 + KOH
3. Flammability temperature
Amount of coal : 200 mg of coal sample
Size of coal : - 72 micron (25 mesh)
System : Coal + Air
Volume of air : 500 ml
Pressure of air : 8 cm of Hg

4. DTA – TG
Amount of coal : 60 mg of coal sample
Size of coal : - 212 micron (72 mesh)
Heating rate : 50 C/min
System : coal + air
Table 4.1 List of coal samples
Sl. No. Sample Name of the organization
1 1
SCCL
2 2
3 3
4 4
5 5
6 6
7 7
8 8
9 9
Table 4.2 Results of proximate analysis parameters
Sample
Moisture(M) Ash(A) Volatile
Matter(VM) Fixed Carbon(FC)
Ar
(%)
Ar
(%)
Ad
(%)
Ar
(%)
Ad
(%)
daf
(%)
Ar
(%)
Ad
(%)
daf
(%)
dmmf
(%)
1 2.433 33.07 33.89 27.96 28.65 43.34 36.54 37.45 56.65 76.5
2 2.13 25.94 26.50 33.42 34.14 46.46 38.51 39.34 53.53 58.5
3 2.73 14.46 14.86 35.83 36.83 43.26 46.98 48.29 56.73 76.1
4 3.76 25.68 26.68 34.13 35.46 48.37 36.43 37.85 51.62 70.1
5 3.166 15.28 15.77 35.99 37.16 44.12 45.57 47.05 57.68 76.8
6 3.66 37.84 39.27 25.88 26.86 44.23 32.62 33.85 55.76 68.5
7 3.766 27.15 28.21 32.84 34.12 47.53 36.25 37.66 52.46 55.4
8 3.693 17.41 18.07 40.40 41.94 51.20 38.5 37.97 48.79 81.6
9 2.866 11.04 11.36 38.91 40.05 45.19 47.19 48.57 54.80 60.9
Dry basis – (100 / 100 – M)
Dry ash free basis – (100 / 100 – (M + A))
Dry mineral matter free basis – (100 / 100 – (M + A + VM))

Table 4.3 Results of calorific value
Sample Calorific Value
(Kcal/Kg)
UHV Value
(Kcal/Kg) Grade of a Coal
01 3648 4001 E
02 4383 5026 C
03 6479 6527 A
04 4689 4837 D
05 5551 6355 A
06 2853 3173 F
07 4400 4634 D
08 5053 5988 B
09 5533 6981 A
Table 4.4 Results of wet oxidation potential
Sample Potential difference EMF (mv)
01 143
02 131
03 115
04 134
05 131
06 150
07 149
08 125
09 144
Table 4.5 Results of flammability temperature
Sample Flammability temperature (oc)
01 520
02 500
03 530
04 510
05 510
06 500
07 510
08 510
09 460

Table 4.6 Results of DTA – TG
Sample II A slope II B slope II slope
Transition
temperature
(oc)
01 -0.032 0.100 0.101 168.63
02 0.045 0.110 0.120 175.03
03 0.010 0.120 0.124 149.60
04 0.080 0.117 0.121 178.14
05 0.020 0.136 0.139 161.52
06 -0.010 0.114 0.137 118.69
07 0.033 0.126 0.127 137.70
08 0.056 0.126 0.128 177.34
09 -0.073 0.179 0.144 177.63

CHAPTER – 5
ANALYSIS
Different graphs have been plotted between the various calculated parameters and are analysed
individually.
Fig: 5.1 Moisture Vs Calorific value
Calorific value decreases with increase in moisture content.
Fig. 5.1 shows that Calorific value has insignificant correlation with Moisture.
Fig: 5.2 Moisture Vs Wet oxidation potential
Wet oxidation potential value slightly varies with increase in moisture.
Wet oxidation potential value has insignificant correlation with moisture.
y = -266.2x + 5566.R² = 0.023
0
1000
2000
3000
4000
5000
6000
7000
0 0.5 1 1.5 2 2.5 3 3.5 4
Cal
ori
fic
valu
e
Moisture
y = 4.644x + 121.2R² = 0.061
0
20
40
60
80
100
120
140
160
0 0.5 1 1.5 2 2.5 3 3.5 4
We
t o
xid
atio
n p
ote
nti
al
Moisture

Fig: 5.3 Moisture Vs Flammability temperature
Flammability temperature has insignificant correlation with moisture content
Flammability temperature value increases with increase in moisture content
Fig: 5.4 Moisture Vs Transition temperature
Transition temperature decreases with increase in moisture content.
Transition temperature has significant correlation with moisture content.
Fig: 5.5 Moisture Vs II slope of DTA
As moisture content increases II slope of DTA also increases.
Moisture content has insignificant correlation with II slope of DTA
y = 0.988x + 502.4R² = 0.001
440460480500520540
0 1 2 3 4Fl
amm
abili
ty
tem
pe
ratu
reMoisture
y = -11.67x + 197.0R² = 0.119
0
50
100
150
200
0 0.5 1 1.5 2 2.5 3 3.5 4
Tran
siti
on
te
mp
era
ture
Moisture
y = 0.007x + 0.102R² = 0.146
0
0.05
0.1
0.15
0.2
0 0.5 1 1.5 2 2.5 3 3.5 4
II s
lop
e
Moisture
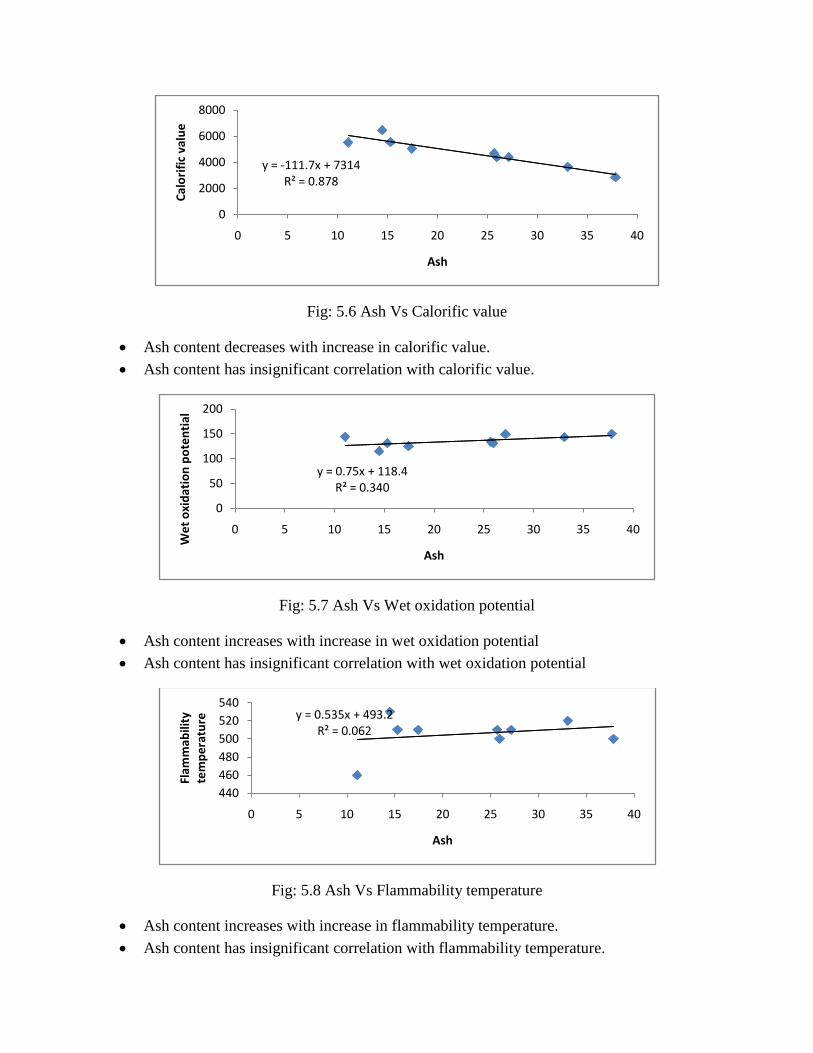
Fig: 5.6 Ash Vs Calorific value
Ash content decreases with increase in calorific value.
Ash content has insignificant correlation with calorific value.
Fig: 5.7 Ash Vs Wet oxidation potential
Ash content increases with increase in wet oxidation potential
Ash content has insignificant correlation with wet oxidation potential
Fig: 5.8 Ash Vs Flammability temperature
Ash content increases with increase in flammability temperature.
Ash content has insignificant correlation with flammability temperature.
y = -111.7x + 7314R² = 0.878
0
2000
4000
6000
8000
0 5 10 15 20 25 30 35 40
Cal
ori
fic
valu
e
Ash
y = 0.75x + 118.4R² = 0.340
0
50
100
150
200
0 5 10 15 20 25 30 35 40
We
t o
xid
atio
n p
ote
nti
al
Ash
y = 0.535x + 493.2R² = 0.062
440
460
480
500
520
540
0 5 10 15 20 25 30 35 40
Flam
mab
ility
te
mp
era
ture
Ash

Fig: 5.9 Ash Vs Transition temperature
Ash content is inversely proportional to transition temperature.
Ash content has insignificant correlation with transition temperature.
Fig: 5.10 Ash Vs II slope of DTA
Ash content decreases with increase in the value of II slope of DTA.
Ash content has insignificant correlation with II slope of DTA.
Fig: 5.11 Ash Vs IIA slope of DTA
II A slope of DTA has insignificant correlation with ash content.
As Ash content increases II A slope of DTA also increases.
y = -1.144x + 186.9R² = 0.243
0
50
100
150
200
0 5 10 15 20 25 30 35 40
Tran
siti
on
te
mp
era
ture
Ash
y = -0.000x + 0.141R² = 0.210
0
0.05
0.1
0.15
0.2
0 5 10 15 20 25 30 35 40
II s
lop
e
Ash
y = 0.000x + 0.003R² = 0.008
-0.1
-0.05
0
0.05
0.1
0 5 10 15 20 25 30 35 40IIA
slo
pe
Ash

Fig: 5.12 Ash Vs IIB slope of DTA
Ash content has significant correlation with II B slope of DTA.
Ash content value increases with decrease in II B slope of DTA value.
Fig: 5.13 VM Vs Calorific value
Calorific value increases with increase in VM content.
Calorific value has significant correlation with VM content.
Fig: 5.14 VM Vs Wet oxidation potential
Wet oxidation potential is inversely proportional to VM content.
Wet oxidation potential has insignificant correlation with VM content.
y = -0.001x + 0.166R² = 0.505
0
0.05
0.1
0.15
0.2
0 5 10 15 20 25 30 35 40
IIB
slo
pe
Ash
y = 188.1x - 1652.R² = 0.664
0
2000
4000
6000
8000
0 5 10 15 20 25 30 35 40 45
Cal
ori
fic
valu
e
VM
y = -1.405x + 183.4R² = 0.318
0
50
100
150
200
0 10 20 30 40 50
We
t o
xid
atio
n
po
ten
tial
VM

Fig: 5.15 VM Vs Flammability temperature
Flammability temperature has insignificant correlation with VM content
VM increases with decrease in the value of flammability temperature.
Fig: 5.16 VM Vs Transition temperature
As VM content increases transition temperature increases so spontaneity decreases
And has significant correlation than flammability temperature.
Fig: 5.17 VM Vs II slope of DTA
VM content is directly proportional to II slope of DTA
VM content increases with increase in the value of II slope of DTA.
y = -1.049x + 541.1R² = 0.064
440
460
480
500
520
540
0 10 20 30 40 50
Flam
mab
ility
te
mp
era
ture
VM
y = 2.746x + 67.28R² = 0.374
0
50
100
150
200
0 5 10 15 20 25 30 35 40 45
Tran
siti
on
te
mp
era
ture
VM
y = 0.001x + 0.090R² = 0.152
0
0.05
0.1
0.15
0.2
0 10 20 30 40 50
II s
lop
e
VM

Fig: 5.18 Fixed carbon Vs Calorific value
Calorific value increases with increase in fixed carbon value.
Calorific value has significant correlation with fixed carbon value.
Fig: 3.19 Fixed carbon vs Wet oxidation potential
Wet oxidation potential content decreases with increase fixed carbon content.
Wet oxidation potential content has insignificant correlation with fixed carbon content.
Fig: 5.20 Fixed carbon Vs Flammability temperature
Flammability temperature has insignificant correlation with fixed carbon.
Flammability temperature decreases with increase in fixed carbon content.
y = 181.5x - 2502.R² = 0.802
0
2000
4000
6000
8000
0 10 20 30 40 50
Cal
ori
fic
valu
e
Fixed carbon
y = -1.146x + 181.4R² = 0.275
0
50
100
150
200
0 10 20 30 40 50
We
t o
xid
atio
n p
ote
nti
al
Fixed carbon
y = -0.751x + 535.5R² = 0.042
440460480500520540
0 10 20 30 40 50
Flam
mab
ility
te
mp
era
ture
Fixed carbon

Fig: 5.21 Fixed carbon Vs Transition temperature
Transition temperature increases with increase in fixed carbon content.
Transition temperature has insignificant correlation with fixed carbon
Fig: 5.22 Fixed carbon Vs II slope of DTA
Fixed carbon content has insignificant correlation with II slope of DTA.
Fixed carbon content increases as II slope of DTA increases.
Fig: 5.23 Calorific value Vs Wet oxidation potential
Wet oxidation potential has significant correlation with calorific value.
Calorific value increases wet oxidation potential decreases.
y = 1.348x + 106.7R² = 0.117
0
50
100
150
200
0 10 20 30 40 50
Tran
siti
on
te
mp
era
ture
Fixed carbon
y = 0.000x + 0.089R² = 0.153
0
0.05
0.1
0.15
0.2
0 10 20 30 40 50
II s
lop
e
Fixed carbon
y = -0.007x + 173.1R² = 0.536
0
50
100
150
200
0 1000 2000 3000 4000 5000 6000 7000
We
t o
xid
atio
n p
ote
nti
al
Calorific value

Fig: 5.24 Calorific value Vs Flammability temperature
Calorific value has insignificant correlation with flammability temperature.
Calorific value increases with increase in flammability temperature.
Fig: 5.25 Calorific value Vs Transition temperature
Calorific value has insignificant correlation with Transition temperature.
Calorific value increases with increase in Transition temperature.
Fig: 5.26 Calorific value Vs II slope of DTA
Calorific value increases with increase in II slope of DTA
Calorific value has insignificant correlation with II slope of DTA.
y = 0.000x + 502.3R² = 0.001
440
460
480
500
520
540
0 1000 2000 3000 4000 5000 6000 7000
Flam
mab
ility
te
mp
era
ture
Calorific value
y = 0.007x + 124.0R² = 0.156
0
50
100
150
200
0 1000 2000 3000 4000 5000 6000 7000
Tran
siti
on
te
mp
era
ture
Calorific value
y = 3E-06x + 0.111R² = 0.076
0
0.05
0.1
0.15
0.2
0 1000 2000 3000 4000 5000 6000 7000
II S
lop
e
Calorific value

Fig: 5.27 Wet oxidation potential Vs Transition temperature
Wet oxidation potential has insignificant correlation with Transition temperature.
Transition temperature decreases with increase in wet oxidation potential value
Fig: 5.28 Wet oxidation potential Vs II slope of DTA
Wet oxidation potential increases with increase in II slope of DTA.
Wet oxidation potential has insignificant correlation with II slope of DTA.
Fig: 5.29 Wet oxidation potential Vs IIA slope of DTA
With increase in wet oxidation potential value II A slope value decreases.
Wet oxidation potential has insignificant correlation with IIA slope of DTA.
y = -0.692x + 254.4R² = 0.147
0
50
100
150
200
0 20 40 60 80 100 120 140 160Tran
siti
on
te
mp
era
ture
Wet oxidation potential
y = 0.000x + 0.110R² = 0.012
0
0.05
0.1
0.15
0.2
0 20 40 60 80 100 120 140 160
II s
lop
e
Wet oxidation potential
y = -0.001x + 0.238R² = 0.167
-0.1
-0.05
0
0.05
0.1
0 20 40 60 80 100 120 140 160II A
slo
pe
Wet oxidation potential

Fig: 5.30 Flammability temperature Vs Transition temperature
Flammability temperature has insignificant correlation with transition temperature.
Transition temperature value decreases with increase in flammability temperature.
Fig: 5.31 Flammability temperature Vs II slope of DTA
Flammability temperature increases with increase in II slope of DTA.
Flammability temperature has insignificant correlation with II slope of DTA.
y = -0.238x + 281.1R² = 0.048
0
50
100
150
200
450 460 470 480 490 500 510 520 530 540Tran
siti
on
te
mp
era
ture
Flammability temperature
y = -0.000x + 0.329R² = 0.371
0
0.05
0.1
0.15
0.2
450 460 470 480 490 500 510 520 530 540
II s
lop
e
Flammability temperature

CHAPTER – 6
DISCUSSION AND CONLUSIONS
In general, the following things are to be summarized from the results of all experiments. (Tables
4.2 to 4.6)
Discussion:
The calorific value of sample 1 is found to be less so it has high susceptibility towards
spontaneous heating.
Sample 1 has ―E‖ grade and its proximate analysis, EMF and Flammability temperature
has moderate impact for spontaneity.
Calorific value of sample 2 is found to be medium which shows that it has moderately
susceptible to spontaneous heating.
Sample 2 has ―C‖ grade coal which shows poorly susceptible in nature.
An experimental result shows that sample 3 is poorly susceptible and sample 4 is
moderately susceptible to spontaneous heating.
Sample 5 shows poor impact towards spontaneous combustion of coal.
Sample 6 has low calorific value and low transition temperature which shows highly
susceptible.
An experimental result shows that sample 7 is moderately susceptible and sample 8 is
poorly susceptible to spontaneous heating.
Results of Flammability temperature and Calorific value of sample 9 shows that it is
moderately susceptible to spontaneous heating.
Conclusions:
The following conclusions are drawn from the analysis of nine coal samples collected from
SCCL:
1. Different graphs plotted between various parameters of experimental results show that
The moisture content of coal decreases with increase in transition temperature.
The calorific value of coal increases with increase in transition temperature.
2. Field observations and experimental results interpreted that the coal samples collected from
the field are classified into the following category:
Highly susceptible to spontaneous heating: Sample – 6.
Moderately susceptible to spontaneous heating: Sample - 1, 2, 4 and 7.
Poorly susceptible to spontaneous heating: Sample - 3, 5, 8 and 9

REFERENCES
1. Banerjee, S.C., Chakravorty, R.N., Use of DTA in the study of spontaneous combustion
of coal, Journal of Mine Metals and Fuels 15, 1967, pp. 1-5
2. Bhattacharya K.K, The role of sorption of water vapour in the spontaneous heating of
coal, Fuel, Volume 50, Issue 4, 1971, pp 367-380
3. Nandy D.K, Banerjee D.D and Chakravorty R.N, Application of crossing point
temperature for determining the spontaneous heating characteristics of coal, J. Mines
Met. Fuels 20 (2), 1972, pp. 41–48.
4. Feng, K.K., Chakravorty, R.N., Cochrane, T.S., Spontaneous combustion - a coal mining
hazard, Can Min Metall Bull 66 (738), 1973, pp. 75-84
5. Mahajan, O.P., Tomita, A., Walker Jr., P.L., Differential scanning calorimetry studies on
coal. 1. Pyrolysis in an inert atmosphere Fuel, 55 (1), 1976, pp. 63-69.
6. Tian, D.X., Technique for detecting the early spontaneous combustion of coal in the
underground, Mining and Safety (Japanese) 3, 1979, pp. 18-31
7. Chandra D, Bhattacharya S.K, Ghosh R and Dasgupta N, On evaluation and classification
of coal with respect to proneness to spontaneous combustion, Q. J. Geol. Min. Metall.
Soc. India 55 (3), 1983, pp. 130–136.
8. Nordon P, Heat of oxidation of coal near ambient temperature and the problem of
spontaneous combustion, Proc. Int. Conf. Coal Sci. Sydney, N.S.W., Australia, 1985, pp.
467–470.
9. Mahadevan, V., Ramlu, M.A., Fire risk rating of coal mines due to spontaneous heating,
Journal of Mines, Metals and Fuels 33 (8), 1985, pp. 357-362
10. Gosh Rekha, Spontaneous combustion of certain Indian coals—some physico-chemical
considerations, Fuel Volume 65, Issue 8, 1986, pp 1042-1046
11. Tarafadar and Guha, Application of wet oxidation processes for the assessment of the
spontaneous heating of coal, Fuel Vol 68, 1989, pp 315 – 317
12. Gouws, M.J., Wade, L., The self-heating liability of coal: Predictions based on composite
indices, Mining Science and Technology 9 (1), 1989, pp. 81-85
13. Karmarkar N.C, Banerjee S.P, A comparative study on CPT index, Ploish Sz index and
Russian U – index of susceptibility of coal to spontaneous combustion, Journal of
MGMI, Vol 86, 1989, pp. 109 – 129.
14. Banerjee S.C, Nandy D.K, Ghosh S.K, Banerjee D.D, Sen S.K and Singh B, An
approach to assessing the status of sealed-off fires by examination of fire indices, Mining
Science and Technology, Volume 10, Issue 1, 1990, pp 37-51
15. Saxena R, Navale G.K.B, Chandra D and Prasad Y.V.S, Spontaneous combustion of
some Permian coal seams of India: an explanation based on microscopic and physico-
chemical properties. In: K.P. Jain and R.S. Tiwari, Editors, Proc. Symp. Vistas in Indian
Palaeobotany, Palaeobotanist 38, 1990, pp. 58–82

16. Chandra D and Prasad Y.V.S, Effect of coalification on spontaneous combustion of coals,
International Journal of Coal Geology, Volume 16, Issues 1-3, 1990, pp 225-229
17. Chen, X. D., The effect of moisture content on spontaneous ignition process: A review.
Proceedings Symposium of 4th Coal Research Conference, Wellington, New Zealand,
1991, pp 327-337.
18. McPherson, M.J., Subsurface fires and explosions, Subsurface Ventilation and
Environment Engineering, 1993 pp. 815-888
19. Mishra B.K and Singh B.D, Susceptibility to spontaneous combustion of Indian coals and
lignites: an organic petrographic autopsy, International Journal of Coal Geology, Volume
25, Issues 3-4, 1994, pp 265-286
20. Bhatt S and Agarwal P.K, The effect of moisture condensation on the spontaneous
combustibility of coal, Fuel, Volume 75, Issue 13, 1996, pp 1523-1532
21. Panigrahi, D.C., Udaybhanu, G., Ojha, A., A comparative study of wet oxidation method
and crossing point temperature method for determining the susceptibility of Indian coals
to spontaneous heating, Proceedings Prevention and Control of Mine and Industrial Fires
- Trends and Challenges, 1996, pp. 51-53
22. Banerjee, S.C., Spontaneous fire risk estimation and its prevention, Prevention and
Combating Mine Fires, 2000, pp. 119
23. Sahu H.B, Panigrahi D.C, Mishra N.M, Assessment of spontaneous heating susceptibility
of coal seams by differential scanning Calorimetry, Journal of Mines, Metals and Fuels
52 (7-8), 2004, pp. 117-121
24. Panigrahi, D.C., Bhattacherjee, R.M., Development of modified gas indices for early
detection of spontaneous heating in coal pillars, Journal of The South African Institute of
Mining and Metallurgy 104 (7), 2004, pp. 367-379
25. Sahu H.B, Panigrahi D C, Classification of coal seams with respect to their spontaneous
heating susceptibility – a neural network approach, Journal of Geotechnical and
Geological Engineering, Kluwer Academic Publishers, 2004, pp. 457 - 476
26. Singh, R.P., Ray, S.K., Singh, A.K., Varma, N.K., Sahay, N, Studies on spontaneous
heating behavior of coal, Journal of Mines, Metals and Fuels (5-6), 2005, pp. 105-109
27. Singh A.K, Singh R.V.K, Singh M.P, Hem Chandra, Shukla N.K, Mine fire gas indices
and their application to Indian underground coal mine fires, International Journal of Coal
Geology, Volume 69, Issue 3, 2007, pp 192-204
28. Singh R V K, Sural G, Singh V K., Safety management of open pit coal mines from
occurrences of spontaneous Heating/Fire - case studies, Australasian Institute of Mining
and Metallurgy Publication Series, 2007, pp. 139-143
29. Sahay, N, Sinha, V.K., A liability index for proneness of coal towards spontaneous
heating based on critical temperature, Journal of Mines, Metals and Fuels 56 (7-8), 2008,
pp. 115-121
30. Jain A, Assessment of spontaneous heating susceptibility of coal using differential
thermal analysis, B.Tech thesis, 2009, pp. 1 – 25

31. Nimaje D.S, Tripathy D.P, Thermal studies on spontaneous heating of coal, The Indian
Mining & Engineering Journal, 2010, pp. 10 – 21.
32. http://en.wikipedia.org/wiki/Coal_seam_fire

APPENDIX
APPENDIX 1 - DTA CURVES
APPENDIX 2 - WET OXIDATION POTENTIAL
CURVES

APPENDIX 1
DTA CURVES

Fig A1: DTA-TG curve of sample 1 Fig A2: DTA-TG curve of sample 2
Fig A3: DTA-TG curve of sample 3 Fig A4: DTA-TG curve of sample 4

Fig A5: DTA-TG curve of sample 5 Fig A6: DTA-TG curve of sample 6
Fig A7: DTA-TG curve of sample 7 Fig A8: DTA-TG curve of sample 8

Fig A9: DTA-TG curve of sample 9
APPENDIX 2
WET OXIDATION POTENTIAL CURVES

Fig A10: Wet oxidation potential curves
0
50
100
150
200
250
300
350
0 5 10 15 20 25 30 35
EMF(
mV
)
Time (min)
sample 1
sample 2
sample 3
sample 4
sample 5
sample 6
sample 7
sample 8
sample 9